Impact of ECOM Solar Radiation Pressure Models on Multi-GNSS Ultra-Rapid Orbit Determination


Abstract
:
1. Introduction
2. Models and Methods
2.1. ECOM Models
2.2. Experiment Methods
3. Results
3.1. Ambiguity Resolution Performance
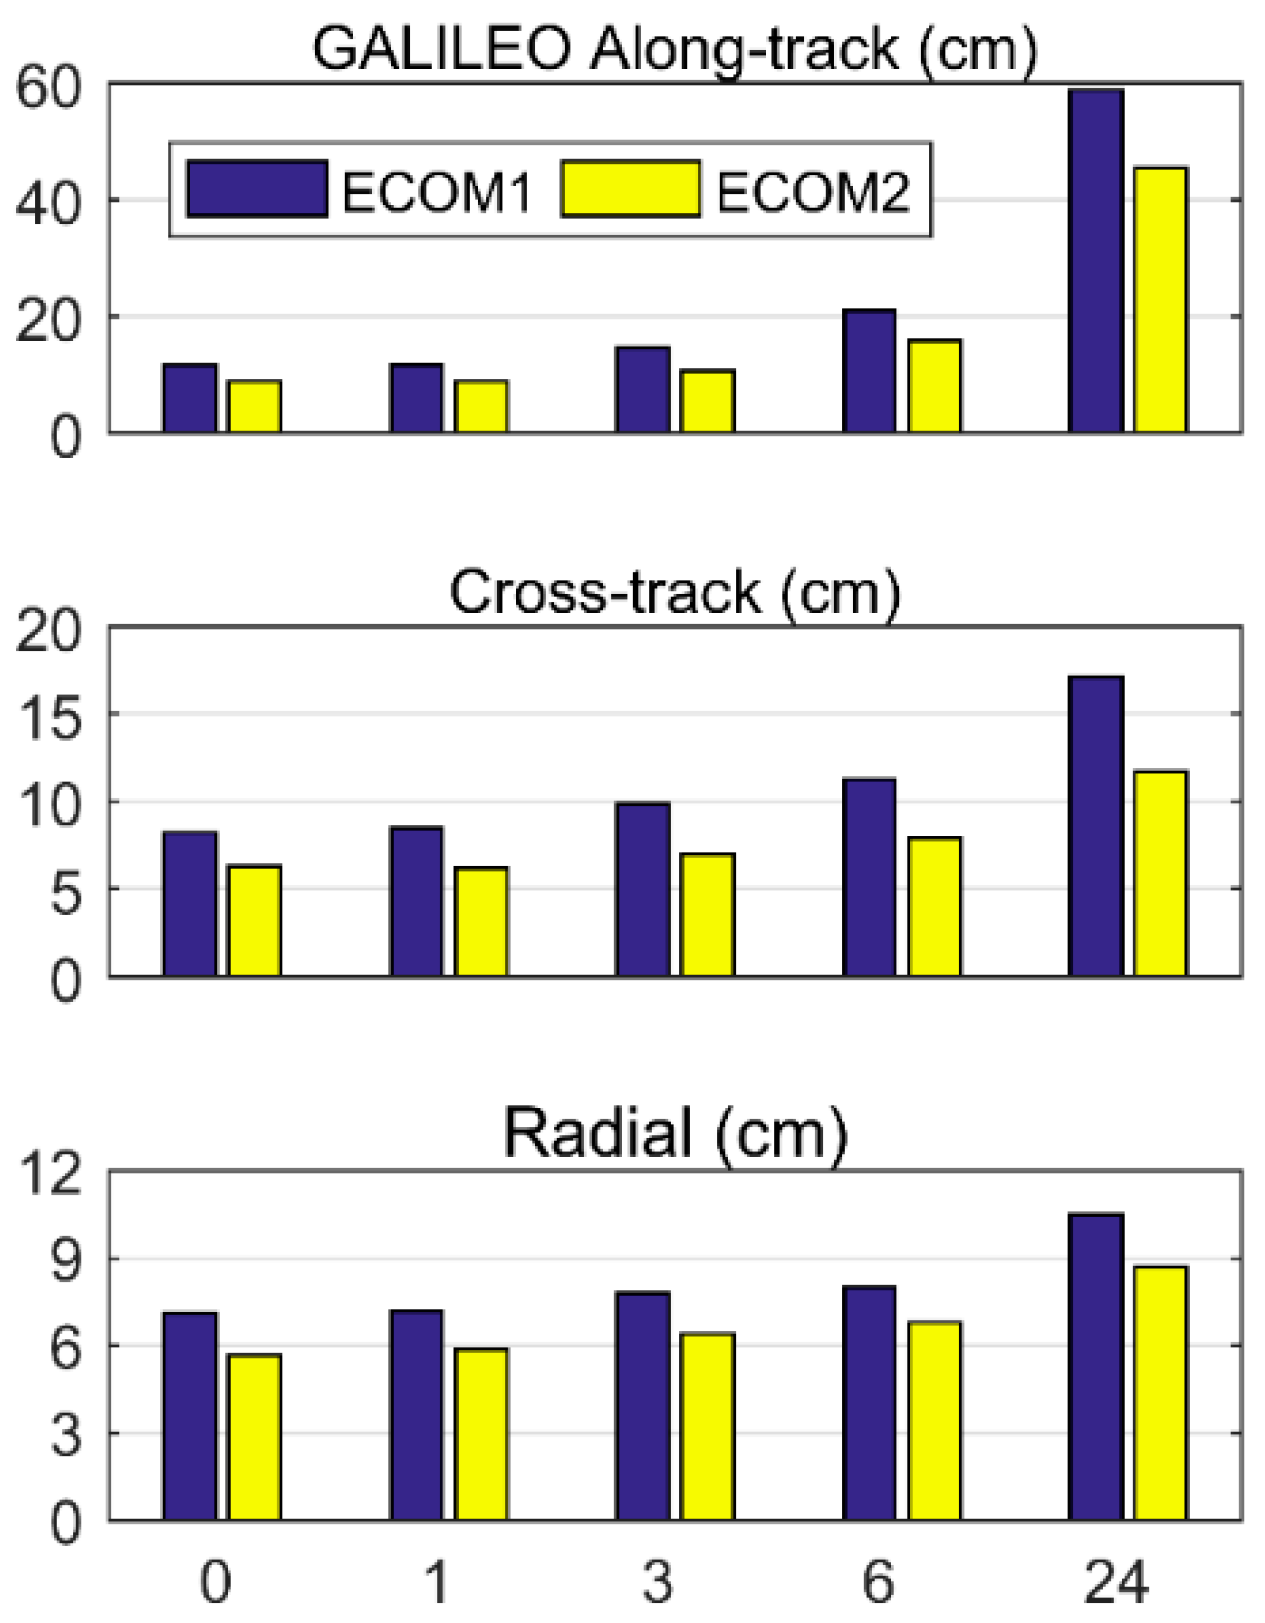
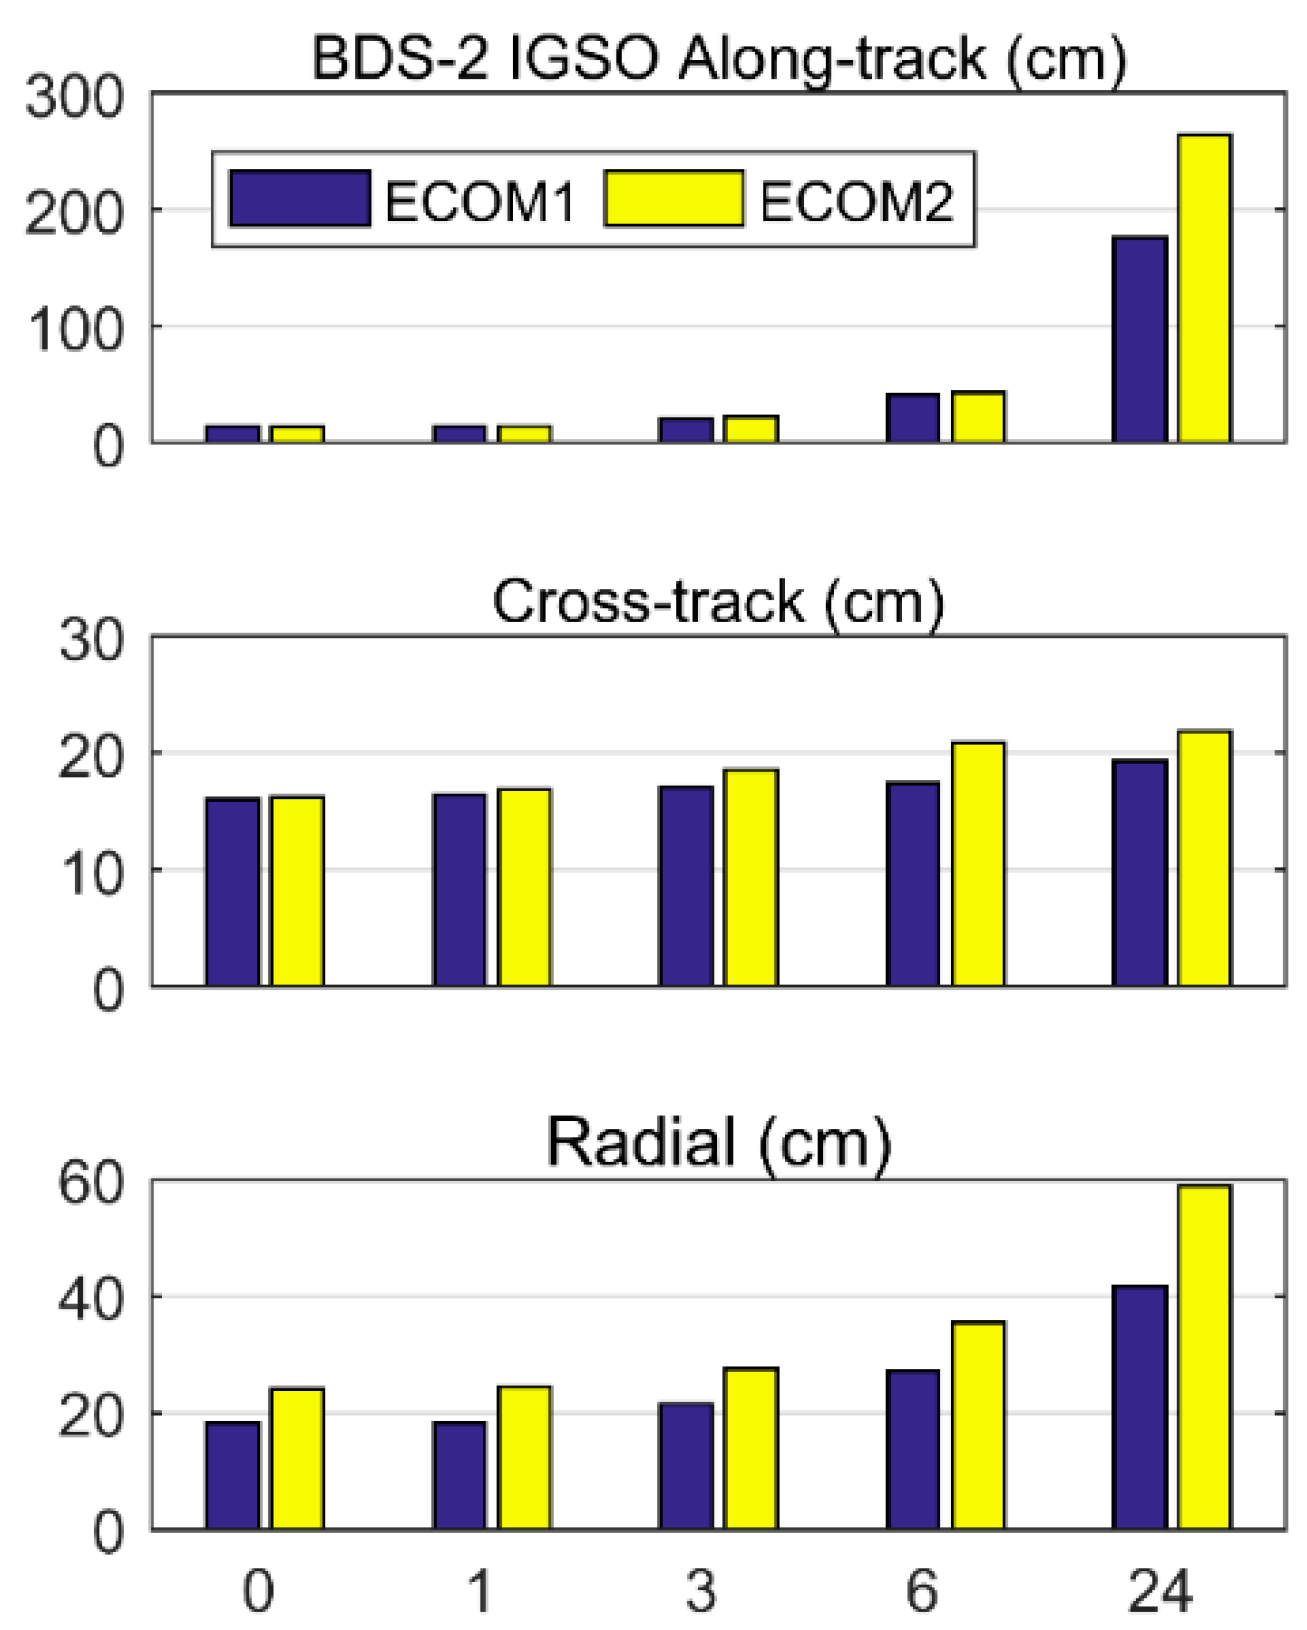
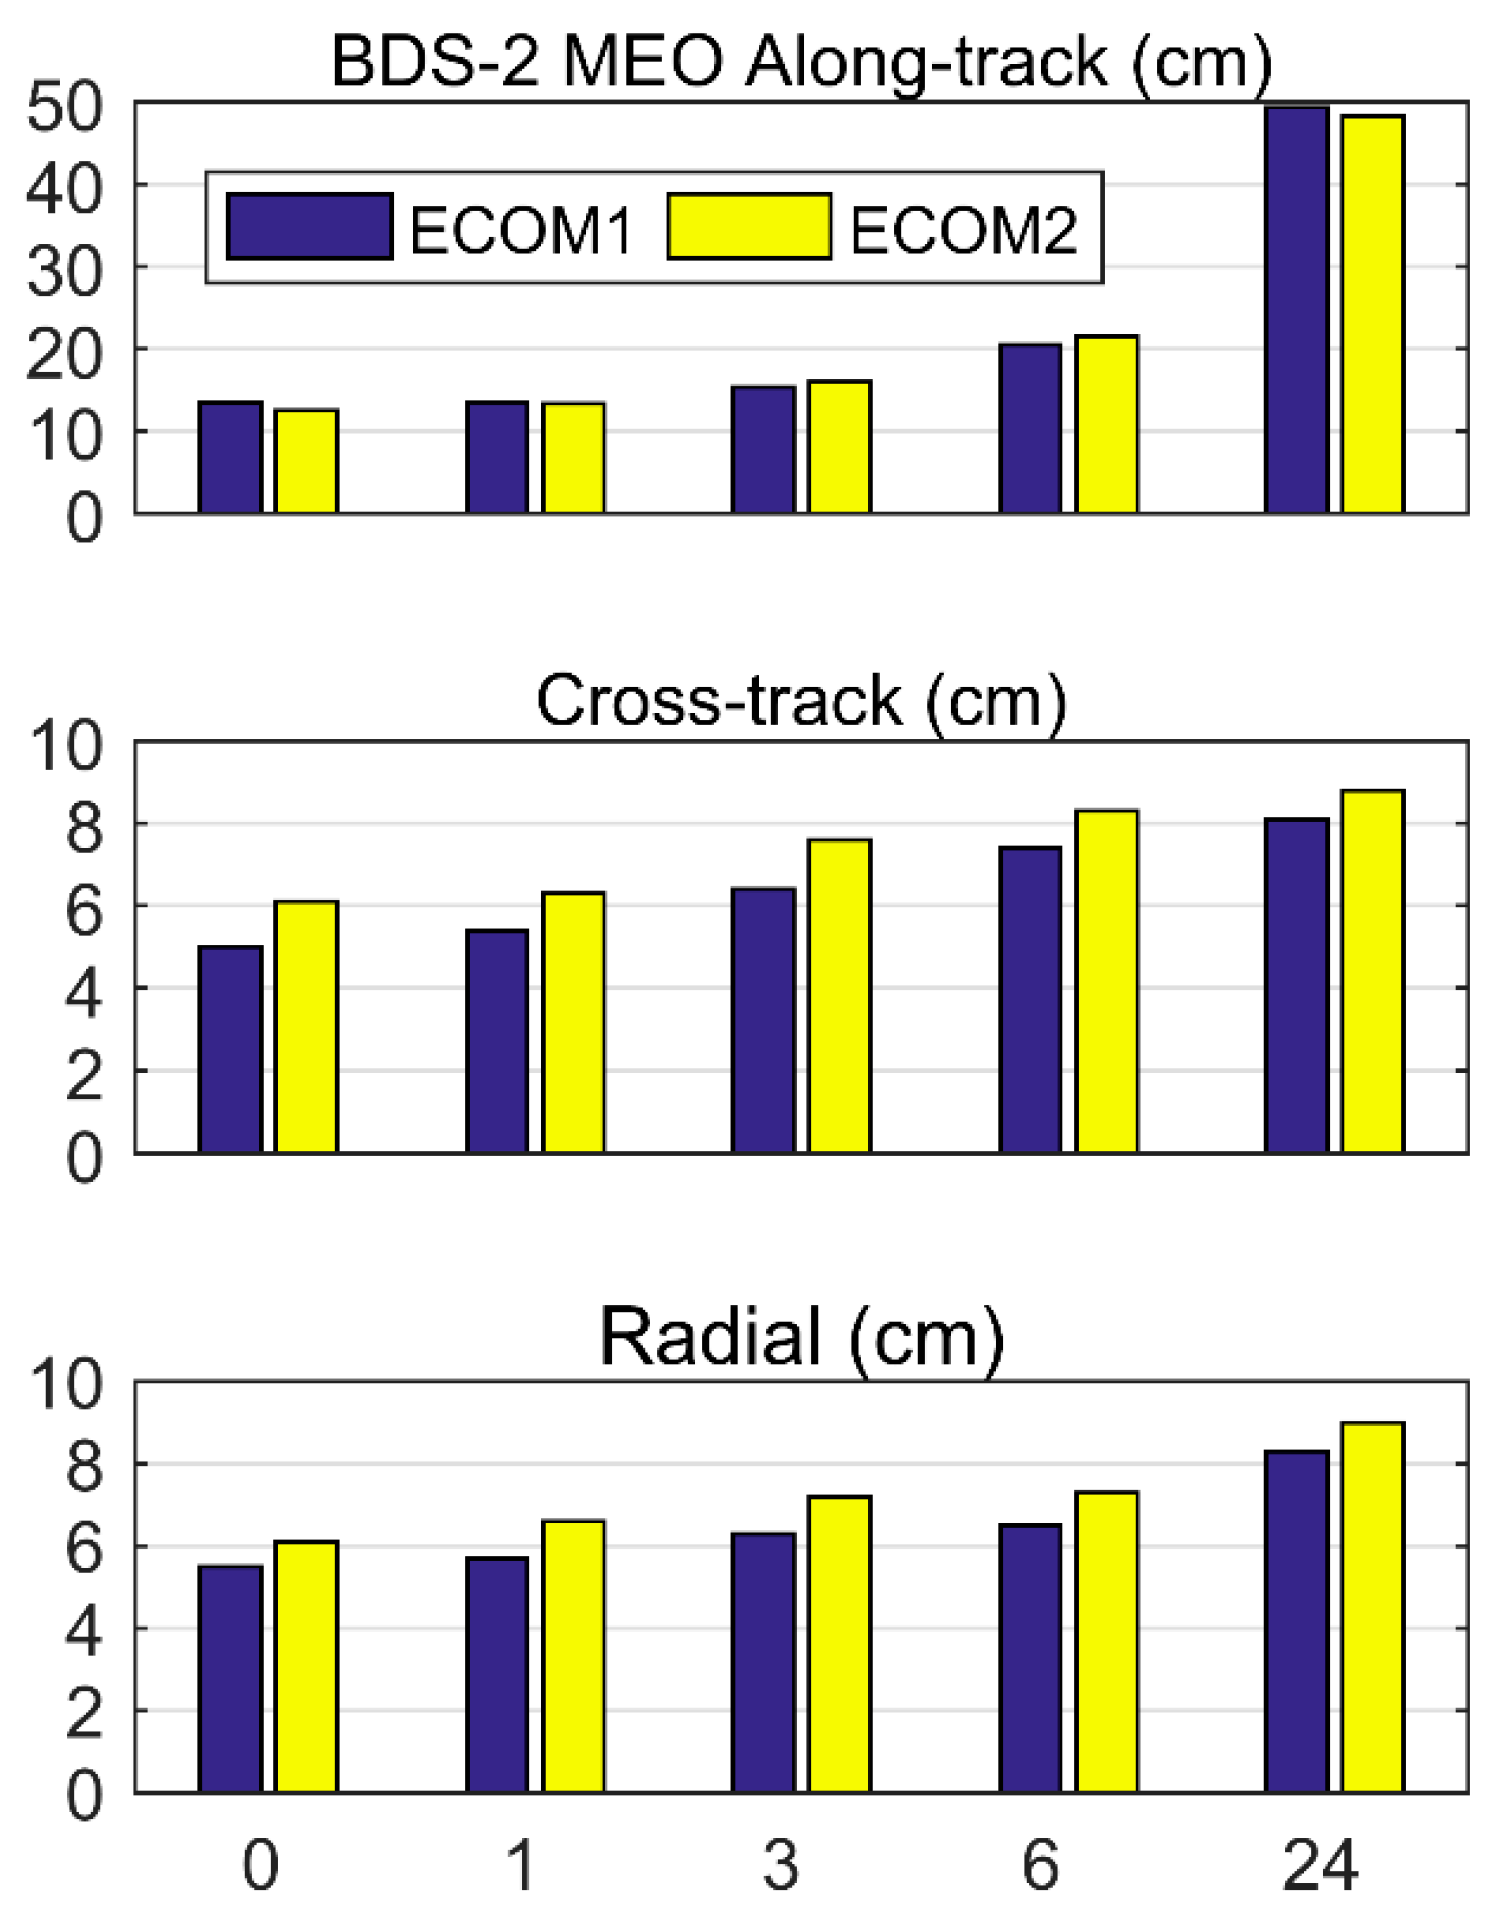
3.2. Orbit Overlap Precision
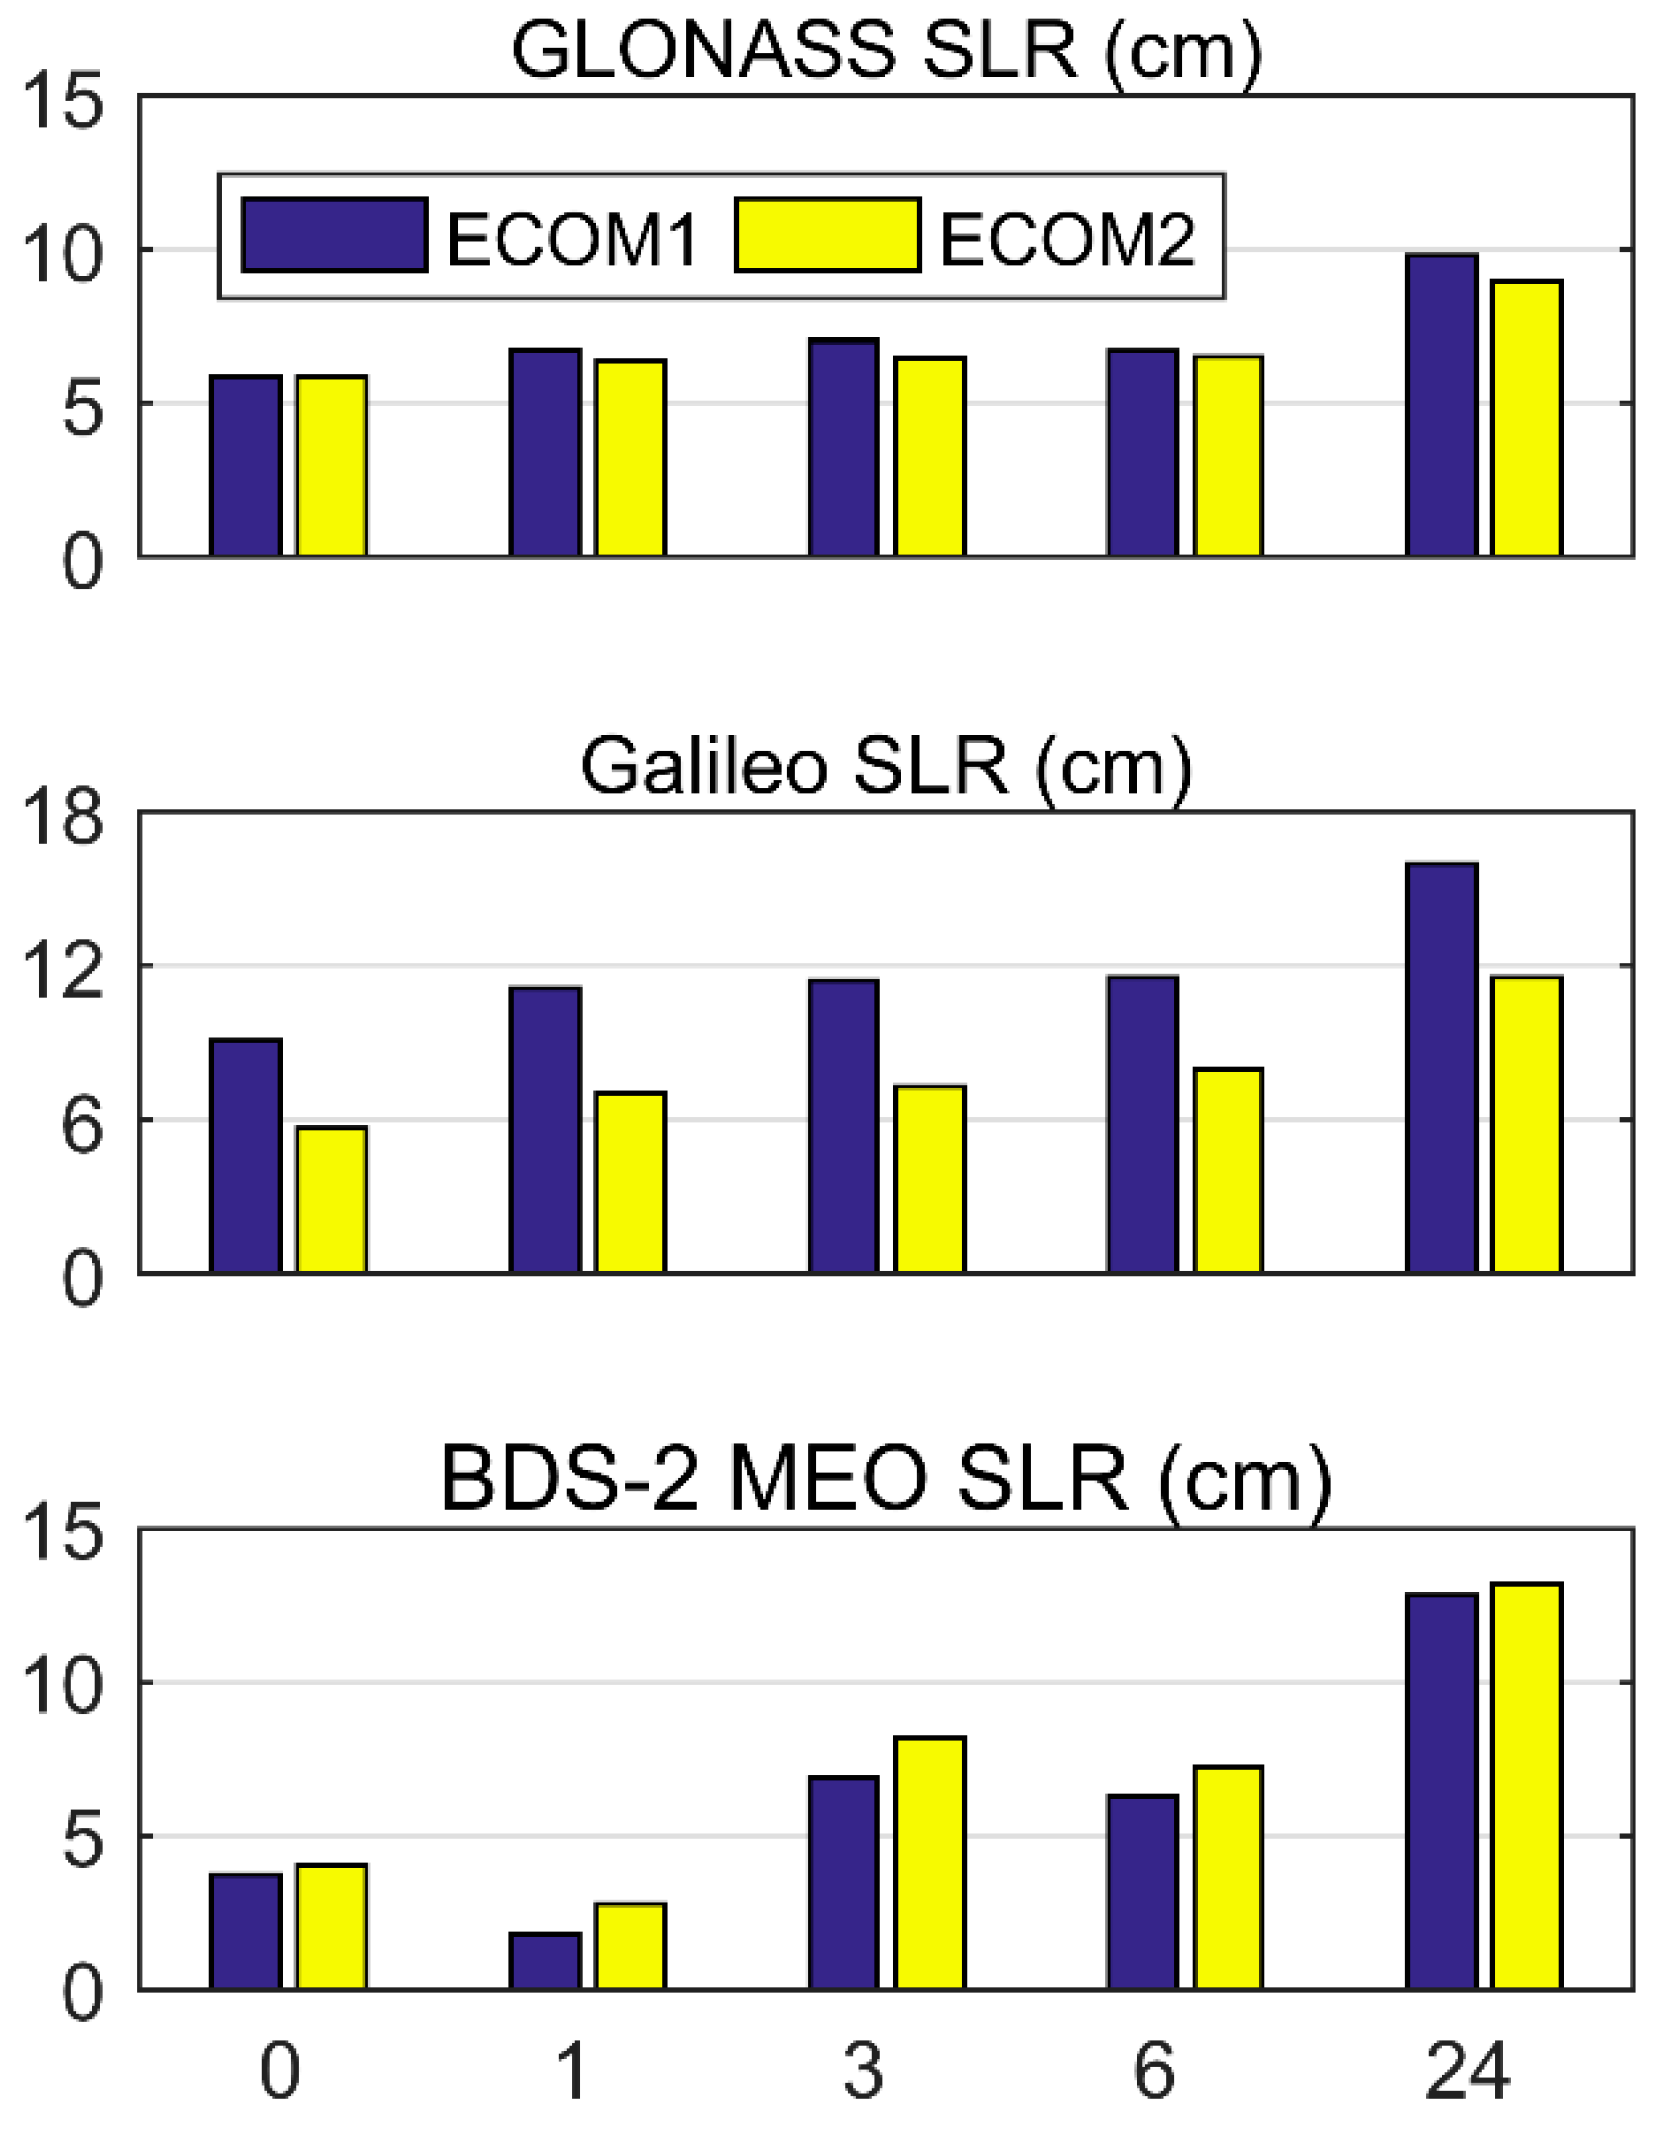
3.3. Satellite Laser Ranging Validation
4. Discussion
5. Conclusions
Author Contributions
Funding
Acknowledgments
Conflicts of Interest
References
- Weber, R.; Slater, J.A.; Fragner, E.; Glotov, V.; Habrich, H.; Romero, I.; Schaer, S. Precise GLONASS orbit determination within the IGS/IGLOS – Pilot Project. Adv. Space Res. 2005, 36, 369–375. [Google Scholar] [CrossRef]
- Montenbruck, O.; Steigenberger, P.; Prange, L.; Deng, Z.; Zhao, Q.; Perosanz, F.; Romero, I.; Noll, C.; Stürze, A.; Weber, G.; et al. The Multi-GNSS Experiment (MGEX) of the International GNSS Service (IGS)—Achievements, prospects and challenges. Adv. Space Res. 2017, 59, 1671–1697. [Google Scholar] [CrossRef]
- Dow, J.; Neilan, R.E.; Rizos, C. The International GNSS Service in a changing landscape of Global Navigation Satellite Systems. J. Geodesy 2009, 83, 191–198. [Google Scholar] [CrossRef]
- Kouba, J. A Guide to Using International GNSS Service (IGS) Products. 2009. Available online: http://acc.igs.org/UsingIGSProductsVer21.pdf (accessed on 15 August 2019).
- Hadas, T.; Bosy, J. IGS RTS precise orbits and clocks verification and quality degradation over time. GPS Solut. 2014, 19, 93–105. [Google Scholar] [CrossRef] [Green Version]
- Deng, Z.; Fritsche, M.; Nischan, T.; Bradke, M. Multi-GNSS Ultra Rapid Orbit-, Clock- & EOP-Product Series. GFZ Data Services. 2016. Available online: http://doi.org/10.5880/GFZ.1.1.2016.003 (accessed on 15 August 2019).
- Deng, Z.; Schuh, H. Improvement of multi-GNSS orbit and clock prediction at GFZ. In Proceedings of the China Satellite Navigation Conference (CSNC) 2017, Shanghai, China, 23–25 May 2017. [Google Scholar]
- Zhao, Q.; Ma, H.; Xu, X.; Guo, J.; Li, M. Hourly updated precise orbit products of quad-constellation satellites in IGS analysis center at Wuhan University. In Proceedings of the 2017 IGS Workshop, Paris, France, 3–7 July 2017. [Google Scholar]
- Li, X.; Chen, X.; Ge, M.; Schuh, H. Improving multi-GNSS ultra-rapid orbit determination for real-time precise point positioning. J. Geodesy 2019, 93, 45–64. [Google Scholar] [CrossRef]
- Tapley, B.; Ries, J. Orbit Determination Requirements for TOPEX. In Proceedings of the AAS/AIAA, Astrodynamics Specialist Conference, Kalispell, MT, USA, 10–13 August 1987. [Google Scholar]
- Fliegel, H.F.; Gallini, T.E.; Swift, E.R. Global Positioning System Radiation Force Model for geodetic applications. J. Geophys. Res. Solid Earth 1992, 97, 559–568. [Google Scholar] [CrossRef]
- Fliegel, H.; Gallini, T. Solar Force Modeling of Block IIR Global Positioning System Satellites. J. Spacecr. Rocket. 1996, 33, 863–866. [Google Scholar] [CrossRef]
- Marshall, J.; Luthcke, S. Modeling Radiation Forces Acting on Topex/Poseidon for Precision Orbit Determination. J. Spacecr. Rocket. 1994, 31, 99–105. [Google Scholar] [CrossRef] [Green Version]
- Ziebart, M.; Adhya, S.; Sibthorpe, A. Combined radiation pressure and thermal modelling of complex satellites: Algorithms and on-orbit tests. Adv. Space Res. 2005, 36, 424–430. [Google Scholar] [CrossRef]
- Bhattarai, S.; Ziebart, M.; Allgeier, S.; Grey, S.; Springer, T.; Harrison, D.; Li, Z. Demonstrating developments in high-fidelity analytical radiation force modelling methods for spacecraft with a new model for GPS IIR/IIR-M. J. Geodesy 2019, 93, 1515–1528. [Google Scholar] [CrossRef] [Green Version]
- Rodriguez-Solano, C.J.; Hugentobler, U.; Steigenberger, P. Adjustable box-wing model for solar radiation pressure impacting GPS satellites. Adv. Space Res. 2012, 49, 1113–1128. [Google Scholar] [CrossRef]
- Montenbruck, O.; Steigenberger, P.; Hugentobler, U. Enhanced solar radiation pressure modeling for Galileo satellites. J. Geodesy 2014, 89, 283–297. [Google Scholar] [CrossRef]
- Colombo, O. The Dynamics of Global Positioning Orbits and the Determination of Precise Ephemerides. J. Geophys. Res. 1989, 94, 9167–9182. [Google Scholar] [CrossRef]
- Beutler, G.; Brockmann, E.; Gurtner, W.; Hugentobler, U.; Mervart, L.; Rothacher, M.; Verdun, A. Extended orbit modeling techniques at the CODE processing center of the International GPS Service for geodynamics (IGS): Theory and initial results. Manuscr. Geod. 1994, 19, 367–386. [Google Scholar]
- Springer, T.A.; Beutler, G.; Rothacher, M. A new solar radiation pressure model for the GPS satellites. GPS Solut. 1999, 3, 50–62. [Google Scholar] [CrossRef]
- Arnold, D.; Meindl, M.; Beutler, G.; Dach, R.; Schaer, S.; Lutz, S.; Prange, L.; Sośnica, K.; Mervart, L.; Jäggi, A. CODE’s new solar radiation pressure model for GNSS orbit determination. J. Geodesy 2015, 89, 775–791. [Google Scholar] [CrossRef] [Green Version]
- Bar-Sever, Y.; Kuang, D. New Empirically Derived Solar Radiation Pressure Model for Global Positioning System Satellites. Interplanet. Netw. Prog. Rep. 2004, 42–159, 1–11. [Google Scholar]
- Rodríguez-Solano, C.J. Impact of Non-Conservative Force Modeling on GNSS Satellite Orbits and Global Solutions; Technische Universität München: Munich, Germany, 2014. [Google Scholar]
- Tapley, B.; Schutz, B.; Born, G. Statistical Orbit Determination; Elsevier Academic Press: Burlington, MA, USA, 2004. [Google Scholar]
- Dai, X.; Lou, Y.; Dai, Z.; Qing, Y.; Li, M.; Shi, C. Real-time precise orbit determination for bds satellites using the square root information filter. GPS Solut. 2019, 23, 45. [Google Scholar] [CrossRef]
- Duan, B.; Hugentobler, U.; Chen, J.; Selmke, I.; Wang, J. Prediction versus real-time orbit determination for gnss satellites. GPS Solut. 2019, 23, 39. [Google Scholar] [CrossRef]
- Prange, L.; Orliac, E.; Dach, R.; Arnold, D.; Beutler, G.; Schaer, S.; Jäggi, A. CODE’s five-system orbit and clock solution-the challenges of multi-GNSS data analysis. J. Geodesy 2017, 91, 345–360. [Google Scholar] [CrossRef] [Green Version]
- Guo, J. The Impacts of Attitude, Solar Radiation and Function Model on Precise Orbit Determination for GNSS Satellites. Ph.D. Thesis, Wuhan University, Wuhan, China, 2014. (In Chinese). [Google Scholar]
- Dai, X.; Ge, M.; Lou, Y.; Shi, C.; Wickert, J.; Schuh, H. Estimating the yaw-attitude of BDS IGSO and MEO satellites. J. Geodesy 2015, 89, 1005–1018. [Google Scholar] [CrossRef]
- Lou, Y.; Liu, Y.; Shi, C.; Yao, X.; Zheng, F. Precise orbit determination of BeiDou constellation based on BETS and MGEX network. Sci. Rep. 2014, 4, 4692. [Google Scholar] [CrossRef] [PubMed] [Green Version]
- Montenbruck, O.; Steigenberger, P.; Darugna, F. Semi-analytical solar radiation pressure modeling for QZS-1 orbit-normal and yaw-steering attitude. Adv. Space Res. 2017, 59, 2088–2100. [Google Scholar] [CrossRef]
- Liu, J.; Ge, M. PANDA software and its preliminary result of positioning and orbit determination. Wuhan Univ. J. Nat. Sci. 2003, 8, 603–609. [Google Scholar]
- Shi, C.; Zhao, Q.; Geng, J.; Lou, Y.; Ge, M.; Liu, J. Recent development of PANDA software in GNSS data processing. In Proceedings of the SPIE 7285, International Conference on Earth Observation Data Processing and Analysis (ICEODPA), Wuhan, China, 28–30 December 2008; p. 72851S. [Google Scholar]
- Gendt, G.; Ge, M.; Nischan, T.; Uhlemann, M.; Beeskow, G.; Brandt, A. Annual Center Reports: GeoForschungsZentrum (GFZ). In International GNSS Service, Technical Report 2011; Meindl, M., Dach, R., Jean, Y., Astronomical Institute, University of Bern, Eds.; IGS Central Bureau: Pasadena, CA, USA, 2012; pp. 62–66. [Google Scholar]
- Rebischung, P.; Griffiths, J.; Ray, J.; Schmid, R.; Collilieux, X.; Garayt, B. IGS08: The IGS realization of ITRF2008. GPS Solut. 2012, 16, 483–494. [Google Scholar] [CrossRef]
- Dilssner, F.; Springer, T.; Schönemann, E.; Enderle, W. Estimation of Satellite Antenna Phase Center Corrections for BeiDou; IGS Workshop: Pasadena, CA, USA, 2014. [Google Scholar]
- Wu, J.T.; Wu, S.C.; Hajj, G.A.; Bertiger, W.I.; Lichten, S.M. Effects of antenna orientation on GPS carrier phase. Manuscr. Geod. 1993, 18, 91–98. [Google Scholar]
- Boehm, J.; Niell, A.; Tregoning, P.; Schuh, H. Global Mapping Function (GMF): A new empirical mapping function based on numerical weather model data. Geophys. Res. Lett. 2006, 33, L7304. [Google Scholar] [CrossRef] [Green Version]
- Chen, G.; Herring, T.A. Effects of atmospheric azimuthal asymmetry on the analysis of space geodetic data. J. Geophys. Res. 1997, 102, 20489–20502. [Google Scholar] [CrossRef]
- Förste, C.; Schmidt, R.; Stubenvoll, R.; Flechtner, F.; Meyer, U.; König, R.; Neumayer, H.; Biancale, R.; Lemoine, J.; Bruinsma, S.; et al. The GeoForschungsZentrum Potsdam/Groupe de Recherche de Gèodésie Spatiale satellite-only and combined gravity field models: EIGEN-GL04S1 and EIGEN-GL04C. J. Geodesy 2008, 82, 331–346. [Google Scholar] [CrossRef] [Green Version]
- Petit, G.; Luzum, B. IERS Conventions 2010. In No. 36 in IERS Technical Note; Verlag des Bundesamts für Kartographie und Geodäsie: Frankfurt am Main, Germany, 2010. [Google Scholar]
- Lyard, F.; Lefevre, F.; Letellier, T.; Francis, O. Modelling the global ocean tides: Modern insights from FES2004. Ocean Dyn. 2006, 56, 394–415. [Google Scholar] [CrossRef]
- Kouba, J. A simplified yaw-attitude model for eclipsing GPS satellites. GPS Solut. 2009, 13, 1–12. [Google Scholar] [CrossRef]
- Dilssner, F.; Springer, T.; Gienger, G.; Dow, J. The GLONASS-M satellite yaw-attitude model. Adv. Space Res. 2011, 47, 160–171. [Google Scholar] [CrossRef]
- Steigenberger, P.; Hugentobler, U.; Loyer, S.; Perosanz, F.; Prange, L.; Dach, R.; Uhlemann, M.; Gendt, G.; Montenbruck, O. Galileo orbit and clock quality of the IGS Multi-GNSS Experiment. Adv. Space Res. 2015, 55, 269–281. [Google Scholar] [CrossRef]
- Ge, M.; Gendt, G.; Dick, G.; Zhang, F.P. Improving carrier-phase ambiguity resolution in global GPS network solutions. J. Geodesy 2005, 79, 103–110. [Google Scholar] [CrossRef]
- Hatch, R. The synergism of GPS code and carrier measurements. In Proceedings of the Third International Symposium on Satellite Doppler Positioning, Las Cruces, NM, USA, 8–12 February 1982; Volume 2, pp. 1213–1231. [Google Scholar]
- Melbourne, W.G. The case for ranging in GPS-based geodetic systems. In Proceedings of the First International Symposium on Precise Positioning with the Global Positioning System, Rockville, MD, USA, 15–19 April 1985; pp. 373–386. [Google Scholar]
- Wübbena, G. Software developments for geodetic positioning with GPS using TI-4100 code and carrier measurements. In Proceedings of the First International Symposium on Precise Positioning with the Global Positioning System, Rockville, MD, USA, 15–19 April 1985; pp. 403–412. [Google Scholar]
- Ge, M.; Gendt, G.; Dick, G.; Zhang, F.; Rothacher, M. A New Data Processing Strategy for Huge GNSS Global Networks. J. Geodesy 2006, 80, 199–203. [Google Scholar] [CrossRef]
- Lou, Y.; Gong, X.; Gu, S.; Zheng, F.; Feng, Y. Assessment of code bias variations of BDS triple-frequency signals and their impacts on ambiguity resolution for long baselines. GPS Solut. 2017, 21, 177–186. [Google Scholar] [CrossRef]
- Ge, M.; Zhang, H.P.; Jia, X.L.; Song, S.L.; Wickert, J. What is achievable with current COMPASS constellation? In Proceedings of the ION GNSS 2012, Institute of Navigation, Nashville, TN, USA, 17–21 September 2012; pp. 331–339. [Google Scholar]
- Liu, Y.; Ge, M.; Shi, C.; Lou, Y.; Wickert, J.; Schuh, H. Improving integer ambiguity resolution for GLONASS precise orbit determination. J. Geodesy 2016, 90, 715–726. [Google Scholar] [CrossRef]
- Geng, J.; Zhao, Q.; Shi, C.; Liu, J. A review on the inter-frequency biases of GLONASS carrier-phase data. J. Geodesy 2017, 91, 329–340. [Google Scholar] [CrossRef]
- Zhao, Q.; Li, X.; Liu, Y.; Geng, J.; Liu, J. Undifferenced ionospheric-free ambiguity resolution using GLONASS data from inhomogeneous stations. GPS Solut. 2018, 22, 26. [Google Scholar] [CrossRef]
- Dach, R.; Schaer, S.; Lutz, S.; Bock, H.; Orliac, E.; Prange, L.; Thaller, D.; Mervart, L.; Jäggi, A.; Beutler, G.; et al. Annual Center Reports: Center for Orbit Determination in Europe (CODE). In International GNSS Service, Technical Report 2011; Meindl, M., Dach, R., Jean, Y., Astronomical Institute, University of Bern, Eds.; IGS Central Bureau: Pasadena, CA, USA, 2012; pp. 29–40. [Google Scholar]
- Griffiths, J.; Ray, J. On the precision and accuracy of IGS orbits. J. Geodesy 2009, 83, 277–287. [Google Scholar] [CrossRef]
- Pearlman, M.R.; Degnan, J.J.; Bosworth, J.M. The International Laser Ranging Service. Adv. Space Res. 2002, 30, 135–143. [Google Scholar] [CrossRef]


| Sampling rate | 300 s |
| Signal | GPS: L1/L2; GLONASS: L1/L2; Galileo: E1/E5a; BDS: B1/B2 |
| Cutoff elevation | 7° |
| Weighting | Priori precision 0.01 cycle and 0.5 m for raw phase and code, respectivelyElevation-dependent, 1 for E > 30°, otherwise 2sin(E) |
| ISB/IFB | Estimated as constant parameters with zero-mean constraints |
| Antenna model | Satellites and stations PCO/PCV from IGS [35], BDS satellites from [36], Galileo/BDS stations using GPS L1 and L2 |
| Phase windup | Corrected [37] |
| Tropospheric delay | GMF [38], 2-hourly ZTD, 24-hourly gradients [39] |
| Clock error | Epoch-by-epoch as white noise |
| ERP | IERS predicted products as the a priori; x-pole, y-pole and their rates estimated with constraints of 3 mars and 0.3 mars/day, respectively; UT1 and its rates estimated with constraints of 1 us and 1 ms/day, respectively |
| Earth gravity | EIGEN_GL04C [40] up to degree and order 12 |
| N-body gravitation | Sun, Moon, and all other Planets, JPL ephemeris DE405 |
| Tidal displacement | IERS Conventions 2010 [41], FES2004 [42] |
| Relativity effect | IERS Conventions 2010 [41] |
| Earth radiation Transmitter thrust | GPS and GLONASS applied [23]; Galileo and BDS not applied |
| Satellite attitude | GPS and GLONASS yaw model [43,44]; Galileo nominal yaw-steering [45]; BDS GEO nominal orbit-normal, IGSO and MEO orbit-normal/yaw-steering [28,29] |
| Baseline Length (km) | Ambiguity Number | ECOM 1 | ECOM 2 |
|---|---|---|---|
| <1000 | 1229 | 95.7% | 95.7% |
| 1000–2000 | 3602 | 94.9% | 94.8% |
| >2000 | 1975 | 94.5% | 94.5% |
| All | 6806 | 94.9% | 94.9% |
| Baseline Length (km) | Ambiguity Number | ECOM 1 | ECOM 2 |
|---|---|---|---|
| <500 | 283 | 91.7% | 91.9% |
| 500–1000 | 591 | 89.7% | 90.0% |
| >1000 | 1174 | 83.9% | 88.3% |
| All | 2048 | 86.5% | 89.3% |
| Baseline Length (km) | Ambiguity Number | ECOM 1 | ECOM 2 |
|---|---|---|---|
| <1000 km | 124 | 87.6% | 88.5% |
| 1000–2000 km | 290 | 80.0% | 82.3% |
| >2000 km | 98 | 70.7% | 78.6% |
| All | 512 | 80.0% | 83.1% |
| Baseline Length (km) | Ambiguity Number | ECOM 1 | ECOM 2 |
|---|---|---|---|
| <1000 | 142 | 85.0% | 85.1% |
| 1000–2000 | 174 | 71.6% | 73.1% |
| >2000 | 17 | 58.0% | 67.7% |
| All | 333 | 76.3% | 77.9% |
| 0 h | 1 h | 3 h | 6 h | 24 h | |
|---|---|---|---|---|---|
| GLONASS | 4125 | 230 | 582 | 1062 | 4353 |
| Galileo | 2154 | 118 | 293 | 540 | 2223 |
| BDS-2 MEO | 185 | 6 | 28 | 53 | 190 |
| BDS-2 IGSO | 171 | 0 | 0 | 0 | 144 |
| BDS-2 GEO | 99 | 0 | 0 | 0 | 81 |
© 2019 by the authors. Licensee MDPI, Basel, Switzerland. This article is an open access article distributed under the terms and conditions of the Creative Commons Attribution (CC BY) license (http://creativecommons.org/licenses/by/4.0/).
Share and Cite
Liu, Y.; Liu, Y.; Tian, Z.; Dai, X.; Qing, Y.; Li, M. Impact of ECOM Solar Radiation Pressure Models on Multi-GNSS Ultra-Rapid Orbit Determination. Remote Sens. 2019, 11, 3024. https://doi.org/10.3390/rs11243024
Liu Y, Liu Y, Tian Z, Dai X, Qing Y, Li M. Impact of ECOM Solar Radiation Pressure Models on Multi-GNSS Ultra-Rapid Orbit Determination. Remote Sensing. 2019; 11(24):3024. https://doi.org/10.3390/rs11243024
Chicago/Turabian StyleLiu, Yang, Yanxiong Liu, Ziwen Tian, Xiaolei Dai, Yun Qing, and Menghao Li. 2019. "Impact of ECOM Solar Radiation Pressure Models on Multi-GNSS Ultra-Rapid Orbit Determination" Remote Sensing 11, no. 24: 3024. https://doi.org/10.3390/rs11243024
APA StyleLiu, Y., Liu, Y., Tian, Z., Dai, X., Qing, Y., & Li, M. (2019). Impact of ECOM Solar Radiation Pressure Models on Multi-GNSS Ultra-Rapid Orbit Determination. Remote Sensing, 11(24), 3024. https://doi.org/10.3390/rs11243024