Article

Crustal Deformation of Northeastern China Following the 2011 Mw 9.0 Tohoku, Japan Earthquake Estimated from GPS Observations: Strain Heterogeneity and Seismicity

1
Key Laboratory of Earthquake Forecasting, Institute of Earthquake Forecasting, China Earthquake Administration, Beijing 100036, China
2
Department of Geodesy, Cadaster and Land Management, Far Eastern Federal University, Vladivostok 690068, Russia
3
Institute of Applied Mathematics, Far Eastern Branch of Russian Academy of Sciences, Vladivostok 690091, Russia
4
Institute of Seismology and Volcanology, Hokkaido University, Sapporo 0600810, Japan
*
Author to whom correspondence should be addressed.
Remote Sens. 2019, 11(24), 3029; https://doi.org/10.3390/rs11243029
Submission received: 22 November 2019 / Revised: 12 December 2019 / Accepted: 13 December 2019 / Published: 16 December 2019
(This article belongs to the Special Issue Global Navigation Satellite Systems for Earth Observing System)

Abstract

:
Using global positioning system (GPS) observations of northeastern China and the southeast of the Russian Far East over the period 2012–2017, we derived an ITRF2014-referenced velocity field by fitting GPS time series with a functional model incorporating yearly and semiannual signals, linear trends, and offsets. We subsequently rotated the velocity field into a Eurasia-fixed velocity field and analyzed its spatial characteristics. Taking an improved multiscale spherical wavelet algorithm, we computed strain rate tensors and analyzed their spatial distribution at multiple scales. The derived Eurasia-referenced velocity field shows that northeastern China generally moved southeastward. Extensional deformation was identified at the Yilan–Yitong Fault (YYF) and the Dunhua–Mishan Fault (DMF), with negligible strike–slip rates. The principal strain rates were characterized by NE–SW compression and NW–SE extension. The dilation rates show compressional deformation in the southern segment of the YYF, northern end of the Nenjiang Fault (NJF), and southeast of the Russian Far East. We also investigated the impact of the 2011 Tohoku Mw 9.0 earthquake on the crustal deformation of northeastern China, generated by its post-seismic viscoelastic relaxation. The velocities generated by the post-seismic viscoelastic relaxation of the giant earthquake are generally orientated southeast, with magnitudes inversely proportional with the epicentral distances. The principal strain rates caused by the viscoelastic relaxation were also characterized by NW–SE stretching and NE–SW compression. The dilation rates show that compressional deformation appeared in the southern segment of the DMF and the YYF and southeast of the Russian Far East. Significant maximum shear rates were identified around the southern borderland between northeastern China and the southeast of the Russian Far East. Finally, we compared the multiple strain rates and the seismicity of northeastern China after the 2011 Tohoku earthquake. Our finding shows that the ML ≥ 4.0 earthquakes were mostly concentrated around the zones of high areal strain rates and shear rates at scales of 4 and 5, in particular, at the DMF and YYF fault zones.

Graphical Abstract

1. Introduction

The 2011 Mw 9.0 earthquake in Tohoku, Japan caused large-scale coseismic crustal deformation throughout northeastern Asia up to 3000 km from the epicenter [1,2]. The coseismic displacements reached tens of meters for the global positioning system (GPS) sites on northeastern Japanese islands [3,4]. This earthquake generated coseismic offset of 14.5–57.7 mm in Korea [5,6] and of ~32 mm in northeastern China [7,8]. Coseismic deformation in northeastern China was dominated by EW-oriented stretching, with amounts near or higher than the tectonic rate [9]. Temporally, the Tohoku earthquake caused disturbance to the crustal stress, not only in the near-field Japan island [10,11], but also in far-field north and northeastern China [8,12,13]. The coseismic Coulomb stress variation produced by the Tohoku earthquake on the primary faults in eastern China was smaller than 0.01 Mpa, the empirical threshold to trigger seismicity rate variation.
Several researchers have calculated the strain rates due to the viscoelastic relaxation after the Tohoku earthquake using a layered rheological model, showing that the strain rate pattern is almost identical to that generated by the mainshock, however with lessened magnitude [8,9]. The seismicity rate recorded by the Chinese Seismic Network does not show significant increase about the primary faults in eastern China following the Tohoku earthquake, but the seismicity rate in northeastern China appears to be a low rate lasting for2 years following the Tohoku earthquake [9], The Epidemic-type Aftershock Sequence (ETAS) model [14,15] was utilized to delineate the observed seismic activities. This indicates that the Tohoku earthquake could have caused a significant influence on the seismic activity in northeastern China, where coseismic displacement and strain are larger than those in other areas in China.
We utilized the data of continuous and campaign GPS sites in northeastern China, including those of the Crustal Movement Observation Network of China (CMONOC), and its successor the Tectonic and Environment Observation Network of China (TEONOC), as well as the continuous GPS sites installed and operated by China Metrological Administration (CMA) over the period of 2012–2017. In addition, we also utilized the GPS velocities of the Russian GPS Network in the Russian Far East to obtain an integrated GPS velocity field. The GPS data of denser sites, including those in northeastern China and the Russian Far East, with a timespan longer than previous studies could better characterize the deformation of crust following the Tohoku mega-earthquake. Firstly, we evaluated crustal deformation in northeastern China following the 2011 Tohoku mega-earthquake with a detailed analysis of the velocity field. Then, we estimated the activity of the Dunhua–Mishan Fault (DMF) and Yilan–Yitong Fault (YYF) by taking an approach centered on GPS velocity profiles. Subsequently, we analyzed the strain rates calculated by the improved multiscale spherical wavelet algorithm [16], followed by the analysis to the impact of the post-seismic relaxation owing to the 2011 Tohoku mega-earthquake on the crustal deformation of northeastern China. Finally, we explored whether the strain rate components inferred from the GPS observations could be correlated with seismicity after the 2011 Tohoku earthquake.

2. Seismotectonic Setting

Northeastern China is located within the proposed Amur microplate [17,18], which is near the eastern boundary of the Eurasian plate (Figure 1). The region is enclosed by the Sino–Korean craton in the south [19,20], and in the north by the Siberian craton [21,22]. In the period of the late Mesozoic, as well as the Cenozoic, stretching was widespread in northeastern China [23]. At least three rifting phases occurred in this region. The first rifting phase was in the late Jurassic–early Cretaceous times, characteristic of intracontinental rifts, volcanism, and extension along the large strike–slip faults [21], resulting in the emergence of the Songliao Basin and its adjacent volcanic mountain ranges. After uplift and denudation generated by compression tectonism near the end of the Cretaceous, in a Paleogen rifting phase, numerous continental rift systems and continental margin basins appeared [23]. During the Neogen, early tertiary basins went into a post-rifting stage, yielding a regional depression [21]. During the Quaternary, rifting was characterized by the eruption of basalt and accelerated depression in the region of tertiary rifting [23].
Multiple studies have been done to ascertain the cause of the crustal extension. The subduction toward the west and rollback to the east of the paleo-Pacific Plate were proposed to interpret the observed widespread stretching and volcanism [24,25]. On the other hand, several researchers claimed that the widespread rifting is possibly associated with progressive closure of the Mongol–Okhotsk Ocean from west to east. The collision after the closure caused lithospheric thickening in northeastern China and the following collapse of the thickened lithosphere led to thinning of the thermally weakened boundary layer [26,27]. Moreover, the gravitational collapse of thickened and weakened crust could also cause the widespread rifting [28].
The DMF and YYF are two strands of the northern extension of the NNE-trending Tanlu fault, which is the fault of largest extent in the eastern Chinese mainland. The 800-km-long YYF extends northeastward from northern Shenyang along the orientation of N50°–55°E, crossing the eastern side of the Songliao Basin, terminating in the Far East of Russia. It has been thought that this fault developed from early the Cretaceous to early Tertiary [29]. Intersecting with the YYF at its southern end, the 900-km-long DMF extends NNE-ward in the direction of ~50°, obliquely to the strike of the YYF. The DMF has undergone at least a two-phase strike–slip activity, namely in the middle-late Permian to the early Triassic and the middle-late Jurassic to the early Cretaceous, with a total offset distance of ~400 km [30]. Recent investigation shows that the new motion of the YYF since the Holocene was predominated by dextral strike–slip, with a normal component [31]. It has been thought that no historical earthquake larger than magnitude 6 occurred at the YYF. However, recent trench excavation at the YYF and sample dating suggest this fault was ruptured by an M ≥ 7 earthquake after 1730 ± 40 year BP [31]. Instrumental seismicity show shallow medium-sized events, generally smaller than magnitude 6, occurred near the YYF, with the largest one measuring M 5.8 in 1963 [32].
Another major fault is the NEE-trending blind Tangshan fault, recognized after the 1976 Mw 7.8 Tangshan earthquake. Small earthquakes have frequently occurred since the 1976 Tangshan earthquake, which were thought to be a long-lasting sequence of aftershocks. Of note was a sequence of small seismic events, which occurred in the Tangshan area in early 2012, incorporating an Ms 4.8 event and an M 4.0 event on 28 May 2012 and 18 June 2012, respectively, after the 2011 Tohoku earthquake. Statistically, deep-focus earthquakes and shallow-focus earthquakes in northeastern China are characterized by activities in groups, with evident correlation in spatial–temporal distribution [32]. The migratory direction of major earthquakes on the subduction belt in the Sea of Japan could cause significant influence on the distribution in space of the shallow seismic events in northeastern China [33].

3. Method

3.1. The Processing of GPS Data

We collected the GPS data of CMONOC and TEONOM, and the data of continuous sites operated by CMA in northeastern China over the period of 2012–2017 (Figure 2). To analyze the crustal deformation pattern after the 2011 Tohoku giant earthquake, we employed the GAMIT/GLOBK software (version 10.6) [34,35] to process raw data in a two-step approach. Firstly, GPS raw data from each station were processed with sessions to calculate post-seismic time series. Details on the processing procedure can be found in our previous work [36,37], and are not repeated here. However, it needs to be mentioned that we also collected raw data of other CMONOC continuous GPS stations throughout the Chinese mainland and about 80 ITRF2014 reference stations distributed globally to realize a reasonable reference frame [38].
Then, the least squares adjustment vectors and the variance–covariance matrix of station positions as well as orbit parameters of each daily solution were further passed to a Kalman filter of GLOBK to resolve position time series by minimizing the deviation of the positions and velocities of the core stations of the IGS network relative to the ITRF2014, with the estimation of translation, orientation, and scale transformation. An iterative approach was performed to remove stations of low-quality data and to stabilize the reference frame.
The velocities and corresponding errors of each site were estimated by linear best fitting for the daily position time series. We invoked a model encompassing a constant linear velocity, yearly and half-year sinusoidal change terms, and jump parameters to fit coordinate time series of each component for each station, written as [39]:
D k ( t i ) = D k ( t 0 ) + v k t i + m = 1 2 [ a m sin ( 2 m π t i ) + b m cos ( 2 m π t i ) ] + j = 0 j 0 o j H ( t i t j ) + e i
where k = n , e , u for the north, east, and vertical components, respectively; D k ( t 0 ) is the station position at time t 0 , and v k is the linear rate of component k ; a m and b m denote the sine and cosine component amplitudes of annual or semi-annual periods; H ( t i t j ) is the Heaviside function; o j is the jump at time t j , and e i the noise of position time series. Concerning the error range, a 95% confidence interval was estimated according to standard normal distribution deduced from the best fitting. The one-sigma root mean square (RMS) was calculated as the residual error in accordance with the data fitting. Outliers with deviations from the fitting beyond the RMS error range, larger than three times that of the RMS, were eliminated from subsequent analysis. GPS sites with RMS beyond 5 mm or a data loss of > 20% for daily recording within the analysis timespan were removed, taking into account that peculiar or frequently interrupted recordings of the sites could imply severe noise for the continuous GPS sites.

3.2. Strain Rate Estimation

In this section, we briefly review the procedures of our approach in strain rate calculation. An optimized algorithm of spherical wavelets was utilized to decompose total strain rates into multiple spatial scales to obtain various scales of strain rates in an uneven distribution of GPS sites [16]. We adopted the difference of Gaussian (DOG) functions by translation and scaling to construct the wavelet basic functions, which are heterogeneous in spatial distribution due to the irregularity of the GPS station distribution. The minimum decomposition scale of 2 was determined by aperture of the GPS network; the scale of maximum decomposition was estimated by the GPS site density. We computed the scale of maximum decomposition by searching for the zone with the smallest radius, including 3 GPS sites at the locus of the wavelet basis functions. The decomposition scales of 6, 7, 8, and 9 correspond to spatial resolutions of 174.4 km, 87.2 km, 43.6 km, and 21.8 km, respectively [40]. Scales 2–9 were determined as sequential decomposition to compute the strain rates.
The relationship between the GPS-derived velocities and the coefficients of the wavelet basic function is written as:
v ( θ , φ ) = k = 1 M [ f ^ k e w g k ( θ , φ ) θ ^ + f ^ k n s g k ( θ , φ ) φ ^ ]
where θ and φ represent the respective co-latitude and longitude of specified GPS sites; θ ^ and φ ^ are the unit vectors of the north component and the east component, respectively; M is the number of basis functions in total; υ ( θ , ϕ ) represents the observed velocity vector for the site at ( θ , ϕ ) , and g k ( θ , φ ) the k-th DOG wavelet basis function. Here, f k e w and f k n s are the k-th parameters for the respective eastern and northern components. Derived from the translation and scaling of their mother functions, the DOG wavelet basis functions are not orthogonal, resulting in rank deficiency of the coefficient matrix of the normal equations [41].
To address this issue, we took the Tikhonov criterion [42] as a trade-off between residuals and smoothness. The optimal regularization was obtained with the minimum value of the ordinary cross-validation function [43] for the respective north and east components. We performed first-order partial differentials for the basis functions and subsequently computed the components of the tensor of velocity gradients at a specified point, which can be written as
[ ε θ ε θ ϕ ε ϕ ε ϕ θ ] = [ G ( θ , ϕ ) θ 0 0 G ( θ , ϕ ) θ G ( θ , ϕ ) ϕ 0 0 G ( θ , ϕ ) ϕ ] [ f ^ n s f ^ e w ]
where ε θ , ε θ ϕ , ε ϕ and ε ϕ θ represent the components of the tensor of the velocity gradients, while G ( θ , ϕ ) θ and G ( θ , ϕ ) ϕ are the partial first-order differentials for wavelet basis functions of the respective northern and eastern components. The f ^ n s and f ^ e w are parameters to be estimated for north and east components. We calculated two-dimensional velocity gradient tensors at grid nodes with obtained wavelet basic functions. The tensors of strain rate and rotation rate were derived from the tensors of velocity gradients. The tensor of strain rate was subsequently invoked to estimate the various strain rates.

4. Results

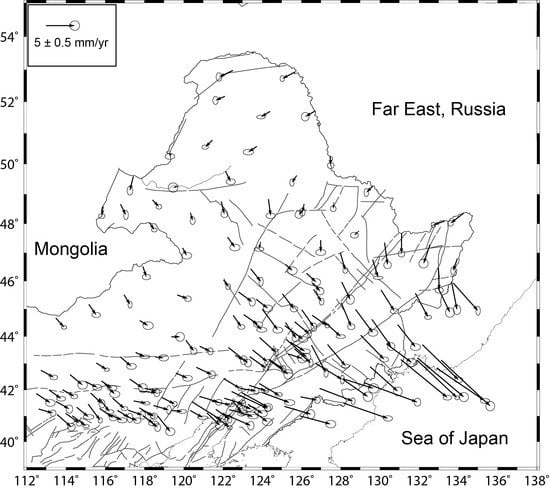
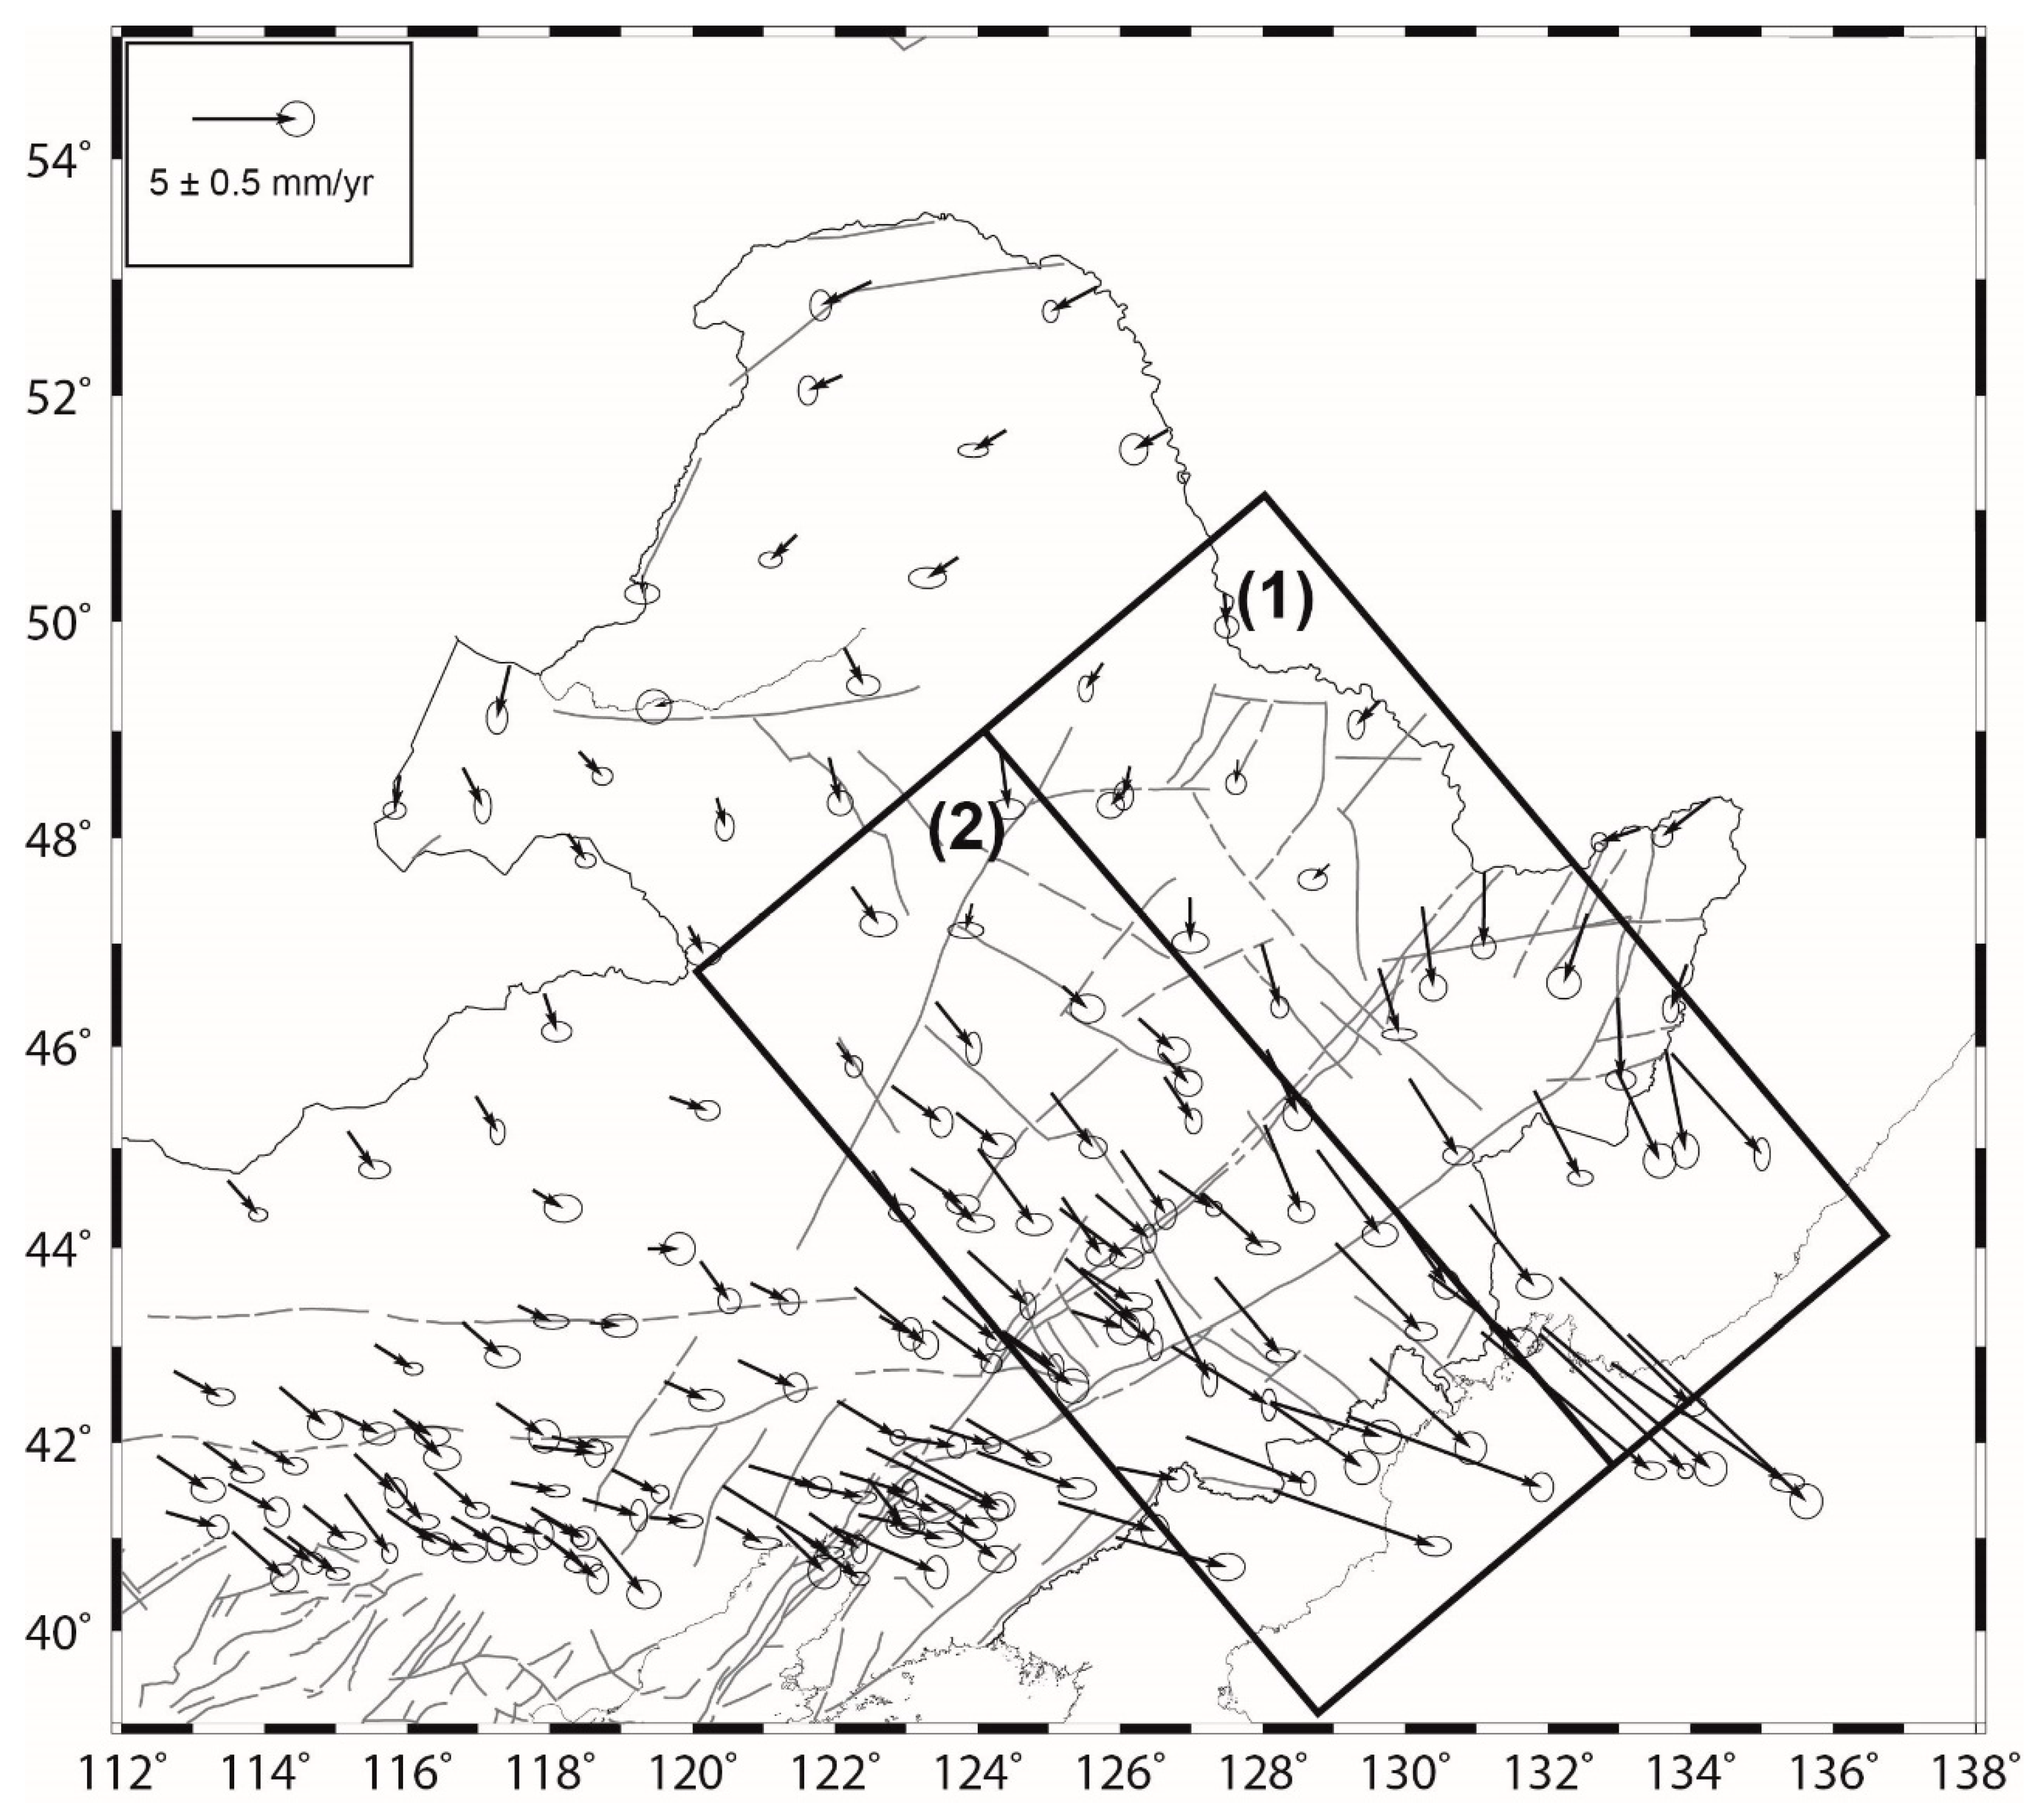
4.1. Horizontal Velocities

We transformed the ITRF2014-referenced velocities into the stable Eurasia-referenced frame utilizing the angular rate of the Eurasian plate [38]. The GPS velocities for continuous and campaign sites of CMONOC, and continuous sites of CMA in northeastern China are listed in Tables S1–S3. We integrated our site velocities with those of 7 GPS sites in the Russian Far East to obtain a relatively denser field of GPS velocities. The Russian sites velocities have the same reference frame as our GPS sites in northeastern China. The GPS velocity field relative to the Eurasian plate (Figure 3) was characterized by a heterogeneous deformation pattern. Except for the GPS sites in the northwestern zone of the study area, GPS velocity vectors show a southeastern movement, primarily orientated toward the epicentral area of the 2011 Tohoku earthquake.
The GPS velocities in the southeastern zone of the Russian Far East had the most significant velocity vector magnitudes, in the range of 5.00 mm/year to 8.00 mm/year. In the northernmost zone of the study area, the GPS site moved southwestward, with a magnitude of around 3.00 mm/year. The GPS sites within the region of 114°E–124°E, N°46–N°50 show velocity vector magnitudes within a range of 3–4 mm/year, with an average orientation of 135.5 ± 3.5°, whereas the GPS stations in the zone of 112°E–124°E, 40°N–45°N had a velocity vector magnitude of 2.00–3.00 mm/year, with an average orientation at 132.6 ± 3.4°. The GPS sites east of the DMF show a larger velocity vector magnitude, in the range of 5.00 mm/year to 9.00 mm/year, indicating that the DMF is characterized by extensional activity. A visual comparison between the GPS velocities across the YYF also shows significant extension of the fault.
To further analyze the activities of the YYF and DMF, we drew two GPS velocity transects across the northeastern and southwestern segments of the two faults to estimate their slip rates. The two transects are plotted in the direction of N150°E, normal to the average strike of the two strands of the Tanlu Fault, as demonstrated by the two rectangles in Figure 3. The velocities of the GPS sites located within the rectangles were resolved into the fault-parallel and fault-perpendicular components (Figure 4). We calculated the mean values of the two velocity components for GPS sites in respective sides of the fault, and then differentiated the mean velocities to determine the activities of the two segments. There are 32 GPS sites distributed within the northeastern rectangle (rectangle 1 in Figure 3). A conspicuous velocity gradient along the transect across the DMF and YYF was identified for the fault-perpendicular velocity components (Figure 4a), while insignificant differential movement was determined to the fault-parallel velocity components (Figure 4b), indicating that the northeastern segments of the two faults were dominated by extensional activity.
We estimated an extensional rate of 3.98 ± 0.04 mm/year and a slight right-lateral rate of 1.00 ± 0.05 mm/year for the DMF. The YYF was found to be less active, with an extensional rate of 1.07 ± 0.05 mm/year, and a slight right-lateral slip rate of 0.78 ± 0.02 mm/year. If the DMF and YYF are taken as an integrated fault system, its activity could be identified using the above approach, with an extensional rate of 4.96 ± 0.05 mm/year and a slight left-lateral slip rate of 0.44 ± 0.04 mm/year. In total, there are 36 GPS sites located within the southwestern rectangle (rectangle 2 in Figure 3). Following the same approach as that for the northeastern profile, we calculated the slip rates of the southwestern segments of the DMF and YYF (Figure 5). The activity of the DHY shows an extensional rate of 2.55 ± 0.04 mm/year and a slight right-lateral slip rate of 1.00 ± 0.05 mm/year. On the other hand, the YYF was identified to be less active than the DMF, with an slight extensional rate of 0.71 ± 0.05 mm/year and a small dextral slip rate of 0.38 ± 0.02mm/year. Assuming the DMF and YYF as a combined fault system, we could estimate its activity to have a larger extensional component of 3.25 ± 0.05 mm/year and with a significant right-lateral slip rate of 3.25 ± 0.05 mm/year. The activity characteristic estimated for the YYF from GPS data is in agreement with recent geological field investigation. The trench excavation and the petroleum geophysical profile exploration indicate that the new activity in Holocene is primarily characterized by a dextral strike–slip with a normal component [31].

4.2. Heterogeneous Strain Rates

Figure 6 depicts wavelet base function distribution calculated from the algorithm, as stated in Section 3.2. As shown in Figure 7, the modeled velocities are generally consistent with the observed GPS velocities. Mean residual velocities are −0.04 mm/year and 0.02 mm/year EW and NS components, respectively. Site GRNC has maximum residuals of −0.88 mm/year and 0.12 mm/year for EW and NS components, respectively. More than 95% residuals were less than 0.25 mm/year for the EW and NS components, as shown by the upper right inset of Figure 7. Strain rate at the specified decomposition scale represent the crustal deformation at the corresponding spatial wavelength. Figure 8 shows the principal strain rate and areal strain rate distribution at multiple decomposition scales. As shown in Figure 8a, at the scales of 2–9, the orientations of the maximum principal strain rate were generally oriented NW–WNW, with some localized variation, in particular in the northern part of the study area. The maximum and minimum principal strain rates increased from west to east, whereas the maximum principal strain rate had an average of 7.22 nstrain/year, with a range from −0.46 nstrain/year to 52.45 nstrain/year. The minimum principal strain rate averaged -6.08 nstrain/year, ranging from −37.01 nstrain/year to 1.03 nstrain/year. Generally, the magnitudes for the principal strain rates are higher in the easternmost domain of the study area. Furthermore, the magnitude of the principal strain rates lessened with the decrease of scales, while the orientation of the principal strain rates did not exhibit significant variation (Figure 8b–d). Significant localized contraction deformation (i.e., a decrease in area) was identified in the southern segment of the DMF and YYF, with a maximum value of 25 nstrain/year (10−9/year), whereas dilation deformation occurred around the central and northern segments of the two faults.
Localized contraction and dilation appeared alternately around the locus of 130°E, 43°N near the southern borderland of northeastern China and the southeastern part of the Russian Far East. The rest of areas did not have significant areal strain rates. Figure 8b shows the principal strain rate and areal strain rates at scale 6, corresponding to a spatial wavelength of 174. 4 km. It can be seen that spatially the localized compression and dilation appeared alternately around the major faults in northeastern China. The strain rate at scale 5 (Figure 8c) represents the strain rate of the wavelength at 348.8 km, showing extensional deformation in a NNE-striking band in the southeastern zone of northeastern China. The NNE-striking band separated several contraction zones. The strain rates at scale 4 (Figure 8d) demonstrated that an elongated zone of dilation deformation appeared in the southeastern area of northeastern China, with the rest of the areas being compressional.
Figure 9a shows maximum shear strain rate at scales 2–9. The maximum shear deformation was dominant around the southeastern part of northeastern China, with a maximum value of 38 nstrain/year at the locus of 130°E, 43°N, near the boundary between northeastern China and the southeastern part of the Russian Far East. The DMF and YYF are characterized by noticeable shearing sense deformation. The maximum shear strain rates at scale 6 (Figure 9b) demonstrate that the shearing deformation was mostly distributed around the major faults of northeastern China, with a maximum value of 14 nstrain/year. As shown by Figure 9c, northeast of the Changbai volcano had the largest maximum shear strain rate at scale 7, corresponding to a decomposition scale of 4. Prominently, the shearing deformation was localized in the northeastern segments of the DMF and YYF (Figure 9d). Overall, GPS-derived strain rate components displayed a heterogeneous trend in northeastern China following the 2011 Tohoku earthquake.

5. Discussion

5.1. Impact of the 2011 Tohoku Earthquake

The Earth’s lithosphere generally experiences a period of accelerated deformation following a large earthquake in response to sudden coseismic stress variations. Transient post-seismic relaxation incorporates contributions due to fault afterslip [44], viscoelastic flow of the lower crust and upper mantle [45], poroelastic rebound of the upper crust [46], and recovery related to coseismic dilatancy of the fault zone [47]. Viscoelastic relaxation at depth is predominant in the post-seismic transient deformation, in particular in the far-field areas from the coseismic fault [48]. It was identified that the afterslip of the 2011 Tohoku earthquake had quickly decayed by September 2013 [49], with viscoelastic relaxation dominating after this time. To investigate the impact of the 2011 Tohoku mega-earthquake on the crustal deformation of northeastern China due to its viscoelastic relaxation, we employed a model incorporating an elastic layer and a homogeneous Maxell viscoelastic substratum. The overlying elastic layer stands for the lithosphere, whereas the underlying viscoelastic substratum denotes the asthenosphere. A rigidity of 30 Gpa was set for the overlying elastic layer, while a rigidity of 60 Gpa was set for the lower viscoelastic substratum. The Maxwell solid body’s viscosity was set to 1.0 × 10¹⁹ Pa.s, and the thickness of elastic layer was set to 30 km by referring to a previous study [7].
We employed the source model inverted from the data of inland GPS sites and ocean bottom GPS and acoustic observations [50]. The post-seismic displacements were calculated at multiple specified time points and fitted to the displacements with a linear regression approach to obtain the velocities for each GPS sites over the period of 2012–2017. Figure 10 shows the derived surface deformation owing to the relaxation process. The mean velocities are 2.74 mm/year and −0.88 mm/year for EW and NS components, respectively. The NKHD site in the Russian Far East had maximum values of 7.27 mm/year for the EW component and −3.72 mm/year for the NS component. Generally, the orientations of crustal motion due to the post-seismic viscoelastic relaxation were orientated toward the epicenter of the 2011 Tohoku giant earthquake, with magnitudes lessening with increasing distance away from the epicenter.
We made a velocity cross-section with a size identical to the rectangles in Figure 3 across the DMF and HHY in the direction of 60°NE to further quantify the influence of viscoelastic relaxation on the two faults. There are 78 GPS sites in total within the plotted cross-section. All the velocities of GPS sites in the cross-sections were resolved into fault-parallel and fault-perpendicular components. As demonstrated in Figure S1, an evident velocity gradient was identified for the fault-perpendicular components across the two faults, with the velocity magnitudes of GPS sites east of the DMF being distinctly larger than those of GPS sites west of the YYF and those sites between the two faults. Nevertheless, the fault-parallel velocity components were almost identical at the 95% confidence level across the two faults. We computed the mean value of the velocity components for the GPS sites on each site of the two faults, and then took the difference between them.
The extensional velocity was estimated to be 2.01 ± 0.02 mm/year, with a slight dextral slip rate of 0.11 ± 0.02 mm/year for the DMF. The YYF appeared to be less impacted, with an insignificant extensional slip rate of 0.56 ± 0.02 mm/year and a dextral of 0.08 ± 0.03 mm/year. If the DMF and YYF were regarded as a coupled fault system, the influence due to the viscoelastic relaxation can be estimated as having an extensional rate pf 2.57 ± 0.05 mm/year and a dextral slip rate of 0.08 ± 0.04 mm/year. These estimates indicate the post-seismic viscoelastic relaxation by the 2011 Tohoku mega MW 9.0 earthquake had a significant impact on the motion of DMF and HHF, dominated by stretching deformation, in agreement with the observed GPS results.
The spherical wavelet algorithm described in Section 3.2 was performed to calculate the strain rates of the velocity field due to the viscoelastic relaxation. Figure 11a shows the principal strain rates and areal strain rates at scales 2–9. The direction of the maximum principal strain rate was oriented NW–WNW, while the orientation of minimum principal strain rate was in the direction of NE–ENE. As shown in Figure 11b–d, the magnitudes for the principal strain rates reduced with the decrease of the decomposition scales. Compressional deformation appeared in the southern segments of the DHY and YYF, with a maximum value of 12.10 nstrain/year at the intersection of northeastern China and the southeastern part of the Russian Far East. The principal strain rates and areal strain rates at scale 6 (Figure 11b) display that spatially the compression and extension appeared alternately around the border between northeastern China and the Russian Far East, with magnitudes of areal strain rates of less than 6.00 nstrain/year. The rest of the areas show relatively small magnitudes for the strain rates, at ~2.00 nstrain/year. Figure 11c,d shows the principal strain rates and areal strain rates at scale 5 and scale 4, respectively. It can be seen that the study area had an areal strain rate magnitudes of less than 2.00 nstrain/year at the two compositional scales. Furthermore, dilation deformation occurred in the entire segments of DMF and YYF, whereas compressional deformation appeared in the southeastern zone of the Russian Far East.
As shown in Figure 12a, a very heterogeneous deformation pattern was identified for the maximum shear strain rate at scales 2–9. A larger gradient was found around the southernmost zone of the intersection of northeastern China and the Russian Far East, with a maximum value of 26.00 nstrain/year. The maximum shearing deformation shows a southeast to northwest decrease with the increase of epicenter distance. The maximum shear strain rate at scale 6 (Figure 12b) shows that there was localized shearing sense deformation around the southernmost zone of northeastern China and the Russian Far East, with a maximum value of 12.00 nstrain/year. The other areas had maximum shear strain rates less than 3.00 nstrain/year. Figure 12c shows the maximum shear strain rate at scale 5. Localized shearing was identified around the intersecting area of northeastern China and the southeastern zone of the Russian Far East, with a maximum value of 5.10 nstrain/year. The maximum shear strain rate at scale 4 (Figure 12d) shows that the above mentioned area of localized shear was larger than that at scale 5, but with smaller magnitudes. The other areas show insignificant shearing deformation in terms of their magnitudes.

5.2. Comparison of Strain Rate and Seismicity

We acquired an earthquake catalogue from the China Earthquake Data Center, providing fundamental seismic event properties, including locus, magnitude, depth, and phases of seismograms online. We extracted ML ≥ 3.0 events that took place in northeastern China after the 2011 Tohoku earthquake over the period of 2012–2017. Statistically, 767 ML ≥ 3.0 events and 208 ML ≥ 4.0 events recorded in this timespan. Moreover, 24 ML ≥ 5.0 earthquakes occurred in this timespan, among which six earthquakes were deep-focus events in the southeastern part of northeastern China, with focal depths larger than 440 km. We did not take into account the deep focus events, as these earthquakes could not bring about significant surface deformation, as sampled by GPS observations on the ground.
The epicenters of earthquakes following the 2011 Tohoku mega-earthquake were plotted on the figures of principal strain rates and areal strain rates, shown in Figure 11, and the figures of the maximum shear strain rates, shown in Figure 12. The densities of registered earthquakes were relatively higher in the western and southern areas. Spatially, the seismicity did not show a clear relationship with the areal strain rates and the maximum shear strain rates at scales of 2–9. A preliminary analysis shows that the seismicity following the Tohoku meg-earthquake did not hold a high spatial relationship with various strain rate components in the study time span. However, further in-depth insight is warranted with an advanced statistical analysis approach.

6. Conclusions

Utilizing the data of 178 continuous and survey-mode GPS sites throughout northeastern China and its adjacent southeastern region of the Russian Far East during the period of 2012–2017, we have analyzed the crustal deformation following the 2011 mega-earthquake in Tohoku, Japan. The velocities show a prominent decrease, from the intersection of northern China and southeastern zone of the Russian Far East to the western areas of northeastern China. The motion of the DMF and YYF were dominated by extensional deformation, with their northeastern segments being more active than the southwestern portions. We estimated extensional rates of 3.98 ± 0.04 mm/year and 2.55 ± 0.04 mm/year for northeastern and southwestern segments of the DMF, respectively. Extensional rates of 1.07 ± 0.04 mm/year and 0.70 ± 0.05 mm/year were identified for the northeastern portion and southwestern portion of the YYF, respectively.
The 2011 Tohoku earthquake brought about significant influence on the crustal deformation of northeastern China, due to its viscoelastic relaxation of stress, despite it occurring more than 1000 km away from northeastern China. Components of strain rates at multiple scales displayed a highly heterogeneous deformation pattern after the Tohoku earthquake. We found that the ML ≥ 4.0 earthquakes were mostly located around the southeastern area of northeastern China, where at the scales of 4 and 5, higher areal strain rates and shear strain rates were identified.

Supplementary Materials

The following are available online at https://www.mdpi.com/2072-4292/11/24/3029/s1. Tables S1 and S2: Eurasian plate-referenced horizontal velocities of continuous sites and campaign sites of CMONOC, respectively. Table S3: Eurasian plate-referenced horizontal velocities of continuous GPS sites of CMA. Figure S1: Influence on the DMF and YYF motion owing to viscoelastic relaxation of the 2011 Tohoku mega-earthquake.

Author Contributions

Conceptualization, G.M., S.N., H.T., and M.O.; methodology, G.M. and X.S.; data curation, X.S., S.N. and M.G.; writing, G.M. and W.W.

Funding

This study was funded by the National Natural Science Foundation of China (Nos. 41604007 and 41874024), and the special fund of China Seismic Earthquake Site, grant number 2018CSES0207.

Acknowledgments

We are grateful for Data Center of CMONOC for providing GPS data in this study. Some figures were drawn using the GMT software.

Conflicts of Interest

The authors declare no conflict of interest.

References

  1. Shestakov, N.; Takahashi, H.; Ohzono, M.; Prytkov, A.; Bykov, V.; Gerasimenko, M.; Luneva, M.; Gerasimov, G.; Kolomiets, A.; Bormotov, V.; et al. Analysis of the far-field crustal displacementscaused by the 2011 Great Tohoku earthquake inferred from continuous GPS observations. Tectonophysics 2012, 524–525, 76–86. [Google Scholar] [CrossRef]
  2. Wang, M.; Li, Q.; Wang, F.; Zhang, R.; Wang, Y.; Shi, H. Far-field coseismic displacements associated with the 2011 Tohoku earthquake in Japan observed by Global Positioning System. Chin. Sci. Bull. 2011, 56, 2419–2424. [Google Scholar] [CrossRef] [Green Version]
  3. Ozawa, S.; Nishimura, T.; Munekane, H.; Suito, H.; Kobayashi, T.; Tobita, M.; Imakiire, T. Preceding, coseismic, and postseismic slips of the 2011 Tohoku earthquake, Japan. J. Geophys. Res. 2012, 117. [Google Scholar] [CrossRef]
  4. Pollitz, F.; Burgmann, R.; Banerjee, P. Geodetic slip model of the 2011 M9.0 Tohoku earthquake. Geophys. Res. Lett. 2011, 38. [Google Scholar] [CrossRef]
  5. Baek, J.; Shin, Y.H.; Na, S.H.; Shestakov, N.V.; Park, P.H.; Cho, S. Coseismic and postseismic crustal deformations of the Korean Peninsula caused by the 2011 Mw 9.0 Tohoku earthquake, Japan, from Global Positioning System data. Terra Nova 2012, 24, 295–300. [Google Scholar] [CrossRef]
  6. Hwang, J.S.; Yun, H.S.; Huang, H.; Jung, T.J.; Lee, D.H.; We, K.J. The 2011 Tohoku earthquake’s influence on the Asian plates and Korean geodetic network. Chin. J. Geophys. 2012, 55, 1884–1893. [Google Scholar]
  7. Zhao, Q.; Fu, G.; Wu, W.; Liu, T.; Su, L.; Su, X.; Shestakov, N. Spatial-temporal evolution and corresponding mechanism of the far-field post-seismic displacements following the 2011 Mw 9.0 Tohoku earthquake. Geophys. J. Int. 2018, 214, 1774–1782. [Google Scholar] [CrossRef]
  8. Cheng, J.; Liu, M.; Gan, W.; Xu, X.; Huang, F.; Liu, J. Seismic impact of the Mw 9.0 Tohoku earthquake in Eastern China. Bull. Seis. Soc. Am. 2014, 104, 1258–1267. [Google Scholar] [CrossRef] [Green Version]
  9. Wang, L.; Liu, J.; Zhao, J.; Zhao, J. Tempo-spatial impact of the 2011 M 9 Tohoku earthquake on eastern china. Pure Appl. Geophys. 2016, 173, 35–47. [Google Scholar] [CrossRef]
  10. Hirose, F.; Miyaoka, K.; Hayashimoto, N.; Yamazaki, T.; Nakamura, M. Outline of the 2011 Off the Pacific Coast of Tohoku earthquake (Mw 9.0)—Seismicity: Foreshocks, mainshock, aftershocks, and induced activity. Earth Planets Space 2011, 63, 513–518. [Google Scholar] [CrossRef] [Green Version]
  11. Kato, A.; Sakai, S.; Obara, K.A. normal-faulting seismic sequence triggered by the 2011 Off the Pacific Coast of Tohoku earthquake: Wholesale stress regime changes in the upper plate. Earth Planets Space 2011, 63, 745–748. [Google Scholar] [CrossRef] [Green Version]
  12. Feng, C.; Zhang, P.; Sun, W.; Qin, X.; Che, Q.; Tan, C. A dicussion on the impact of Japan Mw 9.0 earthquake on the main active fault zone in north-and northereast China continent and the seismic risk. Earth Sci. Front. 2013, 20, 123–140. [Google Scholar]
  13. Tan, C.; Hu, Q.; Zhang, P.; Feng, C.; Qin, X. Present tectonic stres adjustment process before and after Japan Mw 9.0 earthquake in North and Northeast China and its research significance. Earth Sci. Front. 2015, 22, 345–359. [Google Scholar]
  14. Ogata, Y. Statistical models for earthquake occurrences and residual analysis for point processes. J. Am. Stat. Assoc. 1988, 83, 9–27. [Google Scholar] [CrossRef]
  15. Ogata, Y. Seismicity analysis through point-process modeling: A review. Pure Appl. Geophys. 1999, 155, 471–507. [Google Scholar] [CrossRef]
  16. Su, X.N.; Meng, G.J.; Wang, Z. Methodology and application of GPS strain field estimation based on spherical wavelet. Chin. J. Geophys. 2016, 59, 1585–1595. [Google Scholar] [CrossRef]
  17. Zonenshain, L.P.; Savostin, L.A. Geodynamics of the Baikal rift zone and plate tectonics of Asia. Tectonophysics 1981, 76, 1–45. [Google Scholar] [CrossRef] [Green Version]
  18. Apel, E.V.; Bürgmann, R.; Steblov, G.; Vasilenko, N.; King, R.; Prytkov, A. Independent active microplate tectonics of northeast asia from gps velocities and block modeling. Geophys. Res. Lett. 2006, 33, L11303. [Google Scholar] [CrossRef]
  19. Chen, B.; Jahn, B.M.; Wilde, S.; Xu, B. Two contrasting Paleozoic magmatic belts in northern Inner Mongolia, China. Tectonophysics 2000, 328, 157–182. [Google Scholar] [CrossRef]
  20. Shi, Y.; Liu, D.; Zhang, Q. SHRIMP geochronology of dioritic-granitic intrusions in Sunidzuoqi area, Inner Mongolia. Acta Geol. Sin. 2004, 78, 789–799. [Google Scholar]
  21. Meng, Q.R. What drove late Mesozoic extension of the northern China–Mongolia tract? Tectonophysics 2003, 369, 155–174. [Google Scholar] [CrossRef]
  22. Kravchinsky, V.A.; Halim, N.; Hankard, F. Late Jurassic–Early Cretaceous closure of the Mongol–Okhotsk Ocean demonstrated by new Mesozoic paleomagnetic results from the Trans-Baikalarea (SE Siberia). Geophys. J. Int. 2005, 163, 813–832. [Google Scholar] [CrossRef] [Green Version]
  23. Ren, J.; Tamaki, K.; Li, S.; Zhang, J. Late Mesozoic and Cenozoic rifting and its dynamic setting in eastern China and adjacent areas. Tectonophysics 2002, 344, 175–205. [Google Scholar] [CrossRef]
  24. Watson, M.P.; Hayward, A.B.; Parkinson, D.N.; Zhang, Z.M. Plate tectonic history, basin development and petroleum source rock deposition onshore China. Mar. Pet. Geol. 1987, 4, 205–225. [Google Scholar] [CrossRef]
  25. Davis, G.A.; Xu, B.; Zheng, Y.; Zhang, W. Indosinian extension in the Solonker suture zone: The Sonid Zuoqi metamorphic core complex, Inner Mongolia, China. Earth Sci. Front. 2004, 11, 135–144. [Google Scholar]
  26. Molnar, P.; Houseman, G.A.; Conrad, C.P. Rayleigh–Taylor instability and convective thinning of mechanically thickened lithosphere: Effects of non-linear viscosity decreasing exponentially with depth and of horizontal shortening of the layer. Geophys. J. Int. 1998, 133, 568–584. [Google Scholar] [CrossRef]
  27. Wang, F.; Zhou, X.; Zhang, L.; Ying, J.; Zhang, Y.; Wu, F.; Zhu, R. Late Mesozoic volcanism in the Great Xing’an Range (NE China): Timing and implications for the dynamic setting of NE Asia. Earth Planet. Sci. Lett. 2006, 251, 179–198. [Google Scholar] [CrossRef]
  28. Tao, K.; Niu, F.; Ning, J.; Chen, Y.J.; Grand, S.; Kawakatsu, H.; Satoru, T.; Masayuki, O.; Ni, J. Crustal structure beneath NE China imaged by NECESSArray receiver function data. Earth Planet. Sci. Lett. 2014, 398, 48–57. [Google Scholar] [CrossRef]
  29. Yin, A.; Nie, S. An indentation model for the North and South China collision and the development of the Tan-Lu and Honam Fault Systems, eastern Asia. Tectonics 1993, 12, 801–813. [Google Scholar] [CrossRef]
  30. Wang, F.; Xu, W.; Ge, W.; Yang, H.; Pei, F.; Wu, W. The offset distance of the Dunhua-Mishuan Fault: Constraints from Paleozoic Mesozoic magmatism within the Songnen Zhangguancai Range, Jiamusi, and Khanka massifs. Acta Petrol. Sin. 2016, 32, 1129–1140. [Google Scholar]
  31. Min, W.; Liu, Y.; Jiao, D.; Shen, J.; Pan, X. Evidence for holocene activity of the yilan-yitong fault, northeastern section of the Tan-lu fault zone in northeast china. J. Asian Earth Sci. 2013, 67–68, 207–216. [Google Scholar] [CrossRef]
  32. Sun, W.; Wang, X.; Chang, Z.; Chen, H.; He, Y.S. Discussion on time-space evolutionary characteristics of seismicity in northeast of China and dynamic mechanism. Seismol. Res. Northeast China 2005, 21, 1–8. [Google Scholar]
  33. Sun, W.; He, Y. The Feature of Seismicity in Northeast China and its relation to the suduction of the Japan Sea plate. Seismol. Geol. 2004, 26, 122–132. [Google Scholar]
  34. Herring, T.A.; King, R.W.; Floyd, M.A.; McClusky, S.C. GAMIT Reference Manual, Version 10.6; Massachusetts Institute of Technology: Cambridge, MA, USA, 2015; Available online: http://geoweb.mit.edu/gg/GAMIT_Ref.pdf (accessed on 16 June 2019).
  35. Herring, T.A.; King, R.W.; Floyd, M.A.; McClusky, S.C. GLOBK Reference Manual, Version 10.6; Massachusetts Institute of Technology: Cambridge, MA, USA, 2015; Available online: http://geoweb.mit.edu/gg/GLOBK_Ref.pdf (accessed on 16 June 2019).
  36. Wu, W.W.; Su, X.N.; Meng, G.J.; Li, C.T. Crustal deformation prior to the 2017 Jiuzhaigou, northeastern Tibetan Plateau (China), Ms 7.0 earthquake derived from GPS observations. Remote Sens. 2018, 10, 2028. [Google Scholar] [CrossRef] [Green Version]
  37. Su, X.N.; Yao, L.B.; Wu, W.W.; Meng, G.J.; Su, L.N.; Xiong, R.W.; Hong, S.Y. Crustal deformation on the northeastern margin of the Tibetan Plateau from continuous GPS observations. Remote Sens. 2019, 11, 34. [Google Scholar] [CrossRef] [Green Version]
  38. Altamimi, Z.; Rebischung, P.; Métivier, L.; Collilieux, X. ITRF2014: A new release of the International Terrestrial Reference Frame modeling nonlinear station motions. J. Geophys. Res. 2016, 121, 6109–6131. [Google Scholar] [CrossRef] [Green Version]
  39. Nikolaidis, R. Observation of Geodetic and Seismic Deformation with the Global Positioning System. Ph.D. Thesis, University of California, San Diego, CA, USA, January 2002. [Google Scholar]
  40. Tape, C.; Musé, P.; Simons, M.; Dong, D.; Webb, F. Multiscale estimation of GPS velocity fields. Geophys. J. Int. 2009, 179, 945–971. [Google Scholar] [CrossRef] [Green Version]
  41. Bao, B.C.; Hu, W.; Liu, Z.D.; Kang, Z.S.; Xu, J.P. Dynamic analysis of the DOG wavelet mapping with dilation and translation. Acta Phys. Sinca 2009, 58, 2240–2247. [Google Scholar]
  42. Golub, G.H.; Hansen, P.C.; O’Leary, D.P. Tikhonov regularization and total least squares. Siam J. Matrix Anal. Appl. 1997, 21, 185–194. [Google Scholar] [CrossRef] [Green Version]
  43. Golub, G.H.; Wahba, H.G. Generalized cross-validation as a method for choosing a good ridge parameter. Technometrics 1979, 21, 215–223. [Google Scholar] [CrossRef]
  44. Johnson, K.M.; Bürgmann, R.; Larson, K. Frictional properties on the San Andreas fault near Parkfield, California, inferred from models of afterslip following the 2004 earthquake. Bull. Seismol. Soc. Am. 2006, 96, 321–338. [Google Scholar] [CrossRef]
  45. Bürgmann, R.; Dresen, G. Rheology of the lower crust and upper mantle: Evidence from rock mechanics, geodesy and field observations. Annu. Rev. Earth Planet. Sci. 2008, 36, 531–567. [Google Scholar] [CrossRef] [Green Version]
  46. Jónsson, S.; Segall, P.; Pedersen, R.; Björnsson, G. Post-earthquake ground movements correlated to pore-pressure transients. Nature 2003, 424, 179–183. [Google Scholar] [CrossRef] [PubMed]
  47. Savage, J.C.; Svarc, J.L. Postseismic relaxation following the 1989 Ms 7.1 Loma Prieta earthquake, central California. J. Geophys. Res. 2010, 115, B08404. [Google Scholar] [CrossRef]
  48. Freed, A.M.; Hirth, G.; Behn, M.D. Using short-term postseismic displacements to infer the ambient deformation conditions of the upper mantle. J. Geophys. Res. 2012, 117, B01409. [Google Scholar] [CrossRef] [Green Version]
  49. Yamagiwa, S.; Miyazaki, S.I.; Hirahara, K.; Fukahata, Y. Afterslip and viscoelastic relaxation following the 2011 Tohoku earthquake (Mw9.0) inferred from inland GPS and seafloor GPS/Acoustic data. Geophys. Res. Lett. 2015, 42, 66–73. [Google Scholar] [CrossRef] [Green Version]
  50. Wei, S.J.; Graves, R.; Helmberger, D.; Avouac, J.P.; Jiang, J. Sources of shaking and flooding during the Tohoku earthquake: A mixture of rupture styles. Earth Planet. Sci. Lett. 2012, 333–334, 91–100. [Google Scholar] [CrossRef]
Figure 1. Tectonic setting with seismicity of the northeast China following the 2011 earthquake in Tohoku, Japan. The dashed line is the hypothesized plate boundary of the Amur microplate. The black lines are active Quaternary faults. The pink line delimits the Songliao Basin; the black arrow represents the subducting rate of the Pacific Plate; the red star depicts the epicenter of the Tohoku earthquake. The red circle represents the epicenter of the 1976 Tangshan Mw 7.8 earthquake; The pink triangle is the epicenter of the 1975 Mw 7.0 Haicheng earthquake. Note: SKC, the Sino–Korean craton; XMOB, the Xing’an–Mongolia orogenic belt; SLB, the Songliao Basin; CBM, the Changbaishan Mountain region; CV, the Changbaishan volcano; F1, the Nenjiang Fault; F2, the Yilan–Yitong Fault; F3, the Dunhua–Mishan Fault; F4, the Tangshan Fault; HC, Haicheng; PA, the Pacific Ocean.
Remotesensing 11 03029 g001
Figure 2. Global positioning system (GPS) site distribution in northeastern China. The black lines are active Quaternary faults. The red triangles and the black triangles represent continuous GPS sites and campaign sites of the Crustal Movement Observation Network of China (CMONOC), respectively. The blue squares are continuous GPS sites of China Metrological Administration (CMA). The seven cyan triangles with site names are continuous GPS sites installed and operated by the Far East Federal University, Russia.
Remotesensing 11 03029 g002
Figure 3. Observed GPS velocities at the 95% confidence level. The two rectangles are transects across the Yilan-Yitong Fault (YYF) and the Dunhua-Mishan Fault (DMF). The black lines are Quaternary faults.
Remotesensing 11 03029 g003
Figure 4. Northern GPS velocity cross-section. (a) Fault-along velocity component (sinistral positive) and (b) fault-perpendicular velocity component (extensional positive) regarding the distance away from the DMF and YYF in rectangle 1 in Figure 3. The error bar denotes 1-sigma of the estimated velocity.
Remotesensing 11 03029 g004
Figure 5. Southern GPS velocity cross-section. (a) Fault-parallel velocity component (sinistral positive) and (b) fault-normal velocity component (extensional positive) regarding the distance away from the DMF and YYF, as seen in rectangle 2 in Figure 3. Error bar represents 1-sigma of the derived velocities.
Remotesensing 11 03029 g005
Figure 6. Spatial distribution of wavelet base functions: (a) at the scales of 2–9, with 516 base functions in total; (b) at the scales of 2–6, with a total of 273 base functions.
Remotesensing 11 03029 g006
Figure 7. The observed velocities and the modeled velocities derived from the spherical wavelet algorithm. The black lines are Quaternary faults. The upper right inset shows the residual histograms for NS and EW components, respectively.
Remotesensing 11 03029 g007
Figure 8. Principal strain rate and areal strain rate at multiple scales. The red arrows denote the negative (shortening) and the blue arrows represent the positive (stretching) values for the principal strain rates. The size of arrow is proportional to the magnitude of the strain rate. The red background colors represent negative (contraction) and the blue background colors represent positive (dilation) values of areal strain rates, with contour interval at 2.00 nstrain/year. The black lines are Quaternary faults: (a) scales 2–9; (b) scale 6; (c) scale 5; (d) scale 4.
Remotesensing 11 03029 g008aRemotesensing 11 03029 g008b
Figure 9. Maximum shear rate at multiple scales. The color represents maximum shear strain rates, with green lines indicating their contours with intervals of 1.00 nstrain/year. The black lines are Quaternary faults: (a) scales 2–9; (b) scale 6; (c) scale 5; (d) scale 4.
Remotesensing 11 03029 g009
Figure 10. GPS velocities due to the post-seismic viscoelastic relaxation of the 2011 Tohoku mega-earthquake over the period of 2012–2017. The black triangle is the GNRC site in the Russian Far East. The black lines are Quaternary faults.
Remotesensing 11 03029 g010
Figure 11. Principal strain rate and areal strain rate owing to viscoelastic relaxation from the 2011 Tohoku mega-earthquake. The red arrows denote negative (shortening) values; blue arrows depict negative positive (stretching) values for the principal strain rates. The sizes of the arrows are proportional to the magnitudes of the strain rates. The red background color represents negative (contraction) values; blue background color represents positive (dilation) value of areal strain rates, with contour intervals of 1.00 nstrain/year. The black lines are Quaternary faults: (a) scales 2–9; (b) scale 6; (c) scale 5; (d) scale 4.
Remotesensing 11 03029 g011aRemotesensing 11 03029 g011b
Figure 12. The maximum shear rates owing to the relaxation from the 2011 Tohoku mega-earthquake at multiple scales. The color represents maximum shear strain rates, with green lines indicating their contours, with intervals of 1.0 nstrain/year. The black lines are Quaternary faults: (a) scales 2–9; (b) scale 6; (c) scale 5; (d) scale 4.
Remotesensing 11 03029 g012

