Article

A New Method for Large-Scale Landslide Classification from Satellite Radar

1
The Centre for Observation and Modelling of Earthquakes, Volcanoes and Tectonics, Department of Earth Sciences, Durham University, Durham DH1 3LE, UK
2
School of Engineering, Newcastle University, Newcastle NE1 7RU, UK
3
The Centre for Observation and Modelling of Earthquakes, Volcanoes and Tectonics, Satsense, Leeds LS2 9DF, UK
4
Department of Geography, Durham University, Durham DH1 3LE, UK
*
Author to whom correspondence should be addressed.
Remote Sens. 2019, 11(3), 237; https://doi.org/10.3390/rs11030237
Submission received: 10 January 2019 / Revised: 15 January 2019 / Accepted: 17 January 2019 / Published: 23 January 2019
(This article belongs to the Special Issue SAR for Natural Hazard )

Abstract

:
Following a large continental earthquake, information on the spatial distribution of triggered landslides is required as quickly as possible for use in emergency response coordination. Synthetic Aperture Radar (SAR) methods have the potential to overcome variability in weather conditions, which often causes delays of days or weeks when mapping landslides using optical satellite imagery. Here we test landslide classifiers based on SAR coherence, which is estimated from the similarity in phase change in time between small ensembles of pixels. We test two existing SAR-coherence-based landslide classifiers against an independent inventory of landslides triggered following the Mw 7.8 Gorkha, Nepal earthquake, and present and test a new method, which uses a classifier based on coherence calculated from ensembles of neighbouring pixels and coherence calculated from a more dispersed ensemble of ‘sibling’ pixels. Using Receiver Operating Characteristic analysis, we show that none of these three SAR-coherence-based landslide classification methods are suitable for mapping individual landslides on a pixel-by-pixel basis. However, they show potential in generating lower-resolution density maps, which are used by emergency responders following an earthquake to coordinate large-scale operations and identify priority areas. The new method we present outperforms existing methods when tested at these lower resolutions, suggesting that it may be able to provide useful and rapid information on landslide distributions following major continental earthquakes.

Graphical Abstract

1. Introduction

The majority of continental earthquakes occur in mountainous regions, where they can trigger thousands of landslides over areas of several tens of thousands of km2 [1,2]. These landslides are responsible for more deaths globally than any other secondary earthquake hazard [3]. Earthquake-triggered landslides cause damage to power, transportation and communication infrastructure, isolating remote communities and disrupting emergency response efforts, and may cause further hazards such as dam-outburst floods [4,5].
Information on where landslides have occurred is therefore essential for emergency response coordination and for directing site-specific investigations on the ground, e.g., [6,7]. This information must be rapidly generated and communicated in order to limit delays to resource allocation and therefore be of practical value [8,9]. The information may take several forms, from detailed maps of landslide locations, with individual events recorded either as points, polylines or polygons, to landslide density maps that identify regions that have experienced high numbers or large areas of landslides [9].
Following past earthquakes that triggered extensive landsliding, landslide information products have been generated too slowly for use in emergency response. The most common method, which is to identify triggered landslides through comparison of pre-event and post-event optical satellite imagery, is labour-intensive and reliant on the acquisition of cloud-free imagery. In some cases, automation can alleviate the labour-intensive nature of this process, e.g., [10], but cloud-cover often presents an insurmountable barrier to rapid production of landside maps using optical imagery. This delays the supply of information to emergency response coordinators, as was the case in the aftermath of the 2015 Nepal and 2016 Ecuador earthquakes [9,11].
When cloud-free optical satellite imagery is unavailable, emergency response coordinators must rely on ground-based observations, which may not have wide or homogeneous areal coverage, and on the outputs from predictive models. Such models estimate where landslides are likely to have occurred based on factors such as peak ground acceleration, topographic slope and proximity to rivers or active faults, e.g., [12,13,14]. However, these models are generally static in time, empirical in nature, and are strongly dependent on input data quality. Peak ground acceleration, for example, may be poorly constrained immediately following the earthquake [15]. Additionally, the models may fail to capture differences in susceptibility for different regions, as illustrated by the significant differences in triggered landsliding between the 2008 Mw 7.9 Wenchuan earthquake and the 2015 Mw 7.8 Gorkha earthquake [1]. The inclusion of observed landslide data in these models improves their predictive skill but the improvement is limited if these data are clustered, as they necessarily must be if mapped using optical satellite imagery through small gaps in cloud-cover [14].
Synthetic Aperture Radar (SAR) satellite imagery, which uses active emission and sensing of electromagnetic radiation in the microwave rather than the visible light spectrum, can acquire useable imagery in cloudy conditions as radar is able to penetrate cloud cover. SAR may therefore provide a solution to the problem of mapping landslides when cloud obstructs optical imagery. In recent years the number of satellite-based SAR systems has vastly increased, leading to a corresponding increase in the frequency and regularity of image acquisition everywhere on Earth [16]. For example, the European Space Agency’s (ESA’s) Sentinel-1 satellite constellation (comprising the Sentinel-1a and Sentinel-1b satellites), imagery from which is used in this study, comprises two satellites and acquires imagery on ascending and descending tracks every 12 days for tectonic regions globally and every 6 days in Europe [17]. These data are freely available to download.
SAR products are routinely used in other rapid response situations, for example in flood mapping or in the production of interferograms to map ground deformation after an earthquake or during an episode of volcanic unrest [18,19,20]. NASA’s Advanced Rapid Imaging and Analysis (ARIA) project uses SAR to produce damage proxy maps in urban areas following earthquakes, cyclones or wildfires [20,21]. SAR methods such as offset tracking, e.g., [22], persistant scatterer interferometry, e.g., [23,24] and traditional differential InSAR, e.g., ref. [25] are also used in monitoring the movements of slow-moving landslides. Persistent scatterer interferometry and traditional differential InSAR have been used in several cases to supplement pre-existing inventories with ground surface deformation information, which can be used to evaluate the state of activity of the landslides [26,27,28]. However, the potential use of SAR in rapid production of landslide maps for emergency response has only been demonstrated on individual landslides or catchments, and with limited success [21,29].
A clear example of the limitations of landslide mapping using optical imagery, and the potential that SAR has to overcome these limitations was the Gorkha earthquake on 25 April 2015, which triggered over 25,000 landslides in the surrounding mountains (Figure 1) [2]. Figure 2 shows a timeline of mapping efforts carried out by an international team of researchers using optical satellite imagery and intended for use by emergency response coordinators [9]. Although the earthquake occurred during Nepal’s dry season, cloud cover caused severe delays to landslide mapping, with almost no cloud-free imagery available in the first week following the earthquake and some areas remaining unmapped up until the onset of the monsoon on 9 June 2015, roughly one-and-half months later. The emergency response process evolves quickly in comparison. For example, the United Nations response framework following a disaster mandates an initial assessment after 72 h and a second after 2 weeks [9,30]. In the case of the 2015 Gorkha earthquake, the impending monsoon season applied additional time pressure, because the arrival of the monsoon would make cloud-free optical image acquisition unlikely and because it was anticipated that the earthquake would increase the severity of rainfall triggered landsliding [7]. The acquisition of useable SAR imagery and generation of associated products occurred comparatively quickly (Figure 2). Five days following the earthquake, NASA’s ARIA team released an initial damage proxy map for building damage in Kathmandu based on SAR data acquired by the Italian Space Agency’s COSMO-SkyMed satellite system. The first post-event imagery acquired on each satellite acquisition track by ESA’s Sentinel-1a satellite is shown on Figure 1, with the first of these being acquired 4 days after the Gorkha mainshock. Sentinel-1 coverage has since improved with the launch of a second satellite, Sentinel-1b, in 2016. Had it been possible to use SAR products in mapping landslides following the Gorkha earthquake, critical information on landslide distribution could have been delivered to first responders and government agencies with greater areal coverage and better timeliness than was possible from optical satellite data.
In this paper, we investigate automatic methods to detect landslides using SAR and present a new method based on SAR coherence. We tested this method on the landslides triggered by the Gorkha earthquake, using a comprehensive independent inventory of triggered landslides produced from manual analysis of optical satellite imagery [2]. Additionally, multiple reports have been published discussing the emergency response effort following the earthquake, allowing identification of how SAR landslide products could have been used if they had been available [5,6,7].

2. Materials and Methods

2.1. Theory: Landslide Detection with SAR

2.1.1. Synthetic Aperture Radar: Interferometry and Coherence

Two SAR images acquired by the same satellite system and covering the same area at different times may be combined to form a radar interferogram (e.g., Figure 3a) [31]. To acquire each image, microwave radiation is emitted by the satellite’s antenna, back-scattered from the Earth’s surface, and recorded again by the satellite as two components: amplitude and phase. An interferogram, such as the one shown in Figure 3, is a map of the difference in phase, Δφ, between the two images; the repeated bands of colour can be considered as contours of the change in distance between the satellite and the imaged surface. Figure 3 shows an example pre-event interferogram before the 2015 Nepal earthquake, i.e., an interferogram made from two pre-event SAR images.
The coherence of a pixel is a measure of the signal to noise ratio of a point. A coherence map can be estimated from two SAR images to assess the spatial coherence in Δφ that is shown in the interferogram. SAR coherence, γ , is estimated as the correlation between Δφ of closely-grouped pixels and can be calculated pixel-by-pixel for a pair of images (denoted A and B) from an ensemble of n pixels using the following equation [32].
γ = 1 n | i = 1 n A i · B ¯ i | 1 n ( i = 1 n A i · A ¯ i i = 1 n B i · B ¯ i )
Here, i is an individual pixel and Ai and Bi are complex representations of phase and amplitude for images A and B respectively. The overline indicates the complex conjugate. The factor of 1/n is included here as a scaling factor in order to account for variations between pixels in the size of the ensemble, required for Section 2.1.4. In the widely used ‘boxcar’ coherence estimation, the ensemble is defined as a square box of pixels centred on the pixel in question. Pixels within the box will sum constructively if they have similar Δφ and destructively if not. Examples of areas with low and high estimated coherence are shown in Figure 3b,c respectively.
The overall coherence of a pixel is determined by several factors, often illustrated by its decomposition into three components:
γ t o t a l = γ t e m p o r a l · γ s p a t i a l · γ t h e r m a l
where γtemporal is temporal coherence, γspatial is spatial coherence, and γthermal is thermal coherence [34]. Decorrelation of any one of these components will lead to decorrelation of the signal as a whole. Thermal coherence is related to noise within the signal, and its decorrelation is generally insignificant [34]. Spatial (or geometric) coherence is dependent on the topography of the target region, the imaging geometry of the satellite, the radar wavelength and the bandwidth of the radar sensor. The temporal component is dependent on the change in scattering properties of a target pixel, which in turn is dependent on modification to the ground surface. Surfaces such as bare rock or buildings tend to retain the same scattering properties over time and so have a high temporal coherence, while vegetated regions, which are likely to move or grow between image acquisitions, tend to have a lower temporal coherence.
Changes to the ground surface between the acquisition of two SAR images, for example due to fire, flooding, building collapse or construction, earthquake surface rupture or landslides, alter the scattering properties of each pixel, leading to low temporal coherence and so a low observed coherence. Previous studies have demonstrated that SAR coherence can be used to map changes of this nature [20,21,35,36,37,38]; and that these products can be rapidly generated and released for emergency response purposes [20,21]. We therefore used SAR coherence as a starting point in this study.

2.1.2. Absolute Coherence Method

For two SAR images whose acquisitions span a landslide trigger event, landslide pixels are expected to have a low coherence. The occurrence of a landslide represents a significant modification of the ground surface and therefore its scattering properties. The simplest method of using coherence information to map landslides is to use this absolute coherence, assigning low-coherence pixels as ‘landslide’ and high-coherence pixels as ‘not landslide’. For a few cases, landslides have been identified using this method, e.g., [37]. However, as low coherence may be due to factors unrelated to the trigger event, such as the presence of dense vegetation or unfavourable imaging geometry, this method is likely to result in a classification surface with many false positives—low coherence regions that are classified as ‘landslide’ but are not landslides.

2.1.3. ARIA Method

It has been suggested that differencing a pre-event coherence map (calculated from two pre-event SAR images) and a co-event coherence map (calculated from two SAR images spanning the event) can differentiate between areas where coherence is always low and areas where it has decreased, e.g., due to building collapse or landsliding [21,35,39]. The method developed by NASA’s ARIA project for rapid generation of urban damage proxy maps is based on this approach [21,39].
Figure 4 shows the steps which go into producing ARIA damage proxy maps, described by Yun et al. [21,39]. Two pre-event SAR images and one post-event image are taken and used to calculate pre-event and co-event coherence maps. The histogram of the coherence values in the co-event coherence map is then ‘matched’ to the histogram of the pre-event coherence map in order to mitigate any bulk changes in coherence between the two images, for example due to variability in weather conditions. This histogram matching process is shown for the simple case of 16 pixels in Figure 4b, in which the co-event cumulative histogram is mapped onto the pre-event histogram. For this step, pre-event and co-event pixels are sorted by value. In order to obtain a strict ordering, co-event pixels are sorted first by their value and then by the values of the eight pixels around them as in Coltuc et al. [40]. The ordered co-event pixels are set equal to the values of the ordered pre-event pixels, and then placed in their original spatial positions, resulting in a co-event coherence map whose coherence frequency distribution is identical to that of the pre-event map. The histogram-matched co-event map and the pre-event map are then differenced to produce a classification surface. For their purposes, the ARIA team then classify pixels whose co-event coherence is lower than their pre-event coherence as ‘damaged’, with increasing confidence in more negative pixels (Figure 4c).
The ARIA method was originally developed for urban damage mapping. However, when applying the method following the 2015 Gorkha earthquake, Yun et al. [21] noted that it showed some promise in landslide detection. Yun et al. [21] identified an area of decreased coherence spatially correlated with the Langtang Valley landslide, an exceptionally large and destructive landslide triggered by the earthquake [41]. However, Yun et al. [21] judged that overall, coherence was not sufficiently stable through time in vegetated regions, resulting in many false positives: pixels incorrectly identified as damaged due to coherence changes unrelated to the earthquake.

2.1.4. Sibling-Based Coherence Method

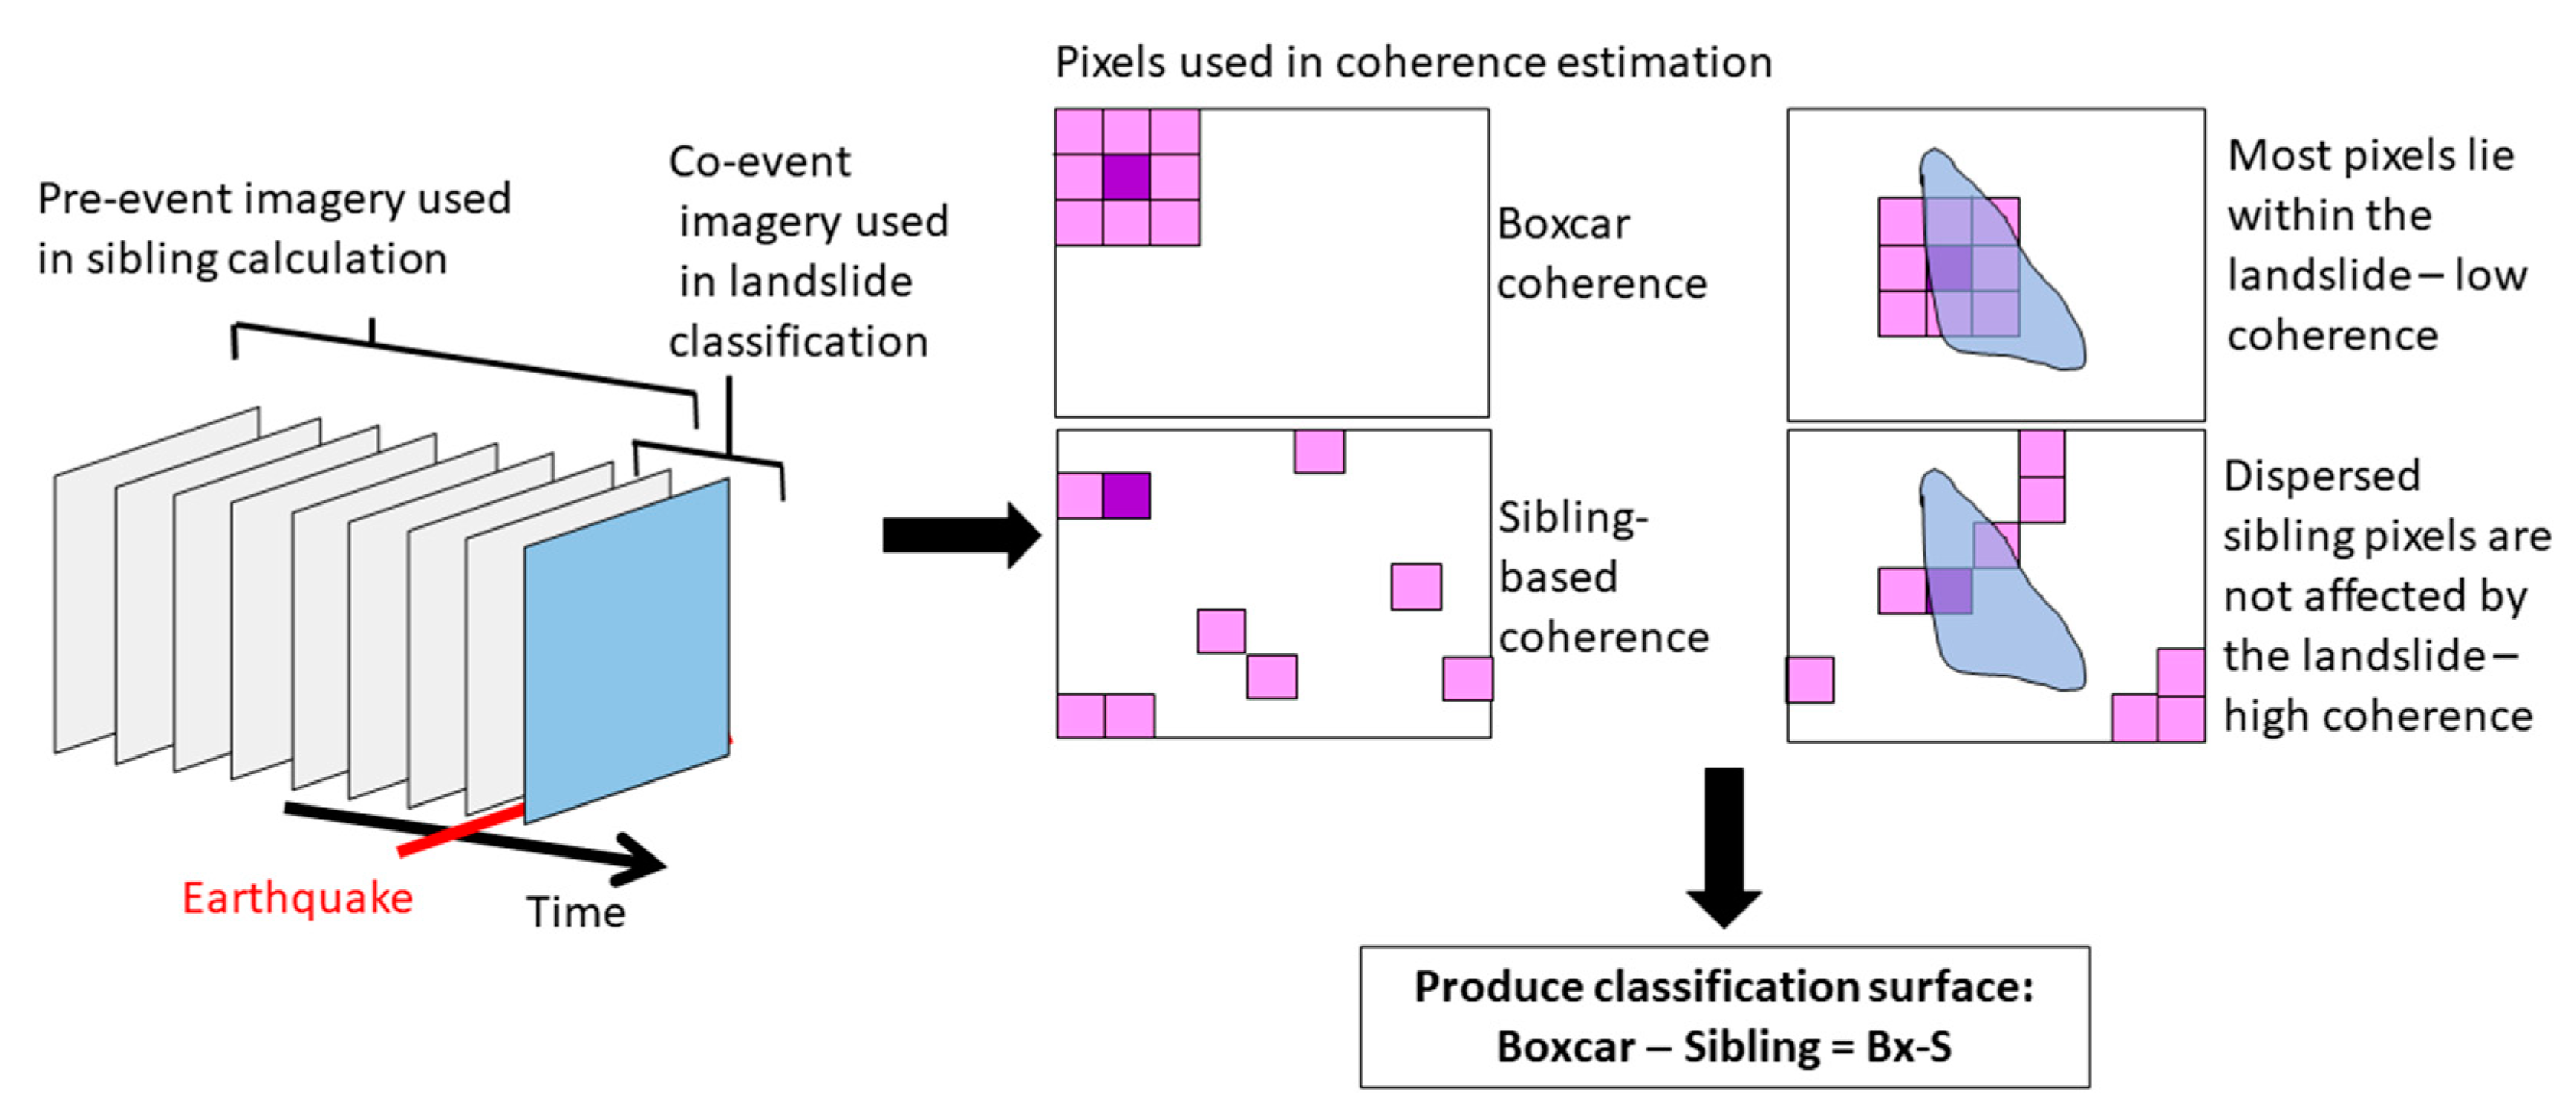
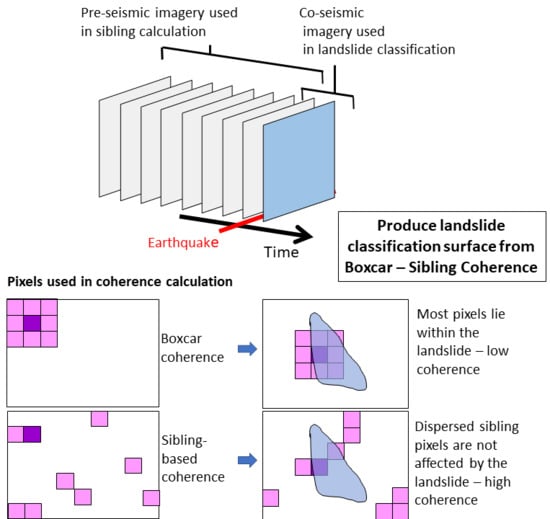
The new method we have developed is outlined in Figure 5. As with the ARIA method, the aim is to produce an expected landslide-free coherence surface, which is subtracted from the co-event coherence map. However, where Yun et al. [21,39] subtract a pre-event coherence map, we subtract a co-event coherence map that is calculated in such a way as to be less sensitive to localised decreases in coherence such as landslides. Unlike the ARIA method, the new method is not based on the change in coherence through time and so is expected to have fewer false positives caused by variations in temporal coherence unrelated to landsliding.
As an alternative to the boxcar coherence described in Section 2.1 and used in the absolute and ARIA methods, SAR coherence can be calculated based on ensembles of ‘sibling’ pixels, which exhibit similar behaviour to the target pixel, e.g., [42,43,44]. Here, we use the RapidSAR algorithm of Spaans and Hooper [44] for this process. For every pixel, a search is performed within a window of a given size, centred on that pixel, for pixels behaving similarly in terms of amplitude and amplitude variability throughout a time series of pre-event imagery. These pixels are designated as ‘siblings’. The sibling ensemble of each pixel is then used in place of the boxcar of adjacent pixels in the summations in Equation (1).
When using a boxcar ensemble in estimating the coherence of a pixel that lies within a landslide, the pixels used in the summation are adjacent and so are likely to also lie within the landslide when the landslide in question is similar in size or larger than the boxcar. Since a landslide modifies the scattering properties of the Earth’s surface, giving pixels within the landslide random Δφ, the ensemble is expected to sum destructively, resulting in a low coherence estimate. Additionally, any coherent pixels within the landslide will still be estimated as low coherence due to the random Δφ of their neighbours. However, the sibling-based coherence estimate calculated using RapidSAR uses an ensemble of pixels dispersed throughout a window much larger than the size of a boxcar and specified to be larger than the expected size of individual landslides. Compared to the boxcar ensemble, we expect that proportionally fewer siblings of a landslide pixel will lie within the landslide. Pixels lying outside the landslide will not experience the random Δφ associated with it and so may sum constructively. The landslide pixel is thus given an estimated coherence value that is more dependent upon its siblings which lie outside the landslide.
The sibling-based coherence calculated by RapidSAR is relatively insensitive to small spatial scale changes in the ground surface such as landslides. This map can therefore be thought of as the co-event coherence map we would expect if there were no landslides. The method we propose is to subtract this sibling-based coherence map from the co-event boxcar map, producing a classification surface, which will be referred to subsequently as boxcar-sibling (Bx-S). Landslide pixels should have a lower boxcar coherence than sibling-based coherence and so be negative in the Bx-S surface. Since the same pair of images is used in the coherence calculation with both methods, the histogram matching step carried out in the ARIA method [21,39] becomes unnecessary and the potential for other sources of temporal decorrelation is decreased.

2.2. Case Study: The 2015 Gorkha Earthquake

2.2.1. Validation Data

We analysed the classification ability of the three methods presented in Section 2—absolute coherence, ARIA and Bx-S—using the inventory of landslides triggered by the 2015 Gorkha earthquake that was compiled by Roback et al. [2]. The inventory consists of 24,915 landslides mapped as polygons that include both scar and runout. The majority of landslides were mapped using pre- and post-event imagery from DigitalGlobe Worldview-2 and -3 with some landslides mapped using Pleiades and Google Earth imagery. Due to restrictions on the SAR imagery available for the event, we use a subsection of this area containing 16,539 landslides, the extent of which is shown on Figure 1 (solid red line).

2.2.2. SAR Data and Processing

C-band Sentinel-1a SAR imagery acquired on descending track 19 (dashed red line, Figure 1) was used in this study. Acquisition dates are shown in Figure 6. This includes a long time-series of pre-event imagery, which is required for sibling calculation in the new method presented in Section 2.1.4. The occurrence of the Gorkha earthquake early in the lifetime of Sentinel-1a and prior to the launch of Sentinel-1b meant that there were not sufficiently regular data acquisitions before the earthquake on ascending track 085 (Figure 1). Ascending imagery was therefore not used in this study. Similarly, descending track pre-seismic imagery of east of Kathmandu on track 121 (Figure 1) was acquired prior to the earthquake less frequently than on track 19 and so is not used here.
Interferograms and coherence maps were produced for consecutive date pairs using the LiCSAR software package [33], which uses GAMMA software to process Sentinel-1 single look complex data. A 1-arcsecond digital elevation model (DEM) derived from Shuttle Radar Topography Mission data [45] was used in this processing. The raw SAR data had a pixel size in the radar coordinate system of 2.3 m × 14.0 m (range × azimuth). Images were multilooked by a factor of five in range and one in azimuth, giving a pixel size of 12 m × 14 m.
Boxcar coherence was calculated using pixels within a 3 × 3 pixel window. To calculate the sibling-based coherence, we used the RapidSAR algorithm of Spaans and Hooper [44]. For every pixel, a window of 41 × 41 pixels was searched and between 15 and 100 pixels were identified which behaved similarly in terms of amplitude and amplitude variability throughout 11 pre-event images acquired up until 5 April 2015 (see Figure 6 for acquisition dates).
Once the three classification surfaces had been calculated according to the methods outlined in Section 2.1, these were converted to a geographic coordinate system, with a pixel size of 20 m × 22 m, which reflects the multilooked resolution of the data. We carried out the analyses presented in Section 3 in this coordinate system. Each classifier surface was then rescaled to produce a surface with values between 0 and 1, where 1 was most likely to be a landslide.

2.2.3. ROC Analysis

A common problem in classification is the choice of threshold at which to assign classes given a continuous classifier. This choice of threshold is strongly dependent on the user requirements and their relative tolerance for false positives and false negatives and so it is preferable to test the performance of a classifier before setting this threshold. We therefore used Receiver Operating Characteristic (ROC) analysis to test the landslide detection ability of each of the three classification surfaces described in Section 2. ROC curves are commonly used to measure the ability of a continuous classifier to correctly identify a binary array [46], in this case, a map of landslides and non-landslide pixels. For a range of classifier threshold values, the true positive rate (the fraction of mapped landslide pixels that are correctly classified as ‘landslide’) is plotted against the false positive rate (the fraction of mapped non-landslide pixels that are incorrectly classified as ‘landslide’). As the threshold is relaxed from a value where all pixels are classified as ‘non-landslide’ to one where all are classified as ‘landslide’, a good classifier will identify true positives at a faster rate than it accepts false positives. The ROC curve plots the true positive rate against the false positive rate, with better classifiers resulting in a curve that lies closer to the upper left-hand corner of the plot. The overall performance of a classifier can therefore be quantified by the area under the curve (AUC). For a random classification surface where any pixel has a 50% chance of being classified as landslide or non-landslide, the ROC plots as a straight line between (0,0) and (1,1) with AUC = 0.5. A classifier AUC is expected to lie between 0.5 and the perfect case, for which AUC = 1.0.

2.2.4. Masks

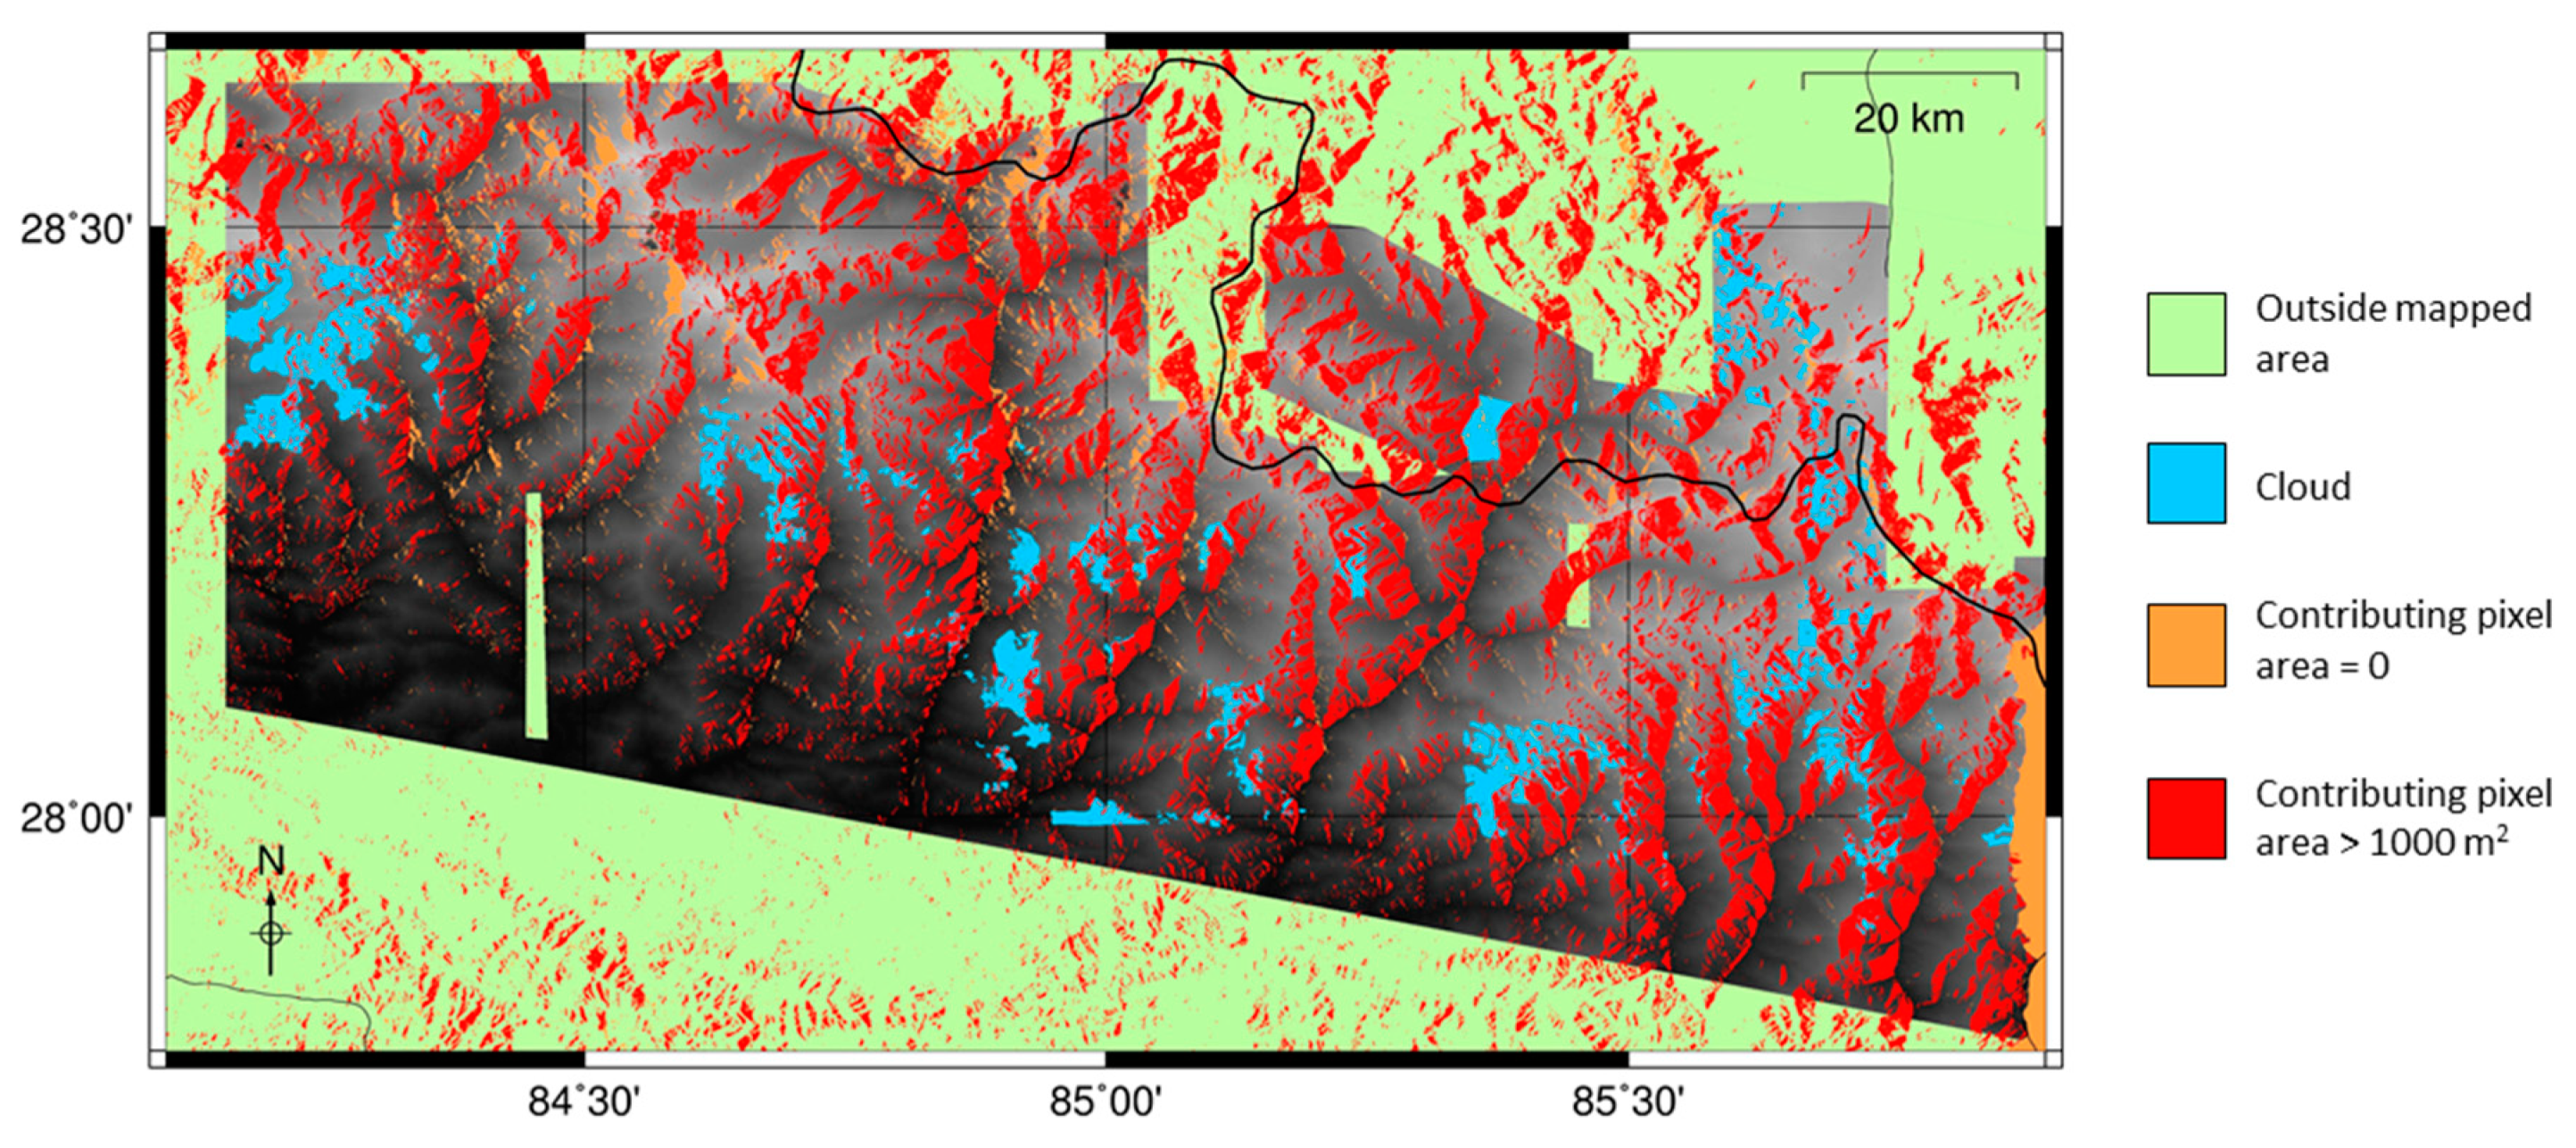
In order to test the classification ability of each surface, it was necessary to mask pixels which were either not mapped in the landslide inventory or which were not well imaged by the SAR system. Based on the data of Roback et al. [2], we applied masks to remove pixels that were either outside the mapped area or obscured by cloud in the optical satellite imagery (Figure 7).
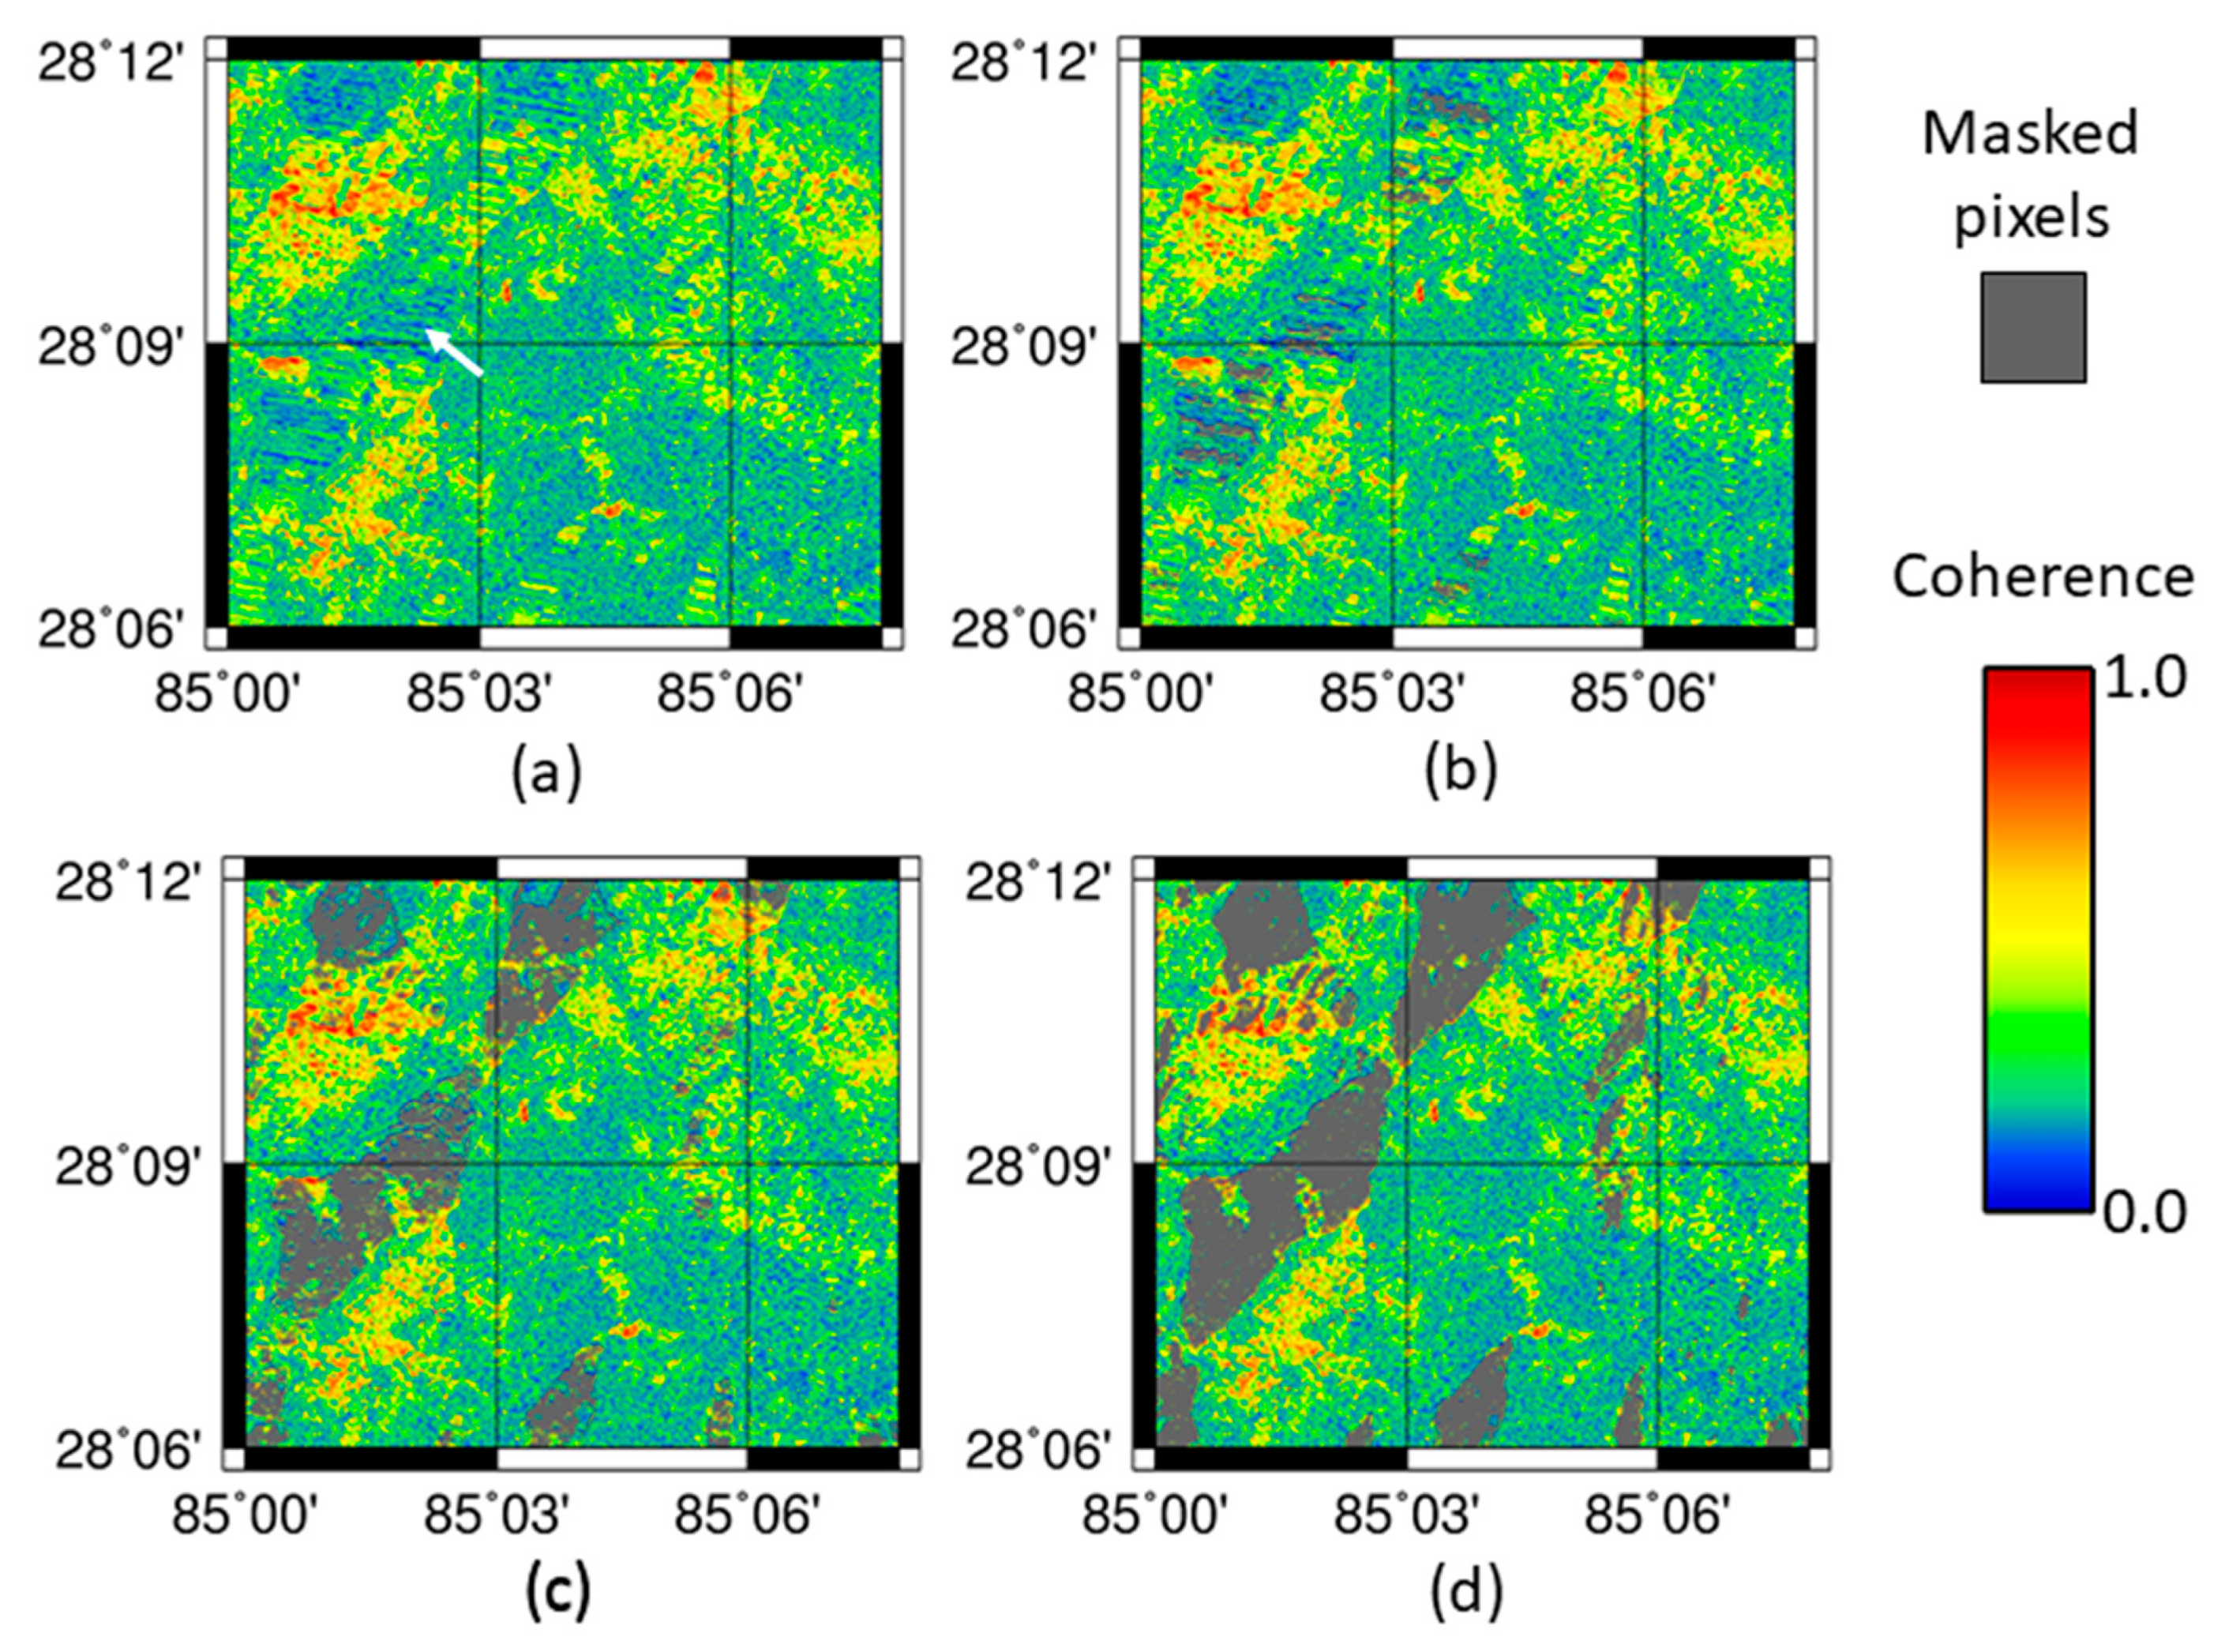
We also masked areas where the SAR system was not likely to capture useable data based on viewing angle of the satellite and topography. The SAR system images the Earth’s surface at an oblique angle, locating pixels according to their two-way travel time and Doppler shift, and projecting them onto a two-dimensional image. Steep topography can distort this image, leading to phenomena known as shadowing, foreshortening and layover (detailed in [47]). In order to assess this effect, we used the σ0 radar backscatter normalisation area calculated using the pixel area integration method described in [48]. This method divides the DEM surface covering the SAR image into small patches. The patches of the DEM surface that correspond spatially to each radar pixel are then integrated in order to approximate the area on the ground that contributes to each pixel. We used this σ0 normalisation area to identify distorted pixels. A mask was applied to remove all pixels for which this contributing area is 0 and those for which the contributing area was >1000 m2 (around 6 times larger than the pixel spacing in radar coordinates) since these were expected to contain little information on landsliding. The selection of this threshold of 1000 m2 is justified in Appendix A.

3. Results

Both maps of individual landslides and of landslide density are useful in the emergency response process [9]. We therefore assessed each classification surface in terms of their ability to: (1) identify individual landslides at a pixel-by-pixel scale; and (2) identify areas that had experienced extensive landsliding at a series of increasingly coarse spatial scales. To do this we produced aggregate classification surfaces, for which the original surface was divided into N × N pixel squares and the mean pixel value within each square was taken as the aggregate classifier value. These were then normalised as before to produce a surface of values between 0 and 1 for each classifier. A landslide density surface was calculated as the percentage mapped landslide area of each aggregate pixel. For the purpose of ROC analysis, which requires a binary validation dataset, we assigned aggregate pixels with over 50% landslide density as ‘landslide’ and those with under 50% ‘non-landslide’, although we also test the sensitivity of all methods to this choice.
Figure 8 shows a map of landslides from Roback et al. [2] and each normalised coherence-based classification surface. Two areas are shown, selected to contain different sizes of landslides. The first is around the Village Development Committee (an administrative region) of Jharlang, located in the Himalayan foothills within Dhading District. The second area covers the Langtang Valley in Rasuwa District, where an exceptionally large landslide with an area of 1.7 km2 led to hundreds of fatalities [6,41]. As was found by Yun et al. [21], the large landslide in the Langtang Valley is visible in the ARIA classification surface. However, in the Jharlang area, where landslides were smaller, the ARIA method was less successful, and the surface is noisy. The new method, Bx-S struggles to differentiate between landslide and non-landslide pixels in both locations, as does absolute coherence, which suffers from false positives.
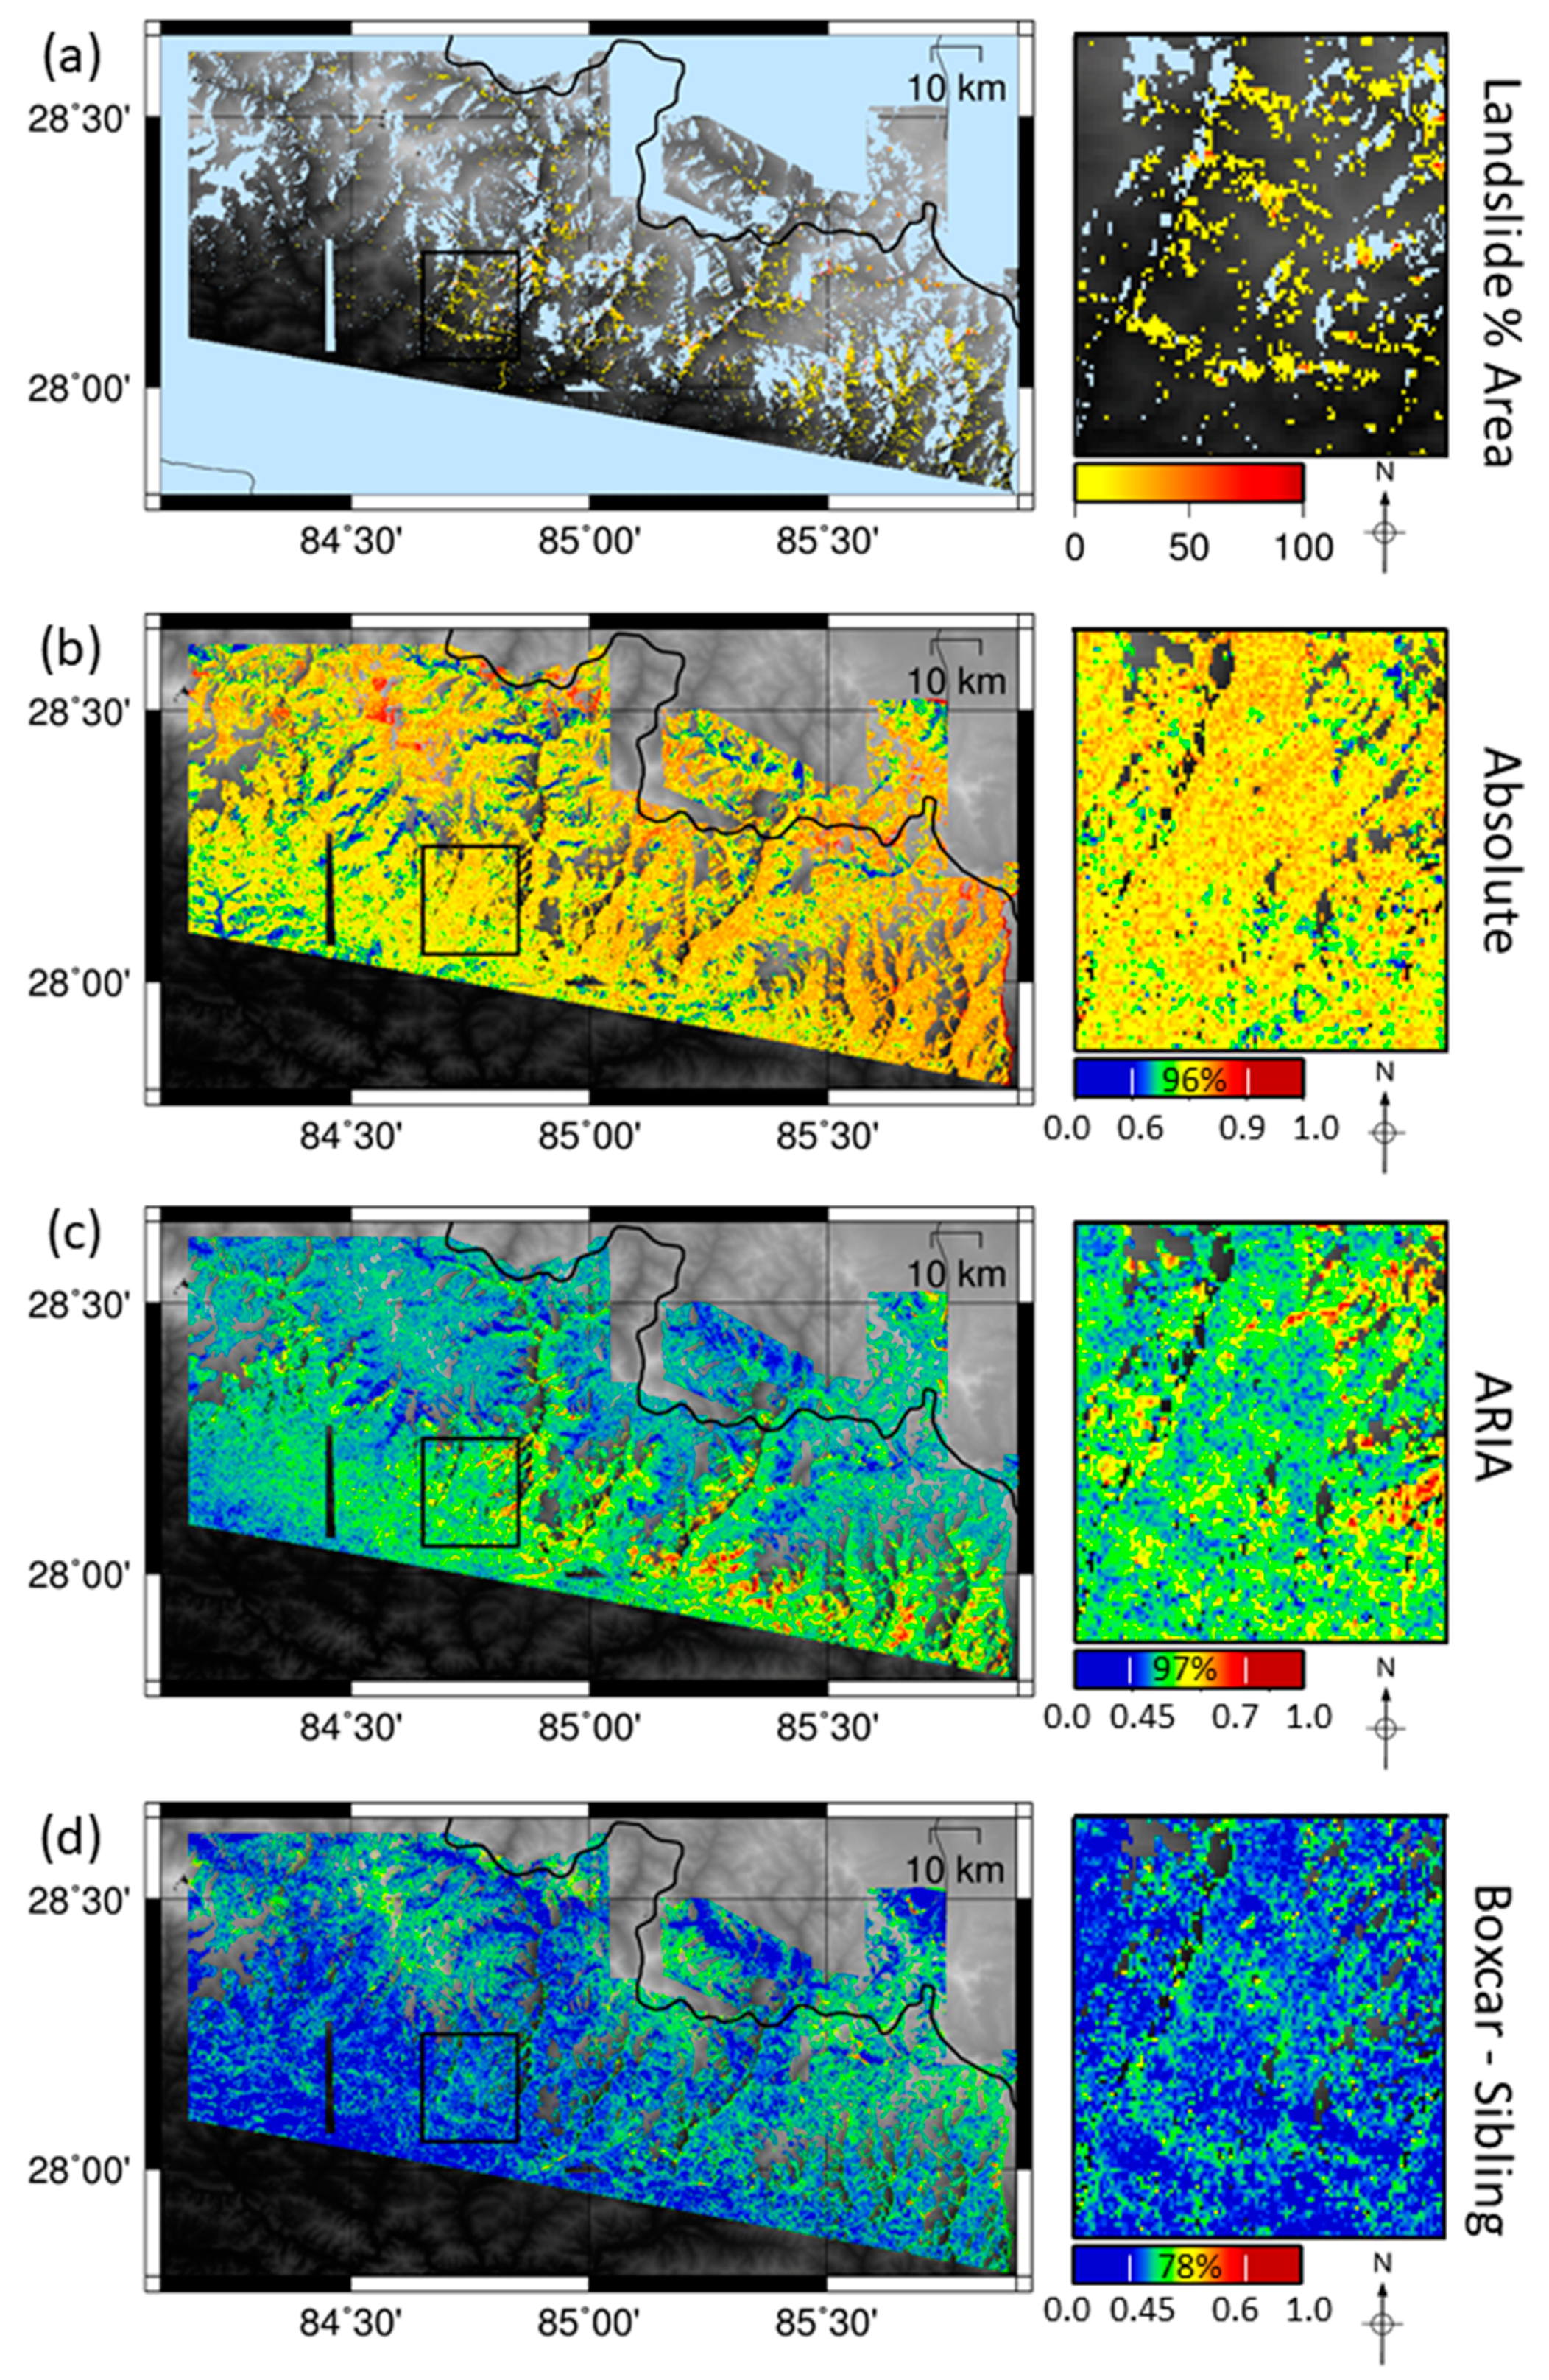
ROC analysis confirms that all three methods perform poorly as landslide classifiers on a pixel-by-pixel scale, with AUC <0.6 (Figure 9). However, Bx-S and to a lesser extent ARIA and absolute coherence are more successful at identifying areas of intense landsliding. ROC analysis shows that increasing pixel size through aggregation results in improved performance for all methods. In particular, Bx-S outperforms the two existing methods at all aggregations and does better with increasing aggregation. ROC AUC for Bx-S increases from 0.56 to 0.77 when aggregated from 20 m × 22 m pixels to 300 m × 330 m. For the same aggregation, absolute coherence ROC AUC increases from 0.55 to 0.72 and the ARIA method ROC AUC increases from 0.57 to 0.68. Figure 10 shows classification surfaces for the whole area at an aggregated pixel size of 200 m × 220 m (10 × 10 pixels), along with a smaller region within Gorkha district. In this smaller region, Bx-S appears relatively successful in recreating the spatial pattern of landslide density, while ARIA and absolute coherence have many false positives, making it difficult to identify the correlation with landslide density. To allow direct comparison, the inset region in Figure 10 is shown in Figure A2 (Appendix B) prior to aggregation.
Several factors exerted a relatively strong influence on classification ability for the different classifiers: one related to spatial scales, a second to the time window of SAR acquisition, and a third to the definition of ‘landslide’ pixels. First, increasing the size of the boxcar window worsens performance for all three classifiers. We have presented all results in this study using a 3 × 3-pixel window but we also tested 5 × 5 and 20 × 20 windows. In most cases increasing the size of the boxcar window reduced ROC AUC, although not for the Bx-S classification surface (Table 1). We carried out the comparison on aggregates of 10 × 10 individual pixels. This was in order to lessen the effect of coarsening resolution on classification ability discussed above.
Second, for all three classifiers, classification ability worsened when the time window between SAR image acquisition was increased. This was expected as a longer time window will have increased temporal decorrelation unrelated to landsliding, particularly in vegetated areas. Third, results were affected by how aggregate ‘landslide’ pixels were defined. For the purposes of ROC analysis, an aggregate landslide pixel was defined as one comprising at least 50% individual landslide pixels. In varying this threshold, we found that ROC AUC was higher when landslide pixels were more strictly defined by a higher threshold (Table 2). The classifiers are therefore better able to identify a region that has experienced more severe landsliding, which may affect how they can be applied. We also tested the effect of altering the size of the RapidSAR search window from 41 × 41, which is used throughout this study, to 21 × 21, 61 × 61 and 81 × 81. This had little effect on ROC AUC on both individual and aggregated pixel surfaces (No more than 0.01 difference) but computation time was noticeably different. The time taken for an 81 × 81 window was around double that of the 21 × 21 window.

4. Discussion

4.1. Pixel Aggregation

We found SAR coherence methods to be more successful in landslide detection at lower spatial resolutions. There are several potential reasons for this. First, any disagreement in landslide shape or location between the SAR classifier and the validation map will have a negative effect on the ROC analysis since non-overlapping ‘landslide’ pixels between the two maps result in both false positives and false negatives. Therefore, any problems in geo-referencing in either the coherence maps or the validation inventory will adversely affect classifier performance. This is particularly relevant in the case of Nepal, where Roback et al. [2] note considerable difficulty in orthorectifying and georeferencing the imagery from which the landslides were mapped. Furthermore, any additional landslides or change in existing landslide shape through landslide reactivation between SAR and optical image acquisition would have the same effect. Reactivation is likely to occur due to unstable ground conditions, rainfall and aftershock activity. The SAR imagery used here was collected 4 days following the earthquake, whereas the optical imagery used by Roback at al. [2] was acquired over a period of several months. It is also worth noting that as well as landslides, our method may detect other forms of damage, such as collapsed buildings or damaged roads. Although this may be a useful application of our method for future studies, here this may result in additional false positives, as these areas would not be included in the inventory of individual landslides.
Second, there are likely to be limitations on the size of an individual landslide that can be detected both by the individual collecting the optical landslide inventory and by the SAR classifier. Of the 24,915 landslides mapped by Roback et al. [2], 6028 (<25%) are under 400 m2 in area, the size of one SAR pixel, while more than half are smaller than the 3 × 3 pixel boxcar window. (Figure 11). The calculation of the boxcar coherence as a spatial average means that sub-pixel landslides are unlikely to be visible and sharp boundaries in coherence are blurred. Using a 3 × 3 pixel window, 9 pixels will be used in the summation in Equation (1). For two adjacent pixels, 6 of these will be the same. Sharp coherence changes are therefore spread across the boxcar window [44]. The blurring between neighbouring pixels may mask the signal of small landslides, making pixel scale detections problematic. This affects all three methods, as all use a boxcar coherence estimate to detect landslides. However, this problem is reduced when using SAR coherence to estimate coarser resolution landslide density, since a mean is taken of neighbouring pixels in the aggregation process.

4.2. The Maximum Detectable Landslide Size

The size of the search window used by RapidSAR for sibling identification is likely to set an upper limit on the maximum size of a landslide that can be detected using the Bx-S method. The method relies on a sibling-based coherence estimate using proportionally fewer landslide pixels in the summation than the boxcar estimation (Equation (1)). We make the assumption that siblings of a given pixel will generally be distributed widely throughout the search window and will not be clustered around it as immediate neighbours. However, for a pixel located at the centre of a landslide that is larger than the RapidSAR window, both of the ensembles of pixels used by the boxcar and sibling-based coherence estimates will lie entirely within the landslide. Both estimates of coherence therefore yield a low value and the difference between them will be small, leading to a false negative. This effect will decrease towards the edges of the landslide.
The largest landslide included in the Roback et al. [2] inventory is the Langtang Valley landslide (Figure 8), which has an area around 1.7 km2. Here we used a 41 × 41-pixel window, equivalent to an area around 270,000 m2. In radar coordinates, the Langtang Valley landslide is 221 pixels in length but has a mean width of just 30 pixels. At its widest point, it is 58 pixels wide. In the centre of the Langtang Valley landslide, we therefore expect to approach the point where both coherence estimates are very low. Therefore, although decreasing the size of the search window decreased computation time, we did not use a smaller 21 × 21 window in this study. In future studies, where the maximum landslide size is unknown, it will be necessary to increase the size of the RapidSAR search window in order to ensure that large landslides are not masked.

4.3. Ascending and Descending Track SAR

In Section 2.2.4, a mask was applied to remove areas of the classification surfaces that were not expected to contain useful information due to the topography and satellite image acquisition parameters. Application of this mask resulted in exclusion of 23% of the study area. However, exclusion is strongly biased towards those slopes facing away from the sensor and is thus often limited to one side of a valley. Therefore, if landsliding occurrence is assumed independent of slope aspect, it remains possible to obtain a relative estimation of regional landslide density. We do note, however, that care should be taken in areas where vegetation cover varies with slope aspect, as this could introduce aspect-related variations in landslide susceptibility.
It is also important to note that, since the locations of these masked regions are dependent on the viewing angle of the satellite, they are different for ascending and descending track SAR. We used descending track imagery, which is acquired from a west-facing sensor, so that steep, west-facing slopes were not well imaged and had to be masked. For ascending track imagery, the opposite would be true. Here, ascending track SAR imagery was unavailable; however, it will be advantageous in future studies to combine both ascending and descending track SAR imagery in order to maximise the area that can be mapped using SAR.

4.4. Combining Classifiers

Predictive landslide models, e.g., [12,13,14], rely on a combination of predictors of landslide distribution that together provide a more accurate model than any one individual predictor. One possible way of improving the classification ability of SAR-based methods would be to combine them with one or more such empirical predictors. Various possible landslide predictors such as slope, lithology and distance to rivers and faults; and means of combining them have been tested and developed [12,13,14,49]. Using SAR data as an additional input for one of these models would allow incorporation of observed data into models that are traditionally static in time based on pre-earthquake conditions and prior knowledge of landslide likelihood.
Alternatively, landslides mapped by SAR could be used to calibrate predictive models. Robinson et al. [14] used small areas of mapped landslides as training data to predict landslide occurrence across Nepal following the Gorkha earthquake. They found that while the input of observed landslide data improved model performance, the improvement was considerably reduced if these observations were clustered. This clustering is common in optically-derived datasets if mapping is only possible through small gaps in cloud cover. SAR methods may provide a more uniformly distributed set of observations that could be used in the calibration of predictive models. Areas where the SAR coherence was likely to be most reliable could be identified for this purpose, either by masking areas with high normalised backscatter as we have done here, by identifying areas where coherence was consistent and non-zero in pre-event imagery or by using a method such as that of Rees [50] to predict areas where topographic effects (e.g., shadowing) might be problematic based on DEM data and satellite image acquisition parameters. For our case study, we were still able to make landslide observations across a wide area, lessening the clustering effect, even after masking unreliable SAR data.
SAR products other than coherence may also be used in landslide identification. For example, SAR amplitude has shown some capacity for mapping landslides in other studies, although not enough to be used alone in large-scale landslide identification [51]. SAR amplitude is dependent on the proportion of microwave energy that is scattered at the Earth’s surface. Vegetation tends to scatter a relatively high proportion of this energy when compared to exposed rock or bare ground so that the amplitude of the signal when it is returned to the satellite is lower for vegetation than for rock. Since landslides remove vegetation, they are expected to correspond to bright areas in an amplitude map and to increased amplitude in time. We tested SAR amplitude in our initial analysis but found it to be outperformed by coherence-based classifiers, so do not report it here. However, SAR amplitude methods are likely to perform better in highly vegetated regions, and therefore may be complementary to coherence-based methods, that are adversely affected by low background temporal coherence in these areas.

4.5. SAR Frequency Band

Sentinel-1a C-band SAR was used in this study because it had good temporal coverage in the months prior to the 2015 Gorkha earthquake, the short 12-day revisit time improves temporal coherence, the data are easily and openly available, and frequent coverage means that this satellite constellation may be used in future emergency response. Many SAR-based landslide studies also use either X-band or L-band SAR [21,22,23,24,26,27,28,29]. X-band SAR has a shorter wavelength than C- and L-band, which makes it able to detect smaller ground movements at higher spatial resolution. However, due to increased penetration of SAR microwaves through the canopy at longer wavelengths, L-band SAR retains higher temporal coherence than C-band in vegetated regions [21,24,25], whilst coherence of X-band SAR imagery for the same regions is very low [21,29]. Since all three methods discussed here rely on non-landslide pixels having a reasonable background coherence, we did not attempt to use X-band data for our case study, due to the heavy vegetation cover in our target region. Whilst the higher temporal coherence of L-band SAR may provide a significant advantage in vegetated regions, this may be negated if there is a long time between image acquisitions. When testing the ARIA method using L-band imagery collected by the ALOS-2 satellite system for the Gorkha earthquake, Yun et al. [21] found L-band SAR to perform poorly in rural, vegetated areas. In order to obtain the two pre-event and one co-event images required for their method, Yun et al. [21] were required to use imagery spanning 7 months. Over this time, vegetated regions underwent considerable change, resulting in changes in coherence unrelated to landsliding or earthquake damage. Since the Gorkha earthquake occurred early in the lifespan of ALOS-2, the pre-event imagery acquired was not sufficient for the sibling identification required by the Bx-S method presented here, so it could not be tested with L-band SAR. However, for future events with more complete pre-event image acquisition, the increased coherence of L-band SAR in vegetated regions may increase the classification ability of SAR-coherence-based methods. Equally, these methods may perform even better with C-band SAR for regions that are less densely vegetated than our case-study area.

4.6. Alternative Methods of Coherence Estimation

The method we present here exploits the difference between a boxcar estimation of coherence and a sibling-based estimation. Here we used the RapidSAR algorithm to calculate this sibling-based estimate; however other methods of identifying sibling pixels have been put forward, e.g., SqueeSAR [43] and NL-InSAR [42]. There may be advantages to other methods of sibling calculation that are worth exploring. For example, NL-InSAR calculates siblings from a single SAR image. This would remove the need for a long time-series of pre-seismic imagery, which may not always be available, and would decrease the number of SAR images to be processed and stored. However, RapidSAR has several attributes that make it particularly well suited to our study. First, it is fully automated and its intended purpose of volcano monitoring means that it was designed to process imagery rapidly, making it suitable for our purpose of emergency response. Second, it allows additional SAR scenes to be incorporated as they are acquired. Third, unlike SqueeSAR, RapidSAR does not require sibling pixels to be interconnected. This allows siblings to be more dispersed through the search window, so that siblings of a landslide pixel are less likely to lie within the landslide.

4.7. Application

The data required for the production of the classification surfaces described in this study are available globally, albeit with varying temporal coverage. Two datasets are required: the SAR imagery and the DEM used to process it. The SRTM 1-arcsecond DEM used here is a global product available between 60° North and 56° South and is openly distributed [45]. SAR imagery is available from a variety of platforms but here we use Sentinel-1 imagery which is acquired at regular intervals globally and is also openly distributed. The classification surfaces produced in this study could therefore be produced in most locations across the world following a landslide trigger event.
It has been stressed in multiple studies that the speed at which information can be produced and disseminated is vital to its application [8,9]. The applicability of SAR-derived landslide products in emergency response is therefore largely determined by the time taken to produce them. The ARIA team have demonstrated that damage proxy maps can be generated within 1 day of post-event imagery being acquired. Although the new method we present here requires more SAR data to be processed, the majority of the processing steps can be performed while waiting for this post-event image to be acquired. Preparation of the DEM, downloading pre-event SAR imagery, processing this to obtain interferograms and calculating sibling locations can all be performed without the post-event image. Once this image has been acquired, the final steps could be carried out within 1 day: downloading and processing the post-event image, calculating boxcar and sibling-based co-event coherences and differencing these. Less time may be required for landslide events that affect a smaller region than the 2015 Gorkha earthquake.
Exactly when these classifiers could be produced is therefore dependent on the acquisition of SAR imagery. The post-event image used in this study was acquired on day 4 following the mainshock, meaning that a classification surface could have been produced by day 5. However, as is shown on Figure 1, imagery further east of Kathmandu was not acquired until day 10, meaning that it would take 11 days to form a complete classification surface for the affected area. Ascending data on track 85 were acquired 7 days following the mainshock and cover the entire affected area so that classification surfaces from these data could have been produced within 8 days. The frequency at which areas are imaged in SAR varies depending on location globally. The launch of Sentinel-1b in 2016 means that Sentinel imagery is now acquired with a 6- rather than 12-day revisit time across Europe [17]. These data are freely accessible soon after acquisition. Other satellite constellations, such as ALOS-2 or Cosmo-Skymed may also provide imagery of affected areas.
Possible uses for a SAR based map of relative landslide density can be illustrated using the case of the Nepal earthquake. Williams et al. [9] divide the emergency response into several phases each with different information requirements. In the first 3 days the ‘situational analysis’ phase aimed to identify, at a broad scale, the spatial extent and severity of the damage. It is conceivable for SAR products to be produced within this time window, although this would depend on the wait time for post-event imagery. After this 3-day period, the requirements of disaster managers begin to transition to more detailed information on specific areas of concern [9]. Based on our findings here, SAR-coherence methods alone would not be capable of mapping individual landslides but could still direct managers toward the areas that were most badly affected—especially if aggregated landslide density maps could be combined with pre-existing population data.
The Gorkha earthquake occurred at the end of April, meaning that the onset of the monsoon was expected around 2 months later. Since earthquake-triggered landsliding correlates spatially with areas of ground weakened by shaking and since existing landslide deposits may be remobilised as debris flows, causing more damage, earthquake-triggered landslide maps were used as input for predictive monsoon-triggered landslide hazard maps [7]. A landscape-scale landslide density map could have been used in this process and would have the advantage of being homogeneous, the whole area having been imaged by a single satellite.
Finally, landslide density could be used in directing field investigations such as those carried out by Collins and Jibson [6], who targeted sites of potential landslide dams. Since landslide mapping was incomplete when they began their investigation, it was necessary to add target sites while the investigations were ongoing. The initial list of target sites was determined at the start of their field investigation, 32 days after the Gorkha mainshock, meaning that SAR products could easily have been made available during this time.
Although here we have focussed on earthquake-triggered landslides, SAR-based approaches have as much or more potential in identifying monsoon- or typhoon-triggered landslides. Since rainfall events are generally accompanied by cloudy weather conditions which obstruct optical mapping, a SAR-based classifier could be particularly advantageous. The ARIA team have released damage proxy maps for urban damage following typhoons in the USA, Tonga and Puerto Rico [20]. There are various factors, however, which could complicate the use of SAR products in mapping rainfall-triggered landslides. In the case of typhoons, one such complication would be the damage to vegetation caused by the typhoon, which would be likely to decrease coherence, possibly leading to false positives. SAR coherence methods may prove unable to distinguish between landslides and damaged vegetation, although combination with SAR amplitude or other predictors might ameliorate this. Monsoon-triggered landslides represent a different problem: since the trigger extends over several months, pairs of SAR images would contain both old and new landslides as well as reactivated or partially reactivated old landslides. The signals associated with each of these would be different, which might cause confusion, particularly if aggregating pixels containing several landslides triggered at different times. Landslides which pre-date a SAR image pair and are stable would be expected to have a higher coherence than new landslides and possibly higher than the surrounding vegetation.

5. Conclusions

We have tested three potential SAR-coherence-based landslide classification methods at a range of resolutions against a manually mapped landslide inventory for events triggered by the 2015 Gorkha, Nepal earthquake [2]. We have tested two classifiers that have previously been suggested to contain landslide information: absolute coherence and the ARIA method for urban damage proxy mapping. We have also presented a new method for landslide classification, in which the difference between boxcar and sibling-based coherence (Bx-S) is used as a classifier. Using ROC analysis, we showed that none of the methods tested here were able to identify landslides at a pixel-by-pixel (20 m × 22 m) scale. However, all three classifiers were more successful when the resolution was coarsened by aggregating pixels, which corresponds to the real-world application of classifying larger regions of high landslide density. Our Bx-S method is more successful than existing SAR coherence methods, with an ROC of 0.77 for 300 m × 330 m aggregate pixels. This suggests that our new method may be able to provide useful and timely information on the large-scale distribution of landslides following future triggering events, such as earthquakes, even under heavy cloud conditions that limit the applicability of optical satellites for this purpose.

Author Contributions

K.B. carried out curation, validation and formal analysis of the data and preparation of the original draft. K.S. and K.B. worked on software used in the study. Conceptualization, administration, funding acquisition and supervision of the project were performed by R.J.W., D.M. and A.L.D. All authors were involved in developing the methodology and in reviewing and editing the manuscript.

Funding

This work was carried out as part of a PhD project funded by the Institute of Hazard, Risk and Resilience at Durham University through the Action on Natural Disasters PhD scholarship programme. The work was partly supported through the NERC Centre for the Observation and Modelling of Earthquakes, volcanoes and Tectonics (COMET).

Acknowledgments

Sentinel-1 interferograms and coherence maps are a derived work of Copernicus data, subject to ESA use and distribution conditions. Some figures were made with the public domain Generic Mapping Tools [52]. We thank Susanna Ebmeier and Nick Rosser for their helpful comments and feedback. We thank four anonymous reviewers for their helpful and constructive reviews.

Conflicts of Interest

The authors declare no conflict of interest.

Appendix A

Figure A1a shows a map of pre-seismic coherence (image pair 5 April 2015, 17 April 2015) for the region of Jharlang. An example of a slope along which pixels have been distorted is indicated, where the pixels are visibly elongate and the image appears striped. In order to identify these distorted pixels, we calculated the geographic area which contributed to each pixel in radar geometry. Across our study area, this pixel contributing area ranged between 0 and 19,000 m2. In contrast, each multilooked pixel in geographic coordinates is around 400 m2 in size. We masked pixels with a contributing area above a given threshold. This threshold was incrementally lowered from 5000 m2 to 2000 m2 to 1000 m2 (Figure A1b–d respectively). With the threshold set at 1000 m2, visibly distorted pixels were removed from the image (Figure A1d). We therefore did not lower the threshold further, as this would have removed data without justification.
Figure A1. (a) Pre-event coherence map for Jharlang with white arrow indicating distorted pixels. (bd) The effect of masking pixels for which the contributing area was over 5000, 2000 and 1000 m2 respectively.
Remotesensing 11 00237 g0a1

Appendix B

The smaller area shown in Figure 10 before pixel aggregation.
Figure A2. (a) The percentage of each 10 × 10 aggregate pixel made up of landslide pixels. (bd) The classifier value before aggregation for the surfaces produced by absolute, ARIA and Bx-S methods respectively. Each surface has been normalised to range between 0 and 1 with 1 most likely to be a landslide. Colour bars are non-linear, but linear between the white lines and labelled with the percentage of pixels across the whole area that lie in this linear range. The area shown corresponds to the smaller area shown in Figure 10.
Remotesensing 11 00237 g0a2

References

  1. Xu, C.; Xu, X.; Tian, Y.; Shen, L.; Yao, Q.; Huang, X.; Ma, J.; Chen, X.; Ma, S. Two comparable earthquakes produced greatly different coseismic landslides: The 2015 Gorkha, Nepal and 2008 Wenchuan, China events. J. Earth Sci. 2016, 27, 1008–1015. [Google Scholar] [CrossRef] [Green Version]
  2. Roback, K.; Clark, M.K.; West, A.J.; Zekkos, D.; Li, G.; Gallen, S.F.; Chamlagain, D.; Godt, J.W. The size, distribution, and mobility of landslides caused by the 2015 Mw 7.8 Gorkha earthquake, Nepal. Nat. Hazards Earth Syst. Sci. 2017, 17, 1521–1540. [Google Scholar] [CrossRef]
  3. Marano, K.D.; Wald, D.J.; Allen, T.I. Global earthquake casualties due to secondary effects: A quantative analysis for improving rapid loss analyses. Nat. Hazards 2010, 52, 319–328. [Google Scholar] [CrossRef]
  4. Cui, P.; Zhu, Y.Y.; Han, Y.S.; Chen, X.Q.; Zhuang, J.Q. The 12 May Wenchuan earthquake-induced landslide lakes: Distribution and preliminary risk evaluation. Landslides 2009, 6, 209–223. [Google Scholar] [CrossRef]
  5. Global Logistics Cluster. Nepal Lessons Learned Report. 2016. Available online: http://www.logcluster.org/global-meeting-document/nepal-lessons-learned-report (accessed on 19 June 2017).
  6. Collins, B.D.; Jibson, R.W. Assessment of Existing and Potential Landslide Hazards Resulting from the April 25, 2015 Gorkha, Nepal Earthquake Sequence; US Geological Survey: Reston, WV, USA, 2015.
  7. Datta, A.; Sigdelm, S.; Oven, K.; Rosser, N.; Densmore, A.; Rijal, S. The Role of Scientific Evidence during the 2015 Nepal Earthquake Relief Efforts; Overseas Development Institute Report: London, UK, 2018. [Google Scholar]
  8. Fiedrich, F.; Gehbauer, F.; Rickers, U. Optimized resource allocation for emergency response after earthquake disasters. Saf. Sci. 2000, 35, 41–57. [Google Scholar] [CrossRef]
  9. Williams, J.G.; Rosser, N.J.; Kincey, M.E.; Benjamin, J.; Oven, K.J.; Densmore, A.L.; Milledge, D.G.; Robinson, T.R.; Jordan, C.A.; Dijkstra, T.A. Satellite-based emergency mapping using optical imagery: Experience and reflections from the 2015 Nepal earthquakes. Nat. Hazards Earth Syst. Sci. 2018, 18, 185–205. [Google Scholar] [CrossRef]
  10. Heleno, S.; Matias, M.; Pina, P.; Sousa, A.J. Semiautomated object-based classification of rain-induced landslides with VHR multispectral images on Madeira Island. Nat. Hazards Earth Syst. Sci. 2016, 16, 1035–1048. [Google Scholar] [CrossRef] [Green Version]
  11. The British Geological Survey. Ecuador Disaster Response 2016. Available online: http://www.bgs.ac.uk/research/earthHazards/epom/ecuadorEarthquake.html (accessed on 8 July 2018).
  12. Kritikos, T.; Robinson, T.R.; Davies, T.R. Regional coseismic landslide hazard assessment without historical landslide inventories: A new approach. J. Geophys. Res. Earth 2015, 120, 711–729. [Google Scholar] [CrossRef] [Green Version]
  13. Gallen, S.F.; Clark, M.K.; Godt, J.W.; Roback, K.; Niemi, N.A. Application and evaluation of a rapid response earthquake-triggered landslide model to the 25 April 2015 Mw 7.8 Gorkha earthquake, Nepal. Tectonophysics 2017, 714, 173–187. [Google Scholar] [CrossRef]
  14. Robinson, T.; Rosser, N.; Densmore, A.; Williams, J.; Kincey, M.; Benjamin, J.; Bell, H. Rapid post-earthquake modelling of coseismic landslide magnitude and distribution for emergency response decision support. Nat. Hazards Earth Syst. Sci. 2017, 17, 1521–1540. [Google Scholar] [CrossRef]
  15. Dixit, A.M.; Ringler, A.T.; Sumy, D.F.; Cochran, E.S.; Hough, S.E.; Martin, S.S.; Gibbons, S.; Luetgert, J.H.; Galetzka, J.; Shrestha, S.N.; et al. Strong-motion observations of the M 7.8 Gorkha, Nepal, earthquake sequence and development of the N-SHAKE strong-motion network. Seismol. Res. Lett. 2015, 86, 1533–1539. [Google Scholar] [CrossRef]
  16. Elliott, J.R.; Walters, R.J.; Wright, T.J. The role of space-based observation in understanding and responding to active tectonics and earthquakes. Nat. Commun. 2016, 7, 13844. [Google Scholar] [CrossRef] [Green Version]
  17. Sentinel-1. European Space Agency. Available online: https://sentinel.esa.int/web/sentinel/missions/sentinel-1/ (accessed on 2 August 2018).
  18. Martinis, S.; Kersten, J.; Twele, A. A fully automated TerraSAR-X based flood service. ISPRS J. Photogramm. 2015, 104, 203–212. [Google Scholar] [CrossRef]
  19. Meyer, F.J.; McAlpin, D.B.; Gong, W.; Ajadi, O.; Arko, S.; Webley, P.W.; Dehn, J. Integrating SAR and derived products into operational volcano monitoring and decision support systems. ISPRS J. Photogramm. 2015, 100, 106–117. [Google Scholar] [CrossRef]
  20. NASA. Advanced Rapid Imaging and Analysis (ARIA) Project for Natural Hazards. Available online: https://aria.jpl.nasa.gov/ (accessed on 27 June 2018).
  21. Yun, S.-H.; Hudnut, K.; Owen, S.; Webb, F.; Simons, M.; Sacco, P.; Gurrola, E.; Manipon, G.; Liang, C.; Fielding, E.; et al. Rapid Damage Mapping for the 2015 Mw 7.8 Gorkha Earthquake Using Synthetic Aperture Radar Data from COSMO-SkyMed and ALOS-2 Satellites. Seismol. Res. Lett. 2015, 86, 1549–1556. [Google Scholar] [CrossRef]
  22. Mulas, M.; Corsini, A.; Cuozzo, G.; Callegari, M.; Thiebes, B.; Mair, V. Quantitative monitoring of surface movements on active landslides by multi-temporal, high resolution X-band SAR amplitude information: Preliminary Results. In Proceedings of the 12th International Symposium on Landslides, Napoli, Italy, 12–19 June 2016; pp. 1511–1516. [Google Scholar]
  23. Confuorto, P.; Di Martire, D.; Centolanza, G.; Iglesias, R.; Mallorqui, J.J.; Novellino, A.; Plank, S.; Ramondini, M.; Thuro, K.; Calcaterra, D. Post-failure evolution analysis of a rainfall-triggered landslide by multi-temporal interferometry SAR approaches integrated with geotechnical analysis. Remote Sens. Environ. 2017, 188, 51–72. [Google Scholar] [CrossRef]
  24. Shi, X.; Zhang, L.; Liao, M.; Balz, T. Deformation monitoring of slow-moving landslide with L-and C-band SAR interferometry. Remote Sens. Lett. 2014, 2014 5, 951–960. [Google Scholar] [CrossRef]
  25. Strozzi, T.; Farina, P.; Corsini, A.; Ambrosi, C.; Thüring, M.; Zilger, J.; Wiesmann, A.; Wegmüller, U.; Werner, C. Survey and monitoring of landslide displacements by means of L-band satellite SAR interferometry. Landslides 2005, 2, 193–201. [Google Scholar] [CrossRef]
  26. Boni, R.; Bordoni, M.; Colombo, A.; Lanteri, L.; Meisina, C. Landslide state of activity maps by combining multi-temporal A-DInSAR (LAMBDA). Remote Sens. Environ. 2018, 217, 172–190. [Google Scholar] [CrossRef]
  27. Rosi, A.; Tofani, V.; Tanteri, L.; Tacconi Stefanelli, C.; Agostini, A.; Catani, F.; Casagli, N. The new landslide inventory of Tuscany (Italy) updated with PS-InSAR: Geomorphological features and landslide distribution. Landslides 2018, 15, 5–19. [Google Scholar] [CrossRef]
  28. Strozzi, T.; Klimeš, J.; Frey, H.; Caduff, R.; Huggel, C.; Wegmüller, U.; Rapre, A.C. Satellite SAR interferometry for the improved assessment of the state of activity of landslides: A case study from the Cordilleras of Peru. Remote Sens. Environ. 2018, 217, 111–125. [Google Scholar] [CrossRef]
  29. Konishi, T.; Suga, Y. Landslide detection using COSMO-SkyMed images: A case study of a landslide event on Kii Peninsula, Japan. Eur. J. Remote Sens. 2018, 51, 205–221. [Google Scholar] [CrossRef]
  30. IASC Multi-Sector Initial Rapid Assessment Guidance. Available online: https://www.humanitarianresponse.info/en/programme-cycle/space/document/multi-sector-initial-rapid-assessment-guidance-revision-july-2015 (accessed on 16 October 2018).
  31. Bamler, R.; Hartl, P. Synthetic Aperture Radar Interferometry. Inverse Probl. 1998, 14, R1. [Google Scholar] [CrossRef]
  32. Just, D.; Bamler, R. Phase Statistics of interferograms with applications to synthetic aperture radar. Appl. Opt. 1994, 33, 4361–4368. [Google Scholar] [CrossRef]
  33. Li, Z.; Wright, T.; Hooper, A.; Crippa, P.; Gonzalez, P.; Walters, R.; Elliott, J.; Ebmeier, S.; Hatton, E.; Parsons, B. Towards InSAR everywhere, all the time with Sentinel-1. Int. Arch. Photogramm. Remote Sens. Spat. Inf. Sci. 2016, 41, 763–766. [Google Scholar] [CrossRef]
  34. Zebker, H.A.; Villasenor, J. Decorrelation in interferometric radar echoes. IEEE Trans. Geosci. 1992, 30, 950–959. [Google Scholar] [CrossRef] [Green Version]
  35. Fielding, E.J.; Talebian, M.; Rosen, P.A.; Nazari, H.; Jackson, J.A.; Ghorashi, M.; Walker, R. Surface ruptures and building damage of the 2003 Bam, Iran, earthquake mapped by satellite synthetic aperture radar interferometric correlation. J. Geophys. Res. Solid Earth 2005, 110. [Google Scholar] [CrossRef] [Green Version]
  36. Nico, G.; Pappalepore, M.; Pasquariello, G.; Refice, A.; Samarelli, S. Comparison of SAR amplitude vs. coherence flood detection methods—A GIS application. Int. J. Remote Sens. 2000, 21, 1619–1631. [Google Scholar] [CrossRef]
  37. Vajedian, S.; Motagh, M.; Mousavi, Z.; Motaghi, K.; Fielding, E.; Akbari, B.; Wetzel, H.U.; Darabi, A. Coseismic Deformation Field of the Mw 7.3 12 November 2017 Sarpol-e Zahab (Iran) Earthquake: A Decoupling Horizon in the Northern Zagros Mountains Inferred from InSAR Observations. Remote Sens. 2018, 10, 1589. [Google Scholar] [CrossRef]
  38. Yonezawa, C.; Takeuchi, S. Decorrelation of SAR data by urban damages caused by the 1995 Hyogoken-nanbu earthquake. Int. J. Remote Sens. 2001, 22, 1585–1600. [Google Scholar] [CrossRef]
  39. Yun, S.H.; Fielding, E.J.; Webb, F.H.; Simons, M. Damage Proxy Map from Interferometric Synthetic Aperture Radar Coherence. U.S. Patent 9,207,318, 20 December 2012. [Google Scholar]
  40. Coltuc, D.; Bolon, P.; Chassery, J.-M. Exact Histogram Specification. IEEE Trans. Image Process. 2006, 15, 1143–1152. [Google Scholar] [CrossRef] [PubMed]
  41. Kargel, J.S.; Leonard, G.J.; Shugar, D.H.; Haritashya, U.K.; Bevington, A.; Fielding, E.J.; Fujita, K.; Geertsema, M.; Miles, E.S.; Steiner, J.; et al. Geomorphic and geologic controls of geohazards induced by Nepal’s 2015 Gorkha earthquake. Science 2016, 351, aac8353. [Google Scholar] [CrossRef] [PubMed]
  42. Deledalle, C.A.; Denis, L.; Tupin, F.; Reigber, A.; Jäger, M. NL-SAR: A unified nonlocal framework for resolution-preserving (Pol)(In) SAR denoising. IEEE Trans. Geosci. Remote 2015, 53, 2021–2038. [Google Scholar] [CrossRef]
  43. Feretti, A.; Fumagalli, A.; Novali, F.; Prati, C.; Rocca, F.; Rucci, A. A new algorithm for processing interferometric data-stacks: SqueeSAR. IEEE Trans. Geosci. Remote 2011, 49, 3460–3470. [Google Scholar] [CrossRef]
  44. Spaans, K.; Hooper, A. InSAR processing for volcano monitoring and other near-real time applications. J. Geophys. Res. Solid Earth 2016, 121, 2947–2960. [Google Scholar] [CrossRef] [Green Version]
  45. Farr, T.G.; Rosen, P.A.; Caro, E.; Crippen, R.; Duren, R.; Hensley, S.; Kobrick, M.; Paller, M.; Rodriguez, E.; Roth, L.; et al. The shuttle radar topography mission. Rev. Geophys. 2007, 45. [Google Scholar] [CrossRef]
  46. Begueria, S. Validation and Evaluation of Predictive Models in Hazard Assessment and Risk Management. Nat. Hazards 2006, 37, 315–329. [Google Scholar] [CrossRef] [Green Version]
  47. Franceschetti, G.; Marino, R.; Migliaccio, M.; Riccio, D. SAR simulation of three-dimensional scenes. SAR Data Processing for Remote Sensing. Int. Soc. Opt. Photonics 1994, 2316, 192–202. [Google Scholar]
  48. Frey, O.; Santoro, M.; Werner, C.; Wegmuller, U. DEM-based SAR pixel area estimation for enhanced geocoding refinement and radiometric normalization. In Proceedings of the FRINGE 2011, Frascati, Italy, 19–23 September 2011. [Google Scholar]
  49. Reichenbach, P.; Rossi, M.; Malamud, B.; Mihir, M.; Guzzetti, F. A review of statistically-based landslide susceptibility models. Earth Sci. Rev. 2018, 180, 60–91. [Google Scholar] [CrossRef]
  50. Rees, W.G. Technical note: Simple masks for shadowing and highlighting in SAR images. Int. J. Remote Sens. 2000, 21, 2145–2152. [Google Scholar] [CrossRef]
  51. Czuchlewski, K.R.; Weissel, J.K.; Kim, Y. Polarimetric synthetic aperture radar study of the Tsaoling landslide generated by the 1999 Chi-Chi earthquake, Taiwan. J. Geophys. Res. Earth 2003, 108. [Google Scholar] [CrossRef] [Green Version]
  52. Wessel, P.; Smith, W.H.F. New improved version of the Generic Mapping Tools released. EOS Trans. Am. Geophys. Union 1998, 76, 579. [Google Scholar] [CrossRef]
Figure 1. Location map of the 2015 Gorkha earthquake. A white star marks the epicenter of the mainshock on 25 April 2015. The density of earthquake-triggered landsliding was calculated based on the inventory of Roback et al. [2]. The first post-event Sentinel-1a Synthetic Aperture Radar (SAR) acquisitions are shown with dashed lines: ascending track 085 (blue); descending track 19 (red) and descending track 121 (orange). The area of SAR imagery used in this study is from track 19 and is outlined in solid red.
Remotesensing 11 00237 g001
Figure 2. Timeline showing satellite image acquisition and product release following the 2015 Gorkha earthquake for optical satellite imagery and for SAR. Modified from [9]. Timeline of NASA Advanced Rapid Imaging and Analysis (ARIA) products is taken from [21]. Optical imagery and products are in blue with maps produced by Durham University (DU) and collated maps coordinated with international partners (International Centre for Integrated Mountain Development (ICIMOD), MacDonald, Dettwiler and Associates Ltd, (MDA) and the National Geospatial-intelligence Agency (NGA)) by the British Geological Survey. SAR imagery and products are in green and include the Sentinel-1 (S-1) imagery used in this study and the COSMO SkyMed (CSK) and ALOS-2 imagery of Kathmandu used by the ARIA project.
Remotesensing 11 00237 g002
Figure 3. (a) Sentinel-1 interferogram produced using LiCSAR [33] for a pre-event SAR image pair acquired on 24 March and 17 April 2015. Each band of colour shows a phase change between image acquisitions equal to 2.8 cm. Background intensity shows the amplitude of the image acquired on 17 April. (b) An example of an area where many pixels are incoherent. In this case, neighbouring pixels do not have a similar phase change and so do not sum constructively, resulting in a low boxcar estimation of coherence. (c) An example of an area of high coherence. Neighbouring pixels have similar phase change so sum constructively, resulting in a high estimation of coherence.
Remotesensing 11 00237 g003
Figure 4. Workflow of the ARIA method [21,39] for identifying ‘damaged’ pixels, for example those which correspond to collapsed buildings or landslides given in 3 steps: (a) Generate coherence maps C12, C23. (b) Histogram match C23 to C21. (c) Calculate the difference between the two coherence maps. Darker grey pixels in (c) have a lower coherence in C23m and C12 and negative pixels in the classification surface are identified as ‘damaged’, i.e., those for which C23m < C12.
Remotesensing 11 00237 g004
Figure 5. Workflow for the Bx-S method, in which the difference between sibling-based and boxcar coherence estimates is used in landslide classification.
Remotesensing 11 00237 g005
Figure 6. Timeline of Sentinel-1a image acquisition for the study area (see Figure 1) over the months preceding the Gorkha earthquake (red star), showing the imagery used in each method. Black diamonds show satellite overpasses at intervals of 12 days. Those where imagery was acquired are labelled with dates.
Remotesensing 11 00237 g006
Figure 7. Regions that were masked before analysis was carried out, either due to being unmapped by Roback et al. [2] (green, blue) or because of poor SAR image quality, identified using the contributing pixel area (orange, red). Underlying surface shows topography.
Remotesensing 11 00237 g007
Figure 8. Classification of individual landslides for two example locations. Each column shows mapped landslide polygons (pink) [2] and the normalized classification surface calculated from each method for the Jharlang (left) and Langtang Valley (right) regions. Colour bars are non-linear but linear between the white lines and labelled with the percentage of pixels across the two areas that lie in this linear range. The main body of the Langtang Valley landslide is indicated in white.
Remotesensing 11 00237 g008
Figure 9. ROC curves for three different SAR coherence-based classifiers, plotted at a range of resolutions from individual 20 m × 22 m pixels up to 300 m × 330 m aggregate pixels. The dotted lines show the performance of a random classifier (AUC = 0.5). Masks shown in Figure 7 were applied to the data before calculation. The Bx-S method outperforms the other classifiers for aggregated pixels.
Remotesensing 11 00237 g009
Figure 10. Classifier surfaces for 200 m × 220 m aggregate pixels. (a) the percentage of each aggregate pixel made up of landslide pixels. (bd) the mean value of the classification surface for each method within each aggregate pixel. These surfaces are normalized to a range between 0 and 1 with 1 being most likely to be a landslide. Colour bars are non-linear, but linear between the white lines and labelled with the percentage of pixels across the whole area that lie in this linear range.
Remotesensing 11 00237 g010
Figure 11. Histogram of landslide areas derived from the inventory of [2]. Landslides over 20,000 m2 in area are omitted for clarity. The sizes of an individual pixel (red) and of the window used in calculation of the boxcar coherence (blue) are marked.
Remotesensing 11 00237 g011
Table 1. ROC AUC values for each method for boxcar window sizes 3 × 3, 5 × 5 and 20 × 20. ROC AUC are shown for 200 m × 220 m aggregate classifier surfaces.
3 × 35 × 520 × 20
Absolute0.680.680.66
ARIA0.690.690.64
Bx-S0.730.730.73
Table 2. The effect on ROC AUC of varying the % landslide area threshold required for an aggregate pixel to be defined as ‘landslide’ for 200 m × 220 m aggregate pixels
10%20%30%40%50%60%
Absolute0.650.670.680.690.680.69
ARIA0.650.650.670.680.690.69
Bx-S0.670.700.720.730.730.75