Article

Application of a Small Baseline Subset Time Series Method with Atmospheric Correction in Monitoring Results of Mining Activity on Ground Surface and in Detecting Induced Seismic Events

by
Wojciech Milczarek
Faculty of Geoengineering, Mining and Geology, Wroclaw University of Science and Technology, Wybrzeże Wyspiańskiego 27, 50-370 Wrocław, Poland
Remote Sens. 2019, 11(9), 1008; https://doi.org/10.3390/rs11091008
Submission received: 19 March 2019 / Revised: 14 April 2019 / Accepted: 24 April 2019 / Published: 28 April 2019

Abstract

:
The article presents the results of applying a Small Baseline Subset (SBAS) method to the monitoring of the influence of underground mining exploitation on terrain surface. Calculations were performed on the basis of two large SAR data sets. Calculations of time series additionally employed the Tymofyeyeva and Fialko empirical method for estimating atmospheric delay. A series of test calculations allowed verifying the potential of the method. The SBAS calculations were based on theoretical data prepared with the use of the Mogi model. This approach allowed simulating both underground mining exploitation and induced tremors. The results indicate that the model is useful in detecting sudden ground surface deformations. In such a situation, the image of a tremor can be observed in the atmospheric component. The actual data used in the analysis covered a region of underground copper ore extraction in southwest Poland. The calculations were based on SAR data obtained from the Sentinel 1A/B satellites, for the period between the end of 2014 and May 2018, from paths 22 and 73. In both cases, the total number of images exceeded 120. They served to calculate over 420 interferograms for each set. The results of ground surface displacements allowed precise identification of areas affected by underground mining activity. Over the acquisition period of six days, sufficient amount of SAR data was obtained to precisely monitor surface changes in the analyzed area. The employed empirical atmospheric delay reduction method was demonstrated to enable the detection of sudden ground surface changes due to mining tremors. This feature makes the method useful in detecting induced seismic events in areas characterized by intensive mining activity. It allows determining tremor locations in cases when acquisition dates are greater than the optimal value of 6–12 days (in the case of Sentinel 1A/B).

Graphical Abstract

1. Introduction

Ground surface deformations due to underground mining activity belong to the most important results of some human interventions in the rock mass. Depending on the geological conditions, they may have a continuous or non-continuous character [1]. Ground surface displacements may be particularly dangerous in urban areas, where they may pose a threat to both the ground-level and underground infrastructure. Therefore, areas affected by mining operations are constantly monitored in order to provide up-to-date information on the scale and range of the observed deformations. The measurement results also serve to prepare and verify forecasts of how underground operations influence changes on the ground surface. The methods most frequently used to measure ground surface deformations in mining areas include: precise leveling lines [2,3], GNSS measurements [4], total station surveys and recently also laser scanning [5] and UAV surveys [6]. The above list of methods should be also supplemented with methods based on synthetic aperture radar interferometry and ground-based InSAR [7,8]. The currently used InSAR methods include the differential method [9,10,11] and the time-series methods: PsInSAR and its variations [12,13], as well as SBAS [14,15]. InSAR methods are also successfully employed in detecting ground surface deformations in post-mining areas, i.e., the so-called post-mining deformations [2,16,17].
In some cases, underground mining operations may lead to induced seismic events. Such events take place when mining stresses, tectonic stresses and lithostatic stresses overlap. These stresses effect an increase of the potential energy in the rock mass. When rock strength limits are exceeded, the rock mass is destroyed and the potential energy is rapidly released. The strongest seismic events may be similar in character to weak earthquakes. In other words, induced seismicity related to the extraction of useful minerals is the dynamic response of the rock mass to human activity, i.e., mining. Mining tremors may occur in the areas of both underground and surface mining. In Poland, mining tremors are typically recorded in the Upper Silesian Coal Basin, the Bogdanka hard coal mine, and the Legnica–Głogów Copper Belt (LGCB).
Threats related to mining tremors represent the most serious hazards in mining operations. Mining tremors occur in many locations worldwide and are related to the extraction of hard coal, lignite, oil, natural gas etc., as well as to injections. A mining tremor may lead to permanent changes in the ground surface. These changes may take the form of local terrain subsidences or non-continuous deformations, such as fracture lines, scarps, sink holes etc. The scale of ground surface changes is measured with the use of traditional land surveys [18] and GNSS [3]. However, attempts have been recently made to use satellite radar data in detecting
The main objective of the research was to check whether satellite radar interferometry could be used for long-term analysis of surface displacements of the mining area. Concurrently, the possibility of using the empirical method of estimating atmospheric delay developed by Tymofyeyev and Fialko [19] for the indirect detection of induced seismic events was presented.

2. Methods

A general equation of the interferometric phase Δ φ calculated from two SAR acquisitions ( t i and t j ) may be shown as follows:
Δ φ = 4 π λ ( Δ r d i s p i j + Δ r g e o m i j + Δ r a t m i j )
where: λ represents the carrier wavelength of the radar, Δ r d i s p i j is the ground displacement in radar LOS direction, Δ r g e o m i j repre sents the geometrical range difference from radar to the target caused by a nonzero spatial baseline between the two orbits, and Δ r a t m i j is the atmospheric delay, respectively.
As is the case with other methods for measuring deformations of ground surfaces or engineering structures, the currently used InSAR methods have significant limitations [20]. Apart from the unknown deformation component, a representative interferogram also includes other components which significantly influence the resulting value of the interferometric phase. The geometric part of the signal Δ r g e o m i j , which includes mainly orbit errors and topographic errors, may be relatively easy to separate. On the other hand, the atmospheric component ( Δ r a t m i j ), composed of ionospheric delay (ionospheric screen) and tropospheric delay, is one of the main areas in current research focused on increasing the accuracy of ground surface deformation calculations performed with the use of InSAR methods [21,22]. In order to determine the values and subsequently to eliminate the influence of errors related to the passing of the signal through the ionosphere and the troposphere, an iterative method was used, as proposed by Tymofyeyev and Fialko [19]. The main principle behind the method is that two (or more) interferograms having the same scene contain an identical (with respect to the value) atmospheric component of the phase due to wave propagation in the troposphere and in the ionosphere. Such an approach for determining the atmospheric component is empirical. The theoretical foundations of the methods are presented below.
Let us assume that we have two interferograms calculated on the basis of three images (in such case the acquisition times are t 1 , t 2 and t 3 , respectively—Figure 1). In the case of each interferogram, the equations will have the following form, respectively:
Δ ϕ 12 = Δ τ 12 + α 2 α 1 + ε 12 and Δ ϕ 23 = Δ τ 23 + α 3 α 2 + ε 23
where α i —atmospheric component due to signal propagation among others in the atmosphere and in the ionosphere, in time t i and Δ τ i j is the phase component related to the observed ground surface deformations in time t i j .
At this stage, an additional assumption should be formulated that the Δ ϕ 12 Δ ϕ 23 difference is independent of the deformation component on condition that the time base is constant and deformation increments are constant in time. This assumption is of key importance for the results presented in this paper. It is also similar to the properties of other empirical methods employed to eliminate atmospheric delays in InSAR calculations [23].
The accuracy of the determined atmospheric component of the phase increases together with the number of interferograms for larger aperture of the averaging stencil N. The general equation describing atmospheric component has the following form:
α i = lim N 1 2 N j = 1 N Δ ϕ i ( i j ) Δ ϕ ( i + j ) i = lim N 1 2 N j = 0 N 1 ( N j ) [ Δ ϕ ( i j ) ( i j 1 ) Δ ϕ ( i + j + 1 ) ( i + j ) ]
The above-described method has been implemented among others in the SBAS time series method. It was successfully employed in seismically active regions of California and Mexico [19,24].
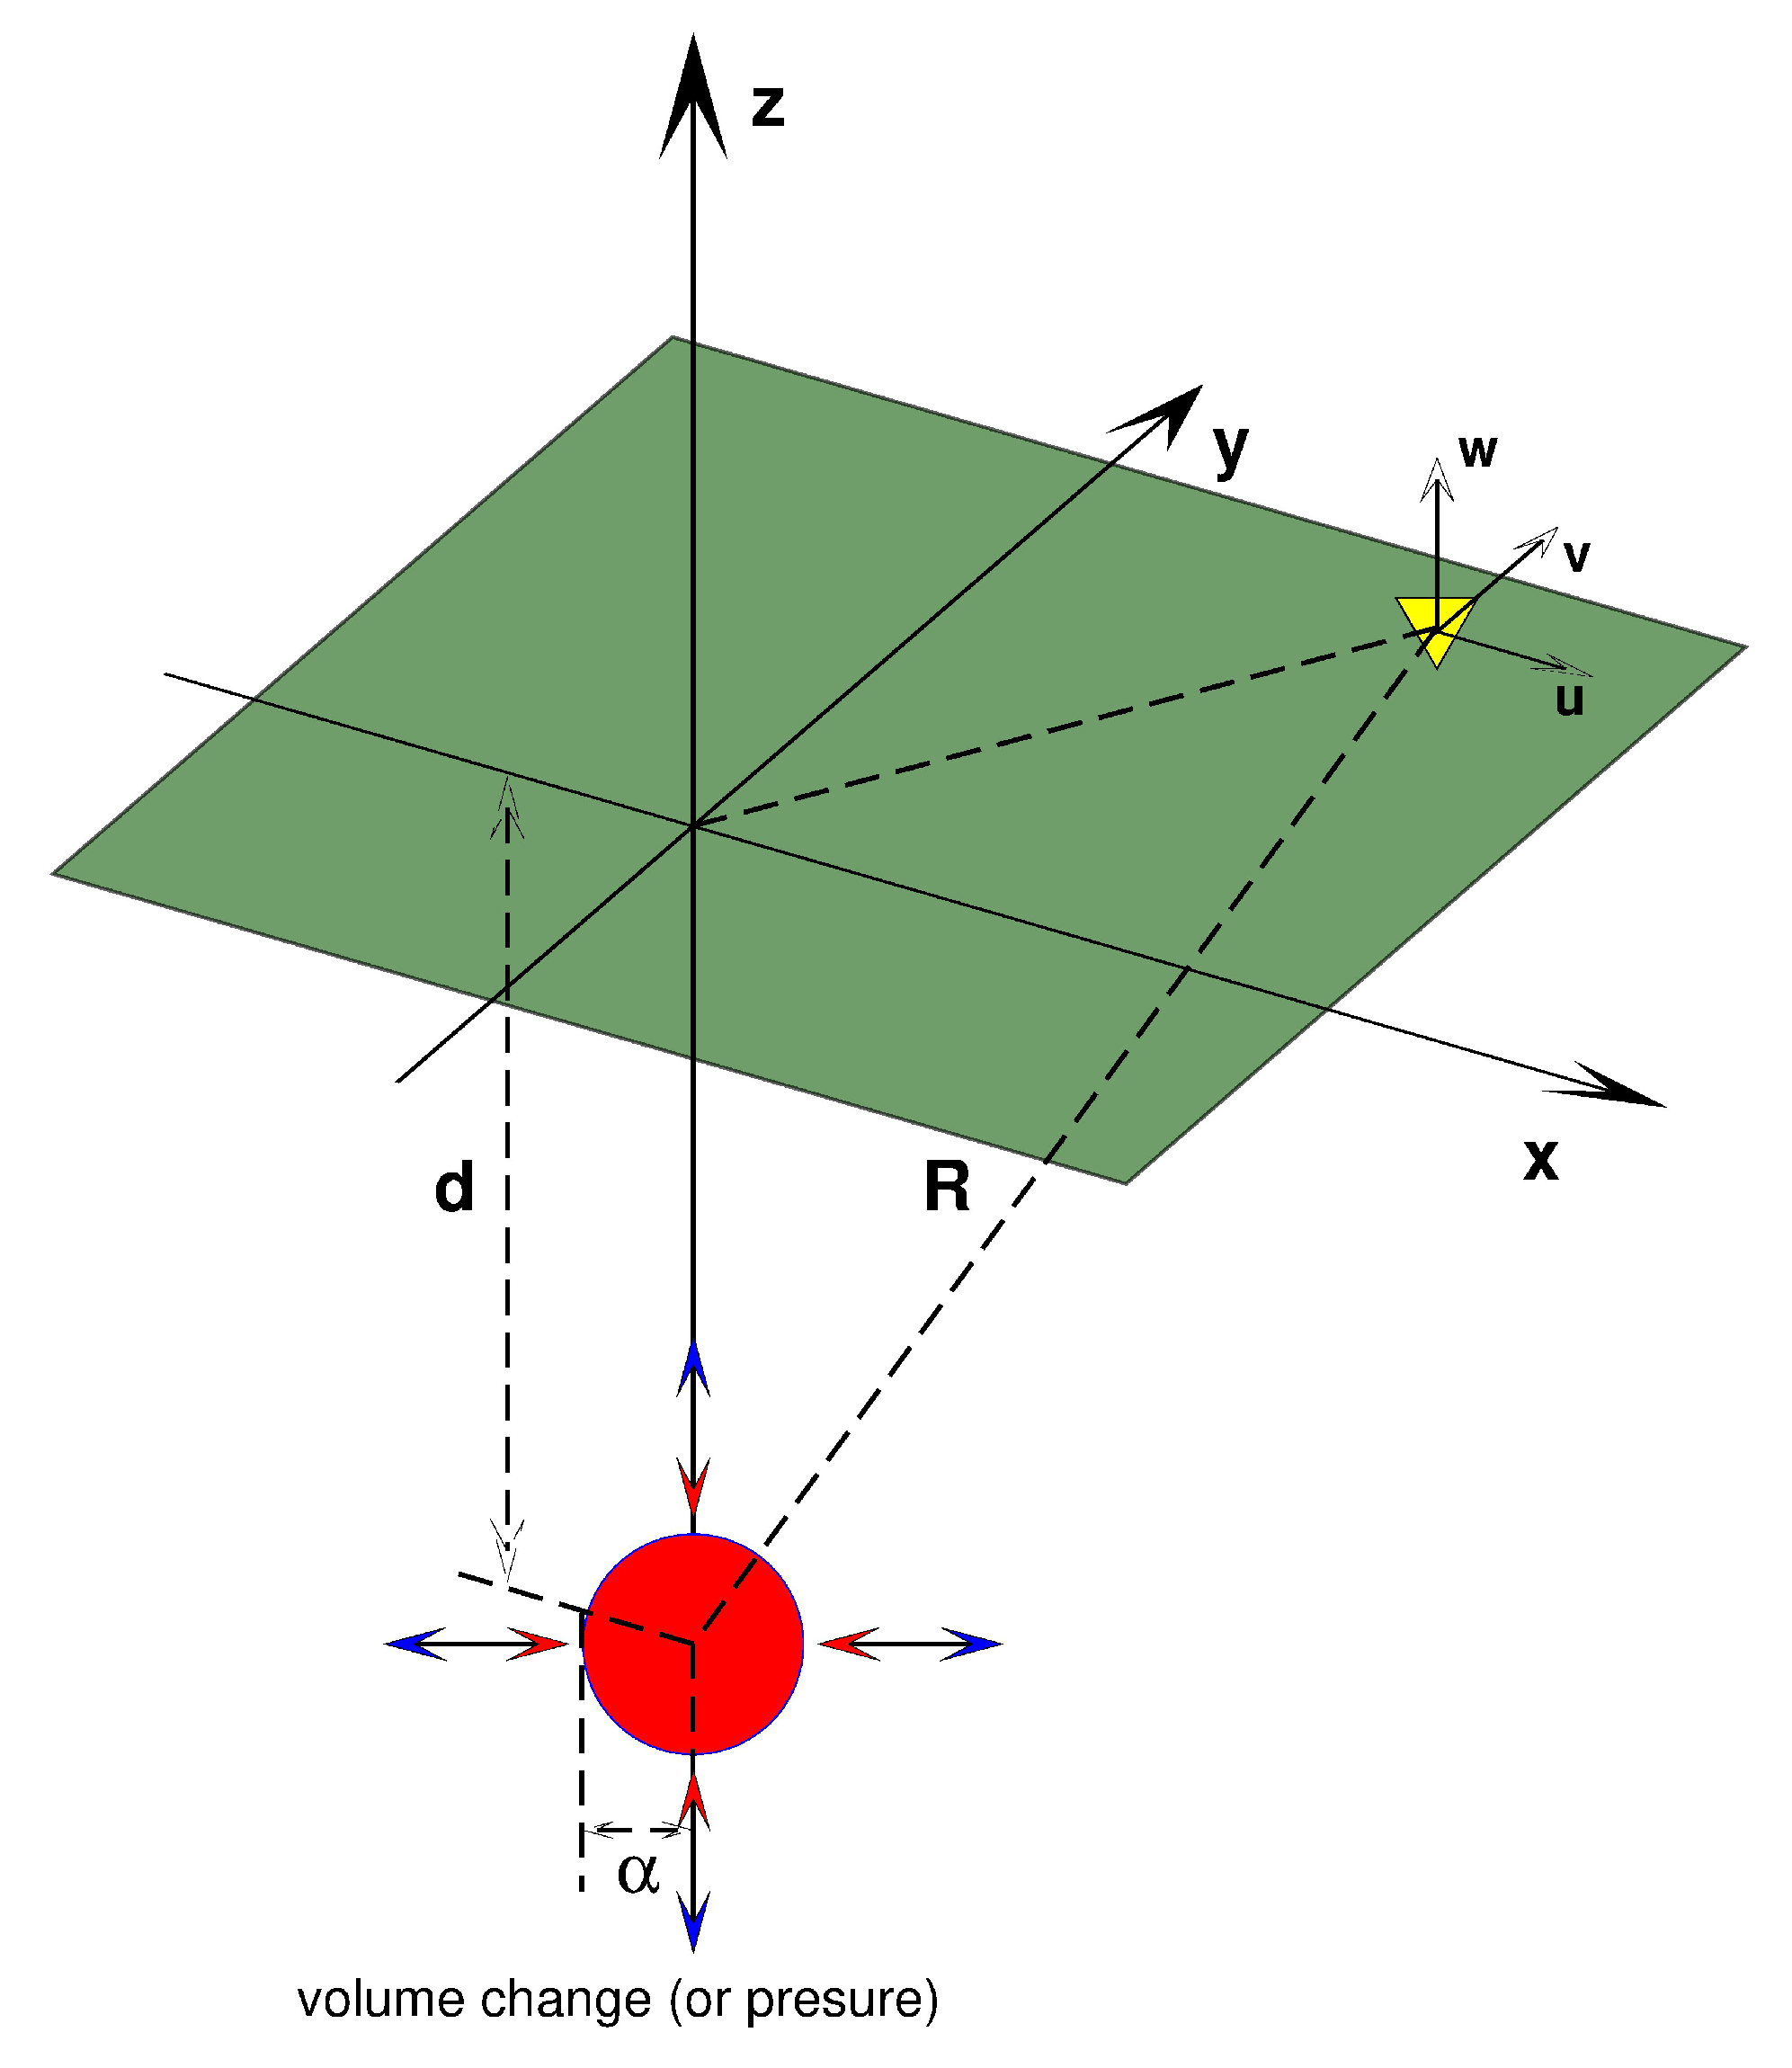
The method was verified with three test models. The data were prepared on the basis of the Mogi model [25], which was developed to test ground deformations in the vicinity of volcanoes. However, the universal character of the model allows a number of further applications [26,27,28,29]. The Mogi model (Figure 2) is an analytical model, which describes the magnitude and the direction of ground displacements due to changed volume or pressure of a point in a uniform elastic half space. The displacements of any point on the surface can be calculated from the following equation:
u v w = Δ V ( 1 ν ) π x / R 3 y / R 3 z / R 3
The main purpose of using the Mogi model, as well as the test calculations was to check how the empirical model of atmospheric delay estimation [19] will affect the results of displacement calculations in the case of an induced seismic event. Taking into consideration one of the assumptions of the model stating that displacements are constant in time, it was checked whether in the case of a mining tremor, it will be possible to extract the signal caused by this tremor. If so, the model proposed by Tymofyeyev and Fialko could be used to determine the impact of mining tremors on the surface indirectly. Detection of the impact of mining tremors in real conditions based on SAR data is often limited. It arises from the fact that intensive and large scale underground mining (e.g., the LGOM area) causes numerous local areas of subsidence—the so-called subsidence basins. In the majority of known cases, the impact of mining tremor is observed within the limits of existing subsidence basins. This is an additional difficulty in determining the impact of mining tremors on the surface.

3. Area of Study

Copper ore is mined in the southwest part of Poland. The mining areas having total surface exceeding 750 km 2 are located in the Fore Sudetic monocline, whose structure was shaped during the Cimmerian and Laramie movements. The copper ore deposit in this region is located in the roof part of the Rotliegend and in the floor part of the Zechstein. The ore is currently extracted at a depth of over 1100 m below the terrain surface. The LGCB comprises seven mining areas (Figure 3) operated by three mining plants. Copper ore is mined using the room and pillar system. In the case of the LGCB, the level of continuous ground surface deformations is consistent with the range of a particular deposit within an area of the copper belt. The scale of deformations is mostly influenced by the thickness of the mined rock mass and by the method applied to the liquidation of the mined-out areas. Induced tremors observed in the region are related to the type of rock in the roof layers of the mined deposit. Every year, the region suffers from several seismic events exceeding magnitude Mw 4.0. The simultaneous occurrence of mining-related deformations, mining tremors and deformations due to rock mass drainage makes the LGCB region a valuable area of research into the influence of mining activity on the surface.

4. Data Time Series Processing

The calculations of the satellite radar data were based on the SBAS method [30,31,32] and with simultaneous allowance for the method of reducing the influence of the atmosphere [19]. As the results could not be compared with the results from other measurement methods (GNSS, precise leveling), the calculations were performed independently for both paths. The analyzed period spanned the years from 2014 to 2018 (Table 1).

4.1. Test Calculations: Application of the Mogi Model

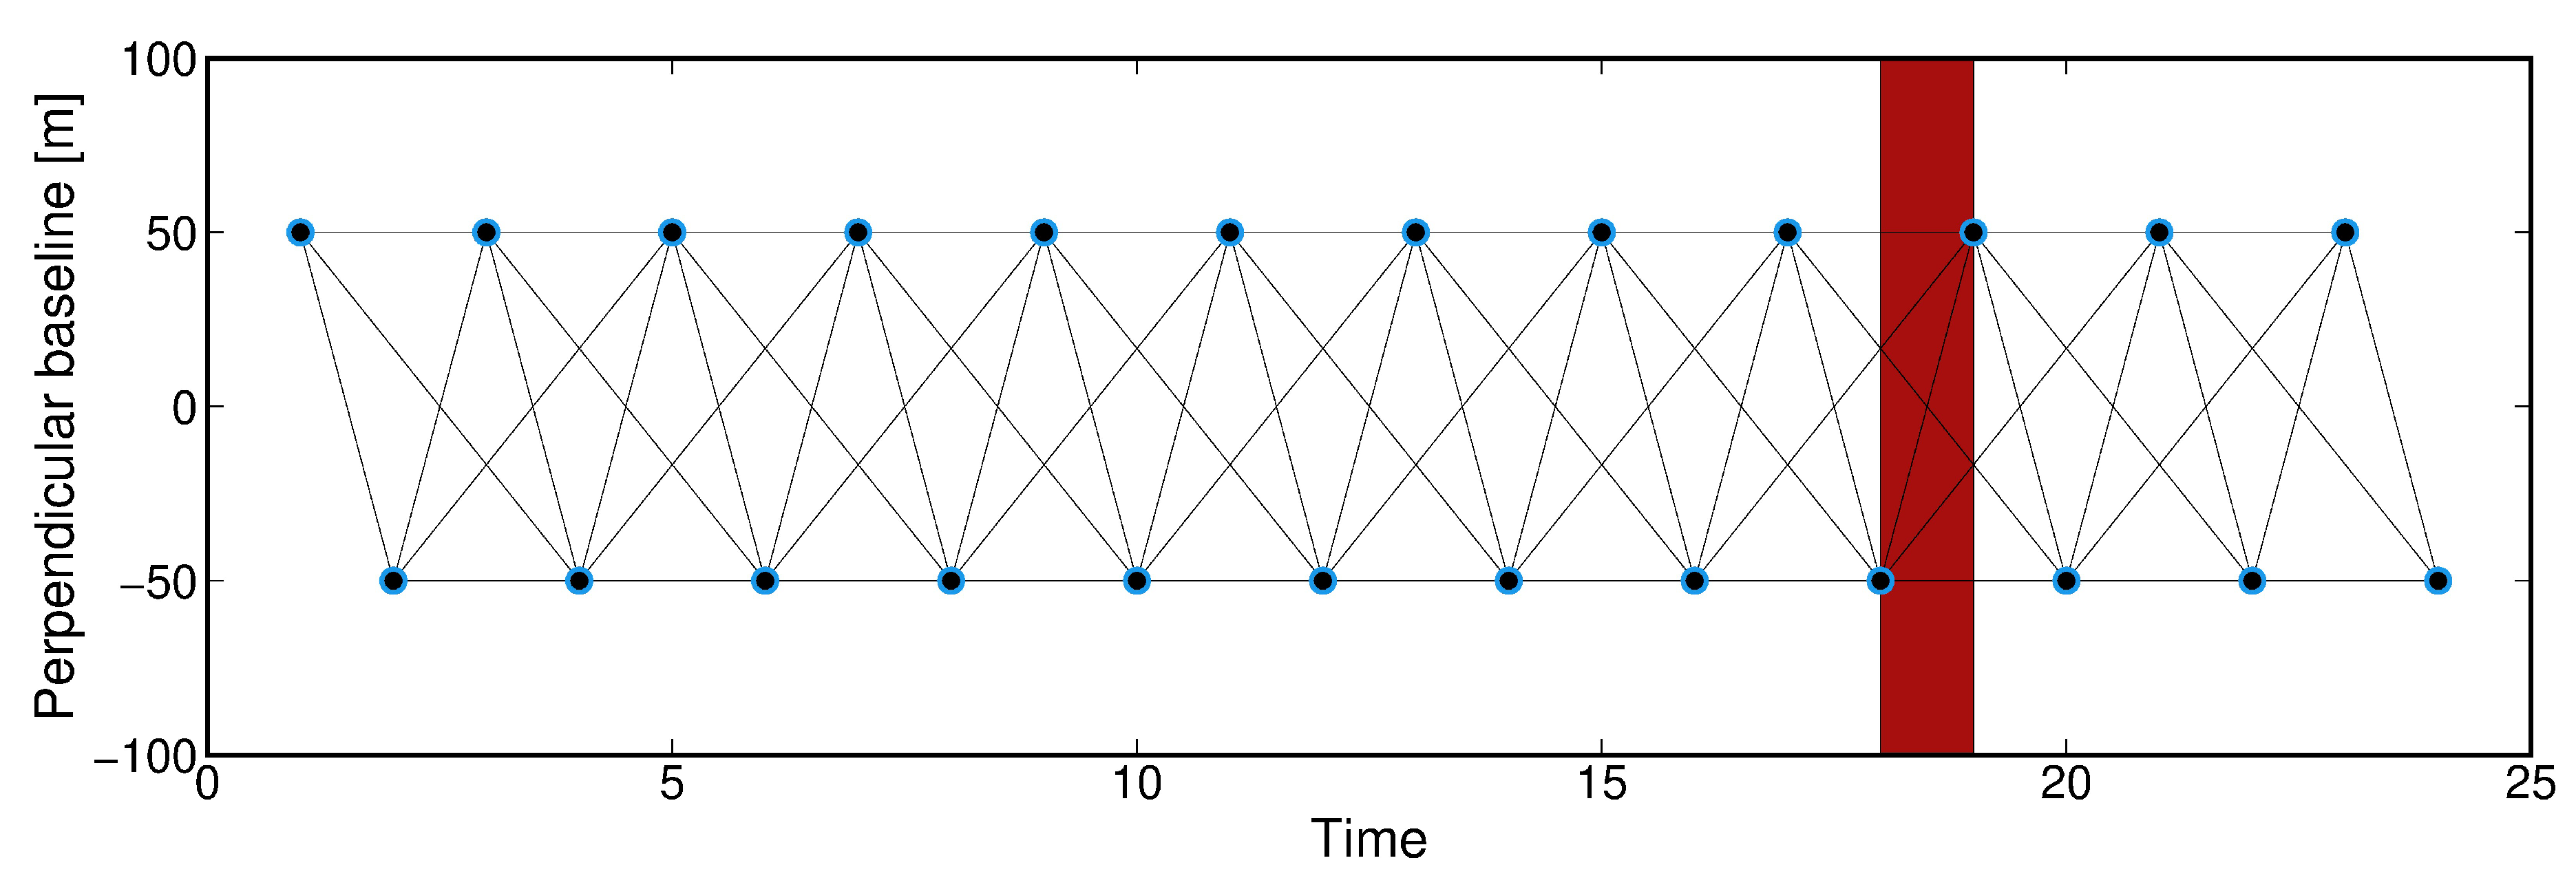
The aim of the test calculations was to verify the empirical solution for the reduction of atmospheric disturbances in the phase signal of the interferogram, as suggested by Fialko. In order to simulate ground surface subsidence due to underground mining activity, the Mogi model was employed, as it allowed simulations of mining at a set depth. 24 time periods were assumed ( t 1 t 24 ) between which time-constant ground surface subsidences of −40 mm occurred due to mining activity at a depth of 500 m. The time interval between the periods was constant. Figure 4 shows baseline plot for the test data. The spatial range of the test data was 10 × 10 km.
Based on the defined assumptions, three independent calculation cases were prepared:
(I)
mining activity without a mining tremor,
(II)
mining activity with a mining tremor recorded between t 18 and t 19 , the tremor having occurred exactly in the center of the already existing subsidence trough,
(III)
mining activity with a mining tremor recorded between t 18 and t 19 , but unlike in case (II) the tremor occurred outside the mining area influenced by mining operations and was located at a distance of approximately 3 km from the center of the already existing subsidence trough.

4.2. Calculations for the Lgcb Region

The calculations of the interferograms were based on two-pass processing with the use of GMTSAR ver. 5.4.4 [70]. Phase unwrapping was performed the with Snaphu ver. 1.4.2 application [71]. Wave phase correction in relation to the ground surface was performed with the data from Shuttle Radar Topography Mission (SRTM) version 1 [72]. The enhanced spectral diversity (ESD) algorithm was not used at the preprocessing stage. This algorithm may remove some part of the atmospheric component in the burst boundaries [24]. Basic information on the dataset for the analyzed paths is provided in Table 2. Figure 5 shows the calculated interferometric pairs.

5. Results

5.1. Test Calculations—Application of the Mogi Model

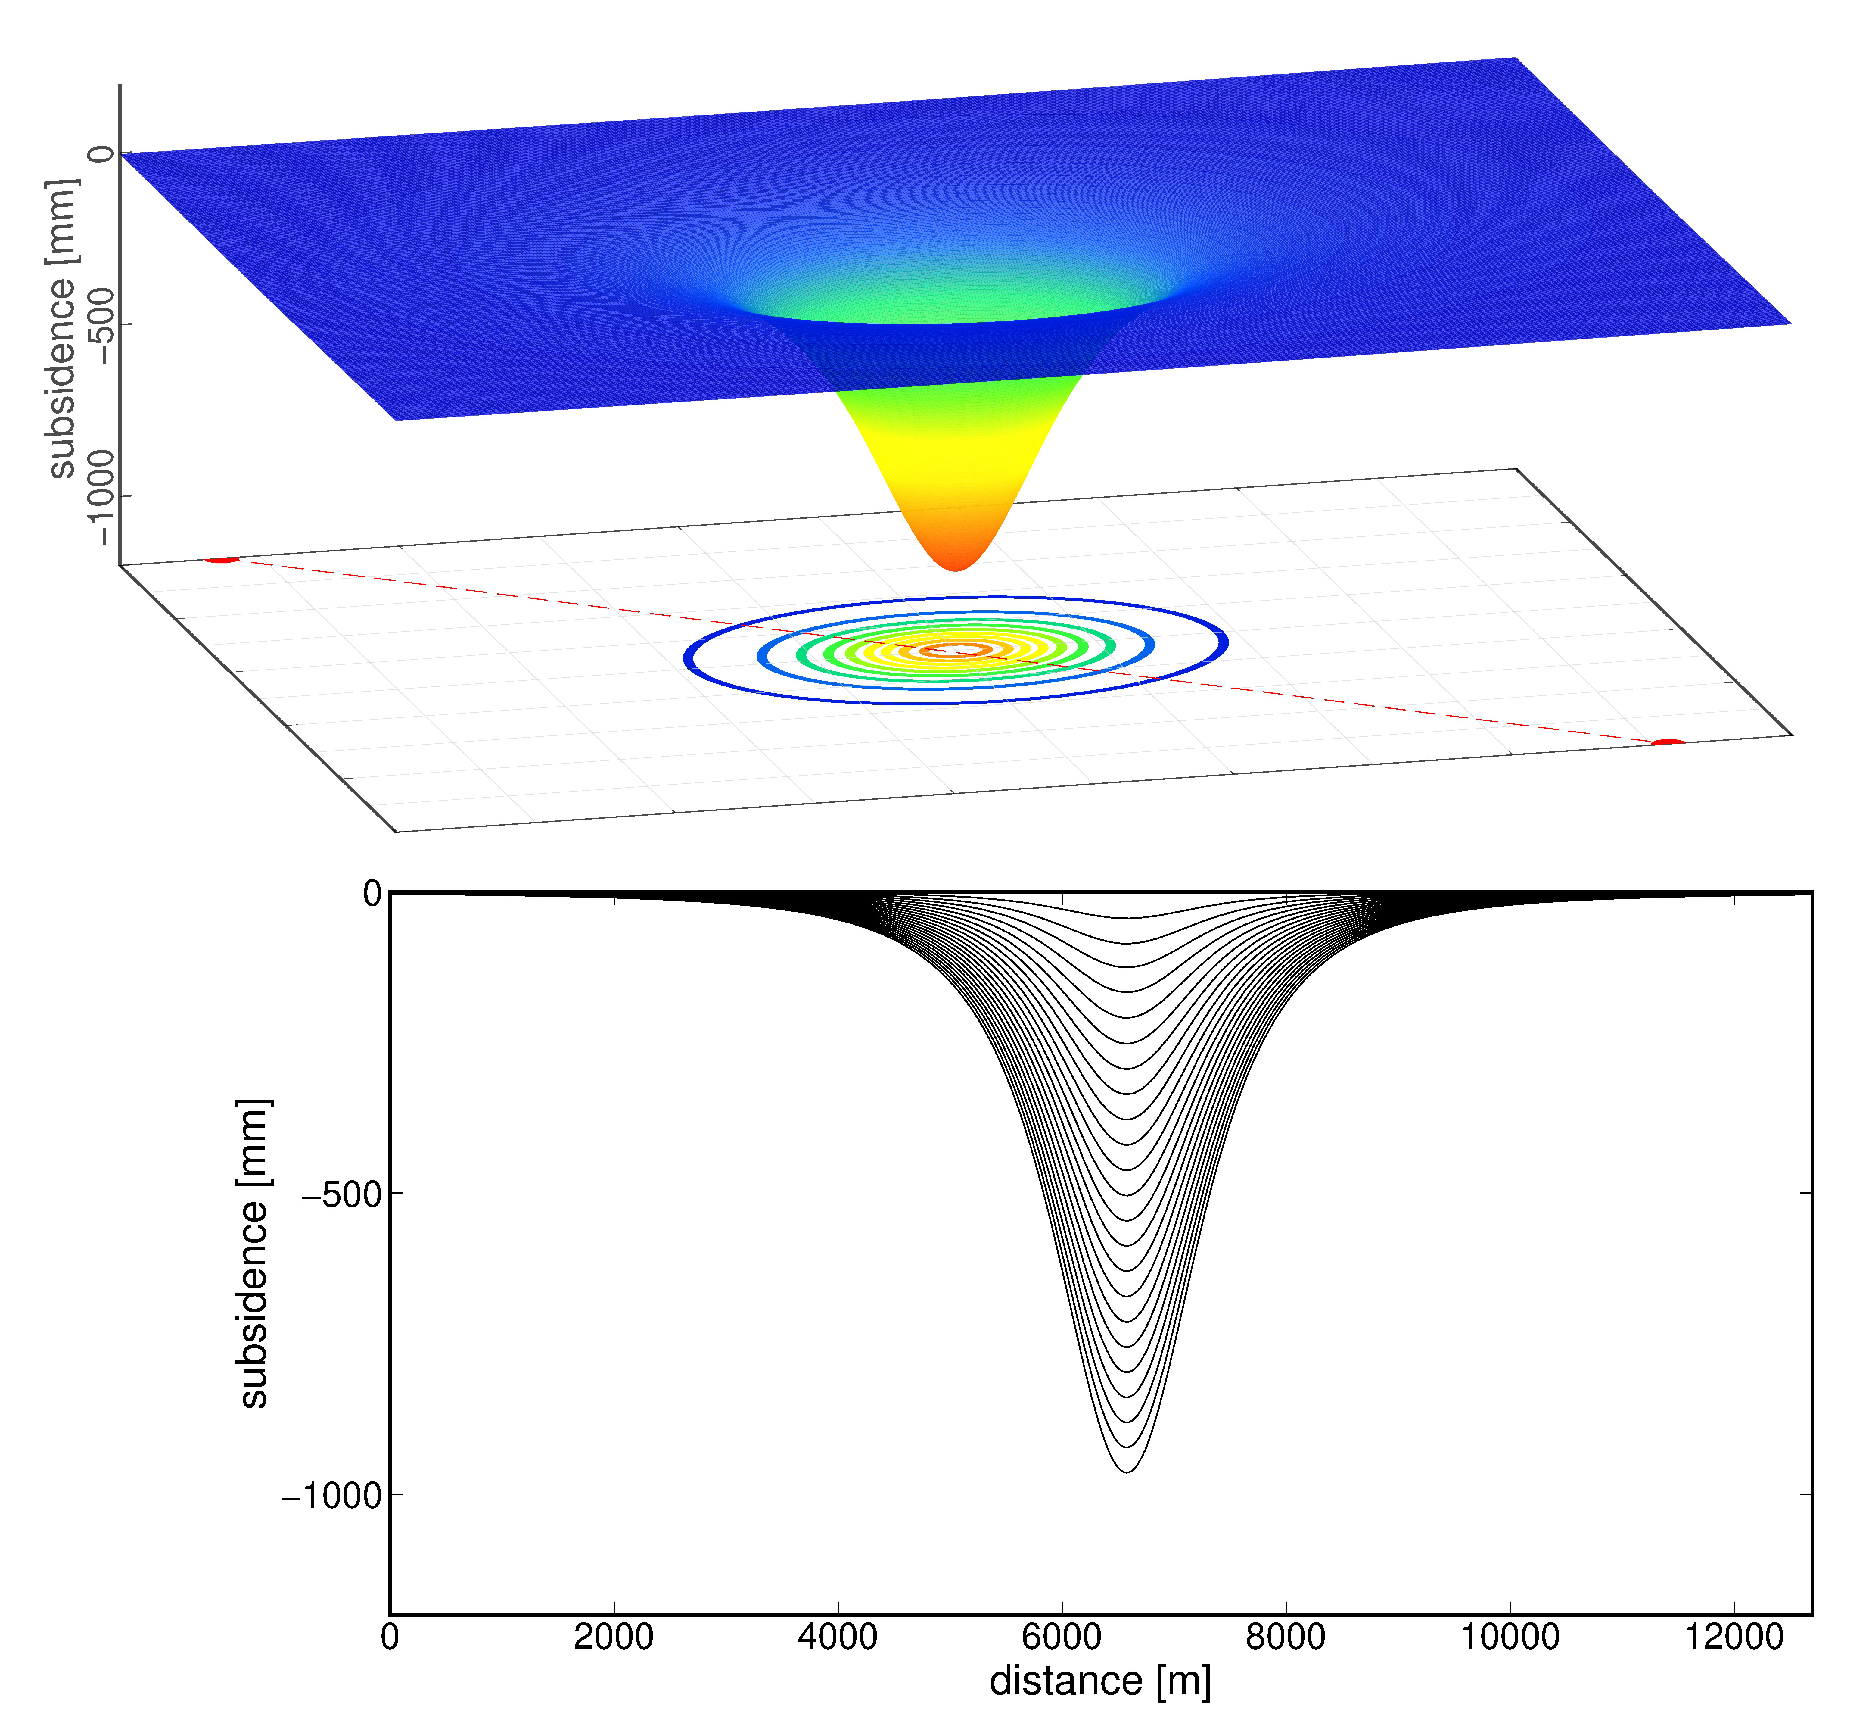
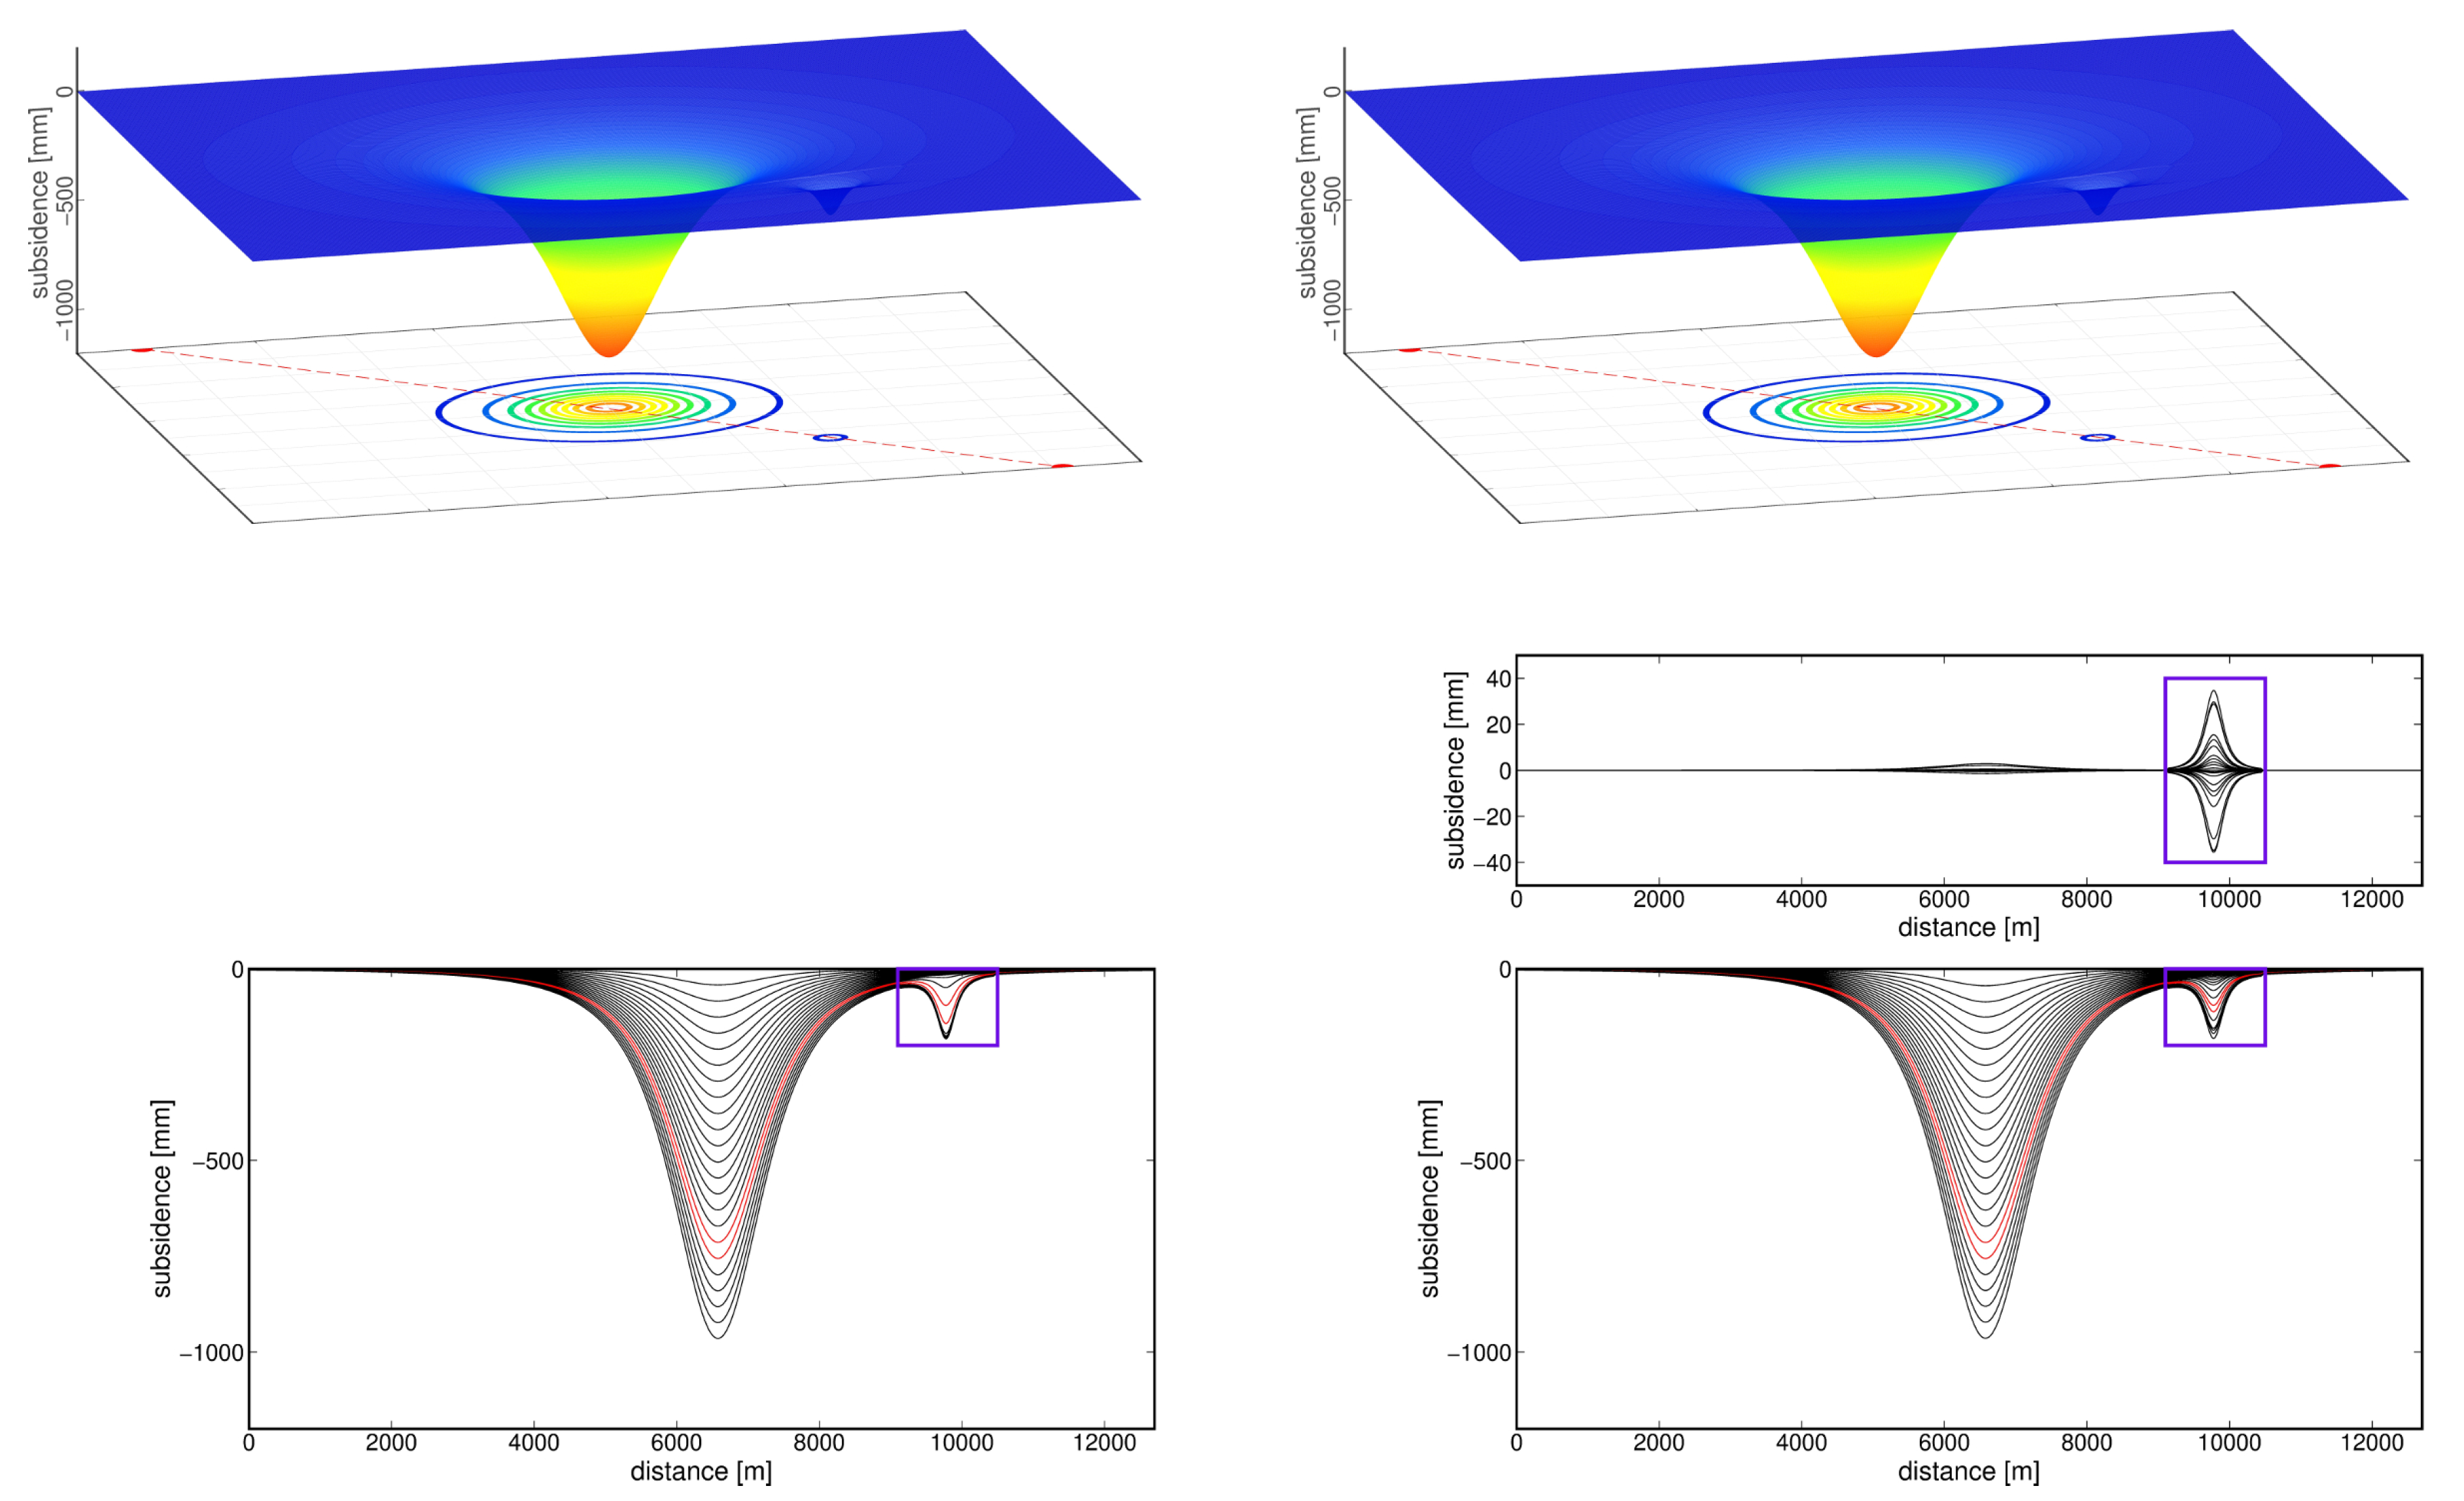
In the first case, without a mining tremor, maximum ground subsidence was −969 mm. Figure 6 shows subsidence increments along a selected profile and allows an observation that increments are constant between subsequent periods. As is expected, no significant values of atmospheric component are observed.
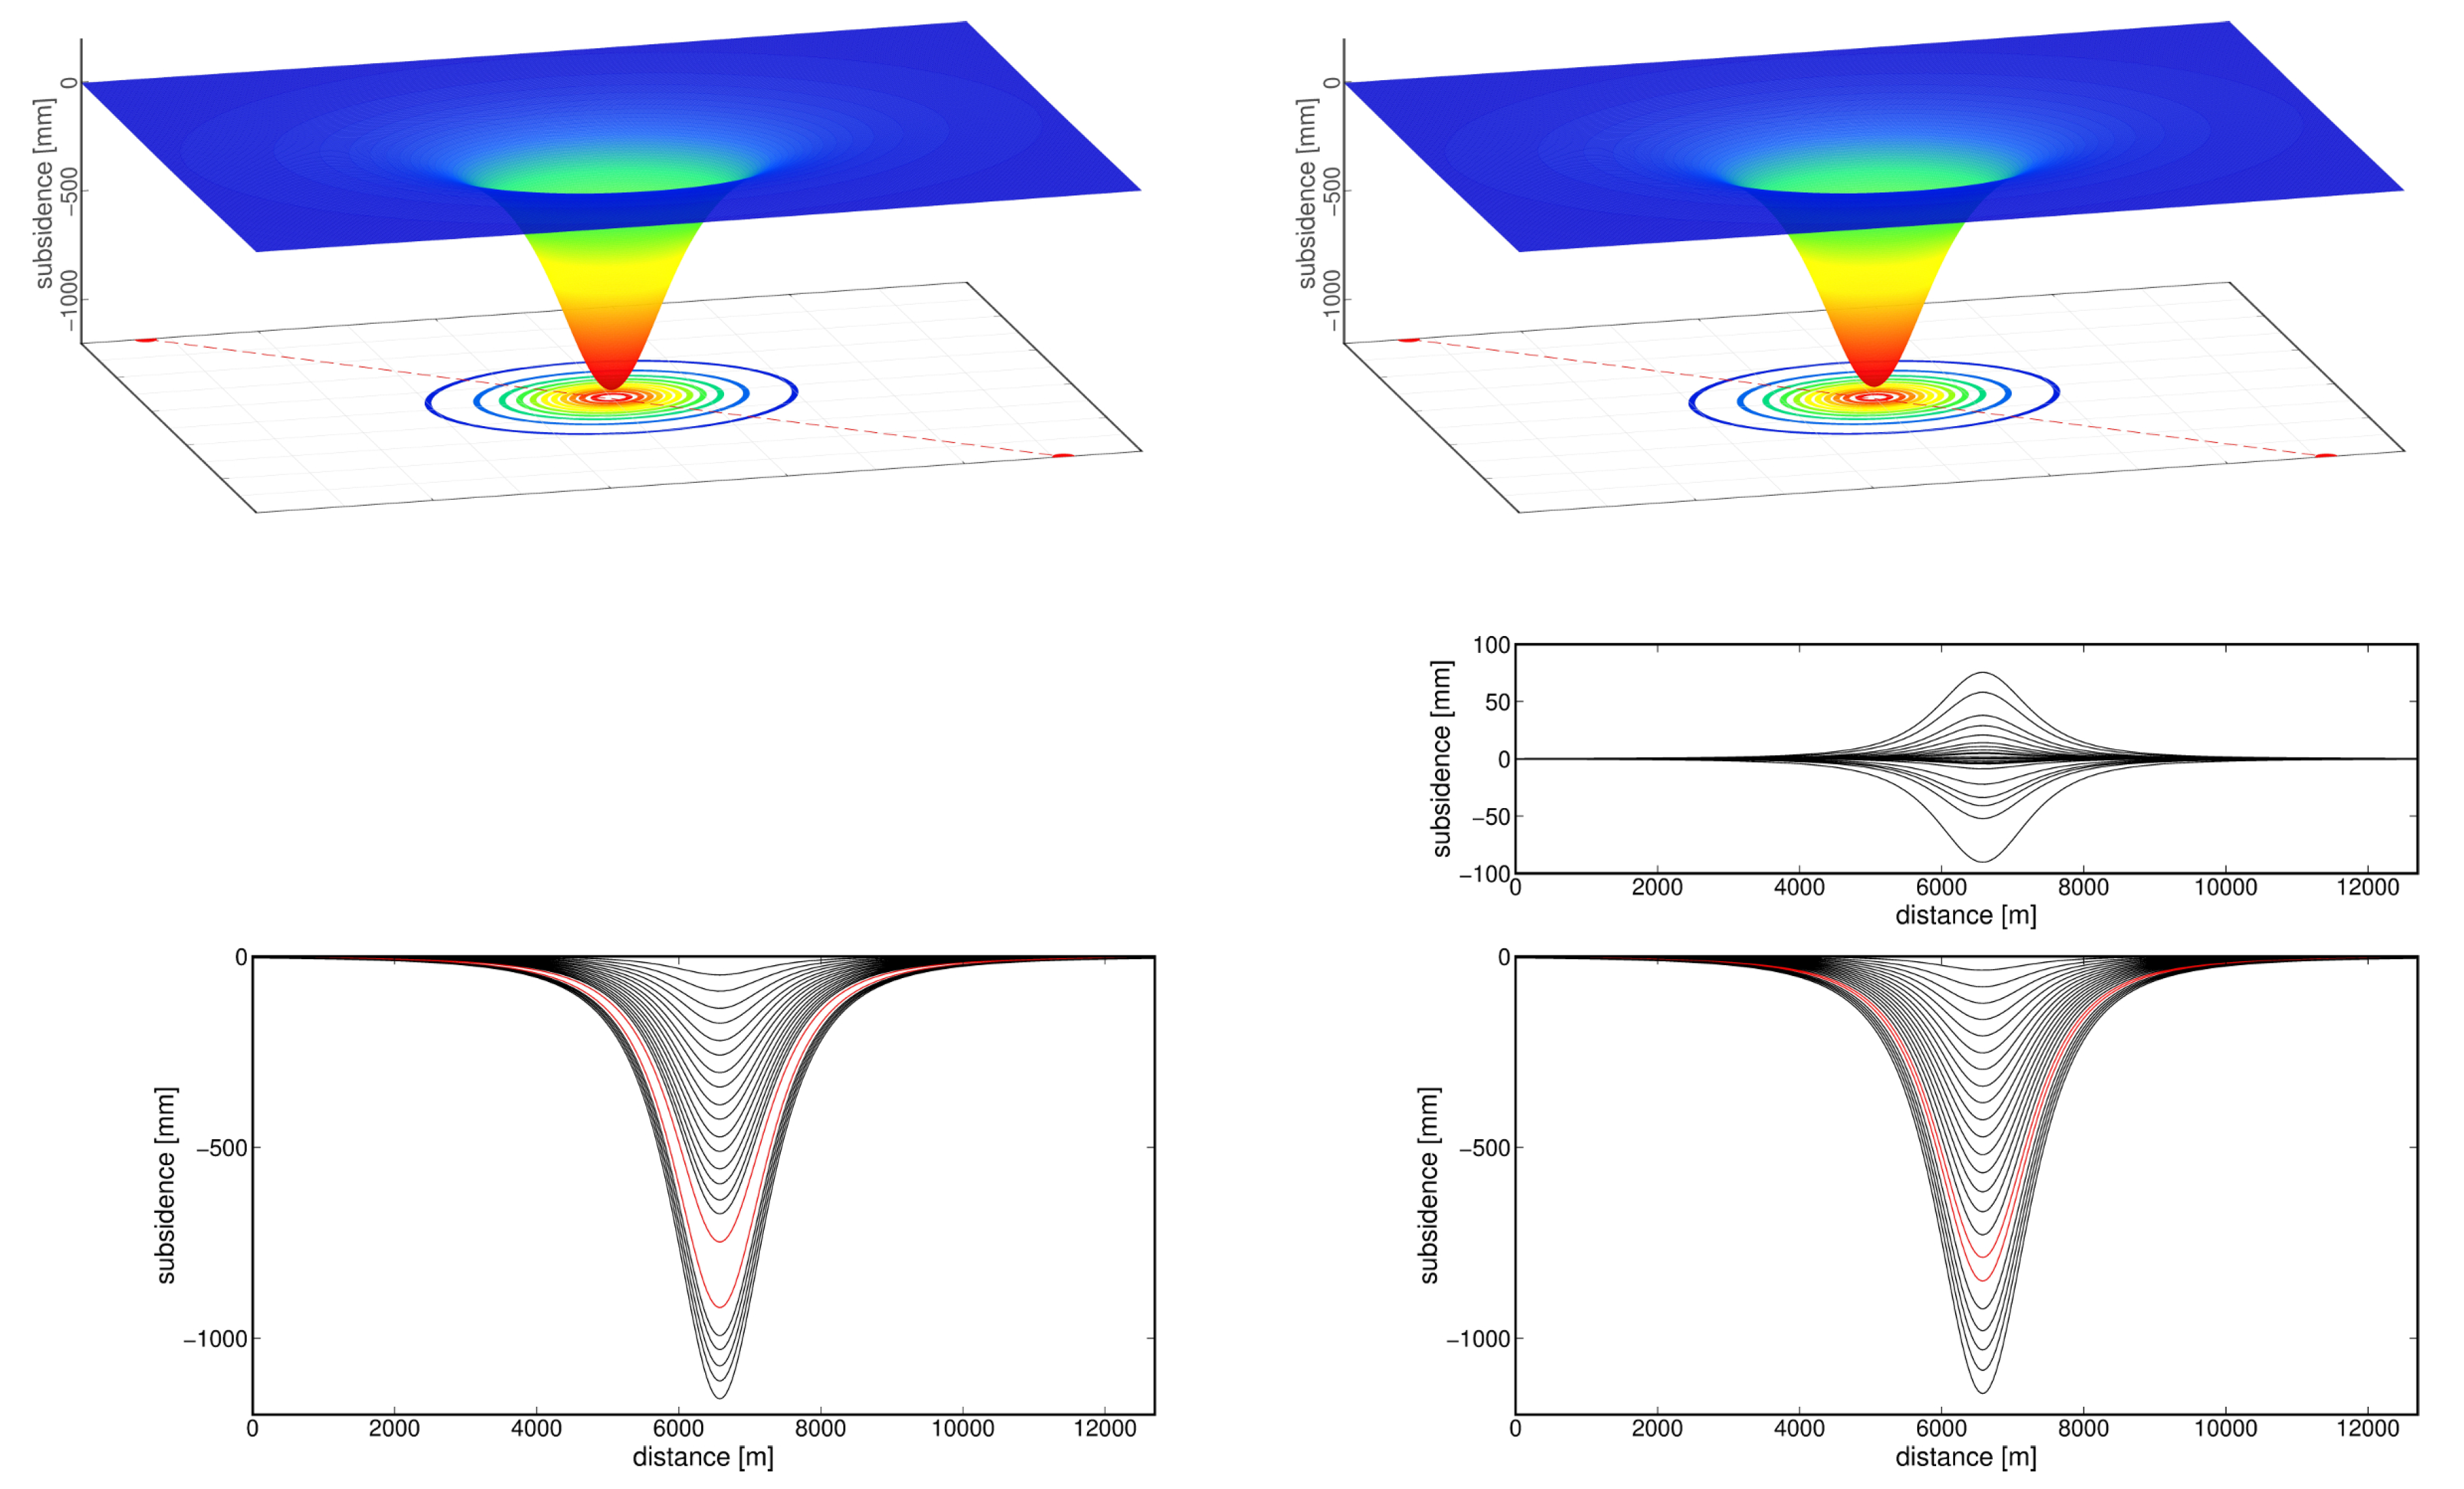
In the second analyzed case (Figure 7), a tremor was assumed in the period between t 18 and t 19 . In this scenario, total subsidence was −1150 mm. The graph (Figure 7, right-hand side, in the middle), shows the values of the determined atmospheric corrections. Corrections having maximum values between −90 and +75 mm were observed in the periods directly before and after the tremor ( t 18 and t 19 ). Another observation points to the fact that significant values of atmospheric corrections occur in all data which formed interferometric pairs with the t 18 period (see: Figure 4—baseline plot). At the same time, the value of the subsidence between periods t 18 and t 19 was −61 mm.
The third case also involved a mining tremor between periods t 18 and t 19 . While in the previous case the tremor was located exactly in the already existing subsidence trough, the tremor in this scenario occurred outside the surface area influenced by mining activity (Figure 8).
The tests proved that allowance for atmospheric delay reduction in SBAS calculations does not affect or distort the calculated displacement results. However, the test calculations demonstrated that in the case of a sudden event (e.g. a seismic event), the image of the event is to some an extent recorded in the atmospheric component of the signal.

5.2. Calculations for the Lgcb Region

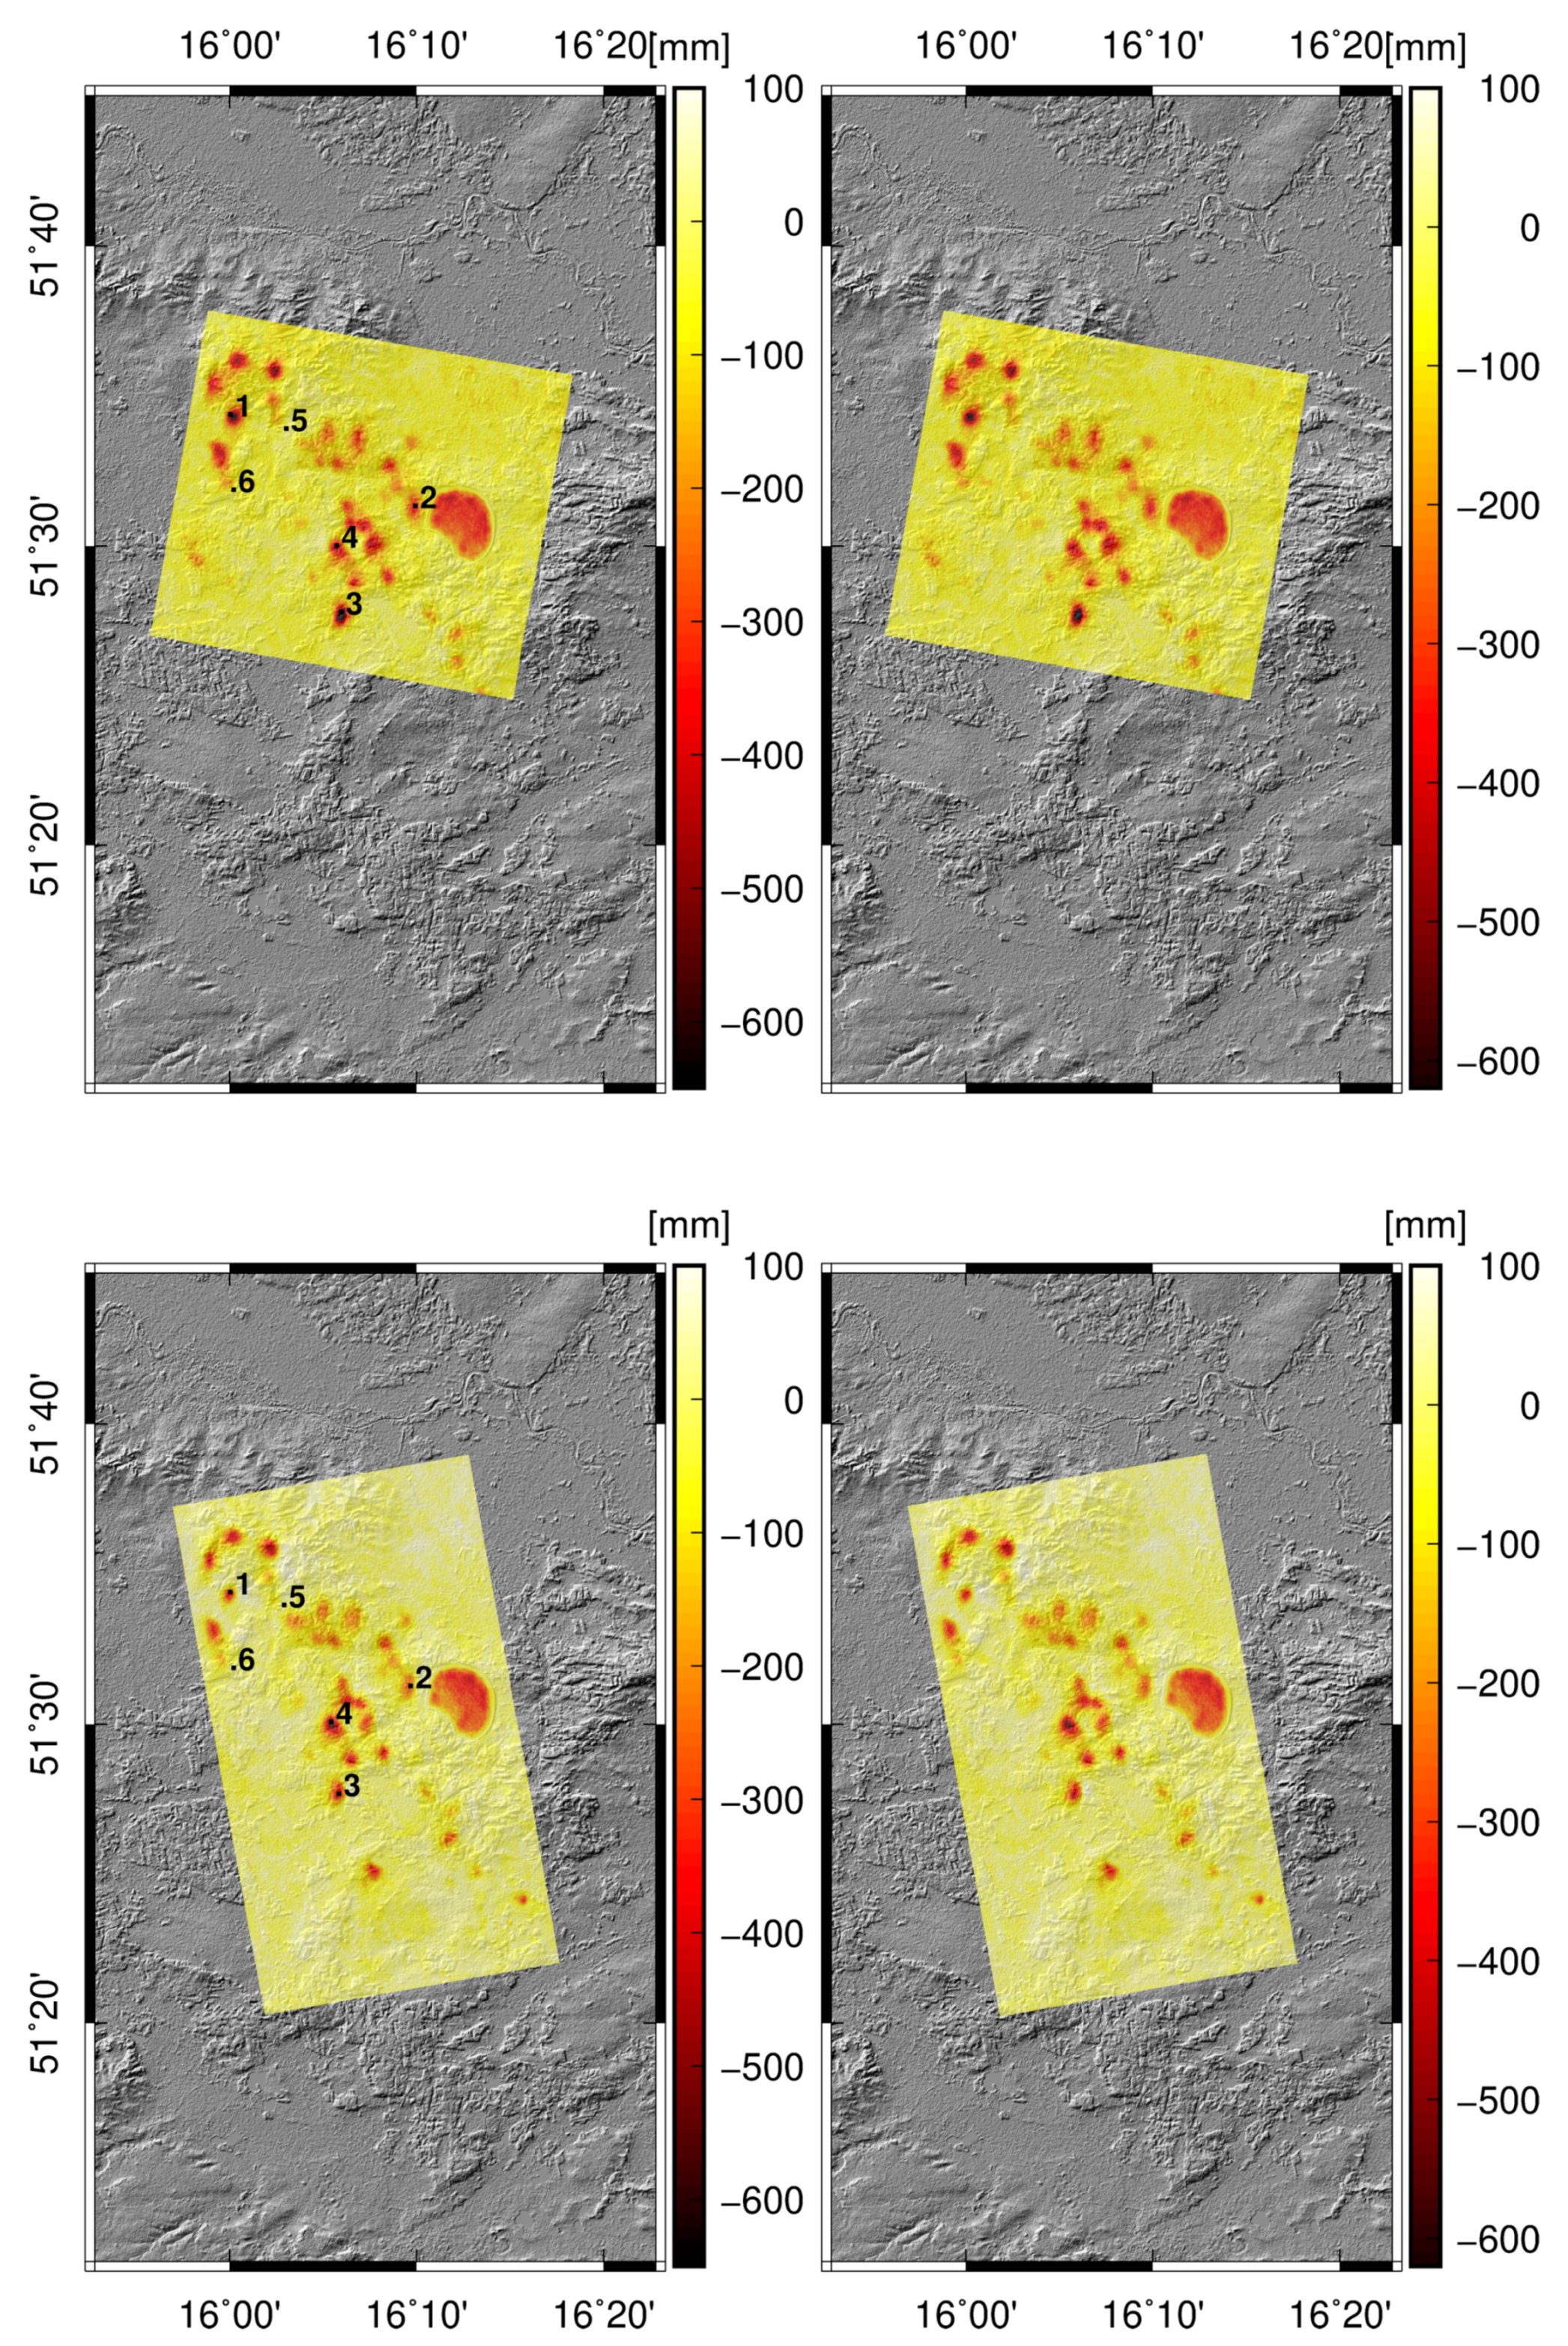
SBAS calculations of the data obtained from the Sentinel 1A/B satellites allowed identification of 27 regions in which underground mining activity influences the ground surface. Total displacements for paths 22 and 73 (Figure 9) without and with allowance for atmospheric correction are insufficient to estimate the influence of the model on the final results. Therefore, a more detailed analysis of the obtained results is offered in the Discussion section.
Graphs representing ground subsidence were also plotted for a selected area (Figure 10). The results for the complete period subjected to analysis clearly demonstrate that the influence of underground mining on the surface is constant. This fact is of key importance in the context of the method for atmospheric delay reduction used in the calculations. Analysis of the displacements indicates regions in which successive curves intersect. In some locations, especially those in which the observed subsidences are small-scale, subsidence increments are inconsistent. In the majority of the graphs, however, successive curves have similar shapes, with a certain offset. This observation confirms the quality of the results obtained for the analyzed area. It also proves that SAR data and the method are useful in monitoring this type of phenomena on the ground surface.

6. Discussion

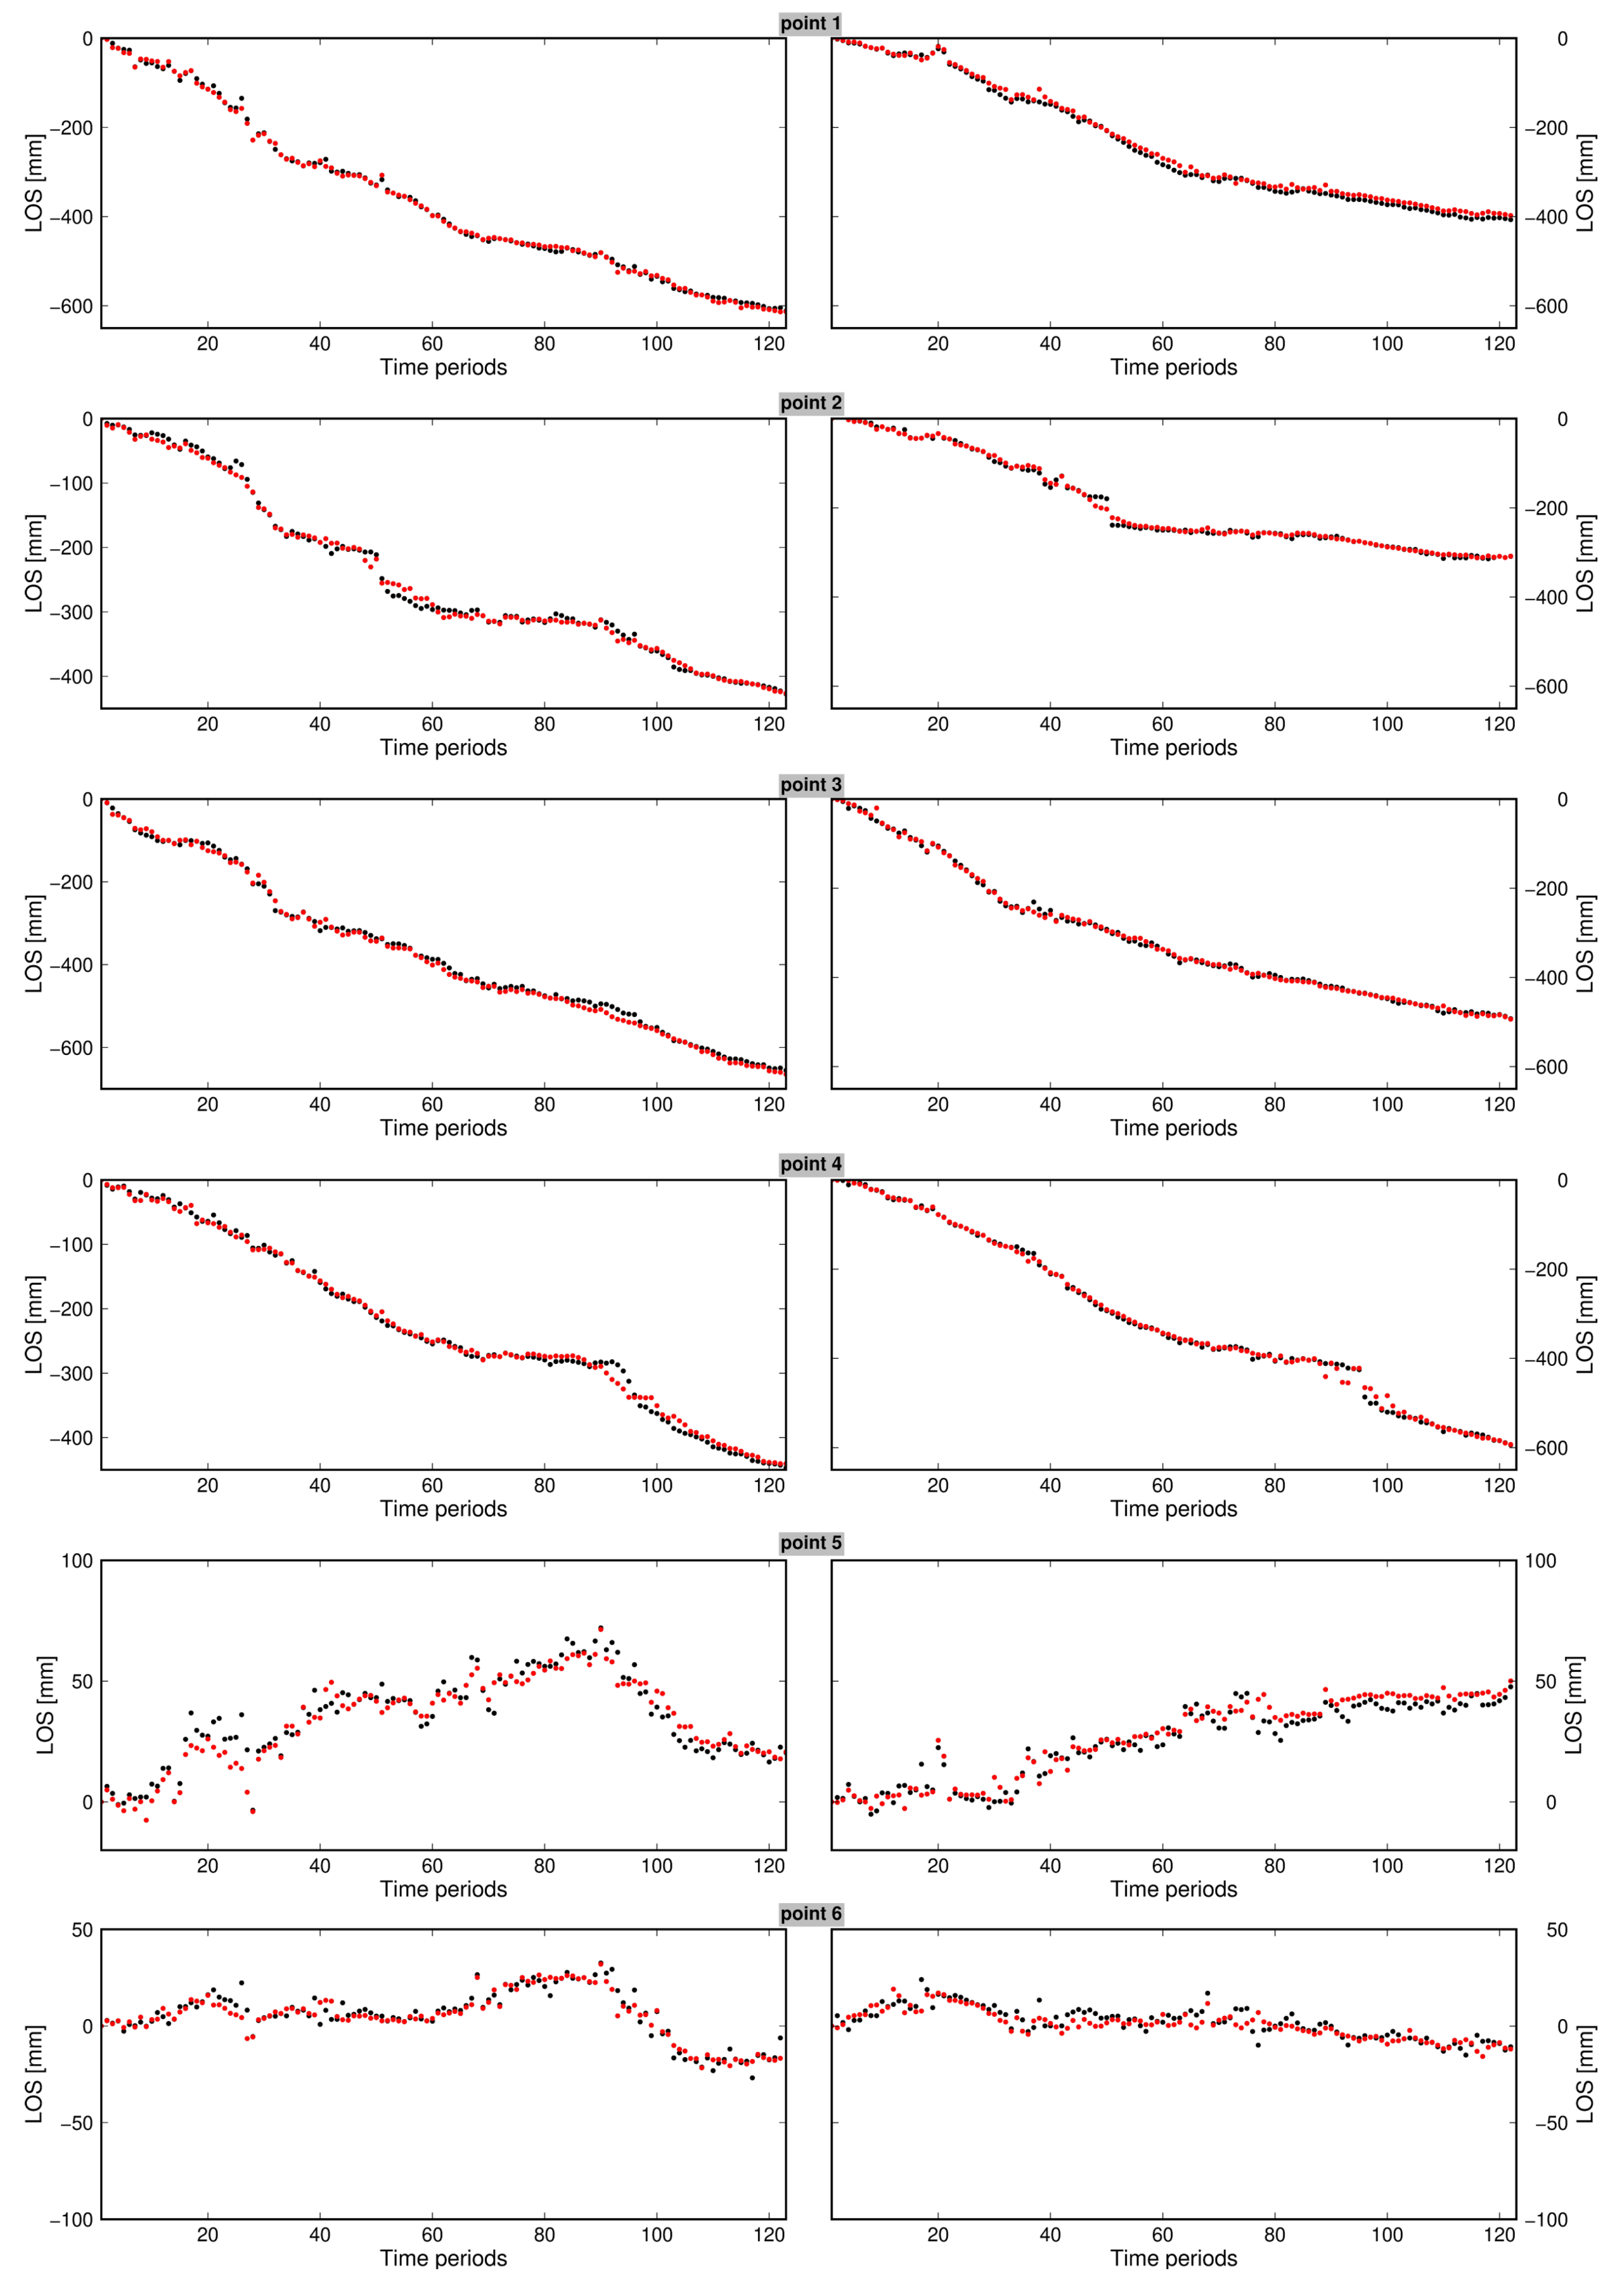
Section 5.2 presents the calculation results for ground displacements in mining areas. The results allow an observation that SAR data (in particular data obtained from new satellites) may successfully supplement information gathered with the help of methods commonly used to measure ground surface deformations. First, however, it was necessary to determine the degree to which the Fialko method influences final results in the SBAS calculations. Figure 11 provides the results of LOS displacements for selected points with and without allowance for atmospheric correction. Based on the graphs, a conclusion may be offered that the obtained displacement results (without allowance for atmospheric correction) show limited disturbances. The results for the points located in selected subsidence troughs demonstrate a clear trend downwards, due to the progress of mining works. No points were observed to have outlying values. As a result, the values of displacements with allowance for atmospheric correction are similar to the original values. The differences between the results reach more than ten millimeters, but are seldom greater than several tens of millimeters. Significantly higher values are observed in areas not affected by mining activities (points 5 and 6, Figure 11).
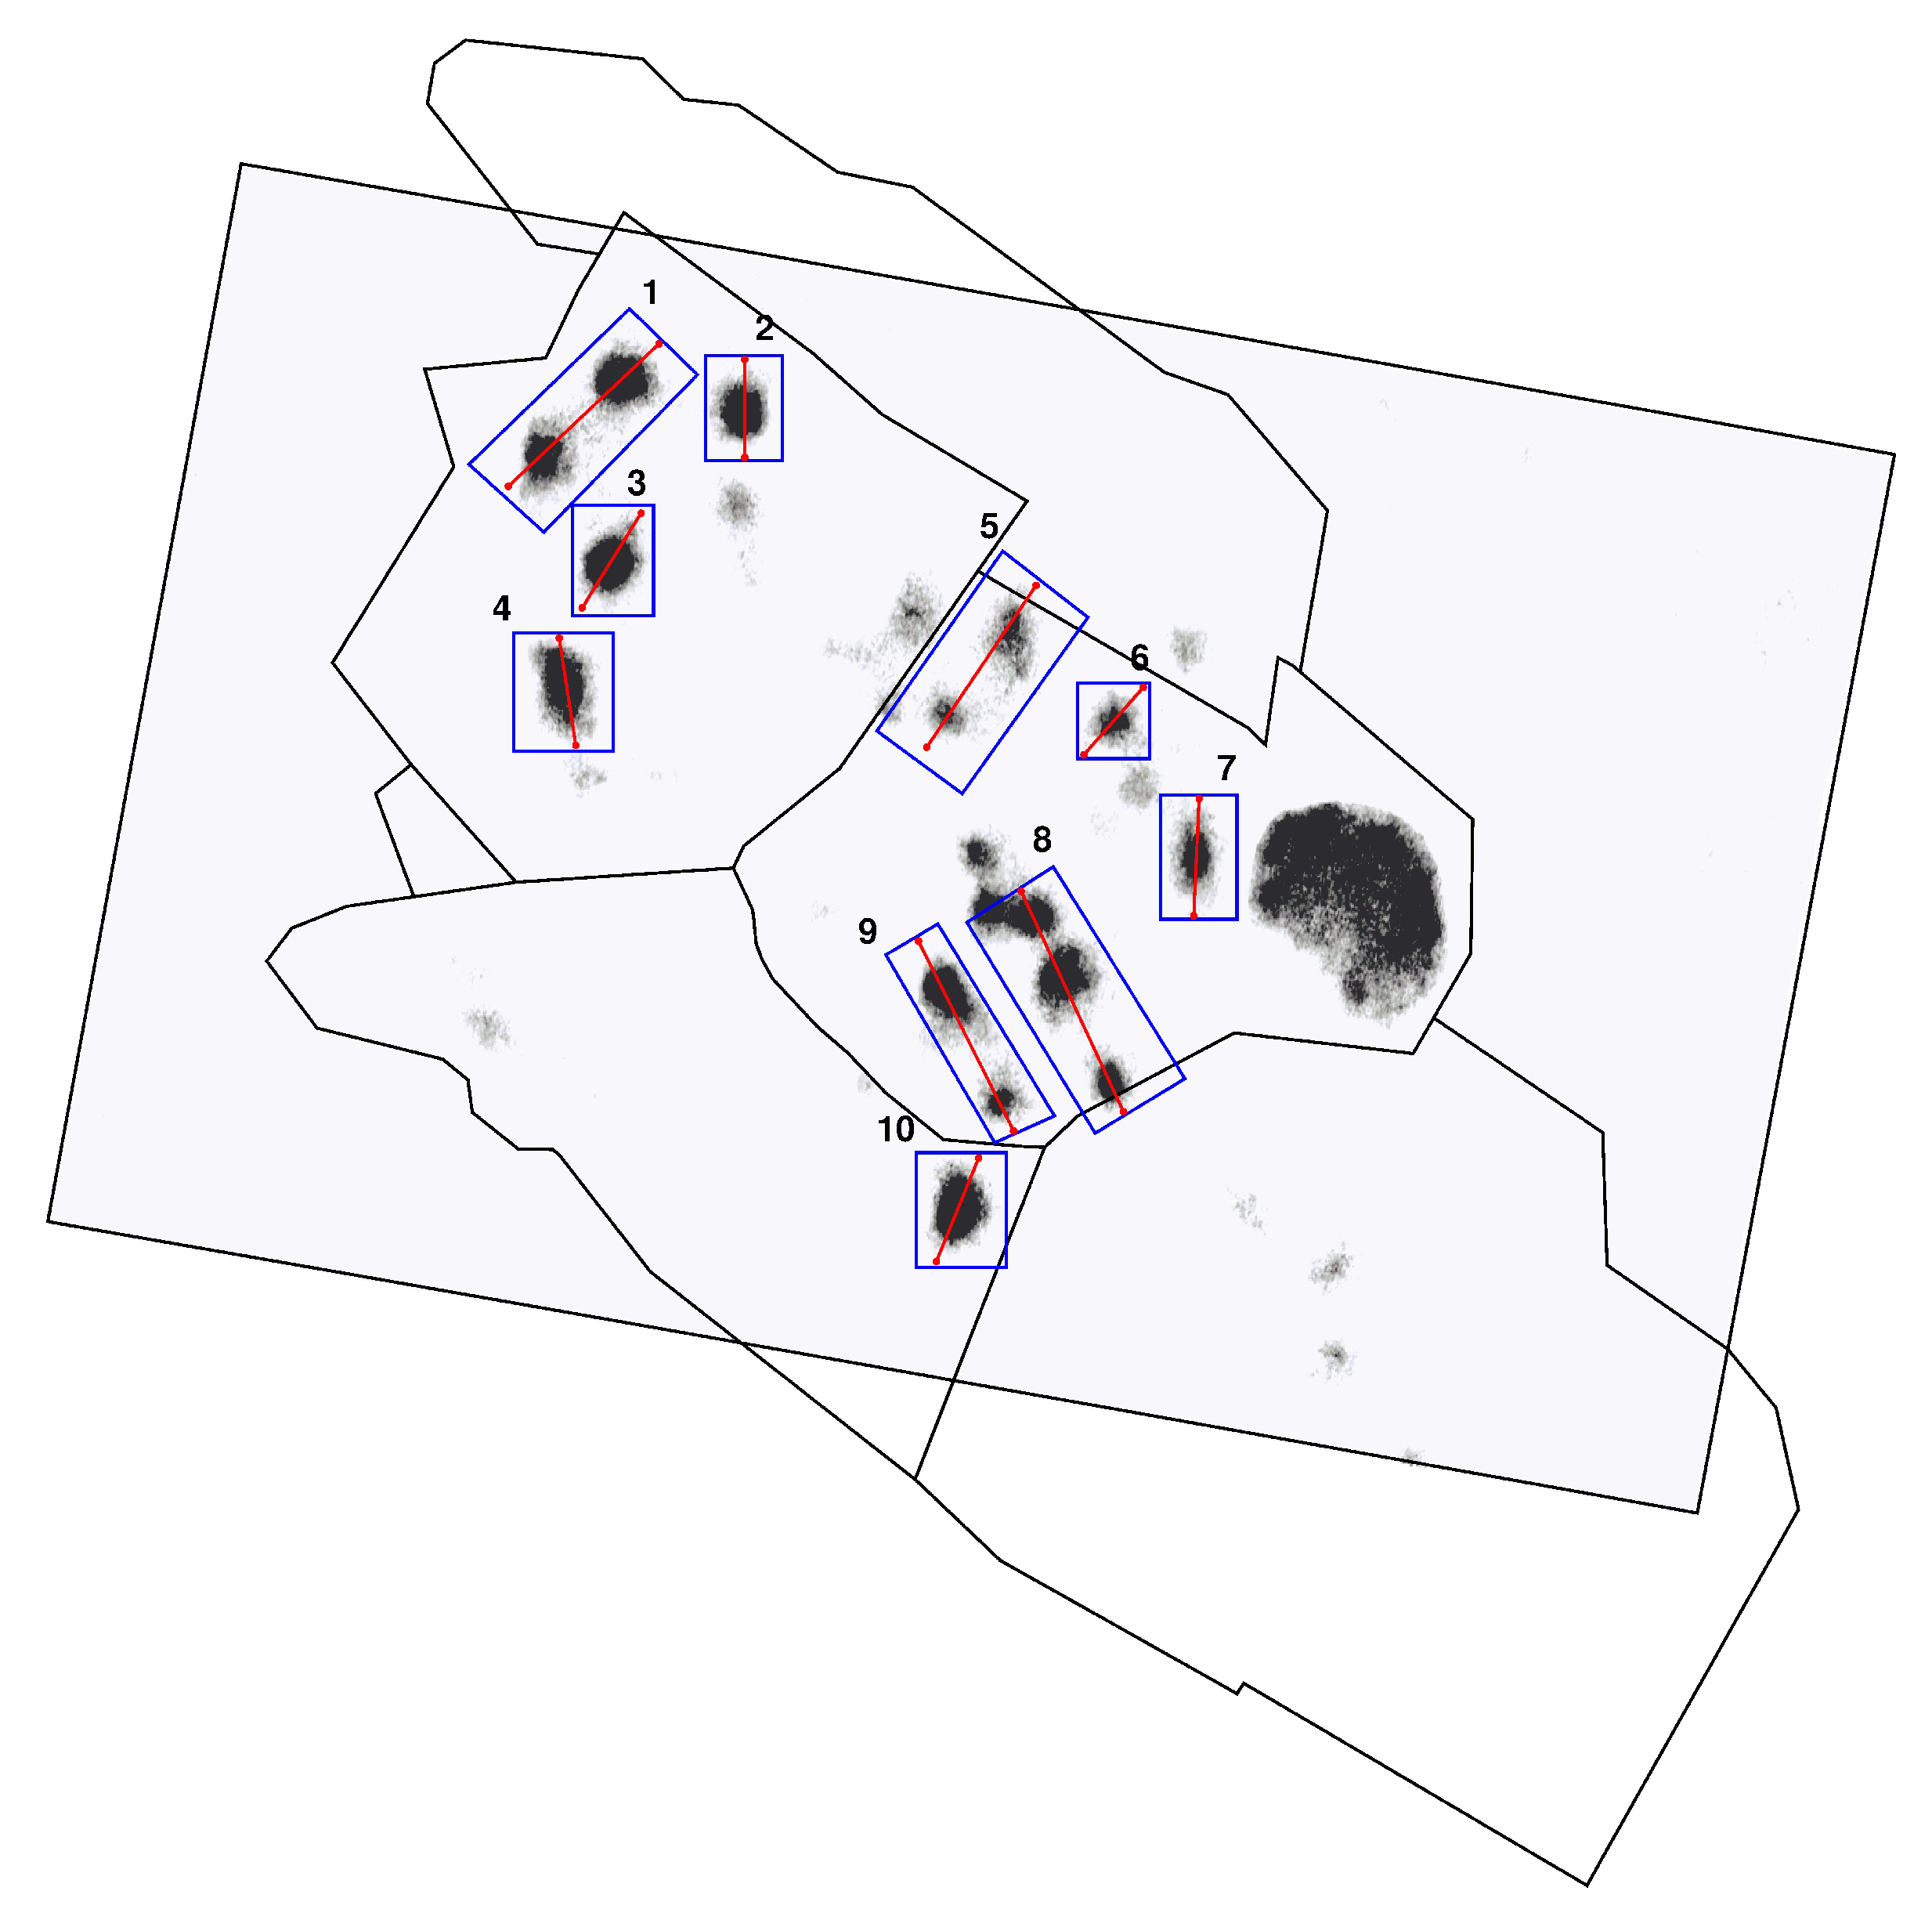
In order to compare displacements from path 22 and from path 73, 10 regions were selected to plot graphs of total displacements (Figure 12).
Analysis of the LOS displacements from the two paths for 10 representative profiles indicates that the majority of the results are consistent (Figure 13). The results are significantly different only for two paths on profiles 3 and 10. In the remaining cases, the displacements have similar curves and maximum values.
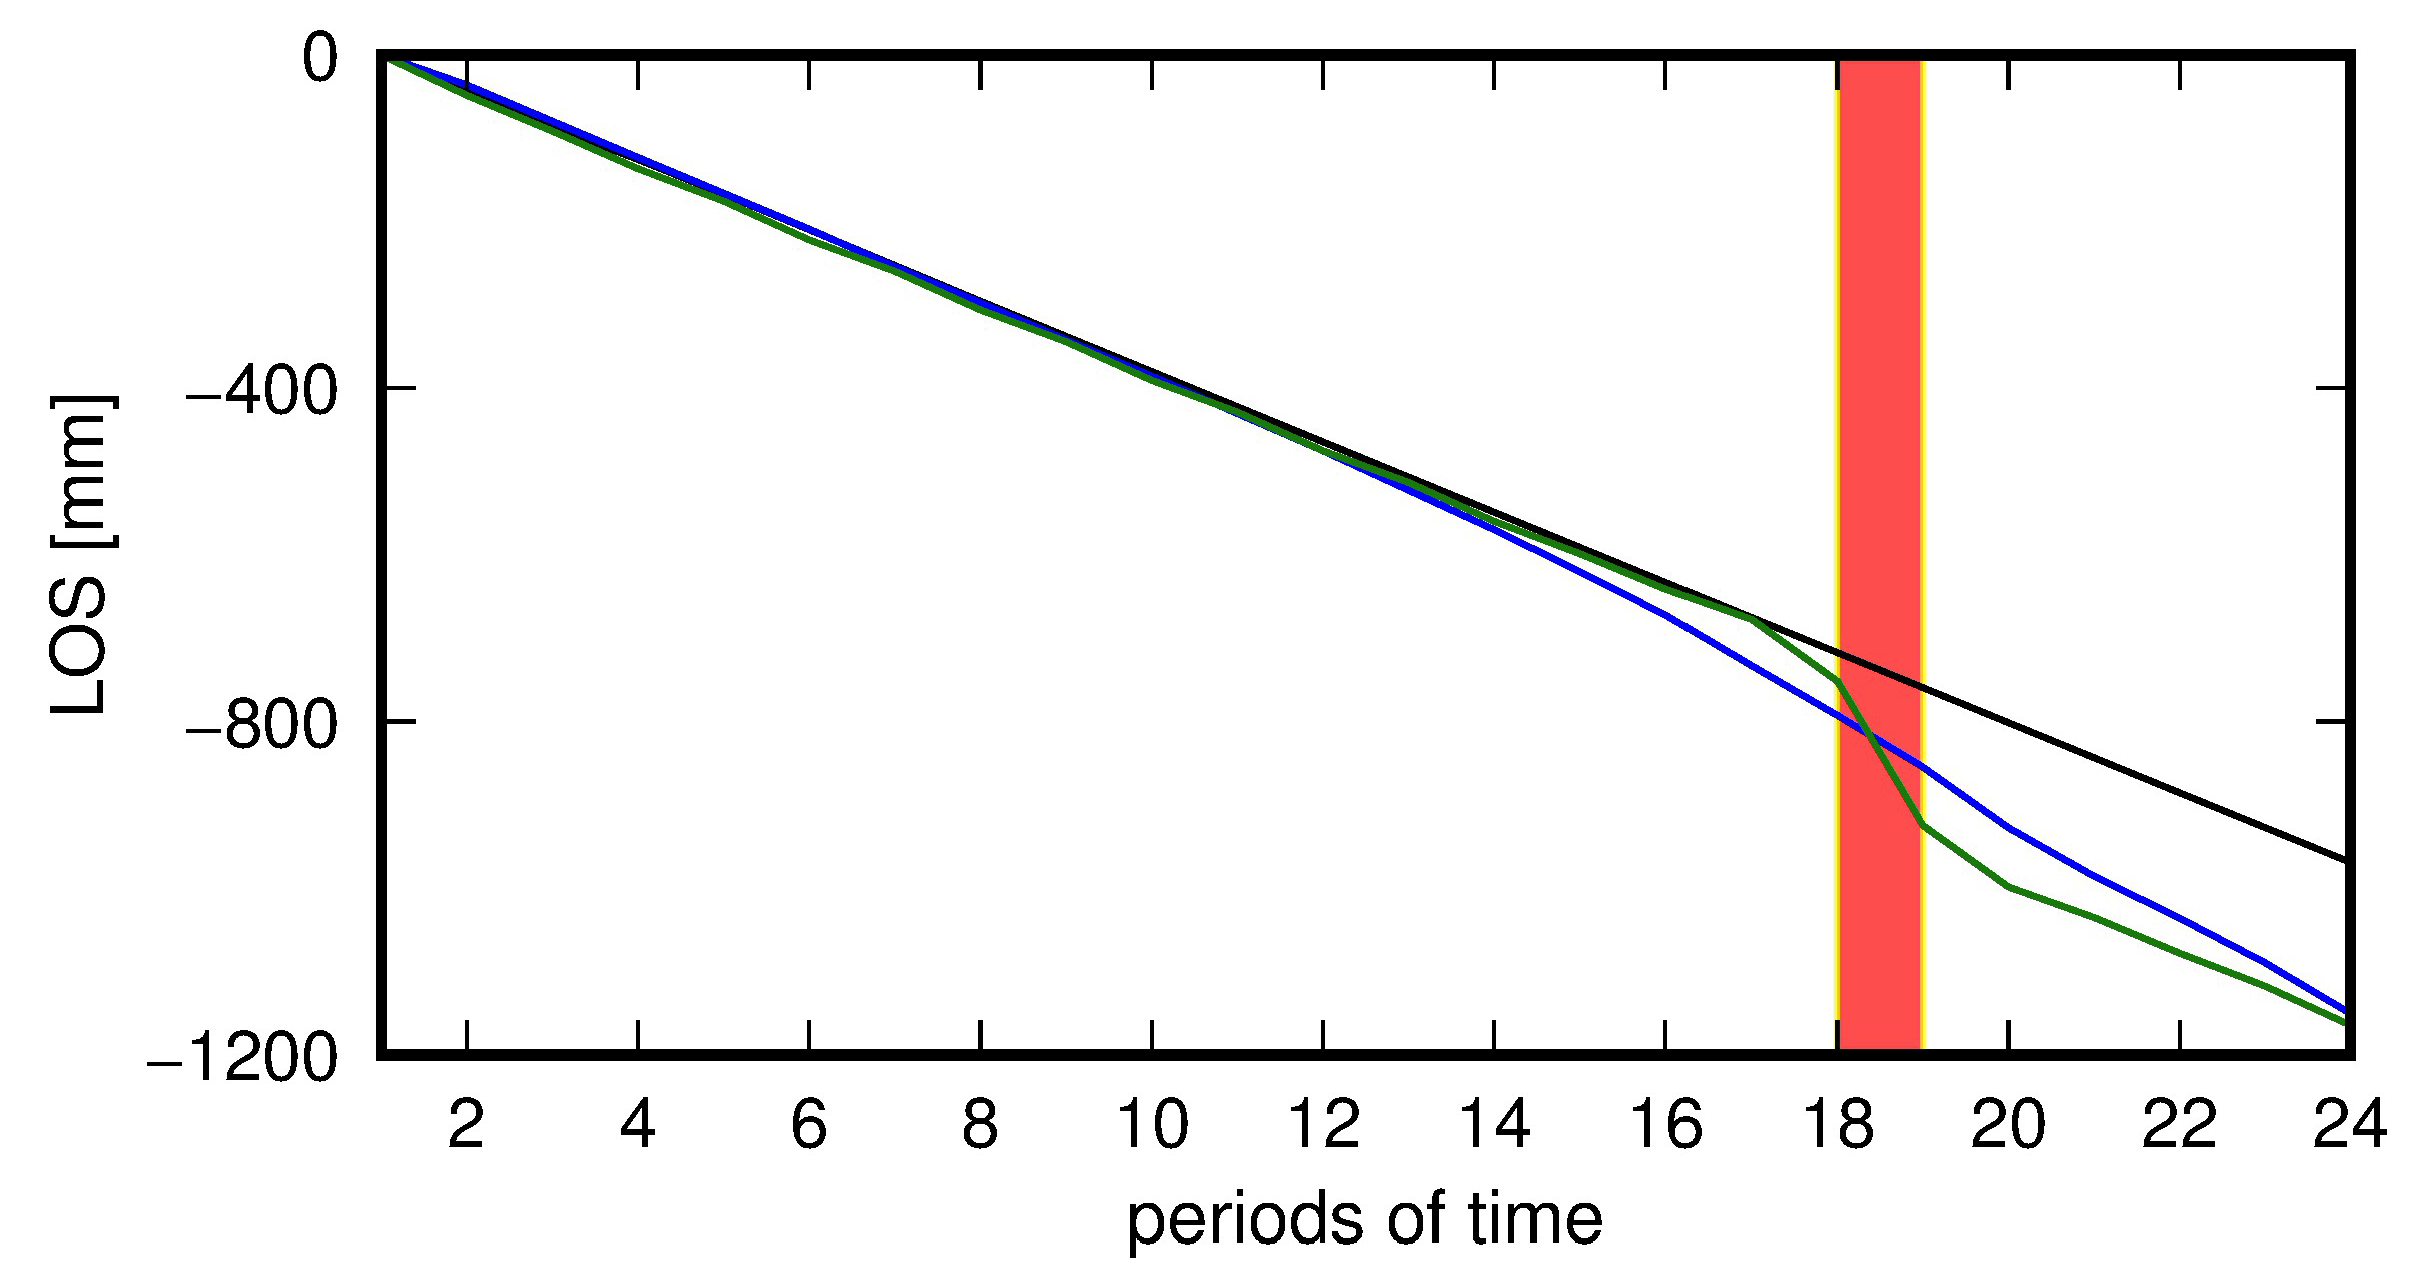
The results of the test calculations are also presented. These calculations were intended to verify whether the model for reducing the influence of atmospheric delay on final results may be considered useful. This empirical method has been successfully used in areas demonstrating displacements which are constant in time [24]. Like some other empirical methods [23], this method does not work well in the case of sudden events (outlying events), such as mining tremors. Figure 14 shows an example of how the method is applied in an area, in which time-constant displacements are accompanied by sporadic sudden events. The results here presented relate to the test models described above. Time-constant ground displacements determined with the SBAS method without the model are correct (i.e., they show as time-constant subsidence increments). The situation is different in the case when an event results in greater displacements observed on the surface. In such case the model reduces the displacement values to approximate the level from the periods when surface displacements were constant. As a result, displacement analysis cannot be used to identify tremor location. In such situation, the results are not fully reliable. The time of the tremor may be identified only by analyzing the atmospheric component. Interestingly, upon comparison, the calculated total displacement values show to be practically identical for cases in which tremors are analyzed with and without allowance for the reduction model.
This fact allowed a hypothesis that the method in question can be applied to detecting induced seismic events. The model seems applicable in the case of such regions as the LGCB. Intensive, albeit time-constant underground mining activity results in the creation of subsidence troughs, while specific geological conditions may contribute to mining tremors. Tremors of this type are located in the mining area, i.e., in the area affected by ground surface subsidence. With all of these conditions overlapping, using InSAR against the background of mining deformations to detect a potential mining tremor may prove difficult or impossible. The test calculations demonstrated that the model allows the detection of a mining tremor in a separated atmospheric signal. Detailed analysis covered 23 induced seismic events, which occurred between December 2014 and June 2018 in the LGCB region. Their distribution in time with respect to SAR data is shown in Figure 5. Tremors selected for analysis had magnitude greater than Mw 4.0. The selection of tremors for analysis was based on the data obtained from Helmholtz Centre Potsdam. Each tremor was matched with two pairs of SAR images obtained from the Sentinel 1A/B satellites, from paths 22 and 73 (Table 3). Time consistency was ensured by selecting images dated closest to a particular tremor (before and after, at a maximum of 12 days).
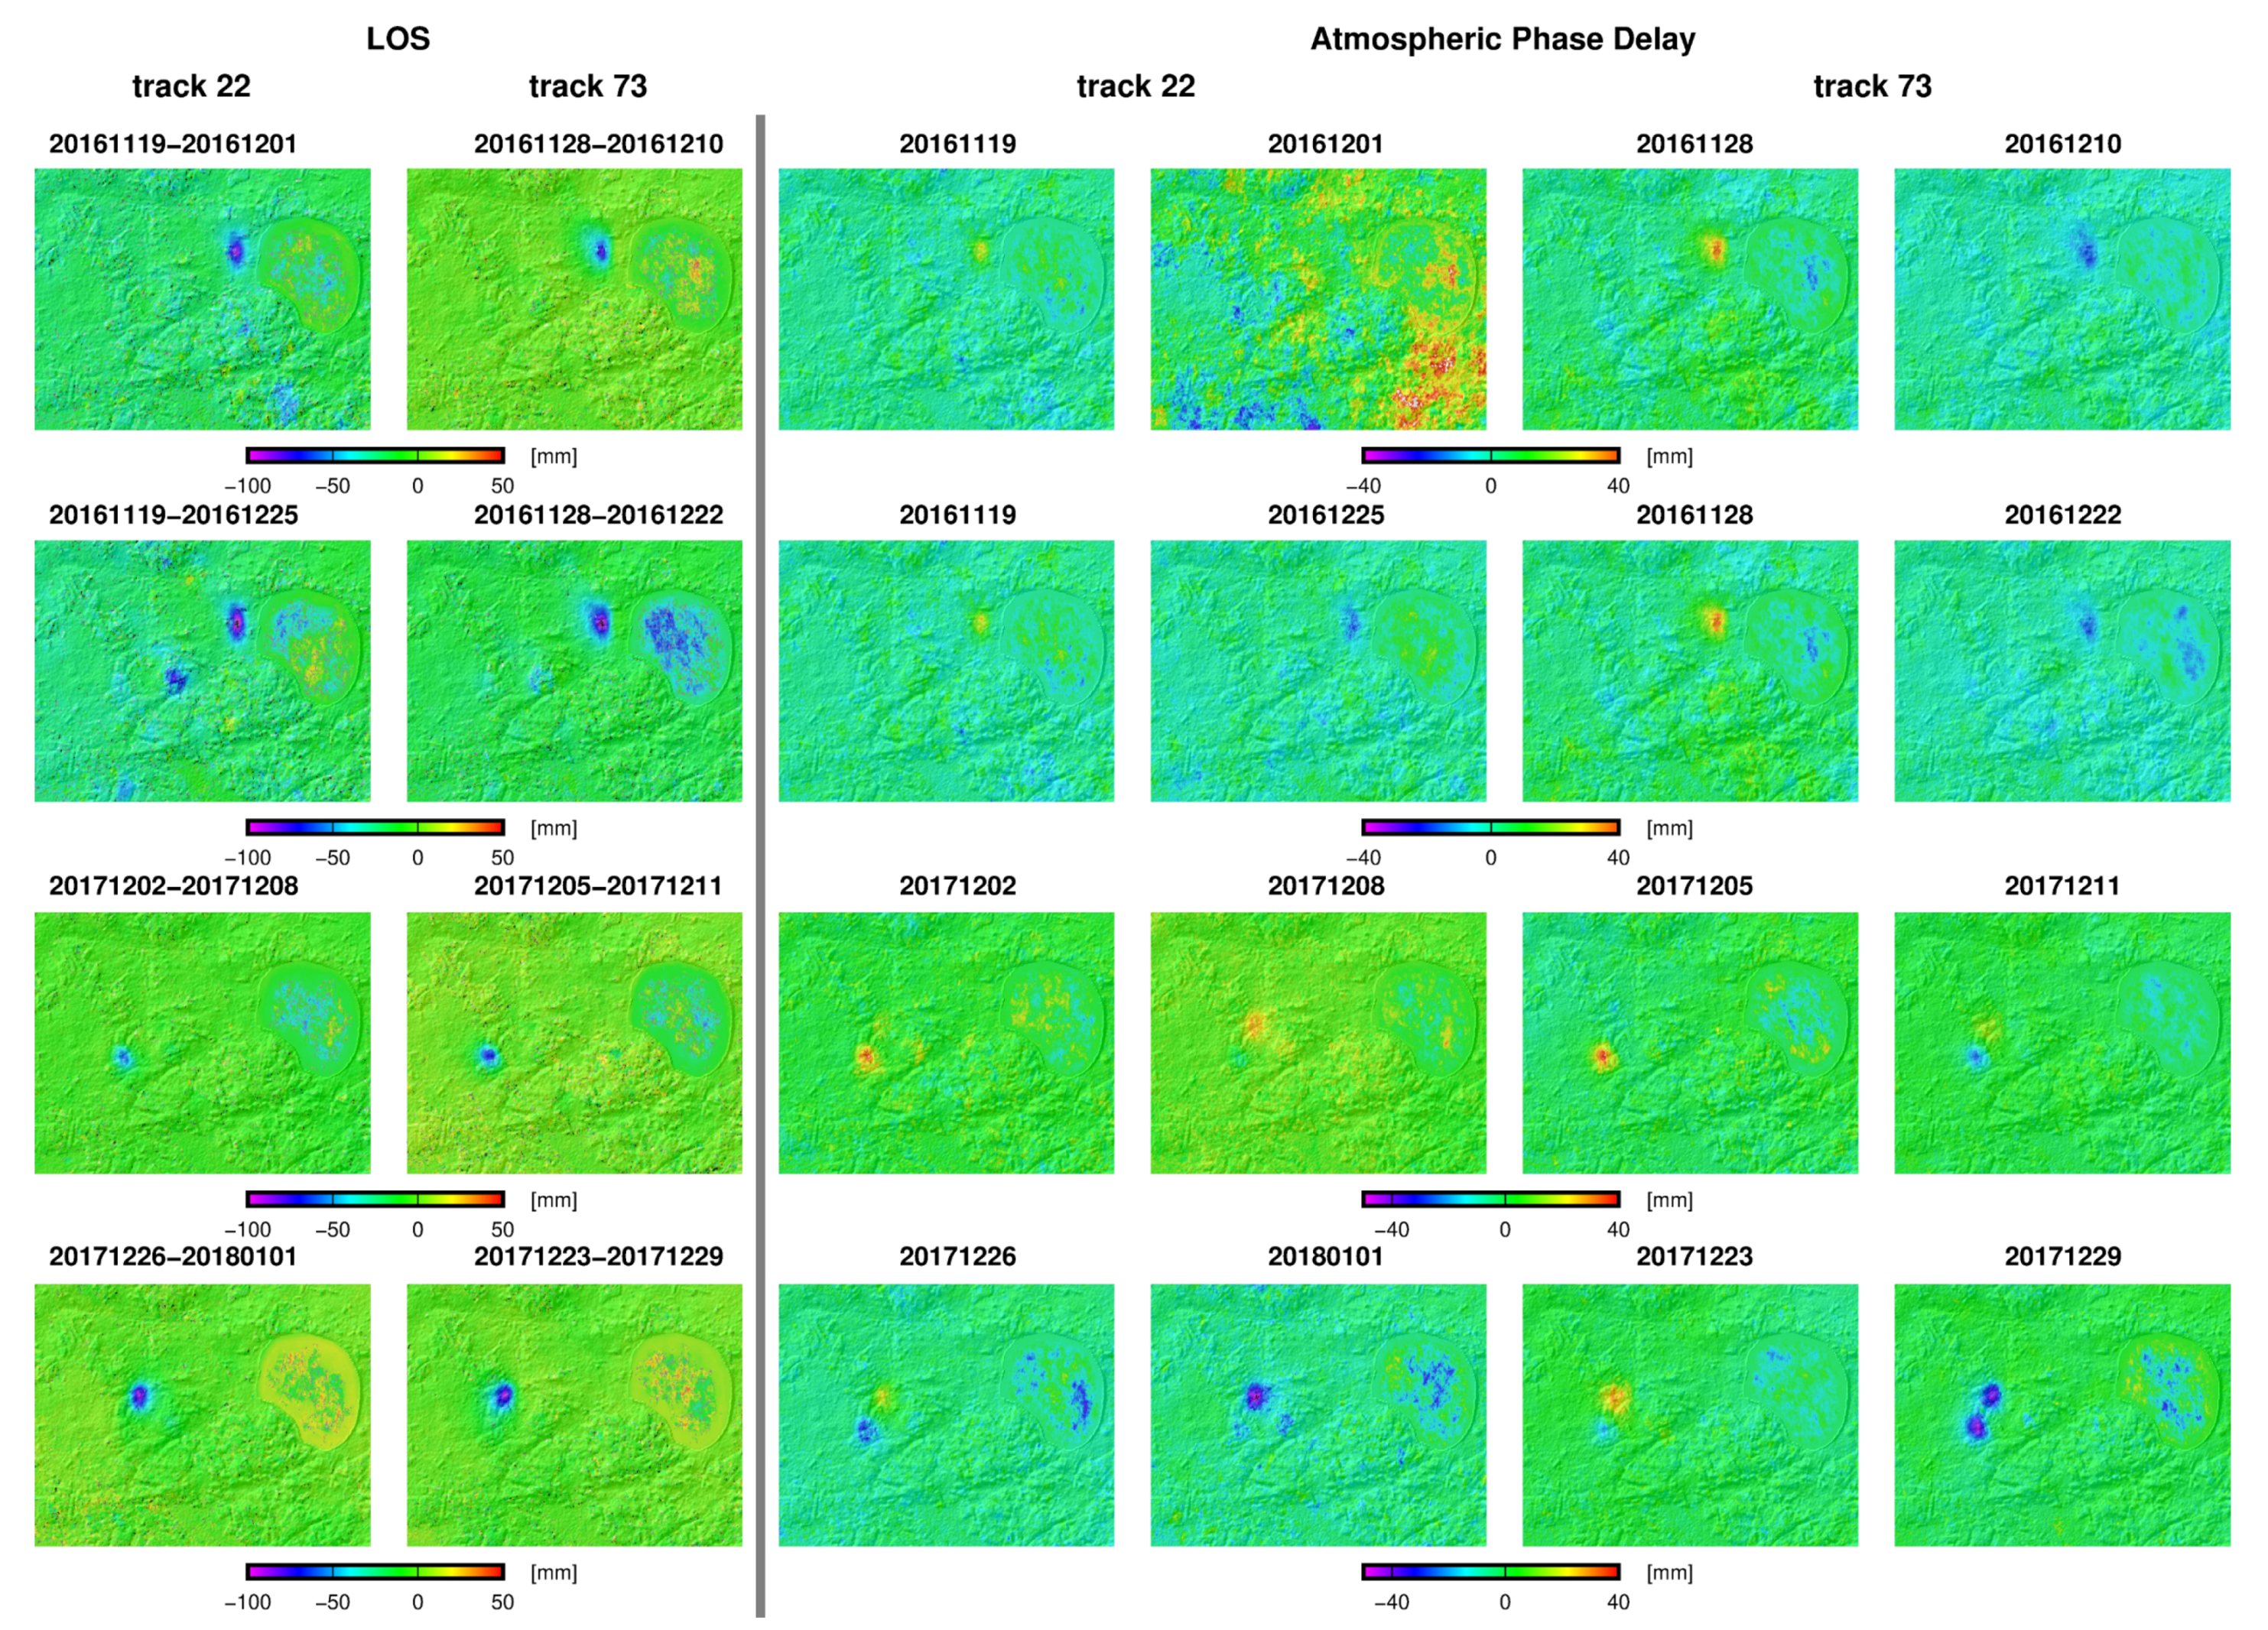
The results (Table 3, Figure 15) indicate the possibility to observe an image of a tremor in the calculated atmospheric component. In the case of the LGCB region, the model for reducing atmospheric delays allows detecting the majority of induced seismic events having magnitude Mw greater than 4.1.
The demonstrated property of SBAS calculations that takes into account the empirical model of atmospheric delay estimation, can be used to detect the impact of mining tremors on the surface. Analysis of the results showed that detection of mining tremors based on SAR data obtained for a period longer than 6–12 days is limited due to influence mining operation observed in the phase of the signal. Figure 15 shows the results for three selected induced seismic events. The first two lines concern the same event. The first row shows the results for SAR data with a temporal base of 12 days. The results obtained in this case allow to clearly locate the mining tremor. The second row presents displacement results for longer temporal bases, corresponding to: 36 days (for track 22) and 24 days (for track 73) respectively. In the case of track 22 where the temporal base was over one month, additional subsidence basins can be observed. These are the result of the impact of mining on the surface. The rows 3 and 4 present the results for selected mining tremors that were determined based on SAR data with an interval of 6 days.

7. Conclusions

Application of satellite interferometry in the monitoring of mining and post-mining areas (secondary deformations) may prove an important aid to the methods currently used for measuring ground surface deformations. This paper presents an analysis of the results of surface deformations due to underground mining of copper ore. The analyses are based on calculations of a large number of SAR data obtained from satellites Sentinel 1A/B. The calculations employed the SBAS method and the empirical method for the elimination of atmospheric delay, as proposed by Tymofyeyev and Fialko [19]. Prior to calculating actual data, a series of test calculations was performed. These calculations employed the Mogi model in order to simulate the influence of underground mining activity on ground surface and on mining tremors. The test calculations performed with the use of the atmospheric delay reduction model resulted in two observations which are of significance from the perspective of monitoring surfaces of mining areas. Firstly, if constant displacements occur in the analyzed area, then the application of the model does not have a significant effect on the scale of calculated displacements. Secondly, if a tremor occurs in a considered area, then the applied model reduces displacements due to the seismic event. Some values of these displacements are observed in the calculated atmospheric correction, related to images forming interferometric pairs. If a tremor occurs outside the area affected by mining activity, the displacement value is practically completely reduced. The image of such an event is recorded in the part of the signal corresponding to the atmospheric correction. Therefore, the method should not be applied in areas where ground surface deformations are not time-constant. The method may be used, however, in such regions as the LGCB, where the employed mining system results in relatively time-constant displacements. The results indicate that the method is effective at detecting changes resulting from induced seismic events. It allows determining tremor locations in cases when acquisition dates are greater than the optimal value of 6–12 days (in the case of Sentinel 1A/B).
Importantly, the calculation results presented here have some weaknesses. One such flaw is lack of comparison with the results from other measurement methods (e.g., GNSS, precise leveling). Unfortunately, access to the GNSS and precise leveling data is currently impossible due to the policy implemented by the mines of the LGCB region.

Funding

This research received no external funding

Conflicts of Interest

The author declare no conflict of interest.

References

  1. Brady, B.H.G.; Brown, E.T. Rock Mechanics, 3rd ed.; Chapter 16; Springer: Dordrecht, The Netherlands, 2006; p. 628. [Google Scholar]
  2. Samsonov, S.; Smets, B.; D’Oreye, N.; Smets, B. Ground deformation associated with post-mining activity at the French—German border revealed by novel InSAR time series method. Int. J. Appl. Earth Obs. Geoinf. 2013, 23, 142–154. [Google Scholar] [CrossRef]
  3. Szczerbowski, Z.; Jura, J. Mining induced seismic events and surface deformations monitored by GPS permanent stations. Acta Geodyn. Et Geomater. 2015, 12, 237–248. [Google Scholar] [CrossRef]
  4. Doležalová, H.; Kajzar, V.; Souček, K.; Staš, L. Evaluation of mining subsidence using GPS data. Acta Geodyn. Et Geomater. 2009, 6, 359–367. [Google Scholar]
  5. Yue, D.; Wang, J.; Zhou, J.; Chen, X.; Ren, H. Monitoring slope deformation using a 3-D laser image scanning system: A case study. Min. Sci. Technol. 2010, 20, 898–903. [Google Scholar] [CrossRef]
  6. Xu, Z.; Xu, E.; Wu, L.; Liu, S.; Mao, Y. Registration of Terrestrial Laser Scanning Surveys Using Terrain-Invariant Regions for Measuring Exploitative Volumes over Open-Pit Mines. Remote Sens. 2019, 11, 606. [Google Scholar] [CrossRef]
  7. Antonello, G.; Casagli, N.; Farina, P.; Leva, D.; Nico, G.; Sieber, A.J.; Tarchi, D. Ground-based SAR interferometry for monitoring mass movements. Landslides 2004, 1, 21–28. [Google Scholar] [CrossRef]
  8. Carlà, T.; Farina, P.; Intrieri, E.; Ketizmen, H.; Casagli, N. Integration of ground-based radar and satellite InSAR data for the analysis of an unexpected slope failure in an open-pit mine. Eng. Geol. 2018, 235, 39–52. [Google Scholar] [CrossRef]
  9. Duque, S.; Lopez-Sanchez, J.; Mallorqui, J.; Herrera, G.; Tomás, R.; Mulas, J.; Delgado, J. Advanced DInSAR analysis on mining areas: La Union case study (Murcia, SE Spain). Eng. Geol. 2007, 90, 148–159. [Google Scholar] [Green Version]
  10. Paradella, W.R.; Ferretti, A.; Mura, J.C.; Colombo, D.; Gama, F.F.; Tamburini, A.; Santos, A.R.; Novali, F.; Galo, M.; Camargo, P.O.; et al. Mapping surface deformation in open pit iron mines of Carajás Province (Amazon Region) using an integrated SAR analysis. Eng. Geol. 2015, 193, 61–78. [Google Scholar] [CrossRef] [Green Version]
  11. Peduto, D.; Nicodemo, G.; Maccabiani, J.; Ferlisi, S. Multi-scale analysis of settlement-induced building damage using damage surveys and DInSAR data: A case study in The Netherlands. Eng. Geol. 2017, 218, 117–133. [Google Scholar] [CrossRef]
  12. Jung, H.C.; Kim, S.W.; Jung, H.S.; Min, K.D.; Won, J.S. Satellite observation of coal mining subsidence by persistent scatterer analysis. Eng. Geol. 2007, 92, 1–13. [Google Scholar] [CrossRef]
  13. Liu, D.; Shao, Y.; Liu, Z.; Riedel, B.; Sowter, A.; Niemeier, W.; Bian, Z. Evaluation of InSAR and TomoSAR for Monitoring Deformations Caused by Mining in a Mountainous Area with High Resolution Satellite-Based SAR. Remote Sens. 2014, 6, 1476–1495. [Google Scholar] [CrossRef] [Green Version]
  14. Ma, C.; Cheng, X.; Yang, Y.; Zhang, X.; Guo, Z.; Zou, Y. Investigation on Mining Subsidence Based on Multi-Temporal InSAR and Time-Series Analysis of the Small Baseline Subset—Case Study of Working Faces 22201-1/2 in Bu’ertai Mine, Shendong Coalfield, China. Remote Sens. 2016, 8. [Google Scholar] [CrossRef]
  15. Zhao, C.; Lu, Z.; Zhang, Q. Time-series deformation monitoring over mining regions with SAR intensity-based offset measurements. Remote Sens. Lett. 2013, 4, 436–445. [Google Scholar] [CrossRef]
  16. Cuenca, C.M.; Hooper, A.J.; Hanssen, R.F. Surface deformation induced by water influx in the abandoned coal mines in Limburg, The Netherlands observed by satellite radar interferometry. J. Appl. Geophys. 2013, 88, 1–11. [Google Scholar] [CrossRef]
  17. Milczarek, W.; Blachowski, J.; Grzempowski, P. Application of PSInSAR for assessment of surface deformations in post-mining area—Case study of the former Walbrzych hard coal basin (SW Poland). Acta Geodyn. Et Geomater. 2017, 14, 41–52. [Google Scholar]
  18. Popiolek, E.; Ostrowski, J.; Czaja, J.; Mazur, J. Poster_Paper 9.pdf. In Proceedings of the 10th FIG International Symposium on Deformation Measurements, International Federation of Surveyors, Orange, CA, USA, 19–21 March 2001; pp. 77–80. [Google Scholar]
  19. Tymofyeyeva, E.; Fialko, Y. Mitigation of atmospheric phase delays in InSAR data, with application to the eastern California shear zone. J. Geophys. Res. Solid Earth 2015, 120, 5952–5963. [Google Scholar] [CrossRef] [Green Version]
  20. Bürgmann, R.; Rosen, P.A.; Fielding, E.J. Synthetic Aperture Radar Interferometry to Measure Earth’s Surface Topography and Its Deformation. Annu. Rev. Earth Planet. Sci. 2000, 28, 169–209. [Google Scholar] [CrossRef]
  21. Brcic, R.; Parizzi, A.; Eineder, M.; Bamler, R.; Meyer, F. Estimation and compensation of ionospheric delay for SAR interferometry. Int. Geosci. Remote Sens. Symp. 2010, 2908–2911. [Google Scholar] [CrossRef]
  22. Yu, C.; Li, Z.; Penna, N.T.; Crippa, P. Generic Atmospheric Correction Model for Interferometric Synthetic Aperture Radar Observations. J. Geophys. Res. Solid Earth 2018, 9202–9222. [Google Scholar] [CrossRef]
  23. Bekaert, D.P.S.; Walters, R.J.; Wright, T.J.; Hooper, A.J.; Parker, D.J. Statistical comparison of {InSAR} tropospheric correction techniques. Remote Sens. Environ. 2015, 170, 40–47. [Google Scholar] [CrossRef]
  24. Xu, X.; Sandwell, D.T.; Tymofyeyeva, E.; González-Ortega, A.; Tong, X. Tectonic and {Anthropogenic} {Deformation} at the {Cerro} {Prieto} {Geothermal} {Step}-{Over} {Revealed} by {Sentinel}-1A {InSAR}. IEEE Trans. Geosci. Remote Sens. 2017, 55, 5284–5292. [Google Scholar] [CrossRef]
  25. Mogi, K. Relations between the eruptions of various volcanoes and the deformations of the ground surfaces around them. Bull. Earthq. Res. Inst 1958, 36, 99–134. [Google Scholar]
  26. Meo, M.; Tammaro, U.; Capuano, P. Influence of topography on ground deformation at Mt. Vesuvius (Italy) by finite element modelling. Int. J. Non-Linear Mech. 2008, 43, 178–186. [Google Scholar] [CrossRef] [Green Version]
  27. Masterlark, T. Magma intrusion and deformation predictions: Sensitivities to the Mogi assumptions. J. Geophys. Res. Solid Earth 2007, 112, 1–17. [Google Scholar] [CrossRef]
  28. Freymueller, J.T.; Kaufman, A.M. Changes in the magma system during the 2008 eruption of Okmok volcano, Alaska, based on GPS measurements. J. Geophys. Res. Solid Earth 2010, 115, 1–14. [Google Scholar] [CrossRef]
  29. Fuhrmann, T.; Garthwaite, M.C. Resolving Three-Dimensional Surface Motion with InSAR: Constraints from Multi-Geometry Data Fusion. Remote Sens. 2019, 11, 241. [Google Scholar] [CrossRef]
  30. Berardino, P.; Fornaro, G.; Lanari, R.; Sansosti, E. A new algorithm for surface deformation monitoring based on small baseline differential {SAR} interferograms. IEEE Trans. Geosci. Remote Sens. 2002, 40, 2375–2383. [Google Scholar] [CrossRef]
  31. Lanari, R.; Mora, O.; Manunta, M.; Mallorqui, J.J.; Berardino, P.; Sansosti, E. A small-baseline approach for investigating deformations on full-resolution differential SAR interferograms. IEEE Trans. Geosci. Remote Sens. 2004, 42, 1377–1386. [Google Scholar] [CrossRef]
  32. Lanari, R.; Casu, F.; Manzo, M.; Zeni, G.; Berardino, P.; Manunta, M.; Pepe, A. An Overview of the Small BAseline Subset Algorithm: A DInSAR Technique for Surface Deformation Analysis. In Deformation and Gravity Change: Indicators of Isostasy, Tectonics, Volcanism, and Climate Change; Wolf, D., Fernández, J., Eds.; Birkhäuser Basel: Basel, Switzerland, 2007; pp. 637–661. [Google Scholar]
  33. Orlecka-Sikora, B.; Papadimitriou, E.E.; Kwiatek, G. A study of the interaction among mining-induced seismic events in the Legnica-Głogów Copper District, Poland. Acta Geophys. 2009, 57, 413–434. [Google Scholar] [CrossRef] [Green Version]
  34. Gibowicz, S.J. Seismic doublets and multiplets at Polish coal and copper mines. Acta Geophys. 2006, 54, 142–157. [Google Scholar] [CrossRef]
  35. Trenczek, S. Study of influence of tremors on combined hazards. Longwall mining operations in co-occurrence of natural hazards. A case study. J. Sustain. Min. 2016, 15, 36–47. [Google Scholar] [CrossRef] [Green Version]
  36. Gibowicz, S.; Kijko, A. An Introduction to Mining Seismology; Academic Press: New York, NY, USA, 1994; chapter 2; pp. 15–23. [Google Scholar]
  37. Drzewiecki, J.; Piernikarczyk, A. The forecast of mining-induced seismicity and the consequent risk of damage to the excavation in the area of seismic event. J. Sustain. Min. 2017, 16, 1–7. [Google Scholar] [CrossRef]
  38. Kubacki, T.; Koper, K.D.; Pankow, K.L.; McCarter, M.K. Changes in mining-induced seismicity before and after the 2007 Crandall Canyon Mine collapse. J. Geophys. Res. Solid Earth 2014, 119, 4876–4889. [Google Scholar] [CrossRef] [Green Version]
  39. Krawczyk, A.; Grzybek, R. An evaluation of processing InSAR Sentinel-1A/B data for correlation of mining subsidence with mining induced tremors in the Upper Silesian Coal Basin (Poland). E3S Web Conf. 2018, 26, 1–5. [Google Scholar] [CrossRef]
  40. Bommer, J.J.; Crowley, H.; Pinho, R. A risk-mitigation approach to the management of induced seismicity. J. Seismol. 2015, 19, 623–646. [Google Scholar] [CrossRef] [Green Version]
  41. Lei, X.; Huang, D.; Su, J.; Jiang, G.; Wang, X.; Wang, H.; Guo, X.; Fu, H. Fault reactivation and earthquakes with magnitudes of up to Mw4.7 induced by shale-gas hydraulic fracturing in Sichuan Basin, China. Sci. Rep. 2017, 7, 1–12. [Google Scholar] [CrossRef]
  42. Corlett, H.; Schultz, R.; Branscombe, P.; Hauck, T.; Haug, K.; MacCormack, K.; Shipman, T. Subsurface faults inferred from reflection seismic, earthquakes, and sedimentological relationships: Implications for induced seismicity in Alberta, Canada. Mar. Pet. Geol. 2018, 93, 135–144. [Google Scholar] [CrossRef]
  43. Barnhart, W.D.; Benz, H.M.; Hayes, G.P.; Rubinstein, J.L.; Bergman, E.; Benz, H.M.; Hayes, G.P.; Rubinstein, J.L.; Bergman, E. Seismological and geodetic constraints on the 2011 Mw5. 3 Trinidad, Colorado earthquake and induced deformation in the Raton Basin. J. Geophys. Res. Solid Earth 2014, 119, 7923–7933. [Google Scholar] [CrossRef]
  44. Vlek, C. Induced Earthquakes from Long-Term Gas Extraction in Groningen, the Netherlands: Statistical Analysis and Prognosis for Acceptable-Risk Regulation. Risk Anal. 2018, 38, 1455–1473. [Google Scholar] [CrossRef] [PubMed] [Green Version]
  45. Diehl, T.; Kraft, T.; Kissling, E.; Wiemer, S. The induced earthquake sequence related to the St. Gallen deep geothermal project (Switzerland): Fault reactivation and fluid interactions imaged by microseismicity. J. Geophys. Res. Solid Earth 2017, 122, 7272–7290. [Google Scholar] [CrossRef]
  46. van der Baan, M.; Calixto, F.J. Human-induced seismicity and large-scale hydrocarbon production in the USA and Canada. Geochem. Geophys. Geosyst. 2017, 116, 1–12. [Google Scholar] [CrossRef]
  47. Did anthropogenic activities trigger the 3 April 2017 Mw 6.5 Botswana earthquake? Remote Sens. 2017, 9, 1–12.
  48. White, J.A.; Foxall, W. Assessing induced seismicity risk at CO2 storage projects: Recent progress and remaining challenges. Int. J. Greenh. Gas Control 2016, 49, 413–424. [Google Scholar] [CrossRef]
  49. Verdon, J.P.; Stork, A.L. Carbon capture and storage, geomechanics and induced seismic activity. J. Rock Mech. Geotech. Eng. 2016, 8, 928–935. [Google Scholar] [CrossRef] [Green Version]
  50. Brodsky, E.E.; Lajoie, L.J. at the Salton Sea Geothermal Field. Science 2013, 543, 543–546. [Google Scholar] [CrossRef]
  51. Lin, G.; Wu, B. Seismic velocity structure and characteristics of induced seismicity at the Geysers Geothermal Field, eastern California. Geothermics 2018, 71, 225–233. [Google Scholar] [CrossRef]
  52. Fialko, Y.; Simons, M. Deformation and seismicity in the Coso geothermal area, Inyo County, California: Observations and modeling using satellite radar interferometry. J. Geophys. Res. Solid Earth 2000, 105, 21781–21793. [Google Scholar] [CrossRef] [Green Version]
  53. Vasco, D.W.; Rutqvist, J.; Ferretti, A.; Rucci, A.; Bellotti, F.; Dobson, P.; Oldenburg, C.; Garcia, J.; Walters, M.; Hartline, C. Monitoring deformation at the Geysers geothermal field, California using C-band and X-band interferometric synthetic aperture radar. Geophys. Res. Lett. 2013, 40, 2567–2572. [Google Scholar] [CrossRef]
  54. Weingarten, M.; Ge, S.; Godt, J.W.; Bekins, B.A.; Rubinstein, J.L. High-rate injection is associated with the increase in U.S. mid-continent seismicity. Science 2015, 348, 1336–1340. [Google Scholar] [CrossRef]
  55. Fan, Z.; Eichhubl, P.; Gale, J.F.W. Geomechanical analysis of fluid injection and seismic fault slip for the M w 4.8 Timpson, Texas, earthquake sequence. J. Geophys. Res. Solid Earth 2016, 2798–2812. [Google Scholar] [CrossRef]
  56. Ellsworth, W.L. Injection-Induced Earthquakes. Science 2013, 341, 1–8. [Google Scholar] [CrossRef] [PubMed]
  57. Ellsworth, W.L.; Llenos, A.L.; McGarr, A.F.; Michael, A.J.; Rubinstein, J.L.; Mueller, C.S.; Petersen, M.D.; Calais, E. Increasing seismicity in the U. S. Midcontinent: Implications for earthquake hazard. Lead. Edge 2015, 34, 618–626. [Google Scholar] [CrossRef]
  58. McNamara, D.E.; Benz, H.M.; Herrmann, R.B.; Bergman, E.A.; Earle, P.; Holland, A.; Baldwin, R.; Gassner, A. Earthquake hypocenters and focal mechanisms in central Oklahoma reveal a complex system of reactivated subsurface strike-slip faulting. Geophys. Res. Lett. 2015, 42, 2742–2749. [Google Scholar] [CrossRef] [Green Version]
  59. Lei, X.; Ma, S.; Chen, W.; Pang, C.; Zeng, J.; Jiang, B. A detailed view of the injection-induced seismicity in a natural gas reservoir in Zigong, southwestern Sichuan Basin, China. J. Geophys. Res. Solid Earth 2013, 118, 4296–4311. [Google Scholar] [CrossRef] [Green Version]
  60. McGarr, A.; Bekins, B.; Burkhardt, N.; Dewey, J.; Earle, P.; Ellsworth, W.; Ge, S.; Hickman, S.; Holland, A.; Majer, E.; et al. Coping with earthquakes induced by fluid injection: Hazard may be reduced by managing injection activities. Science 2015, 347, 830–831. [Google Scholar] [CrossRef] [PubMed]
  61. Foxall, W.; Sweeney, J.J.; Walter, W.R.; Fe, S. Identification of Mine Collapses, Explosions and Earthquakes Using INSAR: A Preliminary Investigation; Lawrence Livermore National Laboratory: Livermore, CA, USA, 1998.
  62. Malinowska, A.A.; Witkowski, W.T.; Guzy, A.; Hejmanowski, R. Mapping ground movements caused by mining-induced earthquakes applying satellite radar interferometry. Eng. Geol. 2018, 246, 402–411. [Google Scholar] [CrossRef]
  63. Yamada, T.; Mori, J.J.; Ide, S.; Kawakata, H.; Iio, Y.; Ogasawara, H. Radiation efficiency and apparent stress of small earthquakes in a South African gold mine. J. Geophys. Res. Solid Earth 2005, 110, 1–18. [Google Scholar] [CrossRef]
  64. McClure, M.; Gibson, R.; Chiu, K.K.; Ranganath, R. Identifying potentially induced seismicity and assessing statistical significance in Oklahoma and California. J. Geophys. Res. Solid Earth 2017, 122, 2153–2172. [Google Scholar] [CrossRef]
  65. Riemer, K.; Durrheim, R. Mining seismicity in the Witwatersrand Basin: Monitoring, mechanisms and mitigation strategies in perspective. J. Rock Mech. Geotech. Eng. 2012, 4, 228–249. [Google Scholar] [CrossRef]
  66. Yeck, W.L.; Hayes, G.P.; McNamara, D.E.; Rubinstein, J.L.; Barnhart, W.D.; Earle, P.S.; Benz, H.M. Oklahoma experiences largest earthquake during ongoing regional wastewater injection hazard mitigation efforts. Geophys. Res. Lett. 2017, 44, 711–717. [Google Scholar] [CrossRef]
  67. King, V.M.; Block, L.V.; Yeck, W.L.; Wood, C.K.; Derouin, S.A. Geological structure of the Paradox Valley Region, Colorado, and relationship to seismicity induced by deep well injection. J. Geophys. Res. 2014, 4955–4978. [Google Scholar] [CrossRef]
  68. Society, S.; Fielding, E.J.; Sangha, S.S.; Bekaert, D.P.S.; Sergey, V.; Chang, J.C. Surface Deformation of North-Central Oklahoma Related to the 2016 Mw 5.8 Pawnee Earthquake from SAR Interferometry Time Series. Seismol. Res. Lett. 2017, 1375. [Google Scholar] [CrossRef]
  69. Loesch, E.; Sagan, V. SBAS analysis of induced ground surface deformation from wastewater injection in east central Oklahoma, USA. Remote Sens. 2018, 10. [Google Scholar] [CrossRef]
  70. Wessel, P.; Smith, W.H.; Scharroo, R.; Luis, J.; Wobbe, F. Generic mapping tools: Improved version released. Eos 2013, 94, 409–410. [Google Scholar] [CrossRef]
  71. Chen, C.W.; Zebker, H.A. Phase unwrapping for large SAR interferograms: Statistical segmentation and generalized network models. IEEE Trans. Geosci. Remote Sens. 2002, 40, 1709–1719. [Google Scholar] [CrossRef]
  72. Farr, T.; Rosen, P.A.; Caro, E.; Crippen, R.; Duren, R.; Hensley, S.; Kobrick, M.; Paller, M.; Rodriguez, E.; Roth, L.; et al. The shuttle radar topography mission. Rev. Geophys. 2007, 45, 1–33. [Google Scholar] [CrossRef]
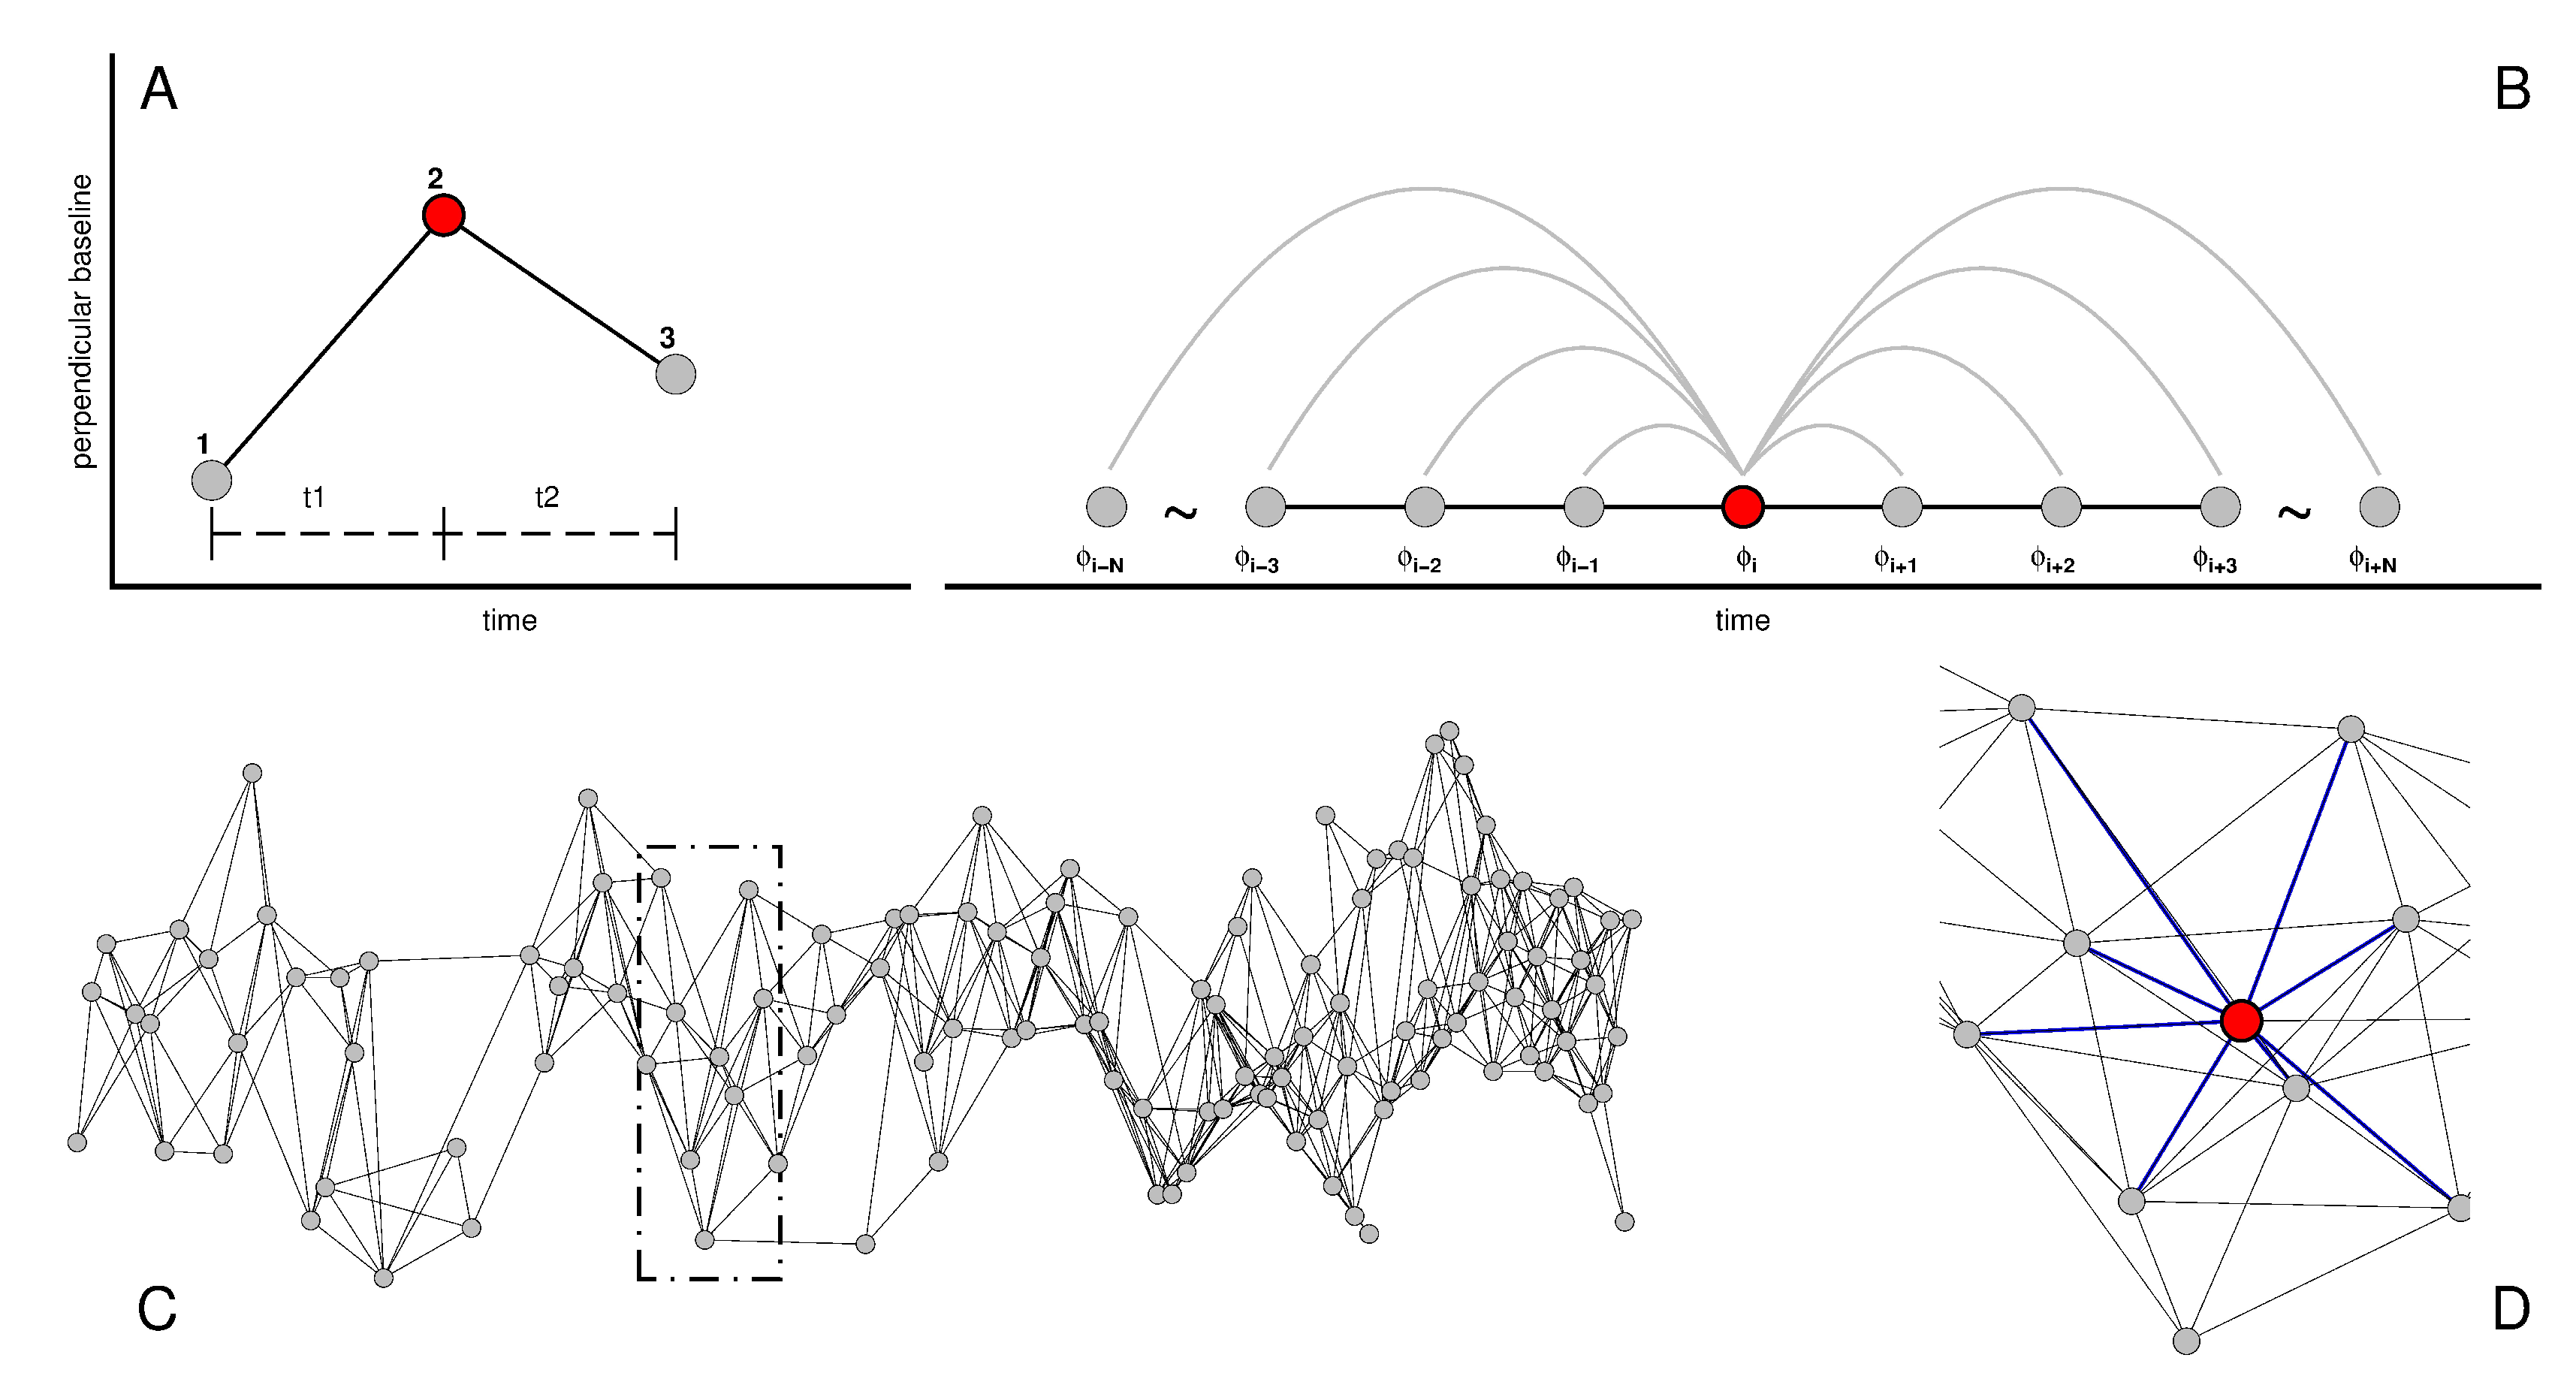
Figure 1. Graphic representation of the basic assumptions behind the method. Part A shows two interferometric pairs having one common image (number 2, denoted in red color). Part B represents the idea behind the method: the more pairs of SAR images with the same recurring image (in red), the more accurate the estimation of atmospheric correction for the image (date). Part C shows the baseline plot for the analyzed SAR data from path 73. Part D, on the other hand, shows the actual implementation of the model. Parts A and B are based on [19].
Remotesensing 11 01008 g001
Figure 2. Schematic diagram of the Mogi model.
Remotesensing 11 01008 g002
Figure 3. Location of the LGCB region. Red polygons denote borders of the mining areas. The map also includes the locations of mining tremors (between 2014 and 2016), the color and the size depend on tremor magnitude. A fragment of an ortophotomap represents the Zelazny Most post-flotation tailings pond.
Remotesensing 11 01008 g003
Figure 4. Temporal and perpendicular baselines of the final selected pairs of hypothetical SAR data. The period in which the simulated mining tremor occurred is marked by the red polygon.
Remotesensing 11 01008 g004
Figure 5. Baseline plot for the two SAR data sets obtained from path 22 (above) and path 73 (below). The analyzed period spanned the years from 2014 to 2018. Red vertical lines denote recorded induced seismic events exceeding magnitude Mw 3.9.
Remotesensing 11 01008 g005
Figure 6. Results of test calculations with the SBAS method for 24 periods. Subsidences were simulated on the basis of the Mogi model. The figure shows a subsidence trough for the first analyzed case without an induced seismic event. The graph in the bottom shows increment dynamics of the simulated ground surface subsidences. The dashed red line indicates the profile.
Remotesensing 11 01008 g006
Figure 7. On the left-hand side: results for the case involving a mining tremor which occurred in the period between t18 and t19, without the model of atmospheric component reduction. On the right-hand side: the same case, but with the reduction model. The graph in the middle (on the right) represents the values of atmospheric components. The graphs in the bottom show increment dynamics of the simulated ground surface subsidences. The dashed red line indicates the profile.
Remotesensing 11 01008 g007
Figure 8. Results of the third test case which involved a mining tremor located outside the surface area influenced by mining activity. The results without and with allowance for atmospheric correction, on the left-hand side and on the right-hand side, respectively. The dashed red line indicates the profile and the location of the tremor is indicated with the violet polygon.
Remotesensing 11 01008 g008
Figure 9. Calculation results of LOS displacements for the LGCB region obtained from two paths: 22 (above) and 73 (below). The figure presents total LOS displacements for the analyzed period, with the maps on the left-hand side showing the results without allowance for the atmospheric correction. The right-hand side part of the image shows total displacements with allowance for the atmospheric correction. Black dots indicate points for which displacement versus time graphs were plotted.
Remotesensing 11 01008 g009
Figure 10. Ground subsidences determined for the same area: the graph above represents path 22 and the graph below—path 73. Successive curves correspond to 6-day increments of surface subsidences.
Remotesensing 11 01008 g010
Figure 11. Comparison of the results of LOS calculations without and with allowance for atmospheric correction (black dots and red dots, respectively). Locations of selected points are shown in Figure 9.
Remotesensing 11 01008 g011
Figure 12. Location of the cross-sections which served as a basis for displacement graphs.
Remotesensing 11 01008 g012
Figure 13. Graphs representing ground displacements on selected profiles. Continuous lines indicate total ground displacements for the complete analyzed period. The red line represents path 22 and the blue line—path 73. Dashed lines denote mean annual velocities [mm/y].
Remotesensing 11 01008 g013
Figure 14. Results of test calculations—displacements of the point in the central part of the subsidence trough. The black line represents displacements in the first case (see Section 5.1), without the mining tremor and with the atmospheric component reduction model. The green line represents displacements in the second case, with the mining tremor and without the atmospheric component reduction model. The blue line represents displacements in the third case, with the mining tremor and with the atmospheric component reduction model. The area denoted in red corresponds to the period in which the tremor was simulated.
Remotesensing 11 01008 g014
Figure 15. Displacement results for three selected mining tremors. Left-hand side: displacement results for the two paths. Right-hand side: results of atmospheric components before and after the tremor, respectively.
Remotesensing 11 01008 g015
Table 1. Comparison of some mining tremors in Poland and in the world, depending on the type of mined material. The table also includes examples of how SAR data are used to facilitate the detection of ground surface changes due to mining tremors.
Type of Mined MaterialExamples in LiteratureExamples of SAR Data Usage, Parentheses Contain the Name of the Satellite Which Provided the Data
hard coal[33,34,35,36,37][38,39]
lignite[40]-
natural gas and oil extracted
with the use of hydraulic
fracturing and traditional methods ⇒[41,42,43,44,45,46][43,47]
Carbon Capture and Storage (CCS)[45,48,49]-
geothermal field[50,51][24,52,53]
injection (saline water)[54,55,56,57,58,59,60][61,62]
other mined materials[36,63,64,65,66,67][68,69]
Table 2. Scene acquisition basic information.
Path2273
satellitesSentinel 1A/1BSentinel 1A/1B
number of SAR data acquired123122
time range06/12/2014 ÷ 19/05/201815/11/2014 ÷ 15/05/2018
number of interferograms420436
Table 3. Calculation results for 23 selected mining tremors which occurred in the LGCB region between 2014 and 2018.
Date and Time of Event (UTC) (Day/Month/Year)Tremor2273Observed Event
[ M w ]before ÷ afterbefore ÷ afterLOSAPS
(Day/Month/Year)(Day/Month/Year)22732273
05/05/2018-03:40:56 PM4.001/05/2018 ÷ 07/05/201804/05/2018 ÷ 10/05/2018
14/04/2018-03:58:52 PM4.113/04/2018 ÷ 19/04/201810/04/2018 ÷ 16/04/2018
26/12/2017-11:15:31 AM4.526/12/2017 ÷ 01/01/201823/12/2017 ÷ 29/12/2017++++
07/12/2017-05:42:50 PM4.102/12/2017 ÷ 08/12/201705/12/2017 ÷ 11/12/2017++++
10/11/2017-11:19:07 AM4.308/11/2017 ÷ 14/11/201705/11/2017 ÷ 11/11/2017++/−++
27/10/2017-05:12:14 AM4.027/10/2017 ÷ 02/11/201724/10/2017 ÷ 30/10/2017+++/−+
31/05/2017-08:25:26 PM4.530/05/2017 ÷ 11/06/201727/05/2017 ÷ 02/06/2017
08/04/2017-10:23:13 PM4.331/03/2017 ÷ 12/04/201728/03/2017 ÷ 09/04/2017+/−+++
17/03/2017-08:50:19 AM4.207/03/2017 ÷ 19/03/201716/03/2017 ÷ 28/03/2017+/−+++
04/03/2017-04:46:10 PM4.123/02/2017 ÷ 07/03/201704/03/2017 ÷ 16/03/2017
16/12/2016-06:46:51 AM4.613/12/2016 ÷ 25/12/201610/12/2016 ÷ 22/12/2016++++
29/11/2016-08:09:42 PM4.519/11/2016 ÷ 01/12/201628/11/2016 ÷ 10/12/2016++++
17/10/2016-11:50:33 PM4.314/10/2016 ÷ 26/10/201611/10/2016 ÷ 23/10/2016++/−++
14/09/2016-07:59:09 AM4.114/19/2016 ÷ 26/09/201605/09/2016 ÷ 17/09/2016
13/08/2016-12:00:58 PM4.309/08/2016 ÷ 21/08/201631/07/2016 ÷ 24/08/2016
02/06/2016-04:08:57 AM4.029/05/2016 ÷ 10/06/201601/06/2016 ÷ 13/06/2016
11/05/2016-04:01:36 AM4.023/04/2016 ÷ 17/05/201608/05/2016 ÷ 20/05/2016
09/09/2015-07:30:16 PM4.008/09/2015 ÷ 20/09/201525/07/2015 ÷ 23/09/2015
19/07/2015-07:18:06 PM4.210/07/2015 ÷ 22/07/201513/07/2015 ÷ 25/07/2015
08/07/2015-06:53:20 AM4.428/06/2015 ÷ 10/07/201501/07/2015 ÷ 13/07/2015
05/02/2015-04:43:59 AM4.004/02/2015 ÷ 16/02/201526/01/2015 ÷ 07/03/2015+/−+/−++
28/01/2015-01:10:45 AM4.323/01/2015 ÷ 04/02/201526/01/2015 ÷ 07/02/2015
12/12/2014-02:50:00 AM4.106/12/2014 ÷ 18/12/201409/12/2014 ÷ 02/01/2015+/−+/−++
the + sign indicates that a tremor was observed on an interferogram or on the atmospheric component. The − sign indicates that no tremor was observed. The +/− sign indicates that the occurrence of a tremor could be neither definitely confirmed nor definitely negated.