Article

Retrieving Foliar Traits of Quercus garryana var. garryana across a Modified Landscape Using Leaf Spectroscopy and LiDAR

1
Department of Forest Resources Management, University of British Columbia, 2424 Main Mall, Vancouver, BC V6T 1Z4, Canada
2
Department of Forest and Wildlife Ecology, University of Wisconsin-Madison, 1630 Linden Drive, Madison, WI 53706, USA
*
Author to whom correspondence should be addressed.
Remote Sens. 2020, 12(1), 26; https://doi.org/10.3390/rs12010026
Submission received: 21 November 2019 / Revised: 11 December 2019 / Accepted: 15 December 2019 / Published: 19 December 2019
(This article belongs to the Special Issue Hyperspectral Remote Sensing for Biodiversity Mapping)

Abstract

:
Understanding the ecological effects of human activities on an ecosystem is integral to the implementation of conservation management plans. The plasticity of plant functional traits presents an opportunity to examine the capacity for intraspecific functional trait variations to be indicators of anthropogenic landscape modifications. The presence of intraspecific trait variation would indicate that plants of a single species could to be used to evaluate and map functional diversity, a common metric used to measure biodiversity. This study uses leaf spectroscopy, light detection and ranging (LiDAR) and partial least squares regression (PLSR) to examine the intraspecific variation of functional traits in a population of 40 Quercus garryana experiencing varying levels of anthropogenic influence at the site level (<0.3 km2) in Duncan, B.C., Canada. These individuals vary in their spatial relationship to roads, agricultural land use change and an encroaching Coastal Douglas-fir forest. A total of 14 functional traits were estimated using pre-determined PLSR coefficients from a multi-species dataset. LiDAR data for each tree and were organized into functional categories based on their influence of plant lifeform, leaf growth or leaf structure. Principal components analysis was performed on each functional category to determine the relative influence of each trait. Results show that leaf growth and lifeform functional trait categories express significant variation in relation to three anthropogenic landscape modifications, while traits associated to leaf structure only varied between land use types (p = 0.05). Diameter at breast height (DBH), mass-based chlorophyll and leaf mass per area (LMA) showed the strongest variation across treatments. These findings support the hypothesis that trait variation exists in small populations of the same species and illustrate that spectroscopy can be used to indirectly sense land use via the leaf functional traits of a single tree species.

Graphical Abstract

1. Introduction

The current speed and scale of anthropogenic landscape modification is unprecedented [1,2]. With such high capacity for human actions to inflict biotic and abiotic change, it is increasingly necessary to accurately monitor the health of ecosystems in a timely manner [3]. The application of remote sensing techniques to evaluate relevant ecosystem characteristics, such as biodiversity and plant health, provide opportunities to achieve these goals [4] and improvements in sensor technology, deployment platforms and computing are enabling new monitoring methodologies at multiple spatial scales [5,6,7]. One technique that has benefited from these recent developments is the use of spectroscopy to identify plant functional traits [8,9,10,11]. These traits, which relate to plant growth and development strategies, provide biologically relevant information relating to photosynthesis and environmental drivers such as nutrient, water and stress regimes [12,13,14,15]. When evaluated at a site- or landscape-level, plant functional traits can be used to map functional diversity, community assembly and other ecosystem characteristics linked with biodiversity [16].
A knowledge gap exists, however, with regards to intraspecific functional trait variation at the site-level (<1 km2) [17]. Intraspecific trait variation (ITV) has been largely underrepresented in spectroscopic studies of natural ecosystems as many ecological studies assume that interspecific variation is much larger than intraspecific variation [17]. This assumption inherently ignores the variation present between individuals of the same species by averaging their trait values into a species mean. Recent studies have shown that ITV exists and is an important factor when evaluating plant functional traits at the community-level [18,19,20,21].
Correct interpretation of plant health is especially important in fragmented ecosystems that contain high-levels of biodiversity, making spectroscopy-based ITV increasingly relevant for the management of these areas. The conventional approach for understanding the effects of these modifications in the ITV of a species across a single site would include complete soil and vegetation sampling over multiple years, as well as long-term plot monitoring [22,23,24]. Considering the expense and time associated with these tasks, it is unlikely that this approach is feasible for the majority of land managers. It is necessary, then, to identify methodologies that are both cost- and time-efficient, while still providing relevant information.
In landscapes with significant anthropogenic modification, the use of spectroscopy to estimate functional traits offers significant potential. However, there is an inherent risk of mixing the spectral properties of leaves when using remotely sensed imagery with a spatial resolution coarser than a single leaf [25,26]. Therefore, methodologies that establish relationships between leaf level spectra and individual traits are critical before attempting to scale these relationships to coarser pixels.
Leaf spectroscopy provides continuous spectral information across the visible, near-infrared (NIR) and shortwave infrared (SWIR) wavelengths relating to how light interacts with pigments and chemicals in leaves [27,28]. Partial least-squares regression (PLSR) [29], a key method in chemometrics, is widely used to estimate the functional traits of a sample from the values recorded in a continuous spectral signature [30,31,32,33]. An even more compete record of a trees morphological and physiological traits can be accomplished through the combination of spectral data with measurements of a tree derived from light detection and ranging (LiDAR) analysis [34,35]. The addition of these structural metrics provides insight to the variation in lifeform associated with the leaves used to derive functional traits, such as the height of the leaves above the ground.
Here we address ITV using Quercus garryana var. garryana Douglas ex Hook (Garry Oak) in British Columbia (B.C.), Canada as a test species. In general, functional traits of the genus Quercus vary significantly based on environment [36,37,38], suggesting that ITV may be present at the site-level where significant variation in human manipulation of the environment is present. Q. garryana has considerable conservation value and utility to this study as a consequence of its role in biodiversity [39] and known variability throughout its range. Q. garryana is also the flagship species for one of the most biodiverse and highly threatened ecosystems in Canada, the Garry Oak meadow [39]. These meadows exist on the south-east coast of Vancouver Island and have experienced anthropogenic influence for the majority of their history [40]. Prescribed burning was used to reduce tree seedlings, such as Ptseudotsuga menziesii var. menziesii (Mayr) Franco (Coastal Douglas-fir), as well as promote the growth of culturally important herbaceous and grass species [40]. At the turn of the 19th century, anthropogenic land use initiatives switched from preservation to urbanization. Since then, the highly arable meadows have transitioned into forest, agricultural or urban sites, disrupting the historic processes that enabled high biodiversity. The presence of these different landscapes offers the opportunity to examine the spatial variation of functional traits in relation to encroaching ecosystems. Due to their decreasing area and ecological importance, Garry Oak meadows are considered one of Canada’s most endangered ecosystems [39].
Infrastructure and fire suppression are two environmental influences controlled by anthropogenic landscape modifications that are related to the decrease of Q. garryana range area and quality. Roads, specifically, have multiple associated effects on adjacent ecosystems. Roadsides are intensively managed to preclude woody plant growth and are often dominated by exotic species, increasing the likelihood of their introduction to native systems [41]. Changes in nutrient composition are also common in landscapes adjacent to roads as automobile exhaust and de-icing agents, specifically sodium chloride (NaCl), having the potential to affect the composition of surrounding vegetation [42,43].
In conjunction with road infrastructure, fire suppression has enabled the encroachment of woody species, such as P. menziesii, into Garry Oak Ecosystems [40]. In an open meadow, these seedlings face low competition and are able to grow and recruit unimpeded [39,44]. Combined, road and fire suppression have the power to alter the traditional species, structure and nutrient composition of Garry Oak ecosystems, threatening the inherently high levels of biodiversity within. The analysis of ITV within Q. garryana will remain important as the influences of land use change on areas of high biodiversity are expected to continue [1,2].
In this paper, leaf-level spectroscopy, LiDAR and pre-determined PLSR coefficients are used to explore the intraspecific functional trait variation of Q. garryana in association with anthropogenic landscape modifications across a single site. Specifically, (1) does intraspecific functional trait variation exist between Q. garryana experiencing different land use regimes and (2) do Q. garryana experiencing the same land use regime exhibit functional trait variation in relation to the spatial distribution of anthropogenic landscape modifications. We conclude by discussing the operational implications of this work and how analysis of functional trait variation within a single species can be used to examine the functional diversity of a site as well as indirectly sense the effects of land use.

2. Materials and Methods

2.1. Study Site

The Cowichan Garry Oak Preserve (CGOP; Lat: 48°48′29.85″N, Long: 123°37′54.34″W) presents an ideal study site as it contains a large population of Q. garryana that has been managed for over 100 years and has experienced various levels of human influence. A portion of the site consists of a natural Garry Oak meadow which has been maintained through a mixture of burning and mowing (Figure 1). Other portions of the site have been used exclusively for the production of hay, providing the opportunity to examine the functional traits of leaves that developed in an agricultural environment (Figure 1). A large, heavily trafficked road spans the south-east length of the site providing a spatial reference from which to examine the association of functional trait values in relation to roads (Figure 1). The northern section of the CGOP consists of a Coastal Douglas-fir Forest (CDF) that was traditionally managed through fire, mowing and removal (Figure 1) [39].

2.2. Airborne Data Aquistion and Processing

Road vector information and LiDAR data were acquired from the B.C. Data Catalogue maintained by the B.C. Ministry of Forest, Lands and Natural Resource Operations and Rural Development and is freely available online (www.catalogue.data.gov.bc.ca). The road dataset was last updated April, 2017, while the LiDAR data of the CGOP was acquired by the Municipality of North Cowichan on 29 May 2017. The LiDAR data was collected using a Riegl Q1560 dual-channel LiDAR system at a nominal flight height of 1700m above ground level and has a density of 15 returns/m2.
A canopy height model (CHM) was created from the LiDAR point cloud using the CanopyModel function in FUSION (Forest Service of the U.S. Department of Agriculture, Seattle, WA, USA, 2014). The CHM was used to select 30 individual Q. garryana trees for sampling with five additional individuals selected from both the agricultural and natural meadow sub-sites to enable comparison between the agriculture and meadow sites (n = 40). Lifeform metrics of height, maximum crown width and height to crown base were calculated from the CHM using the ‘lascanopy’ tool provided by LAStools (rapidlasso GmbH, Gilching, DE, 2018) in ArcGIS Pro (ESRI, Redlands, CA, USA, 2018). The ‘lascanopy’ tool uses the values of each cell with the CHM raster to derive the aforementioned lifeform traits and presents them in a single attribute table (rapidlasso GmbH, Gilching, DE, 2018). Diameter at breast height (DBH) was measured in the field.

2.3. Leaf Spectroscopy

Sun-lit leaf samples were collected from each of the 40 Q. garryana individual using 18m long pruners. All leaf samples were stored on ice for no longer than 1 h. Samples stored in the cooler underwent spectroscopy, scanning and weighing no more than 8 h after collection, after which they were flash frozen until drying. An ASD FieldSpec3 portable spectroradiometer and ASD Integrating Sphere, which is a closed illumination system (Analytical Spectral Devices Inc., Boulder, CO, USA) was used to measure the reflectance spectra of each sampled leaf. White and dark references were taken before each sample was scanned to normalize the recorded radiance, which enables the calculation of reflectance [45]. Each full scan comprised the average of 20-sub scans. Three leaves per tree underwent full scans an average of 20 times to provide a mean of approximately 400 scans per leaf sample. Reflectance was measured from 350–2500 nm and the values of each spectral band were the used as inputs for the partial least square regression (PLSR) that was used to estimate plant functional trait values.

2.4. Partial Least-Squares Regression

Recent studies have proven that PLSR is effective at estimating plant functional traits from a full spectral signature (350 nm–2500 nm) [33,46]. PLSR is a multivariate calibration method ideal for the analysis of data with high-dimensionality, such as that produced through spectroscopy [29,46,47]. The PLSR model is created using a training dataset which includes the spectral signatures and chemometric results of each functional trait for every leaf within [29,48]. The model produces output coefficients that are applied to a validation dataset, which also contains a spectral signature and chemically determined values for each functional trait of every leaf within the dataset. To determine the accuracy of the PLSR coefficients, the estimated functional trait values produced by the validation dataset are compared to the chemical results [29]. For this study, the input variables are the spectral signature of 40 Quercus garryana leaves. This method is different to the traditional index-based approach of plant functional trait estimation [49].
This study utilizes PLSR leaf models and coefficients derived by Serbin 2012 using a dataset of various genera, including Quercus, from across the northern United States [50,51]. Chemical analysis of the sampled leaves was completed in order to validate the model [50,51]. The model was created using a similar fashion to those of other PLSR models designed for functional trait identification (Python, 2018) [46,50]. PLSR models for eleven functional traits were developed. The PLSR models were then applied to our spectra to provide trait estimates. This model was selected in favor of the index -based method as it employs the entire spectral signature of each sample and encompasses many genera, making it applicable for non-Quercus studies. This latter point is important as it enables the transference of methodologies employed in this study.

2.5. Principal Component Analysis

Functional traits of interest were separated into three categories based on their functional role: lifeform, leaf growth and leaf structure. Traits in the leaf growth and leaf structure categories were derived solely using coefficients from pre-existing, validated PLSR models (Table 1) [51]. Deriving functional traits in this manner highlights the ability of spectroscopy to provide information relating to a multitude of relevant plant traits. The functional traits in the lifeform category were measured principally using LiDAR (Table 1), again demonstrating the power of advanced remote sensing techniques. The PCA of each group enabled the trait with the highest amount of variation to be identified and its relationship with the other traits in the group to be extracted and analyzed. In total, 14 functional traits were evaluated in this study (Table 1).
The values of each PC were extracted for all leaf samples in this study in order to enable their use as input values for statistical analysis. Normality and equal variance tests were completed in R using base functions of the software (R Core Team, 2018). Independence was achieved as the Q. garryana individuals in this study were not sampled more than once.

2.6. Statistical Analysis

Statistical assumptions were completed to determine if the functional trait estimation data was parametric. Upon finding the data was parametric the Kruskal-Wallis rank sums test was used to evaluate ITV between the agricultural and meadow sites. ITV in spatial relation to the road and CDF anthropogenic landscape modifications was evaluated using Kendall’s Tau rank correlation coefficient test. To ensure that ITV was not spatially significant at random within the meadow a randomization test was completed. Each sample was given a random distance before Kendall’s Tau was completed. This was iterated 1000 times and the means of the resulting Tau estimates, z-statistics and p-values were recorded (Table 2). It was determined that the samples used in this study did not have spatially significant ITV in comparison to the samples evaluated at random distances.
Road, RGB and LiDAR data were all processed in ArcGIS Pro (ESRI, Redlands, CA, 2018). LiDAR data was manipulated using the LAStools ArcGIS toolbox (rapidlasso GmbH, Gilching, DE, 2018). Spectroscopic data was analyzed using a combination of ASD’s ViewSpecPro software and R (Analytical Spectral Devices Inc., Boulder, CO, USA; R Core Team, 2018). Statistical analysis was completed using the R package ‘prcomp’ (R Core Team, 2018).

3. Results

3.1. Leaf-Level Spectroscopy

Mean spectral signatures were created for the agricultural, meadow and sample population leaf samples. Clear differences in the reflectance values are observed in association with various absorption features, and therefore functional traits (Figure 2). Spectral variation is especially notable from 500–650nm (Figure 2a), wavelengths dominated by pigments, and 1400nm to 1700nm (Figure 2b), wavelengths dominated by water absorption as well as leaf structural compounds and proteins (49).

3.2. Model Performance

PLSR model evaluation indicated that 10 of the 11 functional traits evaluated were well estimated by the PLSR model with predictive accuracies ranging (R2 = 0.30 to 0.95; Table 3) [50,51]. Upon evaluation of the PLSR results, five meadow trees were removed from the analysis as the range of at least one of their functional trait estimations was outside the valid range of the model. The final sample population used for the analysis was 27 sample, 3 natural meadow and 5 agricultural Q. garryana individuals (n = 35).

3.3. Principal Component Analyses

3.3.1. PCA 1: ITV between Agricultural and Meadow Sub-Sites

The loadings of PC1 from each functional trait category were determined for the analysis of variation between the agricultural sub-site and the rest of the CGOP (Table 4). From the lifeform group, diameter at breast height (DBH) had the largest influence (−0.989) on PC1, which explained 99% of the variation. This suggests that DBH has the largest amount of variation between samples. Chlorophyll ab Mass (−0.989, 99% of variation) and LMA (0.995, 68% of variation) had the largest influence on the leaf growth and leaf structure functional categories respectively. All variables in the lifeform and structure PC1s are negatively correlated, while all variables in leaf growth’s PC1 are positively correlated (Table 5).

3.3.2. PCA 2: ITV in Spatial Relation to Anthropogenic Landscape Modifications

PCA 2 (Table 5), which did not include the Q. garryana leaf samples from the agricultural site, differed from the PC1 values of PCA 1 (Table 5). DBH (−0.987, 98% of variation), chlorophyll ab mass (−0.989, 99% of variation) and LMA (−0.999, 90% of variation) still accounted for the largest amount of variation in the lifeform, leaf growth and leaf structure functional categories respectively. The fact that the same functional traits were dominant in the PC1s of both PCA 1 and PCA 2 indicates that they are more variable than other traits across the species, regardless of context.

3.4. Statistical Analysis

3.4.1. PCA 1: ITV between Agricultural and Meadow Sub-Sites

The Kruskal-Wallis test yielded significant results (alpha = 0.05) for the lifeform (<0.001), leaf growth (p = 0.05) and structure (p = 0.01) functional categories (Table 6). This indicates significant variation between functional traits of individuals at the two land use sites. The large Chi-square (χ2) value associated with the lifeform group indicates that there is large variation between the agricultural and non-agricultural individuals. Leaf growth has a χ2 of 3.80, which is ten times less than that of the lifeform group, indicating that although significant, the variation in leaf growth traits between sub-sites is considerably lower (Table 6). The χ2 of structure is 6.25, suggesting that leaf structure is more variable between sub-sites than leaf growth, but less variable than lifeform (Table 6).
Due to the nature of the Kruskal-Wallis test, it is not possible to identify how each functional trait category differs between land-use from this analysis alone. To determine this, the statistical mean of the functional trait with the highest loading in each of the functional trait categories must be examined. Table 7 shows that DBH, chlorophyll ab mass and LMA are lower in the meadow sub-site compared to the agricultural sub-site.

3.4.2. PCA 2: ITV in Spatial Relation to Anthropogenic Landscape Modifications

A significant correlation was identified between the PC1 loadings of lifeform and leaf growth functional categories and the distance to both the CDF and road anthropogenic landscape modifications using Kendall’s Tau (Table 8). The leaf structure functional category showed a suggestive relationship association with the CDF anthropogenic landscape modification, but not the road (Table 8a,b). Leaf growth’s relationship with CDF is the strongest in comparison with lifeform, while leaf structure has a suggestive rather than significant relationship (Table 8a). When associated with the road, lifeform has a less significant relationship compared to leaf growth, with leaf structure’s relationship being insignificant (Table 8b). For both the road and CDF anthropogenic landscape modifications the leaf growth functional category has the largest significant association (Table 8a,b).

4. Discussion

4.1. Remote Sensing of Intraspecific Trait Variation

The accurate use of remote sensing technologies to estimate plant functional traits has been well documented [4,10,22]. Physiological traits, such as leaf pigment content, can be derived from spectroscopy, while morphological traits, such as plant height, can be measured from LiDAR [22,52]. This paper uses a combination of these two methodologies to derive 14 functional traits from 40 individual tress of the same species. Spectroscopy at the leaf level provided the spectral information required to apply PLSR coefficients acquired from open-source, pre-validated models (Table 1) [51]. The functional trait estimations resulting from this analysis were within the acceptable range of the validated model, demonstrating that validated PLSR models are transferable (Table 3) [51]. This is significant as the cost and time required to collect and validate PLSR models is considerable.
The LiDAR data used to estimate morphological functional traits in this study was obtained freely from the Municipality of North Cowichan. With a density of 16 points/m2, this dataset provides excellent representation of tree crowns and allows for the accurate derivation of traits like tree height [52]. Due to the open-source nature of this LiDAR data considerable time and cost were avoided when compared to measuring these attributes in the field.
The efficiency of acquiring remotely sensed and open-source data makes it possible to derive accurate functional traits within weeks of collecting leaf level spectral information. This reality means that land managers could have access to quantifiable information about functional traits across their site within a timeframe appropriate to undertake meaningful action. To make use of this potential, the focus of our research was on a relatively underrepresented area of functional trait analysis: intraspecific variation. This research demonstrates the ability of remotely sensed technologies to enable the analysis of intraspecific functional trait variation with respect to anthropogenic landscape modifications and identify the main drivers of functional diversity across the site.

4.2. Spectral Separation

Visual examination of the mean spectral signatures of the meadow, agriculture and sample populations indicates that the agricultural and meadow trees vary in multiple areas of the electromagnetic spectrum between 350 nm and 2500 nm. Separation between the signatures in Figure 2a from 500 nm to 600 nm suggests that there are differences in the pigments associated with leaf growth, such a chlorophyll and anthocyanin, between individuals living in the two land use types [10,49,53]. Variation in structural components, such as cellulose or lignin, and possibly proteins, is suggested by differences in the reflectance values between 1400nm and 1700nm in Figure 2b (10,49,53). This simple examination of the mean spectral signatures from two sub-population in relation to the mean signature of the sample population supports further examination of the intraspecific variation of Q. garryana through the two hypotheses of this study. The use of leaf based spectroscopy and derivation of traits is replicable and can be applied across species, enabling an efficient exploration of variance for managers interested in evaluating the ITV in a species of concern.

4.3. Model Performance

In order to derive traits, we utilized a large North American database of plant spectral, pigment and chemical traits, including samples from a range of Oaks, the key genus in this study. These coefficients are derived from PLSR models with validation R2 ranged from 0.30–0.95, while validation nRMSE ranged from 4.6–19.15% [50,51]. Only δ15N was removed from the analysis due to low validation R2 (<0.30). The ten traits determined through PLSR demonstrated reasonable mean values and standard deviations (Table 3). By using this model, this study demonstrates that a multi-species, pre-validated dataset can be used to explore intraspecific variation within a single population. This is important as it suggests a single, multi-genera dataset can be used to estimate plant functional traits within a population and across a variety of landscapes.

4.4. Functional Trait Categories

The results of both PCA 1 and PCA 2 determined that the greatest variation in lifeform, leaf growth and leaf structural functional trait categories was found in each of their PC1s, with DBH, chlorophyll ab mass and LMA having the highest influence respectively. The PC1 of each functional category explained over 68% of the variation between samples, so it was used exclusively in the statistical analysis. However, it is also possible to evaluate the presence of ITV for a desired trait by using the values of the principal component in which said trait explains the highest proportion of the variance. This could prove useful for managing the drivers of a specific trait across a landscape.

4.5. Functional Trait Variation due to Land Use

Results support the hypothesis that functional trait variation exists in Q. garryana of the same population experiencing different land use pressures. These results are consistent with other studies exploring intraspecific variation through spectroscopy [18,53]. The Kruskal-Wallis rank sums test found a significant level of variation when comparing each of the functional trait groups of individuals persisting in an agricultural environment with those living throughout the rest of the CGOP. Specifically, traits related to lifeform (p = <0.001) and leaf structure (p = 0.01), such as DBH and LMA respectively, had higher values in the agricultural sub-site, while individuals from the meadow had higher values for leaf growth (p = 0.05) (Figure 3). Increased LMA values for individuals in the agricultural sub-site suggests that these trees are growing thicker leaves to increase their resistance to stress, such as agro-centric management practices including the removal of competitors, the addition of fertilizers and consistent watering.
Lifeform functional traits proved to be the most variant between sites (p < 0.001, χ2 of 38.24), with mean DBH being significantly lower in the meadow (32.12 cm) compared to the agricultural (125.14 cm) sub-site (Table 7). Management practices such as the removal of competitors could be a possible reason for this. These findings suggest that it is important to acknowledge the impacts of land use change on the functional strategies related to overall tree size and shape. The leaf growth functional trait category also showed significant differences between the agricultural and meadow sub-sties (p = 0.05, χ2 = 3.80), with Q. garryana individuals in the meadow (7207.43 ng/mg) exhibiting lower chlorophyll ab mass values that those in the agricultural (9463.48 ng/mg) sub-site (Table 7). These variations could be due to the consistent addition of fertilizers to the soil over the last century. ITV related to leaf structure was also proven significant (p < 0.001, χ2 = 6.25), with LMA in the agricultural sub-site (170.85 g/m2) being larger than LMA in the meadow (134.74 g/m2) sub-site. This suggests that functional traits such as LMA can vary based on land use techniques, recognizing that LMA is indicative of overall plant health and a leaf’s investment in photosynthesis versus longevity [31].

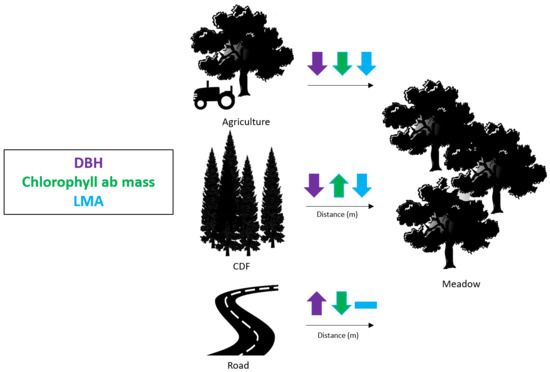
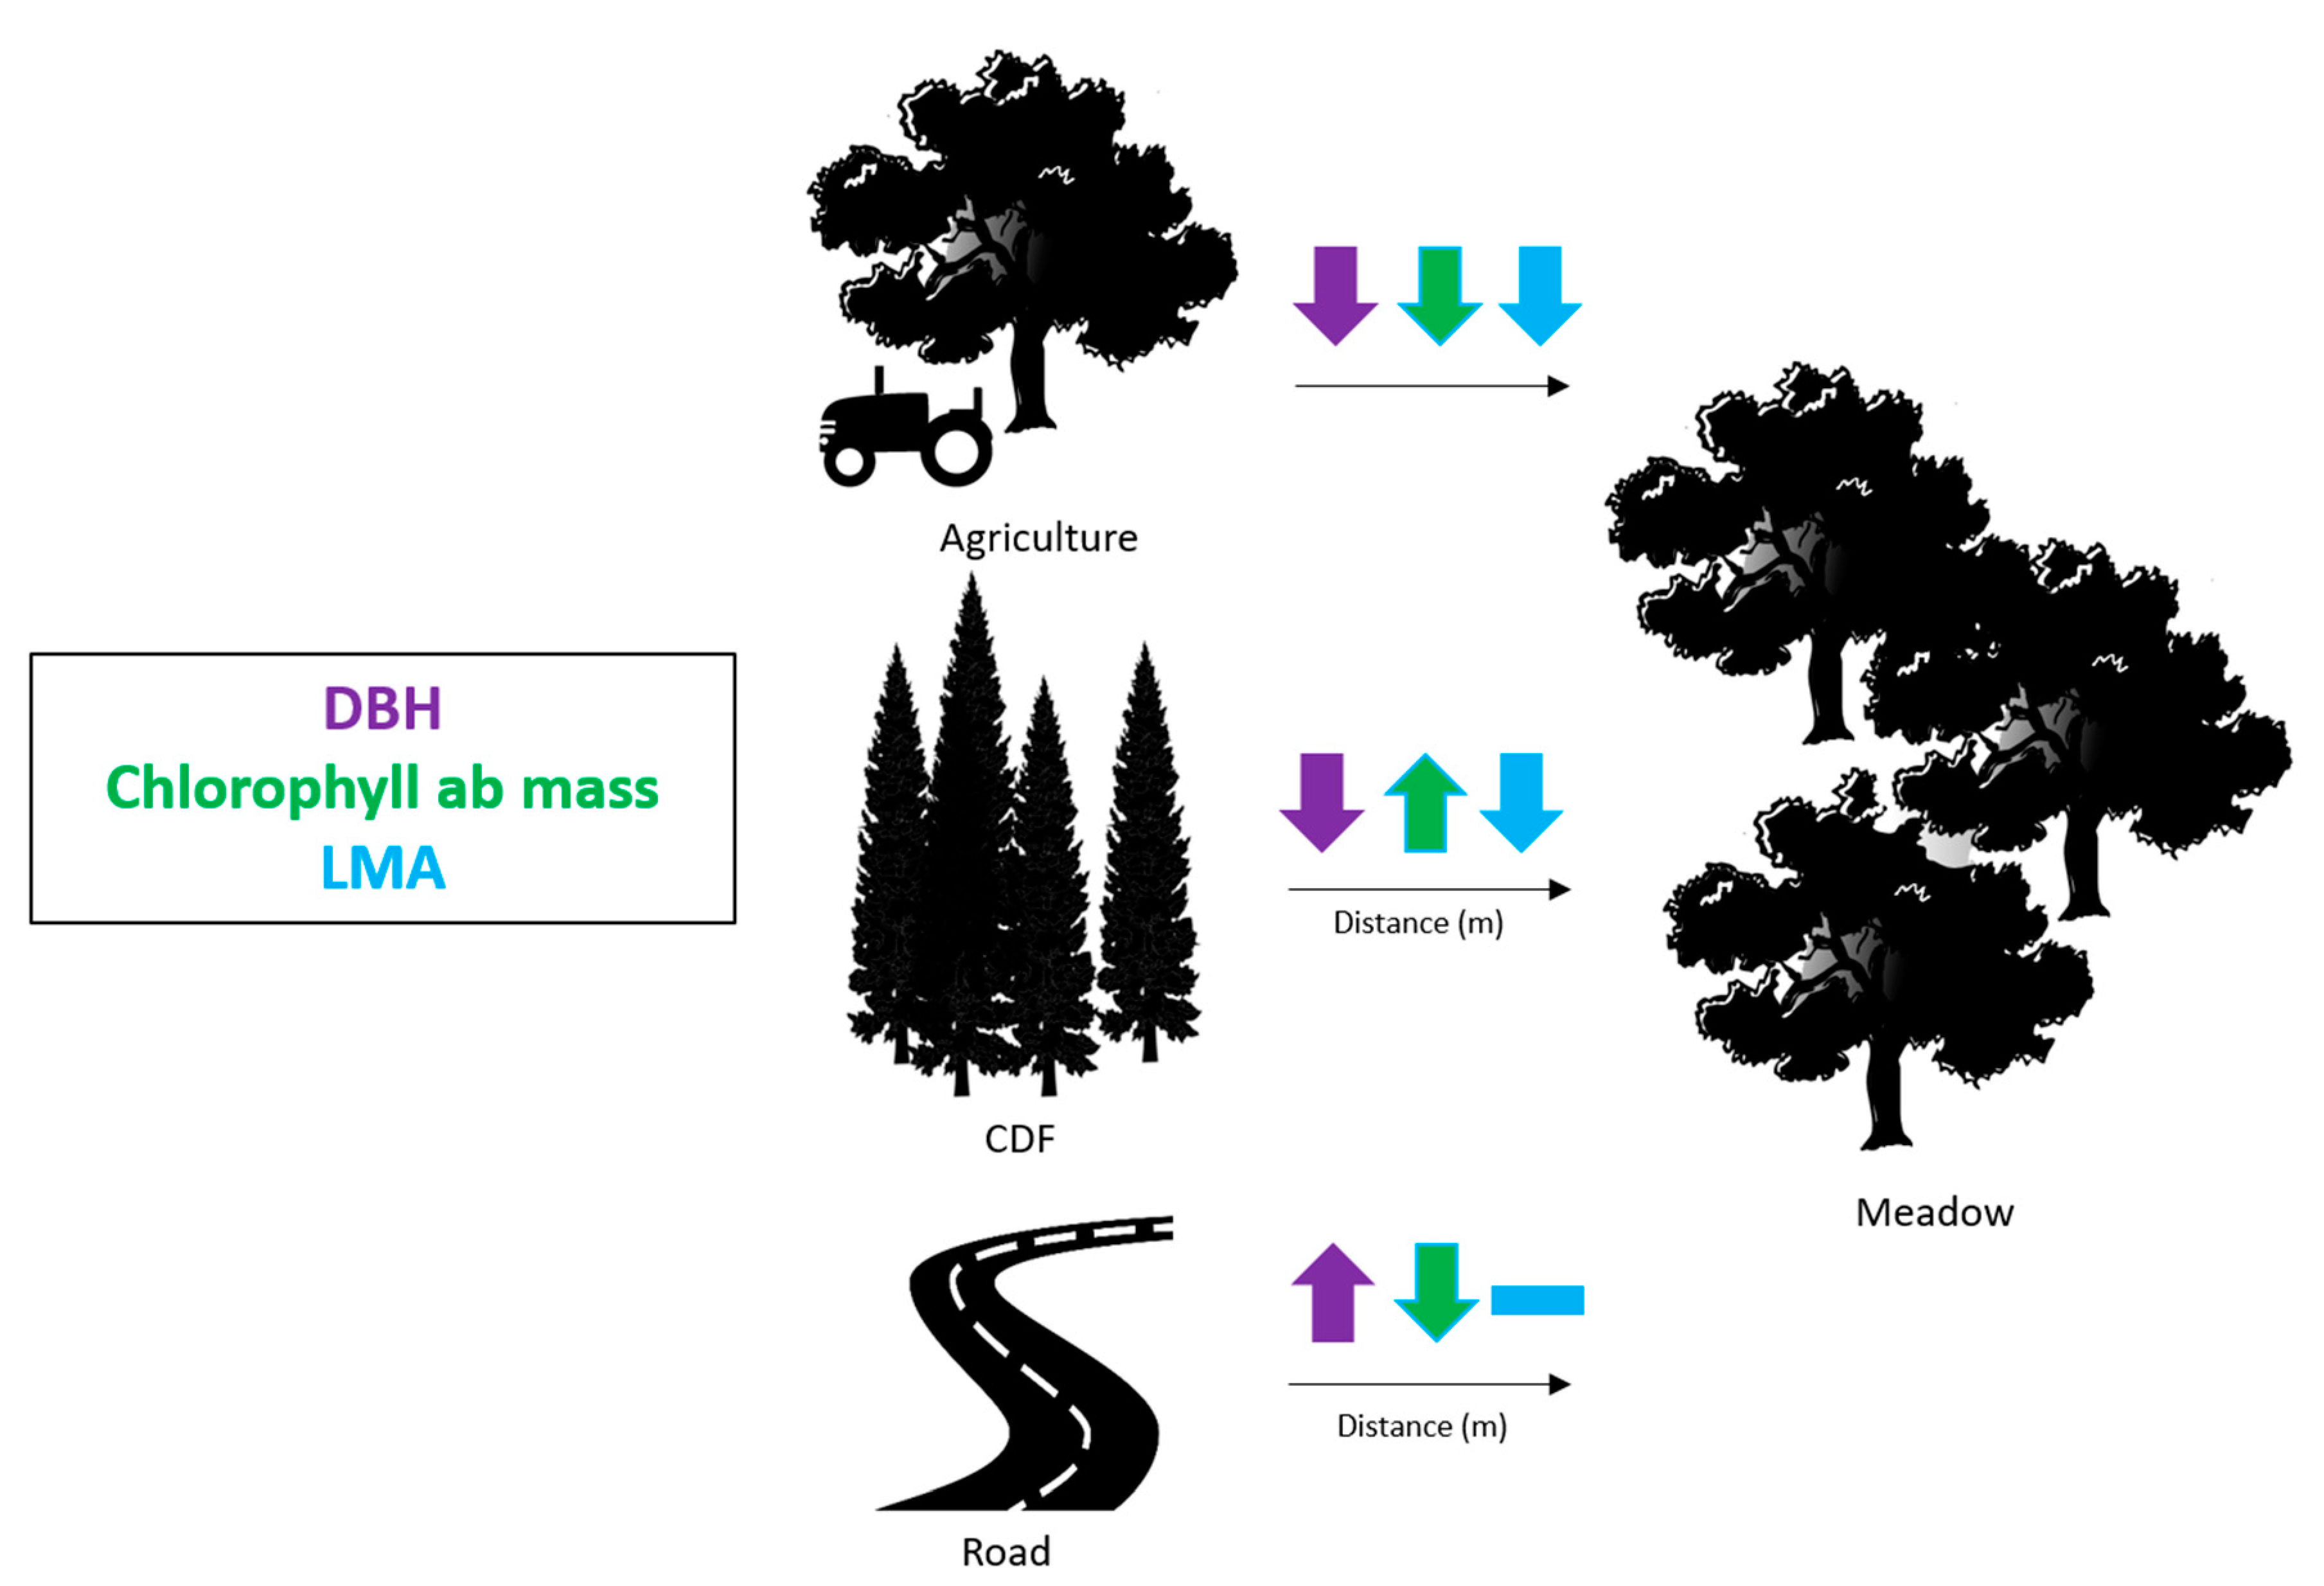
4.6. Functional Trait Variation in Relation to Landscape Modifications

Significant correlations of ITV were found with respect to the spatial relationship of Q. garryana individuals and both CDF and road anthropogenic landscape modifications, supporting the second hypothesis of this study (Table 8a,b). Kendall’s tau rank sum test also found that functional trait categories are affected differently by each of the anthropogenic landscape modifications and suggests that each modification invokes unique environmental changes. This supports the findings of other studies that anthropogenic landscape features can alter the functional strategies of plants [2].
Lifeform traits changed significantly depending on an individual’s distance to the CDF (p = <0.001) (Table 8a). DBH, for example, decreased as distance to the CDF increased, suggesting that individuals are shifting their lifeform strategies based on the association with this competing ecosystem (Figure 3). The growth functional trait category (p < 0.001) also shows a significant relationship to the distance of an individual Q. garryana from the CDF and suggests that leaf chlorophyll increases as distance from the CDF increases. Correlation between the leaf structure (p = 0.069) functional trait category and the CDF is suggestive, implying that Q. garryana individuals may also change their leaf structure based on proximity to competitors, with leaf structural values associated with stress tolerance decreasing with distance (Figure 3) [39,40]. This is interesting as leaf structure is related to a leaf’s defensive capabilities and longevity [13,54,55]. These findings suggest that individuals closer to the CDF have a higher stress tolerance, which could be caused by a more favorable microclimate compared to individuals living in the open meadow.
Similar correlations were found between the functional trait category of each sample and their distance to the main road (Table 8b), supporting the hypotheses that intraspecific functional trait variation exists in relation to the spatial distribution of various anthropogenic landscape modifications. Lifeform (p = 0.004) values decreased as distance from the road increased, while leaf growth (p = 0.002) values increased (Figure 3). This could be due to changes in the nutrient composition of the soil closer to roads, with runoff and de-icing agents like NaCl affecting leaf growth [42,43]. The relationship between the leaf structure functional trait category (p = 0.243) and the road anthropogenic landscape modification was found to be insignificant. The associations between the three functional trait categories and the road anthropogenic landscape modification was inverse to the relationship of those groups with the CDF. This suggests that the influence of the road and CDF affect the lifeform, leaf growth and leaf structure strategies of Q. garryana in different manners. If this is the case, managers should deploy mitigation efforts for each anthropogenic influence separately, such as salt loading in the winter or excess ground water due to runoff from the road, rather than prescribing a site-wide plan [42]. The presence of significant intraspecific variation also suggests that Quercus trees should be considered individually when using functional traits to determine biodiversity metrics as the values of many traits vary in association with different anthropogenic landscape modifications.
In a biodiversity management context, where this project has key implications, our results imply that functional traits of Q. garryana should be considered on an individual-plant basis. When mapping functional traits across a site, for example, intraspecific variations among trees may provide insight relating to the relative functional diversity of one sub-site in relation to another. This information could be used to determine which treatment is necessary at specific locations as well as provide general, site-level context to other biodiversity metrics such as species diversity and species composition across sub-sites.

4.7. Future Directions

This research advances the use of image spectroscopy for conservation science. First, as universal ITV approaches are becoming more prevalent, through the use of standardized equations, it is always important to ensure the predictions of traits are valid and accurate. Ongoing research to develop models between measured traits and spectra thus remains an ongoing concern.
Importantly, by utilizing advanced remote sensing techniques we are able to extend these observations in both time and space to make the results more relevant in a conservation framework. Acquiring data from a sensor on an unmanned aerial vehicle (UAV), as opposed to ground-based measurements, would allow more species to be sampled over a broader landscape. The collection of imaging spectroscopy from UAVs would also enable the hypotheses presented in this study to be tested at a larger spatial scale, enhancing the context in which results can be interpreted. This would be the most time and cost effective image acquisition protocol, allowing agencies to assess species traits over time and across scales relevant to management goals.
This research lays the ground work for space based applications. With the imminent launch of EnMAP (Environmental Mapping and Analysis Program) by the German Aerospace Center and the potential for future missions from other nations, imaging spectroscopy from space offers tantalizing possibilities. While spatial resolutions will not allow individual canopy traits to be assessed at the individual crown scale, forest stand or community traits could be, allowing these hypothesis to be tested over larger spatial extents and routinely over time.
Examination of these differences at a larger spatial resolution would also be beneficial to this study. This would enhance the timeliness of similar studies by improving the temporal resolution of data collection and enable rapid assessment of plant functional traits. The ability of managers to quickly and accurately identify changes in plant health related to anthropogenic landscape modifications, such as functional traits is key to improving on the research presented in this study.

5. Conclusions

Overall, the results presented in this study support the hypotheses that intraspecific functional trait variation exists within a population experiencing different land uses and in relation to various anthropogenic landscape modifications. This study also successfully begins to bridge the knowledge gap between intraspecific functional trait variations at the landscape- and site-levels. The methodology presented in this research provides a simple, replicable and relatively inexpensive baseline on which future studies examining functional trait variation can expand. For example, the coefficients used to estimate each of the leaf growth and leaf structure functional traits were determined by conducting PLSR on a spectral database containing various different genera, rather than Quercus alone. This variety suggests that examination of intraspecific trait variation is possible for the other genera, or species, represented in the database. For many land managers, this could improve efficiency as they would not be required to create and validate their own spectral datasets.

Author Contributions

Conceptualization P.W.H. and N.C.C.; methodology, P.W.H. and N.C.C.; software, P.W.H. and N.C.C.; validation, P.A.T. and Z.W.; formal analysis, P.W.H.; investigation, P.W.H.; resources, N.C.C. and P.A.T.; data curation, P.W.H.; writing—Original draft preparation, P.W.H. and N.C.C.; writing—Review and editing, P.W.H., N.C.C., P.A.T., Z.W.; visualization, P.W.H. and N.C.C.; supervision, N.C.C.; project administration, N.C.C.; funding acquisition, N.C.C. and P.A.T. All authors have read and agreed to the published version of the manuscript.

Funding

This study was completed as part of the Canadian Airborne Biodiversity Observatory (CABO), which is funded by NSERC Discovery Frontiers grant 509190-2017. Support to PAT and ZW from US National Science Foundation Macrosystems Biology and NEON-Enabled Science grant 1638720.

Acknowledgments

The authors would like to thank the Nature Conservancy of Canada for allowing us to conduct our research on their Cowichan Garry Oak Preserve site. We would also like to thank Etienne Laliberté Institut de recherche en biologie végétale at the Université de Montréal for his input into the study design and final manuscript. The authors would also like to acknowledge Irv Banman for providing information relating to the historic land use of the site. This information was instrumental in formulating our research questions. We also thank the Municipality of North Cowichan for sharing their LiDAR data. We further thank Lukas Jarron, Marco Sanelli, Francois du Toit, and George Cheng for their leaf spectroscopy work. The use of specific equipment, software or trade names do not indicate endorsement by the authors.

Conflicts of Interest

The authors declare no conflicts of interest. The funders had no role in the design of the study; in the collection, analyses, or interpretation of data; in the writing of the manuscript, or in the decision to publish the results.

References

  1. Steffen, W.; Grinevald, J.; Crutzen, P.; Mcneill, J. The anthropocene: Conceptual and historical perspectives. Philos. Trans. R. Soc. A Math. Phys. Eng. Sci. 2011, 369, 842–867. [Google Scholar] [CrossRef]
  2. Johnson, C.N.; Balmford, A.; Brook, B.W.; Buettel, J.C.; Galetti, M.; Guangchun, L.; Wilmshurst, J.M. Biodiversity losses and conservation responses in the Anthropocene. Science 2017, 356, 270–275. [Google Scholar] [CrossRef] [PubMed]
  3. Zeller, U.; Starik, N.; Göttert, T. Biodiversity, land use and ecosystem services—An organismic and comparative approach to different geographical regions. Glob. Ecol. Conserv. 2017, 10, 114–125. [Google Scholar] [CrossRef]
  4. Kerr, J.T.; Ostrovsky, M. From space to species: Ecological applications for remote sensing. Trends Ecol. Evol. 2003, 18, 299–305. [Google Scholar] [CrossRef]
  5. Bock, C.H.; Poole, G.H.; Parker, P.E.; Gottwald, T.R. Plant disease severity estimated visually, by digital photography and image analysis, and by hyperspectral imaging. CRC Crit. Rev. Plant Sci. 2010, 29, 59–107. [Google Scholar] [CrossRef]
  6. Eitel, J.U.H.; Gessler, P.E.; Smith, A.M.S.; Robberecht, R. Suitability of existing and novel spectral indices to remotely detect water stress in Populus spp. For. Ecol. Manag. 2006, 229, 170–182. [Google Scholar] [CrossRef]
  7. Newbold, T.; Hudson, L.N.; Phillips, H.R.P.; Hill, S.L.L.; Contu, S.; Lysenko, I.; Blandon, A.; Butchart, S.H.M.; Booth, H.L.; Day, J.; et al. A global model of the response of tropical and sub-tropical forest biodiversity to anthropogenic pressures. Proc. R. Soc. B Biol. Sci. 2014, 281, 1–10. [Google Scholar] [CrossRef] [Green Version]
  8. Van Cleemput, E.; Vanierschot, L.; Fernández-Castilla, B.; Honnay, O.; Somers, B. The functional characterization of grass- and shrubland ecosystems using hyperspectral remote sensing: Trends, accuracy and moderating variables. Remote Sens. Environ. 2018, 209, 747–763. [Google Scholar] [CrossRef]
  9. Tong, A.; He, Y. Estimating and mapping chlorophyll content for a heterogeneous grassland: Comparing prediction power of a suite of vegetation indices across scales between years. ISPRS J. Photogramm. Remote Sens. 2017, 126, 146–167. [Google Scholar] [CrossRef]
  10. Asner, G.P.; Martin, R.E. Spectranomics: Emerging science and conservation opportunities at the interface of biodiversity and remote sensing. Glob. Ecol. Conserv. 2016, 8, 212–219. [Google Scholar] [CrossRef] [Green Version]
  11. Ingh, A.D.S.; Erbin, S.H.P.S.; Eil, B.R.E.M.C.N.; Ingdon, C.L.C.K. Imaging spectroscopy algorithms for mapping canopy foliar chemical and morphological traits and their uncertainties. Ecol. Appl. 2015, 25, 2180–2197. [Google Scholar]
  12. Asner, G.P.; Martin, R.E.; Knapp, D.E.; Tupayachi, R.; Anderson, C.; Carranza, L.; Martinez, P.; Houcheime, M.; Sinca, F.; Weiss, P. Spectroscopy of canopy chemicals in humid tropical forests. Remote Sens. Environ. 2011, 115, 3587–3598. [Google Scholar] [CrossRef]
  13. Kitajima, K.; Joseph Wright, S.; Westbrook, J.W. Leaf cellulose density as the key determinant of inter-and intra-specific variation in leaf fracture toughness in a species-rich tropical forest. Interface Focus 2016, 6, 20150100. [Google Scholar] [CrossRef] [PubMed]
  14. Butler, E.E.; Datta, A.; Flores-Moreno, H.; Chen, M.; Wythers, K.R.; Fazayeli, F.; Banerjee, A.; Atkin, O.K.; Kattge, J.; Amiaud, B.; et al. Mapping local and global variability in plant trait distributions. Proc. Natl. Acad. Sci. USA 2017, 201708984. [Google Scholar] [CrossRef] [PubMed] [Green Version]
  15. Serbin, S.P.; Singh, A.; Desai, A.R.; Dubois, S.G.; Jablonski, A.D.; Kingdon, C.C.; Kruger, E.L.; Townsend, P.A. Remotely estimating photosynthetic capacity, and its response to temperature, in vegetation canopies using imaging spectroscopy. Remote Sens. Environ. 2015, 167, 78–87. [Google Scholar] [CrossRef]
  16. Schmidtlein, S.; Feilhauer, H.; Bruelheide, H. Mapping plant strategy types using remote sensing. J. Veg. Sci. 2012, 23, 395–405. [Google Scholar] [CrossRef]
  17. Albert, H.; Violle, C.; Enquist, B.J.; Mcgill, B.J.; Jiang, L.; Hulshof, C.; Jung, V.; Messier, J. The return of the variance: Intraspecific variability in community ecology. Cell 2012, 27, 244–252. [Google Scholar]
  18. Albert, C.H.; Thuiller, W.; Yoccoz, N.G.; Douzet, R.; Aubert, S.; Lavorel, S. A multi-trait approach reveals the structure and the relative importance of intra- vs. interspecific variability in plant traits. Funct. Ecol. 2010, 24, 1192–1201. [Google Scholar] [CrossRef]
  19. Asner, G.P.; Martin, R.E. Canopy phylogenetic, chemical and spectral assembly in a lowland Amazonian forest. New Phytol. 2011, 189, 999–1012. [Google Scholar] [CrossRef]
  20. Zagajewski, B.; Tømmervik, H.; Bjerke, J.W.; Raczko, E.; Bochenek, Z.; Klos, A.; Jarocińska, A.; Lavender, S.; Ziólkowski, D. Intraspecific differences in spectral reflectance curves as indicators of reduced vitality in high-arctic plants. Remote Sens. 2017, 9, 1289. [Google Scholar] [CrossRef] [Green Version]
  21. Siefert, A.; Violle, C.; Chalmandrier, L.; Albert, C.H.; Taudiere, A.; Fajardo, A.; Aarssen, L.W.; Baraloto, C.; Carlucci, M.B.; Cianciaruso, M.V.; et al. A global meta-analysis of the relative extent of intraspecific trait variation in plant communities. Ecol. Lett. 2015, 18, 1406–1419. [Google Scholar] [CrossRef] [PubMed] [Green Version]
  22. Asner, G.P.; Martin, R.E. Airborne spectranomics: Mapping canopy chemical and taxonomic diversity in tropical forests. Front. Ecol. Environ. 2009, 7, 269–276. [Google Scholar] [CrossRef] [Green Version]
  23. Zhao, Y.; Zeng, Y.; Zheng, Z.; Dong, W.; Zhao, D.; Wu, B.; Zhao, Q. Forest species diversity mapping using airborne LiDAR and hyperspectral data in a subtropical forest in China. Remote Sens. Environ. 2018, 213, 104–114. [Google Scholar] [CrossRef]
  24. Ustin, S.L.; Asner, G.P.; Gamon, J.A.; Fred Huemmrich, K.; Jacquemoud, S.; Schaepman, M.; Zarco-Tejada, P. Retrieval of quantitative and qualitative information about plant pigment systems from high resolution spectroscopy. Remote Sens. Environ. 2009, 113, S67–S77. [Google Scholar] [CrossRef] [Green Version]
  25. Tooke, T.R.; Coops, N.C.; Goodwin, N.R.; Voogt, J.A. Extracting urban vegetation characteristics using spectral mixture analysis and decision tree classifications. Remote Sens. Environ. 2009, 113, 398–407. [Google Scholar] [CrossRef]
  26. Plaza, J.; Hendrix, E.M.T.; García, I.; Martín, G.; Plaza, A. On endmember identification in hyperspectral images without pure pixels: A comparison of algorithms. J. Math. Imaging Vis. 2012, 42, 163–175. [Google Scholar] [CrossRef]
  27. Wu, C.; Niu, Z.; Tang, Q.; Huang, W. Estimating chlorophyll content from hyperspectral vegetation indices: Modeling and validation. Agric. For. Meteorol. 2008, 148, 1230–1241. [Google Scholar] [CrossRef]
  28. Schweiger, A.K.; Cavender-Bares, J.; Townsend, P.A.; Hobbie, S.E.; Madritch, M.D.; Wang, R.; Tilman, D.; Gamon, J.A. Plant spectral diversity integrates functional and phylogenetic components of biodiversity and predicts ecosystem function. Nat. Ecol. Evol. 2018, 2, 976–982. [Google Scholar] [CrossRef]
  29. Wold, S.; Sjostrom, M. PLS-regression: A basic tool of chemometrics. Chemom. Intell. Lab. Syst. 2001, 109–130. [Google Scholar] [CrossRef]
  30. Feilhauer, H.; Asner, G.P.; Martin, R.E. Multi-method ensemble selection of spectral bands related to leaf biochemistry. Remote Sens. Environ. 2015, 164, 57–65. [Google Scholar] [CrossRef]
  31. Dechant, B.; Cuntz, M.; Vohland, M.; Schulz, E.; Doktor, D. Estimation of photosynthesis traits from leaf reflectance spectra: Correlation to nitrogen content as the dominant mechanism. Remote Sens. Environ. 2017, 196, 279–292. [Google Scholar] [CrossRef]
  32. Middleton, E.M.; Cheng, Y.B.; Hilker, T.; Black, T.A.; Krishnan, P.; Coops, N.C.; Huemmrich, K.F. Linking foliage spectral responses to canopy-level ecosystem photosynthetic light-use efficiency at a douglas-fir forest in canada. Can. J. Remote Sens. 2009, 35, 166–188. [Google Scholar] [CrossRef]
  33. Wang, Z.; Townsend, P.A.; Schweiger, A.K.; Couture, J.J.; Singh, A.; Hobbie, S.E.; Cavender-bares, J. Remote Sensing of Environment Mapping foliar functional traits and their uncertainties across three years in a grassland experiment. Remote Sens. Environ. 2019, 221, 405–416. [Google Scholar] [CrossRef]
  34. Asner, G.P.; Martin, R.E.; Anderson, C.B.; Knapp, D.E. Quantifying forest canopy traits: Imaging spectroscopy versus field survey. Remote Sens. Environ. 2015, 158, 15–27. [Google Scholar] [CrossRef]
  35. Coops, N.C.; Hilker, T.; Wulder, M.A.; St-Onge, B.; Newnham, G.; Siggins, A.; Trofymow, J.A. Estimating canopy structure of Douglas-fir forest stands from discrete-return LiDAR. Trees Struct. Funct. 2007, 21, 295–310. [Google Scholar] [CrossRef] [Green Version]
  36. Petry, W.K.; Covelo, F.; Abdala-roberts, L.; Galma, A. Interspecific variation in leaf functional and defensive traits in oak species and its underlying climatic drivers. PLoS ONE 2018, 13, e0202548. [Google Scholar]
  37. Violle, C.; Garnier, E.; Lecoeur, J.; Roumet, C.; Podeur, C.; Navas, A.B.M. Competition, traits and resource depletion in plant communities. Oecologia 2009, 160, 747–755. [Google Scholar] [CrossRef]
  38. Gamon, J.A.; Surfus, J.S. Assessing leaf pigment content and activity with a reflectometer. New Phytol. 1999, 143, 105–117. [Google Scholar] [CrossRef]
  39. Fuchs, M.A. Towards a Recovery Strategy for Garry Oak and Associated Ecosystems in Canada: Ecological Assessment and Literature Review; Environment Canada: Victoria, BC, Canada, 2001.
  40. Bjorkman, A.D.; Vellend, M. Defining historical baselines for conservation: Ecological changes since European settlement on Vancouver Island, Canada. Conserv. Biol. 2010, 24, 1559–1568. [Google Scholar] [CrossRef]
  41. Barber, C.P.; Cochrane, M.A.; Souza, C.M.; Laurance, W.F. Roads, deforestation, and the mitigating effect of protected areas in the Amazon. Biol. Conserv. 2020, 177, 203–209. [Google Scholar] [CrossRef]
  42. Forman, T.T.; Alexander, L.E. Roads and their major ecological effects. Annu. Rev. Ecol. Syst. 1998, 29, 207–231. [Google Scholar] [CrossRef] [Green Version]
  43. Amrheln, C.; Strong, J.E.; Mosher, P.A. Effect of Deicing Salts on Metal and Organic Matter Mobilization in Roadside Soils. Environ. Sci. Technol. 1992, 26, 703–709. [Google Scholar] [CrossRef]
  44. Banman, I.; Munson, T. Restoring British Columbia’s Garry Oak Ecosystems—Principles and Practices; Victoria, BC, Canada, 2011; ISBN 9780973218145. [Google Scholar]
  45. Analytical Spectral Devices. FieldSpec ® 3 User Manual; Boulder, CO, USA, 2010. [Google Scholar]
  46. Wang, Z.; Wang, T.; Darvishzadeh, R.; Skidmore, A.K.; Jones, S.; Suarez, L.; Woodgate, W.; Heiden, U.; Heurich, M.; Hearne, J. Vegetation indices for mapping canopy foliar nitrogen in a mixed temperate forest. Remote Sens. 2016, 8, 491. [Google Scholar] [CrossRef] [Green Version]
  47. Roth, K.L.; Roberts, D.A.; Dennison, P.E.; Alonzo, M.; Peterson, S.H.; Beland, M. Differentiating plant species within and across diverse ecosystems with imaging spectroscopy. Remote Sens. Environ. 2015, 167, 135–151. [Google Scholar] [CrossRef]
  48. Mevik, B.-H.; Wehrens, R. The pls Package: Principle Component and Partial Least Squares Regression in R. J. Stat. Softw. 2007, 18, 1–24. [Google Scholar] [CrossRef] [Green Version]
  49. Curran, P.J. Remote sensing of foliar chemistry. Remote Sens. Environ. 1989, 30, 271–278. [Google Scholar] [CrossRef]
  50. Wang, Z.; Chlus, A.; Ye, Z.; Geygan, R.; Zheng, T.; Singh, A.; Couture, J.J.; Cavender-Bares, J.; Kruger, E.L.; Townsend, P.A. Foliar functional traits from imaging spectroscopy across NEON domains in the eastern U.S. New Pyhtol. under review.
  51. Serbin, S.P. Spectroscopic Determination of Leaf Nutritional, Morphological, and Metabolic Traits. 2012. Available online: https://figshare.com/articles/Spectroscopic_determination_of_leaf_nutritional_morphological_and_metabolic_traits/745311 (accessed on 4 February 2019).
  52. Sibona, E.; Vitali, A.; Meloni, F.; Caffo, L.; Dotta, A.; Lingua, E.; Motta, R.; Garbarino, M. Direct Measurement of Tree Height Provides Different Results on the Assessment of LiDAR accuracy. Forests 2017, 8, 7. [Google Scholar] [CrossRef]
  53. Curran, P.J.; Dungan, J.L.; Peterson, D.L. Estimating the foliar biochemical concentration of leaves with reflectance spectrometry: Testing the Kokaly and Clark methodologies. Remote Sens. Environ. 2001, 76, 349–359. [Google Scholar] [CrossRef]
  54. Aubin, I.; Munson, A.D.; Cardou, F.; Burton, P.J.; Isabel, N.; Pedlar, J.H.; Paquette, A.; Taylor, A.R.; Delagrange, S.; Kebli, H.; et al. Traits to stay, traits to move: A review of functional traits to assess sensitivity and adaptive capacity of temperate and boreal trees to climate change. Environ. Rev. 2016, 24, 164–186. [Google Scholar] [CrossRef]
  55. Asner, G.P.; Martin, R.E.; Carranza-Jiménez, L.; Sinca, F.; Tupayachi, R.; Anderson, C.B.; Martinez, P. Functional and biological diversity of foliar spectra in tree canopies throughout the Andes to Amazon region. New Phytol. 2014, 204, 127–139. [Google Scholar] [CrossRef] [PubMed]
Figure 1. The Cowichan Garry Oak Preserve (CGOP) (light blue) and its associated sub-sites. The Coastal Douglas-fir Forest (CDF, green) places competitive pressure on the site as a whole, especially the Natural Meadow (purple). The Agricultural Field (yellow) was managed as a hay field for over 100 years and contains multiple Quercus garryana individuals.
Remotesensing 12 00026 g001
Figure 2. Mean spectral signatures of Agricultural (n = 5), Meadow (n = 5) and Sample (n = 30) population from (a) 500–650nm and (b) 1400–1700nm. Dotted lines signify the range of variation in the spectral signature evaluated.
Remotesensing 12 00026 g002
Figure 3. Schematic depicting the relative increase or decrease in values for the traits with the highest PCA loadings from lifeform (DBH, purple), leaf growth (Chlorophyll ab mass, green) and leaf structure (LMA, blue) functional categories in relation to each anthropogenic landscape modification Arrows are arranged in accordance with Table 4 for the agricultural vs. meadow analysis and on the Tau values in Table 8 for the CDF and road analyses. Coastal Douglas-fir forest (CDF) and Road values are measured on a continuous scale of distance (m) starting at the anthropogenic landscape modification border (0 m) and ending at 248 m and 273 m respectively. Values associated with the Agriculture anthropogenic landscape modification are Boolean.
Remotesensing 12 00026 g003
Table 1. Categories of functional morphological traits used to analyze the variance between leaf samples and the agricultural, CDF and road anthropogenic landscape modifications.
Leaf GrowthLeaf StructureLifeform
Carbon (%)Cellulose (%)DBH (cm)
Carotenoid area (mmol/m2)Fiber (%)Height (m)
Carotenoid mass (ng/mg)Lignin (%)Max Crown Width (m)
Chlorophyll ab area (mmol/m2)Leaf Mass Area (LMA) (g m2)Height to Crown base (m)
Chlorophyll ab mass (ng/mg)Leaf Structure
Nitrogen (%)Cellulose (%)
Table 2. Mean z- and p-values resulting from the randomization test. The insignificant p-values suggest that intraspecific trait variation (ITV) does not exist at random within the meadow.
Groupzp-value
Lifeform0.010.497
Leaf growth−0.0450.512
Leaf Structure−0.0130.508
Table 3. Mean and Standard deviation of the 10 functional traits calculated using partial least squares regression (PLSR).
TraitMean ValueStandard Deviation
Carbon (%)50.0820.219
Carotenoid Area (mmol/m2)181.7863.383
Carotenoid Mass (ng/mg)1266.16638.087
Cellulose (%)15.9160.972
Chlorophyll ab Area (mmol/m2)589.16624.965
Chlorophyll ab Mass (ng/mg)7529.724251.585
Fiber (%)48.8062.032
Lignin (%)24.2521.320
Nitrogen (%)2.2090.086
LMA (g/m2)139.89513.114
Table 4. PCA 1 completed using all leaf samples (agricultural and natural meadow sub-sites) collected at the CGOP in July 2018. The loadings from the first principal component for each functional trait category are shown as it accounted for ≥68% of the variations in the analysis. Variations are presented in brackets.
PCA 1
LifeformPC1 (>0.99)Leaf Growth PC1
(>0.99)
Leaf StructurePC1
(0.68)
DBH−0.995Chlorophyll ab mass0.989LMA−0.995
Height−0.086Carotenoid mass0.137Lignin−0.068
Height to crown base−0.043Chlorophyll ab area0.053Fiber−0.068
Max crown width−0.031Carotenoid area0.005Cellulose−0.027
Nitrogen<0.0001
Carbon<−0.0001
Table 5. PCA 2 completed using only non-agricultural leaf samples collected at the CGOP in July 2018. The loadings from the first principal component for each functional trait category are shown as it accounted for ≥ 90% of the variations in the analysis. Variations are presented in brackets.
PCA 2
LifeformPC1
(0.98)
Leaf Growth PC1
(>0.99)
Leaf StructurePC1
(0.90)
DBH−0.987Chlorophyll ab mass−0.989LMA−0.999
Height−0.138Carotenoid mass−0.139Fiber0.013
Height to crown base−0.069Chlorophyll ab area−0.045Lignin0.018
Max crown width−0.033Carotenoid area−0.007Cellulose<−0.001
Nitrogen<−0.001
Carbon<−0.001
Table 6. Results of the Kruskal-Wallis test evaluating the differences between agricultural and non-agricultural leaf samples.
Chi-Square (χ2)p-Value
Lifeform38.24<0.001
Leaf Growth3.800.05
Leaf Structure6.250.01
Table 7. Statistical means of the trait with the largest loading value in the PC1 of each functional trait category for the agricultural and meadow sub-sites of the CGOP.
TraitFunctional Trait CategoryAgricultural
(n = 5)
Meadow
(n = 30)
DBH (cm)Lifeform125.1432.12
Chlorophyll ab mass (mmol/m2)Leaf growth9463.487207.43
LMA (g/m2)Leaf Structure170.85134.74
Table 8. Associations between the functional traits with the largest loading in PC1 of each functional trait category and the distance to CDF and road for all non-agricultural Q. garryana individuals (n = 30). The dataset of each trait is arranged based on the individual’s distance to the (a) CDF and (b) road anthropogenic landscape modifications, starting at 0m. Quartiles are the median value of the first quartile (25%), the median (50%) and the third quartile (75%) of each dataset. Significance was calculated using Kendall’s Tau.
a)Distance from CDF (m)
TraitFirst Quartile
(25%)
Median Value
(50%)
Third Quartile
(75%)
p-value
DBH (cm)30.5027.7022.0<0.001
Chlorophyll ab mass (ng/mg)6674.256777.987035.07<0.001
LMA (g/m2)135.14131.35130.380.069
b)Distance from Road (m)
TraitFirst Quartile
(25%)
Median Value
(50%)
Third Quartile(75%)p-value
DBH (cm)22.0027.7029.000.004
Chlorophyll ab mass (ng/mg)7608.997208.697028.970.002
LMA (g/m2)131.22131.35131.480.243

