Article

Practical Recommendations for Hyperspectral and Thermal Proximal Disease Sensing in Potato and Leek Fields

1
Department of Environment, Faculty of Bioscience Engineering, Ghent University, 9000 Ghent, Belgium
2
Department of Plants and Crops, Faculty of Bioscience Engineering, Ghent University, 9000 Ghent, Belgium
*
Author to whom correspondence should be addressed.
Remote Sens. 2020, 12(12), 1939; https://doi.org/10.3390/rs12121939
Submission received: 26 May 2020 / Revised: 12 June 2020 / Accepted: 12 June 2020 / Published: 15 June 2020
(This article belongs to the Special Issue Crop Disease Detection Using Remote Sensing Image Analysis)

Abstract

:
Thermal and hyperspectral proximal disease sensing are valuable tools towards increasing pesticide use efficiency. However, some practical aspects of the implementation of these sensors remain poorly understood. We studied an optimal measurement setup combining both sensors for disease detection in leek and potato. This was achieved by optimising the signal-to-noise ratio (SNR) based on the height of measurement above the crop canopy, off-zenith camera angle and exposure time (ET) of the sensor. Our results indicated a clear increase in SNR with increasing ET for potato. Taking into account practical constraints, the suggested setup for a hyperspectral sensor in our experiment involves (for both leek and potato) an off-zenith angle of 17°, height of 30 cm above crop canopy and ET of 1 ms, which differs from the optimal setup of the same sensor for wheat. Artificial light proved important to counteract the effect of cloud cover on hyperspectral measurements. The interference of these lamps with thermal measurements was minimal for a young leek crop but increased in older leek and after long exposure. These results indicate the importance of optimising the setup before measurements, for each type of crop.

Graphical Abstract

1. Introduction

The agricultural sector is under constant pressure to produce more efficiently and sustainably [1]. One of the most important factors for sustainable food production has always been disease management [2]. Now, globalisation has facilitated the spread of plant pathogens [3,4,5]. This, combined with changing climate conditions, poses great challenges for modern crop protection [6,7,8,9]. Disease typically appears in patches, after which it starts spreading to the rest of the crop [10]. The ability to detect these infections and manage them site-specifically, i.e., in a precision agriculture approach, has the potential to significantly increase pesticide use efficiency and thereby reduce economic and environmental costs, compared to current full-field ‘homogeneous’ applications [8]. Thermal and hyperspectral sensors have been proposed as useful tools for site-specific crop management, in both aerial and ground-based measurements [11,12,13,14,15,16]. However, many practical aspects of using these sensors in proximal or remote disease detection in field conditions are not fully understood [17,18,19]. Researchers have compared the efficacy of disease detection for these sensors in general [11] or specifically for one disease [20]. It was found that the ability to measure dozens up to hundreds of wavebands in the visible and the near-infrared region of the spectrum is an important advantage of hyperspectral sensors. This makes it possible to analyse subtle changes in the spectrum related to for example leaf structure, cell components and photosynthetic capacity, making them a very versatile disease detection tool [21]. Thermal cameras are more specifically aimed at measuring one parameter, for example temperature (through emission of radiation). They have been mainly used to detect abiotic stresses related to irrigation scheduling, although their use for biotic stress detection has also been shown, even post-harvest [11,22]. The combination of these two sensors in a data fusion approach could further increase disease detection capability [23]. For pharmaceutical applications, some research has been done to investigate practical difficulties of the use of hyperspectral imagery and practical solutions have been proposed [24]. Such a practical guideline does not yet exist—to the best of our knowledge—for disease detection, particularly for the fusion of thermal and hyperspectral sensors. Researchers have instead focused on determining the optimal setup for a single sensor for in-field measurement conditions. Franceschini et al. (2017) for example compared a handheld multispectral sensor to an airborne hyperspectral sensor to determine which of these setups performed best for measuring a series of vegetation indices [25]. Garzonio et al. (2017) and Vargas et al. (2020) further discuss the setup of a hyperspectral sensor for drone-based measurements [17,26]. Another recent example is the work of Thompson and Puntel (2020), which discusses the development of a practical decision support system based on drone-based multispectral measurements [27].
From literature, we see that several factors affect the quality of hyperspectral reflectance measurements. Factors related to incident solar radiation include the position of the sun, related to the crop and the viewing angle of the sensor, and cloud cover [28,29,30]. It is advised by some authors to work under cloudy conditions if possible, to counteract solar position variations [31], but this is not practical in most climates around the world. Plant-related properties affecting reflectance measurements include plant species, biotic and abiotic stresses, including drought, nutrients shortage and disease presence, within-crop shading and plant growth stage [19,28,32,33,34,35]. Finally, measurement height, exposure time (ET) of the sensor and angle and distance of artificial lights also affect reflectance measurements. Based on these interfering factors, Whetton et al. (2017) established a method to optimize the setup of a hyperspectral pushbroom camera for measuring a wheat canopy in field conditions based on maximising the signal-to-noise ratio (SNR), which is defined as the ratio of the mean to the standard deviation of the measurement data [19]. It was found for a wheat canopy that the most important parameters affecting SNR (that can be set at the start of the experiment) are the height of scanning, the off-zenith angle of the sensor and the ET [19]. The best SNR in their experiment was found for a height of 30 cm, a camera angle of 10° and an ET of 50 ms. The question remains whether the setup found for hyperspectral measurements of a wheat canopy can be extrapolated to other crops, e.g., potato and leek. In the interest of data fusion, it is also necessary to determine how to merge hyperspectral and thermal sensors into a single setup and subsequently analyse the data. Some research has been conducted towards combining thermal and hyperspectral sensors for nitrogen and irrigation management in a wheat canopy [23]. In this work, the sensors were placed side-by-side at a height of 2.5 m at a fixed angle, without artificial light. It is unclear what the effect would be if, similar to Fitzgerald et al. (2006), a thermal camera is added to the setup of Whetton et al. (2017) where artificial lights flank the camera [19,23].
This paper aims at providing practical recommendations for the use of hyperspectral and thermal proximal sensing side-by-side for canopy measurement in potato and leek. We first conducted a market study to find the optimal combination of a hyperspectral and thermal sensor for measuring crop diseases. Then, we applied the hyperspectral setup optimisation methodology [19] to potato and leek crops, taking the first step towards identifying similarities/differences between the optimal setup of three completely different crop types (broad leaves, narrow leaves and cereals). Finally, we studied the effect of artificial light on hyperspectral and thermal measurements under both sunny and cloudy conditions.

2. Materials and Methods

2.1. Materials

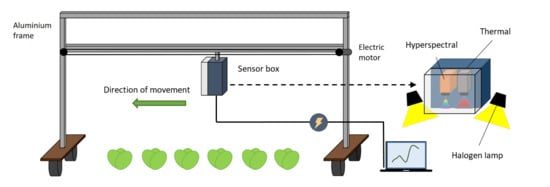
Based on the setup used by Fitzgerald et al. (2006) and Whetton et al. (2017), we designed a new setup for disease detection in leek and potato that combines a thermal (Flir Systems, USA) and a hyperspectral sensor with a spectral range of 400–1000 nm (Specim, Finland) into one portable, easy to use sensor box that can be placed on a variety of platforms (e.g., tractors, rovers, spray boom and fork lift) (Figure 1) [19,23].
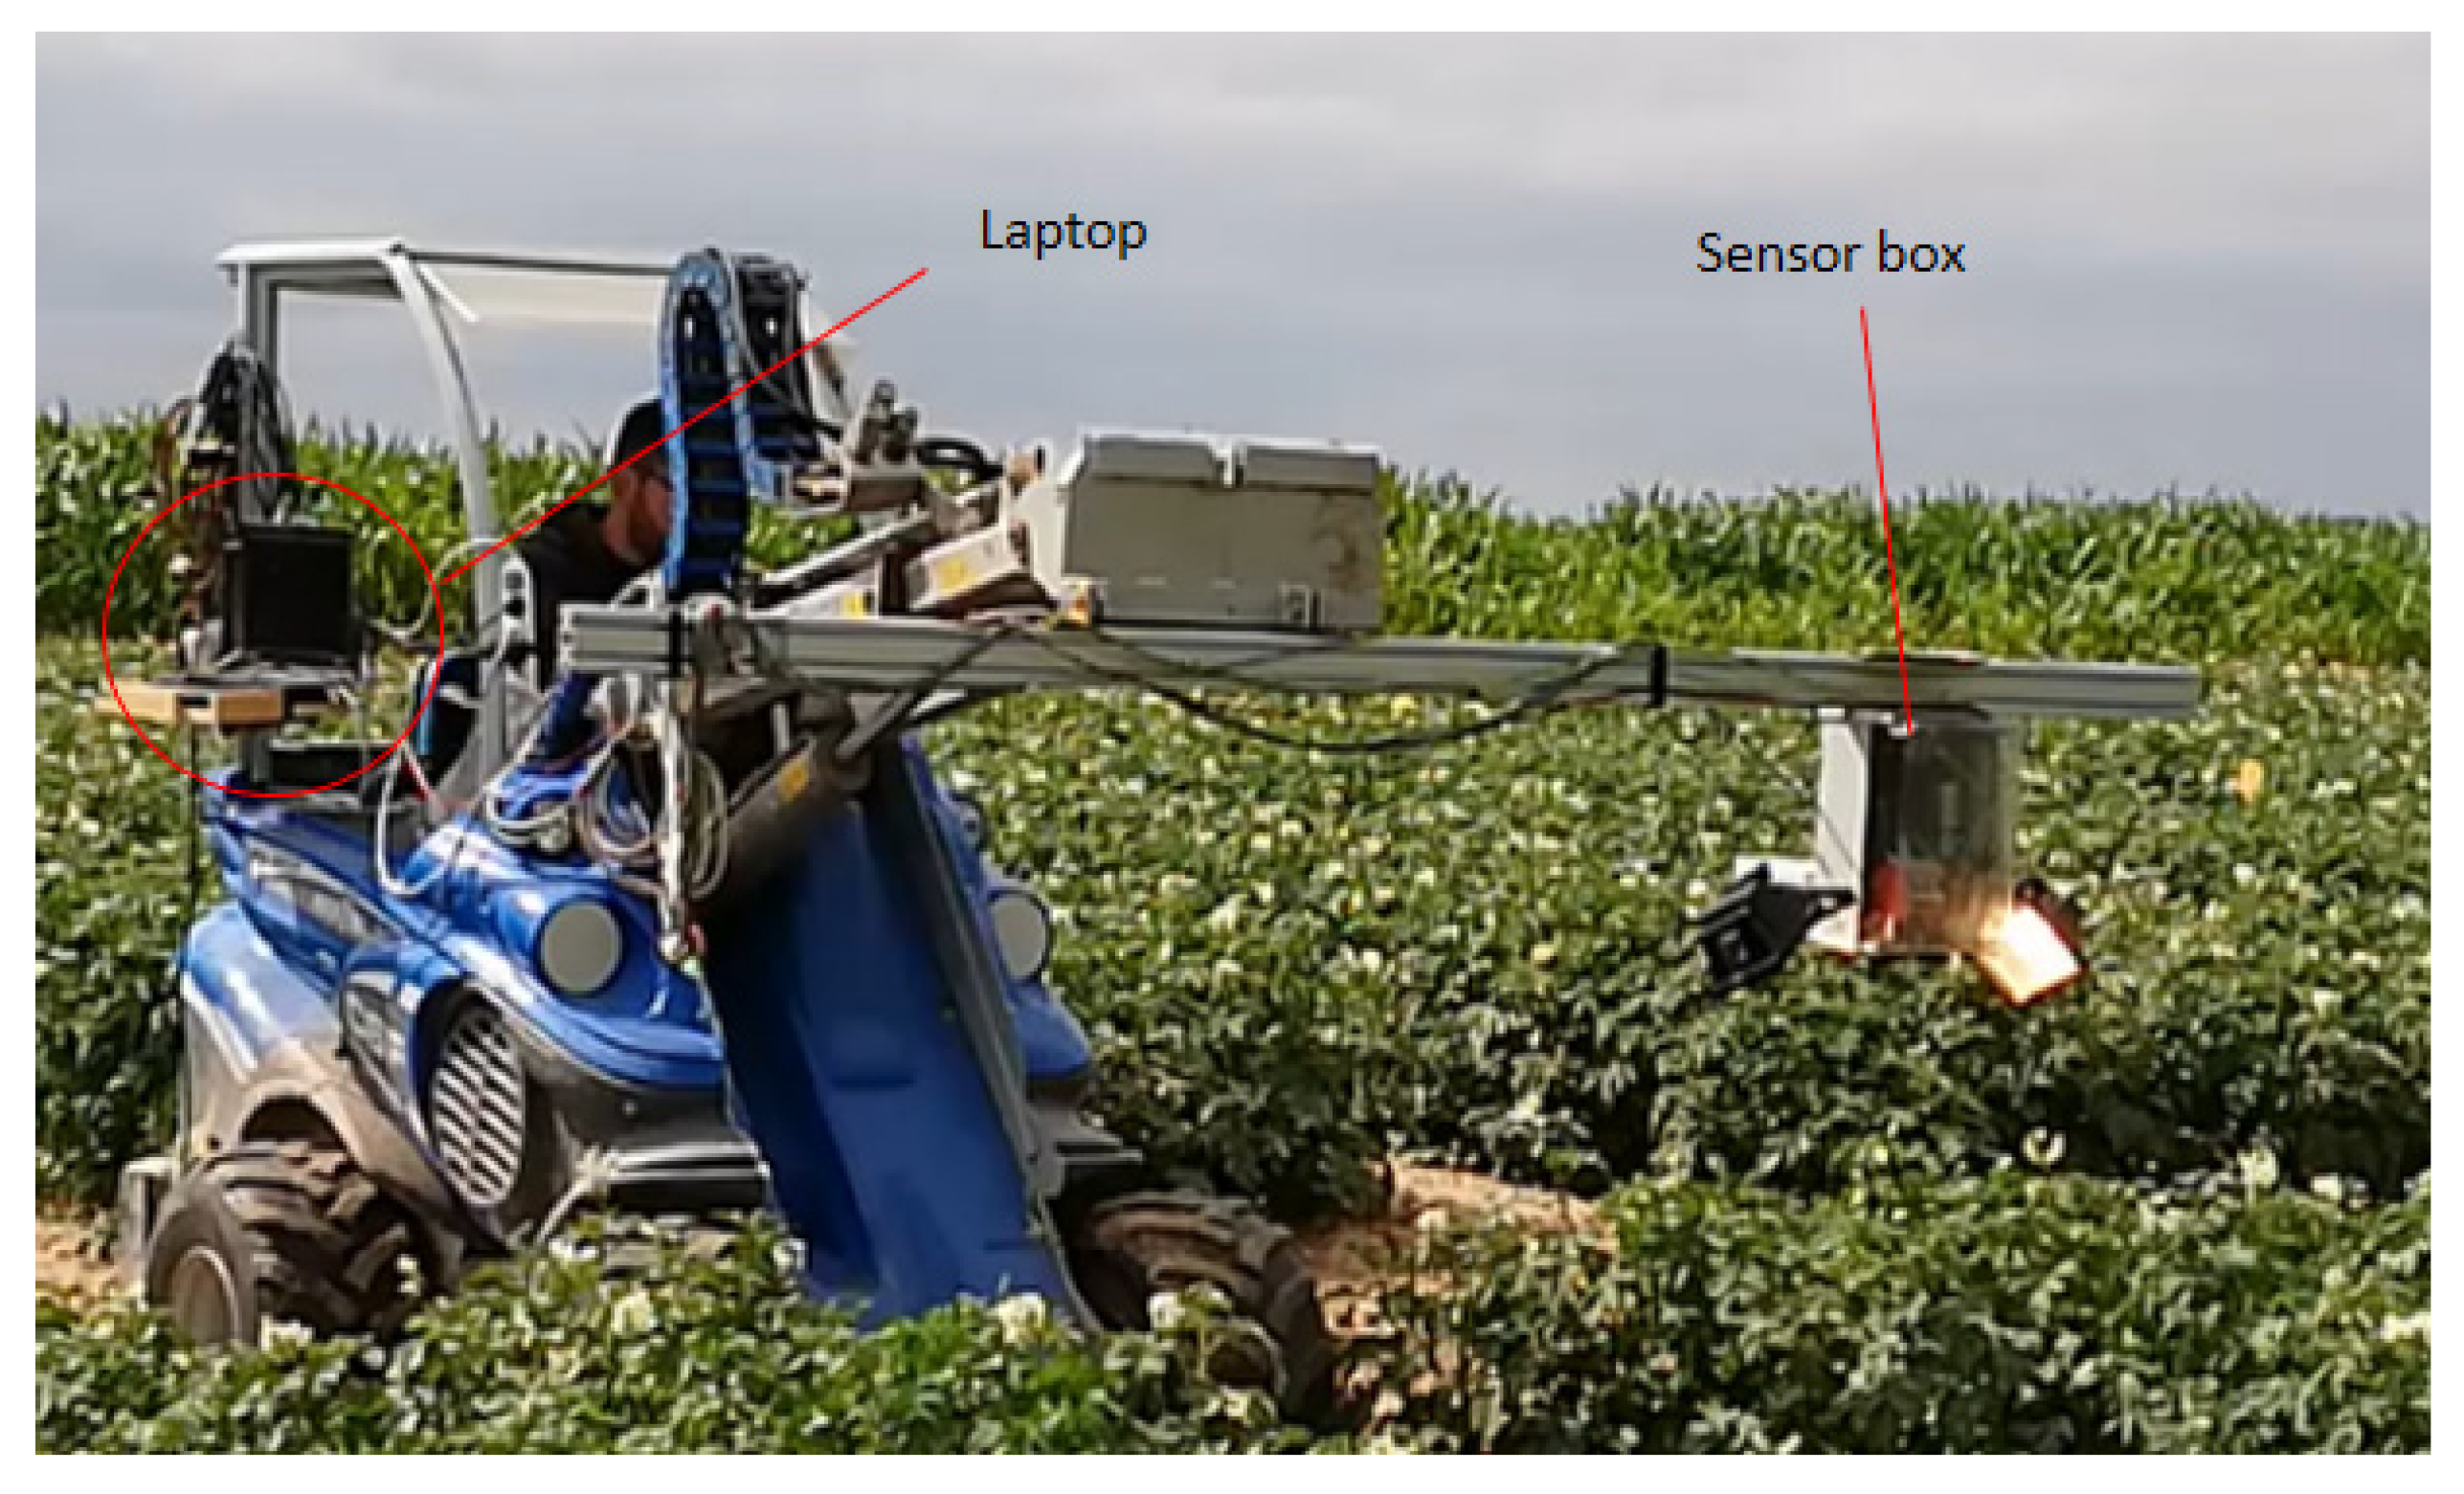
Both sensors were placed inside a waterproof box and connected to a laptop (Panasonic Belgium, Asse). The sensors were placed side by side, in the plane perpendicular to the direction of the crop row. To ensure both sensors were capable of scanning the same point directly beneath the sensor box, an 80° wide-angle lens was selected for the thermal camera so it could be placed next to the hyperspectral camera, whose narrower field of view required it to be above the crop row. The sensor box was installed in one of two ways: on an aluminium frame (Figure 1) or on a mini shovel (MultiOne, The Netherlands) (Figure 2).
The aluminium frame formed an upturned U-shaped structure, which rested on four wheels. Between the supports of the frame, an aluminium bar with a length of 3 m was positioned at adjustable height. The sensor box was attached to this bar by a wheels-and-rail system. The aluminium frame pieces and the aluminium bar could be dismounted and broken up into several smaller pieces for transport. The bar contained an electric motor that was powered by a 12 V battery. This motor moved the sensor box along the aluminium bar (in the direction of the crop row) at a pre-set constant speed by means of a rubber driver belt, which was attached to the sensor box. Two 500 W halogen lamps (Powerplus, The Netherlands) were attached on both sides of the sensor box to provide additional illumination for the hyperspectral camera. It was essential that these lamps were halogen, to ensure they emitted radiation with a similar spectral profile to that of the sun [19]. A generator was used to power the sensors and artificial lamps. The mini shovel was fitted with a 3 m aluminium beam that supported the sensor box. The laptop and power generator were attached to the mini shovel so that one person could operate both the platform and the sensor. A battery-powered pyranometer (Skye Instruments, UK) was used to measure incoming solar radiation for both the mini shovel and frame setups.

2.2. Methods

2.2.1. Test Field

Field experiments were conducted at the Bottelare experimental farm (Merelbeke, Belgium) of Universiteit Gent and Hogeschool Gent, between December 2018 and September 2019. The geographical coordinates are 50°57'45.2"N, 3°45'36.3"E. Leek plants of cultivar Pluston were pregerminated and grown in pots, after which they were transplanted to the field. Potato plants of cultivar Agria were also pregerminated but planted directly into the field. Both potato and leek plants were planted in ridges with a width of 75 cm and a height of 30 cm. Leek plants were planted at a within-row distance of 12 cm, while potatoes were spaced at 34 cm in the row. Leek plots were designed to be 3 by 3 m, whereas potatoes were planted in 3 by 5 m plots. All data storage was done on external solid-state drives, which are more resistant to vibrations and have a higher writing speed (necessary for the storage of large amounts of hyperspectral and thermal data) compared to older storage drive models.

2.2.2. Availability of Optical Sensors in the Market

A market study of commercially available sensors was carried out to guide in the selection of the best combination of hyperspectral and thermal sensors. Although it was not needed for the set-up optimisation, we included fluorescence sensors in this market evaluation as a comparison, since it has also been proposed as a promising sensor for proximal disease sensing [11,36]. We focused only on portable sensors that can be used in field conditions and are not clip-on, so they can work from a proximal sensing perspective.

2.2.3. SNR Based Setup Optimisation

To determine the optimal setup, four ETs (1 ms, 10 ms, 30 ms and 50 ms), three heights (30 cm, 70 cm and 110 cm) and three camera off-zenith angles (0°, 8° and 17°) were tested for scanning in conditions of 300–400 W/m2 for the leek canopy, which are fully sunny conditions during winter, and 800–900 W/m2 for the potato canopy, which are fully sunny conditions during summer. For each of the 36 configurations, around 1000 linescans were taken with the hyperspectral camera at a framerate of 60 Hz. These scans were then stored in one data cube per setup through Lumo software (Specim, Finland). These cubes were subsequently corrected using Matlab software (The Mathworks, Inc., USA) using a white and dark reference value (Equation (1)). The pyranometer was placed in a fixed position before the measurements began and indicated whether a new white reference sample needed to be taken. The white reference target (SphereOptics, Germany, Alucore reflectance target, 500 × 500 mm, 95% reflectance, calibrated) was measured with the hyperspectral camera to obtain a reference value at the start of each measurement and during measurements if the solar radiation varied more than 75 W/m2. This measurement was done in exactly the same conditions as those of the crop. The dark reference value was measured at the start of the experiment by closing the hyperspectral camera shutter. These reference values were later used to correct the data using following equation:
R_cor = (R_raw– R_dr)/(R_wr – R_dr)
where R_cor is the corrected reflectance value of the measured sample, R_wr is the white reference value, or ‘maximum’ reflectance value, R_raw is the raw reflectance of the sample measured and R_dr is the dark, or minimum, reflectance value. In practice, the white reference value was not the maximum value even though it has a reflectance of 95%, because specular reflection could occur. We calculated the SNR using the method used in Whetton et al. (2017) [19]. The SNR of each scan was calculated by first correcting the hyperspectral data cube according to Equation (1), after which nonplant pixels were deleted based on the NDVI value [37,38]. We then, per wavelength, divided the mean of the reflectance values over all plant pixels of the image by the standard deviation over all reflectance values of all plant pixels of the image. This led to 224 SNR values, each belonging to one wavelength. Then, the average of these 224 SNR values was taken to yield one SNR value per scan (Figure 3). Scans were taken until each tested setup had hyperspectral data cubes containing at least 30 leek or potato plants.
To understand the individual effect of each setup parameter on the resulting SNR, principal component analysis (PCA) was carried out using RStudio (RStudio Inc., USA). The input of the PCA analysis was a matrix containing 36 rows (one for each tested setup) and 4 columns for the height, angle and ET of each setup, with the corresponding SNR value. No normalisation was performed on the SNR data, because tests indicated that each of the available normalisation algorithms in the FactoMineR R package lead to principal components (PCs) that represented less of the variability in the data compared to the PCs obtained without normalisation. The results were represented in PCA factor map plots, also using the FactoMineR R package.

2.2.4. Effect of Artificial Lighting on Hyperspectral Measurements in the Field

To evaluate the effect of artificial light, hyperspectral measurements were taken with the predetermined optimal setup from Section 2, which consisted of an angle of 17°, an ET of 1 ms and a height of approximately 30 cm above a leek canopy. Exact height above crop canopy varied slightly due to the inhomogeneity of the leek plant height within each row and because the field was not perfectly level. Two measurements were taken, one in winter and one in early spring. The first measurement was taken on a day with clear weather, representing sunny conditions, whereas the second measurement was taken under fully overcast, cloudy conditions. The effect of the artificial light was determined by comparing the average reflectance values from crop canopy and white reference target measurements. To compare the shape of the reflectance curve between light on and off scenarios, the reflectance curves were normalised to have values in the 0 to 1 range by using (x-min)/range. These spectra were analysed using Matlab software (The Mathworks, Inc., USA) and ENVI (Harris Geospatial, USA) software.

2.2.5. Effect of Artificial Lighting on Thermal Measurements in the Field

To test the effect of the artificial light on the thermal measurements, a series of images of the leek crop row were taken using the aluminium frame designed for the 3 by 3 m leek plots. These images were taken at 1 Hz. To compare between light on/off treatments, average temperature values were calculated with Flir Tools software (Flir Systems, USA), for each of the images. These values were then plotted using Excel software (Microsoft, USA). The ratio of crop to bare soil is not representative for normal field conditions for images captured at the edge of the crop row. We therefore compared treatments based on images of the middle of the row. It was not possible to reliably remove soil pixels from crop pixels in the thermal images, because there was a lot of overlap between the apparent temperature of the leaves and that of the soil. For this reason, we visually compared thermal patterns on the leaves. These patterns allowed us to see if the top of the crop canopy was heated by the artificial light. We also compared average temperature values over the entire image, since the same spot in the field was measured over different setups (lamps on or lamps off). This means the amount of soil was the same for each setup and it was therefore possible to compare the effect of artificial light on the average apparent temperature between treatments. We followed the development of the crop over several weeks to determine whether any disease was naturally occurring during time of measurement.

3. Results

3.1. Multiple Sensor Setup

The results of the market evaluation of available sensors are presented in Table 1. The combination of most promising sensors [11], namely, a snapshot hyperspectral, thermal and fluorescence sensor was found to cost well over 200.000 euro. Snapshot hyperspectral sensors were available from around 30.000 euro, while pushbroom hyperspectral sensors were available from around 10.000 euro. There were far more pushbroom sensors available than snapshot sensors, and not all suppliers offered snapshot sensors. Thermal cameras found here ranged from 4.000 to 20.000 euro in price. Non-clip-on fluorescence sensors for use in field conditions were available as the CropObserver (Phenovation, The Netherlands), a point-measuring system that works with laser-induced fluorescence, or as the Hyperspec sensor (Headwall, Germany), a camera system that has a video function as well as an imaging function. The point measurement system was available for around 40.000 euro, while the Hyperspec fluorescence sensor cost around 175.000 euro.

3.2. Hyperspectral Setup Optimisation

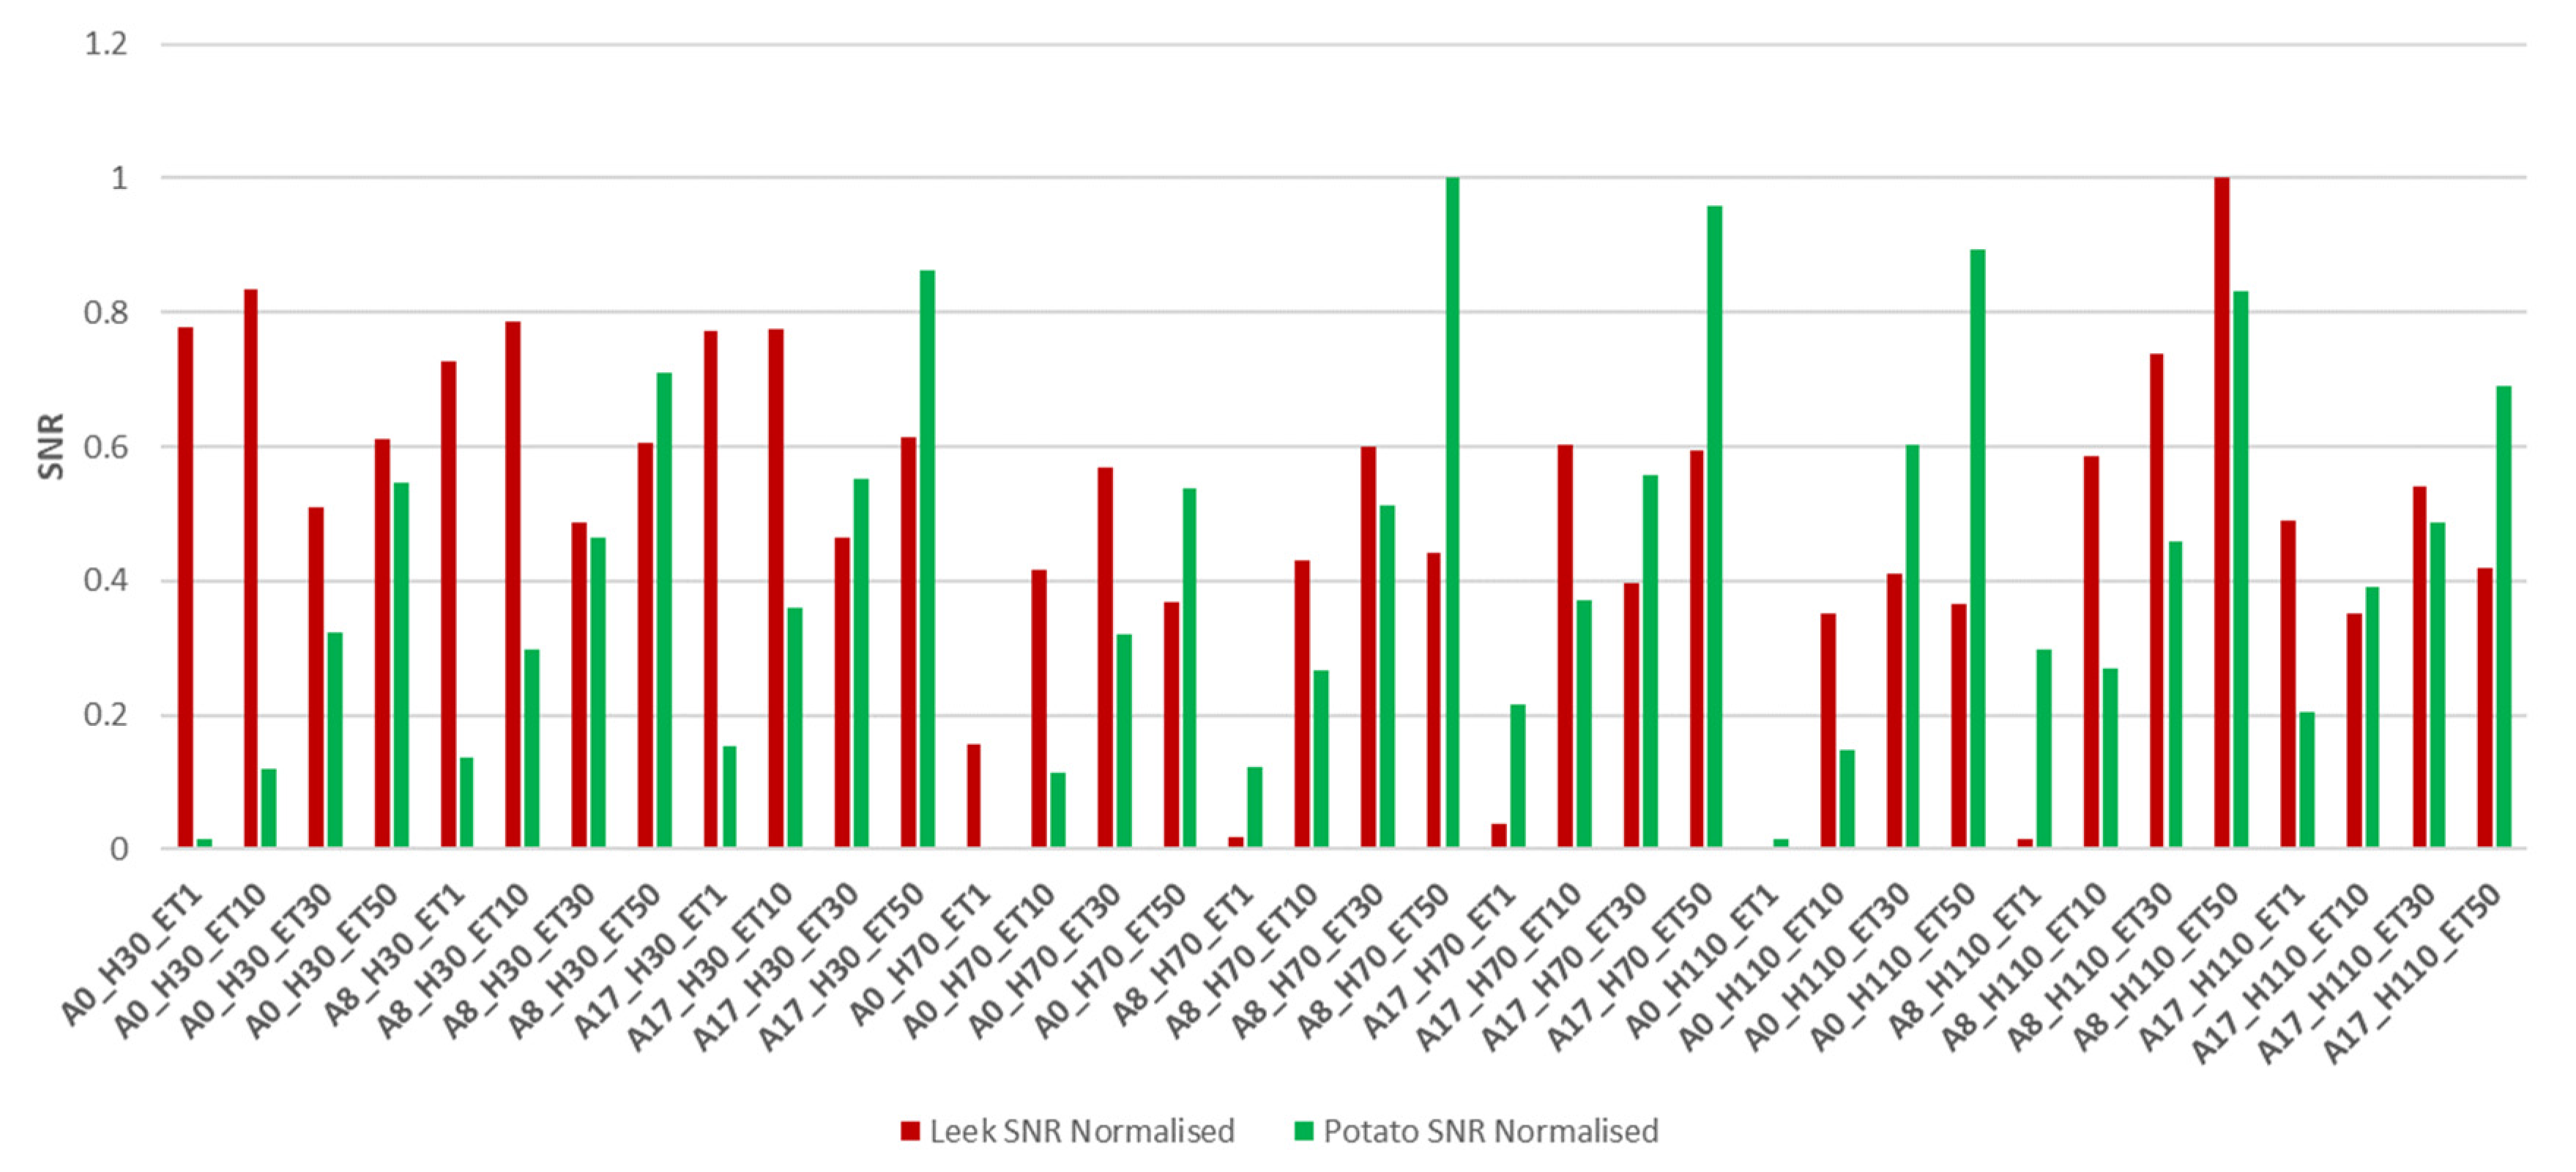
Figure 3 shows the normalised SNR values for a potato and a leek canopy for each of the measurement setups.
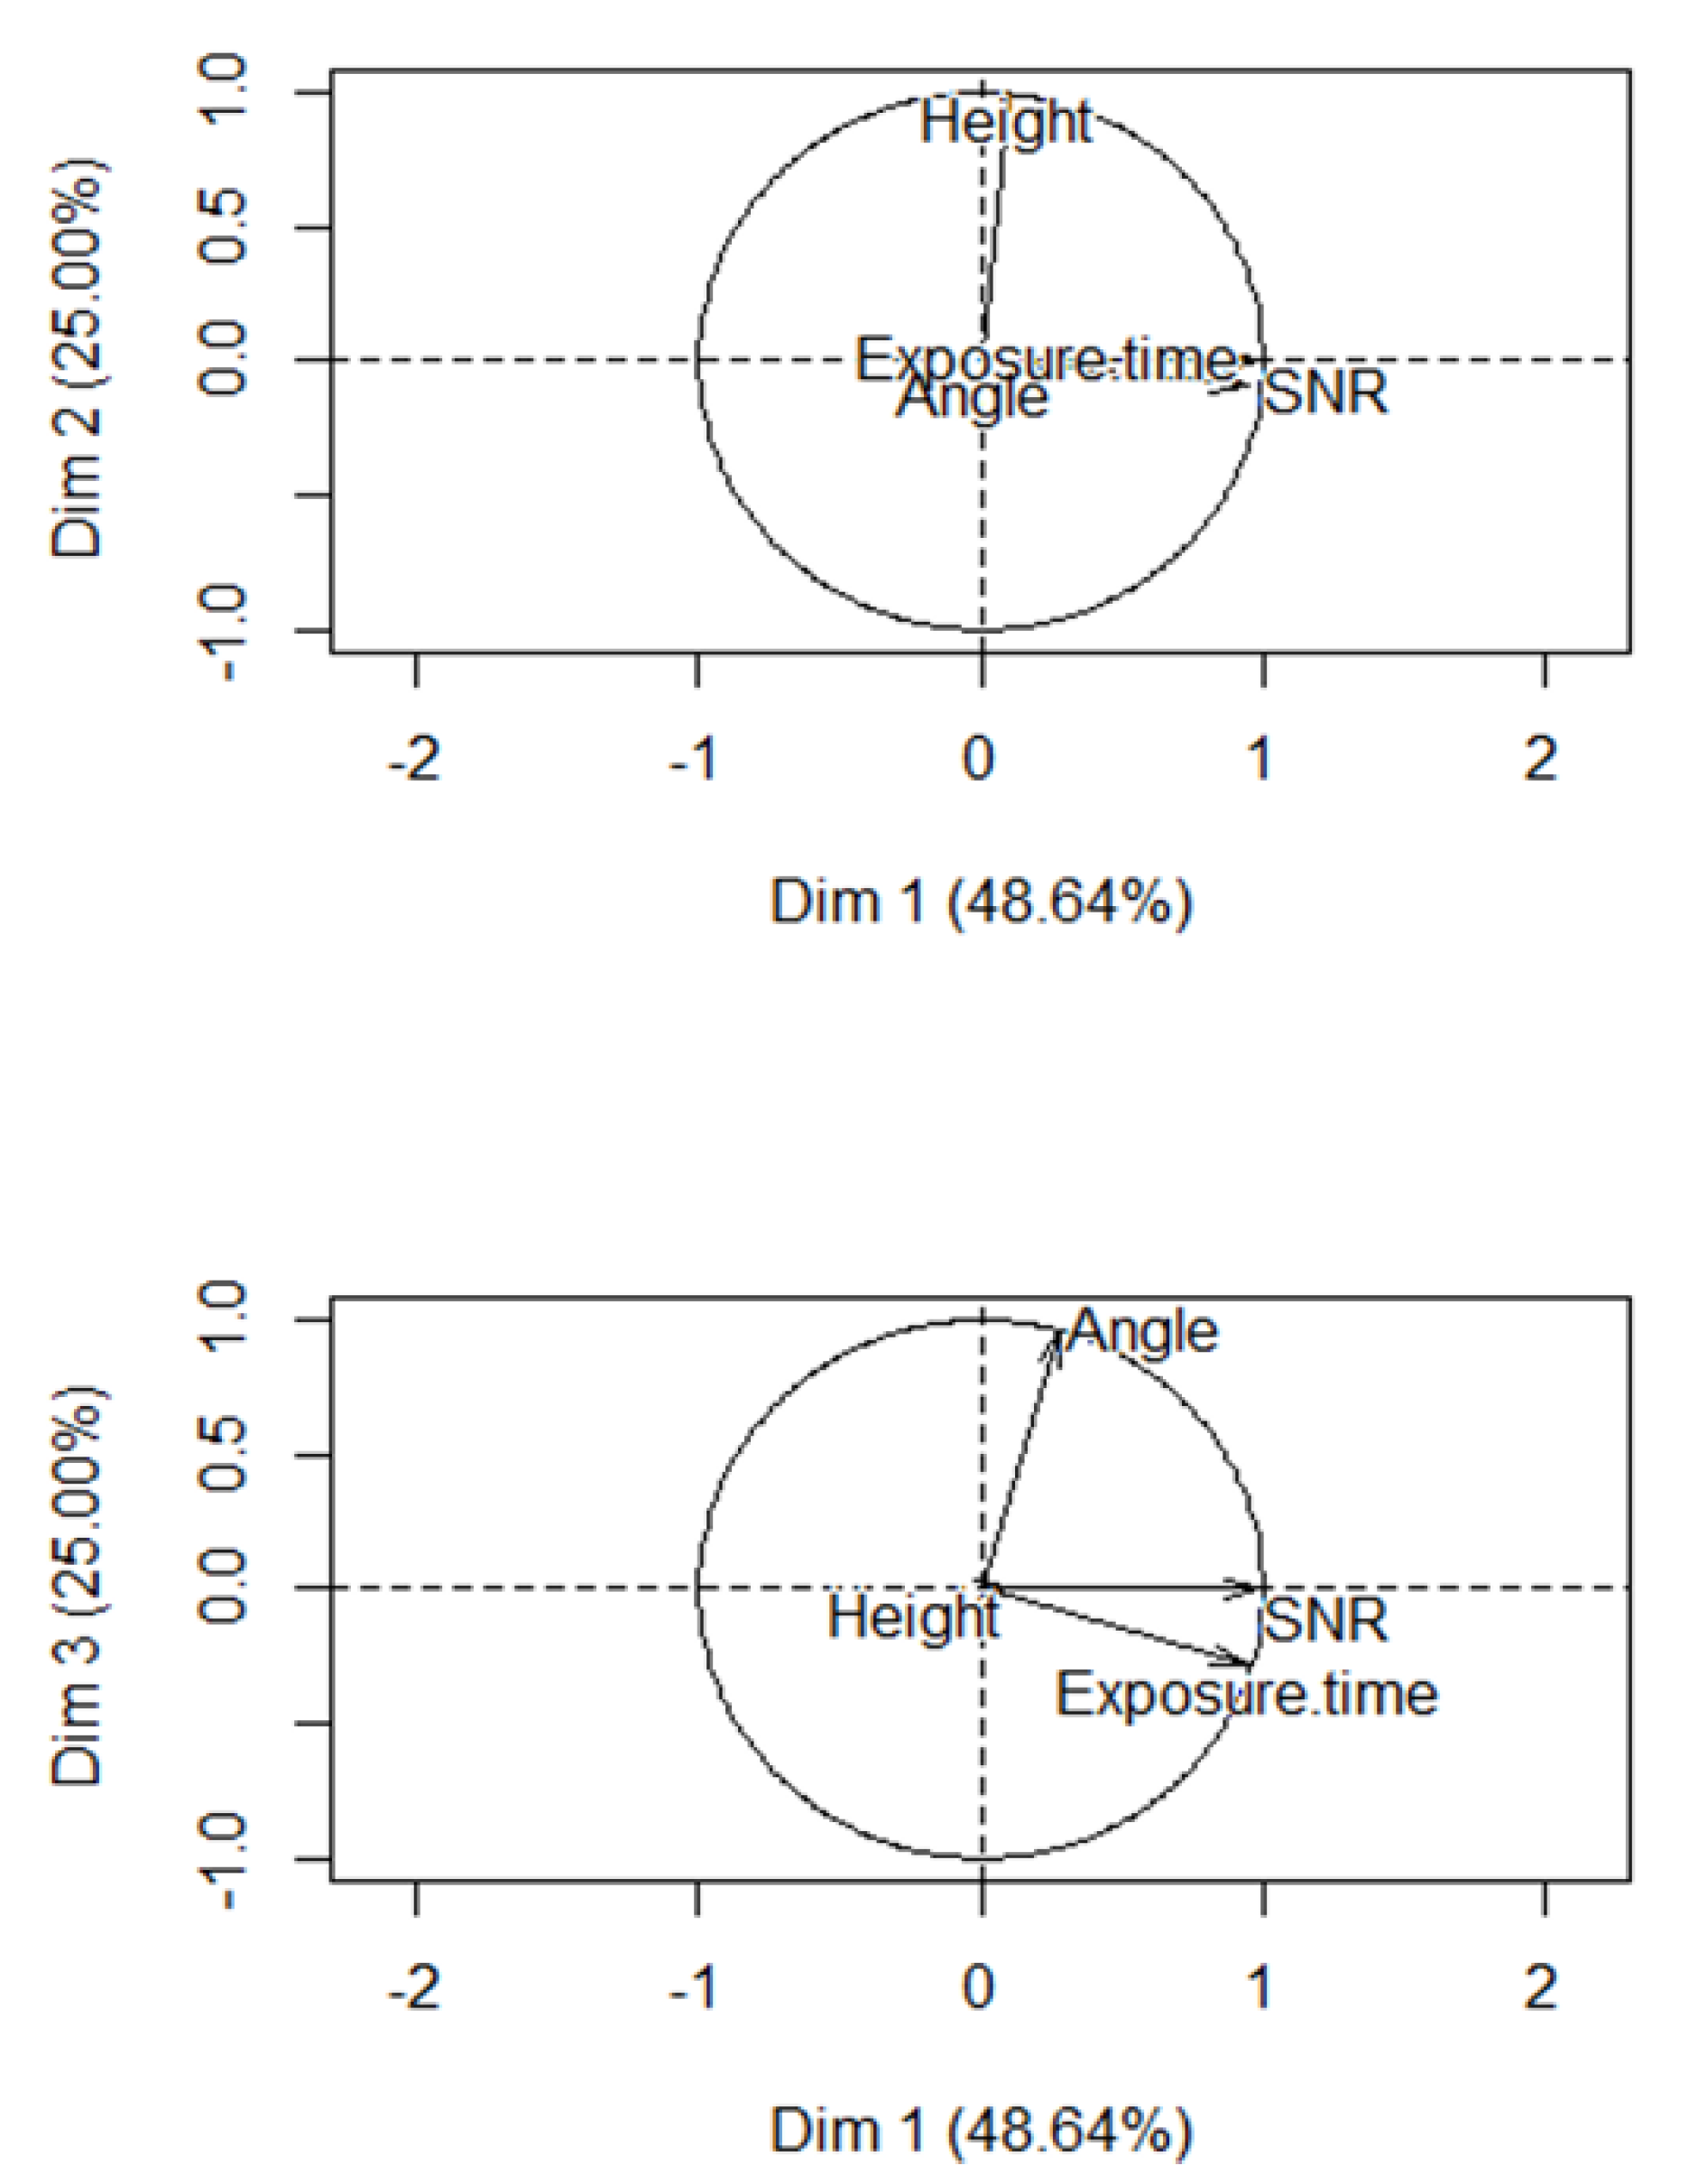
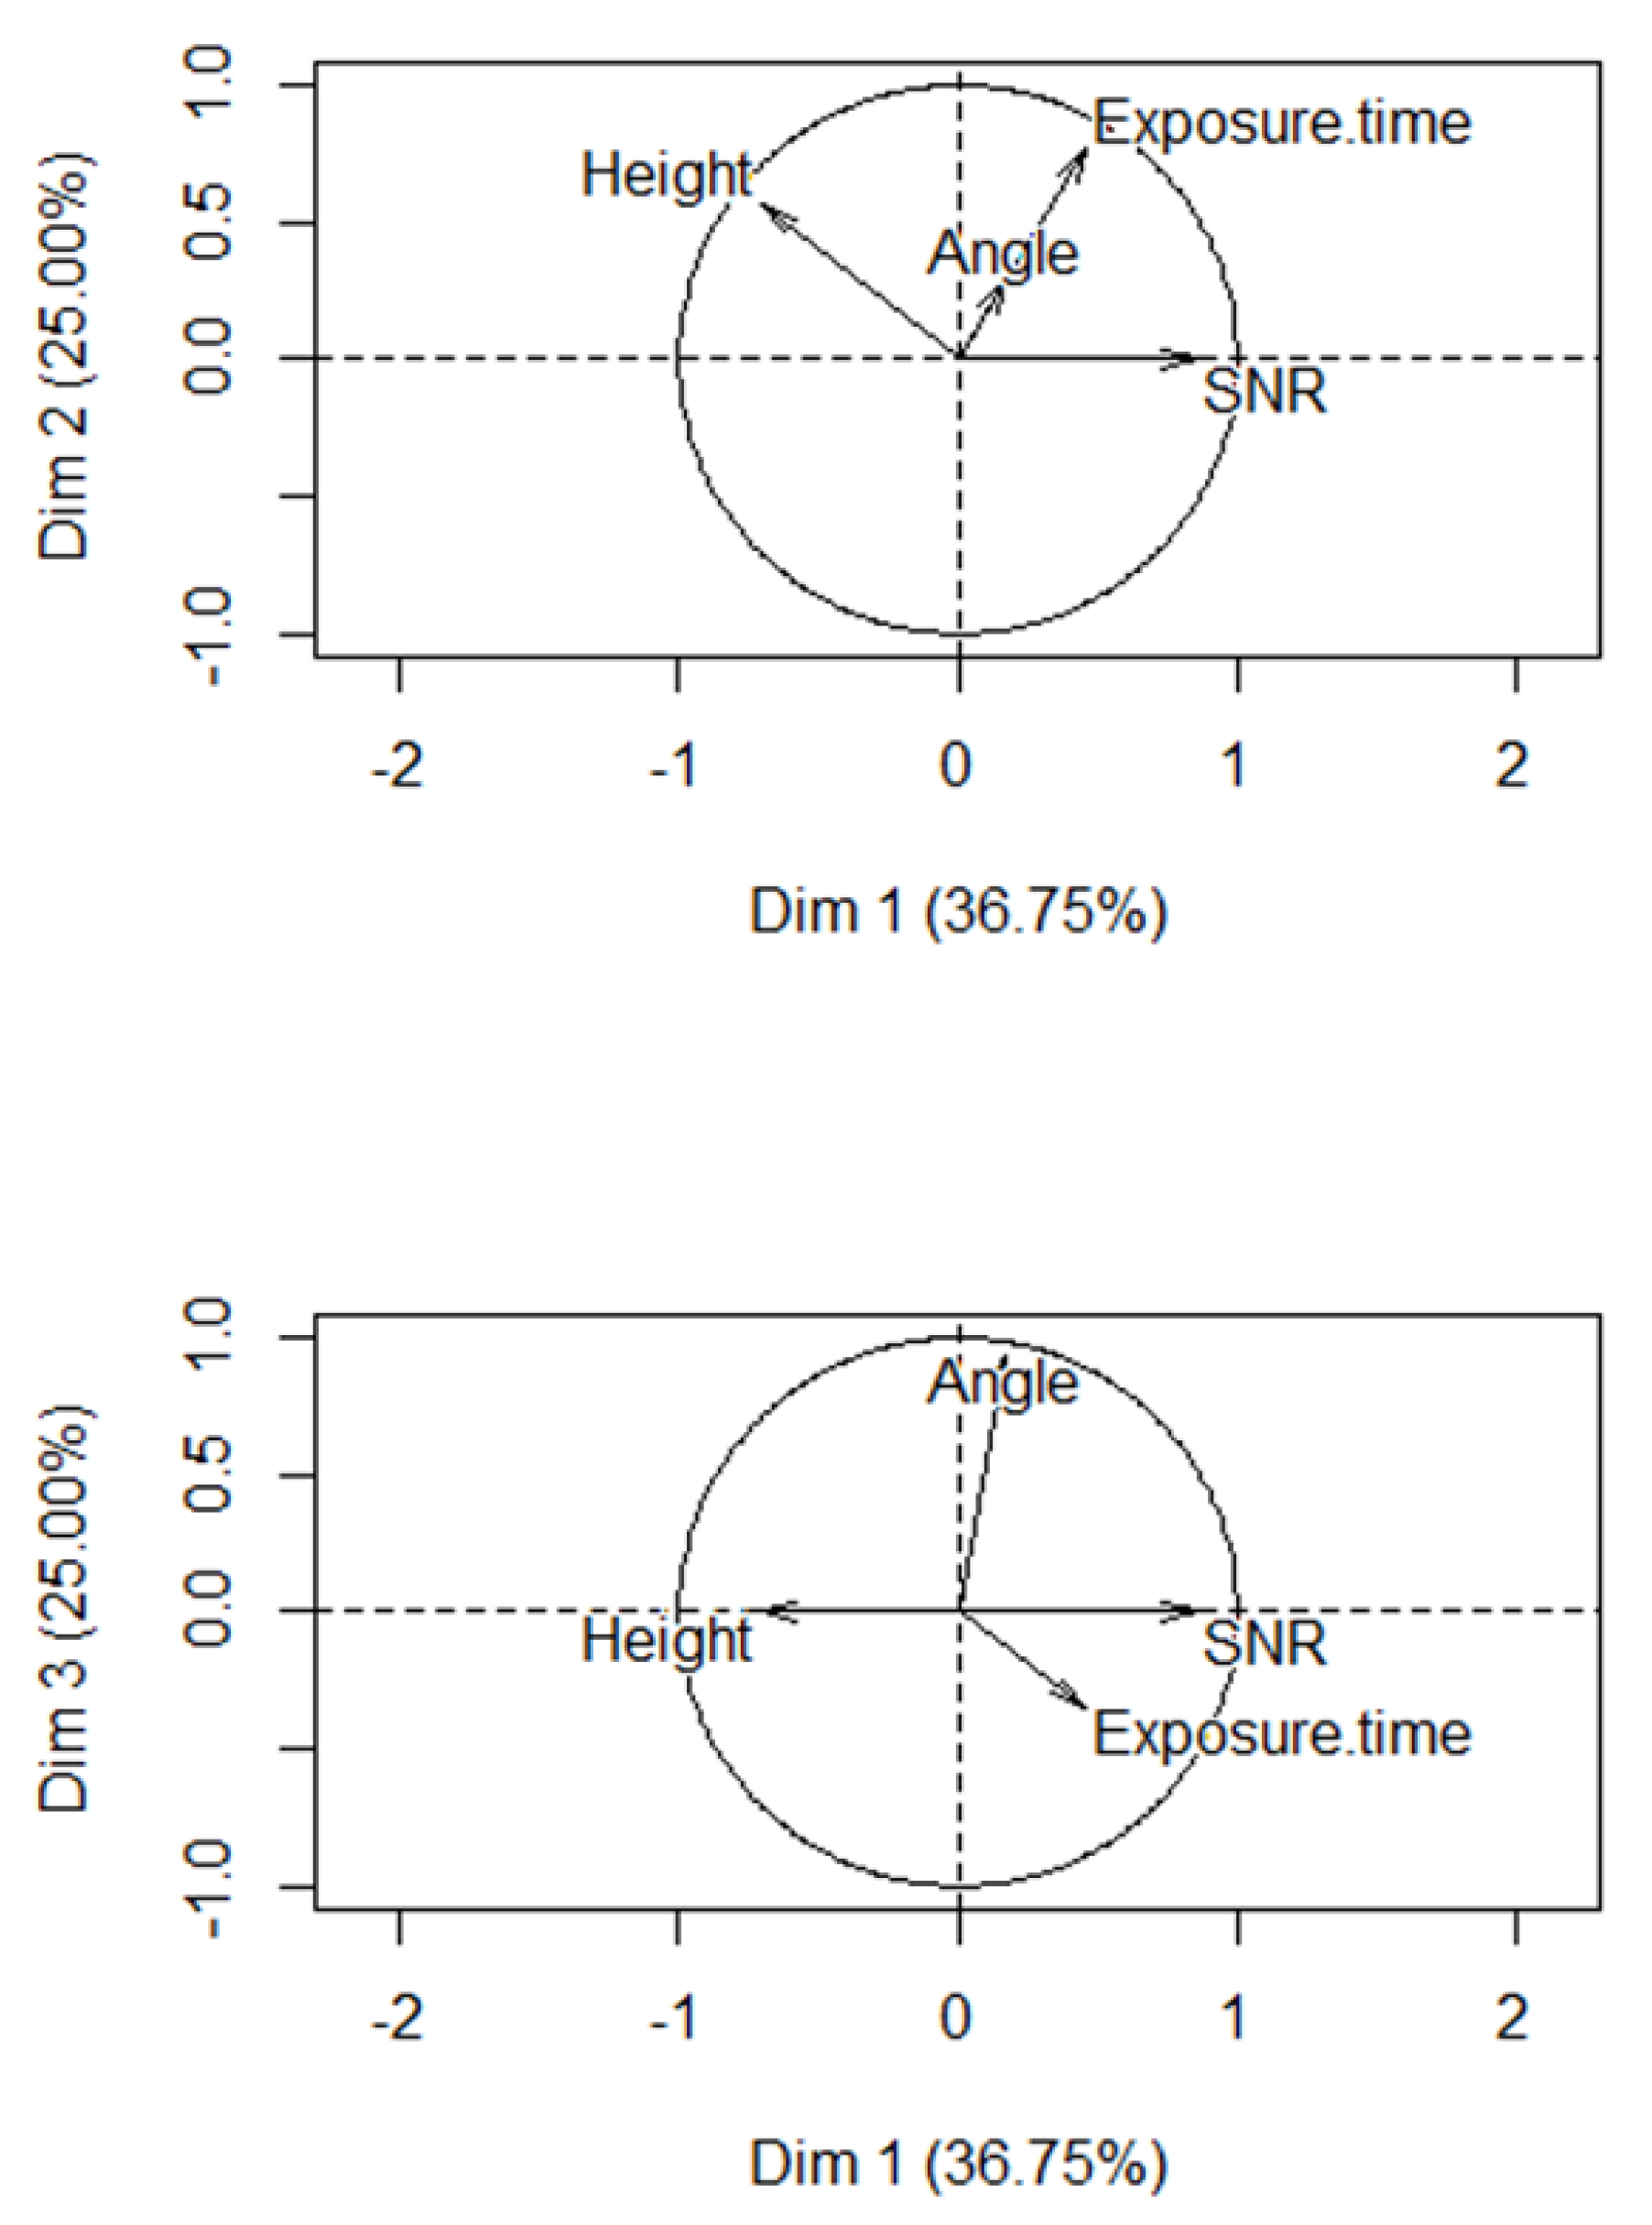
Each dataset was normalised (after SNR calculation) using the formula (x-min)/range, which leads to values between 0 and 1. It can be observed that different setups lead to different SNR values. The highest SNR value in the potato crop was obtained with an off-zenith angle of 8°, a height above crop canopy of 70 cm and an ET of 50 ms. A close second was the setup of an 8° angle, a height of 110 cm and an ET of 50 ms. For leek, the best SNR was achieved with an angle of 17°, a height of 70 cm and an exposure time of 50 ms. Examining the SNR values of the potato, a clear trend of stepwise increasing SNR values with increasing ET could be observed. This differed from the leek SNR values, which showed no clear trend. Figure 4 shows the PCA variables factor map plots on the plane formed by PC1 and PC2, and PC1 and PC3, respectively, for hyperspectral measurements of a potato crop. The plot on the plane formed by PC2 and PC3 showed no representation of the SNR vector, so it has been omitted. It can be seen on the axes that PC1 represented 48.67% of the total variance in the data, while the second and third PCs represented 25% of the variance each. The height vector was perpendicular to the SNR vector in the PC1–PC2 plane, indicating that height did not significantly affect SNR for the potato crop. This was confirmed by the plot of PC1 and PC3, where SNR was fully represented by a long vector, as opposed to height, which was not represented in this plane (indicating it is perpendicular to this plane). The angle and SNR showed no relation in the plot of PC1 and PC2, because angle was not represented in this plane. Looking at the projection on the plane of PC1 and PC3, it can be seen that the angle vector had a projection that was almost perpendicular to the SNR vector. This indicates that SNR was not closely related to camera angle for potatoes. The last variable, ET, was almost entirely congruent with the SNR vector in both the plot on the PC1 and PC2 plane and the PC1 and PC3 plane. This indicated that for potato crops, SNR was mostly influenced by ET. Figure 5 shows the PCA variables factor map plots for hyperspectral measurements of leek for the PC1 and PC2 plane, and the PC1 and PC3 plane. The plot on the plane formed by PC2 and PC3 again showed no representation of the SNR vector, so it has been omitted. It can be seen that the first PC represented 36.75% of the total variance in the data, while the second and third PCs represented 25% of the variance each. In these plots, we saw that the relationship between SNR and the other variables was not as clear-cut compared to those of the potato canopy. Comparable to the potato canopy data, the projections of the angle vector were not concurrent with the leek SNR vector on either the PC1 and PC2 plot or the PC1 and PC3 plot. The projection of the height vector in this case seemed to indicate a more significant, negative relation to SNR compared to the potato dataset. ET again seemed to have a significant positive correlation with SNR. This positive correlation with ET was also observed in the SNR values in Figure 3, especially for potato scans. For leek scans, the SNR values are more variable, but still high ETs seemed to correspond to higher SNR values.

3.3. Effect of Artificial Lighting on Hyperspectral Measurements of a Crop Canopy in the Field

Figure 6 shows the average reflectance curves for the scans of a leek row, with artificial light on/off under sunny and cloudy conditions. The curve related to sunny conditions (Figure 6A) showed that although measurements were taken on an exceptionally sunny day (for winter conditions), the lamps still contributed to reflectance. This is in contrast with the results under cloudy conditions (Figure 6B), in which it can be observed that the added illumination apparently decreased reflectance values, especially in the NIR range. The normalized reflectance curves of the on/off treatments were less similar to each other during cloudy conditions compared to sunny conditions (Figure 6C,D). The normalized reflectance curves of the sunny condition experiment appeared very similar in the visible region of the spectrum, while the cloudy conditions curve showed differences, especially in the red colour region of the spectrum (600–680 nm). In the NIR region, the on/off curves of under sunny conditions are inconsistent. During cloudy conditions, the light-on-treatment’s reflectance curve is consistently below that of the off-treatment in the NIR region, up to +/-930 nm, after which differences are inconsistent. A depression in the reflectance curve appeared around 950 nm, for cloudy conditions, which did not appear for sunny conditions for both the raw and normalised spectra.
Looking at the increased reflectance of the white reference as a result of switching on the light under sunny conditions (Figure 7A), a mild increase can be seen more or less uniformly over the entire spectrum, with a bigger increase in the middle part of the spectrum compared to the edges at 400 and 1000 nm. It is clear that the halogen lights cause a reflectance pattern that is very similar to the natural light conditions. However, looking at the cloudy white reference reflectance data (Figure 7B), the additional lighting appeared to mainly increase the reflectance values at higher wavelengths, with the largest increase again occurring in the middle part of the spectrum. However, in cloudy conditions, the difference between the light on and light off for white reference curves is much more significant, both in terms of shape of the curve and magnitude of reflectance (Figure 7B). The white reference reflectance curve without artificial light was less bell-shaped and more skewed under cloudy conditions (Figure 7B) compared to that without artificial lights under sunny conditions (Figure 7A), indicating the effect of cloud cover on the reflectance spectrum.

3.4. Effect of Artificial Lighting on Thermal Measurements of a Crop Canopy in the Field

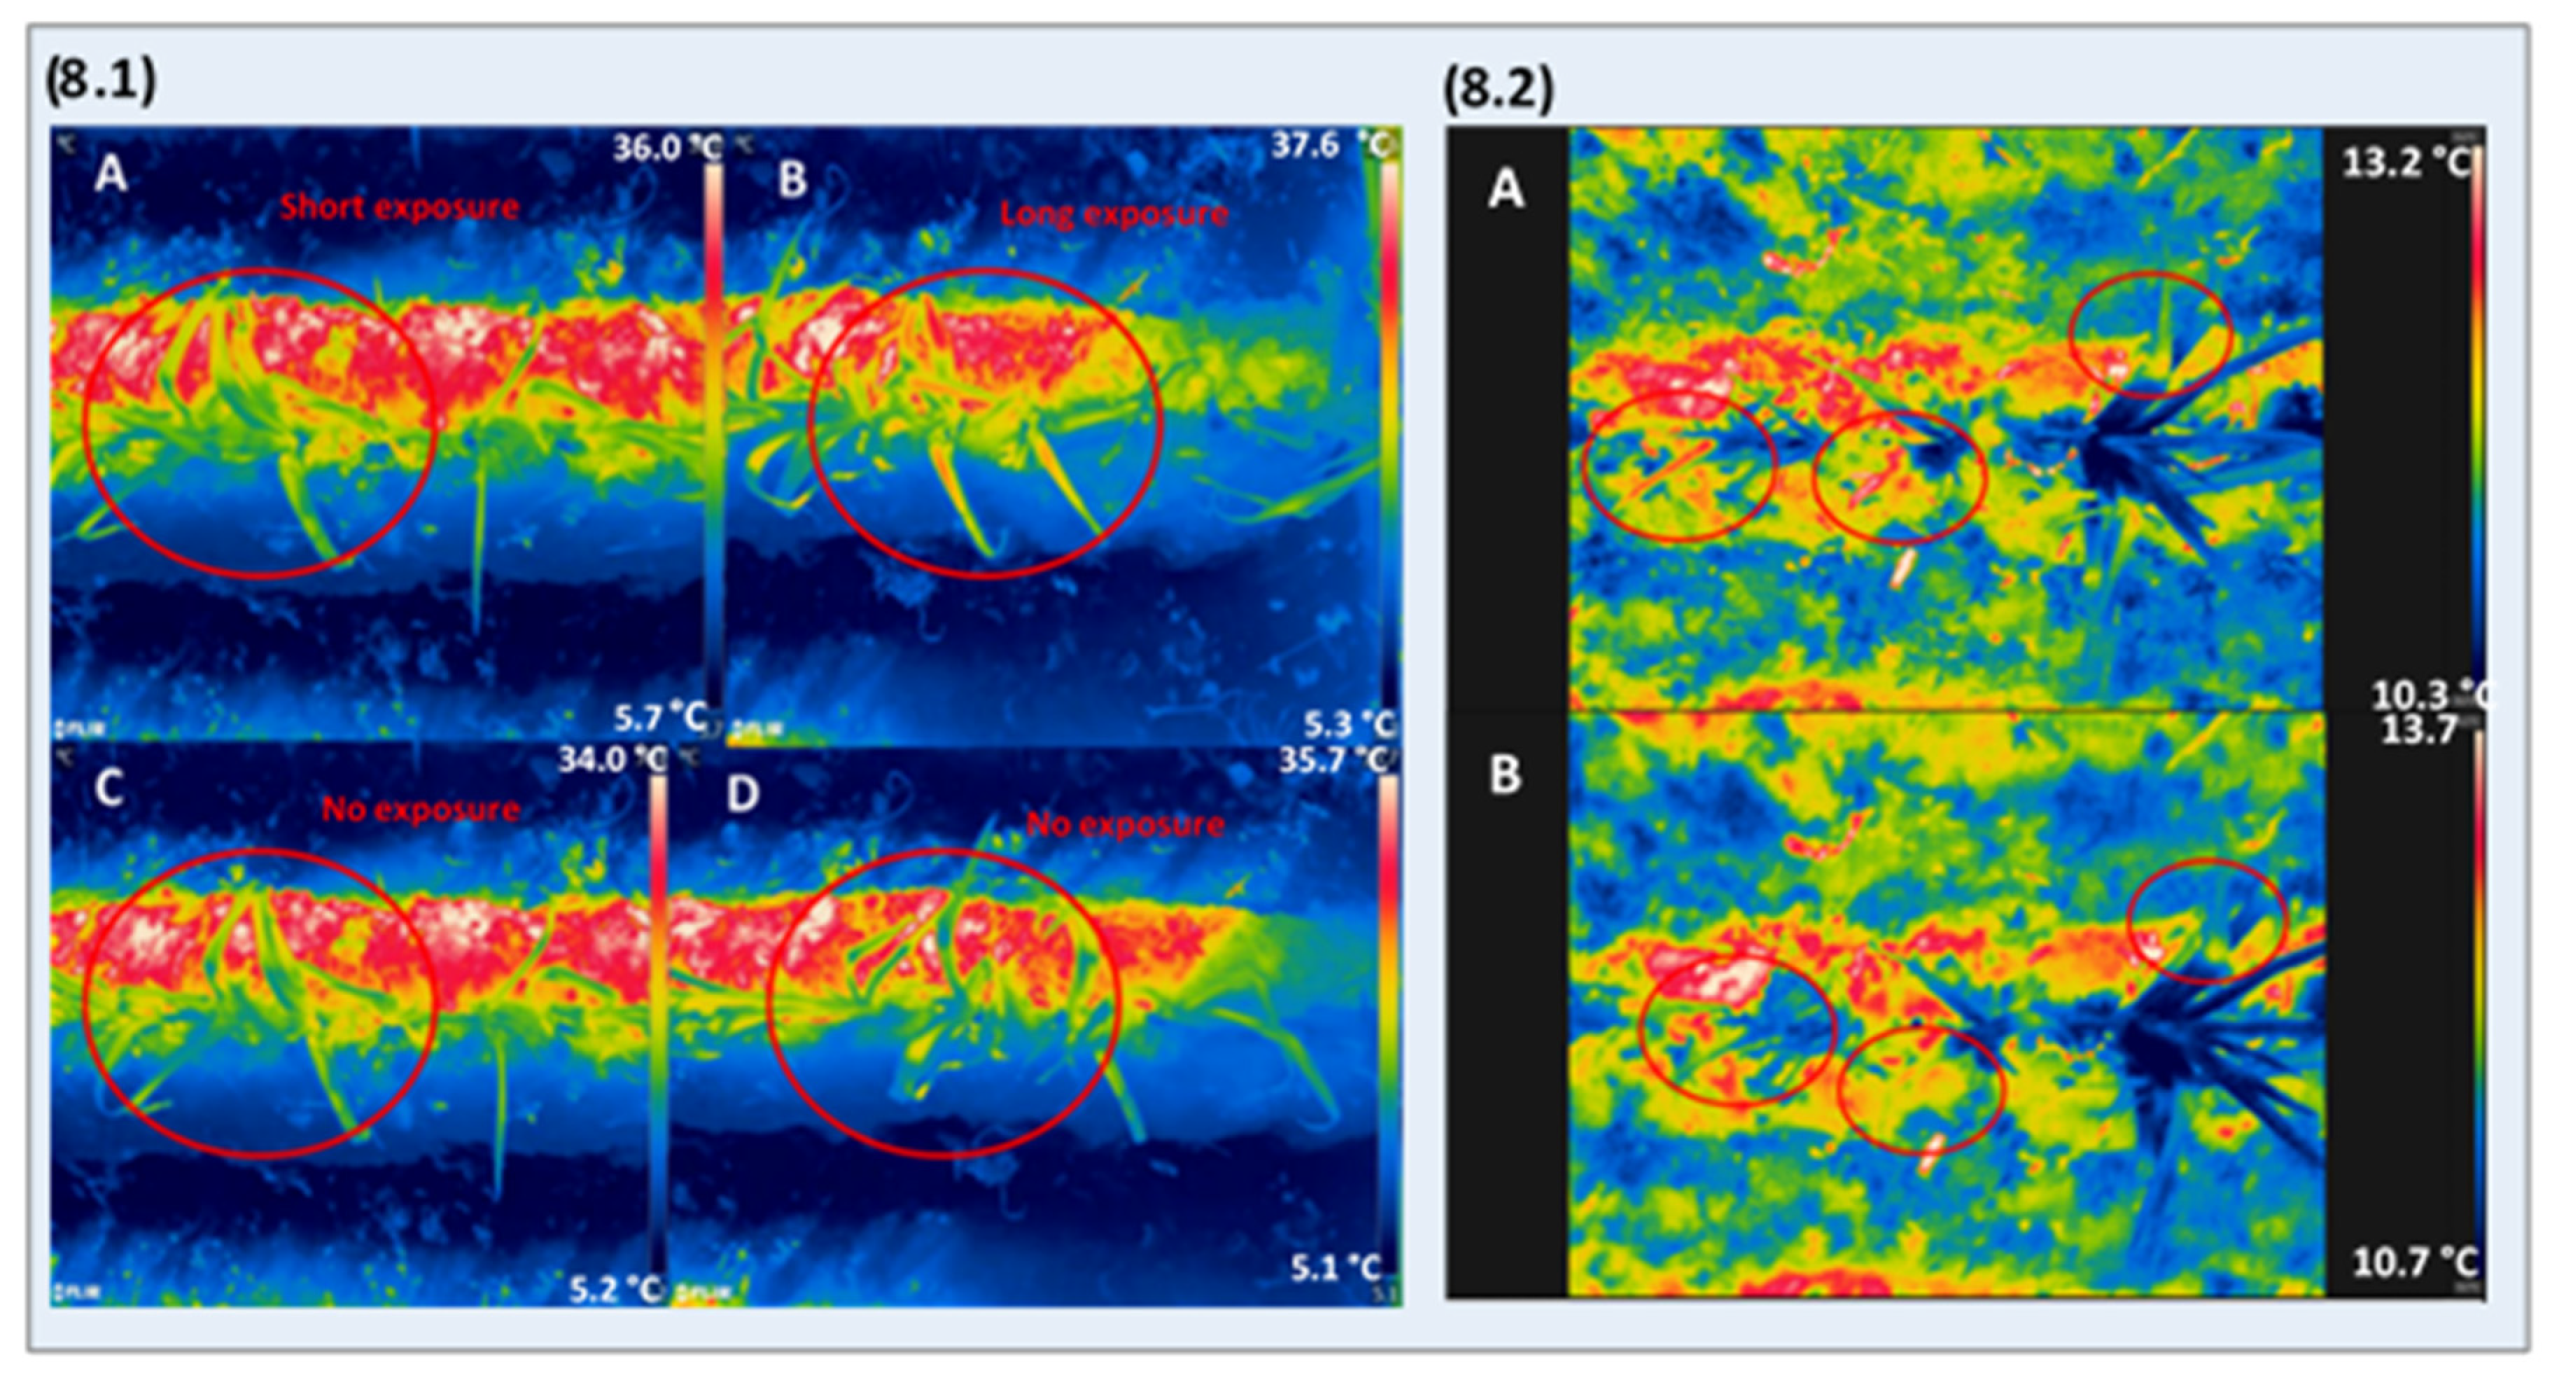
Figure 8 compares thermal images measured in conditions with and without artificial light, under sunny (8.1) and cloudy (8.2) conditions.
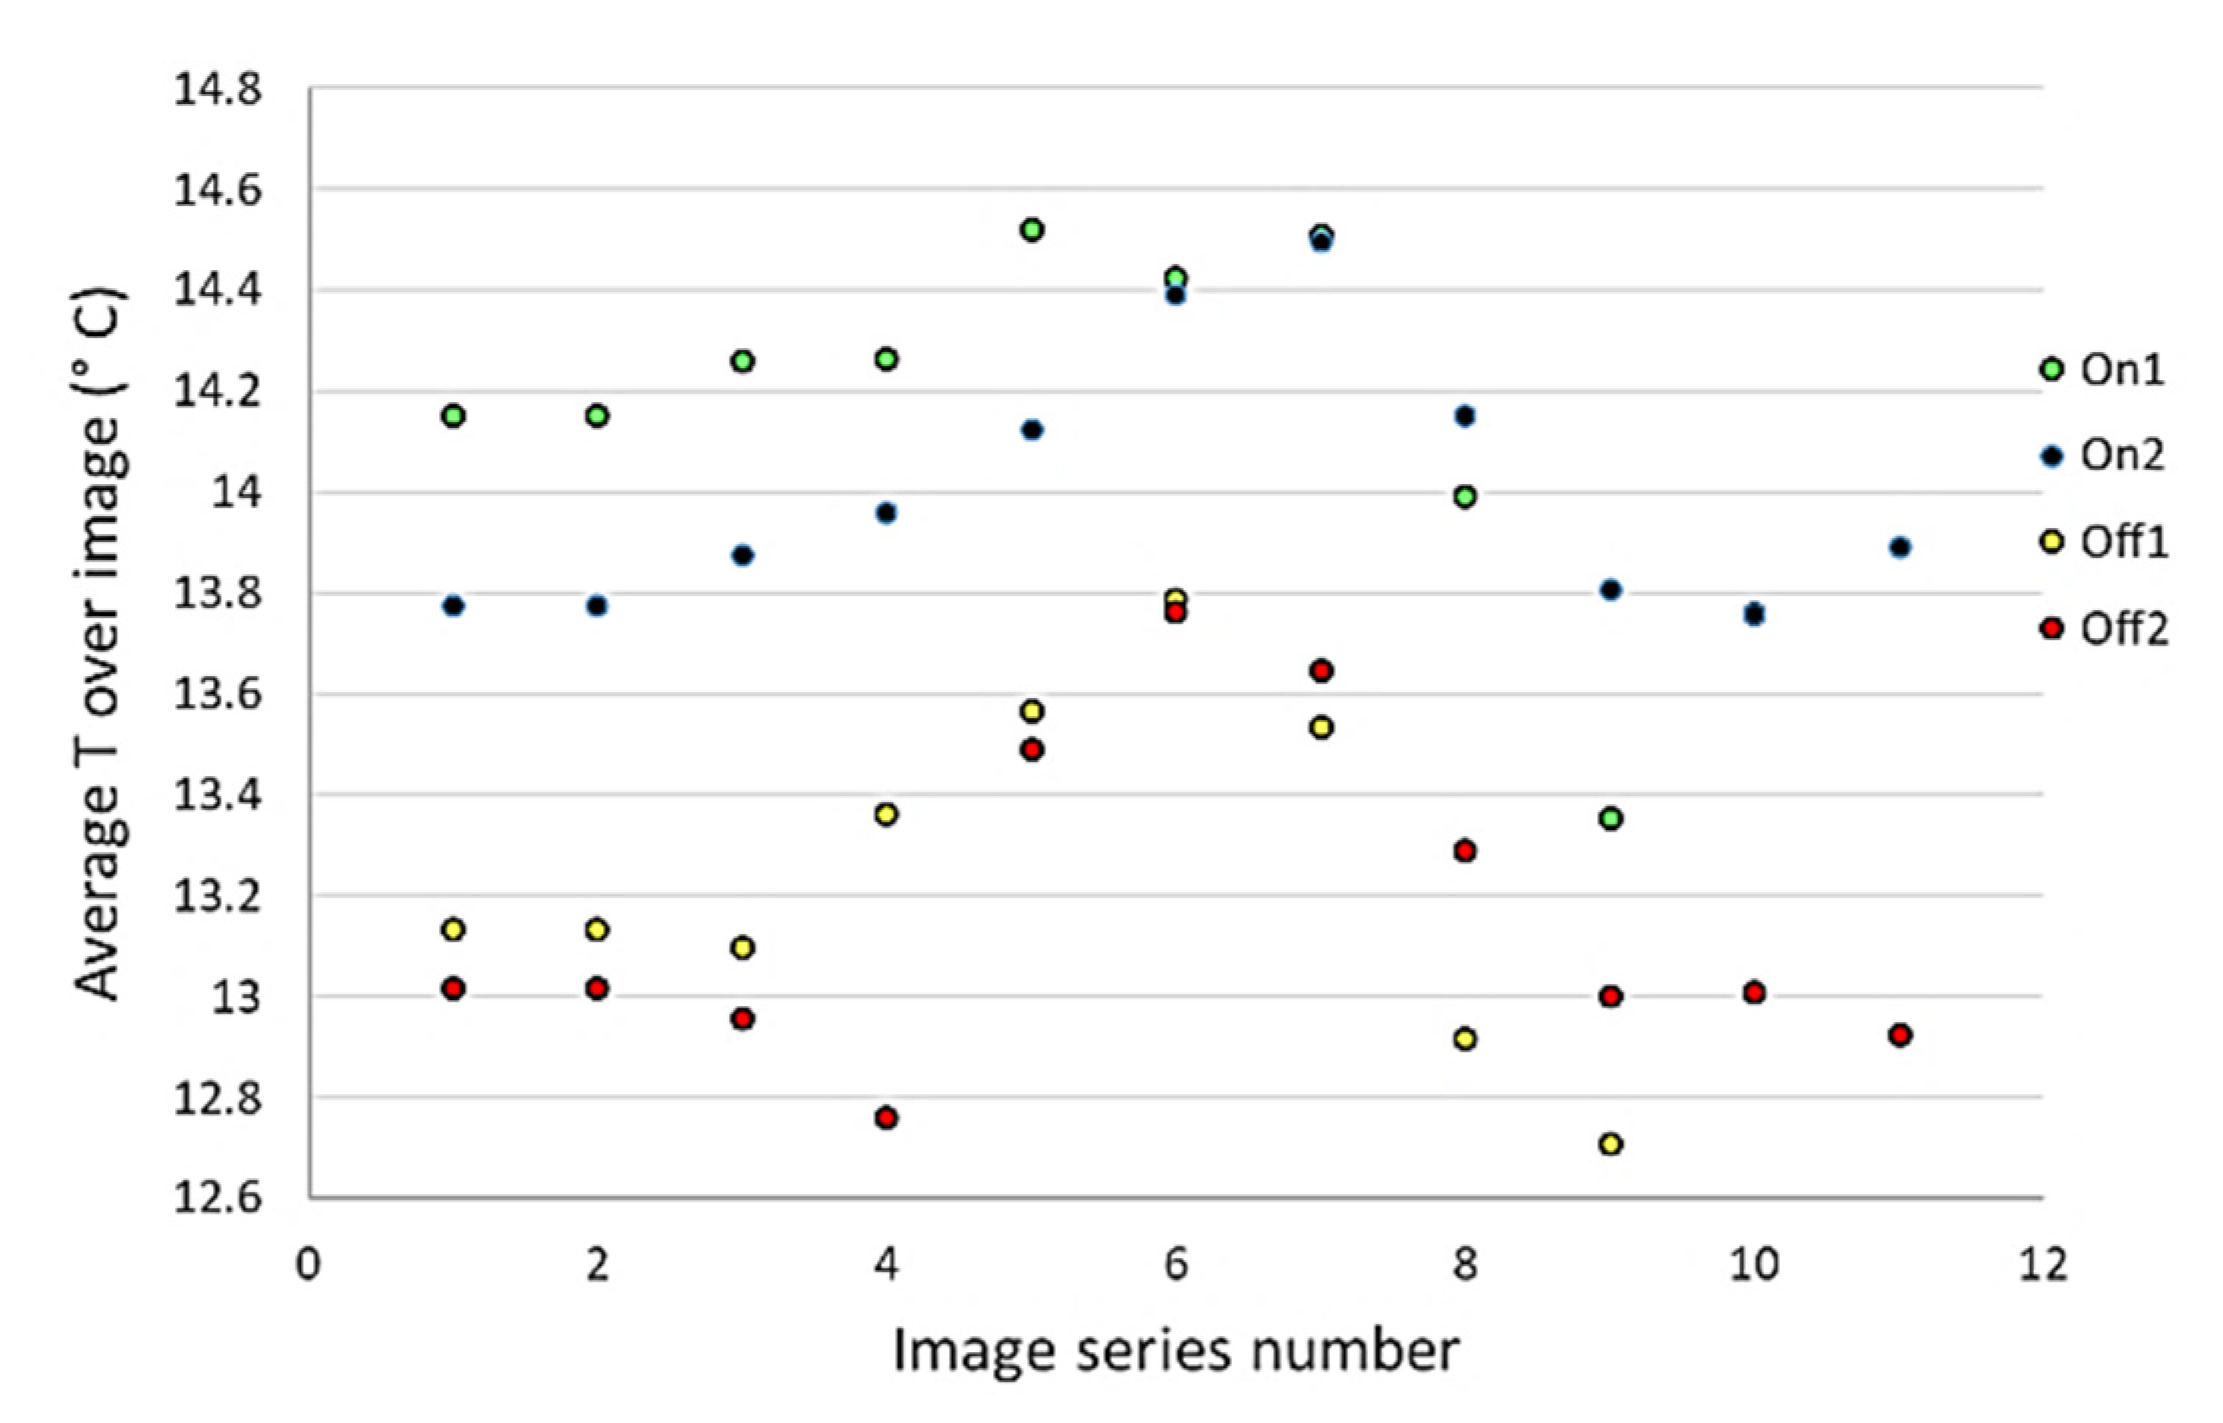
Comparing Figure 8.1B,D with Figure 8A,C, it can be seen that the ridge at the edge of the row was slightly slanted, causing it to receive less radiation, which resulted in a decreased average temperature measured in these frames (Figure 8.1B,D). It can further be observed that the prolonged exposure to the halogen lights at the row edge caused a temperature increase in the top parts of the crop canopy, which is closest to the lamps (Figure 8.1B). This leads to ‘hot spots’ that were not necessarily related to disease or other types of plant stress, since no disease appeared during the weeks following measurement and the hot spots appeared only after the halogen lamps were turned on. There was no clear formation of hot spots in the middle of the crop row during the light-on treatment (Figure 8.1A,C). The temperature difference seemed to mainly stem from absorption of radiation by the soil. Figure 8.2 shows the effect of additional lighting during cloudy conditions. This measurement was later in the growing season, when dense weed cover started appearing on the ridges. It is clear from the thermal images that weeds significantly affect measured temperature patterns, as weed temperature was cooler than that of the soil but generally hotter than the leek. No apparent average temperature increase was observed when switching on lights, considering the entire thermal image, with even some minor temperature decrease. The red circled areas on Figure 8.2A show that during this measurement, the artificial light caused hot spots even during movement of the sensor box. This was repeatedly observed in different locations throughout the measured leek rows. These hotspots seemed to be located around sharp bends in the leaves or on lower leaves, which were older and decaying. Looking at healthy leaf tissue (areas outside the red circles), there was no effect of additional light, even on parts of the leek crop that were higher compared to the hotspots. Figure 9 shows the average temperature measured over two rows of leek plants, in conditions with and without artificial lights. There was approximately a 1 °C increase in average temperature due to the addition of artificial light, during sunny conditions. The images taken in the middle of the crop row (image series number 4–8) showed a higher average temperature compared to those at the row edge.

4. Discussion

4.1. Multiple Sensor Setup Selection

The combination of a snapshot hyperspectral, thermal and fluorescence sensor would cost over 200.000 euro. The biggest cost is the snapshot fluorescence camera, at around 175.000 euro. To the best of our knowledge, this is the only sensor of its type available on the market today. The cheapest combination of all three sensors would cost approximately 55.000 euro (Table 1) and consists of a pushbroom hyperspectral sensor, a snapshot thermal camera, and a point measurement fluorescence sensor. It is on the other hand possible to combine a hyperspectral and thermal sensor for under 20.000 euro. The high cost of fluorescence sensors might lead researchers to opt for a cheaper version, such as the handheld MultispeQ clip-on fluorescence sensor (PhotosynQ, USA), which costs around 1000 euro. However, clip-on sensors cannot be used for on-the-go scanning, requiring researchers to invest a lot of time for manual measurements. We therefore believe that for practical applications in precision agriculture, the combination of hyperspectral and thermal sensors provides a good starting point, with relatively low investment costs and less complexity compared to a system including a fluorescence sensor as well. This led to the choice to use a snapshot thermal sensor and a pushbroom hyperspectral sensor for this experiment, both costing no more than 20.000 euro each.

4.2. Hyperspectral Setup Optimisation

The results from Figure 2 and Figure 3 and Figure 4 and Figure 5 confirmed that the method used for optimising the hyperspectral sensor setup for a wheat canopy can likewise be used to optimise the setup for a potato and leek canopy. The most optimal setups in potato and leek consisted of an ET of 50 ms (Figure 3). There was also a clear trend in the potato SNR values indicating a positive correlation with ET, which is in agreement with results found in a wheat canopy [19]. For leek, values appeared more variable. The effect of each variable is shown in the PCA factor map plots of Figure 4 and Figure 5. Both figures indicated that height seemed less important for SNR. The angle also showed no clear correlation to SNR in either of the figures. However, the ET vector was clearly congruent with the SNR vector in the potato PCA factor map plots (Figure 4). Together with the values presented in Figure 3, it is reasonable to conclude that ET was the most important factor affecting SNR for this experiment. This is in agreement with the findings in wheat, where ET was also found to be the most important factor determining SNR values [19]. However, the results in leek were less clear-cut compared to those of potatoes and wheat. This crucial difference means that researchers must always determine the optimal setup for the crop under observation, before measurements. In our results, the optimal setups consisted of an angle of 8°, a height of 70 cm and an ET of 50 ms for potatoes and an angle of 17°, a height of 70 cm and an ET of 50 ms for leek (Figure 3). The optimal setup for leek also registered as the 5th best setup for potatoes. Theoretically, the best measurement setup (of the ones tested in this experiment) for both crops therefore lies at an ET of 50 ms, a height of 70 cm and an off-zenith angle of 8° to 17°. However, some practical constraints have to be considered. First, we observed the occurrence of saturation at ETs of 30 and 50 ms in potato and leek, respectively, similar to the results in wheat [19], but there for a much higher ET of 1000 ms. Only the 1 and 10 ms treatments did not show saturation. It is further important to note that a lower ET results in a higher possible framerate. For some measurement conditions, there is a minimum speed at which the measurement needs to be done (e.g., due to time restrictions, operating speed of a treadmill or driving speed of a tractor). This speed correlates to a minimum framerate necessary to obtain a scan of the full sample, which in turn is associated to a maximum possible ET. From Figure 3, it can be concluded that theoretically the optimal height of scanning of both studied crops seemed to be 70 cm. However, since the variability in potato SNR values and to a lesser extent in leek is mainly caused by ET, the choice of measurement height needs to depend on other factors than the SNR values. We propose that measurement height is determined mainly by pixel resolution and scanning width needed in the experimental context. For example, if the main goal is to scan as large a crop area as possible in a limited amount of time (e.g., farmer field scans), then a height above the crop of 110 m is beneficial. However, if the aim of the experiment is to detect small symptoms (e.g., rust pustules) on the leaves of an experimental leek plot in early stages of infection, a height of 30 cm above the crop is preferable, since this will yield a higher image resolution.
The off-zenith angle shows no clear correlation to SNR like that of the ET, except for leek in the PC1–PC2 plot (Figure 4). The complex interaction between viewing angle and reflectance has been studied for forest canopies [39]. It was found that for white backgrounds, the reflectance decreased with increasing off-zenith measurement angle, while for dark backgrounds the opposite occurred, with increasing reflectance at higher off-zenith viewing angles. In a mixed system such as a crop canopy that contains brighter areas (e.g., phytophthora or other wilting symptoms) and also darker areas (e.g., dark spots or shaded areas), it is difficult to theorise on the effect of viewing angle on reflectance and SNR. Results in pine forests showed that there was a specific angular effect on the reflectance of the red and red edge bands for coniferous trees, possibly due to their canopy structure [40]. Such an angular effect due to canopy structure could contribute to the difference between the results for potato and leek, since angle only seemed to contribute to SNR for leek canopy measurements. This is supported by the clear difference between the oblique growth pattern of a leek canopy, where angular differences are significant between leaves, compared to the relatively homogenous growth pattern of a dense potato canopy, where angular differences might be more easily averaged out. It has further been shown that the angle significantly affects certain canopy measurements, for example of vegetation indices [41]. This is relevant when performing image analysis on, for example, single leaves. In such case, the effect of geometry on reflectance can be modelled to improve data analysis [41,42,43,44]. The same applies to satellite imagery, where the modelling of the solar off-zenith angle is crucial [45]. However, for practical applications in proximal crop sensing, such complex crop geography modelling techniques are often omitted, and it is assumed that the effect can be neglected, or vegetation indices are used that are resistant to these effects [41,46]. We therefore propose that the measurement angle needs to be estimated based on the disease of interest. Ideally, scans should be taken perpendicularly to the plane, in which symptoms occur, to maximize the chance of scanning the infected area. If the disease is for example known to manifest on the bottom of the stem, a 0° off-zenith angle will have no chance of detecting it, as opposed to a 17° angle, which makes it possible to scan the lower canopy. Results for powdery mildew detection in grapes also supported the use of higher off-zenith angles [35]. This leads us to advise an off-zenith angle of 17° to detect symptoms on the bottom of the leek stem and lower leaves. Phytophthora damage tends to appear at leaf tips, but also on the base of the leaf where spores are splashed onto the plant from the soil [47]. To detect symptoms on lower leaves of the potato canopy, an angle of 17° is again advised, especially in dry growing conditions that cause the leaves to sag, causing the symptoms to be in the vertical plane perpendicular to the soil.
Although the use of artificial lights has certain advantages (see subsection 3 of the discussion), it also increases the risk of saturation, especially at low measurement heights. The choice of the optimal measurement setup is therefore not only based on the best SNR but is far more complex and should be discussed from practical perspective, taking into account the specific case of each disease or crop under observation. A balance needs to be found between high ET, resulting in better SNR values, while taking into account saturation, pixel size, measurement speed and the structure of the pathosystem. Specifically, for leek, white tip disease (Phytophthora porri) symptoms can easily cause saturation at low scanning heights because of their proximity to artificial lights, even at low ETs. The trade-off between the risk of saturation (at high ETs) and the risk of noisy data (at low ETs) can partly be overcome by spectra preprocessing techniques, which can, to some extent, deal with noisy spectra [48]. It is important to note that the reflectance values in the visible part of the spectrum are much lower compared to the near-infrared part of the plant canopy spectrum [49]. This means that saturation could primarily occur in the near-infrared part of the spectrum, while a low ET and subsequent noisy data could occur more easily in the visible part of the spectrum. Depending on which part of the spectrum is mainly of interest, the saturation/noise trade-off might be different. For proximal disease detection in experimental conditions for leek and potato, we advise a height of 30 cm (instead of the SNR optimum of 70 cm) above the crop canopy, to maintain a high resolution. Because of the risk of saturation at this height, an ET of 1 ms is advised for both leek and potato, instead of the SNR optimum of 50 ms (for both leek and for potato). This needs to be increased if spectra appear “flat”, with minor or without features. However, saturation should be absolutely avoided. Since no clear influence was observed for the angle, it is recommended to use the 17° angle because it can measure symptoms on lower canopy parts. This was the theoretical optimal angle for a leek canopy, but for a potato canopy the theoretical optimum was an 8° angle.

4.3. Effect of Artificial Lighting on Hyperspectral Measurements of a Crop Canopy in the Field

To explain the phenomenon that the added light seemed to decrease reflectance of spectra collected from a canopy on a cloudy day (Figure 6B), the spectral profile of the white reference was investigated (Figure 7). At wavelengths up to +/-470 nm, the difference between the light on/off white reference reflectance curves under cloudy conditions (Figure 7B) was minimal, similar to sunny conditions (Figure 7A). At higher wavelengths, the difference increased. Without additional light, the white reference reflectance curve under cloudy conditions was skewed compared to the curve under sunny conditions (due to the effects of cloud cover), leading to an inappropriate correction at high wavelengths. The corrected spectrum of wavelengths > 470 nm was ‘stretched’ compared to those at lower wavelengths. This is due to lower white reference reflectance values, which increases the final corrected value according to Equation (1). This explains why in Figure 6B, the added light under cloudy conditions caused a decrease in reflectance compared to the light-off scenario. Turning on the artificial light increased the white reference to such a degree that it counteracted the increased reflection from the crop canopy (due to added artificial radiation), resulting in ultimately lower reflectance values. If there would have been no artificial illumination during experiments, the skewed white reference values on cloudy days would cause the final reflectance in the >470 nm range to be relatively stretched (as shown in Figure 6B) compared to the same target measured on a sunny day (Figure 6A), independent of the crop health status. The added light helped to counteract this problem.
After normalisation, the shapes of the light on/off canopy reflectance curves are similar under sunny conditions (Figure 6C), with only a small difference in the NIR part of the spectrum that could be amended by further preprocessing [50]. The difference between light on/off canopy reflectance curves is much more severe under cloudy conditions, especially around 680 nm. This is an important region for disease detection, so it is essential that any change in reflectance is the result of disease, rather than cloud cover variation [11]. The apparent increase in Figure 6D between 600 to 680 nm could be misinterpreted as an increased ‘red-orange’ colour, which could be interpreted as rust disease symptoms (results not shown). The addition of artificial light helps counteract this effect to some extent, but it is still important to keep this in mind for further data analysis. This area, especially the red colour band at 680 nm, is well documented in literature as being a spectral feature indicating chlorophyll absorption, making it one of the most important features in crop health sensing [19]. The drop in measured reflectance at +/-930 nm appears in both the lights on and lights off curves during cloudy conditions, which suggests that this is a feature, rather than purely the result of variations in solar radiation intensity due to cloud cover (Figure 6D). The fact that this drop occurred only in cloudy conditions lead us to look at the absorbance spectra of cloud cover reported in literature [51]. These authors reported a significant absorption band around 940 nm for stratus clouds, which could possibly explain the decrease in reflectance. This could indicate that the artificial light was not strong enough to compensate for the absorption caused by cloud cover in this spectral region.
Another important aspect of the artificial light is that the angle of reflectance is different compared to that of natural solar radiation [18]. During sunny conditions, the light strikes the crop at a certain angle, depending on the solar radiation. With the artificial light, the light strikes the crop from both sides (because two lamps are used in the present work), at a constant angle to the sensor. This means that the light not only counteracts the effect of cloud cover but also provides a constant source of illumination that helps mitigate the effects of changing solar angle. It is therefore advisable to use as much artificial lights as possible, to reduce the effect of solar radiation variation.

4.4. Effect of Artificial Lighting on Thermal Measurements of a Crop Canopy in the Field

If the crop temperature would increase significantly during sensor movement due to the added radiation, it would be most apparent on the top leaves, which receive most of the radiation. During sunny conditions, hot spot formation was only apparent at the edge of the crop row, where the sensor box stayed stationary for more than 10 seconds (Figure 8.1B). This indicates that even though there was a temperature difference during these measurements, it was mainly caused by absorption of radiation by the soil, not the crop. Otherwise, hot spot formation would occur on the top leaves during measurements (and not only when the box was stationary). Note that this implies that correcting for the temperature difference caused by artificial light is difficult because not every part of the crop row heats up equally. The assumption that bare soil is mainly responsible for the temperature difference between light on/off is also supported by the fact that average measured temperatures varied between the edge and the middle of the crop row, where the soil-to-crop ratio is different (Figure 9). An important observation is that during cloudy conditions (Figure 8.2), there was no apparent temperature increase compared to 1 °C for sunny conditions (Figure 8.1). There was even a small apparent decrease (0.5 °C or less) after turning on the lights for some images during cloudy conditions. The temperature decrease is possibly due to the effect of variations in cloud cover, which are difficult to record during the time of one scan. The lack of temperature difference could also be explained by the dense weed cover that covered the darker soil later in the growing season during the measurements under cloudy conditions. This suggests that it is possible to use halogen lamps in combination with a thermal sensor for weed or crop cover assessment.
During cloudy conditions, hot spot formation in the middle of the crop row was observed during measurements, not only when the sensor box was stationary (Figure 8.2A). The leek crop was older during this measurement, showing signs of wilting on older leaves in places where the leaves were bent or cracked. It was in here that hot spot formation occurred, even when the sensor box passed over the crop in a matter of seconds. This indicates that artificial light interacts differently with diseased or damaged and healthy parts of the crop and that this difference can be observed with thermal cameras. This feature could assist in disease detection using thermal cameras in addition to the fact that these sensors can measure the temperature differences due to evapotranspiration. It is also important to note that the interaction between artificial light and damaged crop areas occurred even over a matter of seconds, which is much faster than the rate at which evapotranspiration changes occur [52]. This could provide new research opportunities, for example by placing thermal cameras with artificial lights at the back of weeders for detecting mechanical damage after passage, which would take longer to show if no artificial light is present.

5. Conclusions

The cost of fluorescence sensors is close to ten times that of a hyperspectral or thermal sensor, leading researchers to favour thermal and hyperspectral imaging. However, very few research groups studied the use of a combination of these two sensors in different applications in crop monitoring and sensing. Our results showed that the setup optimisation method for a pushbroom hyperspectral camera, based on maximum signal-to-noise ratio (SNR), tested in wheat can be extrapolated to other crops. However, different set up parameters should be implemented for different crops to allow successful measurement in practice. The optimal set up parameters found in the present study for potatoes and leek are a camera height of 30 cm, a 17° camera angle and an exposure time (ET) of 1 ms. In line with camera set up results for wheat, ET was the most important parameter affecting SNR, with higher ETs leading to higher SNRs. Measurements in different cropping systems need to be done to determine general applicability of the optimal setup findings. We further concluded that the addition of artificial lights helps counteract the effect of cloud cover on reflectance measurements, aiding disease detection. The temperature difference caused by the additional light appeared to mainly vary with the plant to bare soil ratio. Possible practical applications regarding weed and crop cover assessment with thermal measurements need to be further investigated. Hot spot formation due to artificial light could possibly be used to assess disease stress of certain diseases, due to differential heat absorption of healthy versus diseased crops. A comparison between healthy and diseased plants is needed to confirm the hypothesis that disease detection capabilities increase with the addition of artificial light, for both thermal and the hyperspectral sensing.

Author Contributions

Conceptualization, S.A., J.P. and A.M.M.; methodology, S.A., A.G., J.P. and A.M.M.; validation, S.A., J.P. and A.M.M.; formal analysis, S.A. and S.N.; investigation, S.A.; resources, A.G.; data curation, S.A.; writing—original draft preparation, S.A.; writing—review and editing, S.A., J.P. and A.M.M.; visualization, S.A.; supervision, J.P. and A.M.M.; project administration, A.M.; funding acquisition, A.M.M. All authors have read and agreed to the published version of the manuscript.

Funding

The author(s) disclosed receipt of the following financial support for the research, authorship, and/or publication of this article: This work was supported by the Research Foundation - Flanders (FWO) for Odysseus I SiTeMan Project [Nr. G0F9216N].

Acknowledgments

Apart from the people listed on this paper, a big thanks to the people at Bottelare experimental farm, UGent mechanical workshop and my colleagues who helped me in the field.

Conflicts of Interest

The authors declare no conflict of interest.

References

  1. Armengol, J.; Weigand, S.; Von Tiedemann, A.; Kreiter, S.; Duso, C. Education in crop protection: Erasmus Mundus Joint Master Degree–European Master Degree in Plant Health in Sustainable Cropping Systems. J. Biotechnol. 2019, 305, S8. [Google Scholar] [CrossRef]
  2. Agrios, G.N. Plant Pathology, 5th ed.; Elsevier Academic Press: Amsterdam, The Netherlands, 2005; Volume 26. [Google Scholar]
  3. Anderson, P.K.; Cunningham, A.A.; Patel, N.G.; Morales, F.J.; Epstein, P.R.; Daszak, P. Emerging infectious diseases of plants: Pathogen pollution, climate change and agrotechnology drivers. Trends Ecol. Evol. 2004, 19, 535–544. [Google Scholar] [CrossRef] [PubMed]
  4. Brasier, C.M. The biosecurity threat to the UK and global environment from international trade in plants. Plant Pathol. 2008, 57, 792–808. [Google Scholar] [CrossRef]
  5. Fisher, M.C.; Henk, D.A.; Briggs, C.J.; Brownstein, J.S.; Madoff, L.C.; McCraw, S.L.; Gurr, S.J. Emerging fungal threats to animal, plant and ecosystem health. Nature 2012, 484, 186. [Google Scholar] [CrossRef] [PubMed]
  6. Bebber, D.P.; Holmes, T.; Gurr, S.J. The global spread of crop pests and pathogens. Glob. Ecol. Biogeogr. 2014, 23, 1398–1407. [Google Scholar] [CrossRef] [Green Version]
  7. Coakley, S.M. Variation in climate and prediction of disease in plants. Ann. Rev. Phytopathol. 1988, 26, 163–181. [Google Scholar] [CrossRef]
  8. Mahlein, A.K.; Kuska, M.T.; Behmann, J.; Polder, G.; Walter, A. Hyperspectral sensors and imaging technologies in phytopathology: State of the art. Ann. Rev. Phytopathol. 2018, 56, 535–558. [Google Scholar] [CrossRef]
  9. Rosenzweig, C.; Iglesias, A.; Yang, X.B.; Epstein, P.R.; Chivian, E. Climate change and extreme weather events; implications for food production, plant diseases, and pests. Glob. Chang. Human Health 2001, 2, 90–104. [Google Scholar] [CrossRef]
  10. Bohnenkamp, D.; Behmann, J.; Mahlein, A.K. In-Field Detection of Yellow Rust in Wheat on the Ground Canopy and UAV Scale. Remote Sens. 2019, 11, 2495. [Google Scholar] [CrossRef] [Green Version]
  11. Mahlein, A.K. Present and Future Trends in Plant Disease Detection. Plant Dis. 2016, 100, 1–11. [Google Scholar] [CrossRef]
  12. Nigon, T.J.; Yang, C.; Dias Paiao, G.; Mulla, D.J.; Knight, J.F.; Fernández, F.G. Prediction of Early Season Nitrogen Uptake in Maize Using High-Resolution Aerial Hyperspectral Imagery. Remote Sens. 2020, 12, 1234. [Google Scholar] [CrossRef] [Green Version]
  13. Shen, L.; Gao, M.; Yan, J.; Li, Z.-L.; Leng, P.; Yang, Q.; Duan, S.-B. Hyperspectral Estimation of Soil Organic Matter Content using Different Spectral Preprocessing Techniques and PLSR Method. Remote Sens. 2020, 12, 1206. [Google Scholar] [CrossRef] [Green Version]
  14. Jin, X.; Li, Z.; Atzberger, C. Editorial for the Special Issue “Estimation of Crop Phenotyping Traits using Unmanned Ground Vehicle and Unmanned Aerial Vehicle Imagery”. Remote Sens. 2020, 12, 940. [Google Scholar] [CrossRef] [Green Version]
  15. Zhang, J.; Tian, H.; Wang, D.; Li, H.; Mouazen, A.M. A Novel Approach for Estimation of Above-Ground Biomass of Sugar Beet Based on Wavelength Selection and Optimized Support Vector Machine. Remote Sens. 2020, 12, 620. [Google Scholar] [CrossRef] [Green Version]
  16. Jiang, Y.; Snider, J.L.; Li, C.; Rains, G.C.; Paterson, A.H. Ground Based Hyperspectral Imaging to Characterize Canopy-Level Photosynthetic Activities. Remote Sens. 2020, 12, 315. [Google Scholar] [CrossRef] [Green Version]
  17. Vargas, J.Q.; Bendig, J.; Mac Arthur, A.; Burkart, A.; Julitta, T.; Maseyk, K.; Thomas, R.; Siegmann, B.; Rossini, M.; Celesti, M.; et al. Unmanned Aerial Systems (UAS)-Based Methods for Solar Induced Chlorophyll Fluorescence (SIF) Retrieval with Non-Imaging Spectrometers: State of the Art. Remote Sens. 2020, 12, 1624. [Google Scholar] [CrossRef]
  18. Mishra, P.; Asaari, M.S.M.; Herrero-Langreo, A.; Lohumi, S.; Diezma, B.; Scheunders, P. Close range hyperspectral imaging of plants: A review. Biosyst. Eng. 2017, 164, 49–67. [Google Scholar] [CrossRef]
  19. Whetton, R.L.; Waine, T.W.; Mouazen, A.M. Optimising configuration of a hyperspectral imager for on-line field measurement of wheat canopy. Biosyst. Eng. 2017, 155, 84–95. [Google Scholar] [CrossRef]
  20. Joalland, S.; Screpanti, C.; Liebisch, F.; Varella, H.V.; Gaume, A.; Walter, A. Comparison of visible imaging, thermography and spectrometry methods to evaluate the effect of Heterodera schachtii inoculation on sugar beets. Plant Methods 2017, 13, 73. [Google Scholar] [CrossRef]
  21. Thenkabail, P.S.; Lyon, J.G. Hyperspectral Remote Sensing of Vegetation; CRC Press: Boca Raton, FL, USA, 2012. [Google Scholar]
  22. López-Maestresalas, A.; Keresztes, J.C.; Goodarzi, M.; Arazuri, S.; Jarén, C.; Saeys, W. Non-destructive detection of blackspot in potatoes by Vis-NIR and SWIR hyperspectral imaging. Food Control 2016, 70, 229–241. [Google Scholar] [CrossRef] [Green Version]
  23. Fitzgerald, G.J.; Rodriguez, D.; Christensen, L.K.; Belford, R.; Sadras, V.O.; Clarke, T.R. Spectral and thermal sensing for nitrogen and water status in rainfed and irrigated wheat environments. Precision Agric. 2006, 7, 233–248. [Google Scholar] [CrossRef]
  24. Amigo, J.M. Practical issues of hyperspectral imaging analysis of solid dosage forms. Anal. Bioanal. Chem. 2010, 398, 93–109. [Google Scholar] [CrossRef] [PubMed]
  25. Franceschini, M.H.; Bartholomeus, H.; Van Apeldoorn, D.; Suomalainen, J.; Kooistra, L. Intercomparison of unmanned aerial vehicle and ground-based narrow band spectrometers applied to crop trait monitoring in organic potato production. Sensors 2017, 17, 1428. [Google Scholar] [CrossRef] [PubMed]
  26. Garzonio, R.; Di Mauro, B.; Colombo, R.; Cogliati, S. Surface reflectance and sun-induced fluorescence spectroscopy measurements using a small hyperspectral UAS. Remote Sens. 2017, 9, 472. [Google Scholar] [CrossRef] [Green Version]
  27. Thompson, L.J.; Puntel, L.A. Transforming Unmanned Aerial Vehicle (UAV) and Multispectral Sensor into a Practical Decision Support System for Precision Nitrogen Management in Corn. Remote Sens. 2020, 12, 1597. [Google Scholar] [CrossRef]
  28. Asner, G.P. Biophysical and biochemical sources of variability in canopy reflectance. Remote Sens. Environ. 1998, 64, 234–253. [Google Scholar] [CrossRef]
  29. Pinter Jr, P.J.; Jackson, R.D.; Elaine Ezra, C.; Gausman, H.W. Sun-angle and canopy-architecture effects on the spectral reflectance of six wheat cultivars. Int. J. Remote Sens. 1985, 6, 1813–1825. [Google Scholar] [CrossRef]
  30. Whetton, R.L.; Waine, T.W.; Mouazen, A.M. A Practical Approach to In-Situ Hyperspectral Imaging of Wheat Crop Canopies. In Proceedings of the 13th International Workshop on Advanced Infrared Technology Applications, Pisa, Italy, 29 September–2 October 2015; ISBN 978880250. [Google Scholar]
  31. Whetton, R.L.; Waine, T.W.; Mouazen, A.M. Hyperspectral measurements of yellow rust and fusarium head blight in cereal crops: Part 2: On-line field measurement. Biosyst. Eng. 2018, 167, 144–158. [Google Scholar] [CrossRef] [Green Version]
  32. Barbedo, J.G.; Tibola, C.S.; Fernandes, J.M. Detecting Fusarium head blight in wheat kernels using hyperspectral imaging. Biosyst. Eng. 2015, 131, 65–76. [Google Scholar] [CrossRef]
  33. Bousquet, L.; Lachérade, S.; Jacquemoud, S.; Moya, I. Leaf BRDF measurements and model for specular and diffuse components differentiation. Remote Sens. Environ. 2005, 98, 201–211. [Google Scholar] [CrossRef]
  34. Coops, N.C.; Smith, M.L.; Martin, M.E.; Ollinger, S.V. Prediction of eucalypt foliage nitrogen content from satellite-derived hyperspectral data. IEEE Trans. Geosci. Remote Sens. 2003, 41, 1338–1346. [Google Scholar] [CrossRef]
  35. Oberti, R.; Marchi, M.; Tirelli, P.; Calcante, A.; Iriti, M.; Borghese, A.N. Automatic detection of powdery mildew on grapevine leaves by image analysis: Optimal view-angle range to increase the sensitivity. Comput. Electron. Agric. 2014, 104, 1–8. [Google Scholar] [CrossRef]
  36. West, J.S.; Bravo, C.; Oberti, R.; Lemaire, D.; Moshou, D.; McCartney, H.A. The potential of optical canopy measurement for targeted control of field crop diseases. Annu. Rev. Phytopathol. 2003, 41, 593–614. [Google Scholar] [CrossRef] [PubMed] [Green Version]
  37. Bravo, C.; Moshou, D.; Oberti, R.; West, J.; McCartney, A.; Bodria, L.; Ramon, H. Foliar disease detection in the field using optical sensor fusion. Agri. Eng. Int. CIGR J. Sci. Res. Dev. 2004. Manuscript FP 04 008. Vol. VI. [Google Scholar]
  38. Rouse, J.W., Jr. Monitoring the Vernal Advancement and Retrogradation (Green Wave Effect) of Natural Vegetation; Texas A&M Univ., College Station: Texas, TX, USA, 1974. [Google Scholar]
  39. Pisek, J.; Chen, J.M.; Miller, J.R.; Freemantle, J.R.; Peltoniemi, J.I.; Simic, A. Mapping forest background reflectance in a boreal region using multiangle compact airborne spectrographic imager data. IEEE Trans. Geosci. Remote Sens. 2009, 48, 499–510. [Google Scholar] [CrossRef]
  40. Rautiainen, M.; Lang, M.; Mõttus, M.; Kuusk, A.; Nilson, T.; Kuusk, J.; Lükk, T. Multi-angular reflectance properties of a hemiboreal forest: An analysis using CHRIS PROBA data. Remote Sens. Environ. 2008, 112, 2627–2642. [Google Scholar] [CrossRef]
  41. Behmann, J.; Mahlein, A.K.; Paulus, S.; Kuhlmann, H.; Oerke, E.C.; Plümer, L. Calibration of hyperspectral close-range pushbroom cameras for plant phenotyping. ISPRS J. Photogramm. Remote Sens. 2015, 106, 172–182. [Google Scholar] [CrossRef]
  42. Clarke, T.A.; Fryer, J.G. The development of camera calibration methods and models. Photogramm. Record 1998, 16, 51–66. [Google Scholar] [CrossRef]
  43. Horaud, R.; Mohr, R.; Lorecki, B. On single-scanline camera calibration. IEEE Trans. Robot. Autom. 1993, 9, 71–75. [Google Scholar] [CrossRef]
  44. Schowengerdt, R.A. Remote Sensing: Models and Methods for Image Processing; Elsevier: Amsterdam, The Netherlands, 2006. [Google Scholar]
  45. Grosvenor, D.P.; Wood, R. The effect of solar zenith angle on MODIS cloud optical and microphysical retrievals within marine liquid water clouds. Atmos. Chem. Phys. 2014, 14, 7291–7321. [Google Scholar] [CrossRef] [Green Version]
  46. Van Beek, J.; Tits, L.; Somers, B.; Coppin, P. Stem water potential monitoring in pear orchards through WorldView-2 multispectral imagery. Remote Sens. 2013, 5, 6647–6666. [Google Scholar] [CrossRef] [Green Version]
  47. Declercq, B. Integrated Disease Management Based on the Life Cycle of Phytophthora Porri. Ph.D. Dissertation, Ghent University, Ghent, Belgium, 2009. [Google Scholar]
  48. Dasu, T.; Johnson, T. Exploratory Data Mining and Data Cleaning. John Wiley Sons: New York, NY, USA, 2003; Volume 479. [Google Scholar]
  49. Gates, D.M.; Keegan, H.J.; Schleter, J.C.; Weidner, V.R. Spectral properties of plants. Appl. Opt. 1965, 4, 11–20. [Google Scholar] [CrossRef]
  50. Rinnan, Å.; Van Den Berg, F.; Engelsen, S.B. Review of the most common pre-processing techniques for near-infrared spectra. TrAC Trends Anal. Chem. 2009, 28, 1201–1222. [Google Scholar] [CrossRef]
  51. Kindel, B.C.; Pilewskie, P.; Schmidt, K.S.; Coddington, O.; King, M.D. Solar spectral absorption by marine stratus clouds: Measurements and modeling. J. Geophys. Res. Atmos. 2011, 116. [Google Scholar] [CrossRef]
  52. Marín, D.; Martín, M.; Serrot, P.H.; Sabater, B. Thermodynamic balance of photosynthesis and transpiration at increasing CO2 concentrations and rapid light fluctuations. Biosystems 2014, 116, 21–26. [Google Scholar] [CrossRef] [Green Version]
Figure 1. Aluminium frame with free-moving wheels designed to move a sensor box over leek and potato rows in field conditions. The sensor box contains a pushbroom hyperspectral camera and a thermal camera flanked by two 500 W halogen lights.
Remotesensing 12 01939 g001
Figure 2. Close-up of mini shovel with aluminium beam supporting the sensor box. The box contained the hyperspectral and thermal sensor, flanked by two 500 W halogen lights and was moved over the row of potato test plots. A laptop was mounted on the side to allow control of the sensors. A generator mounted on the back of the mini shovel provided power for the lights, laptop and sensors.
Remotesensing 12 01939 g002
Figure 3. Signal-to-noise ratio (SNR) calculated for the hyperspectral camera for different combinations of setup parameters of height (H), angle (A) and exposure time (ET). Values of SNR were calculated for each wavelength, over all pixels, and then averaged over all wavelengths. Both datasets (leek and potato) have been normalised to be between 0 and 1 using (x-min)/range.
Remotesensing 12 01939 g003
Figure 4. Principal component analysis (PCA) variables factor map plots of a potato canopy, showing the projection on principal components (PC1 and PC2) (top) and PC1 and PC3 (bottom). The projection of each variable vector on the axis formed by the signal-to-noise ratio (SNR) vector gives an indication of the relation of this variable to SNR.
Remotesensing 12 01939 g004
Figure 5. Principal component analysis (PCA) variables factor map plots of a leek canopy, showing the projection on PC1 and PC2 (top) and PC1 and PC3 (bottom). The projection of each variable vector on the axis formed by the signal-to-noise ratio (SNR) vector gives an indication of the relation of this variable to SNR.
Remotesensing 12 01939 g005
Figure 6. Average reflectance curve of a leek canopy with artificial light (two 500 W halogen lamps) on (dashed blue line) and light off (full green line) scenarios under sunny (A) and cloudy (B) weather conditions. Normalised spectra plots also shown for sunny (C) and cloudy (D) conditions.
Remotesensing 12 01939 g006
Figure 7. White reference signal curve with artificial light (two 500 W halogen lamps) on (green line) and lights off (blue line) scenarios under sunny (A) and cloudy (B) scanning conditions. Raw sensor signal is shown.
Remotesensing 12 01939 g007
Figure 8. Figure 8.1 shows thermal images of a leek ridge in the middle of the row (Figure 8.1A,C) and at row edge (Figure 8.1B,D). Scans were taken during cloudless, sunny conditions, with additional lighting (Figure 8.1A,B) and in natural light (Figure 8.1C,D). Figure 8.2 shows thermal images taken on a cloudy day, comparing lights on (Figure 8.2A) with lights off (Figure 8.2B). Red circles indicate the areas studied for comparison of hot spot formation. Rightmost red circles of Figure 8.2 (A and B) show the bend of a leaf, which shows up as a hot spot due to physical damage caused by the bending/cracking of the leaf.
Remotesensing 12 01939 g008
Figure 9. Average T calculated over a series of thermal images captured over two leek crop rows under sunny conditions. Images captured with (on) and without (off) artificial light. Background soil temperature was lower compared to leek temperatures, meaning that lower temperatures correspond to areas with relatively few leek plants, while higher temperature corresponds to the centre of the leek row.
Remotesensing 12 01939 g009
Table 1. Available hyperspectral, thermal and fluorescence sensors, with key technical parameters and price ranges. The focus is on sensors that can be used in field conditions.
Manufacturer/
Distributor
SensorSpectral Range (nm) or Parameter MeasuredNumber of BandsData AcquisitionOn-the-Go MeasurementSensor TypePrice (excl. VAT, 2018)
CubertS185 – FireflEYE SE450–950125SYesHS€ 39.900
CarbonbeeVNIR300–1000256SYesHS/
IMECVNIR470–900150HNoHS€ 15.575
CorningmicroHSI 410 SHARK400–1000120PYesHS$ 30.000
HySpexVNIR series400–1000108–186PYesHS/
ODIN VS-1024400–2500427PYesHS/
Mjolnir series400–1000/2500200–490PYesHS/
BayspecOCI-U-2000600–100025SYesHS$ 24.980
OCI-U-1000600–1000100PYesHS$ 19.980
SenopRikola500–90050SYesHS€ 32.000
MosaicmillRikola500–90050SYesHS€ 40.500
ResononPika L400–1000281PYesHS€ 13.640
Pika XC2400–1000447PYesHS€ 24.582
PolytecNano400–1000270PYesHS€ 32.860
SpecimFX10e400–1000220PYesHS€ 11.690
IQ400–1000204PYesHS€ 15.950
PhenoVationCropObserver//LPNoPSII efficiency (Chl-Fl)€ 38.000
HeadwallHyperspec Fluorescence670–780 nm2160SYesChl-Fl€ 174.000
FlirDUO PRO R 3367.5–13.5 µm/S,VYesThermal € 4.339
DUO PRO R 6407.5–13.5 µm/S,VYesThermal€ 6.342
A655sc7.5–14 µm/S, VYesThermal€ 20.000
WorkswellWIRISEmissivity/S, VYesThermal€ 13.375
HS is hyperspectral, on-the-go measurement is measurement while the sensor is moving on a piece of agricultural machinery, e.g., on a spray boom or a tractor. S is snapshot, P is pushbroom, H is hybrid, HS is hyperspectral, T is thermal, Chl-Fl is chlorophyll fluorescence and PSII is photosystem II.