Article

Position-Domain Non-Gaussian Error Overbounding for ARAIM

College of Automation, Harbin Engineering University, Harbin 150001, China
*
Author to whom correspondence should be addressed.
Remote Sens. 2020, 12(12), 1992; https://doi.org/10.3390/rs12121992
Submission received: 26 May 2020 / Revised: 17 June 2020 / Accepted: 17 June 2020 / Published: 21 June 2020

Abstract

:
The non-Gaussian observation error is a threat for advanced receiver autonomous integrity monitoring (ARAIM), because the protection level of ARAIM based on the Gaussian distribution assumption is insufficient to envelope the positioning error (PE), and the probability of hazardously misleading information (PHMI) is difficult to be satisfied. The traditional non-Gaussian overbounding method is limited by the correlation among observation errors, and the deteriorated continuity risk resulting from the conservative inflation factor for overbounding, simultaneously. We propose an enhanced ARAIM method by position-domain non-Gaussian error overbounding. Furthermore, the upper bound of the inflation factor is imposed to release the conservativeness of overbounding. The simulation and the real-world data are utilized to test the proposed method. The simulation experiment has shown that the global worldwide availability level can be increased to 99.99% by using the proposed method. The real-word data experiment reveals that the proposed method can simultaneously satisfy the integrity risk and continuity risk with the boundary of the inflation factor.

Graphical Abstract

1. Introduction

Receiver autonomous integrity monitoring (RAIM) uses the redundancy of ranging observations for consistency check, which can be applied to safety-of-life (SOL) navigation services [1,2]. RAIM has limitations in satisfying vertical guidance services with stricter integrity requirement than the lateral navigation. With the modernization of global navigation satellite system (GNSS), the frequency diversity can provide better navigation positioning services and the possibility of utilizing RAIM to provide global coverage vertical guidance (LPV 200) [3,4]. In order to enable RAIM for vertical guidance, Blanch et al. proposed the multiple hypothetical solution separations (MHSS) ARAIM algorithm [5,6,7].
RAIM was developed based on the assumption that observation errors follow a Gaussian distribution [8,9]. Under the GPS selective availability (SA) policy, the artificial high-frequency interference of the satellite clock is the main error source. It is reasonable to assume the observation errors follow Gaussian observation errors when SA is on [10,11]. At the post era of SA, the observation errors include satellite orbit and clock errors, ionospheric delay, tropospheric delay, and multipath [12,13,14]. Therefore, observation errors hardly follow the Gaussian distribution due to the non-Gaussian error sources such as ionospheric delay and multipath, which cause the protection level (PL) and represent an instantaneous error envelope of positioning error, unable to bound the positioning error and increase the integrity risk [12,15].
The overbounding method can be utilized to compensate the non-Gaussian distribution, i.e., to replace the non-Gaussian observation error distribution with standard Gaussian distribution [16,17,18]. There are two groups of overbounding methods. One is the probability density function (PDF) overbounding. However, the PDF-based overbounding is difficult to be generalized. The wide Gaussian PDF with large sigma does not envelope narrow Gaussian PDF with small sigma, because the wide Gaussian PDF is always greater in the tails and lower at the mean than a narrower Gaussian PDF [19]. The other one can be generalized as the cumulative distribution function (CDF) overbounding, in which the single CDF overbounding proposed by DeCleene and the paired-overbounding (PB) proposed by Rife and Pullen are two typical implementations [19].
Although the CDF overbounding can be effective for compensating the non-Gaussian observation errors, the PL is inevitably enlarged, and the availability level is reduced. In other words, the CDF overbounding methods focus on the integrity risk caused by non-Gaussian observation errors but ignore the impact of the over-conservativeness of overbounding on the continuity risk [20,21,22,23]. On the other hand, the CDF overbounding method assumes that the observation errors are independent of each other. Nonetheless, due to the presence of receiver noise, tropospheric delay, and multipath, the correlation among the observation errors cannot be neglected [24,25]. The traditional CDF overbounding ignores the effect of correlation, which may lead to the inductive error model being insufficient to overbound the intrinsic error distribution [26,27].
The continuity of ARAIM is challenged by the over-conservatism of the traditional CDF overbounding method in the range-domain. Since the position-domain is more easily associated with continuity of ARAIM, this concern leads to the presence of the position-domain method [28]. The position-domain methods are found to be effective and release the conservativeness caused by the incorrect range-domain modeling error by Braff et al. and Zhu et al. [29,30]. However, compared with the range-domain methods, the position-domain methods are difficult to be generalized due to the limitation of flexibility caused by a large number of convolution process [28]. Therefore, the proposed method will consider the limitations in non-Gaussian overbounding to meet integrity and continuity requirement. In addition, the effect of the overbounding on the continuity has not been clarified yet. We derive the upper bound of the inflation factor to satisfy the continuity requirement of position-domain overbounding.
We define the problem of non-Gaussian observation errors on the MHSS ARAIM and the limitations of the traditional method. Then, an enhanced ARAIM method with position-domain non-Gaussian error overbounding is proposed. Finally, we present the effectiveness of the proposed method in dealing with the simulation and the real-world data experiments, then summarize the research findings.

2. Problem Definition

It is obvious that the non-Gaussian observation error is a threat for ARAIM. The non-Gaussian effect of ARAIM is analyzed at first to prove the importance of compensating for non-Gaussian observation errors. Then, we describe the limitations of the traditional overbounding method.

2.1. Non-Gaussian Effect

In order to analyze the characteristics of non-Gaussian observation errors, we extract the observation errors with the raw observation collected from the International GNSS service (IGS) station (JFNG, located in Hubei, China). The distribution characteristics of observation errors are shown in Figure 1.
Figure 1 is a QQ (Quantile Quantile) plot of the GPS/BDS (BeiDou Navigation Satellite System) observation errors at JFNG station, where the red line indicates the standard Gaussian distribution, and the others indicate the extracted observation error distributions. It can be seen that the extracted BDS and GPS observation errors have non-Gaussian distribution characteristics. Therefore, it breaks the ARAIM assumption that the observation errors follow the Gaussian distribution.
The vertical protection level (VPL) of the MHSS ARAIM is divided into two parts: real-time VPL and prediction VPL, which correspond to the integrity and continuity requirements, respectively. The VPL can be defined as follow [6,7]:
{ VPL = max ( VPL i ) VPL i = K H M I , i σ v , i + B v , i + M i
The prediction part M i related to continuity risk can be expressed as
M i = K C O N T , i σ s s , i + B s s , i
where VPL i represents the VPL under the fault subset i , the state 0 corresponds to the fault-free case, σ v , i and B v , i represent, respectively, the standard deviation and mean bias of observation error related to the integrity under the fault subset i , σ s s , i and B s s , i are related to continuity, K H M I , i represents the quantile of Gaussian cumulative distribution related to the integrity risk, K C O N T , i is related to continuity risk, and K H M I , i and K C O N T , i are calculated based on the premise that the observation error follows a Gaussian distribution. When the observation errors are non-Gaussian, the above two parameters are different from the actual theoretical value and will affect the protection level. The calculation of K H M I , i and K C O N T , i are as follows:
{ K H M I , i = Q 1 ( 1 P H M I i 2 P a p , i ) K C O N T , i = Q 1 ( 1 P cont , i 2 )
in which P H M I i is the PHMI assigned to failure mode i , P cont , i is the continuity risk assigned to failure mode i , P a p , i is the prior failure probability in the corresponding failure mode, and Q 1 is the inverse of the unit Gaussian CDF.
The effect of non-Gaussian distribution on K H M I , i and K C O N T , i can be divided into two types. In the first type, the parameters are lower than the theoretical values. It will lead to misleading information (MI), which indicates that PE, PL are less than the alert limit (AL) and PE is greater than the PL. If the non-Gaussian phenomenon is serious, this type may lead to hazardously misleading information (HMI), which indicates that the PL is less than AL and the PE is greater than the AL. In the second type, the parameters K H M I , i and K C O N T , i are higher than the theoretical values. This enlarges the PL, which reduces the availability level.
In order to avoid the misleading information caused by the non-Gaussian characteristics of the observation errors, the effect of the non-Gaussian errors should be compensated to validate the assumption of Gaussian observation errors.

2.2. Limitations of Traditional Method

The CDF overbounding method in the range-domain is usually used to compensate for the effect of the non-Gaussian distribution. We here introduce the traditional CDF overbounding method and analyze its limitations. The traditional methods include single CDF-overbounding and paired overbounding methods.

2.2.1. Traditional Method

DeCleene proposed the single CDF-overbounding method, which proves that a set of range-domain Gaussian bounds can still form a position-domain bound after convolution [15]. The resulting position-domain error will be bounded according to Equation (4). Each of G o and G a is a symmetric unimodal CDF distribution with a zero mean. The method can be described as,
{ G o ( x ) G a ( x ) , x < 0 G o ( x ) G a ( x ) , x 0
The single CDF-overbounding is only applicable to zero mean and symmetric and unimodal distribution, but the empirical observation errors are generally not satisfied. For the limitation of single CDF-overbounding on observation errors, the paired overbounding was proposed in Rife and Pullen [19]. The paired overbounding is a set of two bounding functions. This set of bounds consists of a left bound G L and a right bound G R defined relative to the actual CDF G a ,
{ G L ( x ) G a ( x ) , x G R ( x ) G a ( x ) , x .
The paired overbounding allows for error distributions of arbitrary form, but it turns out that the requirements of Equation (5) are over-conservative [31,32].

2.2.2. Limitations

In order to compensate for the non-Gaussian distribution of the observation errors, the traditional overbounding method determines an inflated sigma such that the inflated distribution overbounds all reasonable error distributions out to the probabilities assumed in the computation of the PL. The inflation factor, f infaltion , is defined as the ratio of the overbounding sigma σ overbound to the actual sigma σ actual as follows:
f infaltion = σ overbound σ actual  
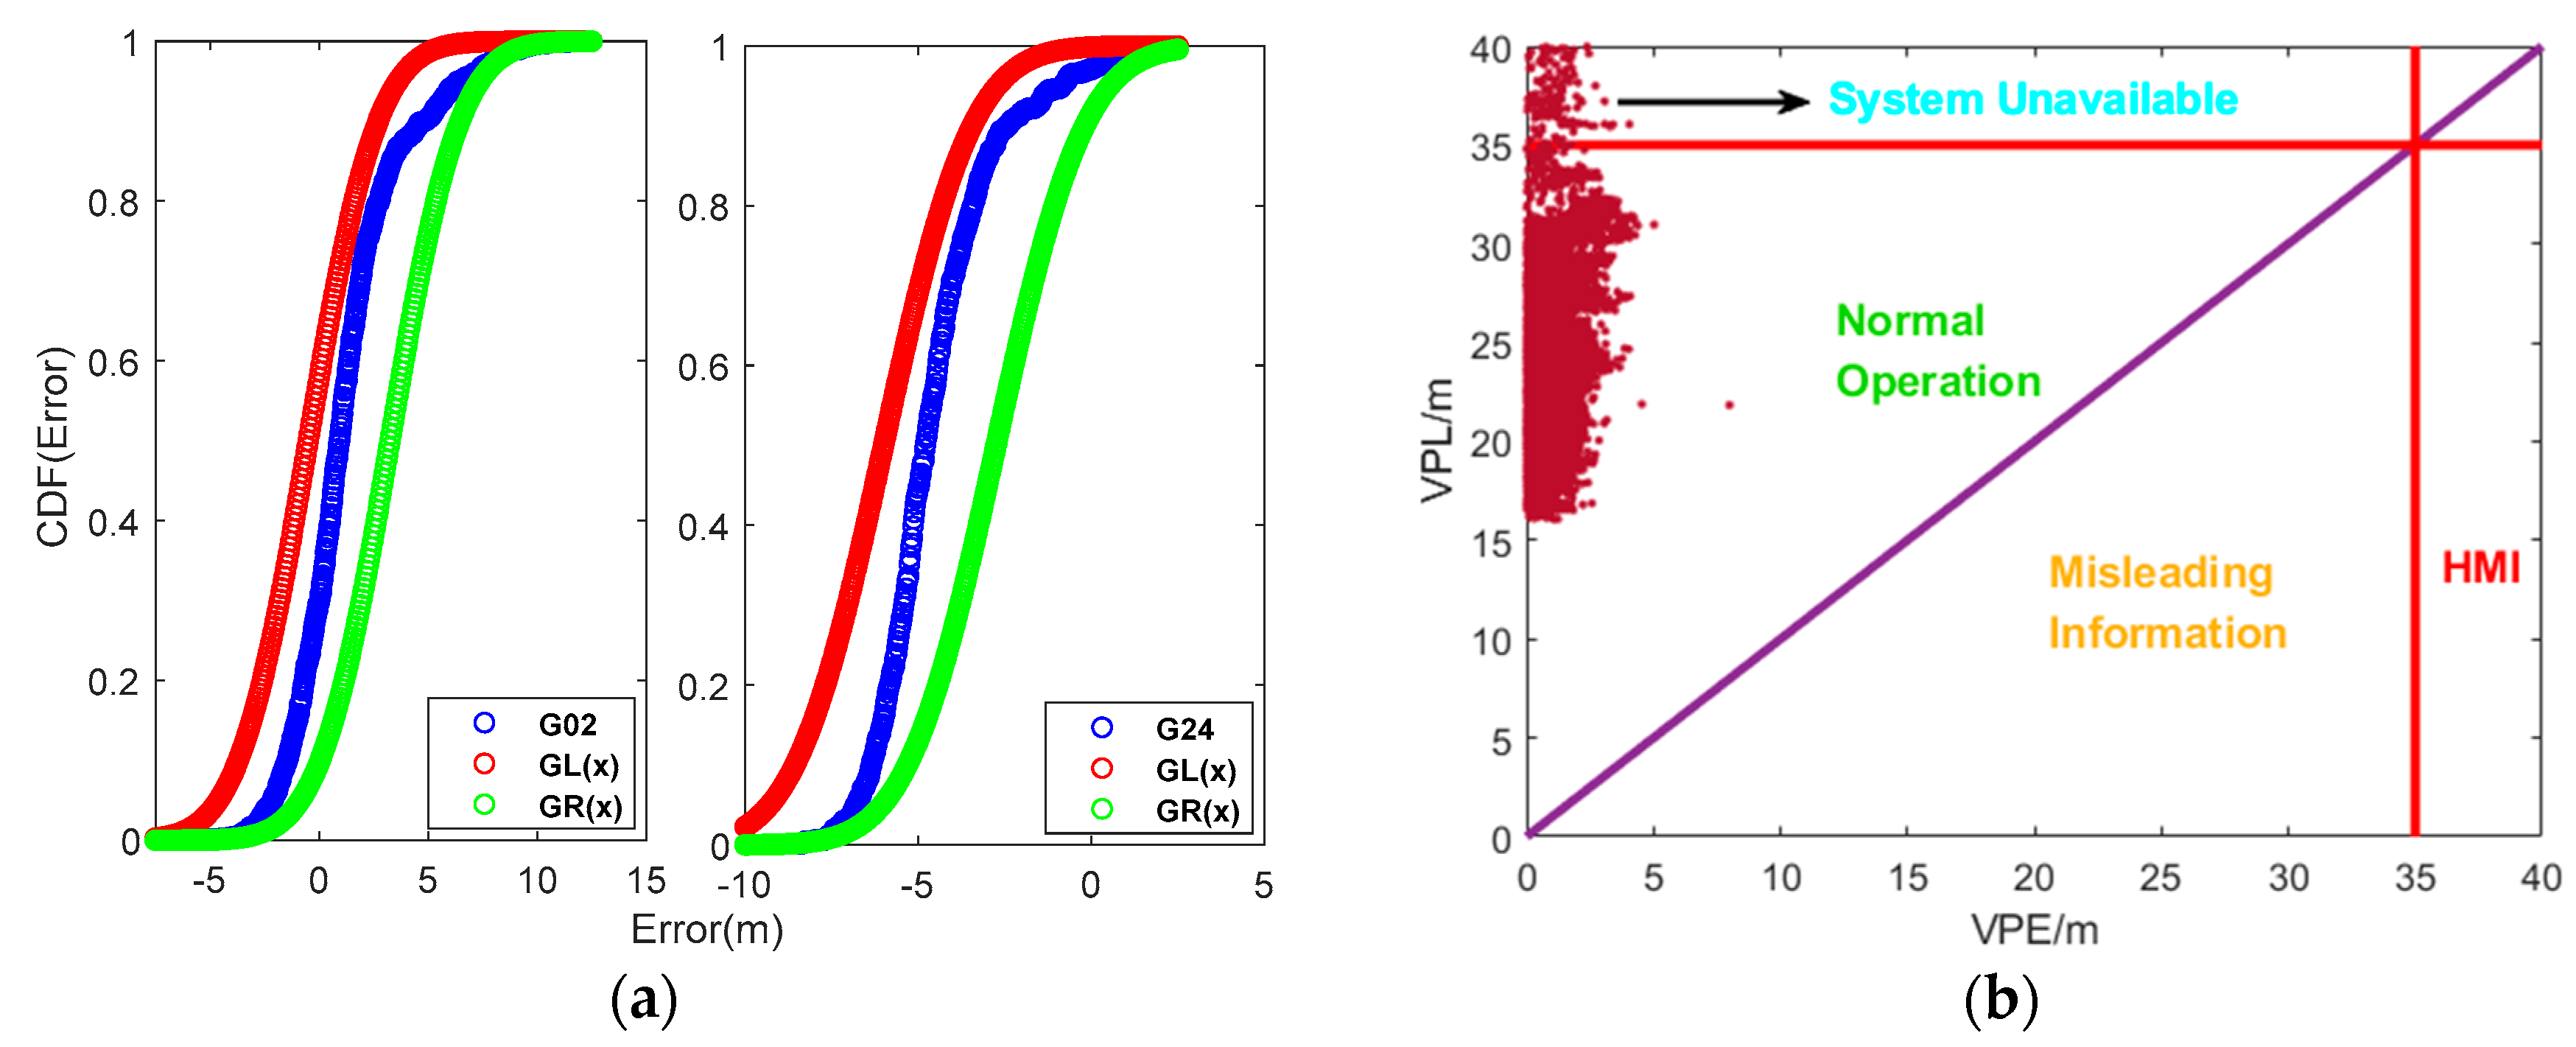
The traditional CDF overbounding theorem is based on the assumption that the observation errors are independent of each other. In reality, due to the influence of receiver noise, multipath, or other errors, there is a certain correlation between the observation errors [24,25,26]. In addition, if error samples cannot fully represent the error distribution or have significant non-Gaussian characteristics, the traditional method will select a more conservative inflation factor to compensate for the non-Gaussian effect. Therefore, the PL will be inevitably increased and lead to a threat to the continuity of ARAIM. The traditional method focuses on compensating the integrity risk caused by the non-Gaussian errors and ignores the balance between non-Gaussian observation errors and the ARAIM continuity. Moreover, the threat of conservatism on the continuity cannot be identified immediately. The conservatism of the traditional method is shown in Figure 2.
As seen in Figure 2b, the PLs frequently exceed the alarm limit, and the continuity is frequently interrupted from the paired overbounding-based ARAIM. Due to the conservatism of the overbounding, it increases continuity risk of ARAIM. Considering that the protection level is established from the position-domain, the non-Gaussian error overbounding method based on the position-domain is more easily associated with continuity risk.

3. Position-Domain Overbounding for ARAIM

Due to the limitations of the traditional CDF overbounding method, an enhanced ARAIM is proposed to overbound the non-Gaussian observation error in position-domain. It is noted that the integrity and continuity are satisfied simultaneously with the proposed method.

3.1. Methodology

Considering that the range-domain observation errors are correlated, the observation errors are divided into the Gaussian error, non-Gaussian error, and correlated non-Gaussian error, which can be expressed as
M ( x ) = M g , n ( x ) + M n g , n ( x ) + M n g , m n ( x )
where M ( x ) represents the observation error, M g , n ( x ) represents the Gaussian part, M n g , n ( x ) represents the non-Gaussian part, and M n g , m n ( x ) represents the correlated non-Gaussian error part between the two satellites m , n . The observation error composition can be found from (7), and the variance of observation error can be expressed as
σ a 2 = S z T W 1 S z = n = 1 N S z , n 2 σ g , n 2 + n = 1 N S z , n 2 σ n g , n 2 + 2 n < m n = 1 N S z , n S z , m σ n g , m n σ n g , n m
where σ a represents the standard deviation of observation error in the position-domain, S = ( G T W G ) 1 G W is the weighted least squares projection matrix, W is the weighted matrix, σ g , n is the standard deviation of Gaussian error, σ n g , n is the satellite non-Gaussian error standard deviation, and σ n g , m n is the correlated non-Gaussian error standard deviation. Since the weight matrix W is a positive-definite matrix and considering the correlated non-Gaussian errors among satellites,
{ σ n g , n m = σ n g , m n σ n g , m n σ n g , n σ n g , m
where 1 m N , 1 n N , the variance of the non-Gaussian errors can be expanded as,
σ n g 2 = n = 1 N S z , n 2 σ n g , n 2 + 2 n < m n = 1 N S z , n S z , m σ n g , m n σ n g , n m n = 1 N S z , n 2 σ n g , n 2 + 2 n < m n = 1 N | S z , n S z , m | σ n g , n σ n g , m = ( n = 1 N | S z , n σ n g , n | ) 2
Equation (10) can be used to compensate the correlation non-Gaussian errors. The non-Gaussian part is inflated into Gaussian errors through the upper bounding of non-Gaussian error. Based on the compensated non-Gaussian errors, the standard deviation σ a can be further be converted to σ o as follows:
σ a = ( σ n g 2 + σ g 2 ) σ g + σ n g n = 1 N S z , n 2 σ g , n 2 + n = 1 N | S z , n σ n g , n | = σ o
The standard deviation σ a containing the non-Gaussian part can be characterized by Gaussian-type errors of the standard deviation σ o . The proposed method decomposes the observation error, and the observation error model is mapped to the position-domain to be overbounded without convolution. Therefore, the limitation of flexibility in the traditional position-domain method can be ignored in the proposed method.
The protection level VPL o by non-Gaussian overbounding can be expressed as
{ VPL o = max ( VPL oi ) VPL oi = K H M I , i σ o , i + B v , i + M o i
where VPL oi represents the VPL corresponding fault subset i , and σ o , i and M o i represent, respectively, the standard deviation and prediction part corresponding fault subset i through overbounding.
The proposed method compensates the effect of non-Gaussian errors due to the correlation among observations through position-domain non-Gaussian overbounding. Therefore, it meets the ARAIM assumption that observation errors follow the Gaussian distribution. Moreover, the enhanced ARAIM with position-domain overbounding should meet integrity and continuity requirement. It is necessary to further explore and verify the integrity and continuity performances of the proposed method.

3.2. Integrity Proof

System integrity defines the primary constraint on overbounding. To protect integrity, the PHMI through overbounding must be less than the actual PHMI requirement. The construction of VPL RT , oi related to integrity risk holds;
VPL RT , ai = K H M I , i σ a i + B v , i K H M I , i σ o i + B v , i =   VPL RT , oi .
It can be found that the VPL RT , oi treated by non-Gaussian overbounding is the upper bound of the actual protection level VPL RT , ai .
Integrity risk is the likelihood of the positioning error exceeding the error bound without raising an alert to the user [33]. Therefore, the integrity risk constraint of MHSS ARAIM under the fault subset i can be described as
P ( | Δ x v i | L o i | i | ) P H M I i P a p , i
and
i = 0 N 1 ( P ( | Δ x v i | L o i | i | ) × P a p , i ) i = 0 N 1 ( P H M I i P a p , i × P a p , i ) = P H M I r e q ,
where x v i represents the vertical positioning error under subset i , and the state 0 corresponds to the fault-free case. L o i represents the subset related to integrity risk under fault subset i , and it corresponds to the VPL RT , ai and VPL RT , oi . P H M I r e q is the PHMI budget, which is distributed into all the modes. Further, the following equation can be obtained:
{ i = 0 N 1 ( P ( | Δ x v i | VPL RT , ai | i | ) × P a p , i ) = P H M I a i = 0 N 1 ( P ( | Δ x v i | VPL RT , oi | i | ) × P a p , i ) = P H M I o
where P H M I a represents the PHMI corresponding to the real error distribution, and P H M I o represents the PHMI processed by non-Gaussian overbounding.
By a combination of Equations (13), (15), and (16), we can get the relationship of PHMI as
P H M I o P H M I a P H M I r e q .
Compared with the P H M I a , it can be found that the P H M I o through overbounding is more stringent. Both of them are constrained by P H M I r e q . This condition implies that the overbounding must be conservative in the position-domain. Therefore, the proposed enhanced method can always meet the predefined integrity risk requirement.

3.3. Overbounding Boundary for Continuity

In addition to the integrity constraint, the overbounding must also satisfy secondary constraints on continuity. If the overbounding turn out to be over-conservative, the increased VPL will exceed the vertical alert limit (VAL). The availability loss will impact the continuity of the ARAIM. Therefore, we will explore the boundary of inflation factor for the position-domain overbounding, where the continuity can be satisfied.
In order to satisfy the continuity risk, the protection level with non-Gaussian overbounding needs to hold [6,7].
P ( i | | x v i | + L o i M o i ) P c o n t , i
where x v i represents the vertical positioning error under subset i . As the predicted solution separation under non-Gaussian overbounding, it is a Gaussian distribution with standard deviation σ o s , i and bias B s i . M o i represents the PL related to continuity risk under fault subset i .
Under the implementation of Equation (18), the M o i in fault subset i has met the requirement of continuity risk. If the current inflation factor is replaced by a more conservative value, the PL of fault subset i will be larger than that of M o i ; in principle, the actual continuity risk will be more severe, which can still meet the continuity risk requirement. However, it does not mean that an over-conservative inflation factor can be selected. When the inflation factor is over-conservative, the increased PL will frequently exceed the limit. The lack of availability will lead to the continuity not being able to be satisfied. Therefore, there is an upper bound on the PL that meets continuity risk in each fault subset i , i.e., sup ( M o i ) = VAL , where the sup is supremum operator.
Combined with the VPL construction process from Equation (12), the boundary of inflation factor in each fault subset i can be obtained as
sup ( f o , i ) = VAL B v i B s i K H M I , i σ a , i + K C O N T , i σ a s , i .
Therefore, the boundary f limit of inflation factor can be defined as
f limit = min ( sup ( f o , i ) ) , i = 1 , 2 ... , N .
Under the constraint of continuity risk, the boundary condition is obtained from Equation (20). The relationship between the boundary and the inflation factor can be used as an “observer”. We can utilize the observer to judge continuity performance of the proposed method. When inflation factor f infaltion satisfies the boundary, the proposed algorithm can meet the requirements of integrity risk and continuity risk simultaneously. If f infaltion breaks through the boundary, the threat on the continuity can be identified. Therefore, it avoids the integrity risks caused by continuing to use the proposed method.

4. Experiment and Discussion

In order to demonstrate the ability of the proposed method to provide better performance, we tested the vertical protection level performance of the ARAIM methods based on LPV-200 RNP parameters introduced in [1,33]. The parameter settings of the experiment are shown in Table 1. We conducted the simulation experiment and the real-world experiment, respectively.

4.1. Simulation Result

A simulated GPS/BDS dual constellation was used to simulate and implement global vertical protection level performance for 10 days with a sampling interval of 30 s, which generated 28,800 positioning samples. Considering the actual operation of the current GPS and BeiDou system, the operational data of 32 GPS satellites and 34 BeiDou satellites were simulated. The simulation was implemented worldwide uniformly with a 5-degree interval in longitude and a 2.5-degree interval latitude (which gave 5329 locations).
In the simulation, the ARAIM based on paired overbounding was compared with the proposed ARAIM. For the convenience of later analysis, they were indicated as the PB-ARAIM method and the PDM-ARAIM method, respectively. Because the observation errors can be customized in simulation experiments, the tropospheric and multipath were set to be correlated as non-Gaussian errors. The standard deviation of the Gaussian part for tropospheric delay was 0 . 12 × 1 . 001 0 . 002001 + sin 2 ( θ ) , and the standard deviation of the Gaussian part for multipath error was 0 . 13 + 0 . 53 e θ / 10 , where θ is satellite elevation.
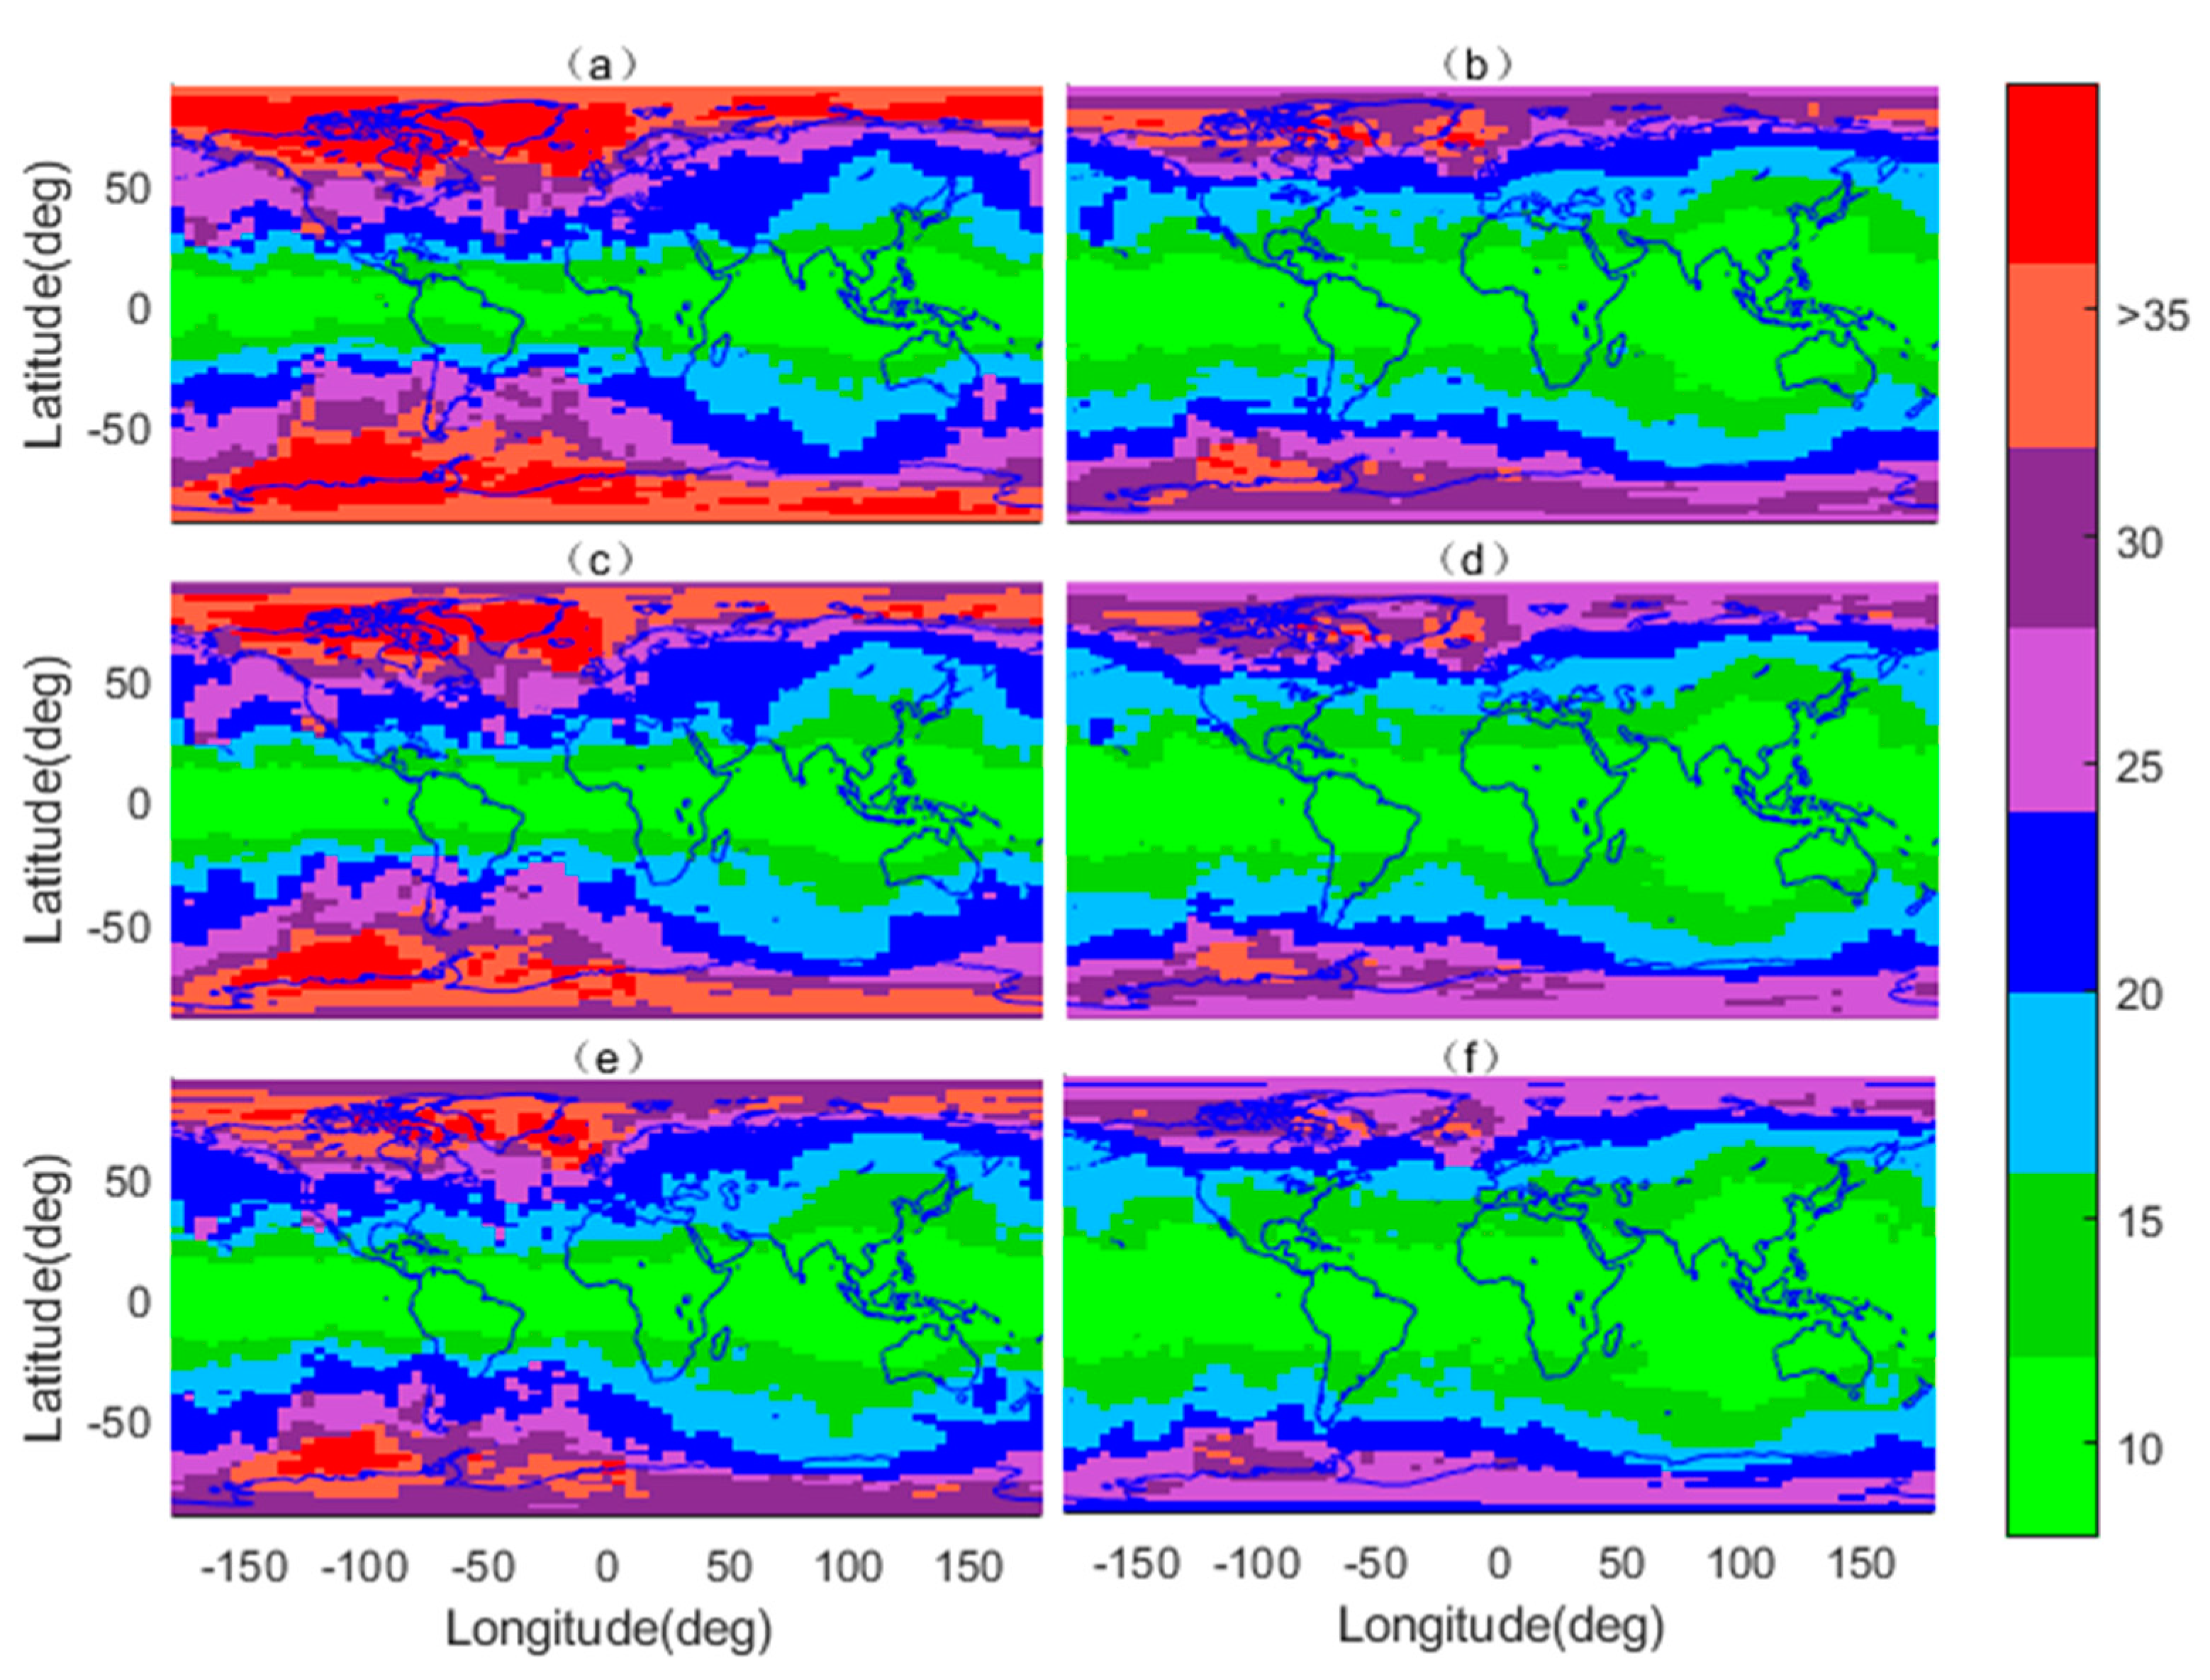
The global VPL variations of PB-ARAIM, PDM-ARAIM are shown in Figure 3 with three satellite prior failure probabilities, i.e., 10 3 , 10 4 , and 10 5 . It can be seen that most of the PB-ARAIM-based VPLs were significantly larger than those of the PDM-ARAIM method regardless of the locations, because the PB-ARAIM was over-conservative in compensating for the effect of non-Gaussian errors. Moreover, it should be noted that both methods could achieve the best VPL results in the Asia Pacific region and low-latitude region. This is because of the better satellite geometry from BeiDou in those region.
The 99.5% VPL global simulation result of different ARAIM methods are listed in Table 2. The average 99.5% VPL represents the global average 99.5% VPL, and the availability level indicates the rate of global users whose VPL is lower than VAL.
As shown in Table 2, the PDM-ARAIM method could provide better VPL performance and higher availability level regardless of satellite failure probability. When the satellite prior failure probability was increased from 10 5 to 10 3 , it could be observed that the PB-ARAIM-based availability level decreased dramatically. Specifically, the 99.5% VPL of PDM-ARAIM could be reduced by 5.2 m relative to PB-ARAIM when satellite prior failure probability was 10 3 . Furthermore, it could be observed that both the PB-ARAIM- and PDM-RAIM-based VPL performance deteriorated when the satellite prior failure probability was increased. Nonetheless, the PDM-ARAIM-based availability level could be increased by 16.36% more than the PB-ARAIM when the satellite prior failure probability was 10 3 . This result demonstrates the superior performance of PDM-ARAIM in dealing with high satellite failure rate. The superior performance of the PDM-ARAIM could be attributed to the better position-domain compensation for non-Gaussian errors, as well as the accurate characterization of the correlation among observation errors. In contrast, the PB-ARAIM method could suffer from over-conservative performance, as induced from the traditional overbounding process.
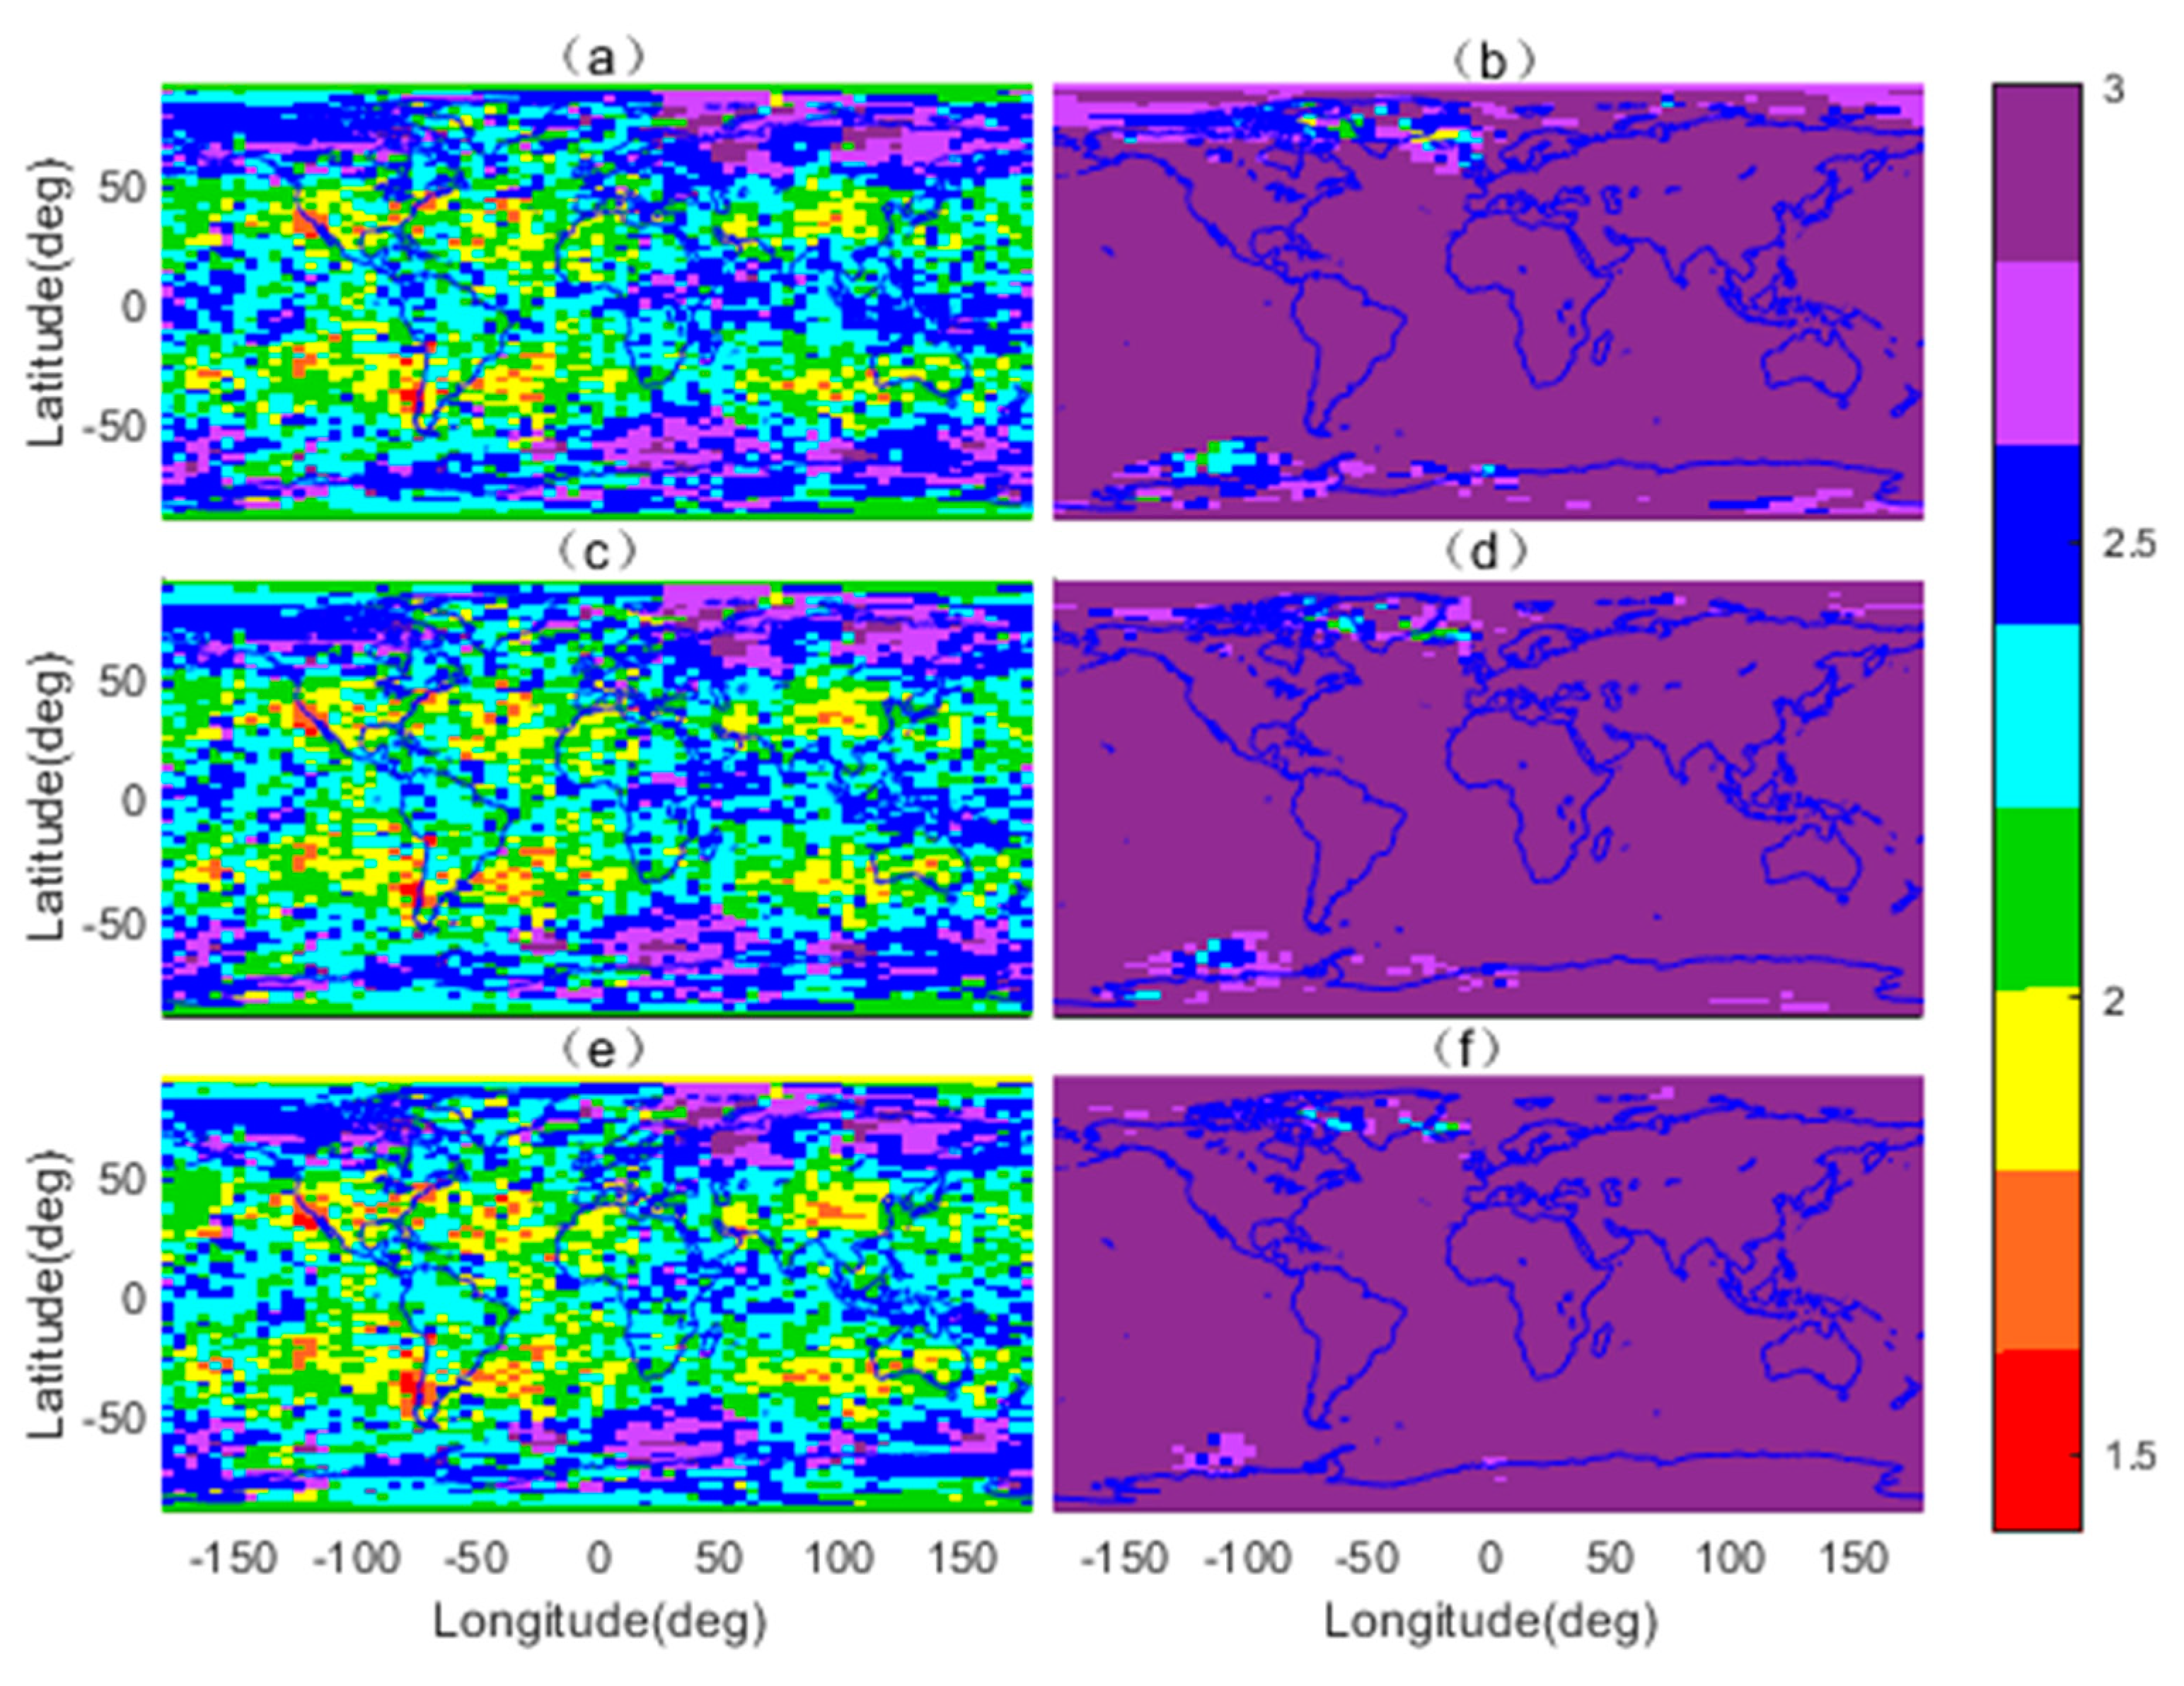
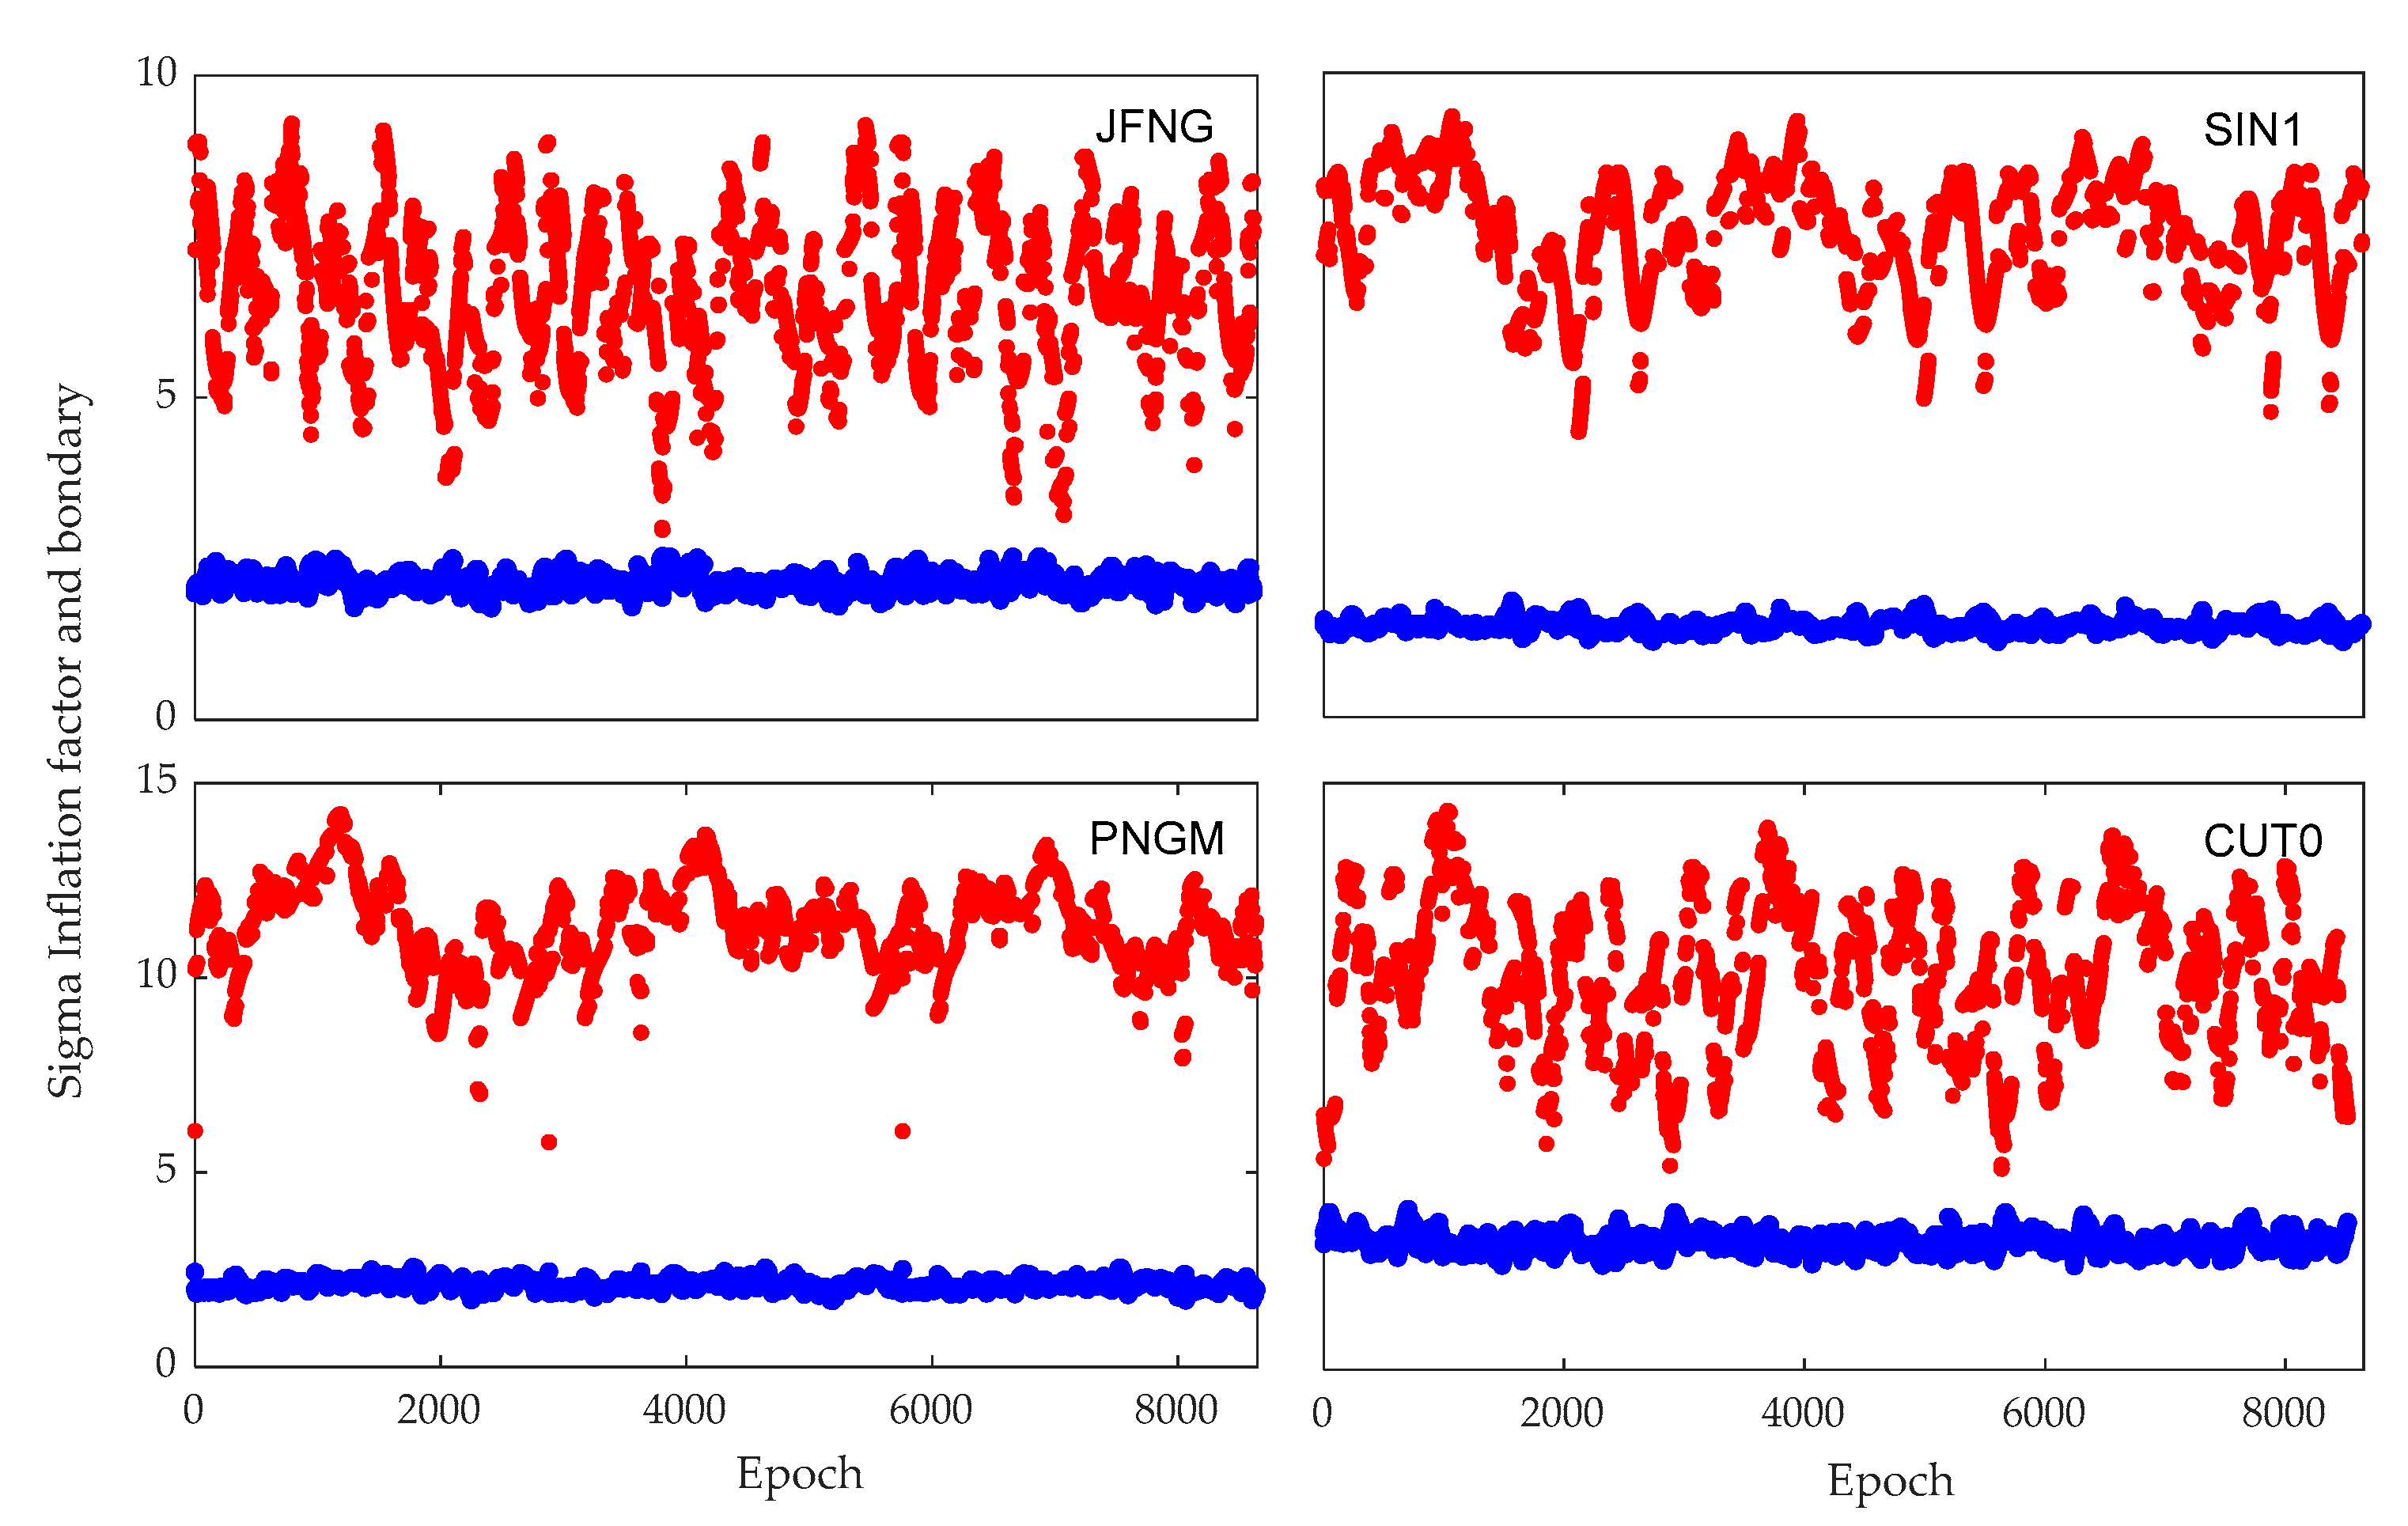
Figure 4 shows the boundary and inflation factor of global simulation based on the PDM-ARAIM. The acceptable inflation factor in mid-latitude regions was smaller, which means better performance could be obtained. Moreover, with the increasing of prior satellite failure probability, more cases of the inflation factor exceeding the boundary were identified. This is consistent with the result of global VPL distribution in Figure 3. This shows that the relationship between the boundary and the inflation factor could be used as an “observer”, which could present the continuity performance of the proposed method, because the boundary was determined on the basis of meeting the continuity requirement. This was the upper bound of conservative inflation factors. It can be seen from Figure 4 that the inflation factors of most areas were within the boundary, which indicated the position-domain overbounding method could meet the continuity requirement. However, there were partial areas that did not meet the continuity. This was because the boundary would become stricter for the areas with poor satellite geometry. Therefore, in order to guarantee the system integrity, the cases where thee inflation factors exceeded the boundary would appear frequently.

4.2. Real-World Data Result

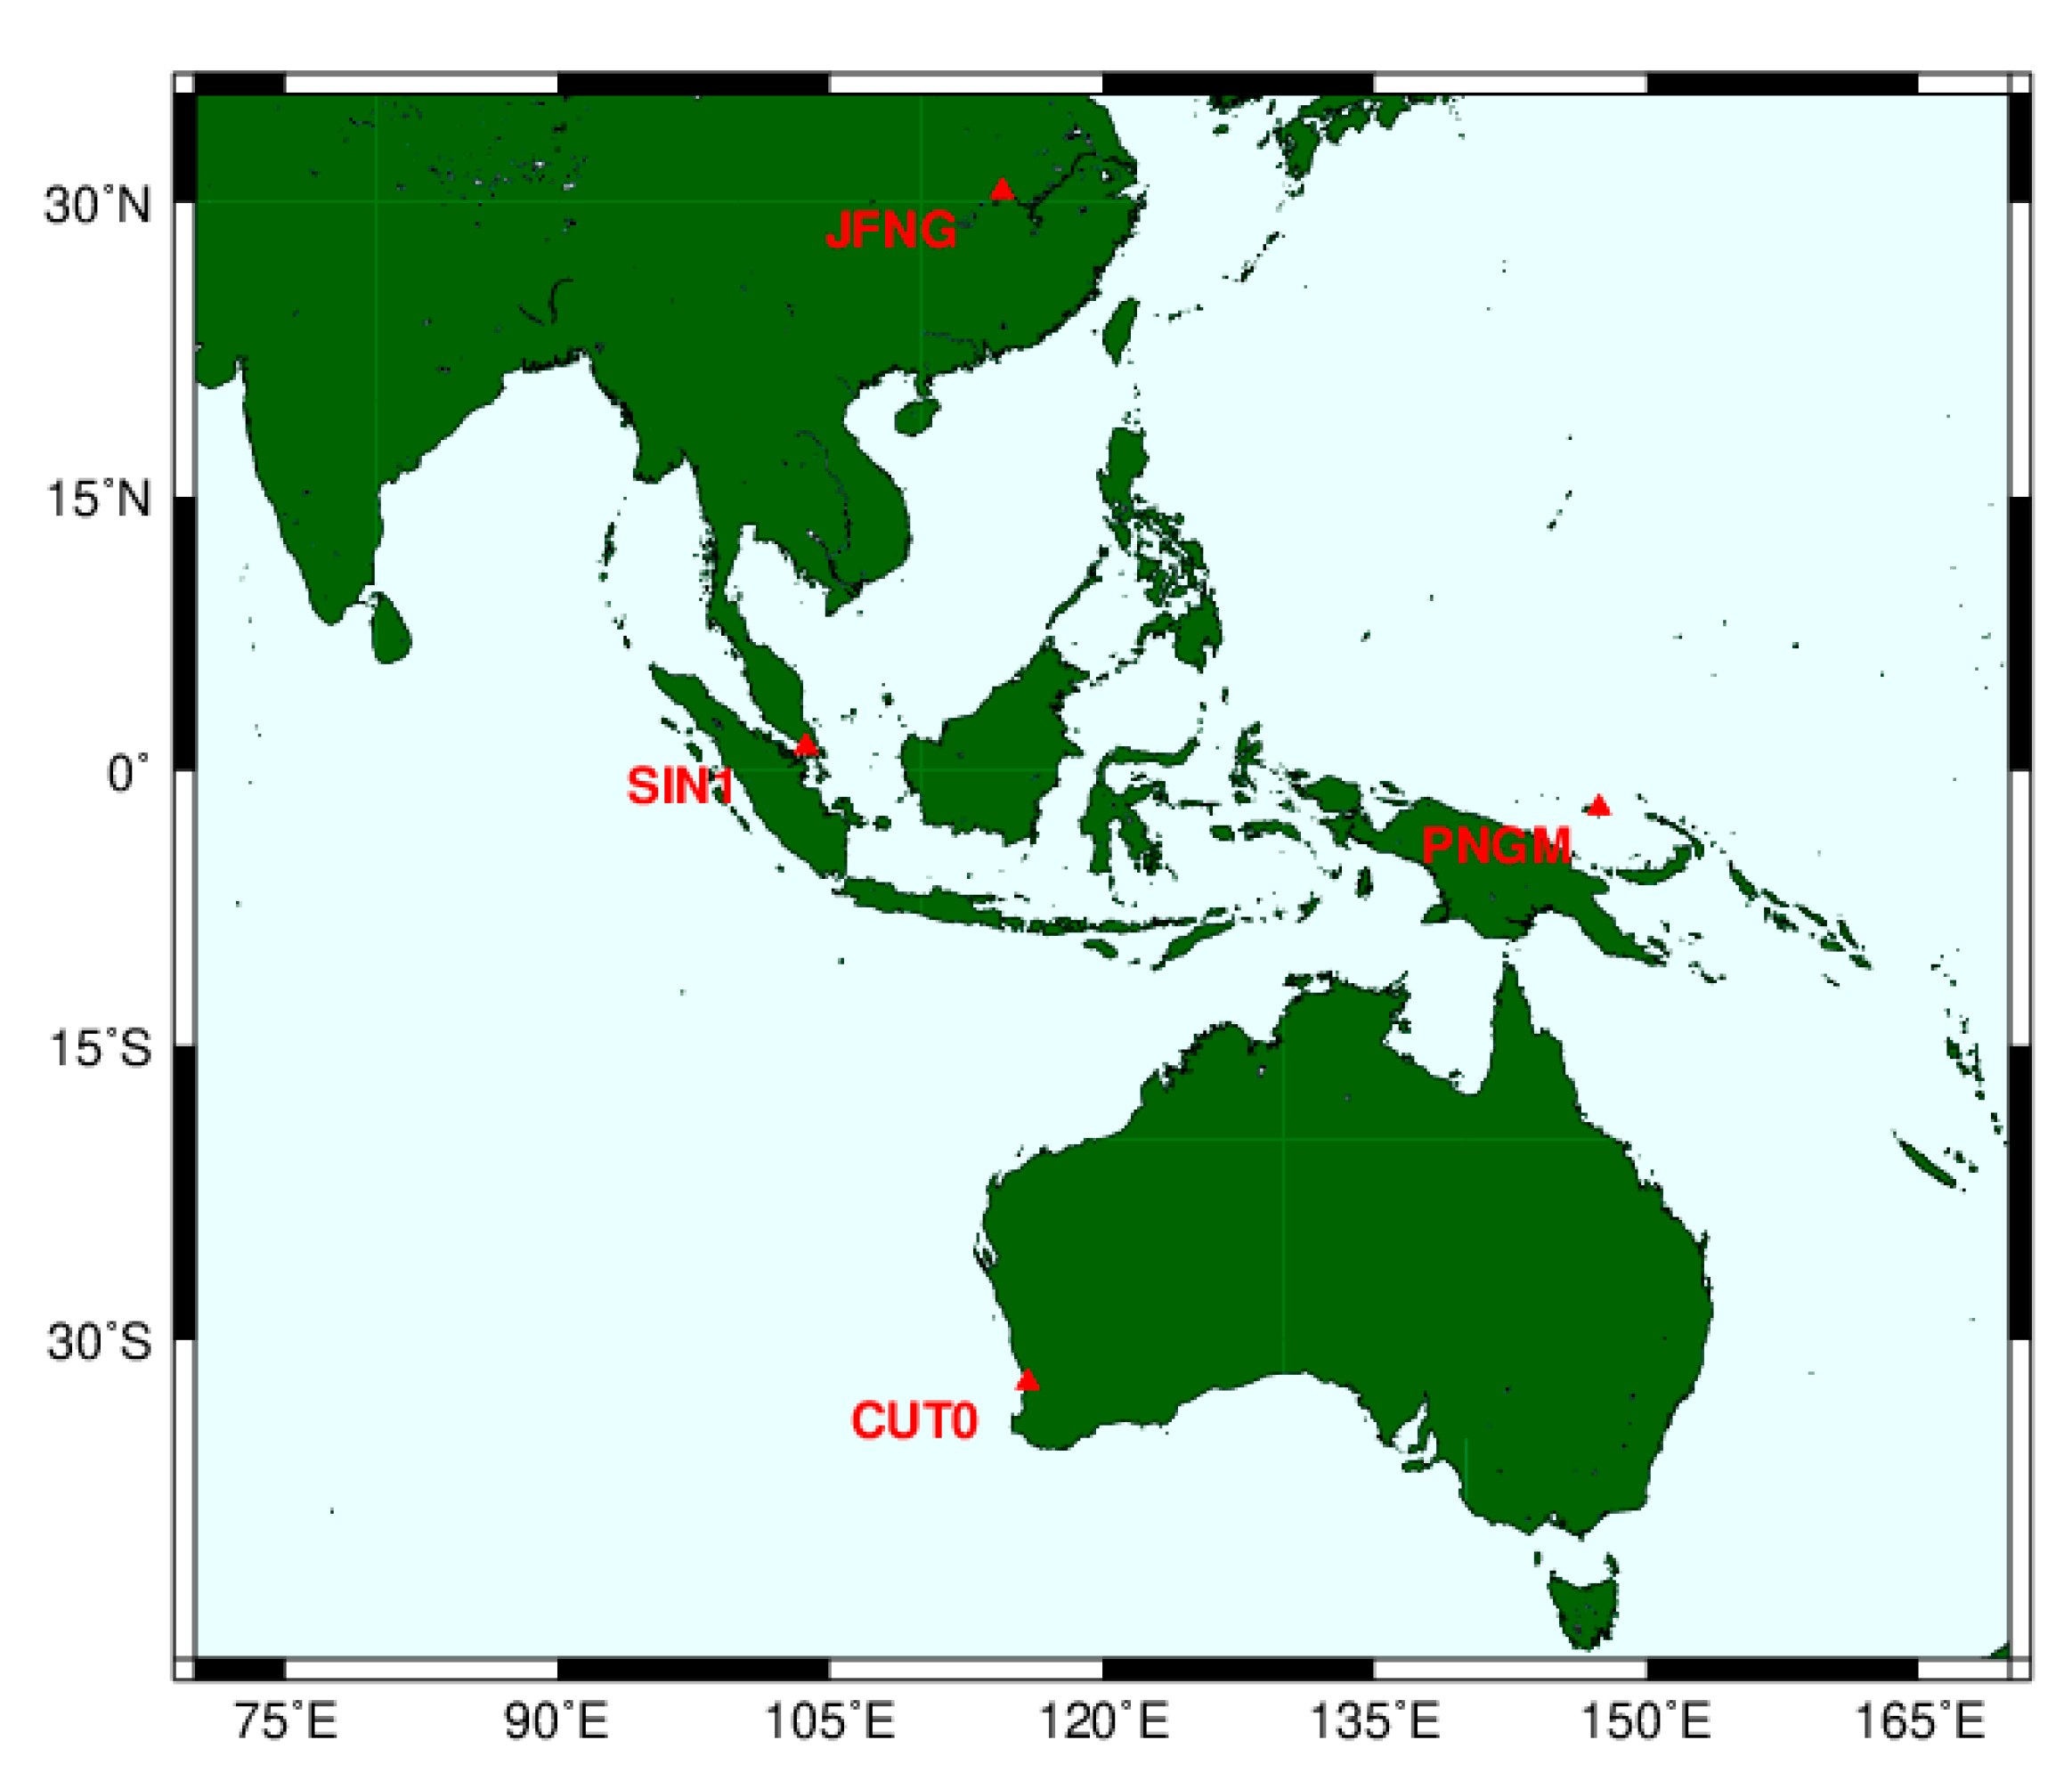
A real-world experiment was carried out to test the PDM-ARAIM method by utilizing single point positioning (SPP) with GPS/BDS dual-frequency ionosphere-free (IF) observation combinations. The data came from the IGS organization and the time span of data collection was 3 days with a sampling interval of 30 s, which generated 11,520 samples. Since BDS had initial operation capability (IOC) in the Asia-Pacific area, four IGS stations were selected in the Asia-Pacific region, namely JFNG, SIN1, PNGM, and CUT0. The station distribution is shown in Figure 5. The real-world experiment was carried out given the parameters listed in Table 1.
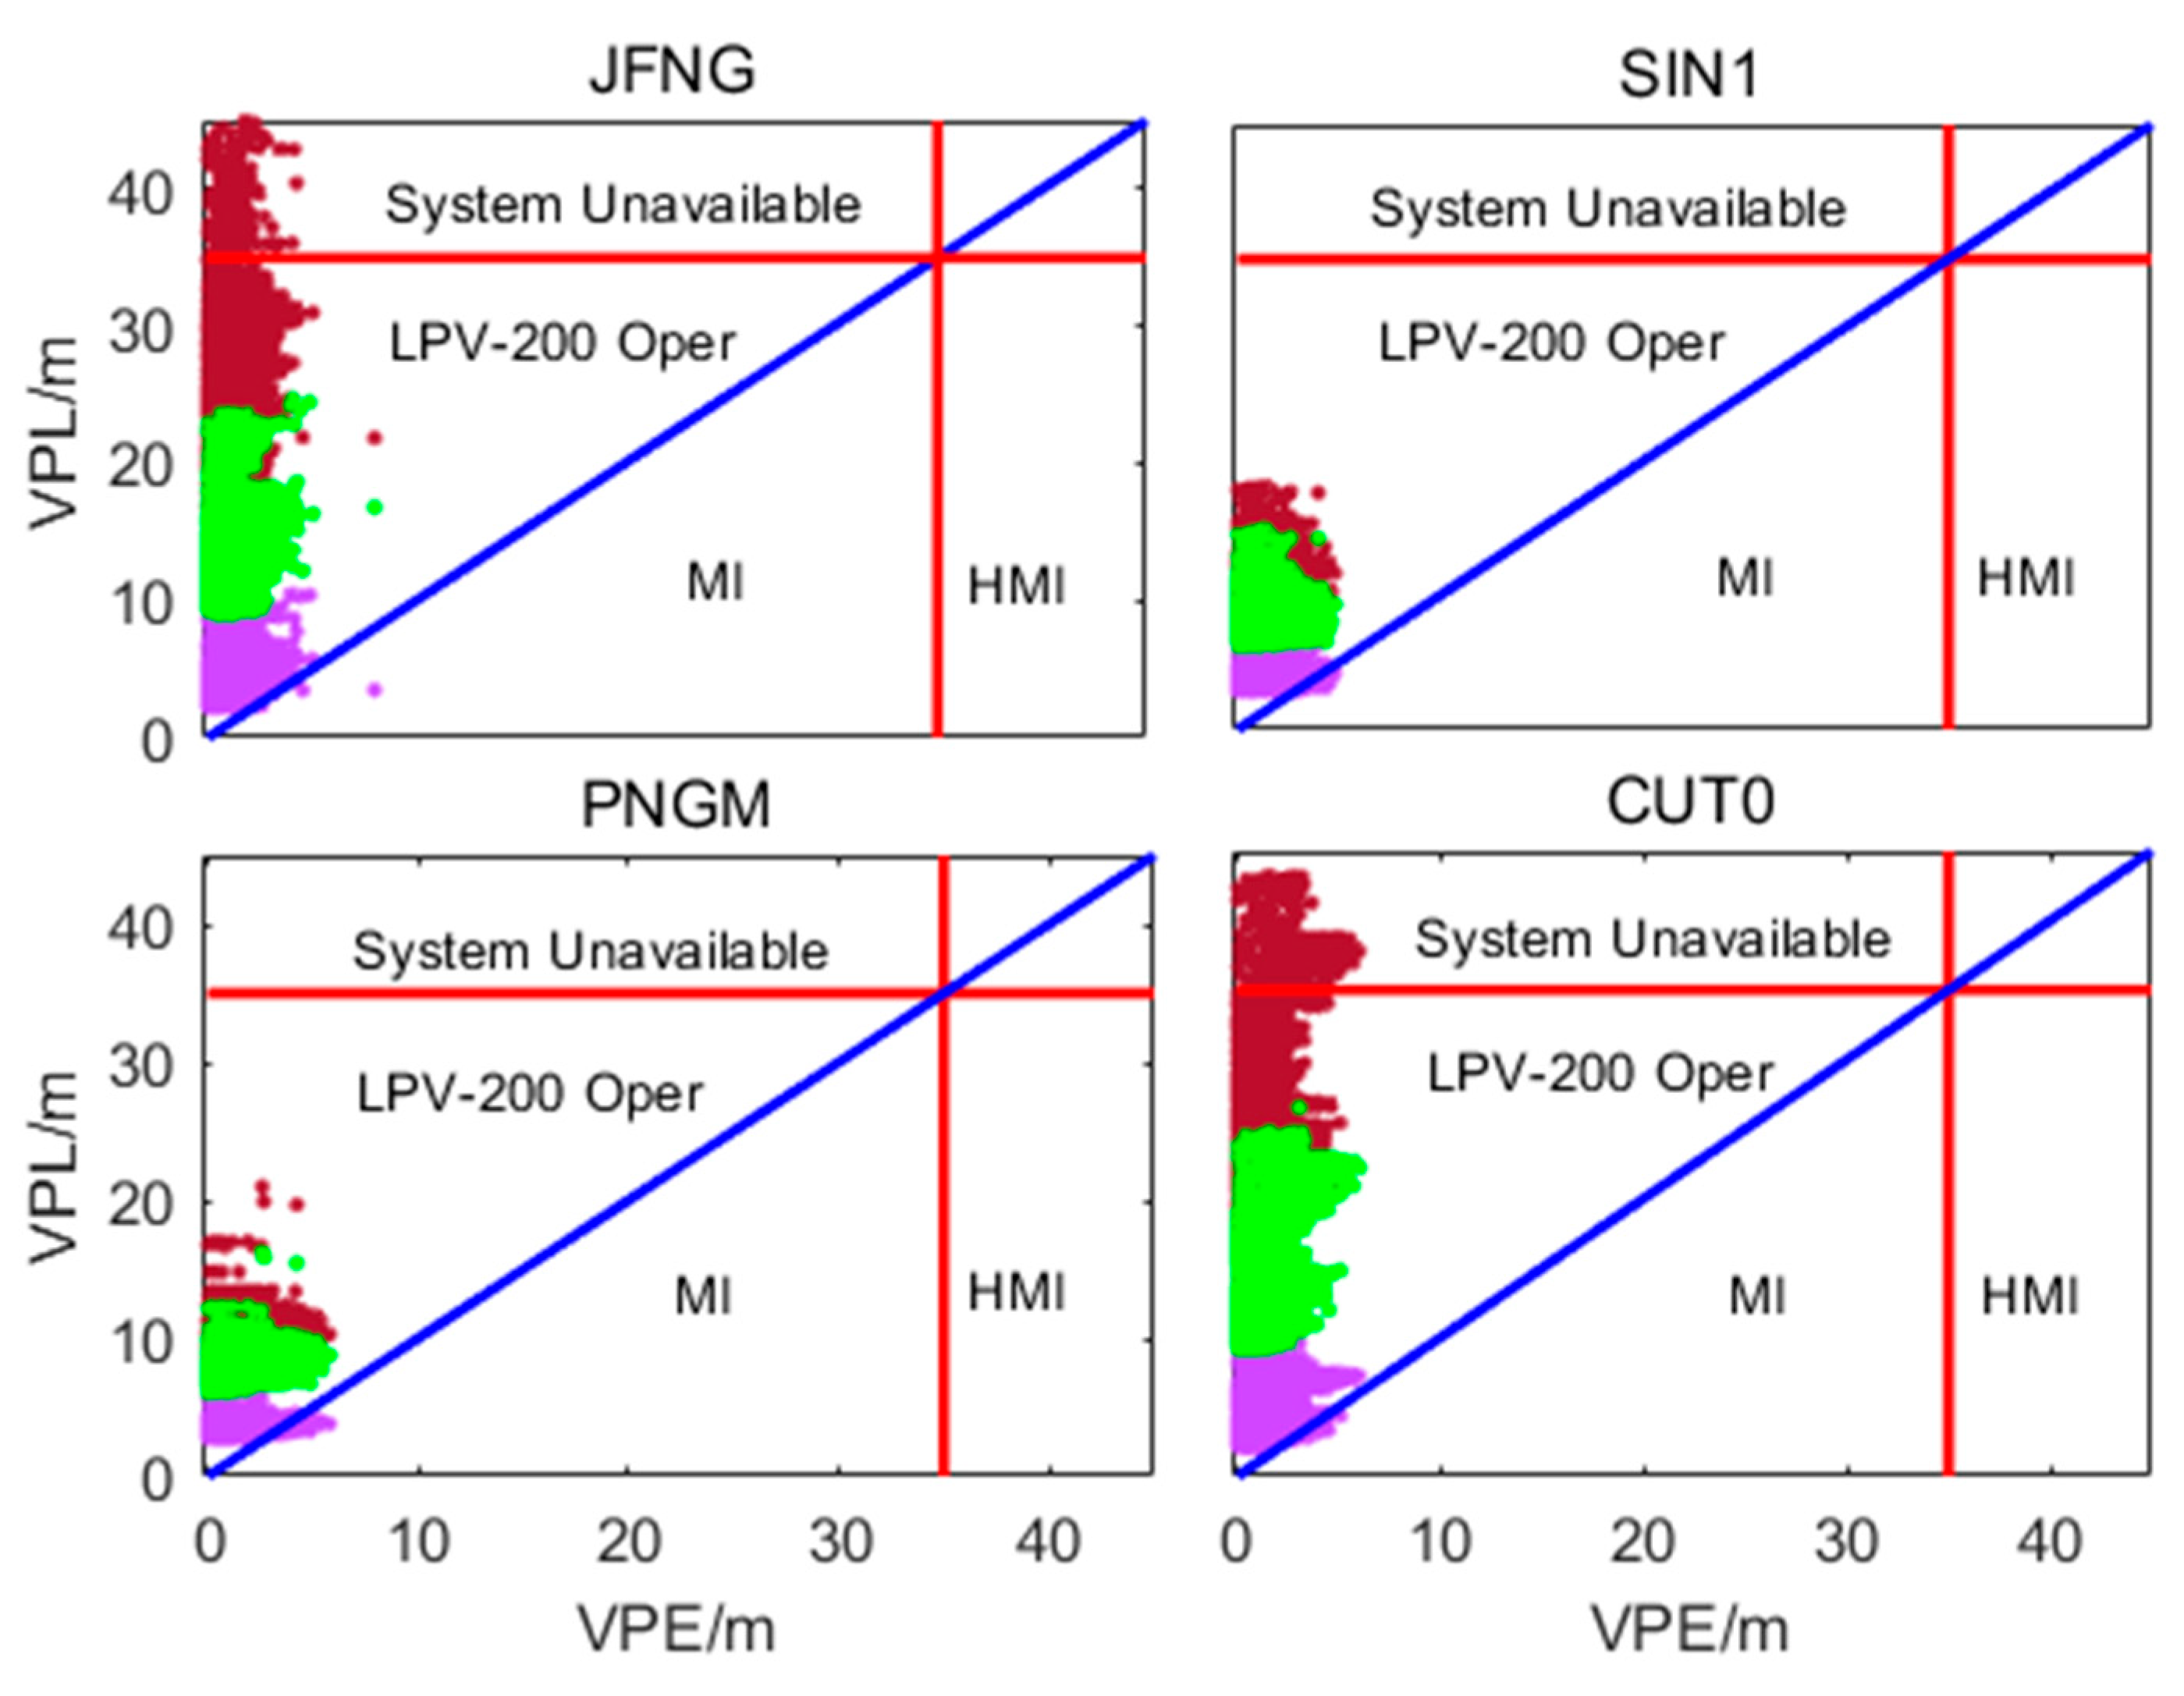
In the real-world data experiment, the ARAIM without non-Gaussian overbounding was added to be compared with the PDM-ARAIM, indicated as NARAIM. In order to test the different ARAIM methods, the Stanford chart was used to evaluate the integrity and continuity performance. Horizontal axes indicates the absolute value of vertical position errors, while VPLs were plotted in the vertical axes.
Figure 6 is the Stanford chart of different ARAIM methods based on the collected real-world data. Note that the cases with less than five satellites in view were neglected. The results of different ARAIM methods are listed in Table 3. It can be seen that the results of SIN1 and PNGM were better than those of the other stations. This was because the SIN1 and PNGM stations are located in the mid-latitude region, which has better satellite geometry. Moreover, the VPL of NARAIM was less than the VAL, and VPE was less than the VAL, which led to the contribution of MI. The MI probability of the NRAIM was 0.57%, 0.91%, 1.65%, and 0.36% for JFNG, SIN1, PNGM, and CUT0, correspondingly. However, the MI cases of PB-ARAIM and PDM-ARAIM were absent, which could be attributed to the non-Gaussian error compensation. This is due to the fact that the overbounding describes a Gaussian envelope to protect integrity, which prevents the non-Gaussian representation of the actual error distribution.
We compared the ARAIM availability in order to demonstrate the ability of the different methods. The NARAIM method computes smaller PLs, which has better availability but constitutes misleading information. With the PB-ARAIM, the availability of JFNG and CUT0 stations were only 96.41% and 95.72%, respectively. Since the PB-ARAIM formed a more conservative Gaussian bound to protect integrity, it would lose part continuity as the cost, which would affect availability. In contrast, we can see from Table 3 that the PDM-ARAIM with JFNG and CUT0 stations maintained the availability of 99.99% and 100%, respectively. This shows the superiority of the proposed position-domain overbounding method, which had the better balance between guaranteeing the integrity and the ARAIM availability. Especially in the mid latitude area, the performance improvement was more obvious.
Now we turn to the boundary and inflation factor of the proposed method. It can be seen from Figure 7 that the inflation factor of JFNG, SIN1, PNGM, and CUT0 was limited by the boundary, respectively. We could judge that position-domain overbounding met the continuity requirement through the relationship between boundary and inflation factor. However, the PDM-ARAIM was relatively conservative for the poor satellite geometric distribution areas, which could be shown as the smaller boundary. In order to ensure the integrity in such areas, the PDM-ARAIM was more likely to decrease the system continuity and availability relative to the good satellite geometric distribution areas. One solution to this issue is the switch of other navigation sources to avoid the continuity interruption caused by the PDM-ARAIM. Obviously, when the globalization of the BeiDou system is completed, the continuity of the proposed method can further be improved.

5. Conclusions

The proposed PDM-ARAIM method compensates the non-Gaussian distribution of observation errors by position-domain overbounding. The proposed method not only takes account of the correlated non-Gaussian errors but also releases the conservativeness of the traditional CDF overbounding method to improve the continuity performance of ARAIM. The proposed method also provides a boundary of inflation factor. The relationship between the boundary and the inflation factor can be used as an “observer”, which can present the performance of the PDM-ARAIM method. Under the constraint of boundary, the proposed method can meet the requirements of integrity risk and continuity risk simultaneously.
The effectiveness of the proposed method is tested by the simulation and real-world data, respectively. The results show that the PDM-ARAIM method can achieve the best performance. It can effectively suppress the integrity risk caused by non-Gaussian characteristics of observation errors and increase the global availability level to 99.99%. However, the PDM-ARAIM can be relatively conservative for the poor satellite geometric distribution. Future work should focus on improving the proposed method under the satellite-constrained cases. In addition, with the completion of the BeiDou global constellation, the performance of the method can be further verified.

Author Contributions

Conceptualization, L.Z., J.Z., and L.L.; Data curation, F.Y.; Investigation, L.Z., J.Z., L.L., and F.Y.; Methodology, J.Z. and L.L.; Software, J.Z.; Supervision, L.L.; Validation, L.Z., J.Z., F.Y., and X.L.; Writing—original draft, J.Z. and L.L.; Writing—review and editing, L.Z., J.Z., L.L., F.Y., and X.L. All authors have read and agreed to the published version of the manuscript.

Funding

This research was jointly funded by the National Natural Science Foundation of China (Nos. 61773132, 61633008, 61803115), the National Key Research and Development Program (No. 2017YFE0131400), the 7th Generation Ultra Deep Water Drilling Unit Innovation Project sponsored by Chinese Ministry of Industry and Information Technology, the Heilongjiang Province Research Science Fund for Distinguished Young Scholars (No. JC2018019), and the Fundamental Research Funds for Central Universities (Nos. HEUCFP201768, 3072019CF0401, 3072020CFJ0402).

Acknowledgments

The authors acknowledge the IGS for providing the data.

Conflicts of Interest

The authors declare no conflict of interest.

References

  1. Lee, Y.C. New advance RAIM with improved availability for detecting constellation-wide faults, using two independent constellations. Navig. J. Inst. Navig. 2013, 60, 71–83. [Google Scholar] [CrossRef]
  2. Nikiforov, I.; Roturier, B. Advanced RAIM algorithms: First results. In Proceedings of the 18th ITM of the Satellite Division of The Institute of Navigation (IONGNSS2005), Long-Beach, CA, USA, 13–16 September 2005; pp. 789–1800. [Google Scholar]
  3. Ene, A.; Blanch, J.; Powell, J.D. Fault detection and elimination for Galileo-GPS vertical guidance. In Proceedings of the ION NTM, San Diego, CA, USA, 22–24 January 2007; pp. 1244–1254. [Google Scholar]
  4. Lee, Y.C.; Braff, R.; Fernow, J.P.; Hashemi, D.; McLaughlin, M.P.; O’Laughlin, D. GPS and Galileo with RAIM or WAAS for vertically guided approaches. In Proceedings of the ION GNSS 2005, Long Beach, CA, USA, 13–16 September 2005; pp. 1801–1825. [Google Scholar]
  5. Blanch, J.; Walter, T.; Enge, P.; Lee, Y.; Pervan, B.; Rippl, M.; Spletter, A.; Kropp, V. Baseline Advanced RAIM User Algorithm and Possible Improvements. IEEE Trans. Aerosp. Electron. Syst. 2015, 51, 713–732. [Google Scholar] [CrossRef]
  6. Blanch, J.; Walter, T.; Enge, P. Optimal positioning for advanced RAIM. Navig. J. Inst. Navig. 2013, 60, 279–289. [Google Scholar] [CrossRef]
  7. Blanch, J.; Walter, T.; Enge, P. RAIM with optimal integrity and continuity allocations under multiple failures. IEEE Trans. Aerosp Electron. Syst. 2010, 46, 1235–1247. [Google Scholar] [CrossRef]
  8. Brown, R.G. A baseline GPS RAIM scheme and a note on the equivalence of three RAIM methods. Navigation 1992, 39, 301–306. [Google Scholar] [CrossRef]
  9. Li, L.; Quddus, M.; Ison, S.; Zhao, L. Multiple reference consistency check for LAAS: A novel position domain approach. GPS Solut. 2012, 16, 209–220. [Google Scholar] [CrossRef] [Green Version]
  10. Angus, J. RAIM with multiple faults. Navigation 2006, 53, 249–257. [Google Scholar] [CrossRef]
  11. Walter, T.; Blanch, J. Characterization of GNSS clock and ephemeris errors to support ARAIM. In Proceedings of the Institute of Navigation, Pacific PNT Meeting, Honolulu, HI, USA, 20–23 April 2015; pp. 920–931. [Google Scholar]
  12. Misra, P.; Rife, J. RAIM with non-Gaussian errors. In Proceedings of the 26th International Technical Meeting of the Satellite Division of The Institute of Navigation (ION GNSS 2013), Nashville, TN, USA, 16–20 September 2013; pp. 2664–2671. [Google Scholar]
  13. DiLellio, J. A hybrid GNSS integrity design leveraging a priori signal noise characteristics. J.Navig. 2010, 63, 513–526. [Google Scholar] [CrossRef]
  14. Perea, S.; Meurer, M.; Rippl, M.; Belabbas, B.; Joerger, M. URA/SISA analysis for GPS and Galileo to support ARAIM. Navig. J. Inst. Navig. 2017, 64, 237–254. [Google Scholar] [CrossRef]
  15. DeCleene, B. Defining pseudorange integrity-Overbounding. In Proceedings of the 13th International Techn. Meeting Satellite Division of the Institute of Navigation, Salt Lake City, UT, USA, 19–22 September 2000; pp. 1916–1924. [Google Scholar]
  16. Rife, J.; Pervan, B. Overbounding Revisited: Discrete Error Distribution Modeling for Safety Critical GPS Navigation. IEEE Trans. Aerosp Electron. Syst. 2012, 48, 1237–1251. [Google Scholar] [CrossRef]
  17. Walter, T.; Gunning, K.; Eric Phelts, R.; Blanch, J. Validation of the unfaulted error bounds for ARAIM. Navig. J. Inst. Navig. 2018, 65, 117–133. [Google Scholar] [CrossRef]
  18. Langel, S.E.; Khanafseh, S.M.; Pervan, B.S. Bounding integrity risk for sequential state estimators with stochastic modeling uncertainty. J. Guidance Control Dyn. 2014, 37, 36–46. [Google Scholar] [CrossRef]
  19. Rife, J.; Pullen, S.; Pervan, B.; Enge, P. Paired overbounding for nonideal LAAS and WAAS error distributions. IEEE Trans. Aerosp. Electron. Syst. 2006, 42, 1386–1395. [Google Scholar] [CrossRef]
  20. Rife, J. Core overbounding and its implications for LAAS integrity. In Proceedings of the ION GNSS 2004, Long Beach, CA, USA, 21–24 September 2004; pp. 2810–2821. [Google Scholar]
  21. Rife, J.; Walter, T.; Blanch, J. Overbounding SBAS and GBAS error distributions with excess-mass functions. In Proceedings of the International Symposium GPS/GNSS, Sydney, Australia, 6–8 December 2004. [Google Scholar]
  22. Rife, J.; Pullen, S. The impact of measurement biases on availability for CAT III LAAS. Navigation 2005, 52, 215–228. [Google Scholar] [CrossRef]
  23. Larson, J.D.; Gebre-Egziabher, D.; Rife, J.H. Gaussian-Pareto overbounding of DGNSS pseudoranges from CORS. Navig. J. Inst. Navig. 2018, 66, 139–150. [Google Scholar] [CrossRef] [Green Version]
  24. Pervan, B.; Khanafseh, S.; Patel, J. Test Statistic Auto- and Cross-correlation Effects on Monitor False Alert and Missed Detection Probabilities. In Proceedings of the 2017 International Technical Meeting of The Institute of Navigation, Monterey, CA, USA, 30 January–2 February 2017; pp. 562–590. [Google Scholar]
  25. Pervan, B.; Sayim, I. Sigma inflation for the local area augmentation of GPS. IEEE Trans. Aerosp. Electron. Syst. 2001, 37, 1301–1311. [Google Scholar] [CrossRef]
  26. Rife, J.; Gebre-Egziabher, D. Symmetric overbounding of correlated errors. Navigation 2007, 54, 109–124. [Google Scholar] [CrossRef]
  27. Li, L.; Zhao, L.; Ding, J.; Gao, S. A new inflation integrity monitoring algorithm for improving availability of LASS signal-in-space. Acta Aeronaut. Astronaut. Sin. 2011, 32, 664–671. [Google Scholar]
  28. Lee, J.; Pullen, S. Sigma overbounding using a position-domain method for the local area augmentation of GPS. IEEE Trans. Aerosp. Electron. Syst. 2009, 45, 1262–1274. [Google Scholar]
  29. Braff, R. A method for LAAS fault-free error overbounding using a position domain monitor. In Proceedings of the ION National Technical Meeting, Anaheim, CA, USA, 22–24 January 2003; pp. 326–388. [Google Scholar]
  30. Fang, K.; Zhu, Y.; Xue, R.; Wang, Z. A Novel Position Domain Overbounding Method Using Pseudorange Error Model Based on Extreme Value Theory. In Proceedings of the ION 2015 Pacific PNT Meeting, Honolulu, HI, USA, 20–23 April 2015; pp. 912–919. [Google Scholar]
  31. Blanch, J.; Walter, T.; Enge, P. Gaussian bounds of sample distributions for integrity analysis. IEEE Trans. Aerosp. Electron. Syst. 2019, 55, 1806–1815. [Google Scholar] [CrossRef]
  32. Blanch, J.; Walter, T.; Enge, P. A MATLAB toolset to determine strict Gaussian bounding distributions of a sample distribution. In Proceedings of the 30th International Technical Meeting Satellite Division of the Institute of Navigation, Portland, OR, USA, 25–29 September 2017; pp. 4236–4247. [Google Scholar]
  33. Li, L.; Wang, H.; Jia, C.; Zhao, L.; Zhao, Y. Integrity and continuity allocation for the RAIM with multiple constellations. GPS Solut. 2017, 21, 1503–1513. [Google Scholar] [CrossRef]
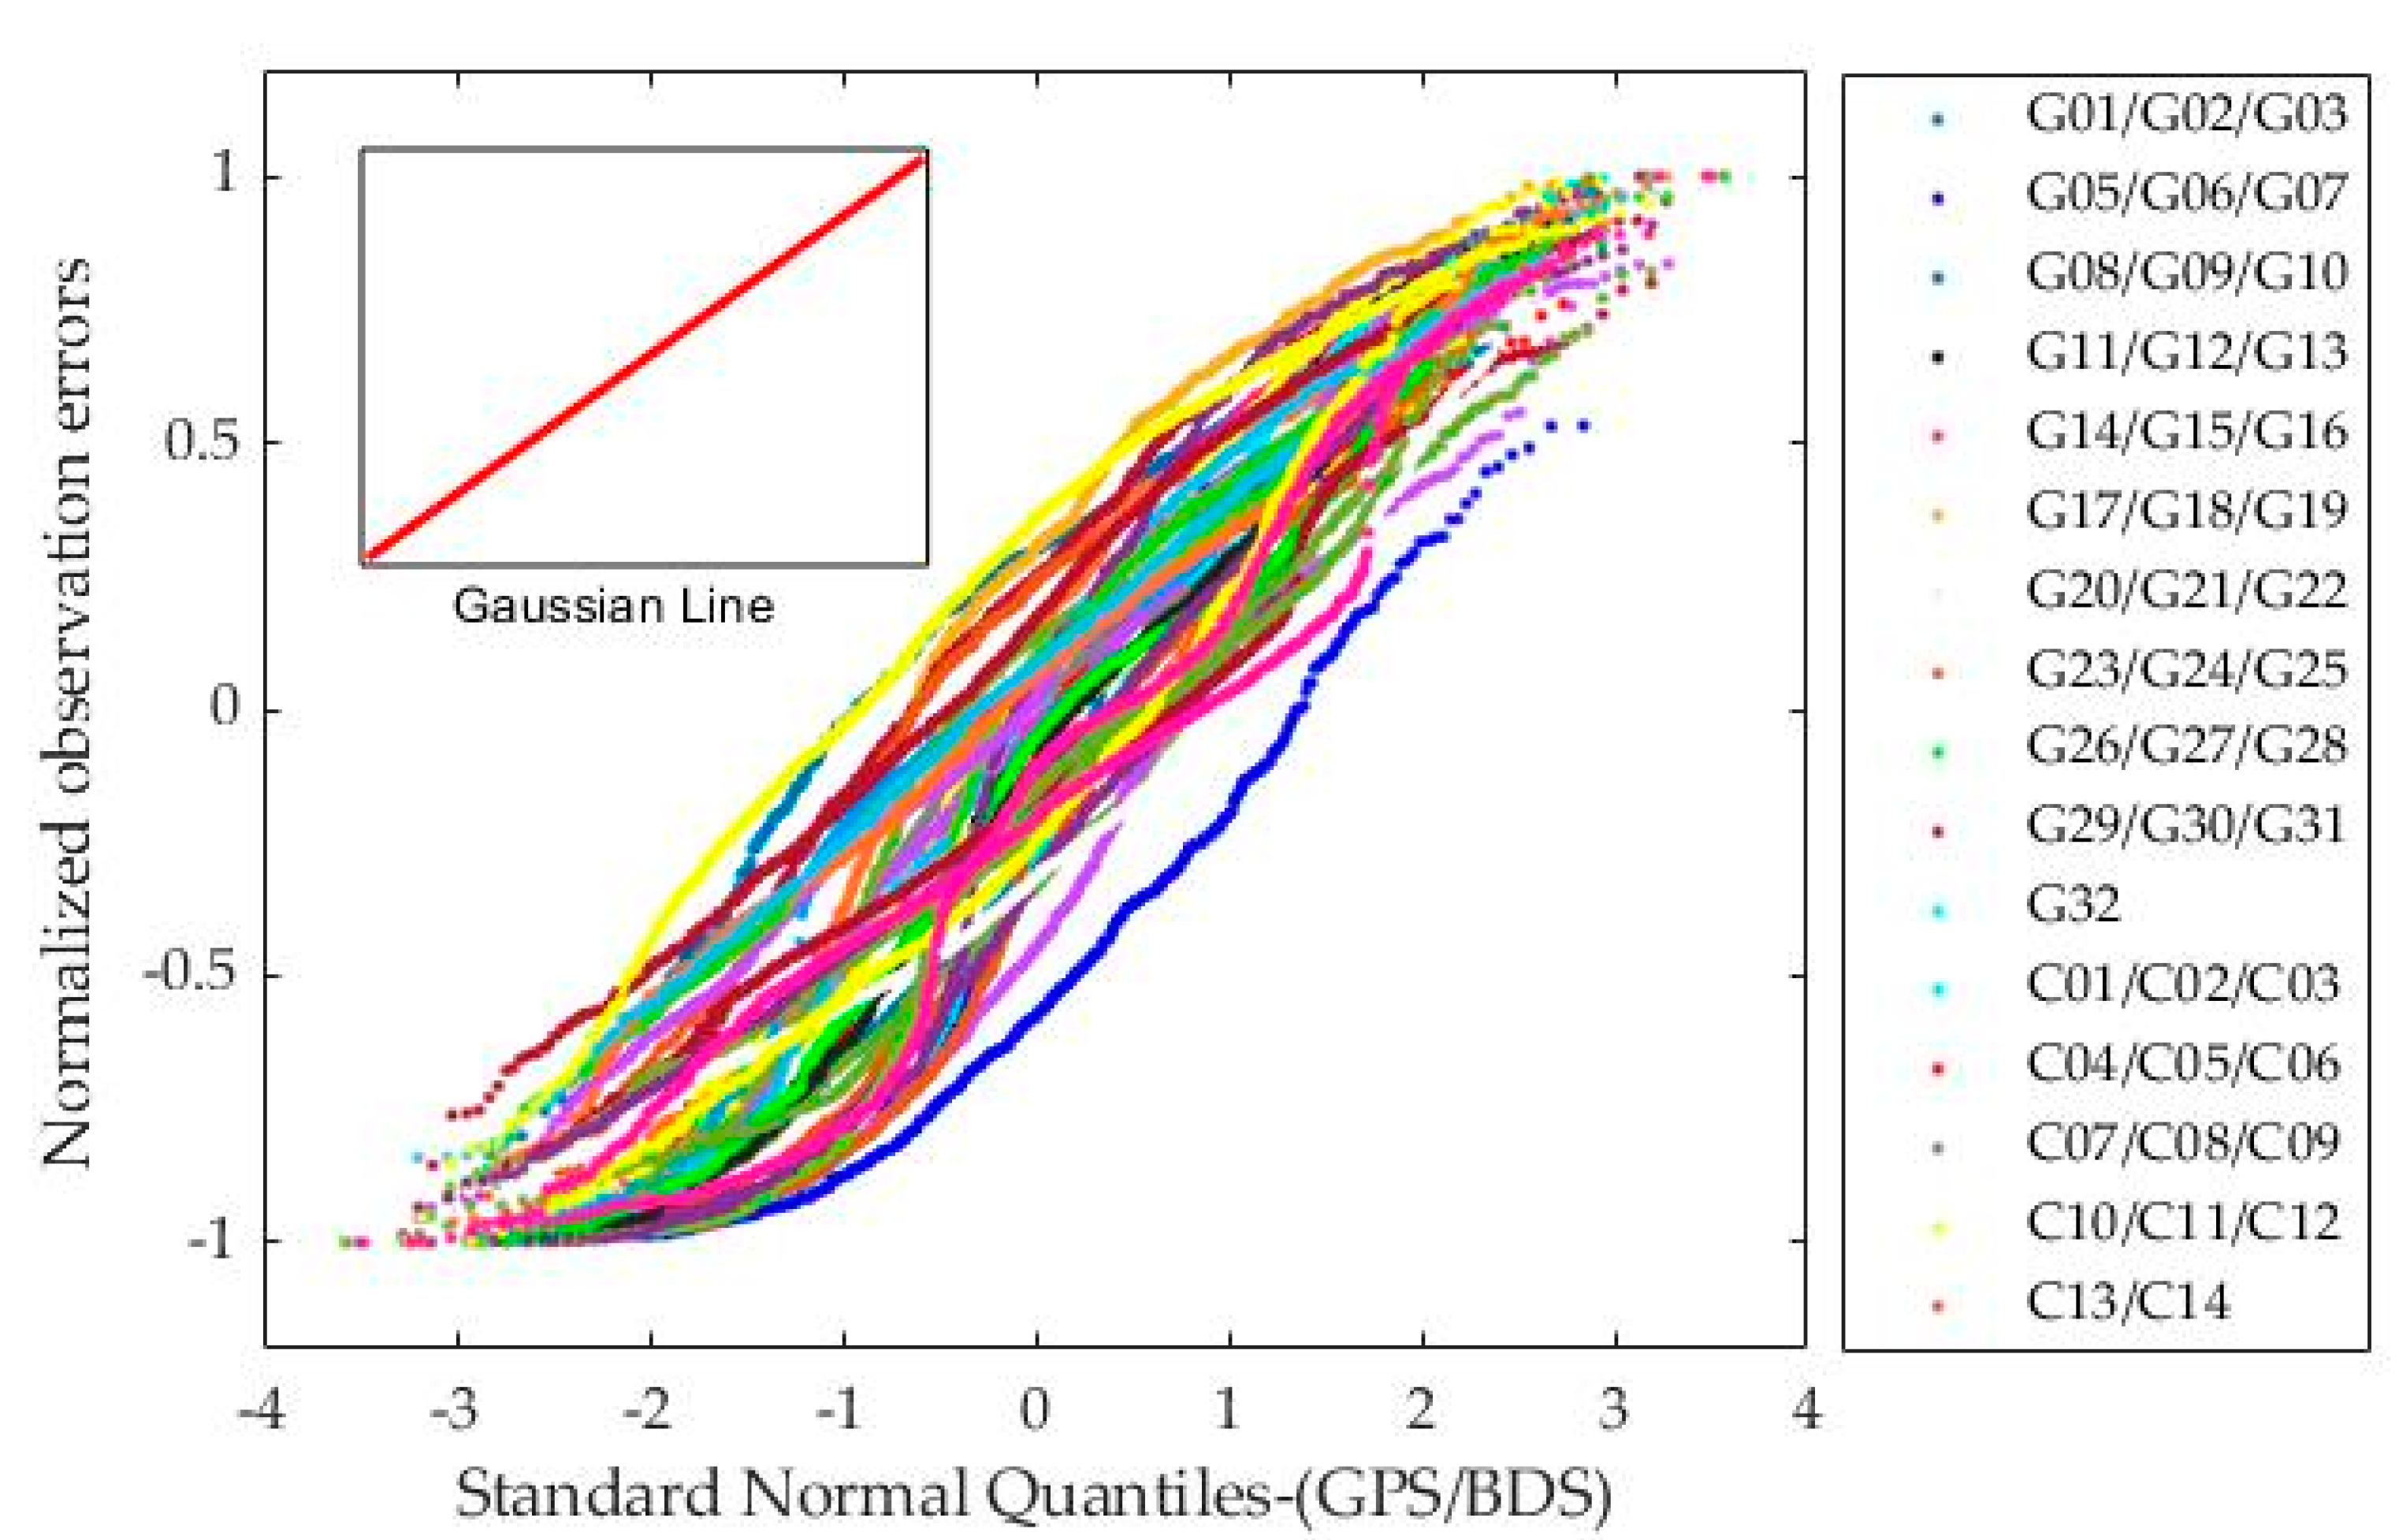
Figure 1. QQ plot of normalized observation errors from the JFNG station.
Remotesensing 12 01992 g001
Figure 2. (a) Paired overbounding method; (b) Stanford chart of MHSS ARAIM from paired overbounding. The data from the JFNG station. Figure 2a shows the inflation results of G02 and G24 observation errors from the paired overbounding method. In Figure 2b, the Stanford chart was used to evaluate the integrity and continuity performance, where the horizontal axes indicate the absolute value of vertical position errors (VPE); the vertical axes is VPLs. The area beyond the red line indicates that ARAIM is unavailable.
Remotesensing 12 01992 g002
Figure 3. 99.5% VPL of ARAIM; 99.5% VPL represents a 99.5% value in ascending order of VPL calculations at any location in the world during the simulation. The subfigure (a), (c), (e) indicate the results from the PB-ARAIM method, and the satellite’s prior failure probabilities are 10 3 , 10 4 , 10 5 , respectively. The subfigure (b), (d), (f) indicate the results from the PDM-ARAIM method, and the satellite’s prior failure probabilities are 10 3 , 10 4 , 10 5 , respectively. The color bar of figure represents the different VPL value.
Remotesensing 12 01992 g003
Figure 4. Boundary and inflation factor distribution of global simulation based on the PDM-ARAIM method. The subfigure (a), (c), (e) indicate the actual inflation factor, and the satellite’s prior failure probabilities are 10 3 , 10 4 , 10 5 , respectively. The subfigure (b), (d), (f) indicate the boundary of inflation factor, and the satellite’s prior failure probabilities are 10 3 , 10 4 , 10 5 , respectively.
Remotesensing 12 01992 g004
Figure 5. Distribution of selected IGS stations.
Remotesensing 12 01992 g005
Figure 6. Stanford chart from ARAIM methods. The red line indicates the vertical alert limit (VAL). Brown dots, green dots, and purple dots represent PB-ARAIM, PDM-ARAIM, and NARAIM results, respectively.
Remotesensing 12 01992 g006
Figure 7. Boundary and inflation factor of PDM-ARAIM method. Red dots represent the boundary of inflation factor; blue dots represent actual inflation factor distribution.
Remotesensing 12 01992 g007
Table 1. Parameter settings.
ParameterValue
σ GPS - URA , int (integrity)0.5 m
σ GPS - URA , cont (continuity)0.25 m
σ BDS - URA , int (integrity)0.9 m
σ BDS - URA , int (continuity)0.45 m
b int (integrity)0.75 m
b cont (continuity)0.1 m
integrity risk 1 × 10 7
continuity risk 2 × 10 6
P a p (GPS) 1 × 10 5
P a p (BDS) 1 × 10 5
Table 2. Performance of ARAIM under GPS/BDS dual constellation.
P a p CategoryPB-RAIMPDM-ARAIM
10 5 Average 99.5% VPL/m20.6716.62
Availability96.06%99.99%
10 4 Average 99.5% VPL/m22.5217.86
Availability89.96%99.74%
10 3 Average 99.5% VPL/m24.1618.96
Availability82.53%98.89%
Table 3. Performance of ARAIM under GPS/BDS dual constellation.
StationJFNGSIN1PNGMCUT0
NARAIMPMI0.57%0.91%1.65%0.36%
Availability 100%100%100%100%
PB-RAIMPMI0%0%0%0%
Availability96.41%100%100%95.72%
PDM-ARAIMPMI0%0%0%0%
Availability99.99%100%100%100%