Evaluation of the Ocean Surface Wind Speed Change following the Super Typhoon from Space-Borne GNSS-Reflectometry


Abstract
:
1. Introduction
2. Data and Methods
2.1. 2018 Typhoon Mangkhut
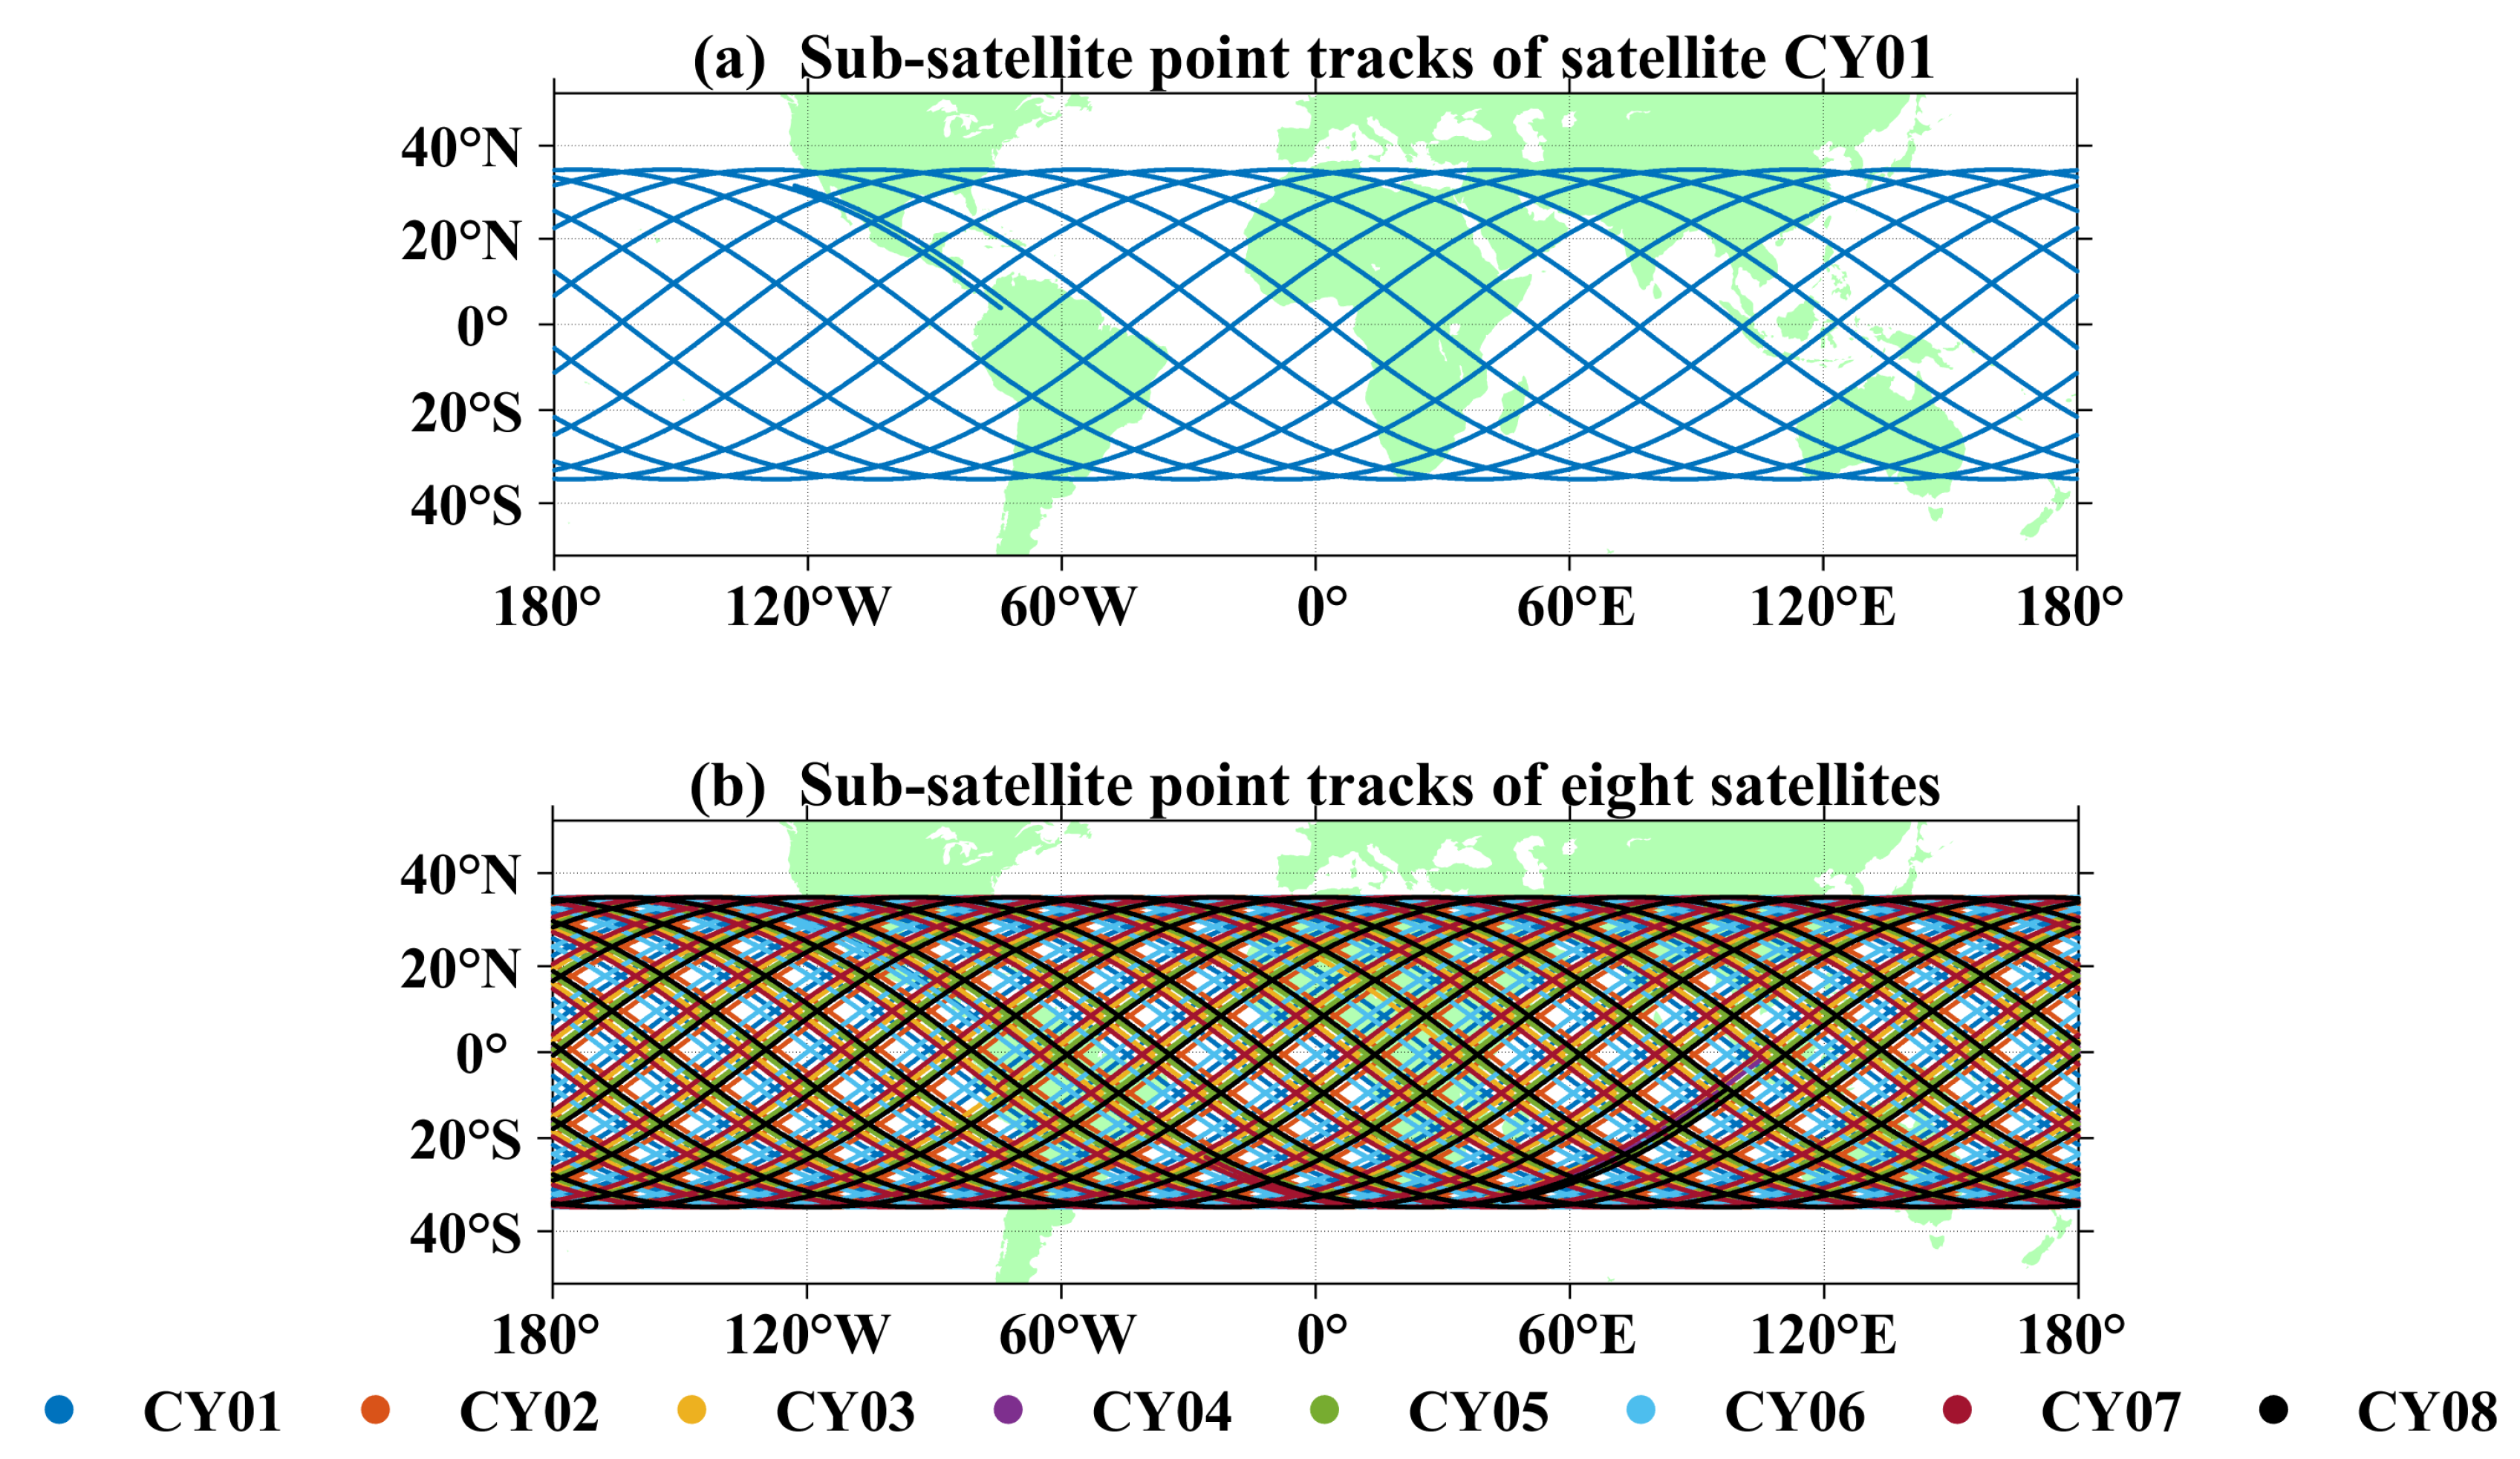
2.2. CYGNSS Data and Processing
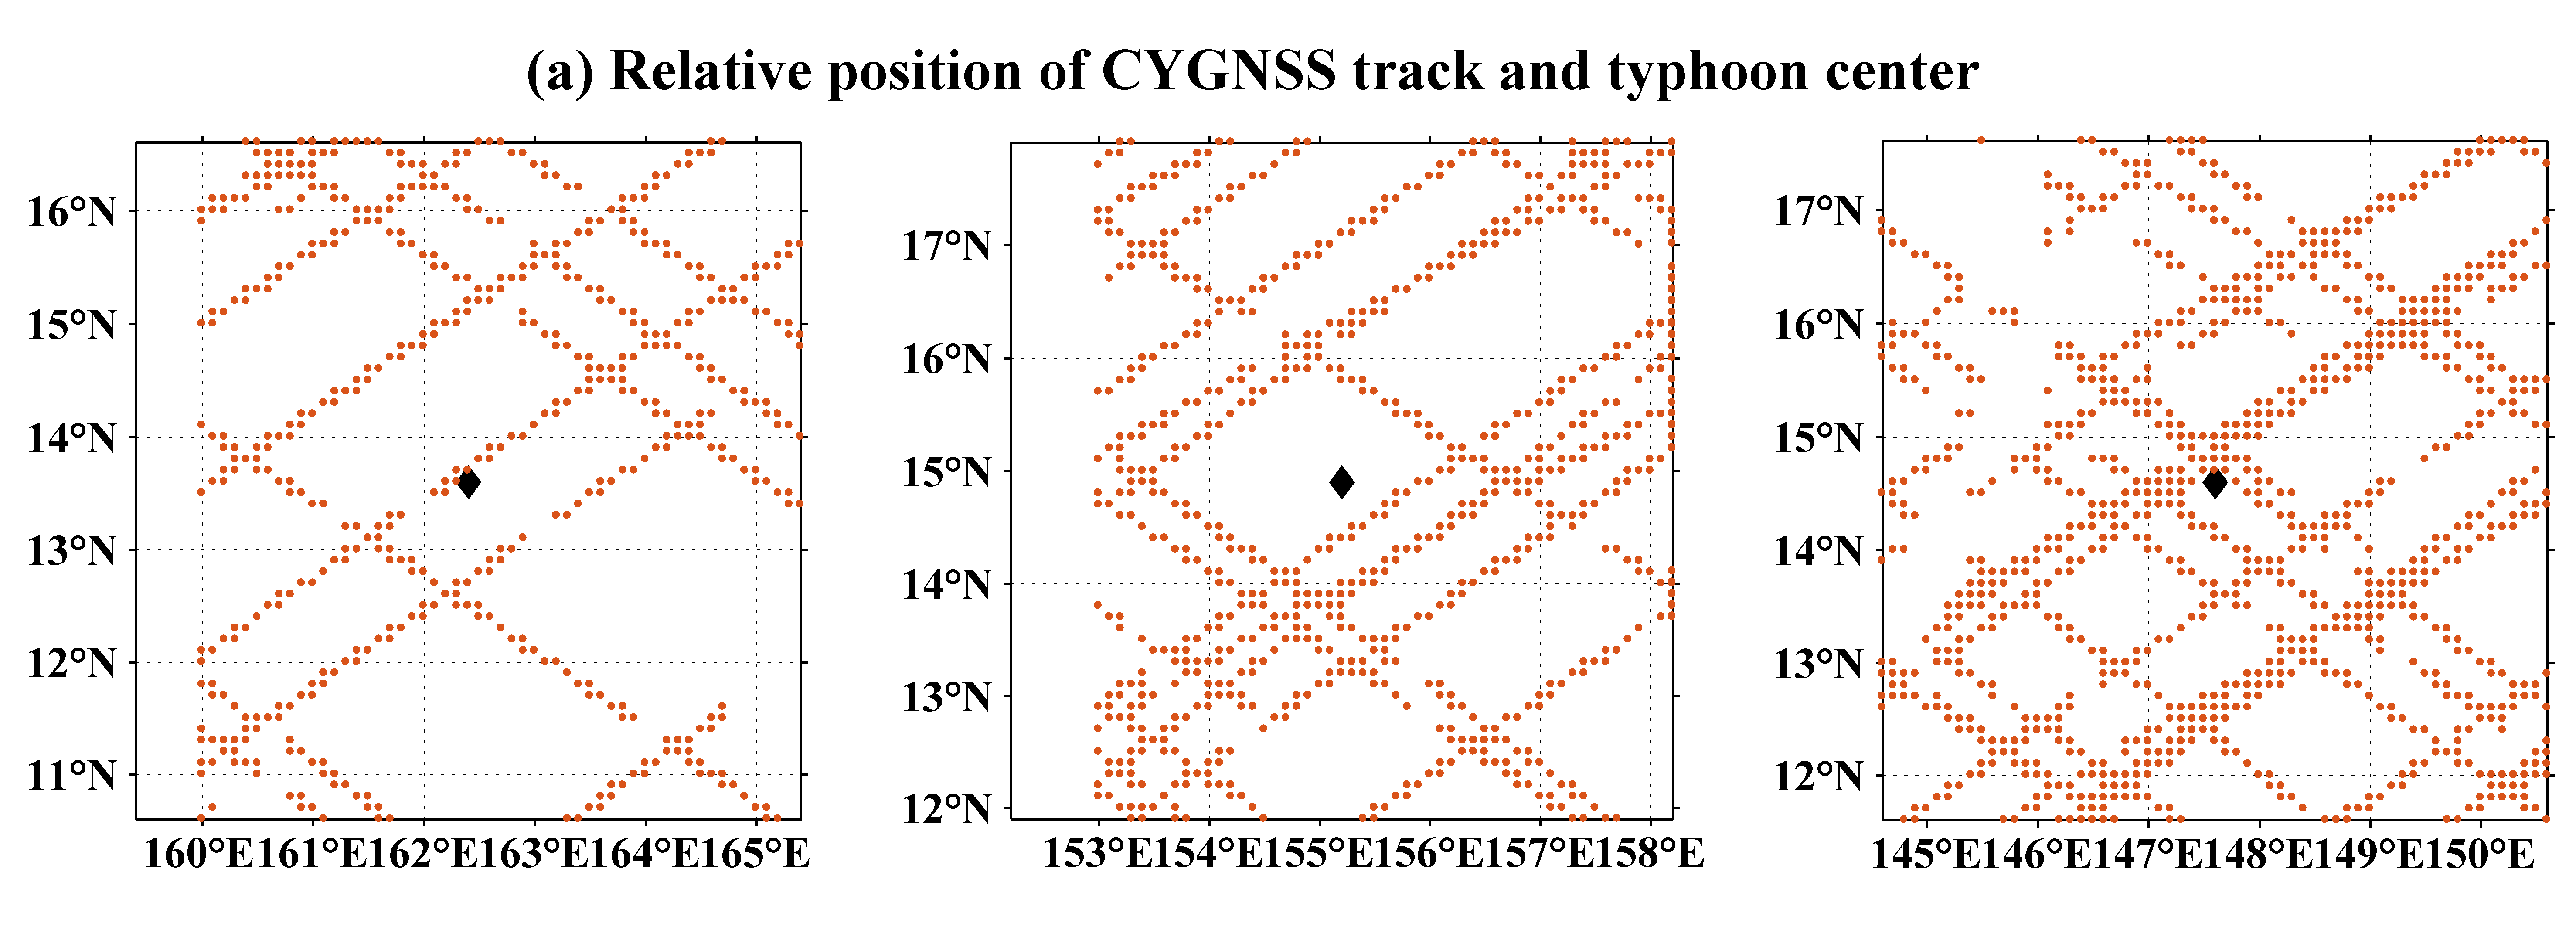
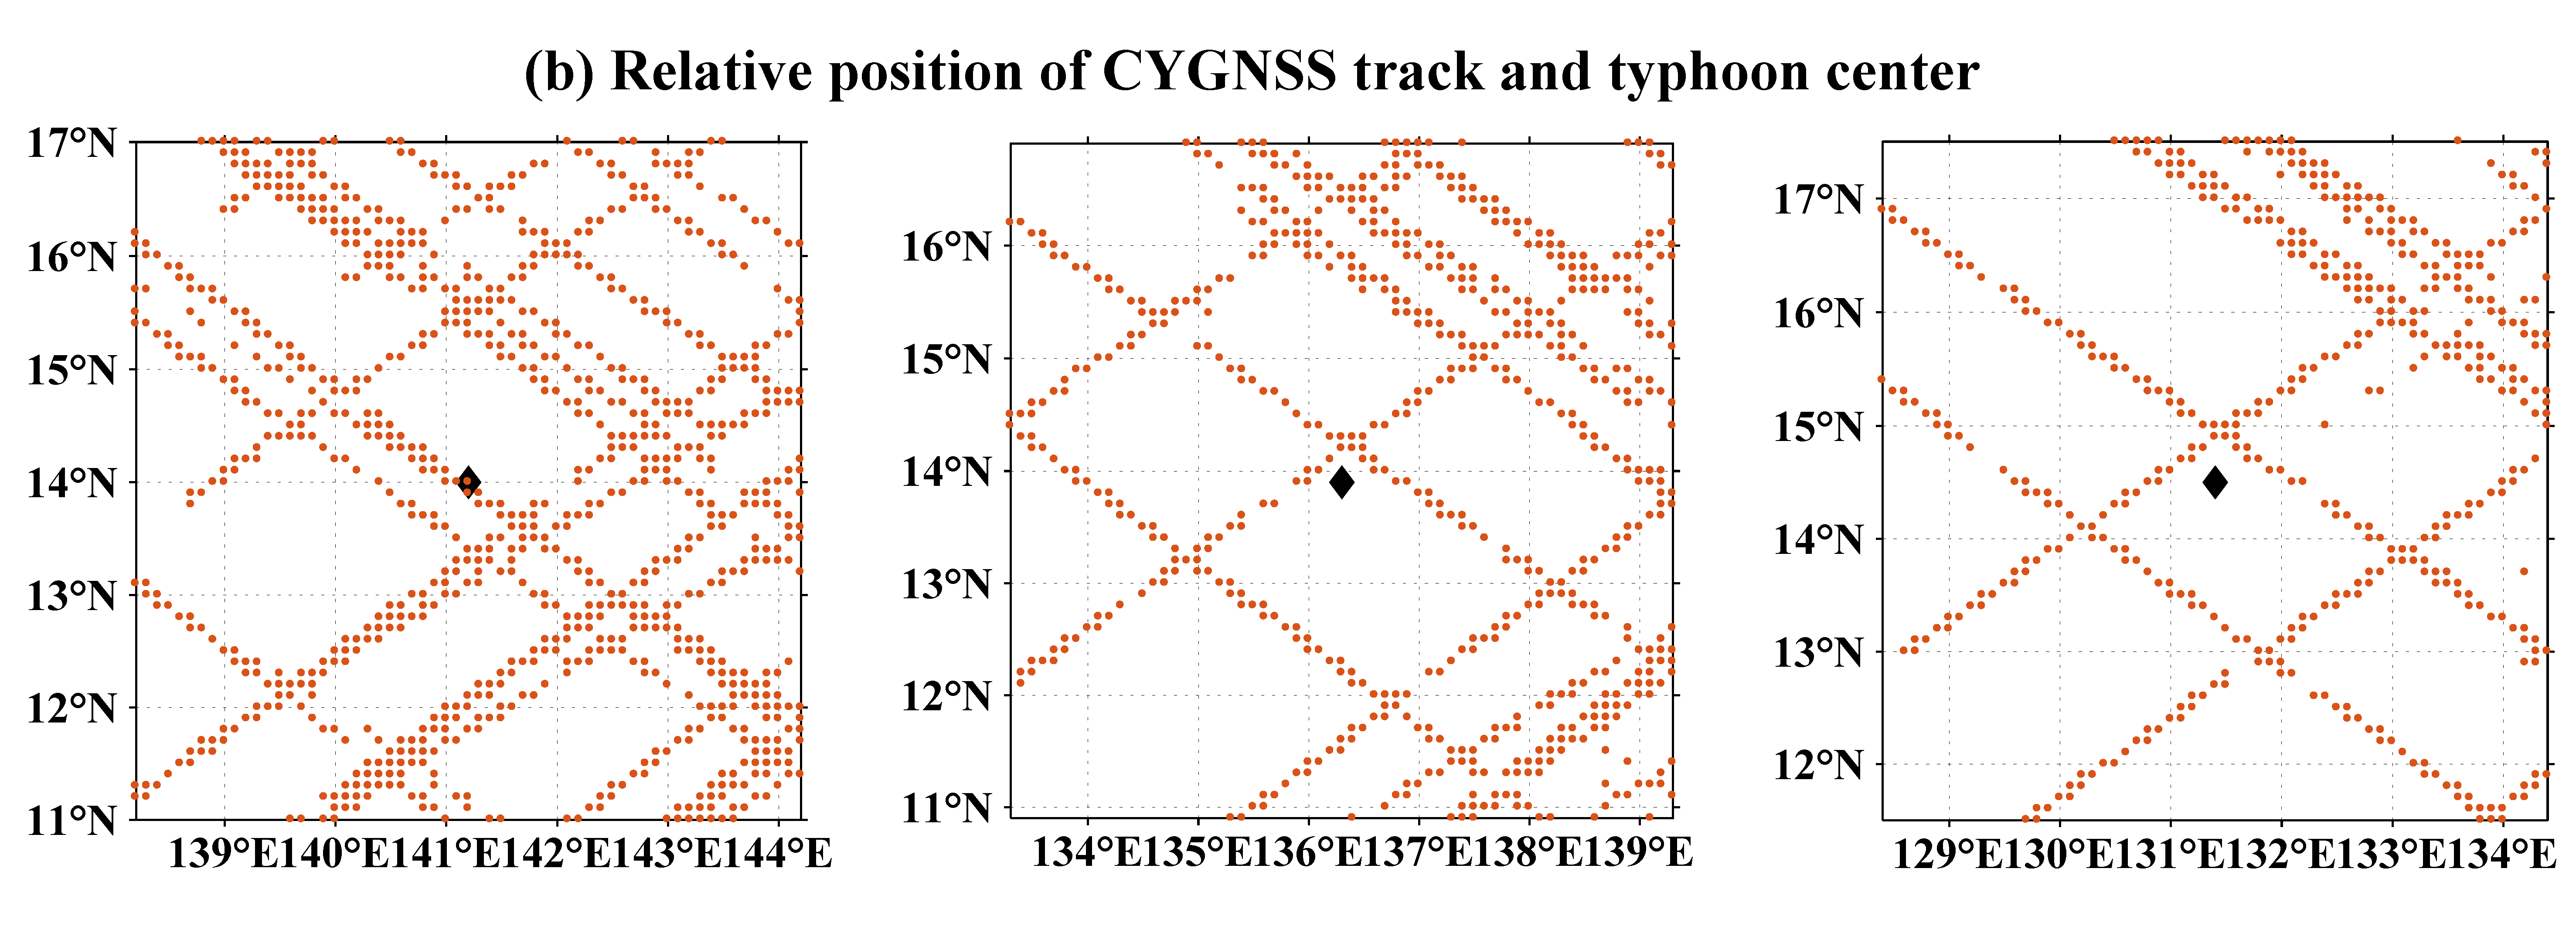
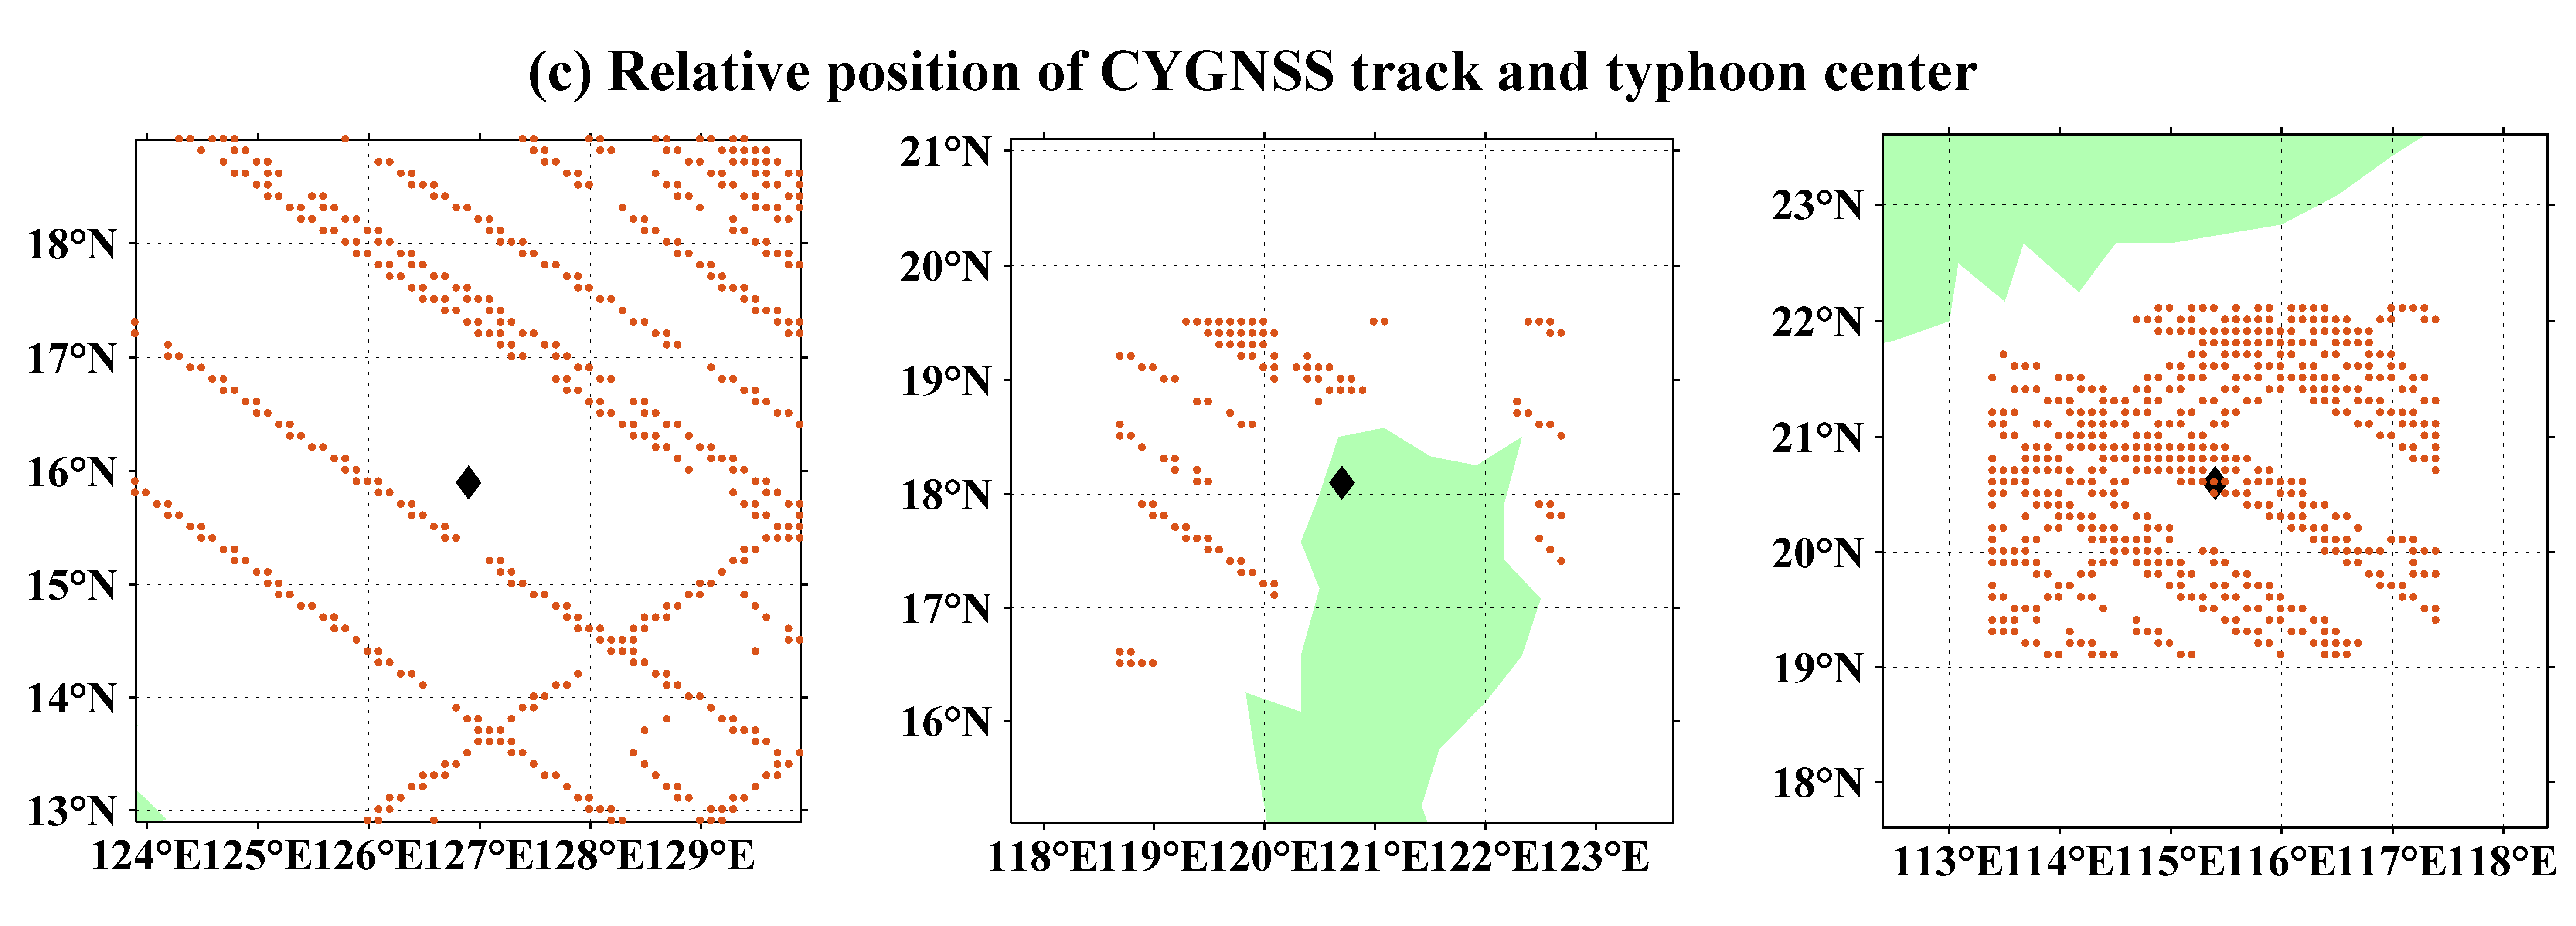
2.3. ECMWF and Typhoon Track Data
2.4. Evaluation Methods
3. Results and Discussion
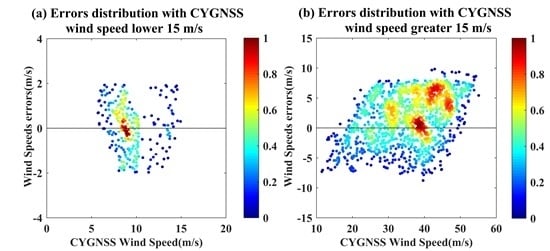
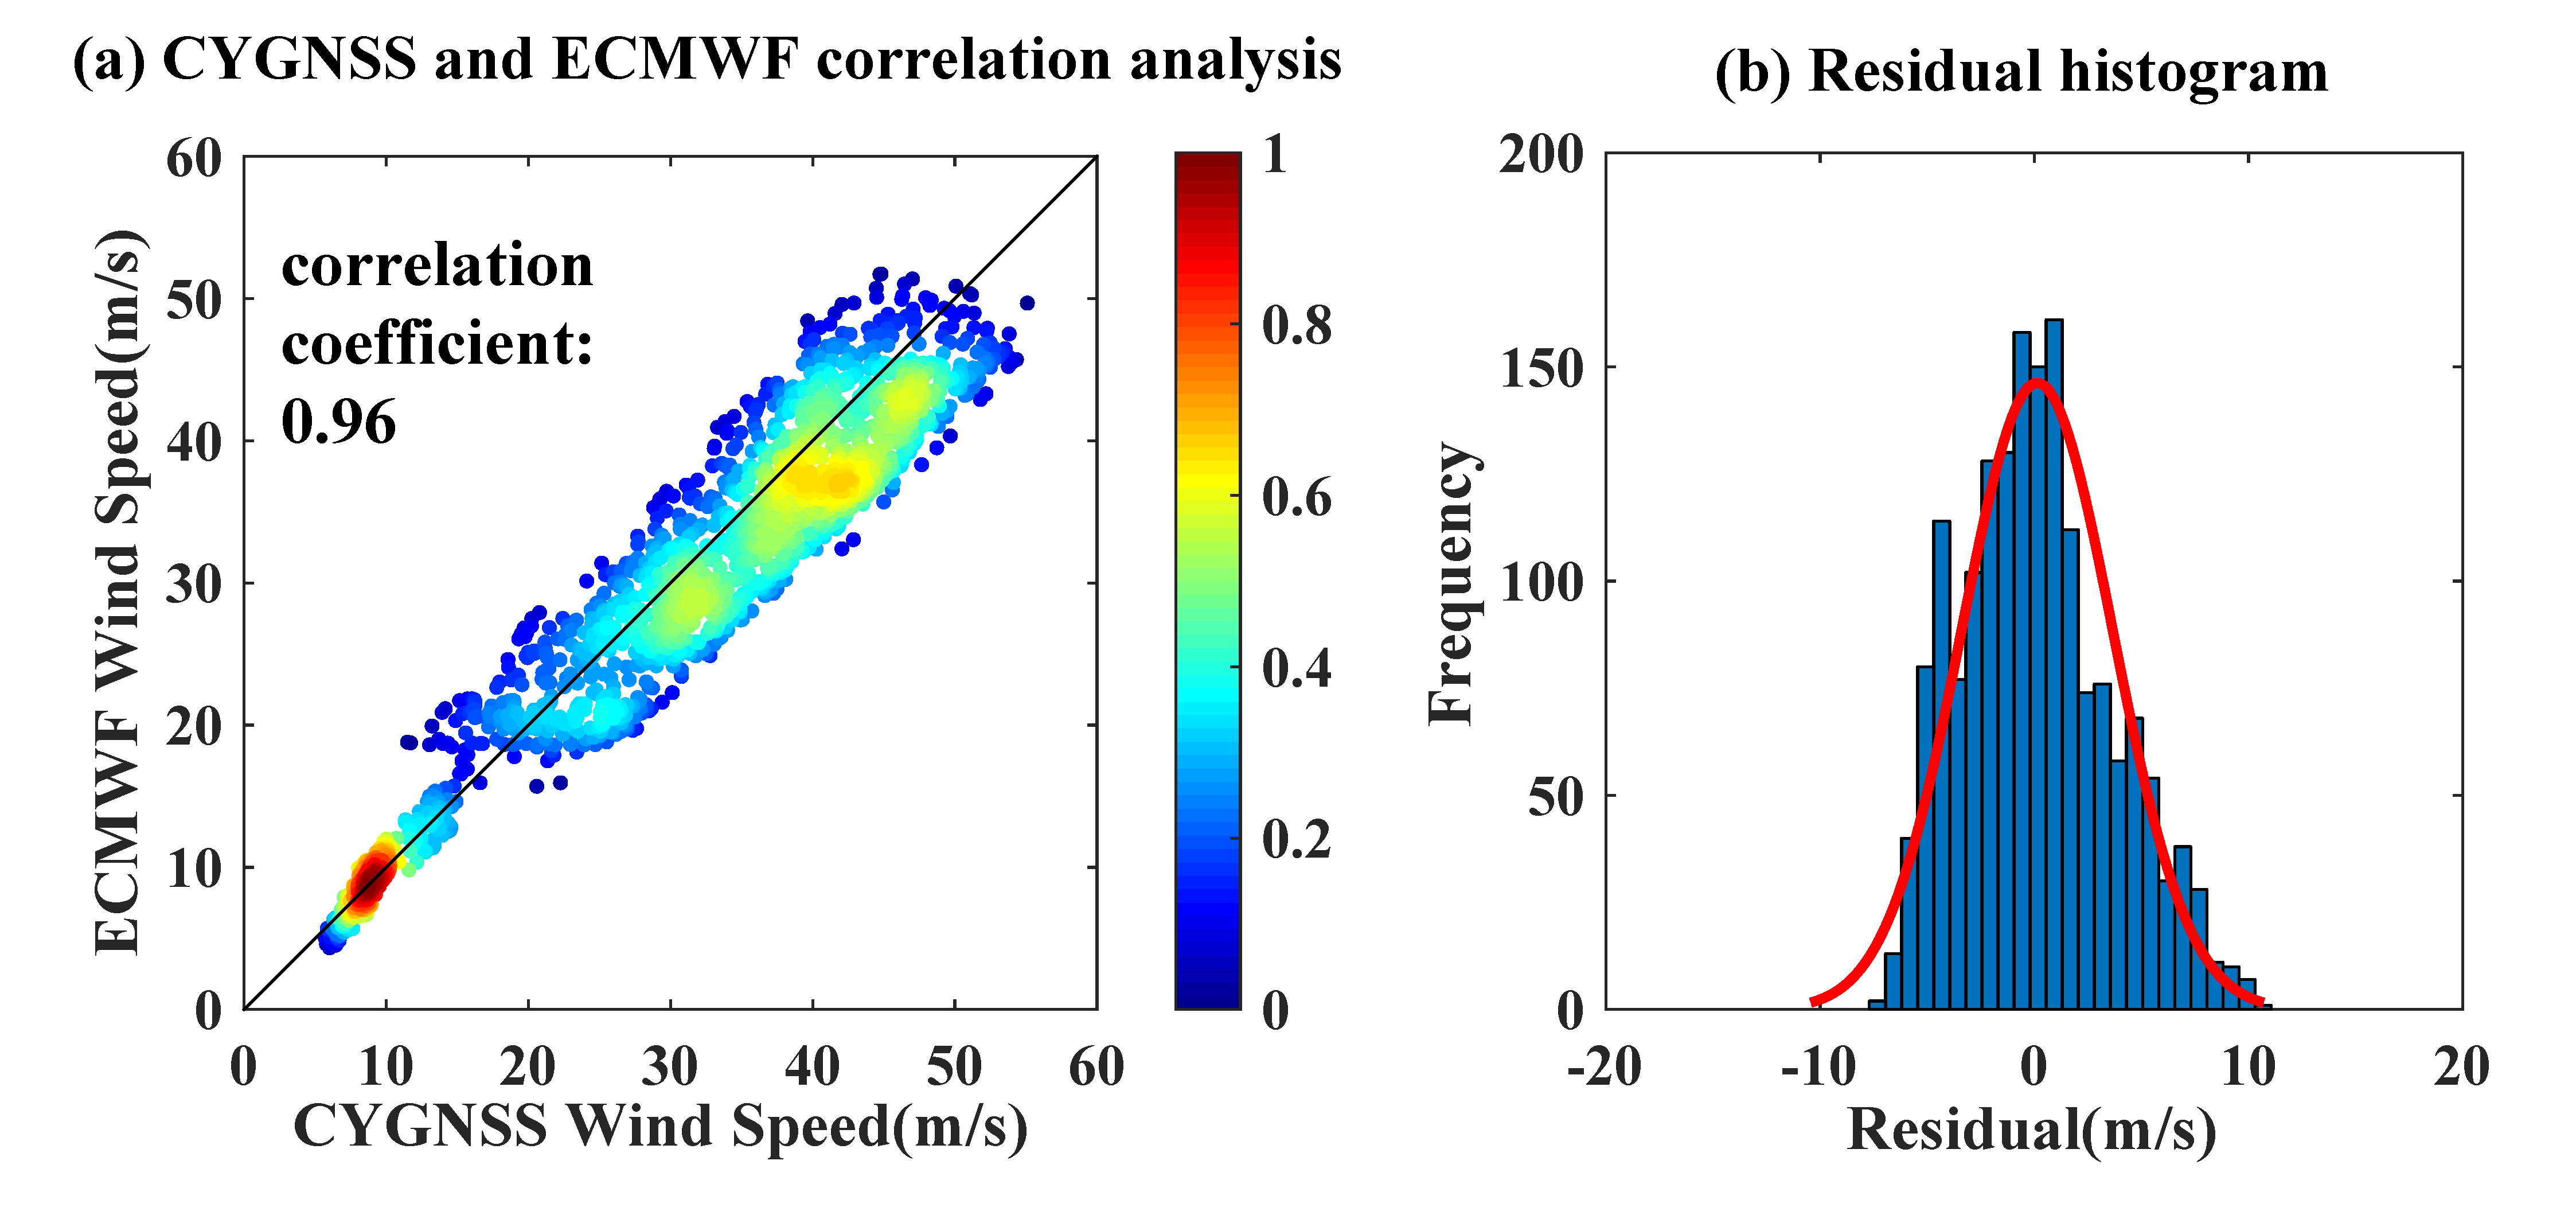
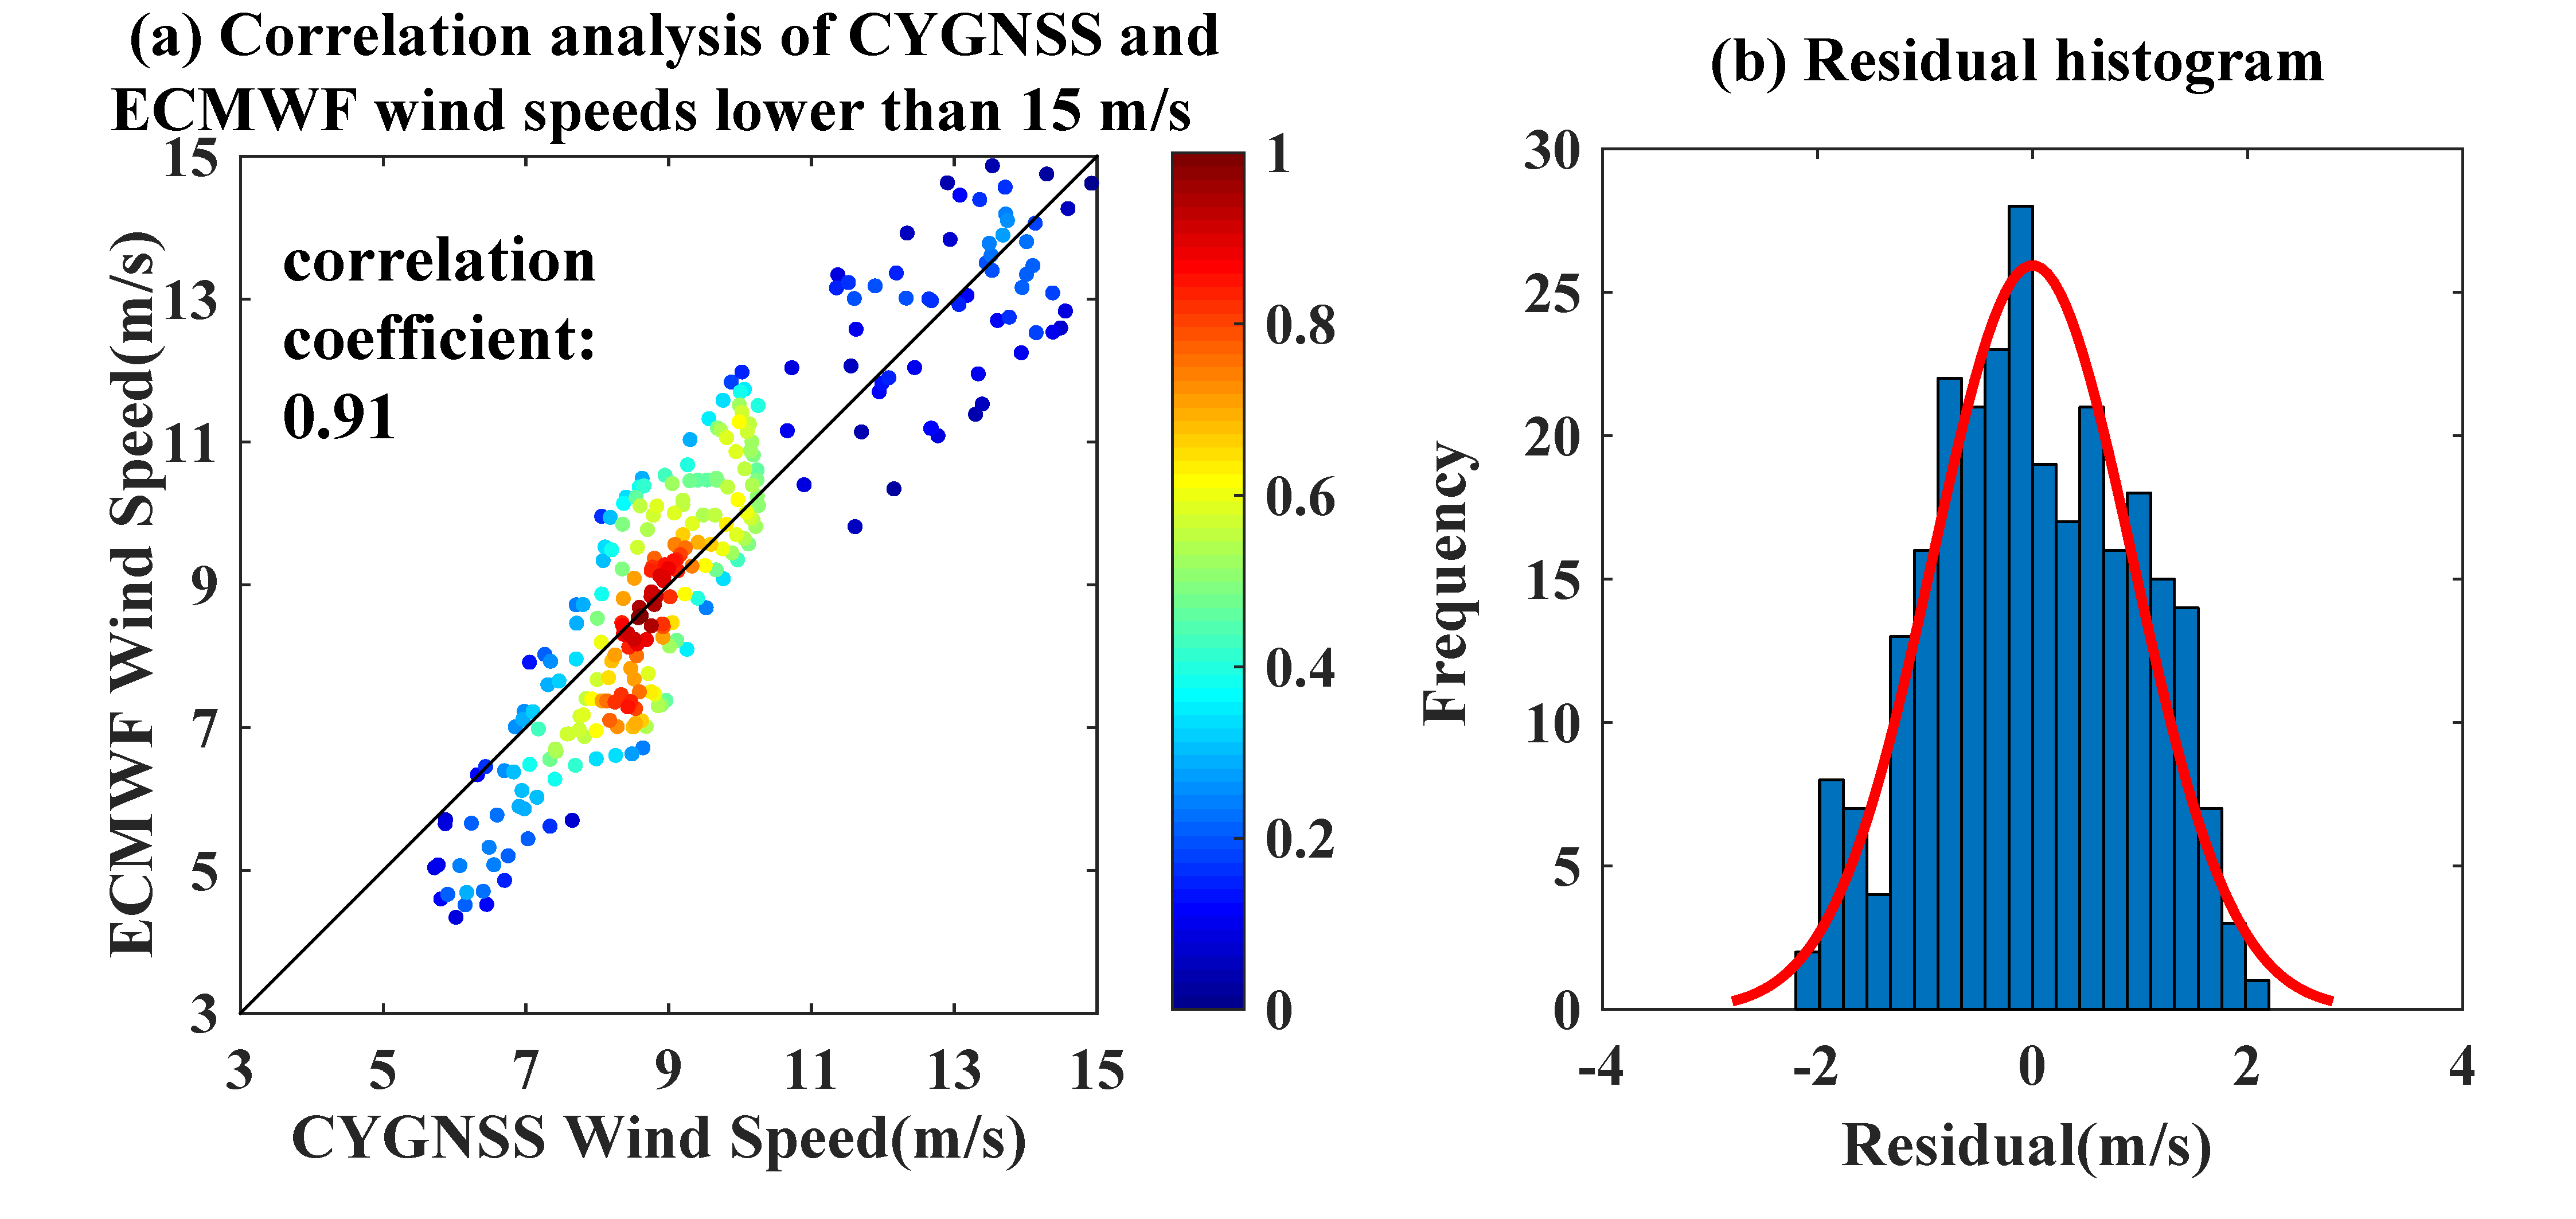
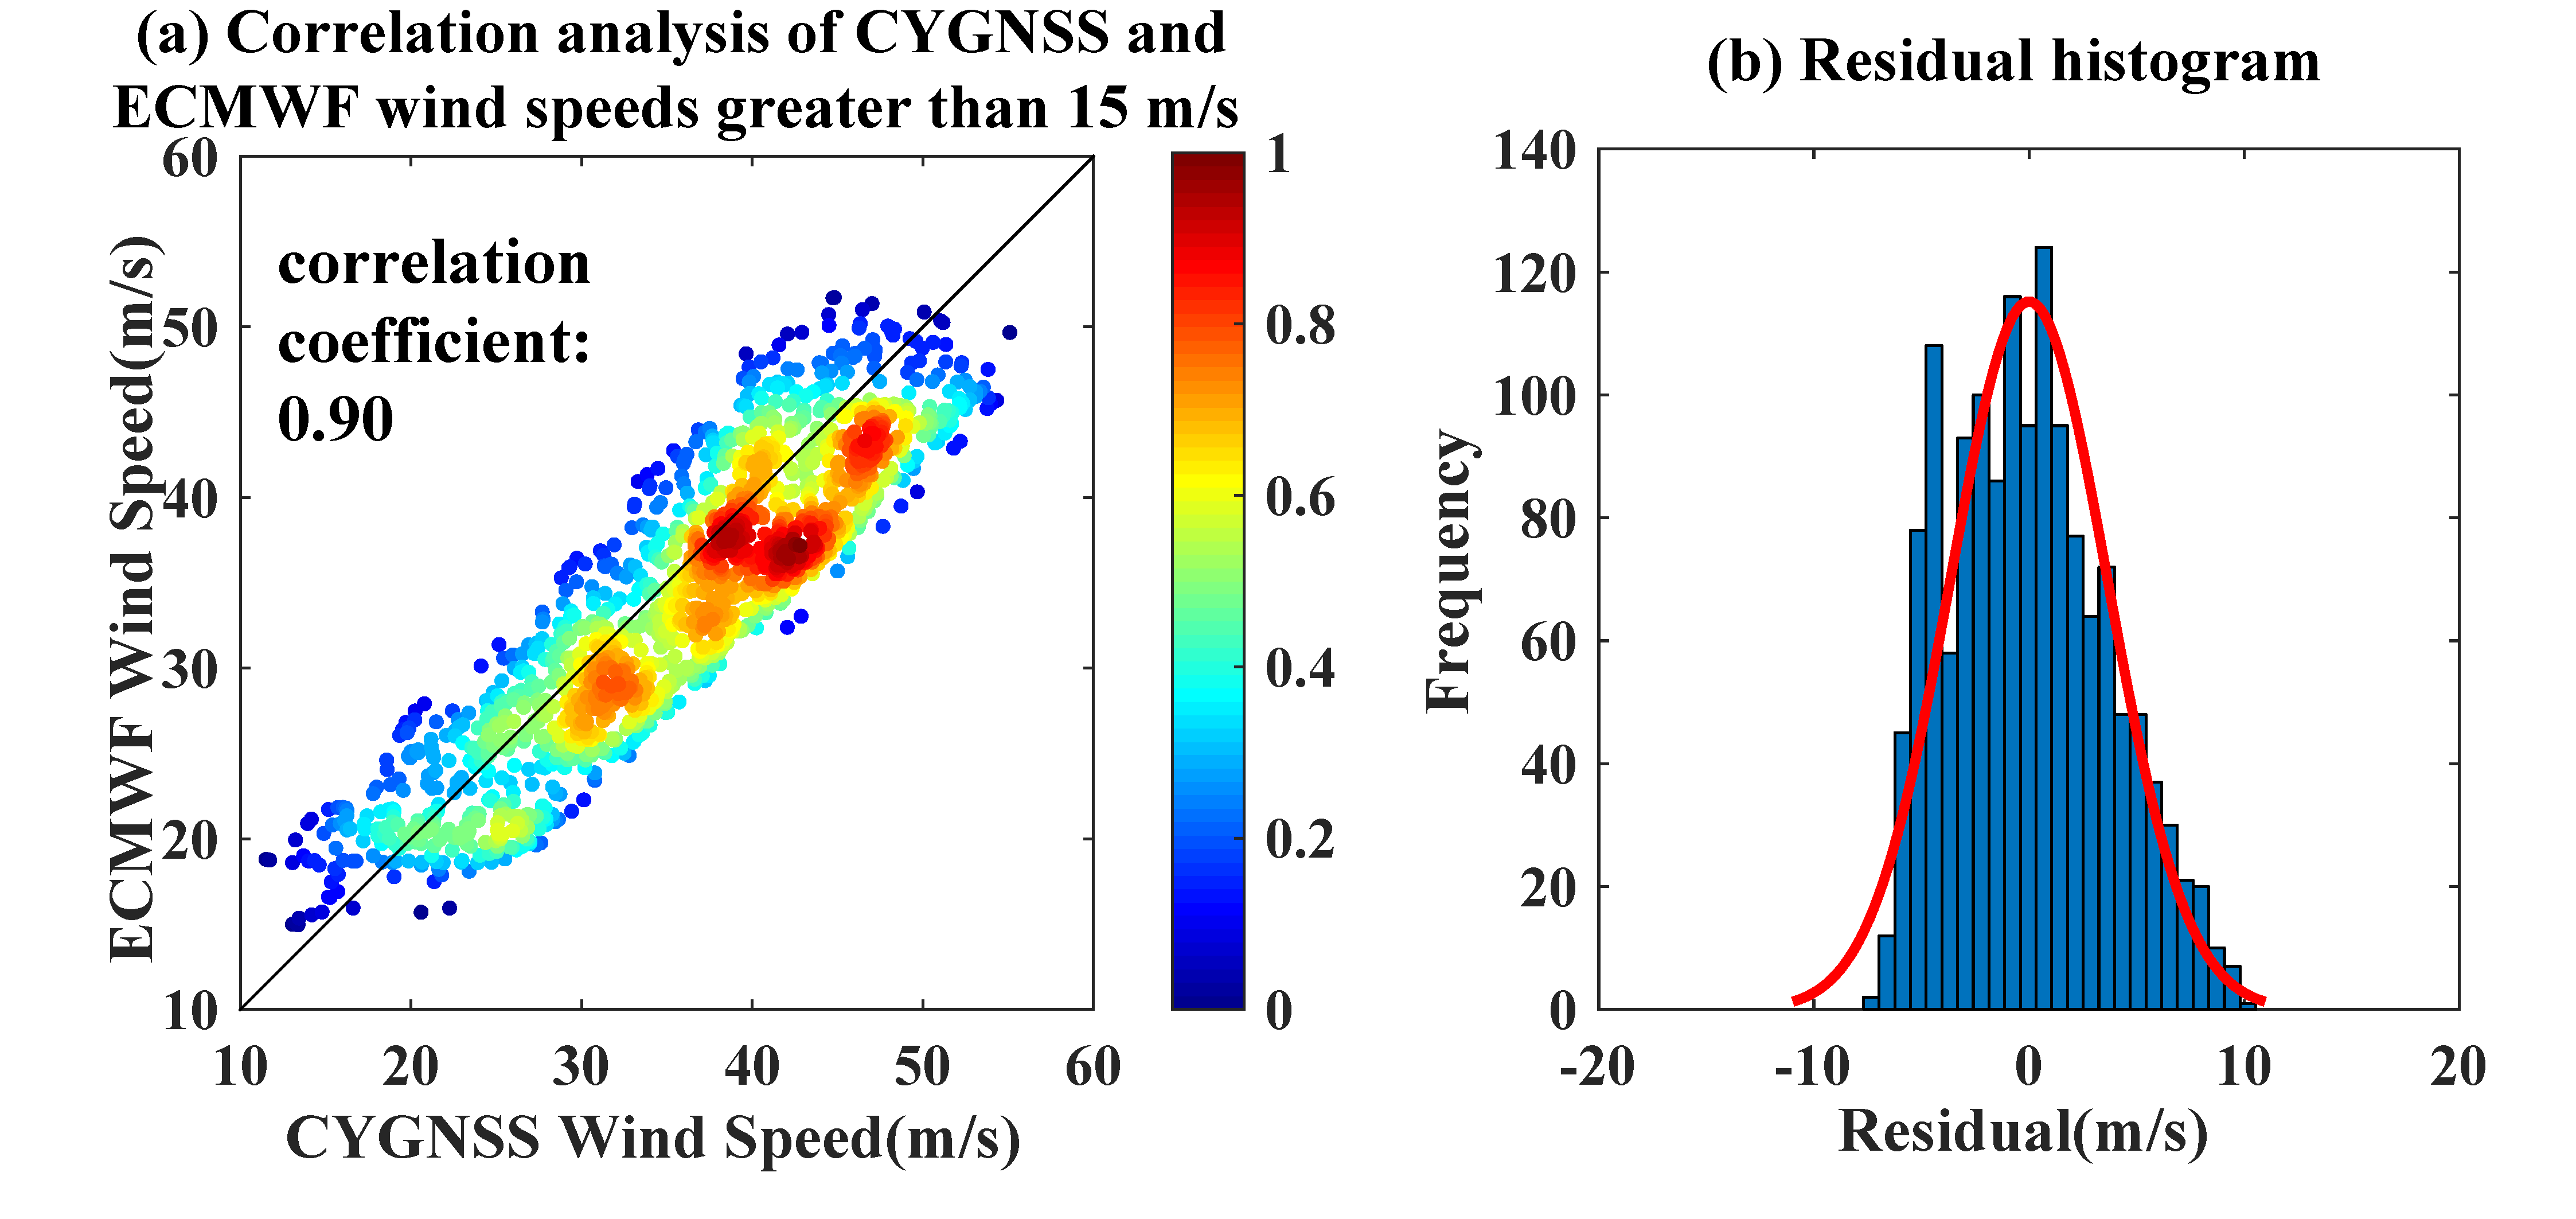
3.1. Evaluation by ERA-5 Data
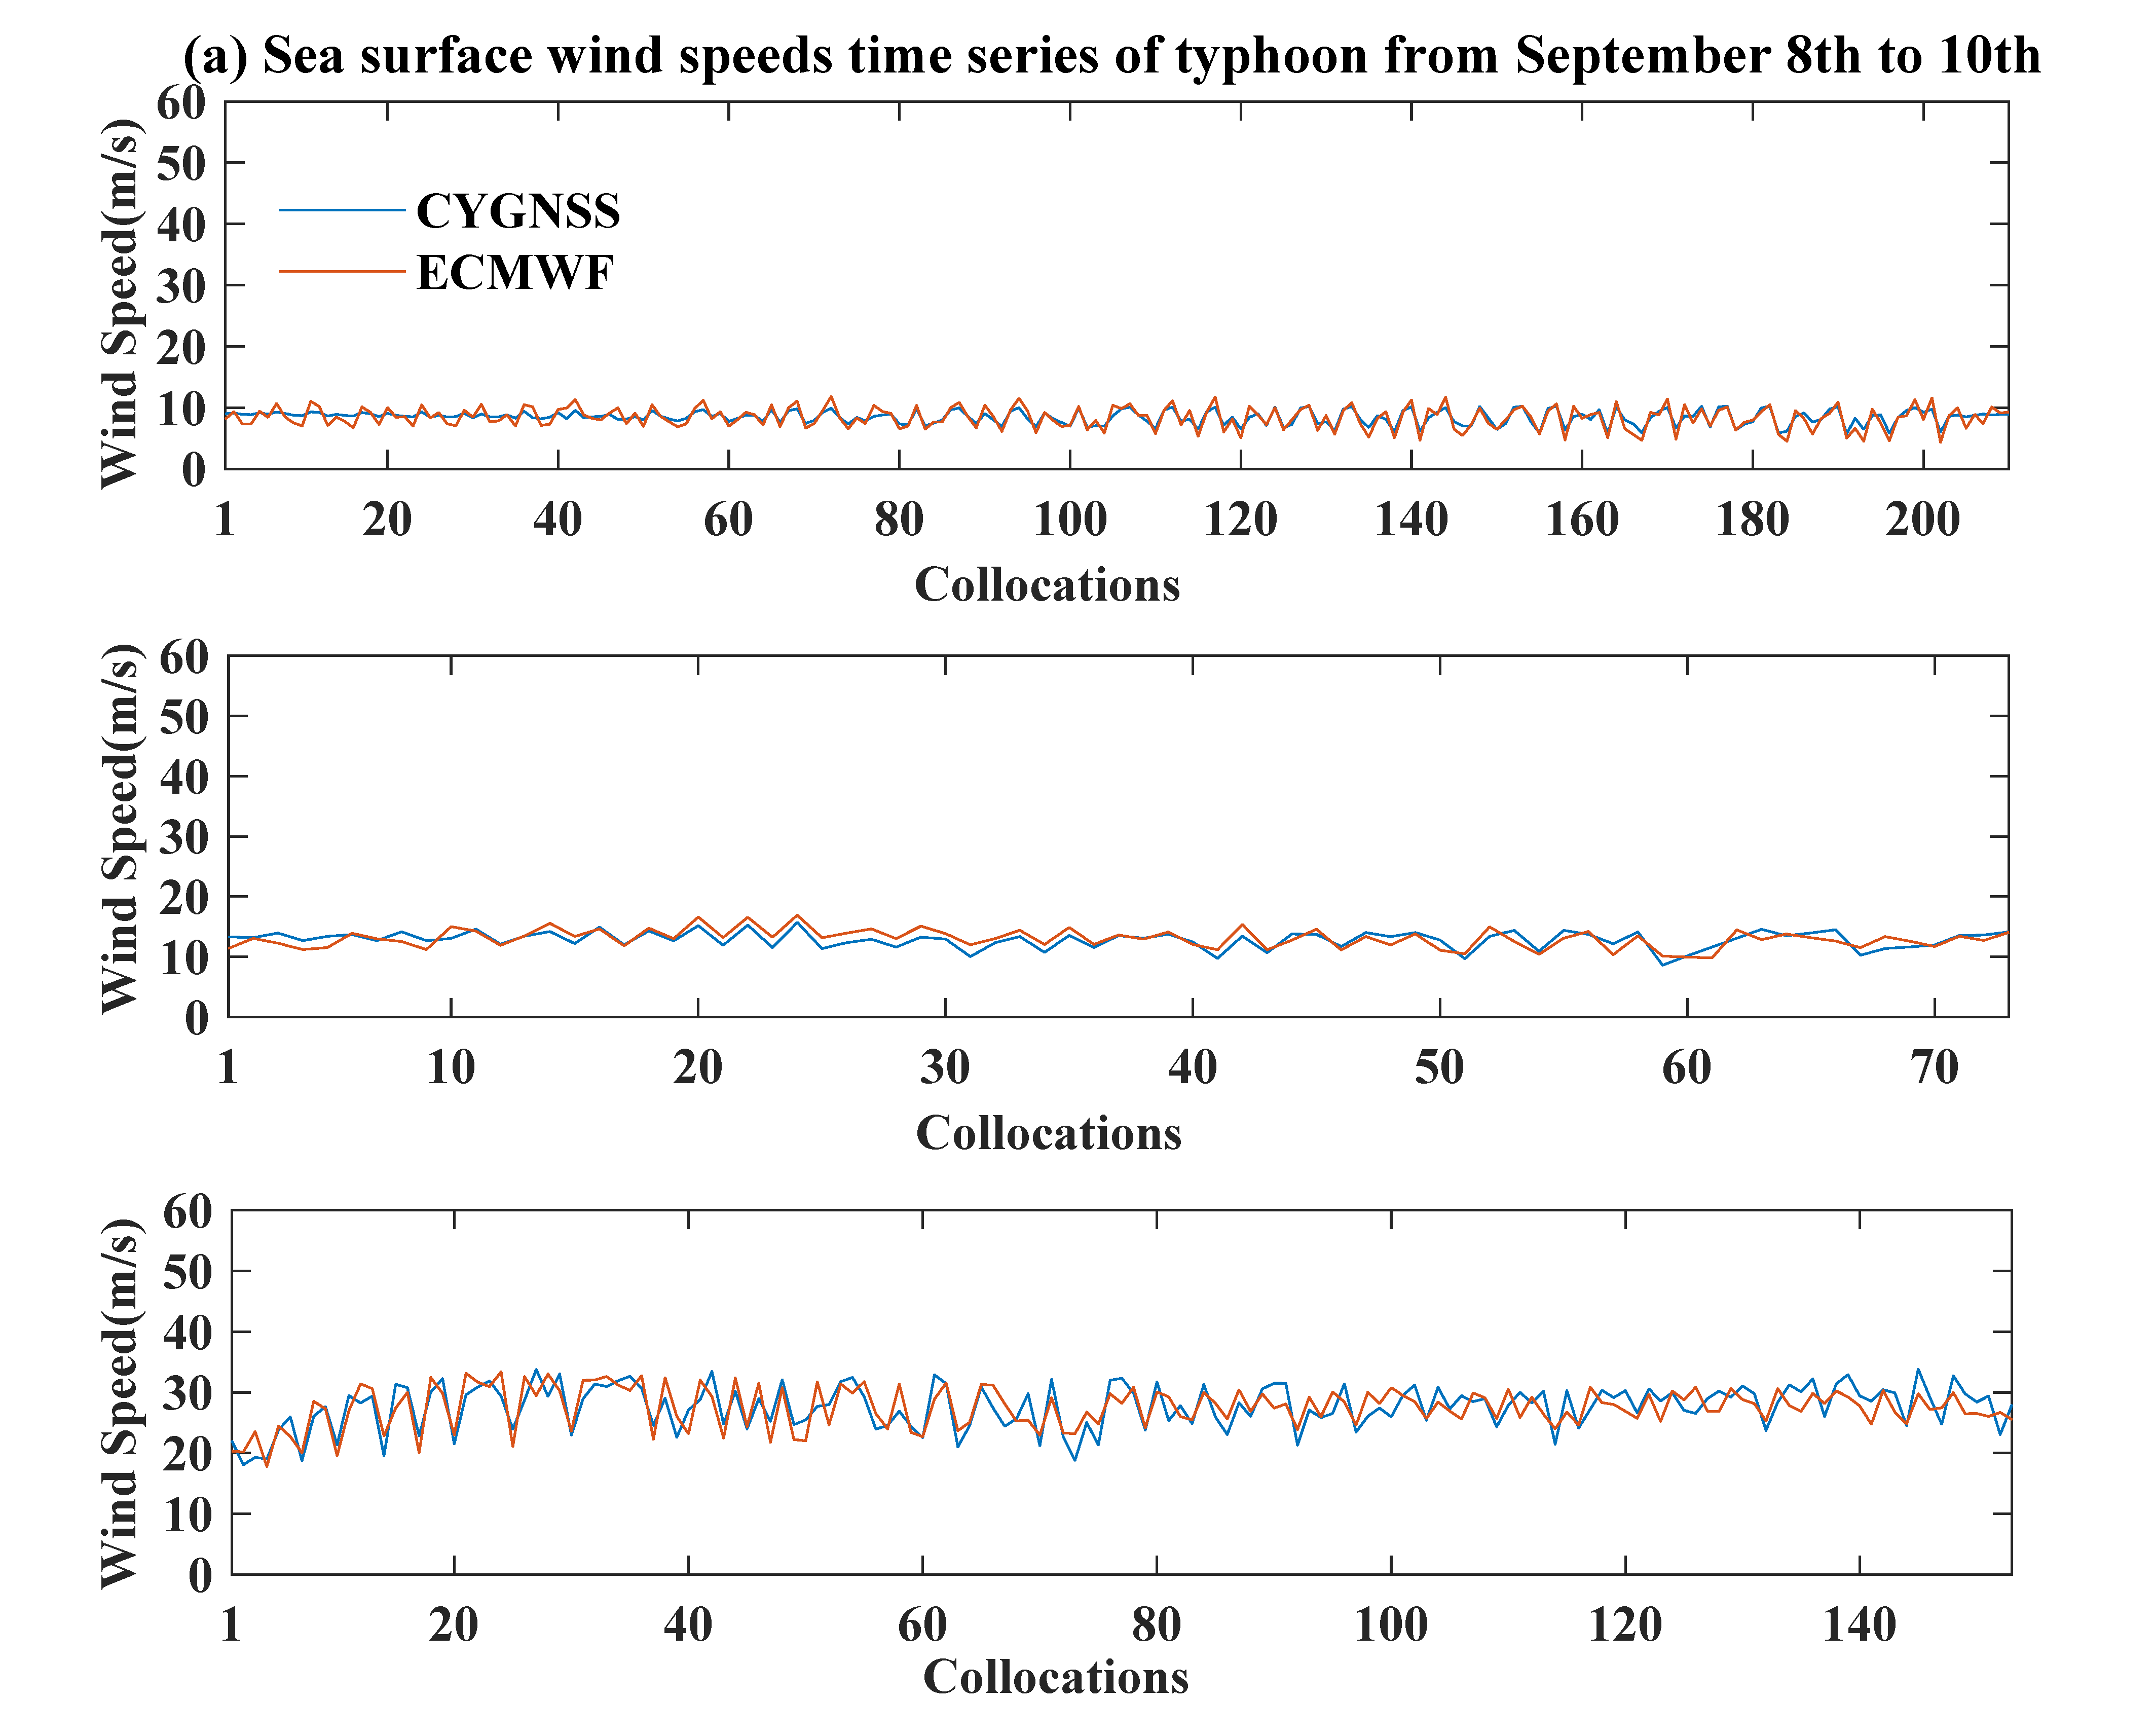
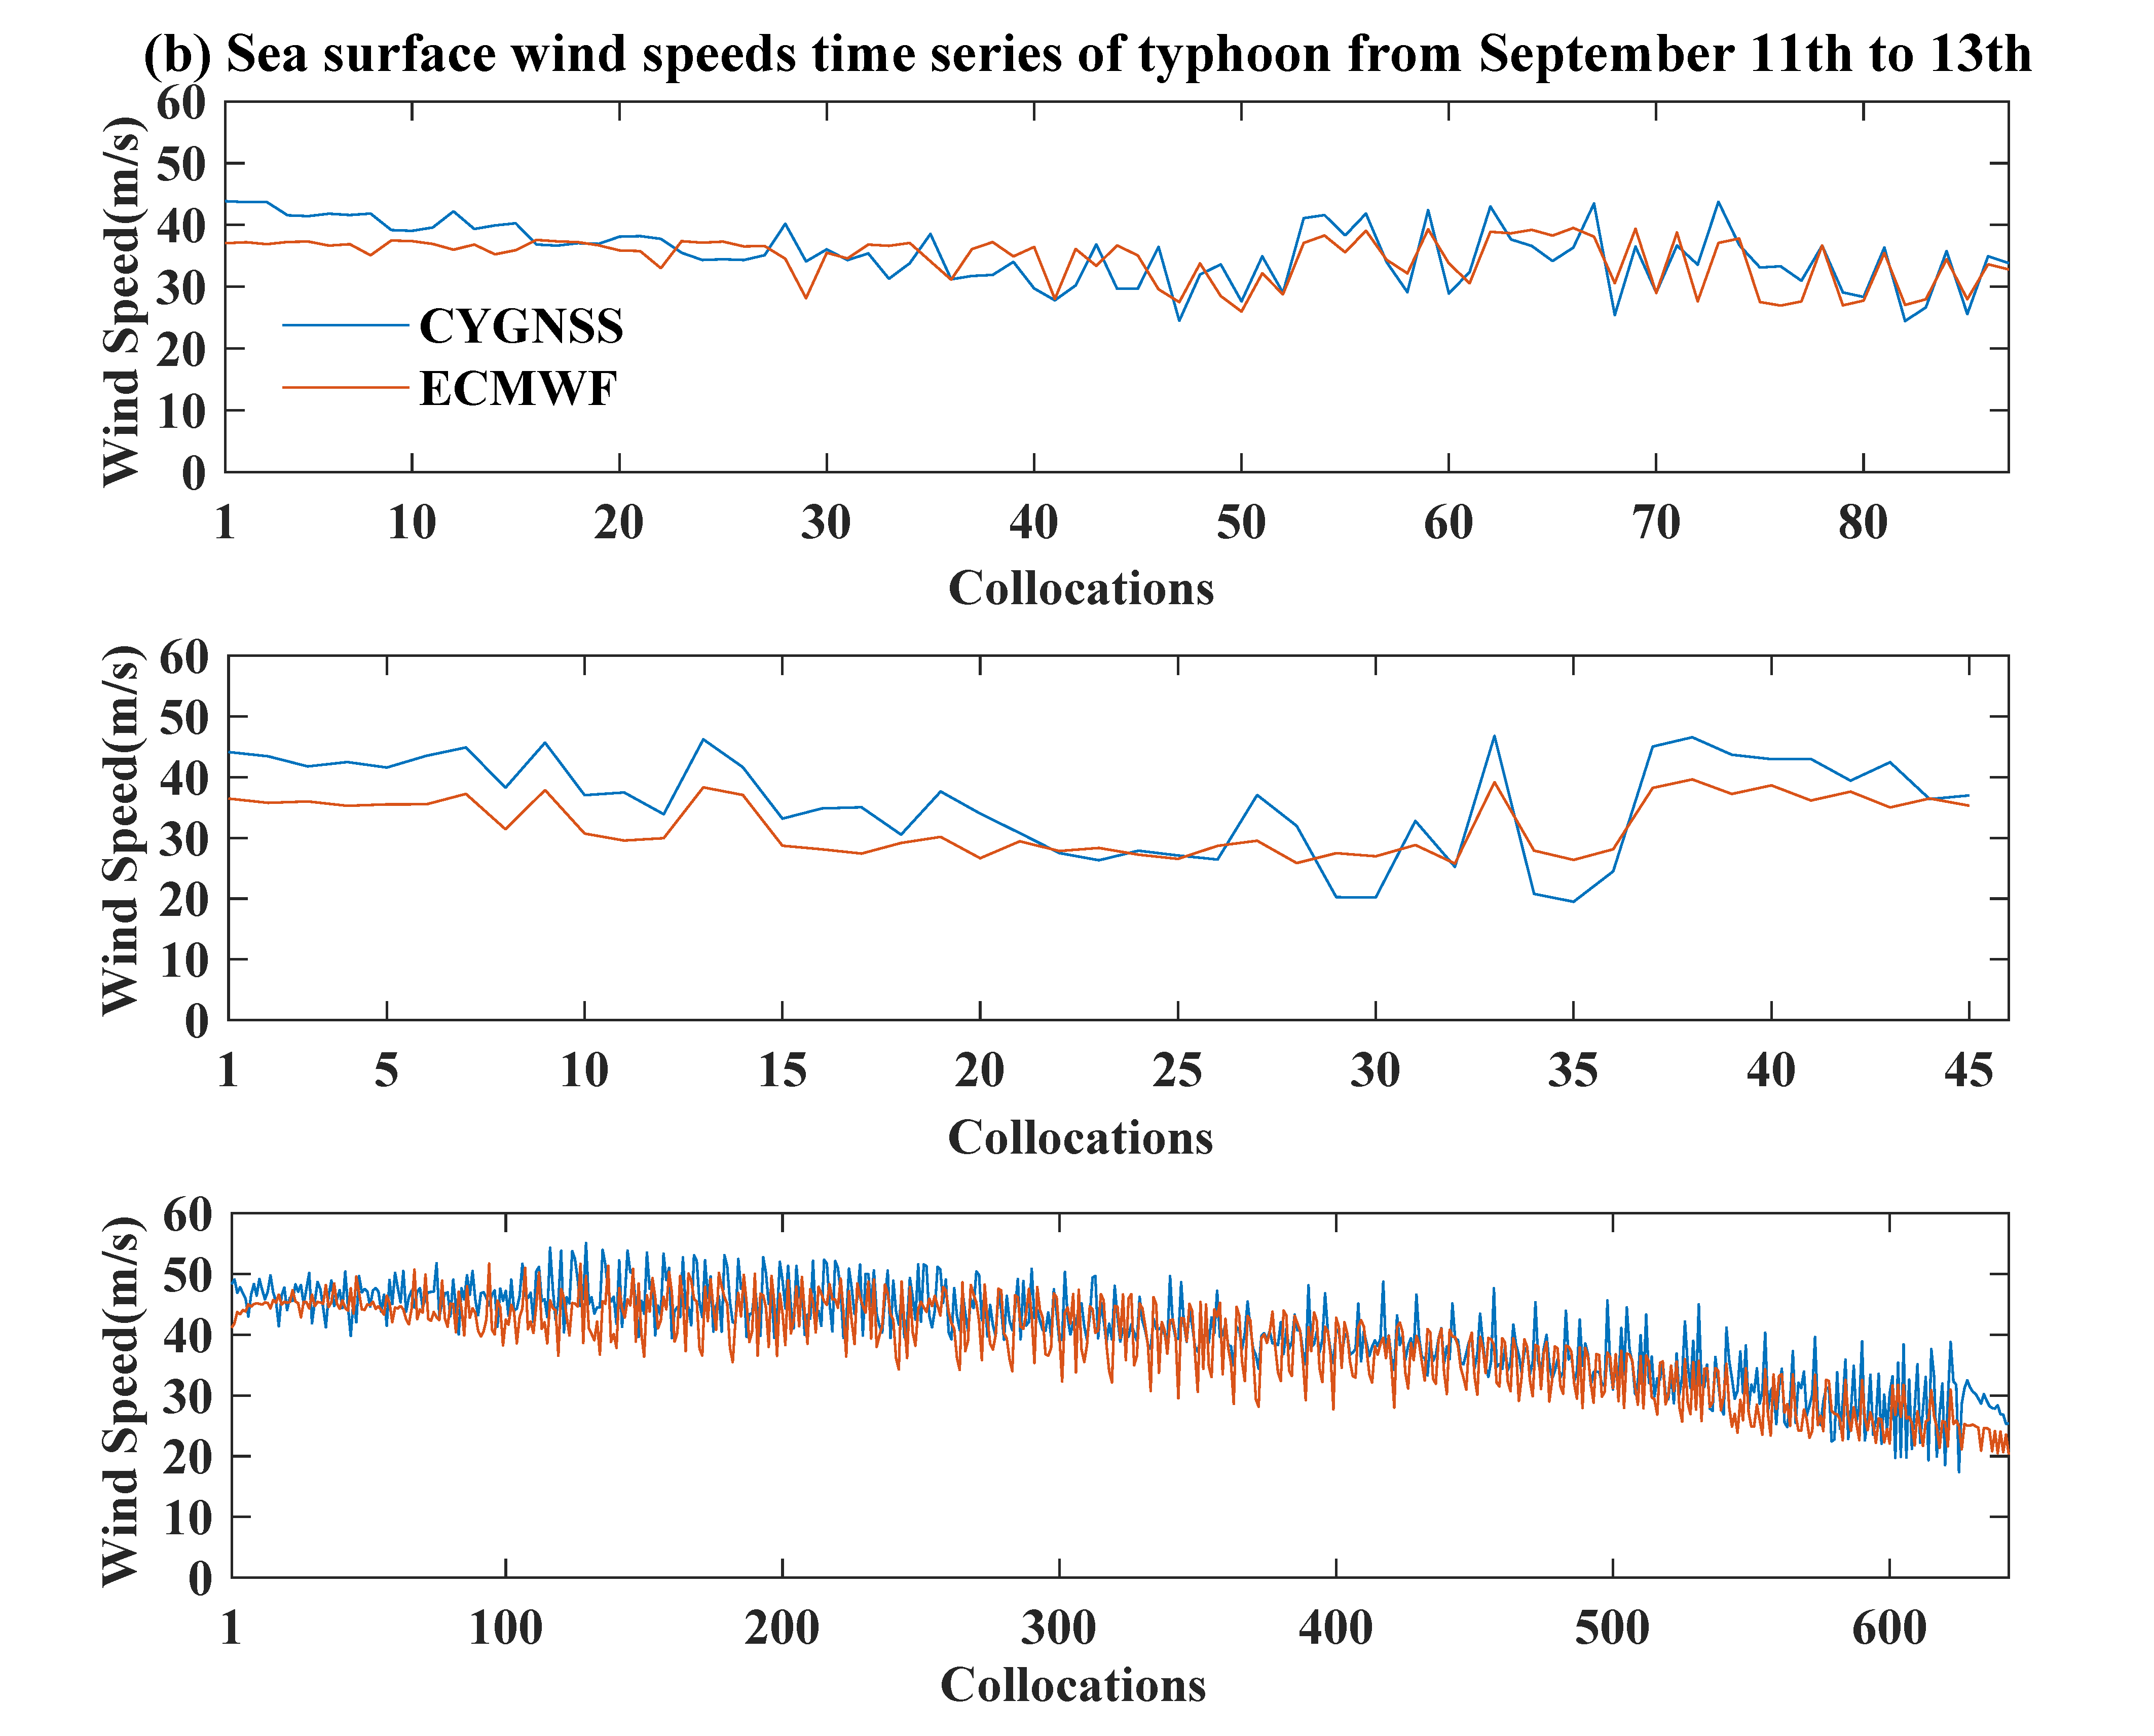
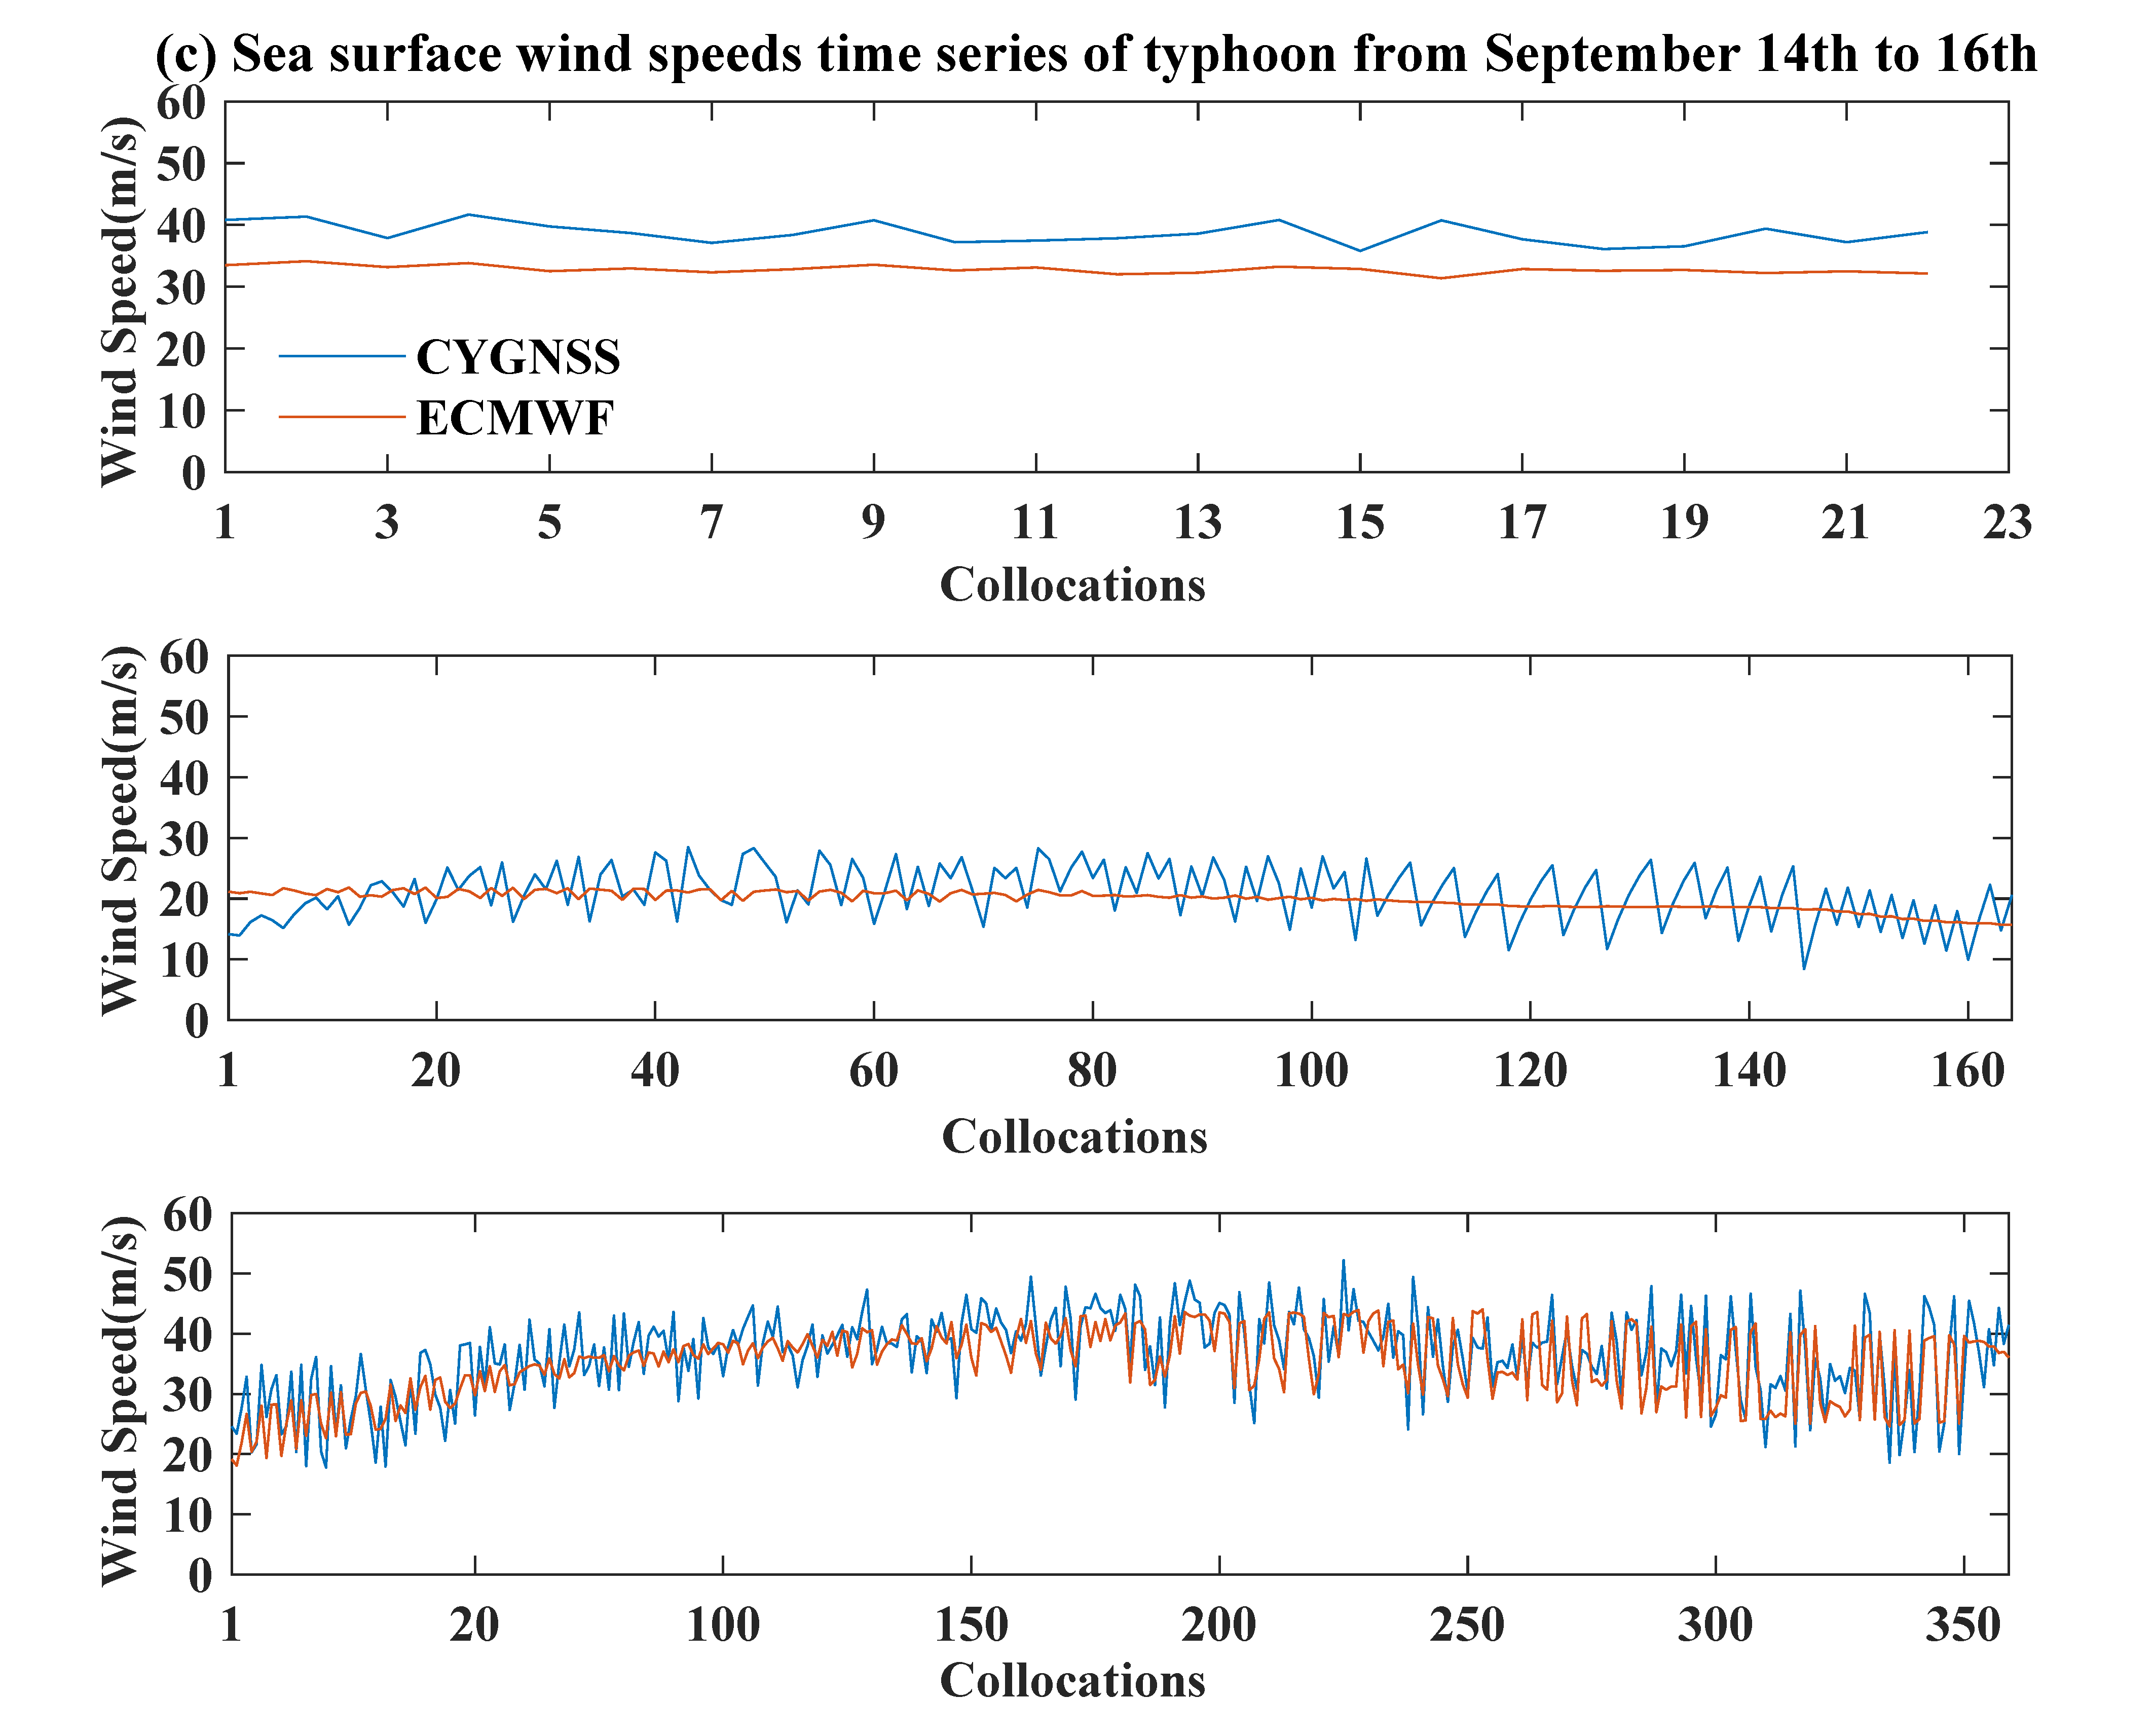
3.2. Variations of Sea Surface Wind Speed
3.3. Discussion
4. Conclusions
Author Contributions
Funding
Acknowledgments
Conflicts of Interest
References
- Dengrong, Z.; Wang, J.; Zhang, Y. Review of typhoon monitoring technology based on remote sensing satellite data. Remote Sens. Technol. Appl. 2013, 28, 994–999. [Google Scholar]
- Yu, J.H.; Tang, J.X.; Dai, Y.H.; Yu, B.Y. Analyses in Errors and Their Causes of Chinese Typhoon Track Operational Forecasts. Meteorol. Mon. 2012, 38, 695–700. [Google Scholar]
- Lei, X.T.; Li, Y.P.; Yu, R.L. A new generation of regional air sea wave coupled typhoon prediction system. Acta Oceanol. 2019, 41, 123–134. [Google Scholar]
- Rogers, R.F.; Reasor, P.D.; Lorsolo, S. Airborne Doppler observations of the inner-core structural differences between intensifying and steady-state tropical cyclones. Mon. Weather Rev. 2013, 141, 2970–2991. [Google Scholar] [CrossRef]
- Jin, S.G.; Su, K. PPP models and performances from single- to quad-frequency BDS observations. Satell. Navig. 2020, 1, 16. [Google Scholar] [CrossRef]
- Jin, S.G.; Komjathy, A. GNSS reflectometry and remote sensing: New objectives and results. Adv. Space Res. 2010, 46, 111–117. [Google Scholar] [CrossRef] [Green Version]
- Jin, S.G.; Feng, G.; Gleason, S. Remote sensing using GNSS signals: Current status and future directions. Adv. Space Res. 2011, 47, 1645–1653. [Google Scholar] [CrossRef]
- Dong, Z.N.; Jin, S.G. Evaluation of spaceborne GNSS-R retrieved ocean surface wind speed with multiple datasets. Remote Sens. 2019, 11, 2747. [Google Scholar] [CrossRef] [Green Version]
- Jin, S.G.; Cardellach, E.; Xie, F. GNSS Remote Sensing: Theory, Methods and Applications; Springer: Amsterdam, The Netherlands, 2014; 276p. [Google Scholar]
- Morris, M.; Ruf, C.S. Estimating tropical cyclone integrated kinetic energy with the CYGNSS satellite constellation. J. Appl. Meteorol. Climatol. 2016, 56, 235–245. [Google Scholar] [CrossRef]
- Cui, Z.Q.; Zhao, X.P.; Tallapragada, V.; Atlas, R.; Ruf, C.S. A preliminary impact study of CYGNSS ocean surface wind speeds on numerical simulations of hurricanes. Geophys. Res. Lett. 2019, 46, 2984–2992. [Google Scholar] [CrossRef] [Green Version]
- Hoover, K.E.; Mecikalski, J.R. Use of an End-to-End-Simulator to analyze CYGNSS. J. Atmos. Ocean. Technol. 2017, 35, 35–55. [Google Scholar] [CrossRef] [PubMed]
- Saïd, F.; Katzberg, S.J.; Soisuvarn, S. Retrieving Hurricane Maximum Winds Using Simulated CYGNSS Power-Versus-Delay Waveforms. IEEE J. STARS 2017, 10, 3799–3809. [Google Scholar] [CrossRef]
- Shi, X.Z.; Zhao, X.P. Impact of CYGNSS ocean surface wind speeds on numerical simulations of a hurricane in observing system simulation experiments. J. Atmos. Ocean. Technol. 2017, 34, 375–383. [Google Scholar]
- Alpert, P.; Neeman, B.U.; Shay-El, Y. Climatological analysis of Mediterranean cyclones using ECMWF data. J. Tellus 1990, 42, 65–77. [Google Scholar] [CrossRef] [Green Version]
- Annane, B.; McNoldy, B.; Leidner, S.M.; Hoffman, R.; Atlas, R.; Majumdar, S.J. A study of the HWRF analysis and forecast impact of realistically simulated CYGNSS observations assimilated as scalar wind speeds and as VAM wind vectors. J. Mon. Weather Rev. 2018, 146, 2221–2236. [Google Scholar] [CrossRef]
- Ruf, C.S. New ocean winds satellite mission to probe hurricanes and tropical convection. Meteorol. Soc. 2015, 97, 835–895. [Google Scholar] [CrossRef]
- Clarizia, M.P.; Ruf, C.S.; Jales, G.P. Spaceborne GNSS-R minimum variance wind speed estimator. J. IEEE Trans. Geosci. Remote Sens. 2014, 52, 6829–6843. [Google Scholar] [CrossRef]
- Clarizia, M.P.; Ruf, C.S. Wind speed retrieval algorithm for the Cyclone Global Navigation Satellite System (CYGNSS) mission. IEEE Trans. Geosci. Remote Sens. 2016, 54, 4419–4432. [Google Scholar] [CrossRef]
- Ruf, C.S.; Balasubramaniam, R. Development of the CYGNSS Geophysical Model Function for Wind Speed. IEEE J. Sel. Top. Appl. Earth Obs. Remote Sens. 2019, 12, 66–77. [Google Scholar] [CrossRef]
- Ruf, C.S.; Chang, P.; Clarizia, M.P.; Gleason, S.; Jelenak, Z. CYGNSS handbook. In Cyclone Global Navigation Satellite Systems; NASA: Ann Arbor, MI, USA, 2016; Volume 4, pp. 1–155. ISBN 978-1-60785-380-0. [Google Scholar]
- Olauson, J. ERA5: The new champion of wind power modelling? J. Renew. Energy 2018, 126, 322–331. [Google Scholar] [CrossRef] [Green Version]
- Jin, S.G.; Zhang, Q.; Qian, X. New progress and application prospects of Global Navigation Satellite System Reflectometry (GNSS+R). ACTA Geod. Cartograph. Sin. 2017, 46, 1389–1398. [Google Scholar]
- Jin, S.G.; Qian, X.; Wu, X. Sea level change from BeiDou Navigation Satellite System-Reflectometry (BDS-R): First results and evaluation. Global Planet. Change 2017, 149, 20–25. [Google Scholar] [CrossRef]


| Date | Typhoon Development Stage | CYGNSS/ECMWF Average Wind Speed (m/s) | Deviation (m/s) | CYGNSS/ECMWF Maximum Wind Speed (m/s) | Deviation (m/s) |
|---|---|---|---|---|---|
| September 8th | Severe tropical storm | 8.5/8.4 | 0.1 | 10.3/11.8 | −1.5 |
| September 9th | typhoon | 12.8/13 | −0.2 | 15.7/16.9 | −1.2 |
| September 10th | typhoon | 27.6/27.5 | 0.1 | 33.8/33.4 | 0.4 |
| September 11th | Super typhoon | 35.4/34.5 | 0.9 | 43.9/39.5 | 4.4 |
| September 12th | Super typhoon | 35.8/32.1 | 3.7 | 46.8/39.6 | 7.2 |
| September 13th | Super typhoon | 40.5/38.3 | 2.2 | 55.1/51.7 | 3.4 |
| September 14th | Super typhoon | 38.7/32.8 | 5.9 | 41.7/34.1 | 7.6 |
| September 15th | Super typhoon | 20.8/19.8 | 1 | 28.5/21.8 | 6.7 |
| September 16th | Strong typhoon | 36.4/35 | 1.4 | 52.2/44.1 | 8.1 |
| CYGNSS | ECMWF Reanalysis Data | ||
|---|---|---|---|
| Latitude(N) | Longitude(E) | Latitude(N) | Longitude(E) |
| 13.8 | 161.8 | 13.7 | 161.3 |
| 15.2 | 155.3 | 15.2 | 155.3 |
| 14.8 | 148.1 | 15.5 | 146.8 |
| 14.2 | 142.2 | 13.8 | 141.2 |
| 14.5 | 137.3 | 14.5 | 137.2 |
| 15.2 | 131.5 | 15.2 | 131.8 |
| 14.4 | 128 | 14.3 | 128 |
| 15.8 | 126.1 | 15.2 | 126 |
| 21.6 | 116.6 | 21.9 | 116.1 |
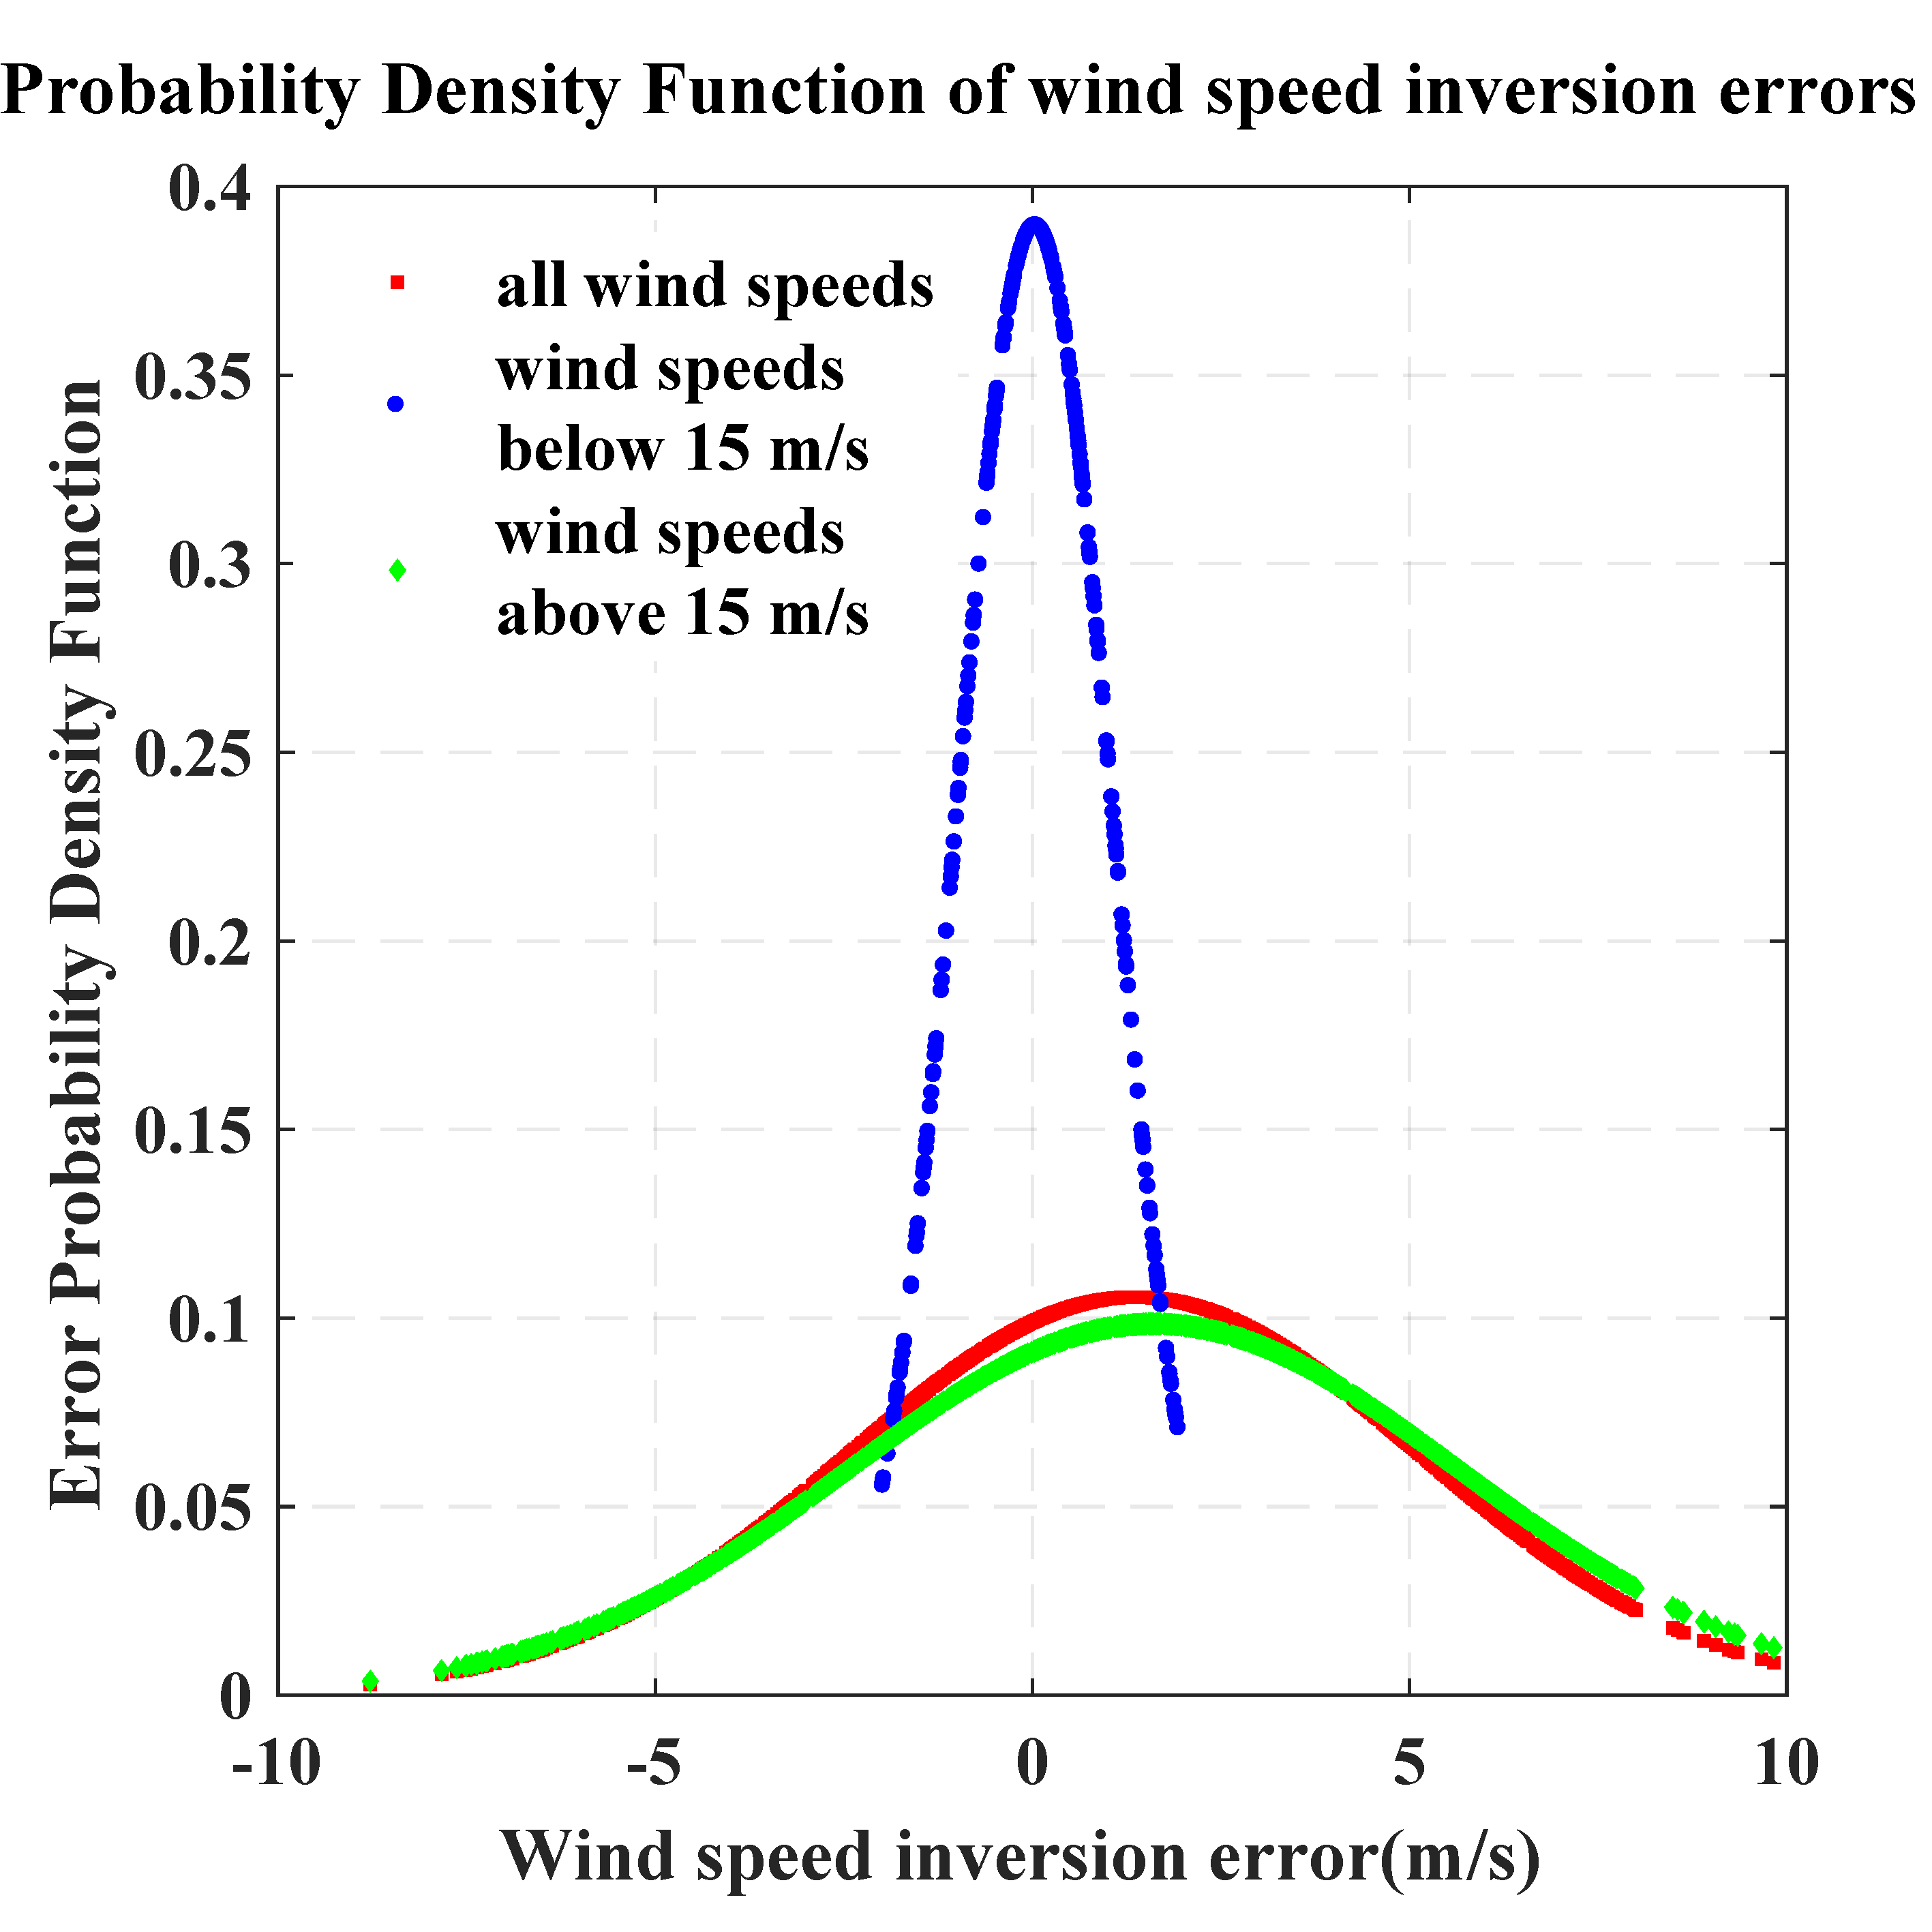
| Wind Speed | Mean Error (m/s) | Mean Absolute Error (m/s) | Number of Positive Bias | Number of Negative Bias |
|---|---|---|---|---|
| <15 m/s | 0.05 | 0.84 | 147 | 128 |
| >15 m/s | 1.61 | 3.70 | 939 | 508 |
© 2020 by the authors. Licensee MDPI, Basel, Switzerland. This article is an open access article distributed under the terms and conditions of the Creative Commons Attribution (CC BY) license (http://creativecommons.org/licenses/by/4.0/).
Share and Cite
Liu, H.; Jin, S.; Yan, Q. Evaluation of the Ocean Surface Wind Speed Change following the Super Typhoon from Space-Borne GNSS-Reflectometry. Remote Sens. 2020, 12, 2034. https://doi.org/10.3390/rs12122034
Liu H, Jin S, Yan Q. Evaluation of the Ocean Surface Wind Speed Change following the Super Typhoon from Space-Borne GNSS-Reflectometry. Remote Sensing. 2020; 12(12):2034. https://doi.org/10.3390/rs12122034
Chicago/Turabian StyleLiu, Hongsu, Shuanggen Jin, and Qingyun Yan. 2020. "Evaluation of the Ocean Surface Wind Speed Change following the Super Typhoon from Space-Borne GNSS-Reflectometry" Remote Sensing 12, no. 12: 2034. https://doi.org/10.3390/rs12122034
APA StyleLiu, H., Jin, S., & Yan, Q. (2020). Evaluation of the Ocean Surface Wind Speed Change following the Super Typhoon from Space-Borne GNSS-Reflectometry. Remote Sensing, 12(12), 2034. https://doi.org/10.3390/rs12122034