Abstract
Augmented reality can improve construction and facility management by visualizing an as-planned model on its corresponding surface for fast, easy, and correct information retrieval. This requires the localization registration of an as-built model in an as-planned model. However, the localization and registration of indoor environments fail, owing to self-similarity in an indoor environment, relatively large as-planned models, and the presence of additional unplanned objects. Therefore, this paper proposes a computer vision-based method to (1) homogenize indoor as-planned and as-built models, (2) reduce the search space of model matching, and (3) localize the structure (e.g., room) for registration of the scanned area in its as-planned model. This method extracts a representative horizontal cross section from the as-built and as-planned point clouds to make these models similar, restricts unnecessary transformation to reduce the search space, and corresponds the line features for the estimation of the registration transformation matrix. The performance of this method, in terms of registration accuracy, is evaluated on as-built point clouds of rooms and a hallway on a building floor. A rotational error of 0.005 rad and a translational error of 0.088 m are observed in the experiments. Hence, the geometric feature described on a representative cross section with transformation restrictions can be a computationally cost-effective solution for indoor localization and registration.
1. Introduction
For construction and facility management, the onsite visualization of design- and project-related data is crucial to capture, manipulate, transform, and communicate information associated with a particular structure or building component. For example, information specific to a certain location needs to be accessed and visualized for the assembly or construction of building elements [1], evaluation of the as-built status [2,3], communication of discrepancies for onsite decision-making [4], and localization of components for maintenance of the facility [5]. The effective means of visualization, which provide relevant information at the right location in a timely manner, can thus facilitate easy information retrieval [6] and a better understanding of design and construction [7] for the reduction of time and cost in construction and facility management [8,9,10].
Traditionally, 2D drawings, generated even when 3D as-planned models are available, have been delivered onsite to analyze and understand how the product is built. In this practice, in general, one manually searches for specific drawings corresponding to the location and perceptually overlays the plans onto their view for understanding and comparing a real-world and virtual design. This physical and mental process can be cumbersome and time-consuming [4,11,12,13,14], especially in the case of a very complex project. Extracting specific information obtained from these papers often requires special training and expertise [15]. The time consumed in understanding a drawing and creating a corresponding mental model is considered as cognitive time; in assembling tasks, cognitive time may exceed up to 50% of the total activity time [12]. In addition, information retrieval from 2D drawings is prone to errors owing to short memory usage [12] and poor spatial perception of the design [10]. For instance, humans have three types of memories: sensory, short-term, and long-term. Information extracted from drawings is stored in the short-term memory [16], and hence, it needs to be used quickly for accurate memory and implementation. The continuous domain switching between the paper and construction activity or the large amount of information in the short-term memory may cause mental fatigue, leading to errors in construction [8,15]. Moreover, humans use spatial cognition to create a mental model, which requires reference of real objects, to locate objects and imagine the model’s size in a mental space. Traditional methods of model representations (e.g., 2D drawings and plans) may make it difficult to develop spatial perception, thus leading to poor understanding. Hou et al. [15] reported that 60% of errors are caused by following the wrong procedure owing to a misunderstanding of the construction manuals. Consequently, traditional methods of design information retrieval and visualization (i.e., 2D drawings) can be time-consuming and error-prone because these means of visualization may cause metal fatigue due to short-term memory usage and lead to poor design understanding due to the absence of spatial perception.
To facilitate onsite information retrieval in a visualized and interactive manner, this paper proposes a point cloud-based localization and registration method that can superimpose an as-planned model (e.g., 3D building information model (BIM)) on a real-world surface shown through a portable augmented reality device (e.g., Microsoft HoloLens). For this visualization, localization is performed to recognize the location of the model components being visualized by roughly estimating the relative position of the sensor (i.e., a user) in a virtual coordinate of BIM. The localization can thus lead to a reduction in search spaces for spatial comparisons between the two models. Registration is then applied for precise matching of point clouds extracted from BIM with those representing the current scene captured by a sensing device. This study thus presents vision-based approaches for the localization and registration of two different models with a focus on indoor environments where GPS-type sensors may not be applicable for localization. By implementing an augmented-reality environment, relevant parts of the information linked to BIM can potentially be extracted and visualized quickly in the field. This can assist in improving a user’s spatial perception of the physical model and result in better understanding of the design and reduction in implementation errors.
The rest of the paper is organized as follow: Section 2 provides a review of literature on localization and registration, discussing the limitations in previous studies, Section 3 describes the proposed method which mainly includes (a) point cloud reconstruction, (b) parameter optimization, and (c) localization and registration, Section 4 describes the experiments conducted to select model parameters and evaluate the overall performance of the proposed method, Section 5 presents the experimental results, Section 6 discusses the results from a technical perspective, and finally, Section 7 summarizes the major findings of this study.
2. Literature Review
Augmented reality is a process of superimposing and visualizing a virtual model on a real-world surface. Thus, its implementation can reduce the information search time by placing the information right on the associated structure or building component, as well as reduce the mental workload caused by cognition in domain switching [3,8,9]. Other benefits include availing humans’ spatial cognition ability to create a better mental model, in return potentially leading to the reduction of 82% of assembling errors [8] and making the error detection in piping design 71% faster than that in the traditional methods (e.g., computer-assisted view) [10]. The experiment results obtained by Chu et al. [6] showed that an augmented reality-based method of information retrieval for facility management was considerably faster than a 2D drawing-based method.
To implement augmented reality, there are typically two approaches using a portable device: marker-based and marker-less. For the former, artificial markers, such as ID markers [17], QR codes [18,19], and infrared markers [20], have been used for the sensor’s localization (i.e., the user). In this approach, the orientation of a digital model relative to a marker is pre-defined such that the digital model is visualized through a device overlaid on a real-world surface in a pre-defined pose when a specific marker is recognized in the view of a camera. However, this marker-based approach requires a set of markers to be pre-installed on the construction jobsite, which may be cumbersome to install and easy to be damaged and occluded in dynamic construction environments. By contrast, marker-less implementation uses images [5] or point clouds [21] instead of markers to locally align a digital model with a real-world scene view by estimating the camera view pose of the image or matching the digital model with the point clouds extracted from a real environment, respectively. This alignment of real-world data (e.g., image or point cloud) with a digital model is called registration. However, despite this advantage that no pre-installed marker is required, the registration in a marker-less approach can often fail when the digital model is very large and has self-similarities (e.g., similar rooms in an as-planned model of a building). For example, a large digital model can increase the complexity of image or point cloud matching for the registration, and also, the self-similarity of indoor environments may cause ambiguity in similar locations. To overcome this complexity and ambiguity in visual data matching, localization of an image or point clouds of the scene is undertaken to determine the current position and orientation of real-world data in a virtual environment (e.g., point cloud space); in this way, the search space in a large digital model can be reduced, by which the accuracy can also be improved. In this context, this paper focuses on the localization and registration of point clouds of built environments (i.e., as-built models) with a digital model, such as a BIM (i.e., an as-planned model), which are used to implement marker-less augmented reality.
2.1. Localization
Localization is a process of finding the real or relative position and orientation of a user’s device in a real world or in a virtual model of a jobsite or facility. One of the common methods for localization is the use of sensors, such as radio frequency identification [22,23,24], Beacon [25], and wireless local area network [26]. These methods typically include signal sources at fixed positions and a receiver of signals carried by the user. The location of the user is then calculated based on the received signal strength indicators, angle of arrival, and time of arrival of signals [24]. However, this approach requires a network of sensors to be pre-installed on the jobsite, similar to the case of maker-based methods.
Unlike sensor-based localization, the use of images allows for an estimation of the location where an image is taken, by comparing an image of the scene with either (i) a point-cloud model constructed from images (i.e., image localization) or (ii) the images pre-captured or virtually generated from a digital model, such as BIM (i.e., image retrieval). For the former, 3D point clouds of the environment are first pre-generated from images, and then a queried image of the scene is identified and localized in the point cloud space by quantitatively comparing the image to the 3D point cloud by using feature descriptors for the matching. In this process, feature descriptors are extracted on the keypoints (e.g., corners of objects) that represent the local geometry of an object well on the image or in 3D point clouds. In the construction, various feature descriptors, such as scale-invariant feature transform (SIFT) [27] and speeded-up robust feature (SURF) [28], have been used for localization. For example, Bae et al. [4] extracted unique features using a SIFT ratio to localize images in point-cloud data reconstructed using a structure-from-motion (SfM) method. Bae et al. [29] proposed a cached k-d tree search strategy using binary robust invariant scalable keypoint (BRISK) features [30] to localize images in SfM-based point clouds. Meanwhile, Li et al. [31], Mikulik et al. [32], and Sattler et al. [33] proposed a visual vocabulary to group similar features for a memory-efficient search. Similarly, Sattler et al. [34] presented a prioritized search strategy on a visual vocabulary using Lowe’s ratio [27] as a unique feature to compare and match image features in the large point-cloud data generated by SfM. Recently, simultaneous localization and mapping (SLAM) has also been studied for the localization of multiple images (e.g., video frames) with pre-constructed point clouds. For instance, Asadi et al. [35] localized and estimated the pose of video frames in pre-generated point clouds by using an algorithm based on a fast and robust local feature detector, the so-called oriented FAST and rotated BRIEF (ORB)-SLAM2 [36], and performed registration by matching a BIM view with an image using vanishing points. This feature-based approach, which directly maps images to a 3D point cloud, showed high localization accuracy [5,37]; however, digital information (e.g., BIM models) has been manually linked to the pre-generated point cloud for augmented reality.
For the latter, image retrieval applications have been proposed as an emerging approach for localization. In this approach, a similar image inferring a user’s location is searched in a large database containing numerous pre-collected images. For image retrieval, Micusik and Wildenauer [38] used a line-matching algorithm to extract similar images from the database. For this purpose, Lu et al. [39] trained multitask learning algorithms on bag-of-words features. By contrast, Ha et al. [40] and Baek et al. [5] proposed the use of BIM to create a BIM-rendered image dataset and trained a visual geometry group convolutional neural network [41] to extract images similar to the image of interest. Although these image retrieval-based methods can localize images directly in an as-planned model [5], they have not been thoroughly studied and tested for indoor localization at a jobsite or facility where the scene contains objects that are not present in an as-planned model. For augmented reality, the presence of an additional object in a scene may occlude the building features, and hence, cause false feature matching, resulting in inaccurate localization and registration. For instance, a query image may not be localized well when the image is captured very closely to an object (e.g., a building element) whose whole geometry is not visible in the image; in this case, features detected in an image may not be enough for the localization. In addition, indoor environments of a facility with similar dimensions and shapes (e.g., similar office rooms) can be another potential challenge for image retrieval, as the view in a single image’s scene can be limited.
Recently, the use of point clouds representing built environments has been proposed to capture the maximum possible spatial information of a scene for localization in an as-planned model. For example, Herbers and König [21] localized the horizontal cross section of an as-built point-cloud model to that of an as-planned model by rotating the as-planned model along the detected orientations of building walls, based on the normals of points in the point-cloud models, and by translating the as-planned model along the cells of the rasterized cross section of the as-built model. Through this rotation and translation, the distance between the nearest-neighbor points of the as-built and as-planned models could be minimized for the localization. However, it was assumed that the horizontal cross section extracted from a portable device (e.g., HoloLens) at an eyesight level was similar to the 2D layout in an as-planned model, and that for the computation of rotations, the building had only orthogonal walls. These assumptions may limit the applicability to specific cases.
2.2. Registration
Registration is a process of aligning a visual datum (e.g., an image and a point cloud) with another visual datum. In construction, registration has been performed between images, from an image to a point cloud, or between point clouds for various purposes, such as model reconstruction, object recognition, quality assurance, construction progress monitoring, and augmented reality. Generally, for visual data alignment, the registration process matches the features (e.g., local feature descriptors or geometric features) extracted from visual data by calculating the transformation to overlay one on the other. For instance, the features reviewed in the localization section, e.g., SIFT [27], SURF [28], BRISK [30], or ORB-SLAM2 [36], can also be used for registration with additional processes of accurate transformation estimation for an image to an image or an image to a point cloud. This accurate transformation can be performed on extracted features using random sample consensus (RANSAC) [42] and then be further refined using bundle adjustment [43]. RANSAC randomly selects the corresponding point sets, calculates the transformation to check the number of inliers, and iteratively identifies the best transformation with the maximum number of inliers. Meanwhile, the bundle adjustment projects registered feature points back onto the image and minimizes the re-projection error of the feature points. Although images can accurately be registered, for augmented reality in indoor environments, registration using point-cloud models can often be more suitable, because unlike images, point-cloud models hold rich information about the geometry of structures (e.g., shape of rooms), helping distinguish scenes with similar appearances by using additional features (e.g., size of rooms). Due to this benefit over image-based approaches, point cloud-to-point cloud registration is mainly used in this study.
In general, the registration of point clouds is implemented in two stages: coarse registration and fine registration. Coarse registration provides an initial rough alignment of point clouds, and then, fine registration further refines this alignment to accurately superimpose one point cloud on another. In construction, coarse registration is implemented either (i) manually by selecting corresponding points in as-planned and as-built models and calculating the transformation matrix, or (ii) by utilizing the corresponding features in both point-cloud models (e.g., as-planned and as-built). In particular, feature-based coarse registration has been implemented with local feature descriptors described on keypoints (e.g., corners) in point clouds and geometric features describing the whole point-cloud model. After two models are roughly aligned, fine registration is implemented to determine the optimal transformation, by using spatial distribution of 3D models and minimizing the distance between two models.
In construction, manual coarse registration is implemented for the comparison of an as-planned model with an as-built model for quality assurance or progress monitoring. For instance, Nguyen and Choi [44,45] manually aligned an as-built model with an as-planned model and applied an iterative closest point (ICP) to register point clouds for the inspection of an industrial plant. For monitoring the construction progress, Golparvar-Fard et al. [46] used control points for the registration between two as-planned and as-built models.
For feature-based coarse registration, local feature descriptors for 3D point clouds, inspired by local feature descriptors for images such as those mentioned in the localization section, have been proposed [47]. Feature descriptors that define the local geometry of point clouds are used to identify and extract keypoints from point clouds, which are then used to compute the transformation matrix for the registration. For example, Barnea and Filin [48] extracted keypoints using a min–max operator and applied RANSAC to register point clouds from a terrestrial laser scanner. Similarly, Mahmood and Han [49] utilized a fast point feature histogram [50] as a feature descriptor and a RANSAC algorithm to reject false correspondences in registering 3D point clouds of rooms for augmented reality. Kim et al. [51] combined RGB images of a scene in a laser-scanned point cloud by calibrating a camera attached to a laser scanner and calculated the SURF feature on images for correspondence and registration of multiple scans. However, these methods, based on the correspondence of feature descriptors, have been proposed for point clouds extracted and built from an identical source so that the performance when point clouds from a cross domain (e.g., a scanned model and a computer-generated model) are registered remains unknown.
In the case of geometry-based features, the use of the principal axis of a model and the length ratio of two intersecting lines on a model has commonly been proposed to describe the shape and orientation of a whole model for coarse registration. For instance, Kim et al. [52] registered an as-planned model of a building with an as-built model by using a principal axis, i.e., a line that passes through the center of gravity of an object, such that its mass is symmetrically distributed around this line. Wang et al. [53] also extracted a principal axis to build precast concrete panel models by registering multiple point clouds. This technique, using a principal axis, may be suitable where a model can be represented by a single principal axis and when a model can be scanned without occlusions. Meanwhile, the length ratios of two intersecting lines formed by four coplanar points on an object are transformation-invariant, as such, a set of four congruent points was searched on another model of the same object for registration [54]. For registration, the authors in [55] particularly extracted 3D difference of Gaussian keypoints from a point cloud and applied a keypoint-based four-points congruent set algorithm [56]. Bueno et al. [57] proposed a four-plane congruent set for the registration of as-built 3D point clouds with 3D BIM models; however, to match the congruent four points (e.g., congruent four keypoints or congruent four planes), a large overlap of point clouds is required.
For fine registration, normal distribution transform (NDT) [58] and ICP [59] have commonly been adopted in construction. NDT [58] divides the point cloud into cubes, calculates Gaussian distribution on the distance of points from the mean point in that cube, and matches these Gaussian distributions for an optimal fine registration. Although the implementation of NDT is known to be faster than ICP [59], its accuracy depends on the size of a cube for rasterization. By contrast, ICP accurately aligns a target point cloud (i.e., an as-planned model) with a source point cloud (i.e., an as-built model) by minimizing the average distance between the nearest-neighbor points of the source and target point clouds. The ICP algorithm iteratively applies the transformation matrices (i.e., rotations and translations) on the target point cloud until the minimum possible average distance between the point clouds is achieved. ICP is known to be one of the most widely used algorithms for fine registration [60,61], due to its generalized implementation and robust performance.
In summary, compared to local feature descriptors, geometry-based features can be suitable for indoor point cloud registration, in that large-scaled geometry of building elements may include richer information to distinguish locations with similar appearances. However, in addition, there can be such objects in an indoor environment that are not present in an as-planned model, causing the difference between the as-built and as-planned point-cloud models and eventually resulting in an inaccurate registration. This issue can be more critical when an as-planned model is larger than an as-built model, locally scanned. However, image-based localization may require a high level of detail in the case of an as-planned model, to be similar to that of an as-built model; thus, such differences in models can negatively affect the performance. In the case of geometry-based features, very few studies exist in terms of the localization and registration between heterogeneous models (e.g., point-cloud models from different sources such as scanning and BIM).
3. Method
For the onsite visualization of an as-planned model, this paper presents a computational framework of a BIM-based localization and registration that enables the superimposing of one point cloud (i.e., an as-built model) onto another (i.e., an as-planned model) by utilizing geometric features of point clouds. Indoor localization is challenging due to large and complex search space. Additionally, the presence of unplanned objects in an indoor environment makes an as-built point cloud different from an as-planned model. To overcome this challenge, a method is needed (1) to reduce search space by reducing the size of point-cloud data, (2) to minimize the additional unplanned objects in the as-built model, (3) to simplify the complexity of search space by restricting rotational and translational transformation, and (4) to utilize a geometric feature that represents shape and orientation of rooms instead of the whole building. To fulfil these needs, first, localization is performed to reduce a search space in registering a locally scanned, inconsistent as-built model with a large-sized as-planned model (e.g., BIM) at a low level of detail. In this process, the location of an as-built model in a coordinate of an as-planned model is identified by converting the 3D point clouds into 2D layouts at a specific height and matching the corresponding horizontal lines on both models in 2D form for the model registration, instead of comparing the geometric features representing the orientation and shape of an entire 3D model. Notably, this approach may help minimize the impact of objects not present in an as-planned model on localization, by finding an optimal height during the 2D conversion, as well as the effect of different appearances between the as-built and as-planned models, by using the geometry of building components (e.g., walls and columns), unlike image-based approaches. Figure 1 illustrates an overview of the proposed framework, which mainly comprises three procedures: (1) a point cloud reconstruction that extracts a point cloud from the as-planned model (e.g., BIM) and builds another as-built point cloud through scanning, (2) a parameter optimization that minimizes the degree of freedom in transforming an as-planned point cloud in a 2D form by vertically aligning point clouds, extracting similar 2D cross sections at a certain height from the point clouds, and subsampling each of the extracted cross sections, and (3) localization and registration that roughly align the point clouds by identifying pairs of corresponding horizontal lines between the two cross sections and further iteratively refine the model alignments at a point level.
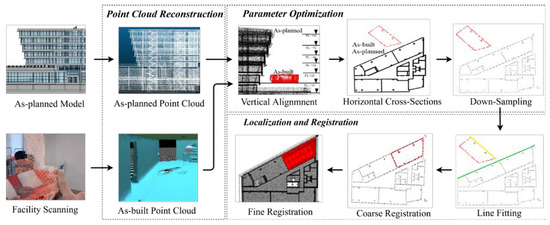
Figure 1.
Computational framework of point cloud-based augmented reality.
3.1. Point Cloud Reconstruction
To superimpose an as-planned model onto its corresponding real-world surface through an augmented reality device (e.g., Microsoft HoloLens), two point-cloud models are reconstructed by scanning a facility through the augmented reality device, representing a built environment, and by computationally generating and sampling points on the surface of a 3D virtual model, representing an as-planned design (e.g., BIM).
For the reconstruction of a built environment, an augmented reality device generally utilizes a depth camera to measure the depth of a scene relative to the device. This relative depth of the scene is measured using the time-of-flight approach. The time-of-flight method measures the time required for an infra-red light to travel back to its source after hitting an object. This time is then used to calculate the distance between the source of the infra-red light and the object using the speed of light. Three-dimensional positions of multiple depth points are then calculated to construct a point cloud of the entire scene within the operating range. Such devices thus help understand the shape and extend of a built environment by reconstructing a real-scale point cloud and allow for anchoring a hologram with six-degrees-of-freedom visualization [62,63,64]. For interactive visualization, the orientation and motion of the device are tracked about the reconstructed scene using inertial measurement unit sensors.
To build a point cloud of an as-planned model, a 3D model (e.g., BIM) is converted to a mesh format that includes corner points of objects as well as the connectivity of those points in the form of lines, creating a polygon surface. The points initially in this mesh form may not represent well the shape of objects precisely, due to the low resolution. Thus, to improve the resolution of a point-cloud model, additional points within the meshes can geometrically be generated using a subdivision surface technique that divides the polygon of surfaces present in a mesh into smaller polygons or a sampling technique that randomly generates and samples points inside the boundary of a polygon surface, based on the surface equations. In this study, a random sampling method that keeps the number of surfaces in a mesh constant is adopted for the low computational load, unlike a subdivision surface technique that increases the number of surfaces in each subdivision process.
3.2. Parameter Optimization
For reducing search space and improving accuracy in the localization and registration of point clouds, the two models (i.e., as-planned and as-built) are converted and sampled into the form of 2D layouts through the optimization of three parameters: (1) degree of freedom, (2) dimension of point clouds, and (3) resolution of point clouds. This optimization process can minimize the computational cost incurred in estimating a transformation matrix (Equations 1 to 6) for localizing and registering point clouds. A transformation matrix comprises three translations and three rotations (i.e., six degrees of freedom) that change the position and orientation of a point cloud, to register one with another. The degree of freedom can be reduced by vertically aligning the point clouds and constraining the vertical translation in the transformation. Three-dimensional point clouds can also be reduced to two-dimensional cross sections, through which unnecessary and inconsistent parts (e.g., tool shelves and workbenches) in an as-built point cloud can be cut down to reduce the error in identifying the corresponding features for model matching. Then, the resolution of both point clouds in a 2D layout is reduced by the voxelization and subsampling of point clouds to systemically decrease the number of points to be processed.
where
- P = Original point cloud
- P’ = Transformed point cloud
- M = Transformation matrix
- T = Translation matrix
- Rx, Ry, Rz = Rotation matrix for rotation around x, y and z axis respectively
- α, β, γ = Rotation angle around x, y and z axis respectively
- Tx, Ty, Tz = Translation along x, y and z axis respectively
First, regarding the degree of freedom associated with point clouds, a Cartesian coordinate system is adopted to describe the position and orientation of a point cloud with an origin and three axes (i.e., x, y, and z). In this study, however, the coordinate systems are defined differently for the as-built and as-planned models. For example, for the as-built model, the system is set as follows: a right-hand rule, such as a positive x-axis toward the right, a positive z-axis toward a device user, and a positive y-axis upward, with the head of the device user as the origin (Figure 2a). By contrast, for the as-planned model, the coordinate system defined for BIM is used: a positive y-axis toward north, a positive x-axis toward east, and a positive z-axis upward with a certain base point as the origin (Figure 2b). Accordingly, the y-coordinates of all points in the as-planned point cloud are switched with the z-coordinates to make the coordinate systems uniform with the as-built model.
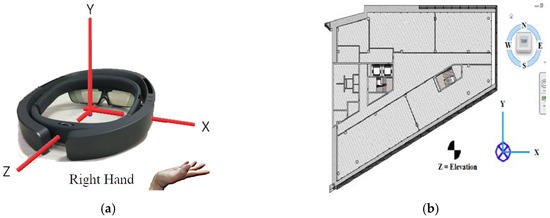
Figure 2.
Definitions of coordinate systems for (a) an as-built point cloud (e.g., an augmented reality device) and (b) an as-planned model (e.g., building information model (BIM)).
In general, the registration of the two point-cloud models involves estimating and applying a transformation matrix with three axial rotations and three directional translations (Figure 3a). When using a head-mounted augmented reality device, however, the vertical and horizontal planes can be recognized with view pose tracking and gravity sensors in the device, maintaining the horizontality of the floor and walls at its natural orientation. In this case, rotational alignments around the horizontal axes (i.e., x- and z-axes in Figure 3a) are not required for computing a transformation matrix. Furthermore, a vertical alignment in the y-axis (Figure 3a) can be performed by identifying and aligning the lowest planes (i.e., floors) in both as-built and as-planned models. Here, the lowest point in an as-built point cloud is placed on the floor, as the planes remain in natural horizontality and verticality with the sensing device. Thus, a floor can be detected by selecting the point at the lowest elevation (i.e., the smallest y-coordinate). For the vertical alignment, the translation of an as-planned point cloud along the y-axis can be calculated using Equation (7), where Ty, B min elevation, and P min elevation denote a translation along the y-axis and the minimum elevations of an as-built and an as-planned point cloud, respectively. Consequently, the degree of freedom for the transformation matrix is reduced to three, including one rotation around the y-axis and two translations along the x- and z-axes, as shown in Figure 3b.
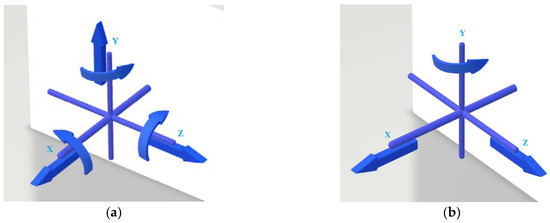
Figure 3.
Transformation matrix parameters reduced from (a) six to (b) three degrees of freedom.
Second, the dimensions of the point clouds are reduced by extracting the horizontal cross sections from both point clouds at a certain elevation, whose boundaries may appear similar. As an as-built point cloud may often include additional objects (e.g., equipment and cupboards), rather than building components present in a drawing, occlusions caused by such objects can lead to inaccurate registration of point clouds. The proposed approach is thus used to make an as-built point cloud as similar to the as-planned model as possible, by determining the optimal elevation at which no or fewer extra objects exist. In this way, the computational burden of registration can also decrease as the registration can be performed with 2D point clouds (i.e., fewer number of points), compared to 3D data. Specifically, the selection process of optimal elevation (Figure 4) includes extracting horizontal cross sections at various elevations (e.g., at an interval of 10 cm in this experiment), extracting boundary points in each cross section, calculating and comparing the areas of the cross sections, and identifying the one producing the largest area; here, the height is considered as y-coordinate, and all the points on the certain y-coordinates are extracted from the point cloud to form a cross section. This approach is based on the assumption that a cross section with the largest area includes the fewest number of unnecessary objects, thus being similar between the as-built and as-planned models, as occlusions by such objects reduce the area.
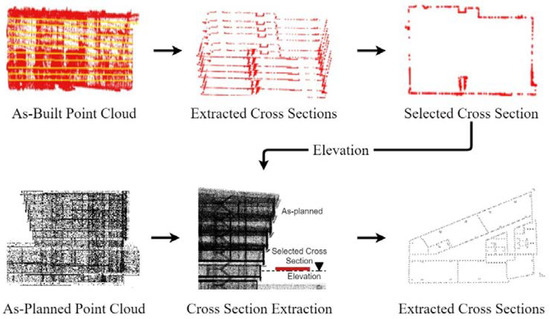
Figure 4.
Conceptual illustration of cross-section extraction.
For the implementation, this study adopts the convex Hull algorithm [65], to extract boundary points on a cross section, and the surveyor’s formula [66], to calculate the area of the cross section. The convex Hull algorithm [65] iteratively determines the outer points in a divide-and-conquer fashion. In this algorithm (Figure 5), space is divided into two halves with a line of two points (e.g., with a minimum and maximum of x). These halves are further divided into halves with the farthest point to this line. Lines are then drawn to form triangles with these points. This process of dividing a space into sub-spaces is iteratively performed until there is no farthest point left out of these triangles. These farthest points create the outer boundary of the cross section. With points on the boundary, the surveyor’s formula [66] allows for calculating the area of a polygon, given the coordinates of the vertices using Equation (8), where, A, x, y, and n denote the area of the polygon, x-and y-coordinates of a vertex, and the number of vertices, respectively. Among the cross sections with the area of the outer boundary at various elevations, the elevation at which the largest area is produced and fewest points are included is selected, as such elevation is likely to exclude the points representing unnecessary objects inside the space. After selecting the elevation of the representative cross-section, a cross-section at this selected elevation is also extracted from the vertically aligned as-planned model to compute the transformation matrix between the two models.
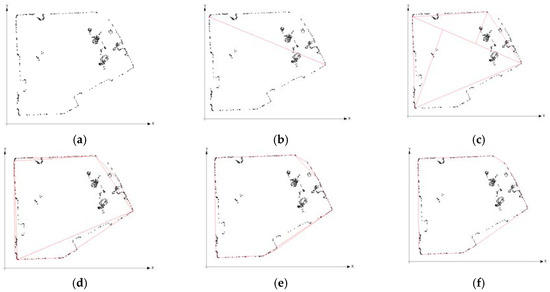
Figure 5.
Sequential computations of boundary extraction using Convex Hull algorithm. (a) A cross section of as-built point cloud, (b) Division of the cross section into halves using extreme end points, (c–e) further division of the halves using their extreme end points, (f) boundary lines formed by all extreme points of division.
Finally, the resolutions of the cross-sectional point clouds are further adjusted to reduce the computational cost incurred in the registration process and to make the resolution of both models consistent for accuracy improvement. Among the two widely used methods, i.e., key point extraction and subsampling, this study adopts the latter to reduce the number of points in point clouds as it is more suitable for preserving the global geometric features (e.g., the size and shape of a room), as in this study, than key point extraction generally used for local geometric features. Specifically, for subsampling of points, 2D voxelization is applied by recursively dividing the plane into 2D voxels. Here, a 2D voxel is a square that contains the points of a point-cloud model, and thus, 2D voxelization creates regular grids of 2D voxels on all points and produces the one point at the centroid of the points existing in the 2D voxel (Figure 6). In this case, the voxel size is critical, as the selection of a too large voxel size can result in subsampling of a distorted cross section. In this study, the effective size of a voxel is selected experimentally by evaluating the trade-off between computational cost and registration accuracy (e.g., the one producing successful registration results with the shortest processing time).
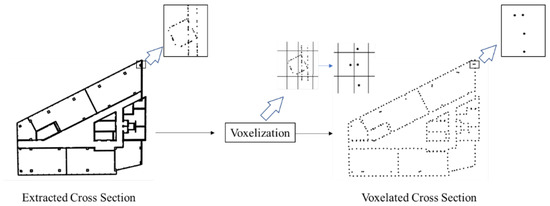
Figure 6.
Subsampling of points on a cross-sectional point cloud using 2D voxelization.
3.3. Localization and Registration
With the two point-cloud models in 2D form, one model is coarsely localized and finely registered with respect to another by identifying pairs of corresponding feature points and computing the transformation matrix. For feature description, this paper proposes a line extraction and fitting that first determines a rotational transformation (e.g., about the y-axis in Figure 3b) with key lines, and then translation transformations (e.g., along the x- and z-axes in Figure 3b) with the points on each line. In this approach, the use of lines for describing and preserving the geometry of a point cloud, such as the shape and size of a model, may help avoid the self-similarity of building elements in matching two models. The technical details are presented from the following aspects: (1) line extraction from point clouds, (2) line correspondence for coarse registration, and (3) point-to-point matching for fine registration.
A building usually includes vertical straight walls; therefore, point clouds of walls represent line features in their horizontal cross section. Other shapes such as circles or curves can also be used to extract features depending upon the shapes of walls. Horizontal lines are sequentially fitted on the subsampled cross-section in the order of the largest to smallest line of both point clouds (i.e., as-built and as-planned models), by fitting a line using RANSAC, eliminating the points of this fitted line from the original point cloud, then and applying RANSAC again on this updated point cloud to extract the next line. RANSAC randomly selects points in a point cloud, fits a line on these selected points, and checks the inliers (Figure 7). This process of random point selection and fitting a line is iterated on a specific number of random samples; for instance, a line with a relatively maximum number of inliers is selected, called as the best fit line, and its parameters (i.e., slope and intercept) are refined for inliers in the whole point cloud (Figure 7c). In this process, the threshold distance for checking the inliers may depend on reconstruction errors in a dataset; thus, the threshold distance is selected as 0.1 m in this study, based on the reconstruction error of point clouds captured from HoloLens [62]. Meanwhile, the number of iterations performed for each line is dynamically estimated at each time of fitting a line, using Equation (9). In this experiment, the variables p and s in Equation (9) are set as 99% and 2 points for line fitting, respectively, whereas the outlier ratio, e, is initially set to 50% but iteratively updated by calculating the number of inliers and outliers at each iteration. For example, the number of line samples—N, which is dynamically computed—is randomly selected and the numbers of inliers for each line are compared to determine the best line. Once the best line is selected, its corresponding points (i.e., inliers) are removed from the entire point set. Then, this process is repeated with the remaining subset of points until 10% of the total points are left. This stopping criterion (i.e., 10%) is experimentally determined by visually inspecting the false detected lines; that is, it is assumed that the 10% of total points left at the end of line fitting do not belong to walls but either pillars or other building elements that do not create any horizontal line.
where
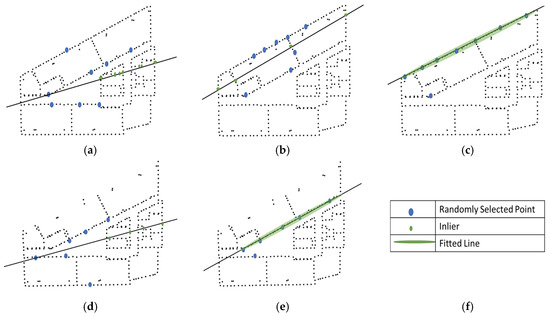
Figure 7.
Random sample consensus (RANSAC) algorithm for fitting lines; (a–c) are iteratively determined for the first line fitting, and (d,e) are determined for the second line fitting.
- N = the number of iterations performed for each line
- p = desired probability of having all inliers in one random sampling (%)
- e = outlier ratio (%)
- s = the number of random points to fit the model
Line correspondence is performed for coarse registration by searching for the best rotational and translational transformations. Specifically, this process first hypothesizes a line correspondence to estimate a rotational transformation, and then a point correspondence on that line, to estimate a translational transformation. These hypotheses of correspondence are iteratively evaluated and checked after applying the estimated transformations on the as-planned model and measuring the distance between the two point clouds, called the similarity index. The estimated transformation that results in the highest similarity index between the point clouds is selected as the best transformation.
First, for the rotational alignment of the point clouds, lines of the as-planned point cloud are matched for correspondence with the largest line of the as-built point cloud, and then, the rotation angle is calculated using the line features. Here, the line features include a polar radius and its angle with respect to a horizontal axis in polar form, as shown in Figure 8. These features of the extracted lines are calculated with the formulation described in [67]. For example, let φ n and ΘN denote the angles of a polar radius in the as-built and as-planned models, respectively. The rotation angle of transformation, r.y, is then calculated using Equation (10). This rotation is applied to an as-planned model to estimate the translation using points on the corresponding line.
where
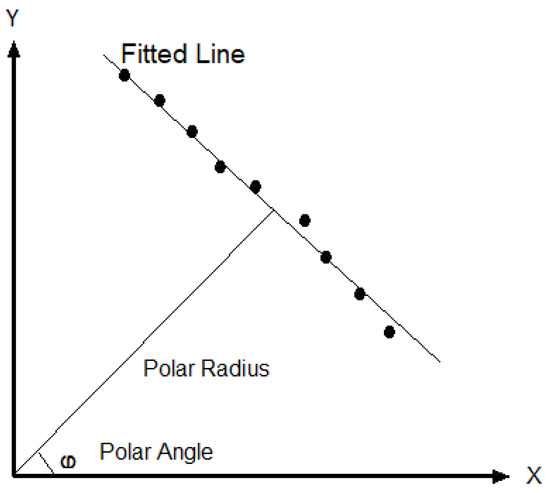
Figure 8.
Estimation of line features (i.e., a polar radius and a polar angle) for the fitted line (adopted from [67]).
- r.y = rotation angle of transformation
- φ n = angle of a polar radius in the as-built model
- ΘN = angle of a polar radius in an as-planned model
Second, to estimate the translation of transformation, points of the corresponding line in the rotated as-planned model are matched with the centroid of the largest line in the as-built model, to check the correspondence. Then, the distance between two point-cloud models, representing the similarity, is calculated to determine the best transformation (i.e., translation and rotation) with the smallest distance. Algorithm (1) describes the steps involved in line correspondence. Here, notably, a line’s polar angle with the x-axis can be in a clockwise or counter-clockwise direction. Therefore, the similarity indices for both angles (i.e., Θ and Θ + 180°) need to be checked, as they are 180° opposite to each other. Overall, Figure 9 illustrates the computational process of coarse registration. In particular, in this study, among the four measures commonly used as a similarity index, i.e., Hausdorff distance, root mean square distance (RMSD), number of inliers, and point-to-plane distance, RMSD is selected through experiments. For instance, Hausdorff distance and point-to-plane distance fail to localize the point-cloud model, and the number of inliers is sensitive to the threshold value and fails to localize similar rooms in the as-built model.
| Algorithm 1. Line correspondence for coarse registration | |
| 1 | Input: Extracted Lines (l1, Ln), their corresponding points (P1m, QLm) and corresponding angles (φ1, ΘN) |
| 2 | Output: Smallest distance D, rotation around vertical axis R.y and horizontal translation T.x, T.z, |
| 3 | calculate centroid of first line in as-built point cloud cross section (P1c) |
| 4 | for each line in as-planned point cloud cross section (Ln) |
| 5 | calculate rotation angle r.y = φ 1 − Θ1 |
| 6 | for each point in line (QLm) |
| 7 | calculate horizontal translation t.x = P1c.x − QLm.x; t.z = P1c.z − QLm.z |
| 8 | apply transformation onto an as-planned point cloud cross section |
| 9 | calculate distance (d) |
| 10 | if d < D |
| 11 | D = d, R.y = r.y, T.x = t.x, T.y = t.y |
| 12 | return R.y, T.x, T.y |
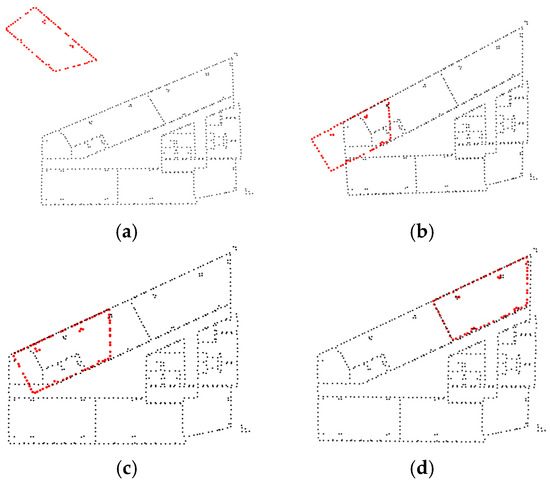
Figure 9.
Rotational and translational alignment: (a) initial state of models, and (b–d) search sequences of coarse registration.
Given the two models are roughly localized (i.e., coarse registration), ICP is applied for fine registration. The ICP method recognizes the closest point as corresponding points within the two point-cloud models and computes the transformation by iteratively calculating and minimizing the squared distance between the two models. In each iteration, a point cloud is randomly rotated and translated, that is, changed in orientation, and the relations between the change in orientation and squared distance can be observed and described in the form of a curve. This curve may not be linear, due to errors and outliers of the reconstruction. Thus, a nonlinear least-squares curve-fitting method, Levenberg–Marquardt, is used to optimize the change in orientation that produces the minimum sum of squared distances. In this optimization, the iterations can be terminated based on (1) the pre-defined distance between point clouds, (2) the pre-defined number of iterations, and (3) the minimum difference between consecutive transformations. This study mainly uses the first criterion, such as being terminated when the squared distance is smaller than the point cloud reconstruction error of 0.1 m.
4. Experimental Implementation
Experiments were carried out on the 3rd floor of a campus building to evaluate the performance of the proposed method in localizing and registering a locally scanned as-built model with a large-sized as-planned model (i.e., BIM). Figure 10 illustrates the floor plans used in the experiments, including those of the classrooms (e.g., Rooms 301, 302, and 305), a library (e.g., Room 304), a lab (e.g., Room 301A), storage (e.g., Room 303), and a hallway (Table 1). These rooms had objects, such as desks, chairs, and cupboards, that were not present in the as-planned model, thus making the scanned as-built model different from the as-planned model. Moreover, this floor included rooms similar in shape and size, such as Rooms 301 and 302, which can potentially lead to the inaccuracy of localization. The as-planned model of this floor had a level of detail of 200–300, with the geometry information (e.g., size and orientation) of rooms as well as doors and windows. Point clouds of this as-planned model were reconstructed by sampling points on the mesh of the as-planned model with a point density of 100 points per square meter, which is equivalent to 0.1 m point spacing of an as-built point cloud [68]. For reconstructing the as-built model, the rooms and hallway were separately scanned using Microsoft HoloLens 1 on the way where the scanned point clouds included a boundary of subjects to preserve the size and shape.
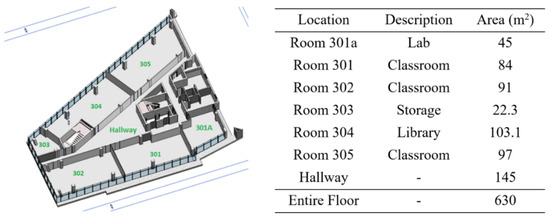
Figure 10.
A floor plan and room descriptions in experimentation.

Table 1.
Floor horizontality evaluation.
The implementation of parameter optimization includes the reduction in (1) degree of freedom, (2) dimension, and (3) resolution, to decrease the search space in localization and registration. First, the reduction in degree of freedom is based on the capability of an augmented reality device that maintains the planes in its natural orientation; for example, a floor should be horizontal at the lowest elevation. To address this issue, two experiments were conducted to evaluate the horizontality of a floor in an as-built point cloud by starting the scanning of the hallway, looking upward and downward. Due to a tilted line of sight in the first frame of scanning, an axis of a frame of reference in the point cloud can also be tilted. To estimate the orientation of the floor in the scanned point cloud, the floor was detected using the RANSAC algorithm for plane segmentation. RANSAC randomly selects the points, fits plane parameters with maximum inliers, and provides the coefficients of a plane equation in Equation (11), where A, B, C, and D represent the X-, Y-, and Z-coordinates of the plane’s normal and the origin distance coefficient, respectively. Consequently, the angle between the horizontal plane (i.e., A = 0, B = 1, and C = 0 in Equation (11)) and the detected floor was measured to evaluate the horizontality deviation using Equation (12).
Second, the dimensions of the point clouds were reduced from 3D to 2D by extracting horizontal cross sections at various elevations and selecting the one with the largest area, which was assumed to be similar to an as-planned model. In this process, if this interval is very small, it can be computationally expensive to extract all cross sections; in contrast, it is possible to miss the suitable elevation with the maximum area if the interval is very large. An experiment was conducted to estimate the optimal elevation interval that can achieve a higher probability of obtaining a suitable cross section at lower computational cost. In this experiment, the probabilities (Equation (13)) and computational times for the area calculation of each cross section were measured by testing intervals from 0.02 to 0.14 m, in intervals of 0.02 m. Particularly, Xlargest area in Equation (13) indicates the number of cross sections whose areas can identically be the largest above a certain elevation (e.g., elevations above the shelf).
where
- Plargest area = probability of obtaining the largest area cross section
- Xlargest area = the number of cross sections with the largest area
- Ncrosssection = the total number of cross sections extracted
Third, the resolution of the cross sections in a point cloud form was reduced through 2D voxelization. In this process, the optimal voxel size may minimize the number of points to be processed while achieving a successful localization. An experiment was undertaken to identify the optimal voxel size for subsampling of points by testing various sizes at an interval of 0.5 m. Specifically, the accuracy of coarse registration and computation time for the transformation estimation were measured with rotationally aligned point clouds as an input, to determine the maximum possible voxel size with accurate localization, as shown in Figure 11.
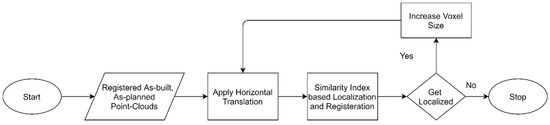
Figure 11.
Procedure of identifying the optimal size of a voxel.
With the 2D cross sections of the as-built and as-planned models, the RANSAC algorithm is applied for fitting horizontal lines in the extracted cross sections. In this process, once the points of the fitted line are extracted from the initial point clouds, the line extraction algorithm is iteratively applied to the remaining set of smaller point clouds. In this study, to avoid false line fitting, a percentage of points left in the point clouds was set as a termination criterion of iterations, as false line detection may occur in the last remaining points; that is, the longest line in the point clouds may have the maximum number of points and highest chances of being detected first in the random selection of points. For the iteration termination, an experiment was conducted to determine the percentage of points present in the point clouds that did not belong to any line of walls, testing various percentages in a range starting from 2% of points up to the point where no false line was detected.
Overall, the performance of the proposed method was evaluated by investigating the accuracy of both coarse and fine registration in the experiments. Specifically, registration errors were calculated through a comparison with ground truth. For example, the scanned point-cloud models were manually registered with the as-planned models using Meshlab software [69], and then, rotational deviations around the vertical axis and horizontal translational deviations between the two models, which are regarded as the ground truth, were compared with those in the transformation matrix computed from the proposed method. Particularly, for a fair comparison, registration errors were evaluated by setting and testing the different initial positions and orientations of the scanned as-built model, for example, rotating the scanned model of each room in every quadrant of a coordinate system (i.e., four directions—flipped left to right and inverted upside down) and applying a translational deviation of 50 m. In addition, the experiment included the case in which the boundary shape of an as-built point could be distorted due to the occlusion of walls (e.g., Room 304 in Figure 12); additionally, a cross section at 1.8 m elevation, including point clouds of scanned cupboards, was intentionally selected to evaluate the robustness of the registration approach toward the occlusions of a wall.
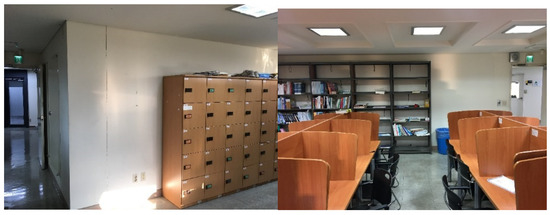
Figure 12.
Snapshots of Room 304, including occluded walls.
5. Results
Experiments were conducted to examine the proposed parameter optimization and identify suitable parameters, using which the overall performance of localization and registration was then assessed. The experimental results were presented and discussed from the following aspects, pre-process parameters, such as (1) degree of freedom to verify the horizontality of scanned as-built point clouds, (2) dimension associated with the extraction of a cross section at a certain elevation, and (3) resolution to compare the effect of different voxel sizes, and eventually, (4) the accuracy of localization and registration by evaluating the rotation and translation in a transformation matrix.
First, a floor on a hallway within a point cloud captured by HoloLens was detected to investigate its horizontality, as shown in Figure 13. The deviation of floor horizontality was calculated in terms of the angle between the floor and the horizontal plane using Equation (12). Table 1 shows that the scanned point clouds maintained a horizontal plane in the natural orientation with an average deviation of 0.008 radians. This result implies that a floor can be detected with points at the lowest elevation in the scanned point clouds, and hence, the rotation around the horizontal axis can be constrained to reduce the degree of freedom of transformation by aligning the floor of an as-built model with that of an as-planned model (Equation (7)). Under this assumption, the degree of freedom in the transformation matrix was reduced to three (i.e., rotation around the vertical axis and translation along the horizontal axis).
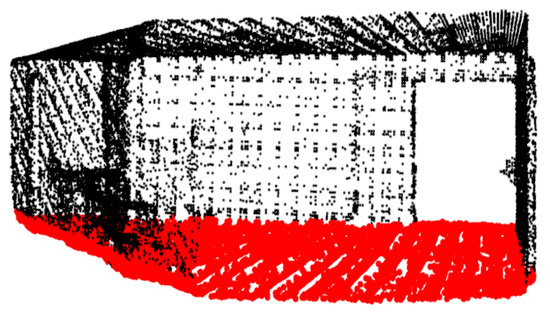
Figure 13.
Floor detected from a scanned point cloud, highlighted in red.
Second, for the dimension reduction of point clouds from 3D to 2D, the process of cross-section extraction was investigated to understand the effect of elevation intervals on the processing time required to calculate the cross-section area and the probability of obtaining the largest area in all extracted cross sections; the results are summarized in Table 2. Figure 14 shows that as the elevation interval increased, the processing times and probabilities decreased. Particularly, the probability dropped after an interval of 0.12 m, while no significant reduction in processing time was observed. Therefore, in this experiment, an interval of 0.10 m was selected to extract the cross sections from both point clouds. Among the horizontal cross sections extracted at the 0.10 m interval, the one with the largest area and fewest points in the cross section was selected as the representative cross section of 3D point clouds. The resulting cross sections of the hallway and rooms are presented in Figure 15. Notably, it can be observed that these cross sections did not include any unnecessary point of other objects rather than boundaries.
Table 2.
Optimal interval for the extraction of horizontal cross sections.
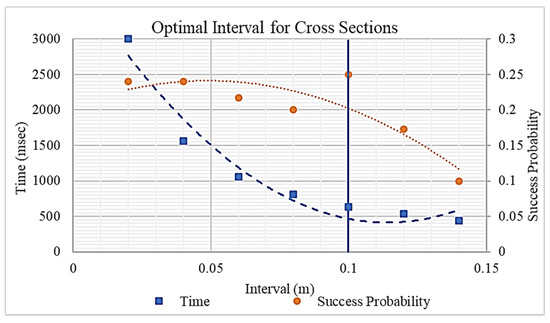
Figure 14.
Relations between intervals with processing time and success probability for the extraction of horizontal cross sections.
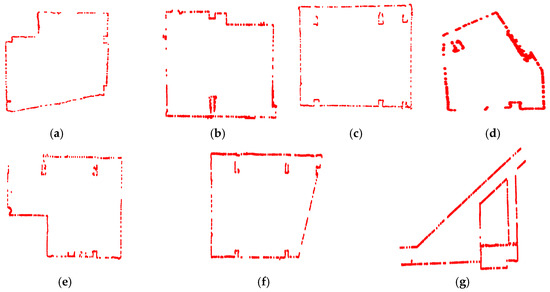
Figure 15.
Extracted cross sections at an optimal elevation: (a) Room 301A, (b) Room 301, (c) Room 302, (d) Room 303, (e) Room 304, (f), Room 305, and (g) Hallway.
Third, the resolution of point clouds in the 2D form of a cross section was further adjusted to reduce the processing time of registration. Table 3 and Figure 16 report the results of experiments conducted to determine the optimal 2D voxel size. As shown in the figure, the registration errors linearly increased with the voxel size, whereas the computation time for registration quadrantally decreased in this experiment. Specifically, the computation time for registration with a voxelized cross section appeared to be similar for each voxel size among the rooms, independent of the room size. This can be attributed to the fact that the computational time for transformation estimation mainly depends on the size of a large-scaled as-planned model that represents the search space during registration. In addition, the result of a voxel size of 2.0 m for Room 303 with the smallest area, which failed for the registration, indicates that a large voxel size can distort the shape of a small room. Eventually, a voxel size of 1.0 m was selected as an optimal size that can significantly reduce the processing time (i.e., no significant reduction after a size of 1.5 m) while maintaining the accuracy at an acceptable level (i.e., errors can be further reduced through fine registration).
Table 3.
Impact of a voxel size on processing time and root mean square error (RMSE) for coarse registration.
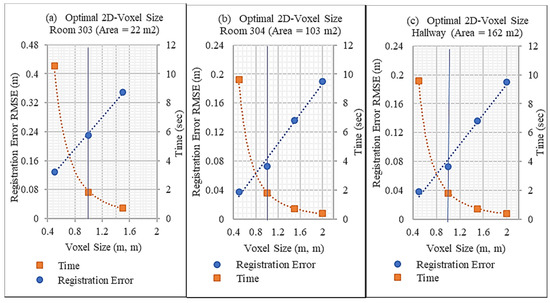
Figure 16.
Relations of voxel sizes with processing time and RMSEs for coarse registration, experimented in (a) Room 303, (b) Room 304, (c) Hallway.
For the localization and registration process, the termination criterion of iterations in the RANSAC algorithm was initially tested by visually observing the number of false lines after the completion of an algorithm at a certain percentage of points left in the point clouds (i.e., termination criterion). Figure 17 shows the number of false lines detected against the number of points left in a point cloud at the end of the line detection algorithm. When the last 10% of the points were left in the point clouds after removing the ones within correct lines, it was found that these points did not belong to any line and that no false line was observed. Meanwhile, when the algorithm was terminated at 8% criterion (i.e., more than 10% iterations), two lines turned out to be false. Accordingly, these 10% of remaining points were selected as the termination threshold for stopping the iterations of the RANSAC algorithm.
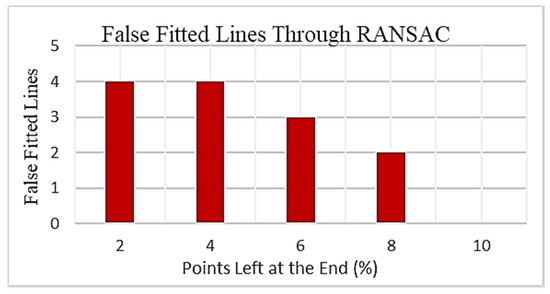
Figure 17.
Stopping criteria for line fitting in terms of remaining point percentage.
Finally, the comprehensive performance of the proposed method was evaluated in terms of both coarse and fine registration accuracies. For the coarse registration, the degree of freedom in a transformation matrix was reduced to three parameters (i.e., rotation around the vertical y-axis and horizontal x-and z-axis translation), which were estimated and compared with the ground truth. In particular, rotation errors around the vertical axis were calculated by computing the difference, in radians, between the estimated angle and ground-truth angle. Similarly, translation errors were determined by calculating the root mean square errors (RMSEs) of x- and z-axis translations between the estimated translations and ground truths. Fine registration was then applied on the coarsely aligned 3D point clouds, and the rotation and translation errors were computed and compared with the ground truth, as performed for coarse registration evaluation. The experiment results are displayed in Table 4. Overall, the proposed approach could achieve a translation error of 0.139 m and a rotational error of 0.007 rad for coarse registration, and a translation error of 0.088 m and rotational error of 0.005 rad for fine registration. The smallest registration error was observed in Room 304 after coarse registration, which may be because this room had horizontally straight walls without pillars attached, and a cross section of such walls leads to accurate line parameter estimation for line correspondence. By contrast, Rooms 301A and 302 as well as the hallway showed relatively large coarse registration errors in some experiments; for example, Room 301A showed larger rotational and translational errors of coarse registration for 3π/2 rad rotational deviation because this room had pillars along the walls or one of the walls was not straight. Such a wall provides a distorted line in a cross section, and in these experiments, these lines may have been detected first for the line correspondence algorithm. An additional experiment was conducted to evaluate the performance for occlusions on walls; for Room 304, walls were occluded by cupboards, which were intentionally included in the extracted cross section. In this case, the room could be localized and registered with a rotational error of 0.008 rad and a translational error of 0.189 m. Furthermore, Figure 18 clearly shows that an improvement in registration accuracy could be obtained after the implementation of fine registration. The final results of coarse and fine registration were also visually inspected, as shown in Figure 19 and Figure 20, respectively.
Table 4.
Summary of rotation and translation errors for coarse and fine registration.
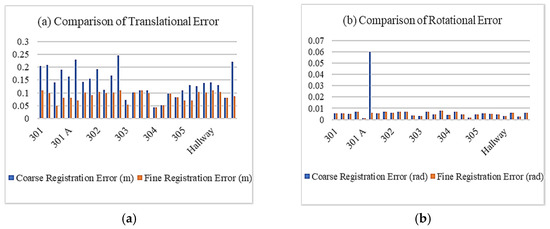
Figure 18.
Error comparison between coarse and fine registration: (a) Translation error, (b) rotational error.
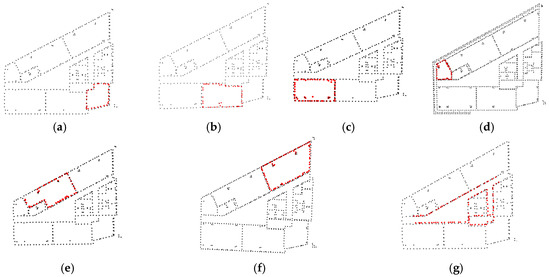
Figure 19.
Coarse registration results: (a) 301A, (b) Room 301, (c) Room 302, (d) Room303, (e) Room 304, (f) Room 305, and (g) Hallway.
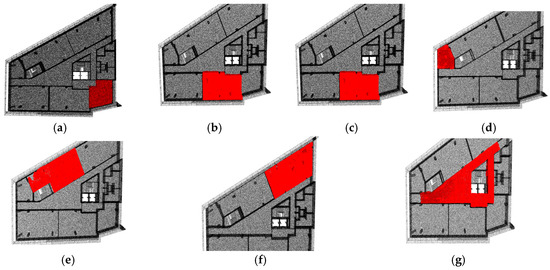
Figure 20.
Fine registration results: (a) 301A, (b) Room 301, (c) Room 302, (d) Room 303, (e) Room 304, (f) Room 305, and (g) Hallway.
As a proof of applicability of the proposed registration method for augmented reality, a BIM model was visualized through a HoloLens augmented on a real surface, as shown in Figure 21. For example, a BIM model was augmented on its corresponding objects, such as a planned door (Figure 21a), and a planned pillar could be observed as being overlaid on its corresponding real-world surface (Figure 21b).
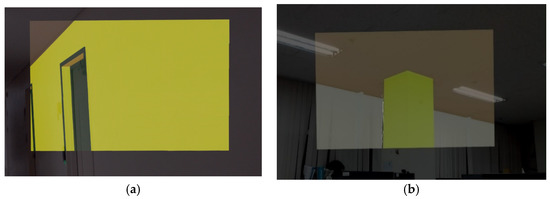
Figure 21.
Examples of visualization of BIM through HoloLens: (a) Hallway and (b) Room 305.
6. Discussion
The vision-based localization and registration of a captured indoor scene with an as-planned model is challenging, due to (1) self-similarity of building elements, such as similar doors and windows, (2) large size of an as-planned model compared to that of a locally scanned as-built model, and (3) the presence of extra objects in a scene that are not present in the as-planned model. For example, in the preliminary study, due to the self-similarity of building elements, the use of local feature descriptors has failed for the localization and registration because there were more false correspondences than correct correspondences. Additionally, the use of geometric features-based registration did not work well because the as-planned model was larger than the as-built model, which makes their features different from each other. However, the shape and area of the rooms may be different on the floor, which can be used as a feature to distinguish rooms. Thus, to utilize this distinguishing property of rooms for localization and registration, this paper proposed correspondence of walls represented as lines in captured and planned models. Experiments were conducted on individually captured rooms of a floor to evaluate the localization and registration accuracies, based on the correspondence of this geometric feature. The results show that the matching of a simple geometric shape present in both captured and planned models can help localize the captured room in an as-planned model accurately, resulting in 0.005 rad rotational error and 0.088 m translational error. Along with this, the distance between points of as-planned and as-built point-cloud models was used as a similarity index. This similarity index provides additional assistance in distinguishing such rooms that are similar in shape and area while their inner elements (e.g., pillars, doors) are at different locations (e.g., Rooms 301 and 302). Consequently, major findings of the paper include: (1) breaking down the transformation matrix into its components for the computation can help in localization of locally scanned indoor point clouds in a larger as-planned model by restricting unnecessary information, (2) although the presence of unplanned objects in an indoor scene makes as-built point cloud different from the as-planned model, extracting a horizontal layout of room above these objects makes both models similar for feature matching, and (3) fitting a geometric shape on building elements (e.g., walls) helps in finding rotation and translation of accurate registration.
A comparatively large size of the as-planned model increases the complexity of the transformation matrix estimation and computational time. First, the complexity of the transformation matrix can be reduced by constraining the known orientations (e.g., horizontality of floor) in the transformation matrix. By constraining the known orientations, the transformation estimation problem can be reduced from six degrees of freedom to three degrees. These known orientations were evaluated in terms of floor horizontality in a scanned point cloud. The results show that an as-built model, scanned with an augmented reality device, has a horizontal floor with an average deviation of 0.008 rad, and thus, can be assumed to be horizontal for restricting the rotational transformation around the horizontal axis. Second, the computational time for transformation estimation can be reduced by down-sampling the number of data points using a method that does not change the shape of a point-cloud model; a change in the shape of a point-cloud model can cause failure in localization. Experiments were conducted to determine the optimal voxel size that can successfully localize an as-built model and reduce the computational time. The results show that by increasing the voxel size, the computational time can be decreased; however, for a smaller room (e.g., Room 303 in this experiment), a larger voxel size can distort a model’s shape and fail the localization.
The presence of an extra object in an as-built model can distort the shape of a scanned room and cause inaccurate localization and registration with an as-planned model. Although these extra objects distort the shape and reduce the area of a model at their elevation level, above these objects, there may be a space in a room that has shape and area similar to that in the as-planned model. Extracting multiple horizontal cross sections from an as-built model and selecting a representative cross section based on the largest area of the cross section may be a solution for homogenization of both as-planned and as-built models. For instance, Figure 15 shows the largest area cross section of each experimented room that does not include any unplanned object. However, horizontal cross sections need to be extracted at a specific elevation interval at which the cross section of the largest area will not be missed. An experiment was conducted to determine an optimal interval of horizontal cross-section extraction by calculating the probability of obtaining the largest area cross section in the as-built model. The results show that the probability of obtaining the largest area cross section, which is a representative cross section, decreased when the elevation interval was increased above 10 cm in this experiment.
The proposed algorithm used the correspondence of line features for transformation estimation, which can lead to accurate registration by reducing the search space. However, the selected line for transformation estimation can be distorted due to pillars or occlusions, by which the nonlinear shapes can negatively affect the accuracy of coarse registration. To test the robustness of the proposed algorithm toward such noisy point-cloud data, an additional experiment was conducted in Room 304 by selecting a representative cross section at an elevation where a cupboard was present. The proposed algorithm localized and registered this partially distorted cross section with a rotational error of 0.008 rad and a translational error of 0.189 m. Although proposed method performed well in partially occluded walls, however the proposed method should further be tested for such cases that walls are fully occluded and that the shape and size of rooms are exactly identical. In these cases, other sensing approaches (e.g., RFID tag, wireless local area network, Beacon) can be used supplementary for the localization. In addition, the building walls may not be straight to fit a line in their cross section. This issue can potentially be resolved by fitting other geometric shapes sequentially on the cross section (e.g., circle) using RANSAC or Hough transform, and then calculating their shape parameter and transforming an as-planned model based on these parameters.
7. Conclusions
This paper presents a geometric feature-based localization and registration of an as-built point cloud in an as-planned point cloud. The proposed method can homogenize the as-built and as-planned models by extracting similar cross sections, which results in a successful localization of the scanned point clouds with an average 0.005 rad rotational error and 0.088 m translational error. The results suggest that the geometric shape of a room, if captured accurately, can be a distinguishing feature for localization in an as-planned model. The major findings of this study can be summarized as follows. (1) Geometric features can capture the uniqueness of an indoor scene (e.g., shape of a room); these unique features can localize an as-built point cloud in an as-planned point cloud (Table 4). (2) Recent augmented reality devices can sense the orientation of walls and floor (Figure 13), which can help in reducing the complexity of registration problems. (3) The 2D shape of a room can be determined from the scanned point clouds by extracting the boundary points above the wall-occluding objects (Figure 15). (4) The down-sampling of point clouds can reduce the computational time of localization and registration (Figure 16). In summary, search space reduction techniques (e.g., reduction in the degree of freedom for transformation estimation, 3D point cloud to 2D layout conversion, down-sampling of points) will reduce the complexity of transformation estimation and improve the accuracy in localization and registration through the simplification of feature matching. This paper also proposes simple geometric features (e.g., lines) that can describe the shape of rooms in a computationally efficient manner for the estimation of the orientation of the scanned model relative to the as-planned model.
From the perspectives of construction and facility management, this registration method can be used to overlay a BIM model on its corresponding scene, to visualize it through a portable augmented reality device. Thus, a user can take better advantage of augmented reality and the BIM model on the jobsite. One may find information right at the place where it is required, with less mental effort. With efficient and faster design information retrieval, augmented reality may provide a solution for efficient facility management. By utilizing the spatial information with the augmented BIM model, a better perception of design can be developed for accurate construction and quality control. Accordingly, the augmented reality of the as-planned model may allow for the easy retrieval of onsite information and a better understanding of complex designs; eventually, this visualization platform could potentially lead to the improvement of construction and facility management.
Author Contributions
Conceptualization, S.H.; Methodology, B.M., and S.H.; Software, N/A; Validation, B.M. and S.H.; Formal analysis, B.M.; Data curation, B.M.; Writing—original draft preparation, B.M.; Writing—review and editing, S.H.; Supervision, S.H., and D.-E.L.; Project Administration, D.-E.L.; Funding Acquisition, D.-E.L. All authors have read and agreed to the published version of the manuscript.
Funding
This research was supported by the National Research Foundation of Korea (NRF) grant funded by the Korea government (MSIT) (No. NRF-2018R1A5A1025137).
Acknowledgments
We would like to thank the students for their help in data collection and 3D modeling of the building used in the experiments.
Conflicts of Interest
The authors declare no conflict of interest. The sponsors had no role in the design, execution, interpretation, or writing of the study.
References
- Ahn, S.; Han, S.; Al-Hussein, M. 2D drawing visualization framework for applying projection-based augmented reality in a panelized construction manufacturing facility: Proof of concept. J. Comput. Civ. Eng. 2019, 33, 04019032. [Google Scholar] [CrossRef]
- Golparvar-Fard, M.; Peña-Mora, F.A.; Savarese, S. Four-Dimensional Augmented Reality Models for Interactive Visualization and Automated Construction Progress Monitoring. U.S. Patent 9,070,216 2015, 30 June 2015. [Google Scholar]
- Park, C.S.; Lee, D.Y.; Kwon, O.S.; Wang, X. A framework for proactive construction defect management using BIM, augmented reality and ontology-based data collection template. Autom. Constr. 2013, 33, 61–71. [Google Scholar] [CrossRef]
- Bae, H.; Golparvar-Fard, M.; White, J. High-precision vision-based mobile augmented reality system for context-aware architectural, engineering, construction and facility management (AEC/FM) applications. Vis. Eng. 2013, 1, 3. [Google Scholar] [CrossRef]
- Baek, F.; Ha, I.; Kim, H. Augmented reality system for facility management using image-based indoor localization. Autom. Constr. 2019, 99, 18–26. [Google Scholar] [CrossRef]
- Chu, M.; Matthews, J.; Love, P.E.D. Integrating mobile Building Information Modelling and Augmented Reality systems: An experimental study. Autom. Constr. 2018, 85, 305–316. [Google Scholar] [CrossRef]
- Chalhoub, J.; Ayer, S.K. Using mixed reality for electrical construction design communication. Autom. Constr. 2018, 86, 1–10. [Google Scholar] [CrossRef]
- Tang, A.; Owen, C.; Biocca, F.; Mou, W. Comparative Effectiveness of Augmented Reality in Object Assembly. In Proceedings of the SIGCHI Conference on Human Factors in Computing Systems, Lauderdale, FL, USA, 5–10 April 2003; pp. 73–80. [Google Scholar] [CrossRef]
- Wang, X.; Dunston, P.S. Compatibility issues in Augmented Reality systems for AEC: An experimental prototype study. Autom. Constr. 2006, 15, 314–326. [Google Scholar] [CrossRef]
- Wang, X.; Dunston, P.S. Potential of augmented reality as an assistant viewer for computer-aided drawing. J. Comput. Civ. Eng. 2006, 20, 437–441. [Google Scholar] [CrossRef]
- Chu, C.H.; Liao, C.J.; Lin, S.C. Comparing Augmented Reality-Assisted Assembly Functions—A Case Study on Dougong Structure. Appl. Sci. 2020, 10, 3383. [Google Scholar] [CrossRef]
- Wang, X.; Love, P.E.; Kim, M.J.; Park, C.-S.; Sing, C.-P.; Hou, L. A conceptual framework for integrating building information modeling with augmented reality. Autom. Constr. 2013, 34, 37–44. [Google Scholar] [CrossRef]
- Wang, X.; Love, P.E. BIM+ AR: Onsite Information Sharing and Communication Via Advanced Visualization. In Proceedings of the 2012 IEEE 16th International Conference on Computer Supported Cooperative Work in Design (CSCWD), Wuhan, China, 23–25 May 2012; pp. 850–855. [Google Scholar]
- Williams, T.P. Applying handheld computers in the construction industry. Pract. Period. Struct. Des. Constr. 2003, 8, 226–231. [Google Scholar] [CrossRef]
- Hou, L.; Wang, X.; Bernold, L.; Love, P.E. Using animated augmented reality to cognitively guide assembly. J. Comput. Civ. Eng. 2013, 27, 439–451. [Google Scholar] [CrossRef]
- Hou, L.; Wang, X. Experimental framework for evaluating cognitive workload of using AR system for general assembly task. In Proceedings of the 28th International Symposium on Automation and Robotics in Construction, Seoul, Korea, 29 June–2 July 2011; pp. 625–630. [Google Scholar]
- Lee, S.; Akin, Ö. Augmented reality-based computational fieldwork support for equipment operations and maintenance. Autom. Constr. 2011, 20, 338–352. [Google Scholar] [CrossRef]
- Cho, K. Development of guide and facility management app by using augmented reality and QR code. J. Digit. Converg. 2014, 12, 245–249. [Google Scholar] [CrossRef]
- Lin, Y.C.; Su, Y.C.; Chen, Y.P. Developing mobile BIM/2D barcode-based automated facility management system. Sci. World J. 2014. [Google Scholar] [CrossRef]
- Kuo, C.G.; Jeng, T.S.; Yang, I.T. An invisible head marker tracking system for indoor mobile augmented reality. Autom. Constr. 2013, 33, 104–115. [Google Scholar] [CrossRef]
- Herbers, P.; König, M. Indoor localization for augmented reality devices using BIM, point clouds, and template matching. Appl. Sci. 2019, 9, 4260. [Google Scholar] [CrossRef]
- Costin, A.M.; Teizer, J.; Schoner, B. RFID and BIM-enabled worker location tracking to support real-time building protocol control and data visualization. Electron. J. Inf. Technol. Constr. 2015, 20, 495–517. [Google Scholar]
- Jin, G.Y.; Lu, X.Y.; Park, M.S. An Indoor Localization Mechanism Using Active RFID Tag. In Proceedings of the IEEE International Conference on Sensor Networks, Ubiquitous, and Trustworthy Computing (SUTC’06), Taichung, Taiwan, 5–7 June 2006; pp. 40–43. [Google Scholar]
- Montaser, A.; Moselhi, O. RFID indoor location identification for construction projects. Autom. Constr. 2014, 39, 167–179. [Google Scholar] [CrossRef]
- Park, J.; Chen, J.; Cho, Y.K. Self-corrective knowledge-based hybrid tracking system using BIM and multimodal sensors. Adv. Eng. Inform. 2017, 32, 126–138. [Google Scholar] [CrossRef]
- Khalajmehrabadi, A.; Gatsis, N.; Akopian, D. Modern WLAN fingerprinting indoor positioning methods and deployment challenges. IEEE Commun. Surv. 2017, 19, 1974–2002. [Google Scholar] [CrossRef]
- Lowe, D.G. Distinctive image features from scale-invariant keypoints. Int J. Comput. Vis. 2004, 60, 91–110. [Google Scholar] [CrossRef]
- Bay, H.; Tuytelaars, T.; Van Gool, L. SURF: Speeded up robust features. Lect. Notes Comput. Sci. 2006, 3951, 404–417. [Google Scholar] [CrossRef]
- Bae, H.; Walker, M.; White, J.; Pan, Y.; Sun, Y.; Golparvar-Fard, M. Fast and scalable structure-from-motion based localization for high-precision mobile augmented reality systems. J. Mob. User Exp. 2016, 5, 4. [Google Scholar] [CrossRef]
- Leutenegger, S.; Chli, M.; Siegwart, R.Y. BRISK: Binary Robust Invariant Scalable Keypoints. In Proceedings of the 2011 International Conference on Computer Vision, Barcelona, Spain, 6–13 November 2011; pp. 2548–2555. [Google Scholar]
- Li, Y.; Snavely, N.; Huttenlocher, D.P. Location recognition using prioritized feature matching. In Proceedings of the European Conference on Computer Vision, Heraklion, Crete, Greece, 5 September 2010; pp. 791–804. [Google Scholar]
- Mikulik, A.; Perdoch, M.; Chum, O.; Matas, J. Learning vocabularies over a fine quantization. Int. J. Comput. Vis. 2013, 103, 163–175. [Google Scholar] [CrossRef]
- Sattler, T.; Leibe, B.; Kobbelt, L. Fast Image-Based Localization Using Direct 2d-to-3d Matching. In Proceedings of the 2011 International Conference on Computer Vision, Barcelona, Spain, 6–13 November 2011; pp. 667–674. [Google Scholar]
- Sattler, T.; Leibe, B.; Kobbelt, L. Efficient & effective prioritized matching for large-scale image-based localization. IEEE Trans. Pattern Anal. Mach. Intell. 2017, 39, 1744–1756. [Google Scholar]
- Asadi, K.; Ramshankar, H.; Noghabaei, M.; Han, K. Real-time image localization and registration with BIM using perspective alignment for indoor monitoring of construction. J. Comput. Civ. Eng. 2019, 33, 04019031. [Google Scholar] [CrossRef]
- Mur-Artal, R.; Tardós, J.D. Orb-slam2: An open-source slam system for monocular, stereo, and rgb-d cameras. IEEE Trans. Robot. 2017, 33, 1255–1262. [Google Scholar] [CrossRef]
- Sattler, T.; Weyand, T.; Leibe, B.; Kobbelt, L. Image retrieval for image-based localization revisited. In Proceedings of the BMVC, Guildford, UK, 3–7 September 2012. [Google Scholar]
- Micusik, B.; Wildenauer, H. Descriptor free visual indoor localization with line segments. In Proceedings of the IEEE Conference on Computer Vision and Pattern Recognition, Boston, MA, USA, 7–12 June 2015; pp. 3165–3173. [Google Scholar]
- Lu, G.; Yan, Y.; Sebe, N.; Kambhamettu, C. Indoor localization via multi-view images and videos. Comput. Vis. Image Underst. 2017, 161, 145–160. [Google Scholar] [CrossRef]
- Ha, I.; Kim, H.; Park, S.; Kim, H. Image retrieval using BIM and features from pretrained VGG network for indoor localization. Build. Environ. 2018, 140, 23–31. [Google Scholar] [CrossRef]
- Simonyan, K.; Zisserman, A. Very Deep convolutional networks for large-scale image recognition. arXiv 2014, arXiv:1409.1556. [Google Scholar]
- Fischler, M.A.; Bolles, R.C. Random sample consensus: A paradigm for model-fitting with applications to image-analysis and automated cartography. Commun. ACM 1981, 24, 381–395. [Google Scholar] [CrossRef]
- Triggs, B.; McLauchlan, P.F.; Hartley, R.I.; Fitzgibbon, A.W. Bundle Adjustment—A Modern Synthesis. In Proceedings of the International Workshop on Vision Algorithms, Corfu, Greece, 21–22 September 1999; pp. 298–372. [Google Scholar]
- Nguyen, C.H.P.; Choi, Y. Parametric comparing for local inspection of industrial plants by using as-built model acquired from laser scan data. Comput Aided Des. Appl. 2018, 15, 238–246. [Google Scholar] [CrossRef]
- Nguyen, C.H.P.; Choi, Y. Comparison of point cloud data and 3D CAD data for on-site dimensional inspection of industrial plant piping systems. Autom. Constr. 2018, 91, 44–52. [Google Scholar] [CrossRef]
- Golparvar-Fard, M.; Pena-Mora, F.; Savarese, S. D4AR—A 4-dimensional augmented reality model for automating construction progress monitoring data collection, processing and communication. Electron. J. Inf. Technol. Constr. 2009, 14, 129–153. [Google Scholar]
- Hana, X.F.; Jin, J.S.; Xie, J.; Wang, M.J.; Jiang, W. A comprehensive review of 3d point cloud descriptors. arXiv 2018, arXiv:1802.02297. [Google Scholar]
- Barnea, S.; Filin, S. Keypoint based autonomous registration of terrestrial laser point-clouds. ISPRS J. Photogramm. Remote Sens. 2008, 63, 19–35. [Google Scholar] [CrossRef]
- Mahmood, B.; Han, S. 3D registration of indoor point clouds for augmented reality. In Proceedings of the ASCE International Conference on Computing in Civil Engineering 2019, Atlanta, GA, USA, 17–19 June 2019; pp. 17–19. [Google Scholar]
- Rusu, R.B.; Blodow, N.; Beetz, M. Fast Point Feature Histograms (FPFH) for 3D Registration. In Proceedings of the 2009 IEEE International Conference on Robotics and Automation, Kobe, Japan, 12–17 May 2009; pp. 3212–3217. [Google Scholar]
- Kim, P.; Chen, J.; Cho, Y.K. Automated point cloud registration using visual and planar features for construction environments. J. Comput. Civ. Eng. 2018, 32, 04017076. [Google Scholar] [CrossRef]
- Kim, C.; Lee, J.; Cho, M.; Kim, C. Fully Automated Registration of 3D CAD Model with Point Cloud from Construction Site. In Proceedings of the 28th International Symposium on Automation and Robotics in Construction, Seoul, Korea, 29 June–2 July 2011; pp. 917–922. [Google Scholar]
- Wang, Q.; Sohn, H.; Cheng, J.C.P. Automatic as-built bim creation of precast concrete bridge deck panels using laser scan data. J. Comput. Civ. Eng. 2018, 32. [Google Scholar] [CrossRef]
- Aiger, D.; Mitra, N.J.; Cohen-Or, D. 4-Points Congruent Sets for Robust Pairwise Surface Registration; Association for Computing Machinery: Los Angeles, CA, USA, 2008. [Google Scholar] [CrossRef]
- Bueno, M.; Gonzalez-Jorge, H.; Martinez-Sanchez, J.; Lorenzo, H. Automatic point cloud coarse registration using geometric keypoint descriptors for indoor scenes. Autom. Constr. 2017, 81, 134–148. [Google Scholar] [CrossRef]
- Theiler, P.W.; Wegner, J.D.; Schindler, K. Keypoint-based 4-points congruent sets–automated marker-less registration of laser scans. ISPRS J. Photogramm. Remote Sens. 2014, 96, 149–163. [Google Scholar] [CrossRef]
- Bueno, M.; Bosche, F.; Gonzalez-Jorge, H.; Martinez-Sanchez, J.; Arias, P. 4-Plane congruent sets for automatic registration of as-is 3D point clouds with 3D BIM models. Autom. Constr. 2018, 89, 120–134. [Google Scholar] [CrossRef]
- Biber, P.; Strasser, W. The Normal Distributions Transform: A New Approach to Laser Scan Matching. In Proceedings of the 2003 IEEE/RSJ International Conference on Intelligent Robots and Systems (IROS 2003) (Cat. No.03CH37453), Las Vegas, NV, USA, 27–31 October 2003; pp. 2743–2748. [Google Scholar]
- Besl, P.J.; Mckay, N.D. A method for registration of 3-D shapes. IEEE Trans. Pattern Anal. Mach. Intell. 1992, 14, 239–256. [Google Scholar] [CrossRef]
- Jost, T.; Hügli, H. Fast ICP Algorithms for Shape Registration. In Proceedings of the Joint Pattern Recognition Symposium, Zurich, Switzerland, 16–18 September 2002; pp. 91–99. [Google Scholar]
- Rusinkiewicz, S.; Levoy, M. Efficient Variants of the ICP Algorithm. In Proceedings of the Third International Conference on 3-D Digital Imaging and Modeling, Quebec, QC, Canada, 28 May–1 June 2001; pp. 145–152. [Google Scholar]
- Hübner, P.; Landgraf, S.; Weinmann, M.; Wursthorn, S. Evaluation of the Microsoft Hololens for the Mapping of Indoor Building Environments. In Proceedings of the Three-Country Conference of the DGPF, the OVG and the SGPF, Vienna, Austria, 20–22 February 2019; pp. 44–53. [Google Scholar]
- Hübner, P.; Clintworth, K.; Liu, Q.; Weinmann, M.; Wursthorn, S. Evaluation of HoloLens Tracking and Depth Sensing for Indoor Mapping Applications. Sensors 2020, 20, 1021. [Google Scholar] [CrossRef] [PubMed]
- Liu, Y.; Dong, H.; Zhang, L.; El Saddik, A. Technical evaluation of HoloLens for multimedia: A first look. IEEE Multimed. 2018, 25, 8–18. [Google Scholar] [CrossRef]
- Barber, C.B.; Dobkin, D.P.; Huhdanpaa, H. The Quickhull algorithm for convex hulls. ACM Trans. Math. Softw. 1996, 22, 469–483. [Google Scholar] [CrossRef]
- Braden, B. The surveyor’s area formula. Coll. Math. J. 1986, 17, 326–337. [Google Scholar] [CrossRef]
- Wang, K.; Shi, T.; Liao, G.; Xia, Q. Image registration using a point-line duality based line matching method. J. Vis. Commun. Image Represent. 2013, 24, 615–626. [Google Scholar] [CrossRef]
- Bondar, S.; Salem, B.; Stjepandić, J. Indoor Object Reconstruction Based on Acquisition by Low-Cost Devices. In Proceedings of the Transdisciplinary Engineering Methods for Social Innovation of Industry 4.0, Modena, Italy, 3–6 July 2018; pp. 113–122. [Google Scholar]
- Cignoni, P.; Callieri, M.; Corsini, M.; Dellepiane, M.; Ganovelli, F.; Ranzuglia, G. MeshLab: An Open-Source Mesh Processing Tool. In Proceedings of the 6th Eurographics Italian Chapter Conference, Salerno, Italy, 2 July 2008; pp. 129–136. [Google Scholar]


© 2020 by the authors. Licensee MDPI, Basel, Switzerland. This article is an open access article distributed under the terms and conditions of the Creative Commons Attribution (CC BY) license (http://creativecommons.org/licenses/by/4.0/).