Estimating River Sediment Discharge in the Upper Mississippi River Using Landsat Imagery


Abstract
1. Introduction
2. Materials and Methods
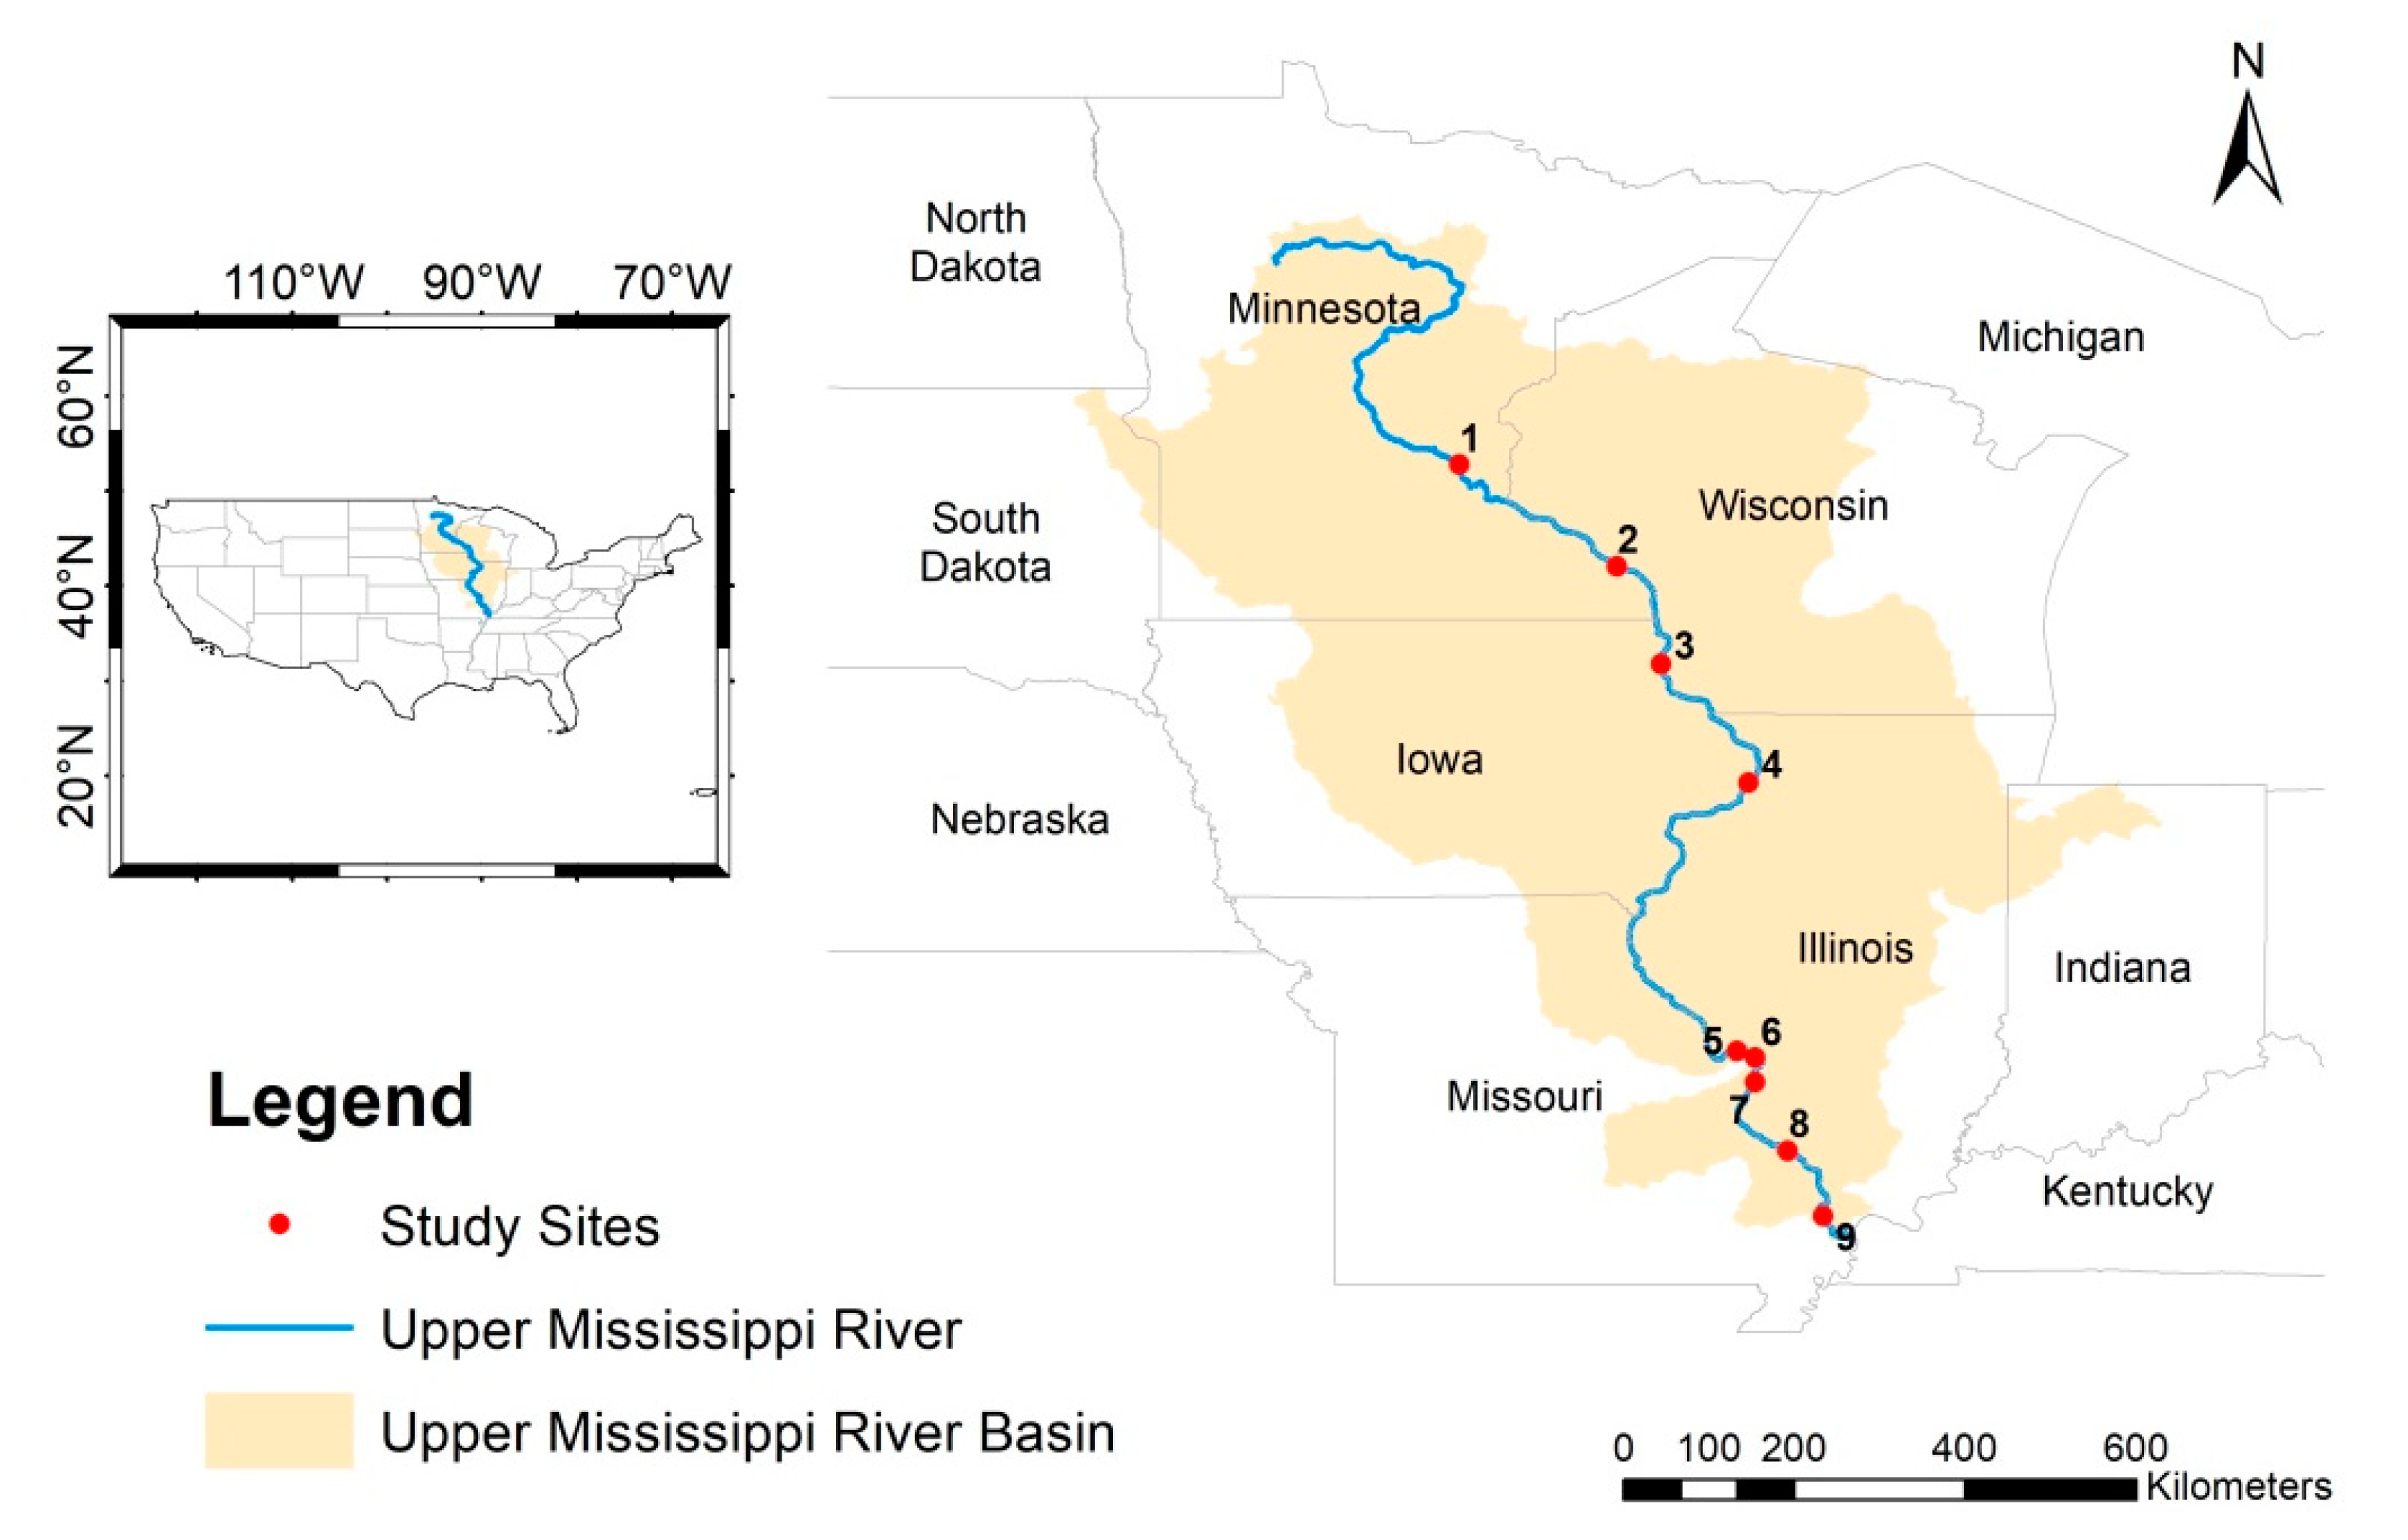
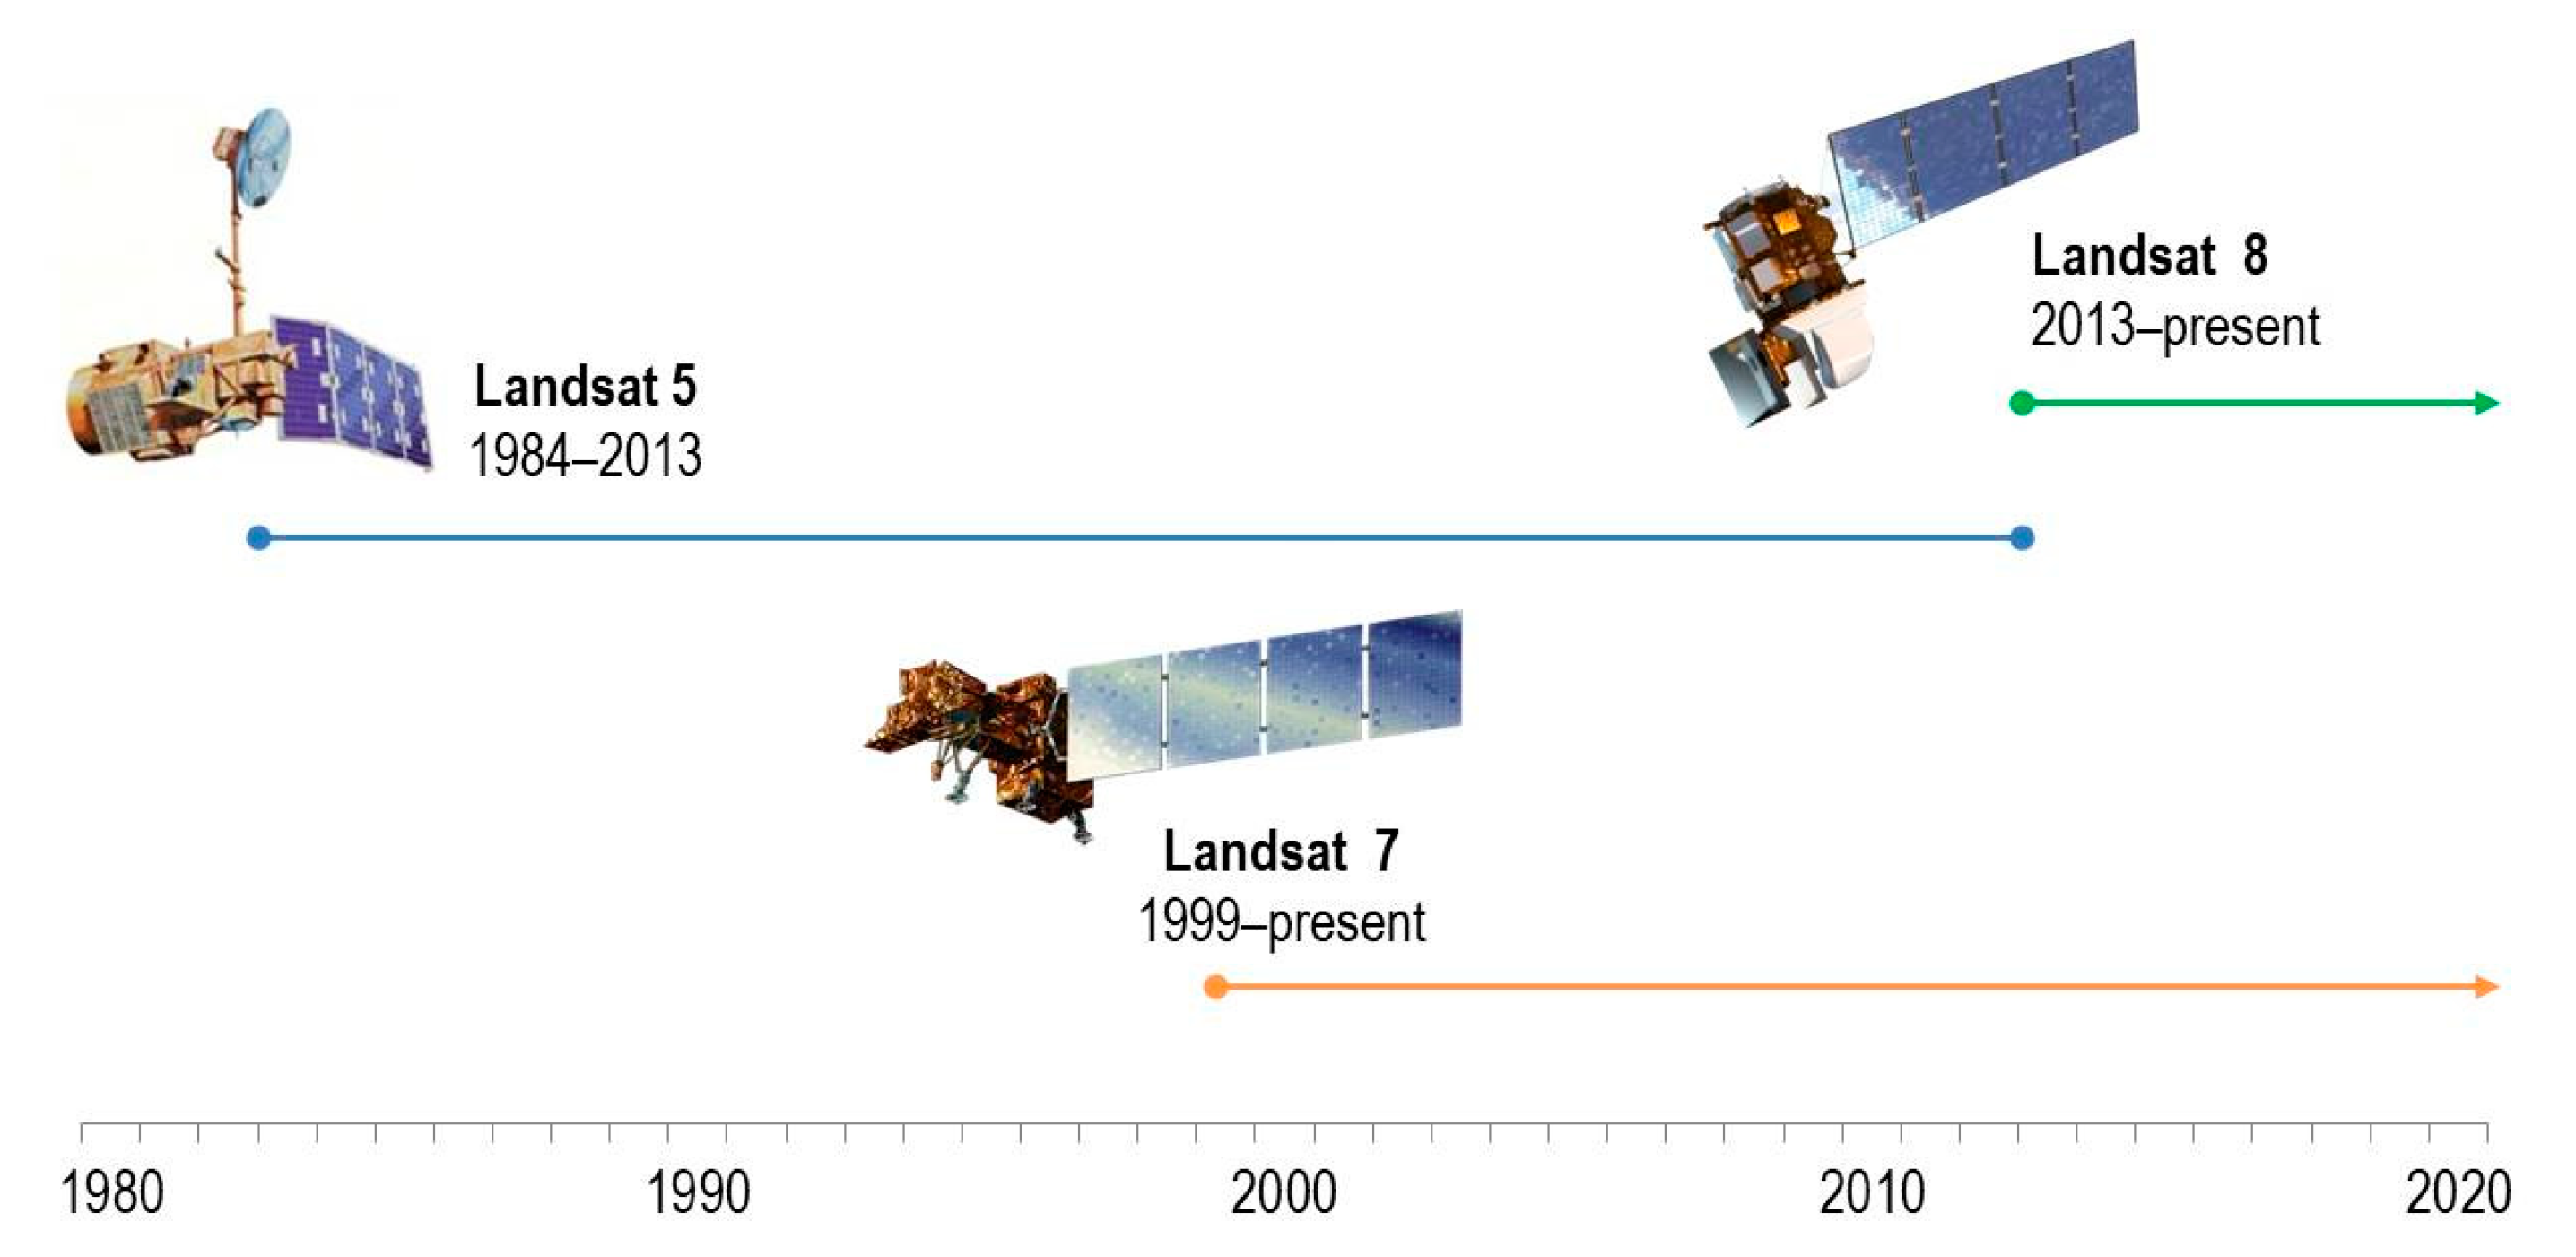
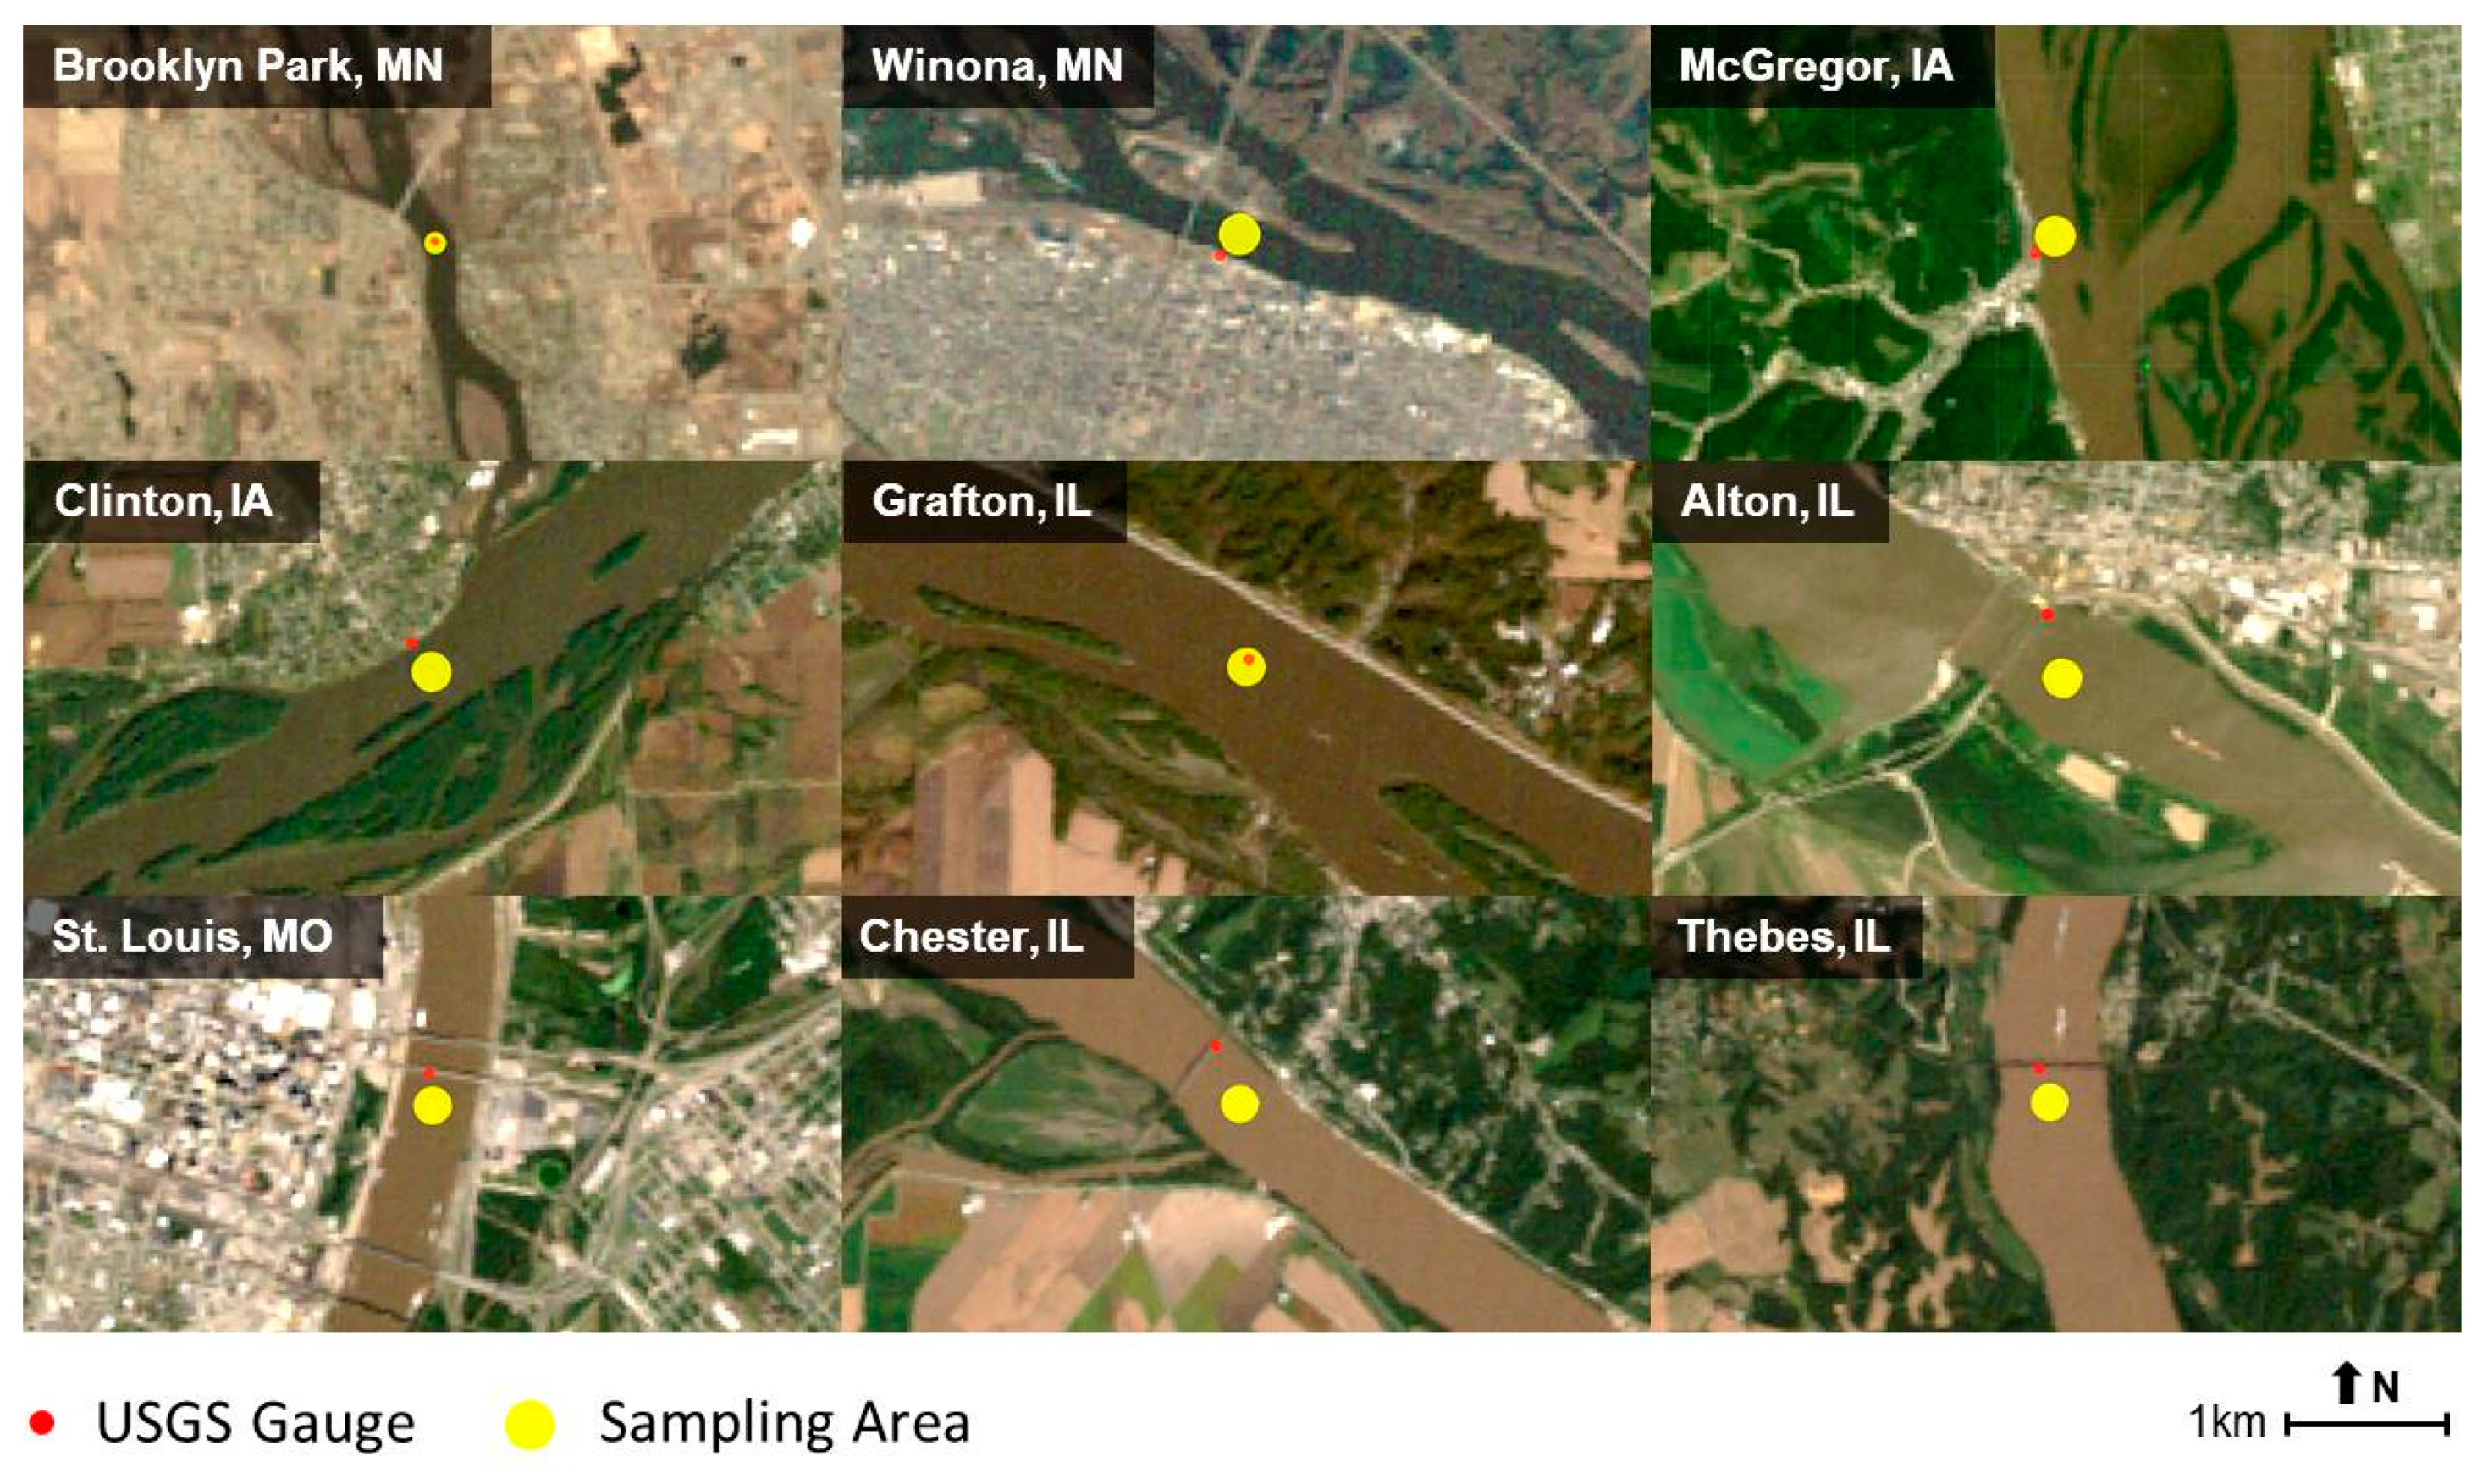
2.1. Study Sites and Data
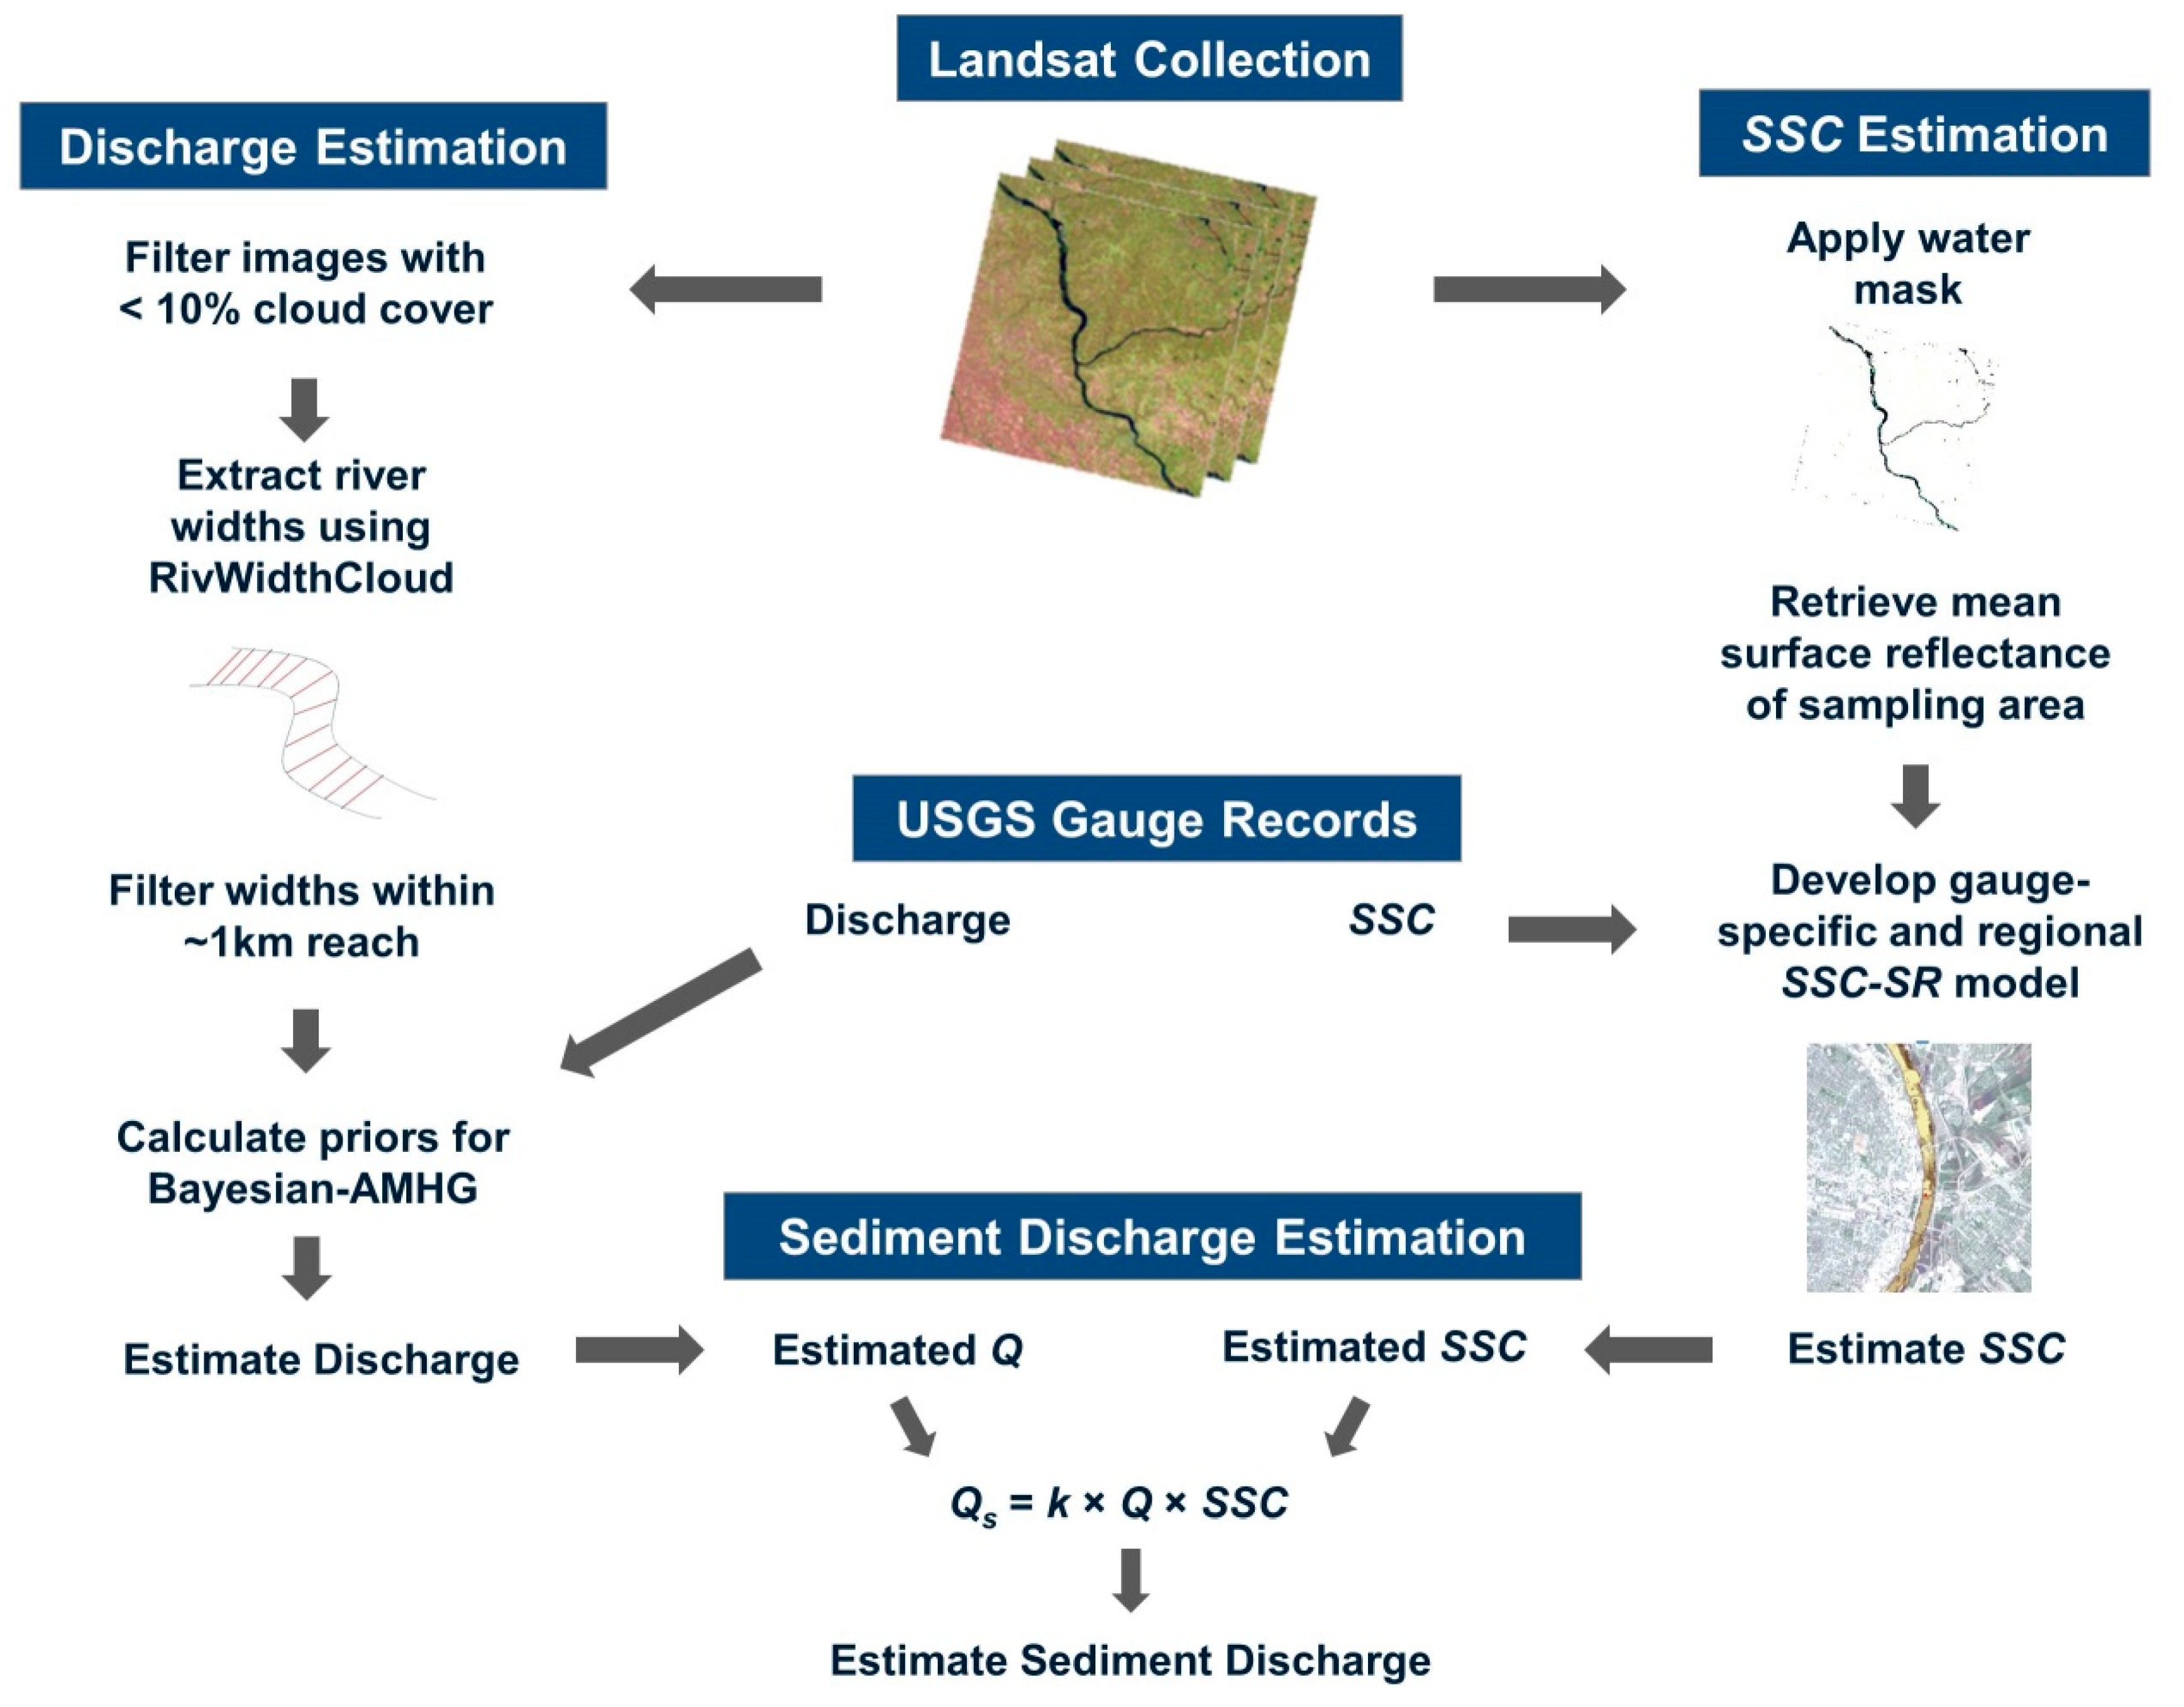
2.2. River Discharge Estimation using Landsat Imagery
2.3. Estimating Suspended Sediment Concentration
2.4. Sediment Discharge Estimation and Performance Evaluation
3. Results
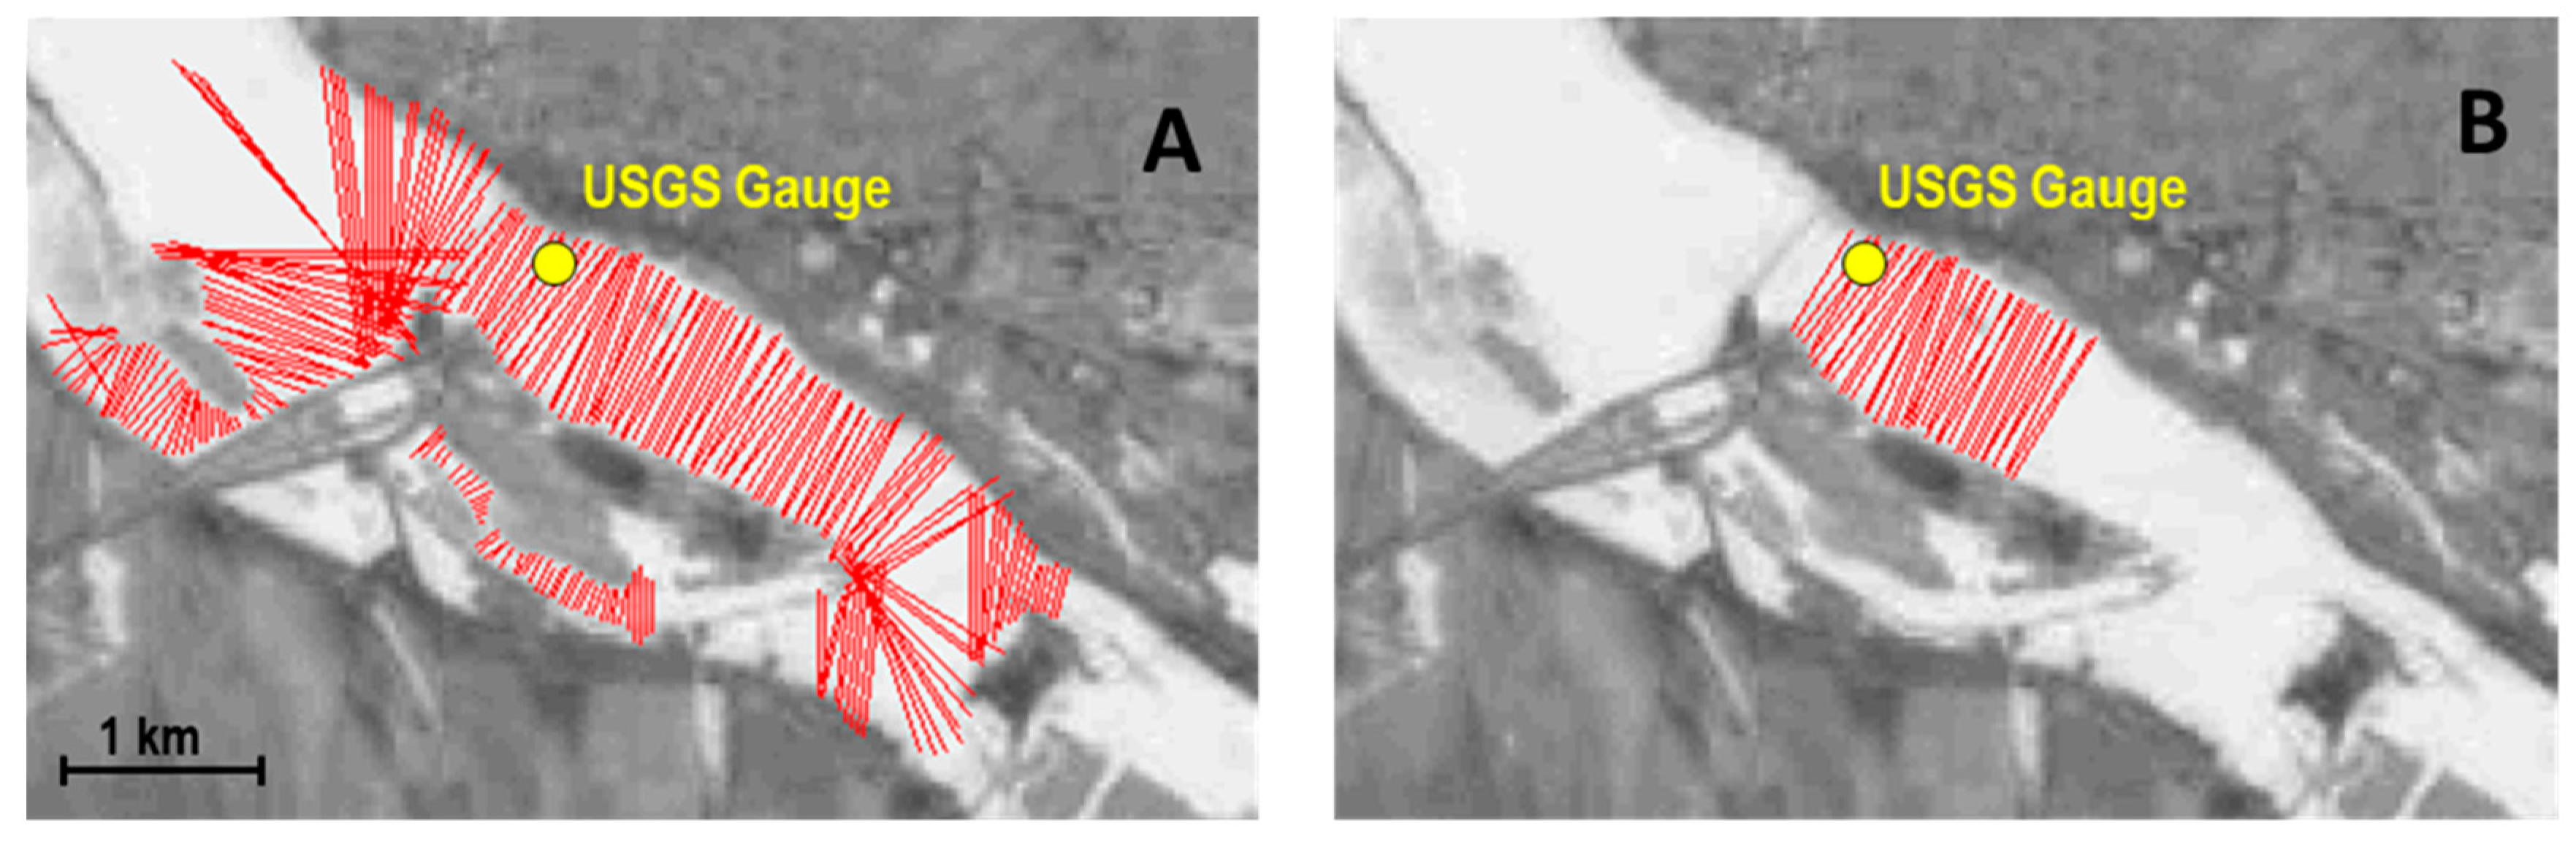
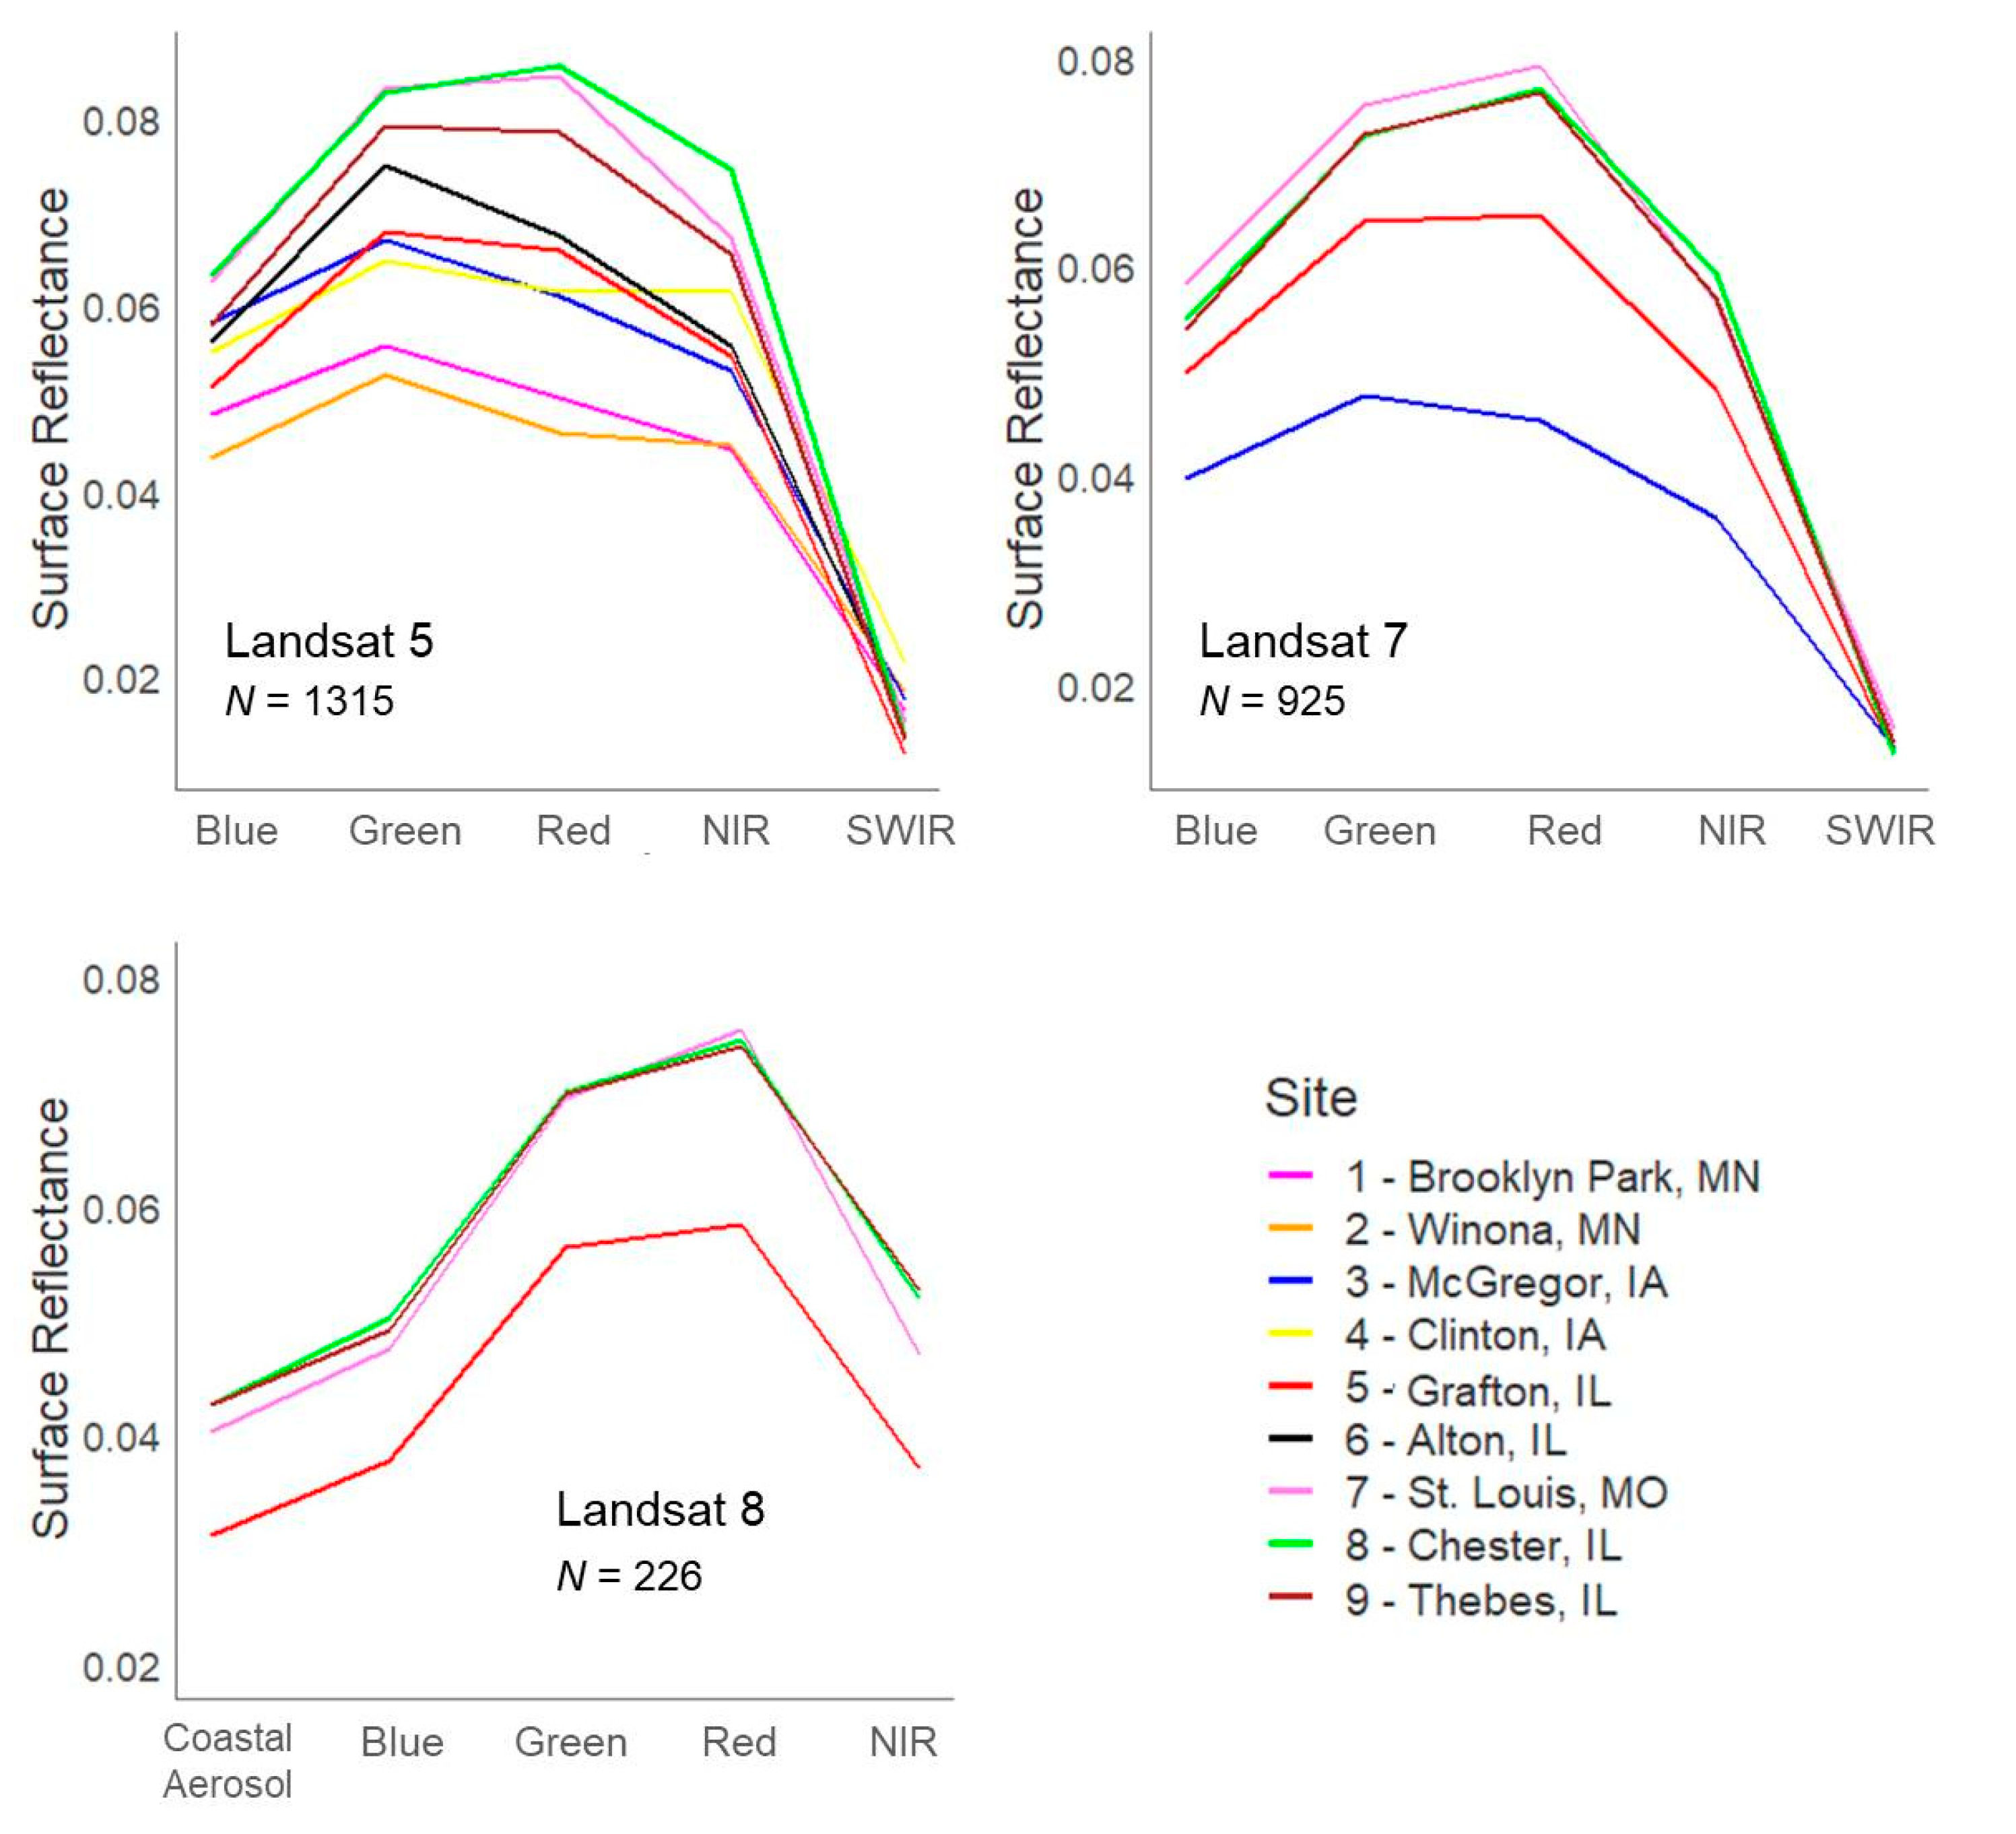
3.1. River Widths and Landsat Surface Reflectance Retrieval
3.2. River Discharge Estimation
3.2.1. Sensitivity Analysis for Q Prior
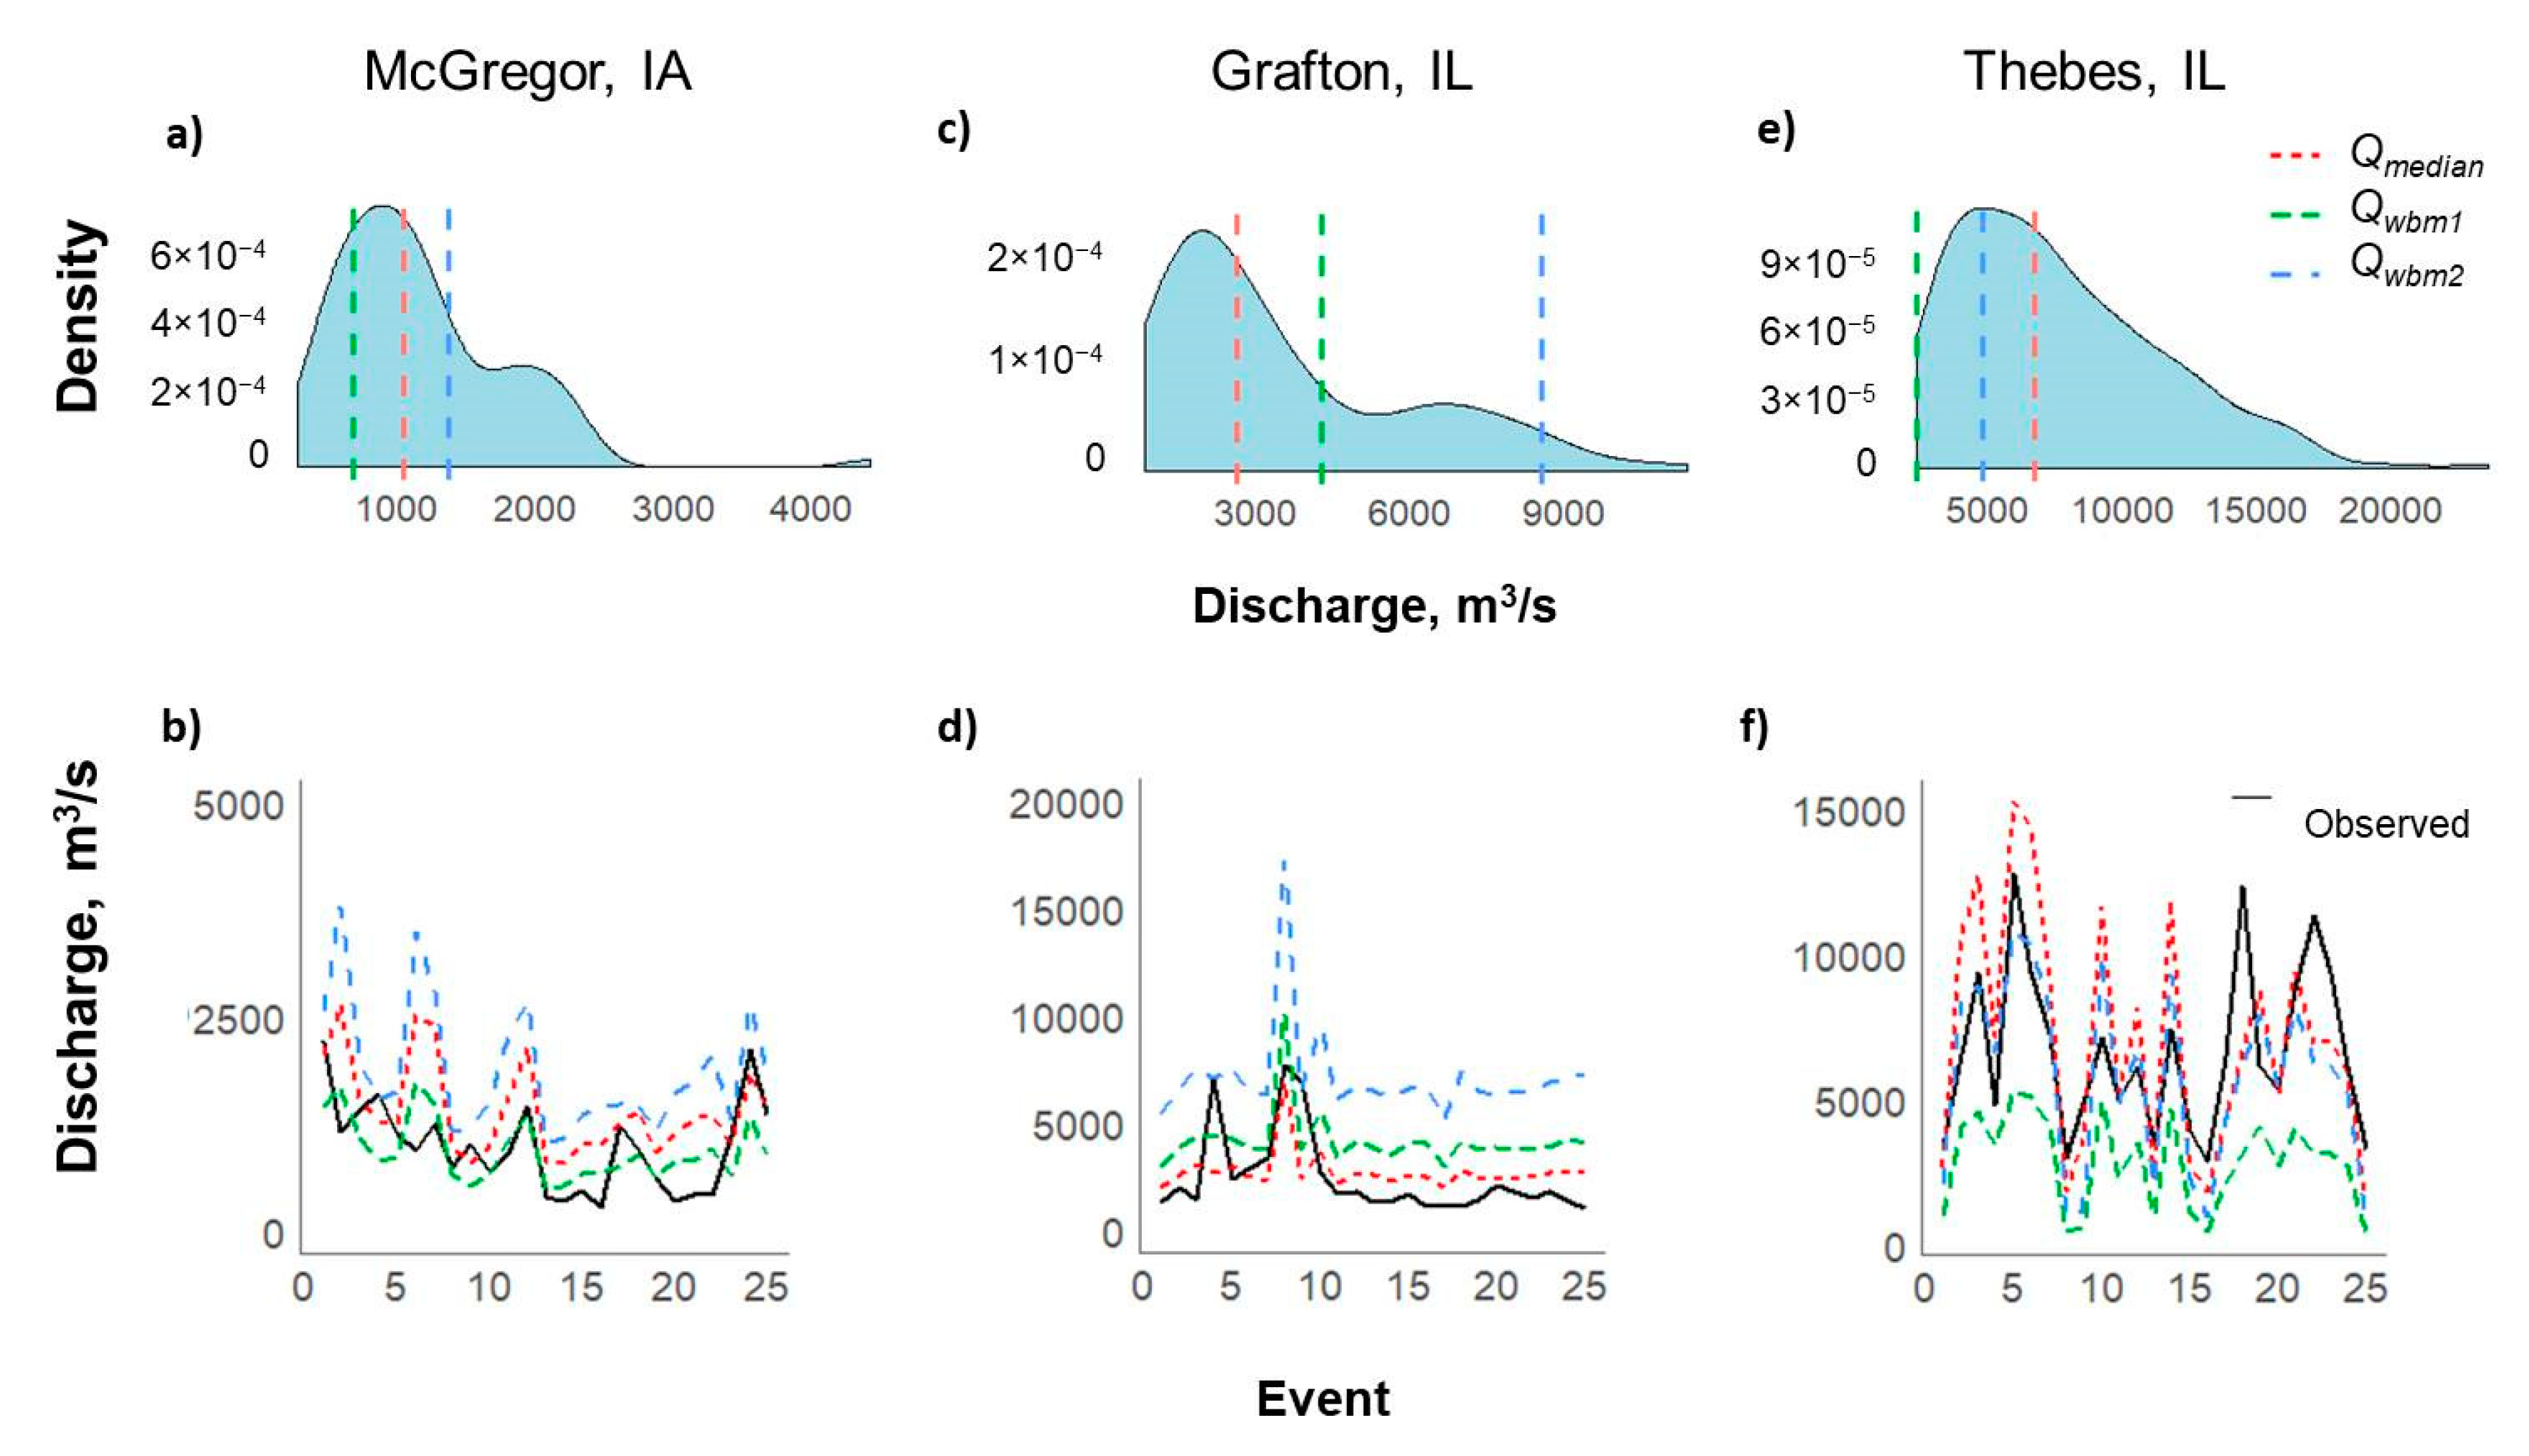
3.2.2. Width-Based Discharge Estimates
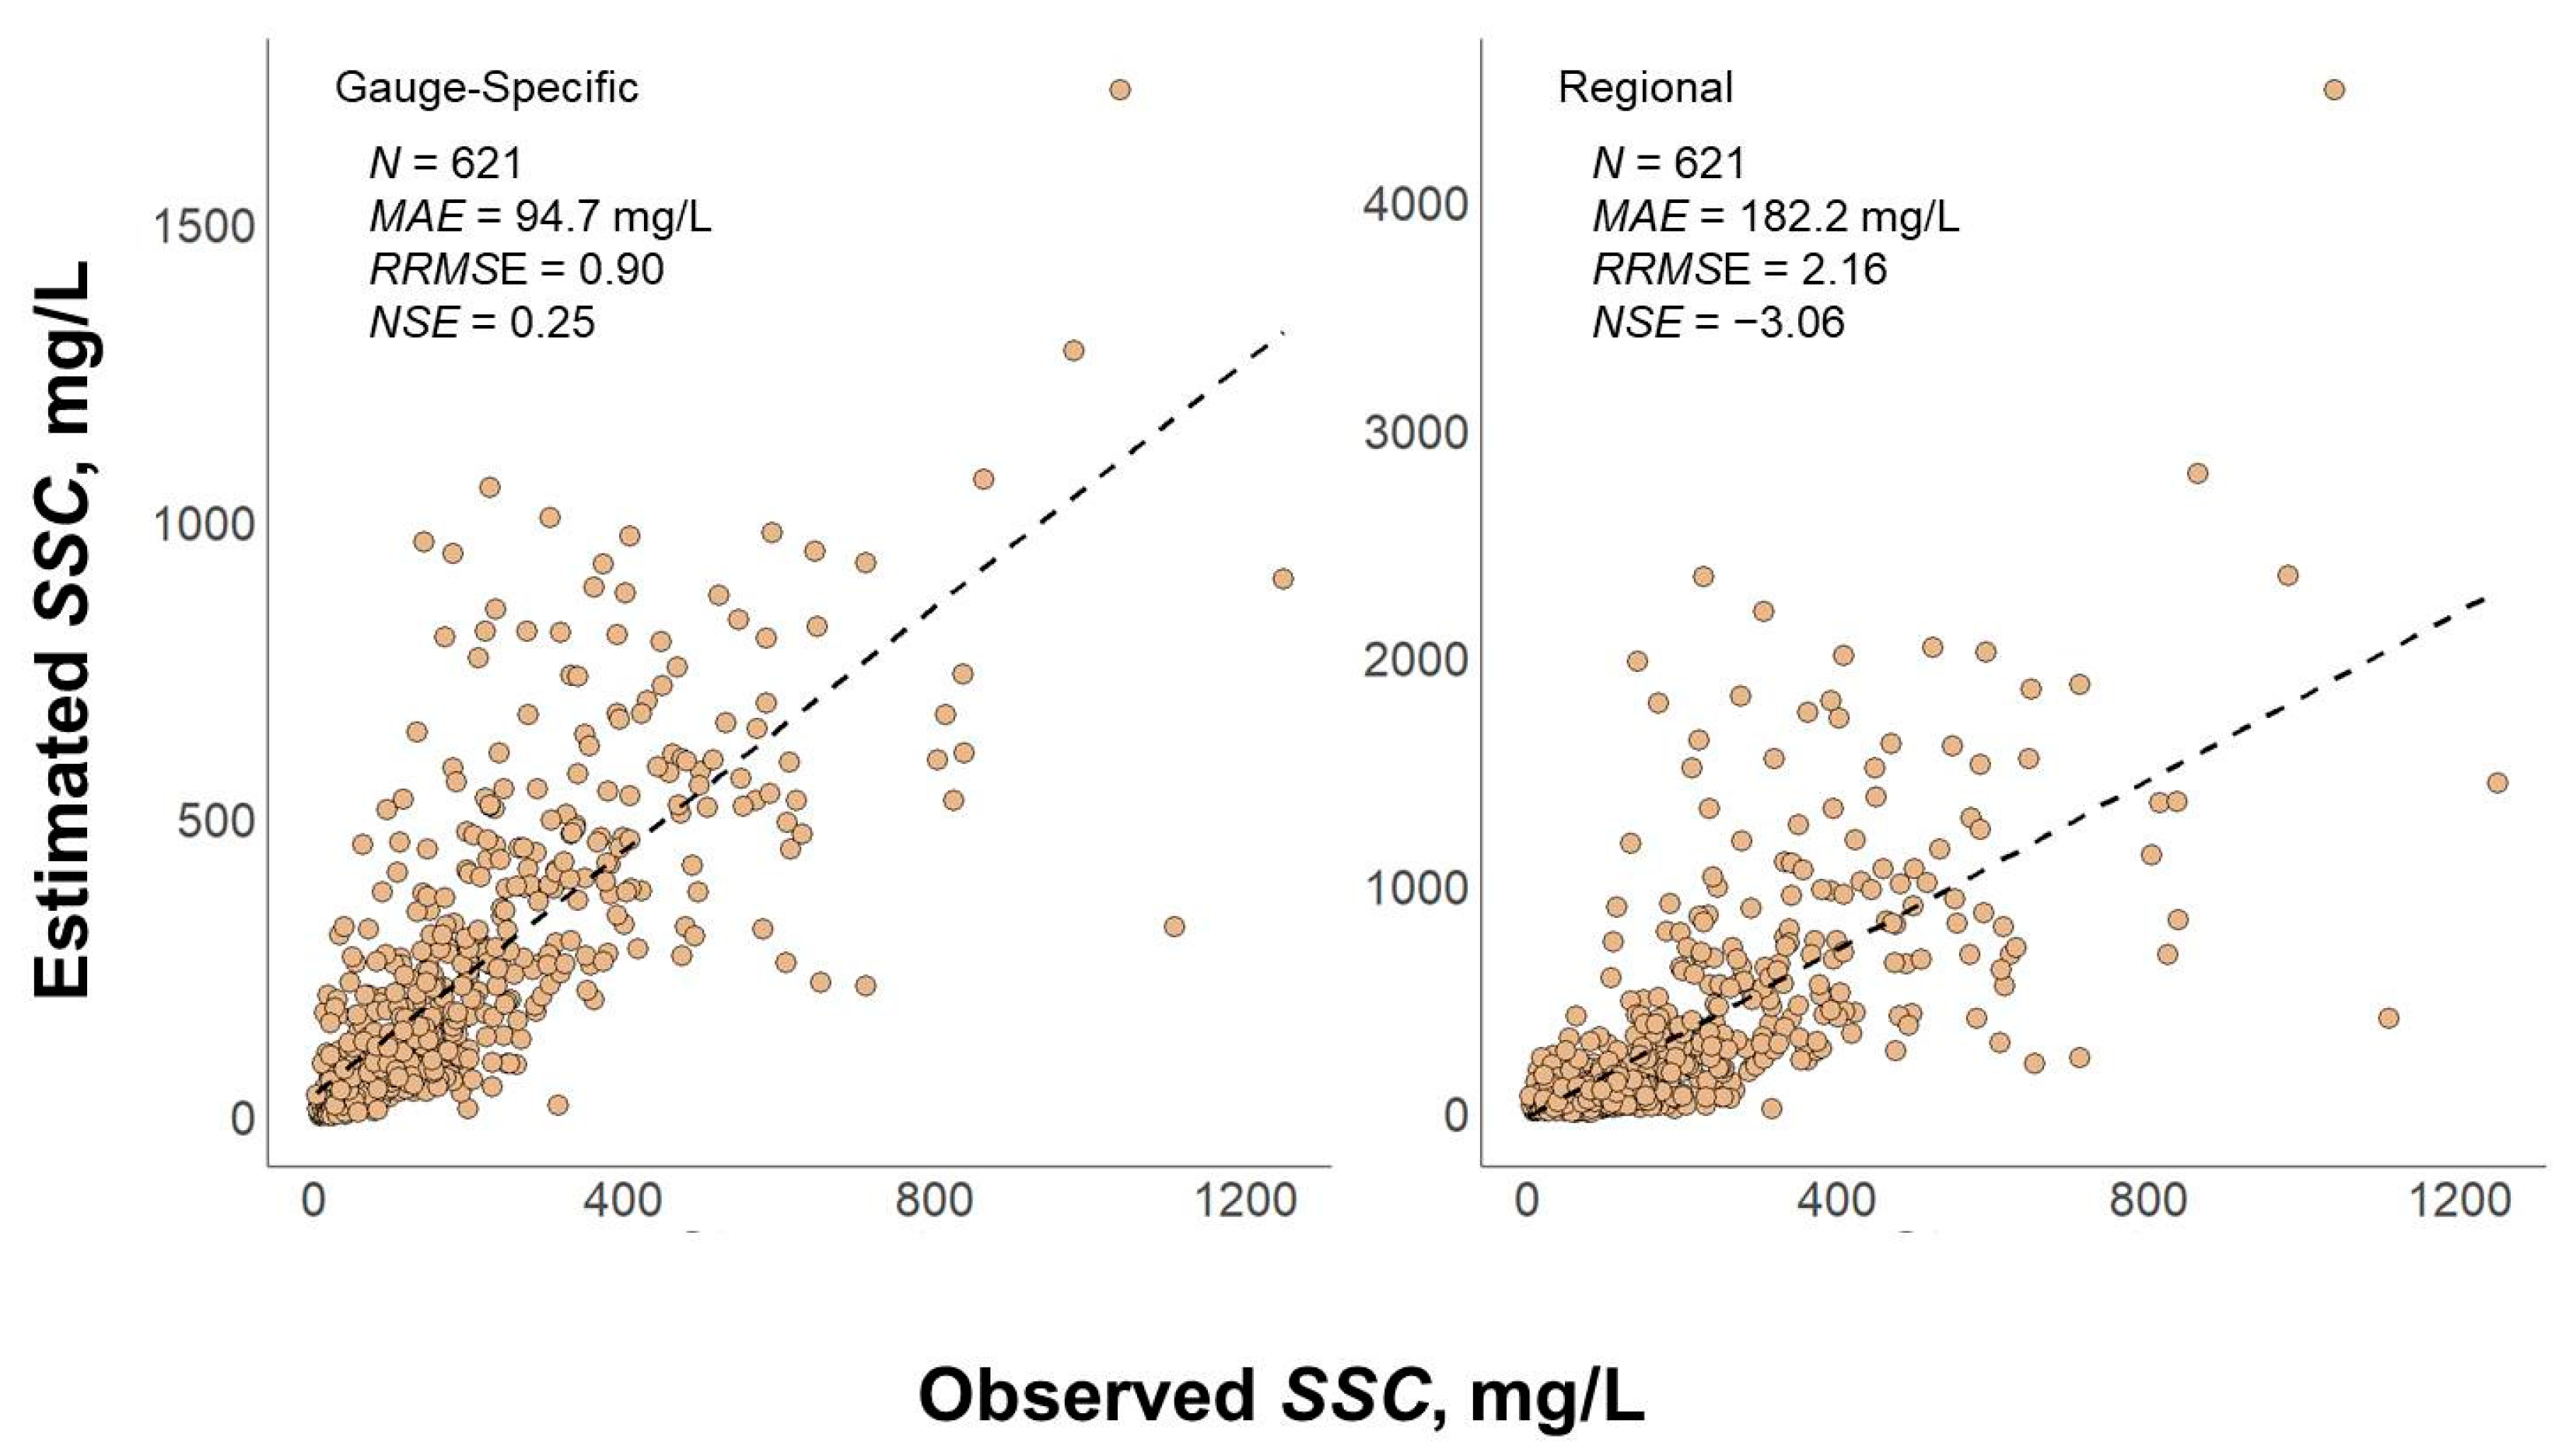
3.3. Suspended Sediment Concentration Estimation
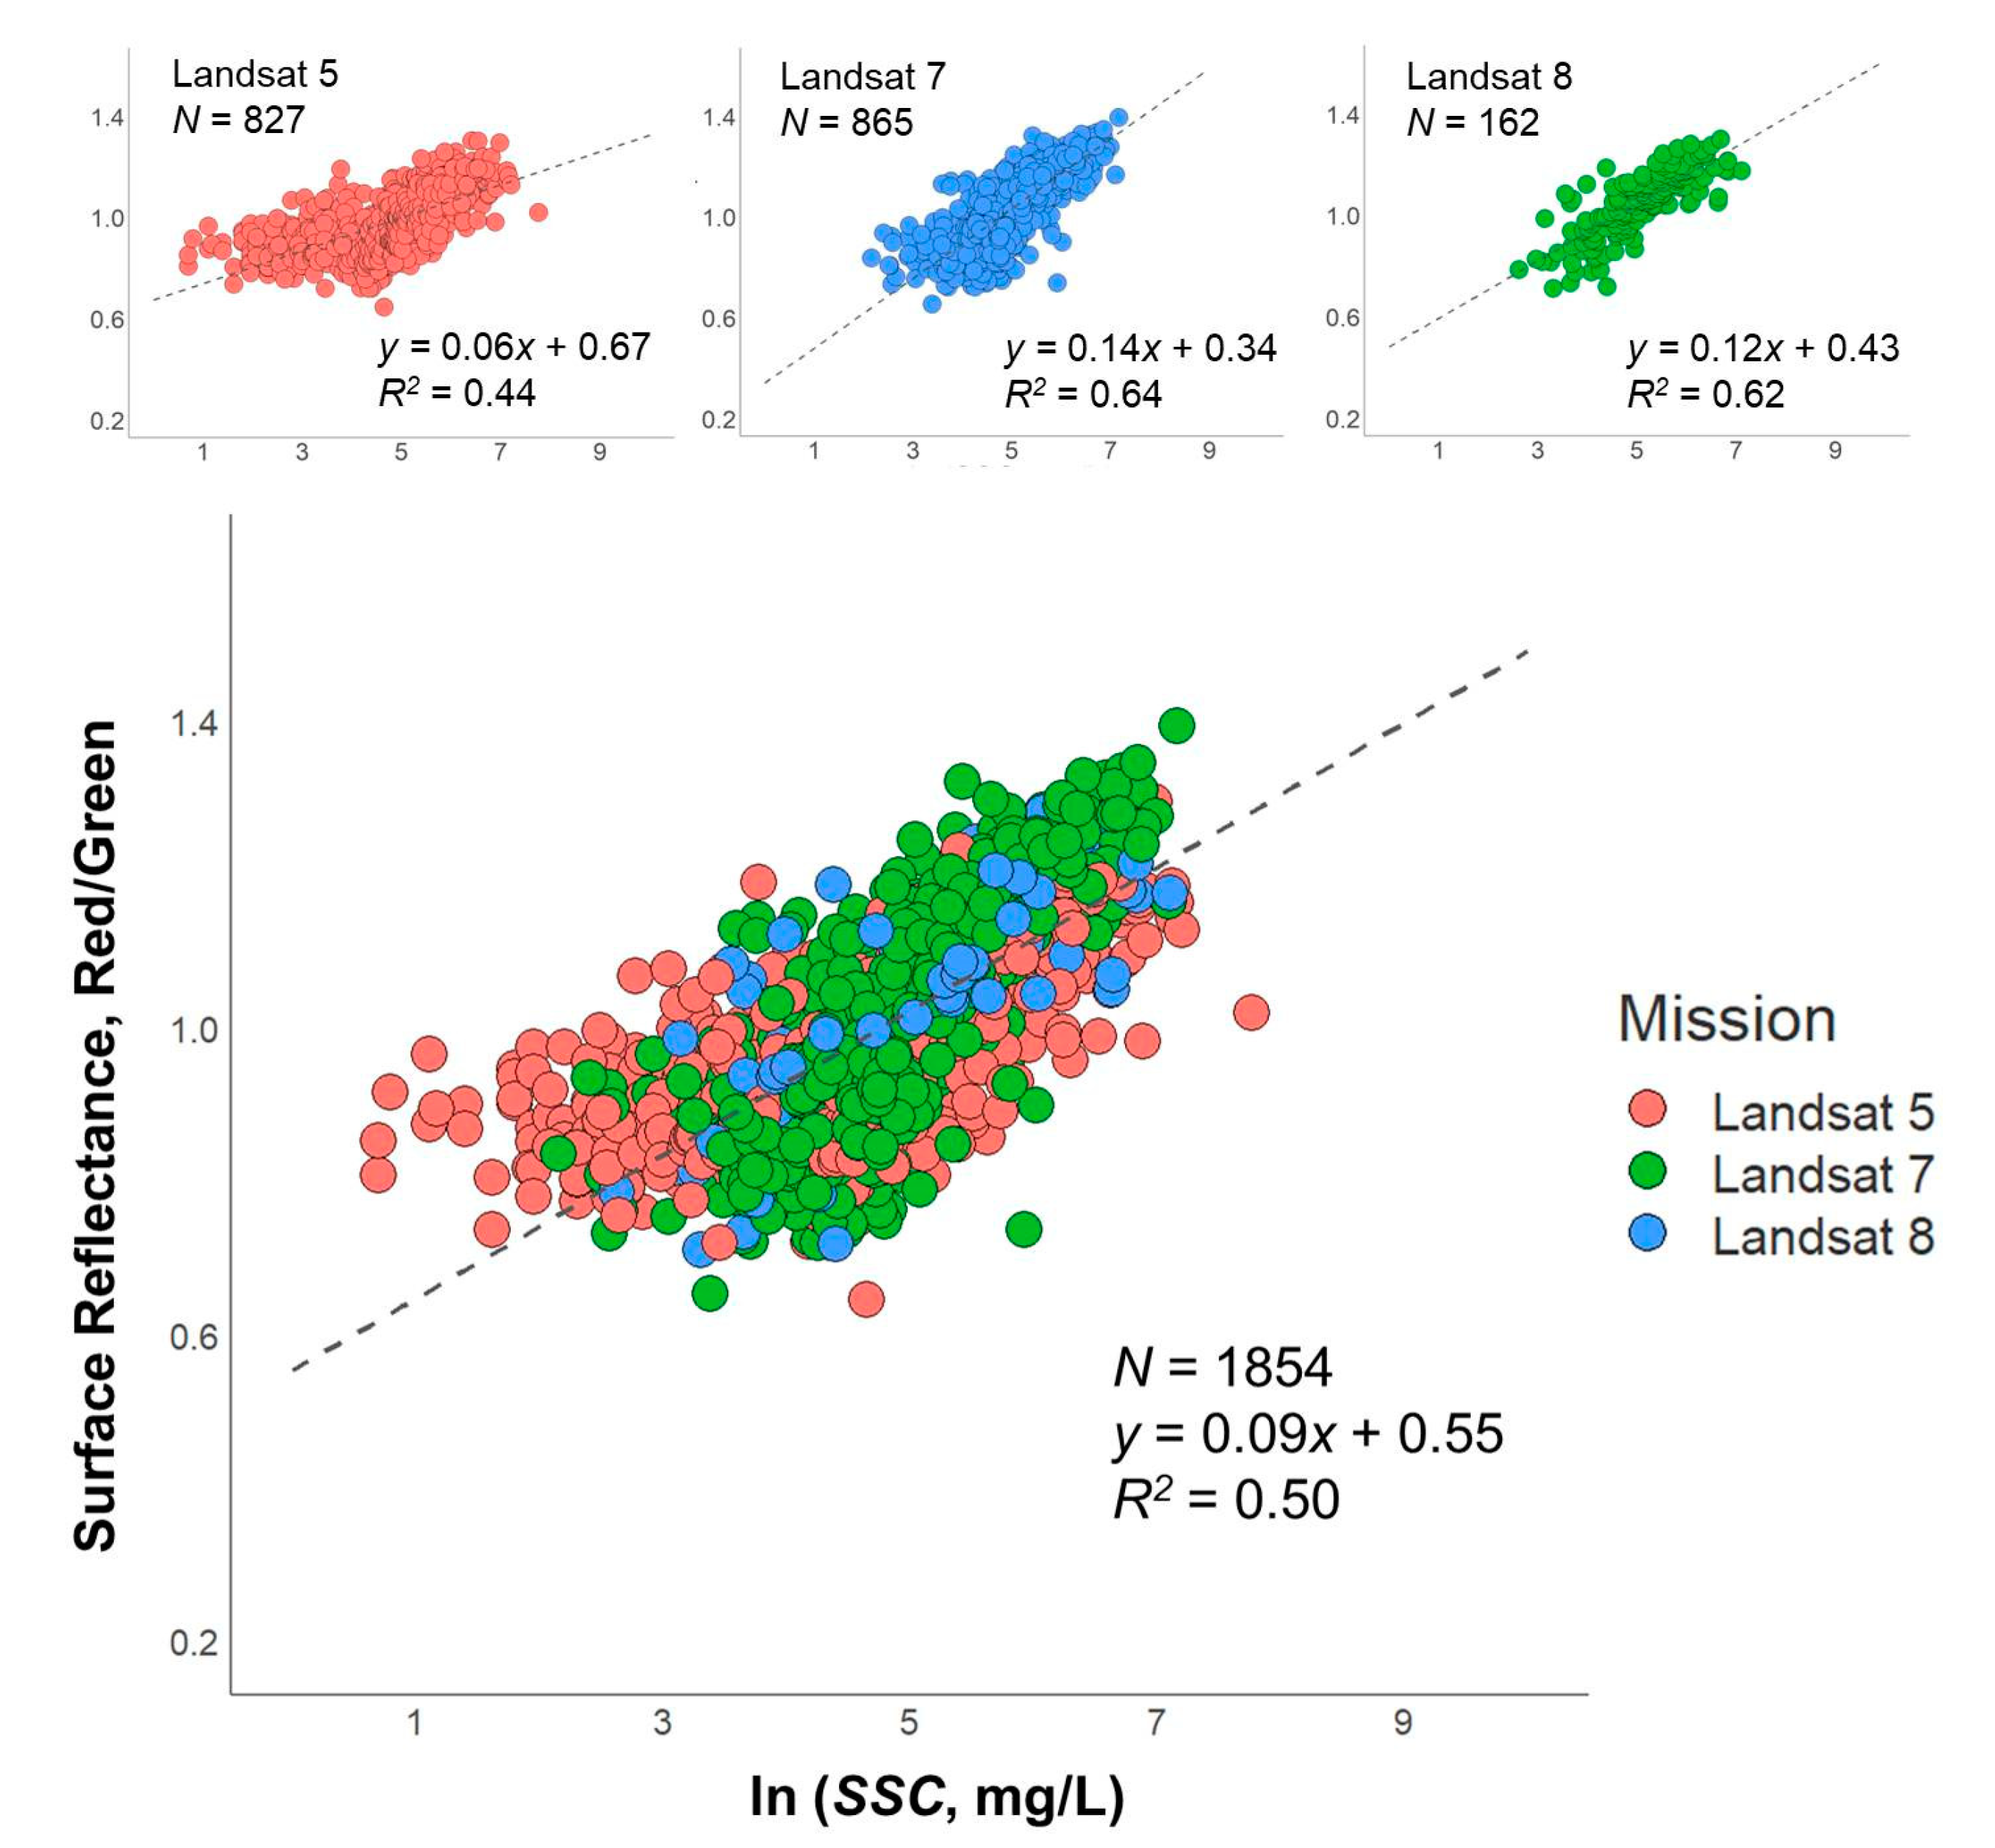
3.3.1. Gauge-Specific SSC-SR Model
3.3.2. Regional-Scale SSC-SR Model
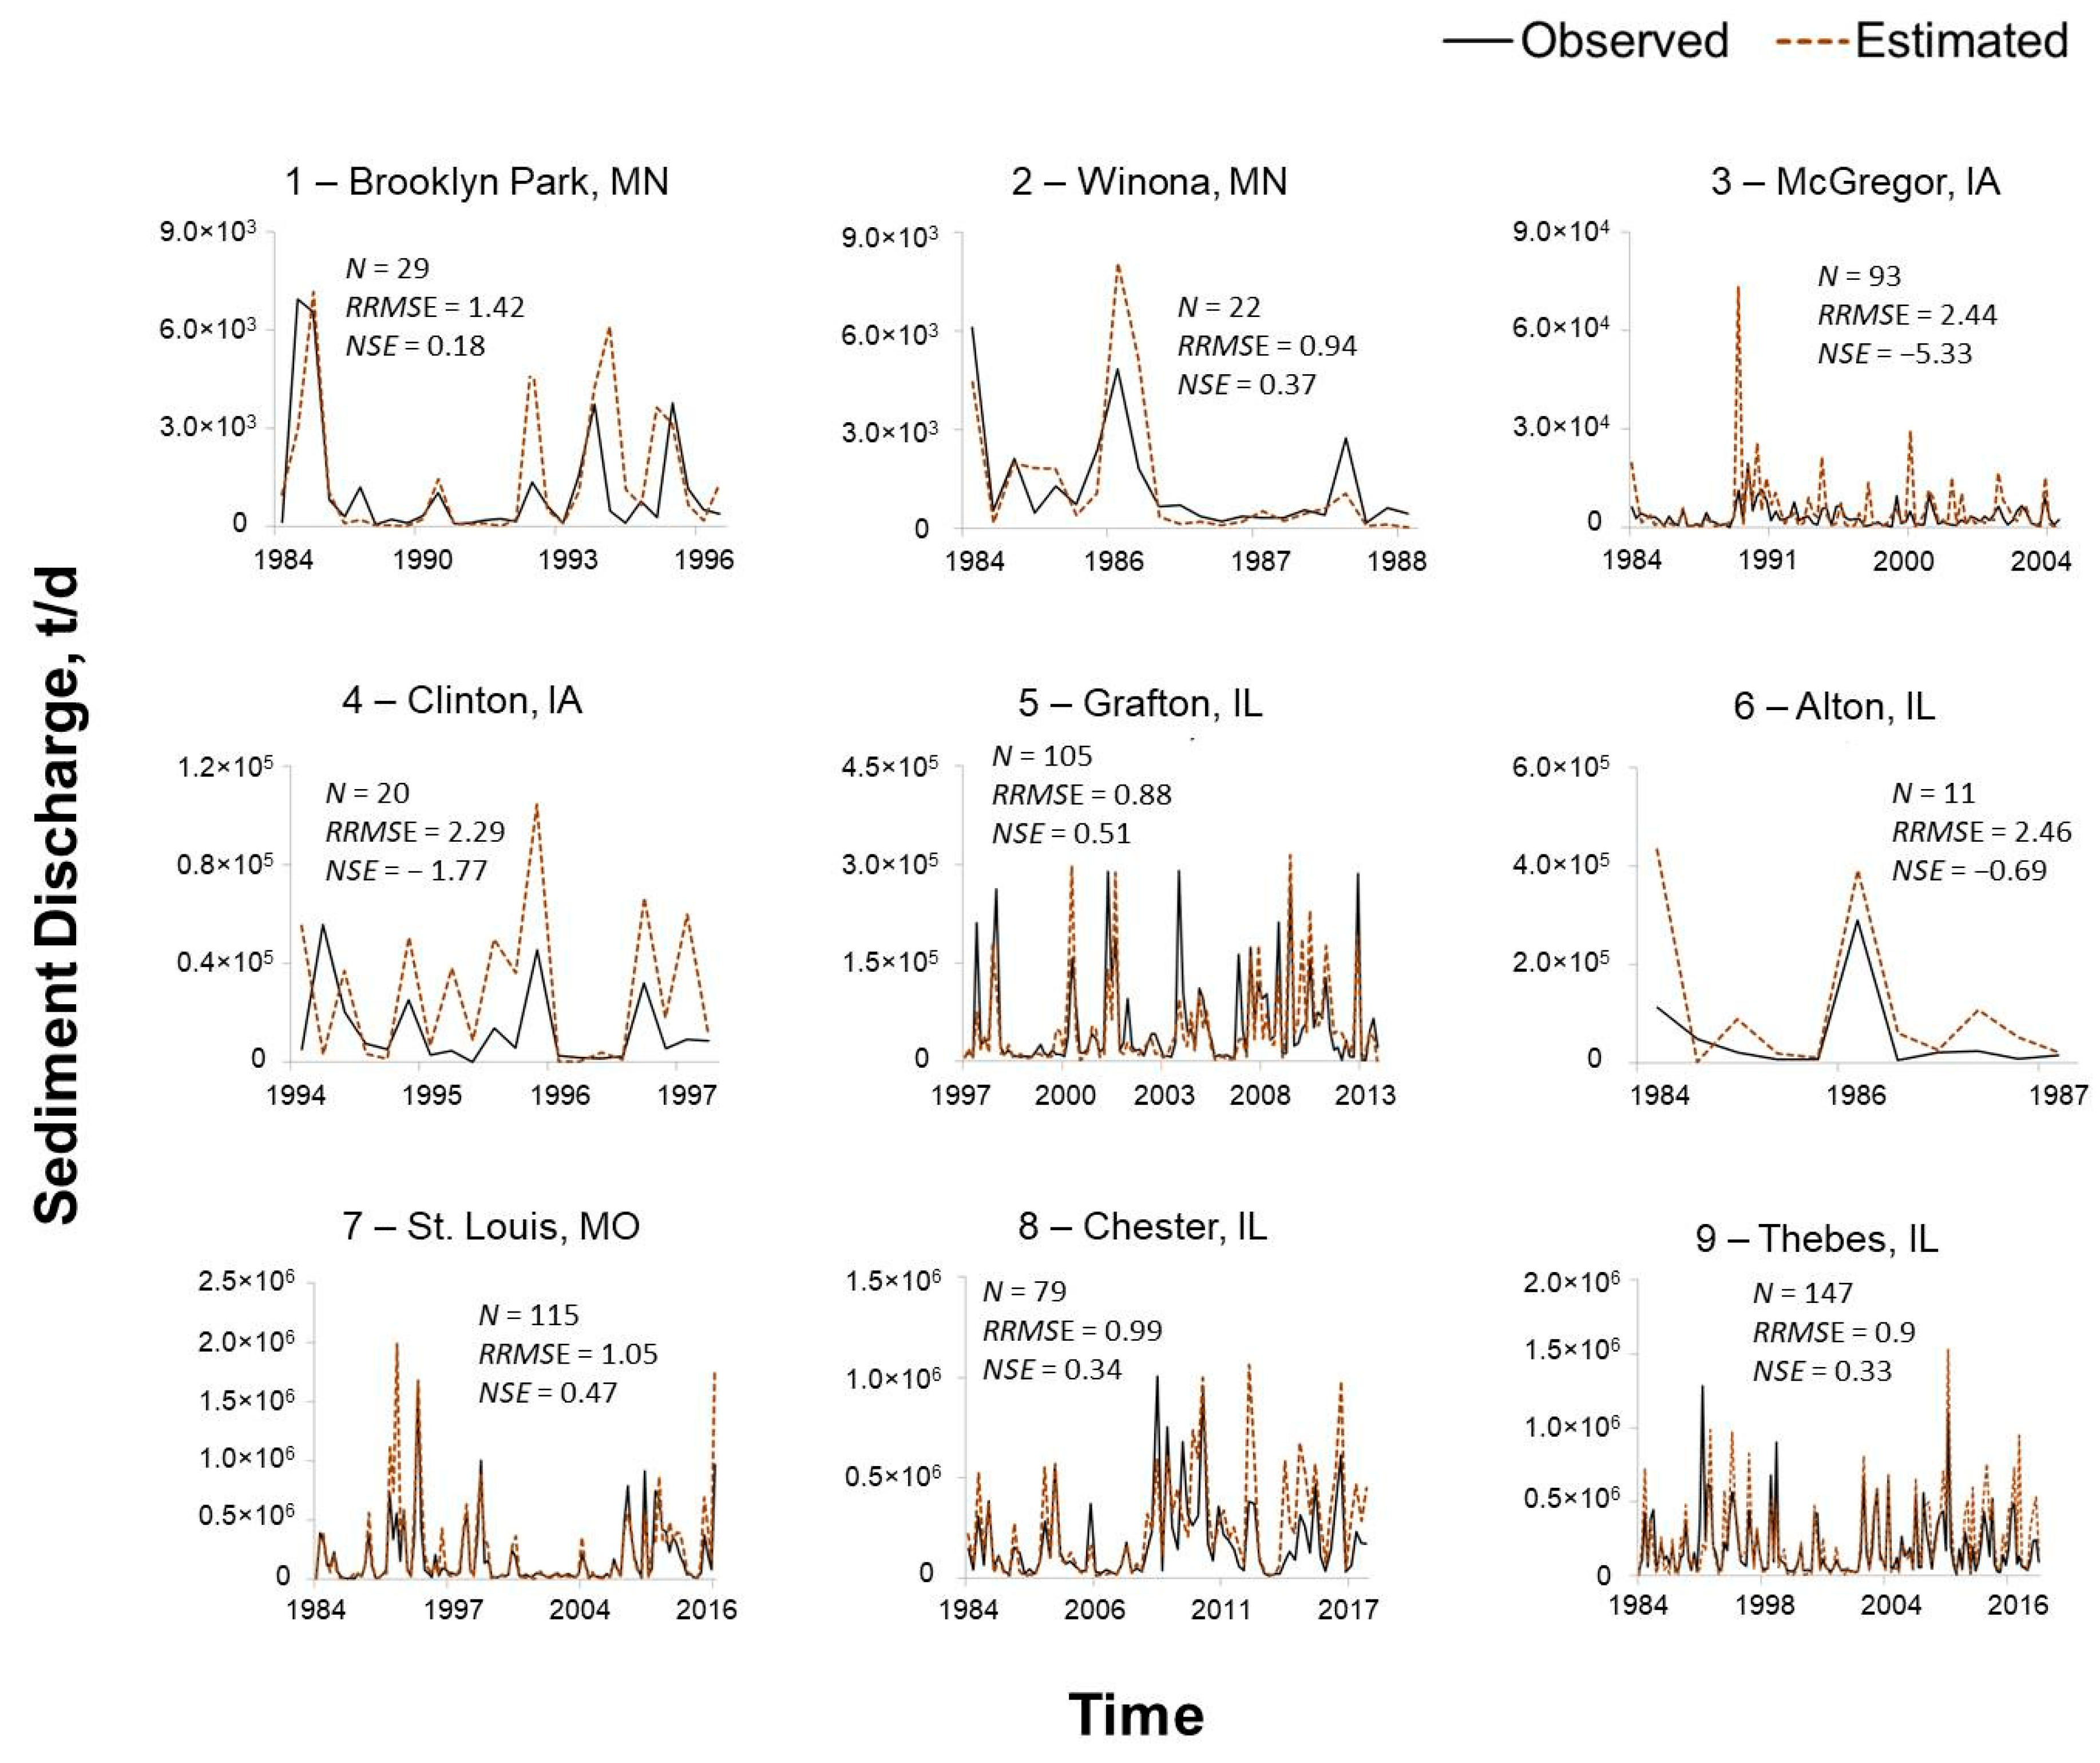
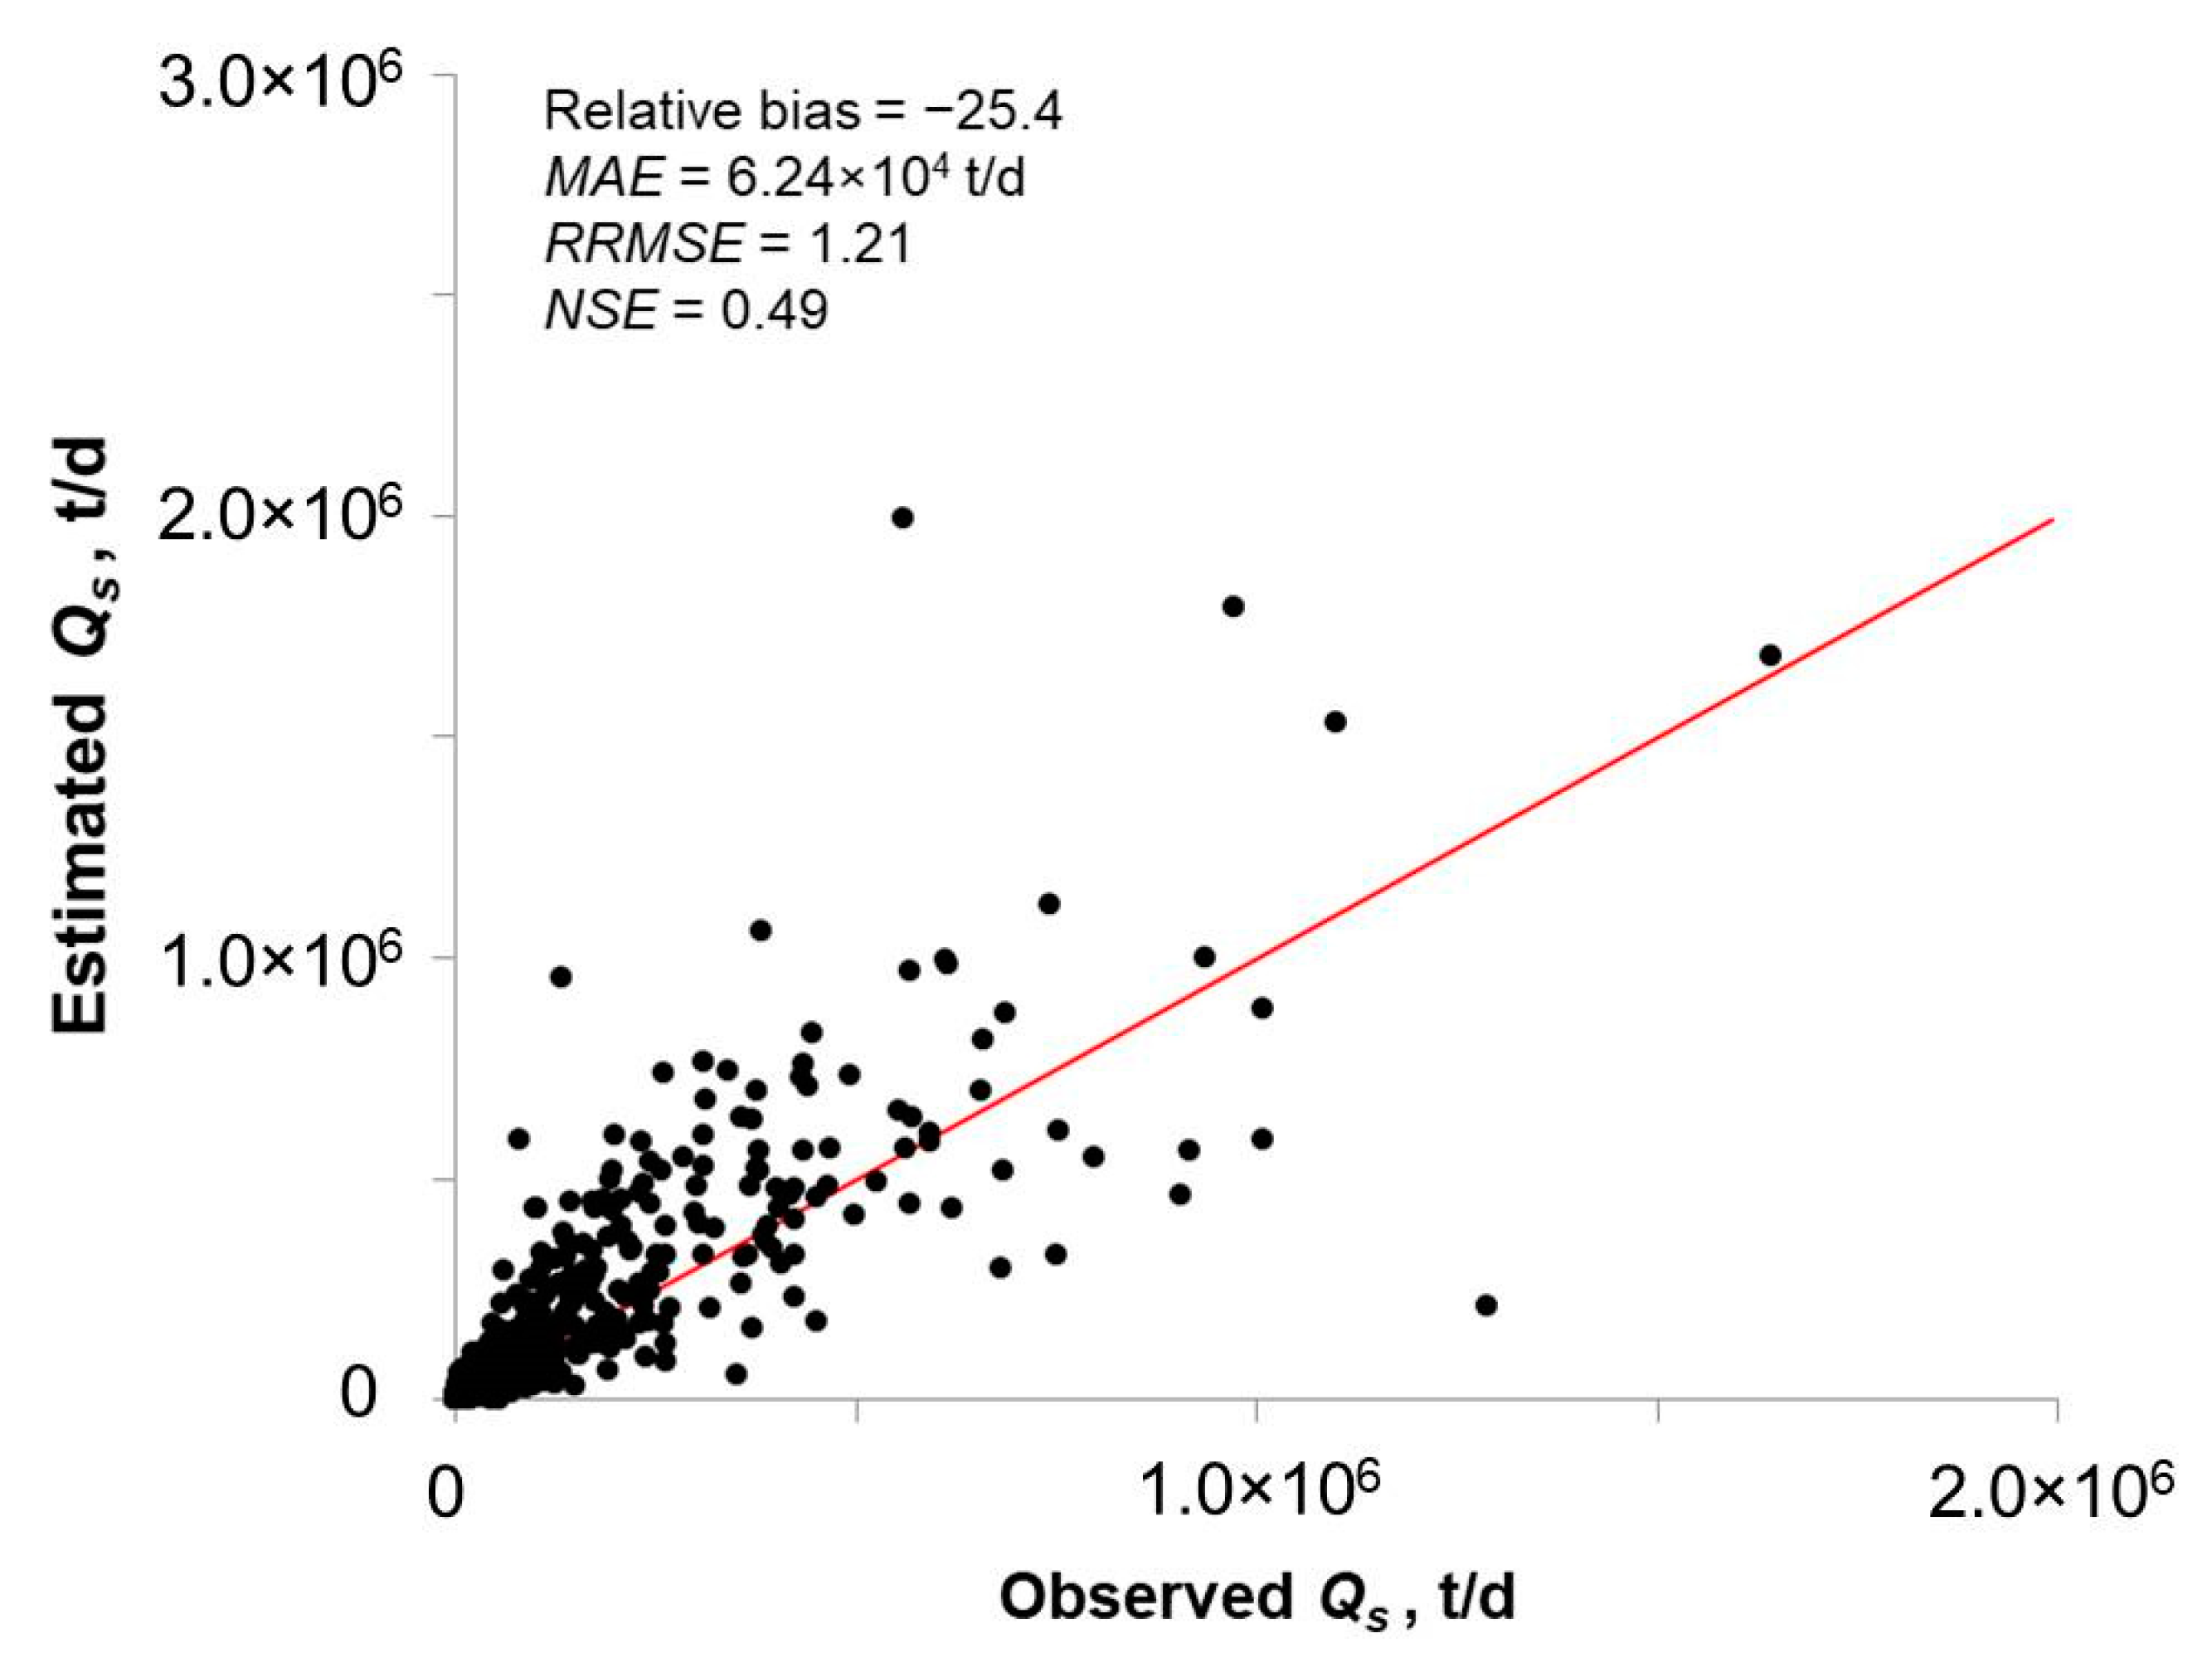
3.4. Sediment Discharge Estimation
4. Discussion
5. Conclusions
- Width outputs from RivWidthCloud can be effectively used for Bayesian-AMHG inference of river discharge.
- Discharge estimations are influenced by both prior information and morphologic features along the river.
- Higher biases and errors in SSC estimates tended to result from Landsat 5 sensors capturing scenes with low sediment levels in the water column. This suggests that for Landsat 5 surface reflectance data, additional band combinations should be explored.
- Landsat imagery-based estimates of Q and SSC can yield reasonable sediment discharge estimates. In this study of the Upper Mississippi River, estimates had a relative bias of −25.4, MAE of 6.24 × 10⁴ t/d, RRMSE of 1.21, and NSE of 0.49.
- Because sediment discharge estimates are the product of two other independent estimates (water discharge and SSC), biases and errors from these component estimates can either increase or decrease the magnitude of errors in the sediment discharge estimates.
- Even without gauge records for calibrations, this method can be used to estimate water and sediment discharges of rivers, and to evaluate and screen for rivers susceptible to extreme flooding or exhibiting excessive sedimentation.
Supplementary Materials
Author Contributions
Funding
Acknowledgments
Conflicts of Interest
References
- Aylward, B.; Bandyopadhyay, J.; Belausteguigotia, J.C. Freshwater ecosystem services. In Ecosystems and Human Well-Being: Policy Responses; Island Press: Washington, DC, USA, 2005; Volume 3, pp. 213–254. [Google Scholar]
- Böck, K.; Polt, R.; Schülting, L. Ecosystem services in river landscapes. In Riverine Ecosystem Management; Springer: Cham, Switzerland, 2018; pp. 413–433. [Google Scholar]
- Khatri, N.; Tyagi, S. Influences of natural and anthropogenic factors on surface and groundwater quality in rural and urban areas. Front. Life Sci. 2015, 8, 23–39. [Google Scholar] [CrossRef]
- Adeosun, F.; Adams, T.; Amrevuawho, M. Effect of anthropogenic activities on the water quality parameters of federal university of agriculture Abeokuta reservoir. Int. J. Fish. Aquat. Stud. 2016, 4, 104–108. [Google Scholar]
- Cheng, Y.; He, H.; Cheng, N.; He, W. The effects of climate and anthropogenic activity on hydrologic features in Yanhe River. Adv. Meteorol. 2016, 2016, 1–11. [Google Scholar] [CrossRef]
- Zhang, X.F.; Yan, H.C.; Yue, Y.; Xu, Q.X. Quantifying natural and anthropogenic impacts on runoff and sediment load: An investigation on the middle and lower reaches of the Jinsha River Basin. J. Hydrol. Reg. Stud. 2019, 25, 100617. [Google Scholar] [CrossRef]
- Chimwanza, B.; Mumba, P.P.; Moyo, B.H.Z.; Kadewa, W. The impact of farming on river banks on water quality of the rivers. Int. J. Environ. Sci. Technol. 2006, 2, 353–358. [Google Scholar] [CrossRef]
- Ayobahan, S.U.; Ezenwa, I.M.; Orogun, E.E.; Uriri, J.E.; Wemimo, I.J. Assessment of anthropogenic activities on water quality of Benin River. J. Appl. Sci. Environ. Manag. 2014, 18, 629–636. [Google Scholar] [CrossRef][Green Version]
- Gunawardena, A.; Wijeratne, E.M.S.; White, B.; Hailu, A.; Pandit, R. Industrial pollution and the management of river water quality: A model of Kelani River, Sri Lanka. Environ. Monit. Assess. 2017, 189, 457. [Google Scholar] [CrossRef]
- Camara, M.; Jamil, N.R.; Abdullah, A.F.B. Impact of land uses on water quality in Malaysia: A review. Ecol. Process. 2019, 8, 10. [Google Scholar] [CrossRef]
- Chetty, S.; Pillay, L. Assessing the influence of human activities on river health: A case for two South African rivers with differing pollutant sources. Environ. Monit. Assess. 2019, 191, 168. [Google Scholar] [CrossRef]
- Gordon, C.; Nukpezah, D.; Lawson, E.T.; Ofori, B.D.; Tawiah, D.Y.; Pabi, O.; Ayivor, J.S.; Koranteng, D.; Mensah, A.M. West Africa—Water resources vulnerability using a multidimensional approach: Case study of Volta Basin. Clim. Vulnerability 2013, 2, 283–309. [Google Scholar]
- Hauer, C.; Leitner, P.; Unfer, G.; Pulg, U.; Habersack, H.; Graf, W. The role of sediment and sediment dynamics in the aquatic environment. In Riverine Ecosystem Management; Springer: Cham, Switzerland, 2018; pp. 151–169. [Google Scholar]
- Tundu, C.; Tumbare, M.J.; Onema, J.M.K. Sedimentation and its impacts/effects on river system and reservoir water quality: Case study of Mazowe catchment, Zimbabwe. Proc. Int. Assoc. Hydrol. Sci. 2018, 377, 57. [Google Scholar] [CrossRef]
- Walling, D.E. The United Nations world water assessment programme. In The Impact of Global Change on Erosion and Sediment Transport by Rivers: Current Progress and Challenges; UNESCO: Paris, France, 2009. [Google Scholar]
- Walling, D.E.; Fang, D. Recent trends in the suspended sediment loads of the world’s rivers. Glob. Planet. Chang. 2003, 39, 111–126. [Google Scholar] [CrossRef]
- Martinez, J.M.; Guyot, J.L.; Filizola, N.; Sondag, F. Increase in suspended sediment discharge of the Amazon River assessed by monitoring network and satellite data. Catena 2009, 79, 257–264. [Google Scholar] [CrossRef]
- Wang, S.; Fu, B.; Piao, S.; Lü, Y.; Ciais, P.; Feng, X.; Wang, Y. Reduced sediment transport in the Yellow River due to anthropogenic changes. Nat. Geosci. 2016, 9, 38–41. [Google Scholar] [CrossRef]
- Engstrom, D.R.; Almendinger, J.E.; Wolin, J.A. Historical changes in sediment and phosphorus loading to the upper Mississippi River: Mass-Balance reconstructions from the sediments of Lake Pepin. J. Paleolimnol. 2009, 41, 563–588. [Google Scholar] [CrossRef]
- Holeman, J.N. The sediment yield of major rivers of the world. Water Resour. Res. 1968, 4, 737–747. [Google Scholar] [CrossRef]
- Milliman, J.D.; Meade, R.H. World-Wide delivery of river sediment to the oceans. J. Geol. 1983, 91, 1–21. [Google Scholar] [CrossRef]
- Meade, R.H.; Moody, J.A. Causes for the decline of suspended-sediment discharge in the Mississippi River system, 1940–2007. Hydrol. Process. Int. J. 2010, 24, 35–49. [Google Scholar] [CrossRef]
- Porterfield, G. Computation of fluvial-sediment discharge. In US Geological Survey Techniques of Water-Resources Investigations; US Government Printing Office: Washington, DC, USA, 1972. [Google Scholar]
- Gray, J.R.; Simões, F.J. Estimating sediment discharge. In Sedimentation Engineering—Processes, Measurements, Modeling, and Practice Manual; American Society of Civil Engineers (ASCE): Reston, VA, USA, 2008; Volume 110, pp. 1067–1088. [Google Scholar]
- Borah, D.K. Sediment discharge model for small watersheds. Trans. ASAE 1989, 32, 0874–0880. [Google Scholar] [CrossRef]
- Wang, G.; Hapuarachchi, P.; Ishidaira, H.; Kiem, A.S.; Takeuchi, K. Estimation of soil erosion and sediment yield during individual rainstorms at catchment scale. Water Resour. Manag. 2009, 23, 1447–1465. [Google Scholar] [CrossRef]
- Prosser, I.P.; Rutherfurd, I.D.; Olley, J.M.; Young, W.J.; Wallbrink, P.J.; Moran, C.J. Corrigendum to: Large-Scale patterns of erosion and sediment transport in river networks, with examples from Australia. Mar. Freshw. Res. 2001, 52, 817. [Google Scholar] [CrossRef]
- Merritt, W.S.; Letcher, R.A.; Jakeman, A.J. A review of erosion and sediment transport models. Environ. Model. Softw. 2003, 18, 761–799. [Google Scholar] [CrossRef]
- Smith, L.C. Satellite remote sensing of river inundation area, stage, and discharge: A review. Hydrol. Process. 1997, 11, 1427–1439. [Google Scholar] [CrossRef]
- Wass, P.D.; Marks, S.D.; Finch, J.W.; Leeks, G.J.L.; Ingram, J.K. Monitoring and preliminary interpretation of in-river turbidity and remote sensed imagery for suspended sediment transport studies in the Humber catchment. Sci. Total Environ. 1997, 194, 263–283. [Google Scholar] [CrossRef]
- Brakenridge, G.R.; Tracy, B.T.; Knox, J.C. Orbital SAR remote sensing of a river flood wave. Int. J. Remote Sens. 1998, 19, 1439–1445. [Google Scholar] [CrossRef]
- Smith, L.C.; Pavelsky, T.M. Estimation of river discharge, propagation speed, and hydraulic geometry from space: Lena River, Siberia. Water Resour. Res. 2008, 44. [Google Scholar] [CrossRef]
- Kuhn, C.; de Matos Valerio, A.; Ward, N.; Loken, L.; Sawakuchi, H.O.; Kampel, M.; Richey, J.; Stadler, P.; Crawford, J.; Striegl, R.; et al. Performance of Landsat-8 and Sentinel-2 surface reflectance products for river remote sensing retrievals of chlorophyll-a and turbidity. Remote Sens. Environ. 2019, 224, 104–118. [Google Scholar] [CrossRef]
- Shen, X.; Wang, D.; Mao, K.; Anagnostou, E.; Hong, Y. Inundation extent mapping by synthetic aperture radar: A review. Remote Sens. 2019, 11, 879. [Google Scholar] [CrossRef]
- Hou, J.; van Dijk, A.I.; Beck, H.E. Global satellite-based river gauging and the influence of river morphology on its application. Remote Sens. Environ. 2020, 239, 111629. [Google Scholar] [CrossRef]
- Yang, X.; Pavelsky, T.M.; Allen, G.H. The past and future of global river ice. Nature 2020, 577, 69–73. [Google Scholar] [CrossRef]
- Gleason, C.J.; Smith, L.C. Toward global mapping of river discharge using satellite images and at-many-stations hydraulic geometry. Proc. Natl. Acad. Sci. USA 2014, 111, 4788–4791. [Google Scholar] [CrossRef] [PubMed]
- Feng, D.; Gleason, C.J.; Yang, X.; Pavelsky, T.M. Comparing discharge estimates made via the BAM algorithm in high-order Arctic rivers derived solely from optical CubeSat, Landsat, and Sentinel-2 data. Water Resour. Res. 2019, 55, 7753–7771. [Google Scholar] [CrossRef]
- Hagemann, M.W.; Gleason, C.J.; Durand, M.T. BAM: Bayesian AMHG-Manning inference of discharge using remotely sensed stream width, slope, and height. Water Resour. Res. 2017, 53, 9692–9707. [Google Scholar] [CrossRef]
- Stumpf, R.P.; Goldschmidt, P.M. Remote sensing of suspended sediment discharge into the western Gulf of Maine during the April 1987 100-year flood. J. Coast. Res. 1992, 8, 218–225. [Google Scholar]
- Mangiarotti, S.; Martinez, J.M.; Bonnet, M.P.; Buarque, D.C.; Filizola, N.; Mazzega, P. Discharge and suspended sediment flux estimated along the mainstream of the Amazon and the Madeira Rivers (from in situ and MODIS Satellite Data). Int. J. Appl. Earth Obs. Geoinf. 2013, 21, 341–355. [Google Scholar] [CrossRef]
- Gallay, M.; Martinez, J.M.; Mora, A.; Castellano, B.; Yépez, S.; Cochonneau, G.; Alfonso, J.A.; Carrera, J.M.; López, J.L.; Laraque, A. Assessing Orinoco river sediment discharge trend using MODIS satellite images. J. S. Am. Earth Sci. 2019, 91, 320–331. [Google Scholar] [CrossRef]
- Mouyen, M.; Longuevergne, L.; Steer, P.; Crave, A.; Lemoine, J.M.; Save, H.; Robin, C. Assessing modern river sediment discharge to the ocean using satellite gravimetry. Nat. Commun. 2018, 9, 1–9. [Google Scholar] [CrossRef] [PubMed]
- Mertes, L.A.; Smith, M.O.; Adams, J.B. Estimating suspended sediment concentrations in surface waters of the Amazon River wetlands from Landsat images. Remote Sens. Environ. 1993, 43, 281–301. [Google Scholar] [CrossRef]
- Lane, S.N.; Westaway, R.M.; Murray Hicks, D. Estimation of erosion and deposition volumes in a large, gravel-bed, braided river using synoptic remote sensing. Earth Surf. Process. Landf. 2003, 28, 249–271. [Google Scholar] [CrossRef]
- Long, C.M.; Pavelsky, T.M. Remote sensing of suspended sediment concentration and hydrologic connectivity in a complex wetland environment. Remote Sens. Environ. 2013, 129, 197–209. [Google Scholar] [CrossRef]
- Villar, R.E.; Martinez, J.M.; Le Texier, M.; Guyot, J.L.; Fraizy, P.; Meneses, P.R.; de Oliveira, E. A study of sediment transport in the Madeira River, Brazil, using MODIS remote-sensing images. J. S. Am. Earth Sci. 2013, 44, 45–54. [Google Scholar] [CrossRef]
- Markert, K.N.; Schmidt, C.M.; Griffin, R.E.; Flores, A.I.; Poortinga, A.; Saah, D.S.; Muench, R.E.; Clinton, N.E.; Chishtie, F.; Kityuttachai, K.; et al. Historical and operational monitoring of surface sediments in the Lower Mekong basin using Landsat and Google Earth Engine cloud computing. Remote Sens. 2018, 10, 909. [Google Scholar] [CrossRef]
- Pereira, L.S.; Andes, L.C.; Cox, A.L.; Ghulam, A. Measuring suspended-sediment concentration and turbidity in the middle mississippi and lower missouri rivers using landsat data. JAWRA J. Am. Water Resour. Assoc. 2018, 54, 440–450. [Google Scholar] [CrossRef]
- Peterson, K.T.; Sagan, V.; Sidike, P.; Cox, A.L.; Martinez, M. Suspended sediment concentration estimation from Landsat imagery along the Lower Missouri and Middle Mississippi Rivers using an extreme learning machine. Remote Sens. 2018, 10, 1503. [Google Scholar] [CrossRef]
- Pham, Q.V.; Ha, N.T.T.; Pahlevan, N.; Oanh, L.T.; Nguyen, T.B.; Nguyen, N.T. Using Landsat-8 images for quantifying suspended sediment concentration in Red River (Northern Vietnam). Remote Sens. 2018, 10, 1841. [Google Scholar] [CrossRef]
- Yepez, S.; Laraque, A.; Martinez, J.M.; De Sa, J.; Carrera, J.M.; Castellanos, B.; Gallay, M.; Lopez, J.L. Retrieval of suspended sediment concentrations using Landsat-8 OLI satellite images in the Orinoco River (Venezuela). Comptes Rendus Geosci. 2018, 350, 20–30. [Google Scholar] [CrossRef]
- Gray, J.R. The need for surrogate technologies to monitor fluvial-sediment transport. In Proceedings of the Turbidity and Other Sediment Surrogates Workshop; 2002. Available online: https://archive.usgs.gov/archive/sites/water.usgs.gov/osw/techniques/TSS/gray.pdf (accessed on 24 January 2020).
- United States Geological Survey. Ecological Status and Trends of the Upper Mississippi River System 1998. A Report of the Long Term Resource Monitoring Program; US Geological Survey, Upper Midwest Environmental Sciences Center: La Crosse, WI, USA, 1999; pp. 1–236.
- Gorelick, N.; Hancher, M.; Dixon, M.; Ilyushchenko, S.; Thau, D.; Moore, R. Google Earth Engine: Planetary-Scale geospatial analysis for everyone. Remote Sens. Environ. 2017, 202, 18–27. [Google Scholar] [CrossRef]
- Yang, X.; Pavelsky, T.M.; Allen, G.H.; Donchyts, G. RivWidthCloud: An automated Google Earth Engine algorithm for river width extraction from remotely sensed imagery. IEEE Geosci. Remote Sens. Lett. 2019, 17, 217–221. [Google Scholar] [CrossRef]
- Leopold, L.B.; Maddock, T. The hydraulic geometry of stream channels and some physiographic implications. In Geological Survey Professional Paper; US Government Printing Office: Washington, DC, USA, 1953; Volume 252. [Google Scholar]
- Edwards, T.K.; Glysson, G.D. Field methods for measurement of fluvial sediment. In US Geological Survey Techniques of Water-Resources Investigations; US Government Printing Office: Washington, DC, USA, 1999. [Google Scholar]
- Han, L. Spectral reflectance with varying suspended sediment concentrations in clear and algae-laden waters. Photogramm. Eng. Remote Sens. 1997, 63, 701–705. [Google Scholar]
- Ha, N.T.T.; Thao, N.T.P.; Koike, K.; Nhuan, M.T. Selecting the best band ratio to estimate chlorophyll-a concentration in a tropical freshwater lake using sentinel 2a images from a case study of Lake Ba Be (Northern Vietnam). ISPRS Int. J. Geoinf. 2017, 6, 290. [Google Scholar] [CrossRef]
- Son, Y.B.; Min, J.E.; Ryu, J.H. Detecting massive green algae (Ulva prolifera) blooms in the Yellow Sea and East China Sea using geostationary ocean color imager (GOCI) data. Ocean Sci. J. 2012, 47, 359–375. [Google Scholar] [CrossRef]
- Pavelsky, T.M.; Smith, L.C. Remote sensing of suspended sediment concentration, flow velocity, and lake recharge in the Peace-Athabasca Delta, Canada. Water Resour. Res. 2009, 45. [Google Scholar] [CrossRef]
- Moriasi, D.N.; Arnold, J.G.; Van Liew, M.W.; Bingner, R.L.; Harmel, R.D.; Veith, T.L. Model evaluation guidelines for systematic quantification of accuracy in watershed simulations. Trans. ASABE 2007, 50, 885–900. [Google Scholar] [CrossRef]
- Rosgen, D.L. A classification of natural rivers. Catena 1994, 22, 169–199. [Google Scholar] [CrossRef]
- Houser, J.N.; Bierman, D.W.; Burdis, R.M.; Soeken-Gittinger, L.A. Longitudinal trends and discontinuities in nutrients, chlorophyll, and suspended solids in the Upper Mississippi River: Implications for transport, processing, and export by large rivers. Hydrobiologia 2010, 651, 127–144. [Google Scholar] [CrossRef]
- Lin, P.; Pan, M.; Beck, H.E.; Yang, Y.; Yamazaki, D.; Frasson, R.; David, C.H.; Durand MPavelsky, T.M.; Allen, G.H.; Gleason, C.J.; et al. Global reconstruction of naturalized river flows at 2.94 million reaches. Water Resour. Res. 2019, 55, 6499–6516. [Google Scholar] [CrossRef]


| Site | Longitude | Latitude | USGS Gauge ID | Location | Flow Data | Sediment Data |
|---|---|---|---|---|---|---|
| 1 | −93.30 | 45.13 | 05288500 | Brooklyn Park, MN | 1931–present | 1975–1996 |
| 2 | −91.64 | 44.06 | 05378500 | Winona, MN | 1928–present | 1975–1988 |
| 3 | −91.17 | 43.03 | 05389500 | McGregor, IA | 1936–2013 | 1975–2004 |
| 4 | −90.25 | 41.78 | 05420500 | Clinton, IA | 1873–present | 1994–1997 |
| 5 | −90.37 | 38.95 | 05587455 | Grafton, IL | 1997–present | 1989–2017 |
| 6 | −90.18 | 38.89 | 05587500 | Alton, IL | 1933–1987 | 1982–1989 |
| 7 | −90.18 | 38.63 | 07010000 | St. Louis, MO | 1861–present | 1980–2017 |
| 8 | −89.84 | 37.90 | 07020500 | Chester, IL | 1942–present | 1982–2017 |
| 9 | −89.47 | 37.22 | 07022000 | Thebes, IL | 1933–present | 1982–2017 |
| Site | Location | Flow and Sediment Data | Landsat Acquisition Path/Row | Number of Landsat Images | |||
|---|---|---|---|---|---|---|---|
| Landsat 5 | Landsat 7 | Landsat 8 | Total | ||||
| 1 | Brooklyn Park, MN | 1975–1996 | 27/29 | 141 | - | - | 141 |
| 2 | Winona, MN | 1975–1988 | 25/29, 25/30, 26/29 | 175 | - | - | 175 |
| 3 | McGregor, IA | 1975–2004 | 25/30 | 286 | 80 | - | 366 |
| 4 | Clinton, IA | 1994–1997 | 24/31, 25/31 | 93 | - | - | 93 |
| 5 | Grafton, IL | 1989–2017 | 23/33, 24/33 | 636 | 609 | 117 | 1362 |
| 6 | Alton, IL | 1982–1989 | 23/33, 24/33 | 142 | - | - | 142 |
| 7 | St. Louis, MO | 1980–2017 | 23/33, 24/33 | 786 | 609 | 180 | 1575 |
| 8 | Chester, IL | 1982–2017 | 22/34, 23/34, 24/34 | 403 | 317 | 88 | 808 |
| 9 | Thebes, IL | 1982–2017 | 23/34 | 418 | 323 | 87 | 828 |
| Site | Location | N | Minimum | Maximum | Mean (m) | SD (m) | CV (%) |
|---|---|---|---|---|---|---|---|
| (m) | (m) | ||||||
| 1 | Brooklyn Park, MN | 34 | 81.0 | 181.8 | 121.8 | 17.2 | 14.1 |
| 2 | Winona, MN | 24 | 124.1 | 326.2 | 237.3 | 29.8 | 12.6 |
| 3 | McGregor, IA | 99 | 175.1 | 390.8 | 273.4 | 28.1 | 10.3 |
| 4 | Clinton, IA | 37 | 335.5 | 565.1 | 445.7 | 51.3 | 11.5 |
| 5 | Grafton, IL | 107 | 657.4 | 1337.5 | 947.6 | 98.9 | 10.4 |
| 6 | Alton, IL | 22 | 571.8 | 982.1 | 755.8 | 68.8 | 9.1 |
| 7 | St. Louis, MO | 121 | 300.8 | 641.6 | 452.4 | 48.3 | 10.7 |
| 8 | Chester, IL | 166 | 300.7 | 761.2 | 552.8 | 67.5 | 12.2 |
| 9 | Thebes, IL | 169 | 403.8 | 908.5 | 637 | 72.3 | 11.4 |
| Site | Location | Observed Range (m3/s) | N | Relative Bias | MAE (m3/s) | RRMSE | NSE | ||||||||
|---|---|---|---|---|---|---|---|---|---|---|---|---|---|---|---|
| Qmedian | Qwbm1 | Qwbm2 | Qmedian | Qwbm1 | Qwbm2 | Qmedian | Qwbm1 | Qwbm2 | Qmedian | Qwbm1 | Qwbm2 | ||||
| 1 | Brooklyn Park, MN | 60–968 | 34 | 0.07 | −0.14 | 0.71 | 145 | 139 | 282 | 0.60 | 0.57 | 1.10 | 0.25 | 0.35 | −0.46 |
| 2 | Winona, MN | 187–2720 | 24 | −0.09 | −0.22 | 0.54 | 389 | 393 | 650 | 0.68 | 0.75 | 0.98 | 0.25 | 0.16 | −0.08 |
| 3 | McGregor, IA | 295–4420 | 99 | 0.21 | −0.2 | 0.52 | 527 | 426 | 794 | 0.54 | 0.52 | 0.80 | 0.11 | 0.19 | −0.29 |
| 4 | Clinton, IA | 547–3630 | 37 | 0.13 | −0.11 | 0.38 | 550 | 503 | 848 | 0.32 | 0.32 | 0.53 | 0.45 | 0.40 | 0.10 |
| 5 | Grafton, IL | 813–11400 | 107 | −0.19 | 0.23 | 1.09 | 1850 | 2260 | 4070 | 0.73 | 0.8 | 1.44 | −0.02 | −0.21 | −0.88 |
| 6 | Alton, IL | 1010–8160 | 22 | −0.06 | −0.19 | 0.49 | 1430 | 1630 | 2150 | 0.45 | 0.49 | 0.69 | 0.30 | 0.29 | 0.16 |
| 7 | St. Louis, MO | 1940–22800 | 121 | 0.13 | −0.68 | −0.35 | 1470 | 4370 | 2320 | 0.47 | 0.82 | 0.45 | 0.58 | 0.56 | 0.84 |
| 8 | Chester, IL | 1870–16500 | 166 | 0.16 | −0.66 | −0.19 | 1760 | 4120 | 1410 | 0.37 | 0.79 | 0.37 | 0.59 | 0.36 | 0.63 |
| 9 | Thebes, IL | 2720–23600 | 169 | −0.05 | −0.59 | −0.18 | 1540 | 4520 | 1800 | 0.28 | 0.68 | 0.32 | 0.70 | 0.55 | 0.72 |
| Average across study sites | ±0.12 | ±0.34 | ±0.49 | 1074 | 2040 | 1590 | 0.49 | 0.64 | 0.74 | 0.36 | 0.29 | 0.08 | |||
| Site | Location | SSC Range (mg/L) | N | Function * | p-Value | R2 |
|---|---|---|---|---|---|---|
| 1 | Brooklyn Park, MN | 2–46 | 38 | y = 0.05x + 0.78 | 0.004 | 0.21 |
| 2 | Winona, MN | 3–56 | 37 | y = 0.06x + 0.72 | 0.006 | 0.20 |
| 3 | McGregor, IA | 3.2–190 | 86 | y = 0.07x + 0.71 | <0.001 | 0.26 |
| 4 | Clinton, IA | 2–127 | 12 | y = 0.03x + 0.84 | 0.017 | 0.45 |
| 5 | Grafton, IL | 12.2–796 | 349 | y = 0.13x + 0.37 | <0.001 | 0.40 |
| 6 | Alton, IL | 12.4–324 | 54 | y = 0.06x + 0.64 | <0.001 | 0.27 |
| 7 | St. Louis, MO | 27.4–2340 | 747 | y = 0.13x + 0.36 | <0.001 | 0.66 |
| 8 | Chester, IL | 35–1280 | 226 | y = 0.15x + 0.28 | <0.001 | 0.64 |
| 9 | Thebes, IL | 23.6–961 | 305 | y = 0.13x + 0.36 | < 0.001 | 0.54 |
| Site | Location | Observed Range (mg/L) | N | Relative Bias | MAE (mg/L) | RRMSE | NSE | ||||
|---|---|---|---|---|---|---|---|---|---|---|---|
| Gauge-Specific | Regional | Gauge-Specific | Regional | Gauge-Specific | Regional | Gauge-Specific | Regional | ||||
| 1 | Brooklyn Park, MN | 5.6–100 | 29 | 0.78 | 0.22 | 30.8 | 45.6 | 2.52 | 2.68 | −6.71 | −4.34 |
| 2 | Winona, MN | 6.0–26 | 22 | 0.19 | 1.32 | 13.7 | 22.0 | 1.46 | 2.35 | −9.36 | −17.7 |
| 3 | McGregor, IA | 4.0–361 | 93 | 0.28 | 1.09 | 31.4 | 42.5 | 1.85 | 2.17 | −1.33 | −1.43 |
| 4 | Clinton, IA | 2.0–198 | 20 | 1.23 | 0.58 | 109 | 50.7 | 2.31 | 1.06 | −5.56 | −0.34 |
| 5 | Grafton, IL | 19.9–487 | 105 | 0.35 | 0.95 | 95.3 | 183 | 1.30 | 3.06 | −2.18 | −16.1 |
| 6 | Alton, IL | 19.8–373 | 11 | 1.40 | −0.13 | 241 | 77.9 | 2.66 | 0.84 | −6.11 | 0.06 |
| 7 | St. Louis, MO | 34.0–1250 | 115 | 0.09 | 0.30 | 98.4 | 153 | 0.59 | 1.06 | 0.50 | −0.56 |
| 8 | Chester, IL | 39.0–863 | 79 | 0.25 | 1.04 | 122 | 324 | 0.68 | 2.14 | 0.16 | −6.31 |
| 9 | Thebes, IL | 44.3–1110 | 147 | 0.22 | 0.86 | 129 | 294 | 0.73 | 1.95 | −0.07 | −5.83 |
| Average across Study Sites | ±0.53 | ±0.72 | 96.6 | 132 | 1.57 | 1.92 | −3.41 | −5.84 | |||
| Site | Location | Observed Range (t/d) | N | Relative Bias | MAE (t/d) | RRMSE | NSE |
|---|---|---|---|---|---|---|---|
| 1 | Brooklyn Park, MN | 7.7 × 101–6.95 × 10³ | 29 | 1.38 | 8.78 × 10² | 1.42 | 0.18 |
| 2 | Winona, MN | 1.78 × 10²–6.11 × 10³ | 22 | 0.03 | 7.64 × 10² | 0.94 | 0.37 |
| 3 | McGregor, IA | 1.46 × 10²–1.96 × 10⁴ | 93 | 0.63 | 3.48 × 10³ | 2.44 | −5.33 |
| 4 | Clinton, IA | 2.41 × 10²–5.58 × 10⁴ | 20 | 1.18 | 2.17 × 10⁴ | 2.29 | −1.77 |
| 5 | Grafton, IL | 2.09 × 10²–2.64 × 10⁵ | 105 | −0.09 | 2.62 × 10⁴ | 0.88 | 0.51 |
| 6 | Alton, IL | 5.44 × 10³–2.63 × 10⁵ | 11 | 1.38 | 7.18 × 10⁴ | 2.46 | −0.69 |
| 7 | St. Louis, MO | 8.56 × 10³–1.64 × 10⁶ | 115 | 0.25 | 8.88 × 10⁴ | 1.05 | 0.47 |
| 8 | Chester, IL | 7.52 × 10³–1.01 × 10⁶ | 79 | 0.40 | 1.16 × 10⁵ | 0.99 | 0.34 |
| 9 | Thebes, IL | 1.38 × 10³–1.29 × 10⁶ | 147 | 0.22 | 1.02 × 10⁵ | 0.90 | 0.33 |
© 2020 by the authors. Licensee MDPI, Basel, Switzerland. This article is an open access article distributed under the terms and conditions of the Creative Commons Attribution (CC BY) license (http://creativecommons.org/licenses/by/4.0/).
Share and Cite
A. Flores, J.; Q. Wu, J.; O. Stöckle, C.; P. Ewing, R.; Yang, X. Estimating River Sediment Discharge in the Upper Mississippi River Using Landsat Imagery. Remote Sens. 2020, 12, 2370. https://doi.org/10.3390/rs12152370
A. Flores J, Q. Wu J, O. Stöckle C, P. Ewing R, Yang X. Estimating River Sediment Discharge in the Upper Mississippi River Using Landsat Imagery. Remote Sensing. 2020; 12(15):2370. https://doi.org/10.3390/rs12152370
Chicago/Turabian StyleA. Flores, Jonathan, Joan Q. Wu, Claudio O. Stöckle, Robert P. Ewing, and Xiao Yang. 2020. "Estimating River Sediment Discharge in the Upper Mississippi River Using Landsat Imagery" Remote Sensing 12, no. 15: 2370. https://doi.org/10.3390/rs12152370
APA StyleA. Flores, J., Q. Wu, J., O. Stöckle, C., P. Ewing, R., & Yang, X. (2020). Estimating River Sediment Discharge in the Upper Mississippi River Using Landsat Imagery. Remote Sensing, 12(15), 2370. https://doi.org/10.3390/rs12152370