Article

Obtaining Gradients of XCO2 in Atmosphere Using the Constrained Linear Least-Squares Technique and Multi-Wavelength IPDA LiDAR

1
School of Remote Sensing and Information Engineering, Wuhan University, Luoyu Road No.129, Wuhan 430079, China
2
State Key Laboratory of Information Engineering in Surveying, Mapping and Remote Sensing, Wuhan University, Luoyu Road No.129, Wuhan 430079, China
3
School of Environmental Science and Tourism, Nanyang Normal University, Wolong Road No.1638, Nan Yang 473061, China
4
Westa College, Southwest University, Tiansheng Road No.2, Chongqing 400715, China
5
College of sciences and engineering, University of Tasmania, Churchill Avenue, Hobart TAS 7055, Australia
*
Author to whom correspondence should be addressed.
Remote Sens. 2020, 12(15), 2395; https://doi.org/10.3390/rs12152395
Submission received: 27 June 2020 / Revised: 20 July 2020 / Accepted: 24 July 2020 / Published: 25 July 2020
(This article belongs to the Section Atmospheric Remote Sensing)

Abstract

:
Integrated-path differential absorption (IPDA) LiDAR is a promising means of measuring the global distributions of the column weighted xCO2 (dry-air mixing ratio of CO2) with adequate accuracy and precision. Most IPDA LiDARs are incapable of discerning the vertical information of CO2 diffusion, which is of great significance for studies on the carbon cycle and climate change. Hence, we developed an inversion method using the constrained linear least-squares technique for a pulsed direct-detection multi-wavelength IPDA LiDAR to obtain sliced xCO2. In the proposed inversion method, the atmosphere is sliced into three different layers, and the xCO2 of those layers is then retrieved using the constrained linear least-squares technique. Assuming complete knowledge of the water vapor content, the accuracy of the retrieved sliced xCO2 could be as high as 99.85% when the signal-to-noise ratio of central wavelength retrievals is higher than 25 (with a log scale). Further experiments demonstrated that different carbon characteristics can be identified by the sign of the carbon gradient of the retrieved xCO2 between the ABL (atmospheric boundary layer) and FT (free troposphere). These results highlight the potential applications of multiple wavelength IPDA LiDAR.

1. Introduction

At present, nearly half of the total anthropogenic CO2 emission has been offset by unidentified CO2 sinks [1]. Dense observations of column xCO2 (dry-air mixing ratio of CO2), supplementing the existing ground-based CO2 monitoring networks, are urgently needed to provide stronger constraints on inversions of carbon fluxes using the atmospheric inversion technique [2]. Since 2000, several satellite-based sensors, such as AIRS, SCIAMACHY, and IASI, have been sent into orbit and are able to obtain data of XCO2 (column-average xCO2). In recent decades, some dedicated greenhouse gas monitoring missions, including GOSAT, OCO-2, and TanSat, have successfully obtained XCO2 products with higher accuracy and precision than before. It is widely witnessed that these data are useful in deepening our understanding of the carbon cycle process, despite their susceptibility to aerosols and dependency on sunlight as well as insufficient coverage over high-latitude zones [3,4]. Supplementing the passive remote sensing of greenhouse gases, differential absorption LiDAR (DIAL) plays an increasingly critical role in atmospheric CO2 sensing, owing to the remarkable developments made in both lasers and detectors [5,6]. Integrated path differential absorption (IPDA) LiDAR, a special type of DIAL, relies on backscattered signals by hard-targets, thus providing a higher signal-to-noise ratio (SNR) [7]. Several groups from different countries are dedicated to developing equipment for the active remote sensing of CO2 equipment based on the integrated-path differential absorption (IPDA) technique, which is expected to obtain CO2 measurements from space with high accuracy and better coverage at night and at high latitudes [8,9,10]. In recent years, airborne CO2-IPDA LiDARs have been extensively tested by different research groups funded by the National Aeronautics and Space Administration (NASA) [5,11,12,13]. In these experiments, results with errors lower than 1% were obtained and researchers are anticipating the realization of spaceborne CO2-IPDA LiDAR in the near future.
To understand the transportation process of CO2 in the atmosphere, it is important to identify vertical gradients of xCO2, especially in the lower troposphere [14,15]. Gradients of xCO2 between the ABL (atmospheric boundary layer) and FT (free troposphere) can be used to estimate the surface net ecosystem exchange [16]. Vertical gradients of CO2 would also help us to gain insight into the feedback between the carbon cycle and climate change [15,17,18,19]. The ground-based dual-wavelength DIAL can measure the range-resolved xCO2 within 3 km [18,20,21]. However, it relies on aerosol backscattered signals with a relatively lower SNR and thus is unlikely to provide products with accuracies of up to 1 ppm. Moreover, ground-based equipment is difficult to deploy and operate in remote places. The spaceborne CO2-IPDA LiDAR is a suitable and effective means to obtain measurements of CO2 with a high accuracy globally. However, most dual-wavelength IPDA systems can only retrieve column-weighted xCO2 and are incapable of measuring gradients of xCO2.
To tackle the above-stated problem, we propose a novel multi-wavelength inversion method, which is based on the constrained linear least-squares technique. In the field of IPDA/DIAL, the multiple-wavelength strategy was proposed soon after the dual-wavelength differential absorption inversion algorithm. In 1985, R.E. Warren first presented a generalized DIAL signal model and then proposed an inversion method of the concentration of a target material by using maximum likelihood estimation [22]. The main goal of R.E. Warren’s method is to retrieve multiple-target materials by means of multiple-wavelength absorption LiDAR. In 1999, Fukuchi presented a multiple wavelength DIAL for measuring range-resolved SO2 and demonstrated that the accuracy can be improved by using averaged signals of a group of on-line/off-line wavelengths instead of a single pair [23]. Later, in 2002, their group successfully developed a five-wavelength SO2-DIAL and obtained range-resolved SO2 concentrations by means of a curve-fitting technique [24]. In 2014, Abshire et al. demonstrated airborne measurements of column-weighted xCO2 using a 30-wavelength CO2-IPDA LiDAR, which is the first multiple-wavelength CO2-IPDA LiDAR [5]. In their inversion method, a layered atmospheric model was used to compute an absorption spectrum for a given path, CO2 concentrations, and some other parameters. On this basis, the CO2 concentration was solved by minimizing the error between the measured spectrum and the modeled one. J.R. Chen presented a novel multiple-wavelength IPDA inversion method using symmetrically measured LiDAR soundings, substantially reducing the error from spectral distortion and laser frequency drift in 2014 [25]. In 2016, Xiang et al. proposed another multiple-wavelength DIAL inversion method which is based on the weighted averaging of observation pairs [26], and they verified the method using a range-resolved, 11-wavelength CO2-DIAL in a laboratory environment. This method was further improved via using a better fitting kernel in 2017 [27]. We can conclude from these previous works that the technical feasibility of multiple-wavelength IPDA LiDAR to measure the CO2 vertical gradient has been established [28]. In this work, we aim to discuss the feasibility of obtaining gradients of xCO2 through our recommended method by multiple-wavelength IPDA LiDAR [13].
In the proposed framework, we sliced the atmosphere into several layers. Then, we constructed simultaneous equations using IPDA equations of multiple wavelengths. On this basis, the simultaneous equations were solved using the constrained linear least-squares technique, obtaining sliced xCO2. The linear least-squares technique is widely used as a standard approach to approximate the solution of over-determined problems [29]. However, it searches for a mathematically optimal solution without consideration of physical constraints [30]. The spatial distribution of CO2 has its own special features, which can impose physical constraints on inversions [31]. The ordinary linear least-squares technique would obtain results with a high accuracy in terms of mathematics but with evident errors in terms of physics. We thus consider using a constrained linear least-squares method to obtain results with physical meanings. Such a technique has been used to resolve problems regarding remote sensing [32] but has not yet been used to deal with data of IPDA LiDAR. The sign of the xCO2 gradient between the ABL and FT would be auxiliary data to help identify the characteristic of carbon flux (source, neutral, and sink). Moreover, one can retrieve the regional carbon flux using xCO2 gradients based on the equilibrium boundary layer theory [33].
The remaining sections are as follows: the principle of the proposed method is presented in Section 2, as well as relevant methodologies used in the experiments. The performance of the proposed method is evaluated in Section 3 in terms of the SNR, the number of wavelengths, the number of layers, and the ABLH (the height of the atmospheric boundary layer). Moreover, we tested the ability of the proposed framework to retrieve gradients of xCO2. In Section 4, we discuss possible effects of water vapor on retrieving sliced xCO2 using the proposed method. Finally, the major findings of this work are summarized in Section 5.

2. Methods

2.1. IPDA Inversion Algorithm

E λ = ξ λ E 0 Q π A r 2 T a t m exp ( 2 0 r N C O 2 ( r ) σ ( λ ) d r ) .
The first task is to introduce the hard-target LiDAR equation, as described in (1) [34]. Here, Eλ is the received energy for a specified wavelength λ and for a given distance. Q is the surface reflectance. ξi is the total instrument efficiency for wavelength i. In addition, r is the detection range (distance from target to receiver). E0 is the output energy of a single laser pulse. A is the receiver area; NCO2 is the density value of CO2. Tatm is the optical transmission due to other atmospheric constituents. σ(λ) is the absorption cross-section of CO2 at wavelength λ, which is related to the atmospheric pressure and temperature [34,35].
On the basis of the LiDAR equation, the dual-wavelength IPDA technique utilizes a differential process to calculate absorption optical depth due to CO2. XCO2 is retrieved using Equation (2):
X C O 2 = 1 2 ln ( E o f f E o n 0 E o n E o f f 0 ) p s u r f a c e p t o a W F ( λ , p , T ) d p
XCO2 represents CO2 concentration, and psurface and ptoa represent pressure at the surface and top of the atmosphere, respectively. Eoff is the received energy of λoff, Eon is the received energy of λon, while   E o n 0 represents the emitted energy of λon,   E o f f 0 represents the emitted energy of λoff. The wavelength located in the strong absorption position of the CO2 molecule is called the on-line wavelength (λon). The wavelength located in the weak absorption spectrum is considered the off-line wavelength (λoff). WF (λ, p, T) is the weighting function of CO2, which is related to pressure and temperature. WF could be determined by Equation (3).
W F ( λ o n , λ o f f , p , T ) = σ ( λ o n , p , T ) σ ( λ o f f , p , T ) g ( p ) [ m d r y + m H 2 O q H 2 O ( p ) ]
where g denotes the intensity of the local gravitational field of the Earth, and mdry and mH2O represent the average masses of dry air and water vapor molecules, respectively, and qH2O is the dry-air volume mixing ratio of water vapor.

2.2. Multi-Wavelength Inversion Framework

The classic IPDA algorithm utilizes the observations of two wavelengths for the differential process. Given n+1 wavelengths across a single absorption line of CO2, we would have n differential equations. For each wavelength except the off-line wavelength, a classic dual-wavelength IPDA equation, as expressed in Equation (4), can be established. A series of such equations can be then expressed by Equation (5).
ln E o f f E o n ( j ) 0 E o n ( j ) E o f f 0 + ξ j = 2 P s u r f a c e P t o a x C O 2 ( p ) W F j ( p ) d p = 2 i = 1 m x C O 2 i Δ p i W F j i
x C O 2 j i represents xCO2 of the ith layer, i = 1,2,...m. WFj is the total WF calculated by wavelengths λon(j) and λoff, W F j i is ith layer WF calculated by the wavelengths of λon(j), and λoff,   E o n ( j ) 0 represents the emitted energy of λon(j). E o n ( j ) represents the received energy of λon(j), and   ξ j represents the error of total DAOD, calculated by the wavelengths of λon(j) and λoff, j = 1,2…,n.
2 [ Δ p 1 W F 1 1 Δ p m W F 1 m Δ p 1 W F n 1 Δ p m W F n m ] [ x C O 2 ? 1 x C O 2 ? m ] [ ln E o f f E o n ( 1 ) 0 E o n E o f f 0 ln E o f f E o n ( n ) 0 E o n ( n ) E o f f ] = [ ξ 1 ξ n ]
pi represents the difference of pressure in layer i, i=1, 2,…, m. Consequently, the parameters of W and obs would be expressed by Equations (6)–(8).
W = 2 [ Δ p 1 W F 1 1 Δ p m W F 1 m Δ p 1 W F n 1 Δ p m W F n m ]
x = [ x C O 2 1 , ... , x C O 2   m ] T
o b s = [ ln E o f f E o n ( 1 ) 0 E o n E o f f ( 1 ) 0 , ... , ln E o f f E o n ( n ) 0 E o n E o f f ( n ) 0 ] T
ξ = W x o b s
where ξ is the detection random error, m is the number of layers in the atmosphere, and n is the number of on-line wavelengths. In Equation (9), obs is an n-dimensional observation vector, W is an n × m-dimensional coefficient matrix, x is a one-dimensional unknown parameter vector, and   ξ   is a residual vector of observations. On this basis, the constraint linear least-squares technique can be used to minimize   ξ . We need to solve Equations (6)–(9) to determine x C O 2 i . To solve Equation (9), an implied condition is n > m.
min x 1 2 W x o b s 2 2   such   that   { A x b A e q x = b e q l x u
In Equation (10), A is an m×m-dimensional coefficient matrix and b is a one-dimensional vector. The inequation A · x b can be used to describe the correlation of xCO2 of different layers. For example, if we had a-priori CO2 profiles describing the vertical structure of xCO2, this information can be imposed on our inversion via A · x   b . The equation Aeq · x   =   beq is used to inverse slice xCO2, with a higher accuracy when the total column concentration and WF are well known. Aeq represents the WF of CO2 in layers, x is layer xCO2, and beq is the DAOD of the total layer of atmosphere. l   x   u is used to set lower/upper boundaries to x by specifying l and u. Varieties of auxiliary data can be also integrated into the proposed frameworks, such as in-situ surface xCO2 measurements and column average xCO2 retrievals from ground-based and spaceborne Fourier transform infrared spectrometers. The principle of constrained Linear Least-Squares Technique could be found in Appendix A and Appendix B. If there is no a-priori knowledge of the inversion process, Equation (7) would be solved using the general least-squares method.
In the experiments of this work, we imposed the following constraints on the inversion process:
(a) xCO2 of each layer should be less than 425 ppm
(b) xCO2 of each layer should be greater than 370 ppm
(c) A x b
A and b in Equation (10) were determined by Equation (11).
A = [ N a i r ( l a y e r 1 ) N a i r ( t o t a l ) N a i r ( l a y e r m ) N a i r ( t o t a l ) ] b = X C O 2 ( 1 2 10 S N R ( T , λ c e n t r a t l ) 10 ) = X C O 2 max
x is the sliced xCO2 in each layer, and XCO2max is the upper boundary of XCO2. We utilized Xiang’s method [26] to obtain the first guess of XCO2. It is worth noting that we only set an initial value for the column weighted xCO2 as a constraint in the inversion process. All sliced xCO2 are not assigned to certain initial values. The value of b in Equation (11) is based on the principle of double standard deviation limitation of probability distributions. Xiang’s method used weighted averaging of XCO2 retrieved by different wavelengths to obtain a more accurate XCO2, but this method cannot obtain sliced xCO2 using IPDA LiDAR. In this work, we used the first guess of XCO2 as one of the constraints in solving equations using the linear least-squares technique. This means that this is never a compulsory procedure. One can use XCO2 provided by other equipment or retrievals of a traditional dual-wavelength IPDA inversion instead. Nair(layeri), (i = 1,2,3…,m) represents the number density of air molecules in each layer; Nair(total) represents the number density of air molecules in the total atmosphere. SNR(T, λcentral) represents the signal-to-noise ratio of the DAOD measured by λcentral, which is further described in Section 3.1. A simple explanation of constraint c herein is that differences between retrieved XCO2 using traditional IPDA algorithms and the proposed sliced xCO2 inversion algorithm are limited to a certain extent, which is related to the SNR of signals.
Regarding settings of the layer number, m is set to 2, 3, and 4 in this work. Here, n is the number of wavelengths of λon(j). A key problem is to determine a rational range for each layer. From a physical point of view, the sensitivity to the vertical profile of CO2 mainly comes from the differences in weighting functions between channels, which come from the fact that the absorption cross-section depends on the pressure. Therefore, a larger m means more unknown parameters to be solved and thus calls for more independent information. As the number of wavelengths increases, the wavelength spacing decreases accordingly, which exacerbates the correlation between the different detection channels. Thus, an increase in m will result in an extremely high increase in n, which in turn will result in a significant decrease in the energy that can be allocated to each channel. Therefore, we do not think it is wise to set an oversized m. A detailed analysis of the effect of m can be seen in the Discussion. Referring to measurements of the vertical profiles of CO2 [36,37], there is an evident gradient of xCO2 between ABL and FT, which could be of great significance for estimating CO2 fluxes. To obtain the xCO2 gradient there, we need to at least know xCO2 in ABL and FT. Consequently, we set m to 3 in this work and sliced the atmosphere into ABL, FT, and STA (top of the atmosphere) as the default configuration. In Section 3.3, we further discuss the effect of the number of layers. Settings of xCO2 are demonstrated in Table 1 as a part of the methodology, referring to the NASA LaRC Airborne Science Data for Atmospheric Composition (https://www-air.larc.nasa.gov/cgi-bin/ArcView/ascends.2017). Atmospheric profiles of pressure and temperature were preset using the US standard atmosphere model. The surface temperature and pressure are 297 K and 101.32 hPa, respectively. In the future of real applications, the number of layers and ranges of layers can be set according to location.

3. Results

3.1. Effect of Signal-to-Noise Ratio

SNRs of received signals of wavelength λ   can be expressed by Equation (12).
S N R λ = E λ M R B ( 2 e M 2 F R ( E λ + E b a c k ) + i D 2 )
where Eλ represents the received energy of λ, M is the internal gain factor of the detector, R denotes the response of the detector, B is the electrical bandwidth, e is the elementary charge, F is the excess noise factor of the detector (which accounts for additional noise due to the internal amplification statistics), and i D 2 is the dark current noise density. E b a c k is the energy of solar background radiance.
One can conclude from Equation (12) that SNRλ is highly related to the hardware configuration. Moreover, some environmental factors can also affect SNRλ, such as the aerosol optical depth and the surface reflectance which determines Pλ. Moreover, the laser wavelength is also a critical parameter determining SNRλ because Pλ varies significantly with λ due to CO2 absorption.
δ ( λ , C O 2 ) = ln E o f f E o n o E o n E o f f o ,
Δ δ ( λ , C O 2 ) δ ( λ , C O 2 ) = 1 N S N R λ δ ( λ , C O 2 ) ,
S N R ( T , λ ) = 10 log ( δ ( λ , C O 2 ) Δ δ ( λ , C O 2 ) )
δ(λ,CO2) is the measured optical depth due to CO2 absorption on a certain wavelength of λ, which can be calculated by Equation (13). The relationship between SNRλ and the relative random error of δ(λ,CO2) can be expressed by Equation (14). N is the average number of the shots, which depends on the average time and emitted frequency of the future satellite IPDA. We further defined SNR(T,λ) using Equation (15), where ∆δ(λ,CO2) is the random error of δ(λ,CO2). SNR(T,λ) is very different from SNRλ, The former is used to describe the SNR of measured δ(λ,CO2), which is proportional to XCO2, while the latter is used to describe the SNR of received laser signals. Given the specific configurations of hardware and detection environments, both SNRλ and δ(λ,CO2) are negatively correlated with random errors of retrievals, as shown in Equation (14). However, SNRλ decreases with the increasing δ(λ,CO2). Therefore, it is unwise to establish a relationship between the detection error and SNRλ. Compared with SNRλ, SNR(T,λ) can reflect the accuracy of retrievals more intuitively. Hence, we define SNR(T,λ) herein and correlate it with the detection error in the following experiments.
SNR(T,λcentral), where λcentral is the central wavelength of on-line wavelengths, would be better than 25 based on the technology of the current hardware [38]. In this group of simulations, the preset vertical profile of xCO2 is shown in Table 1. The number of wavelengths used in this group of simulations is 22. If SNR(T,λcentral) is certain, the SNRs(T,λi) (i = 1,2,3…m, m = 21) would be calculated by Equation (14).
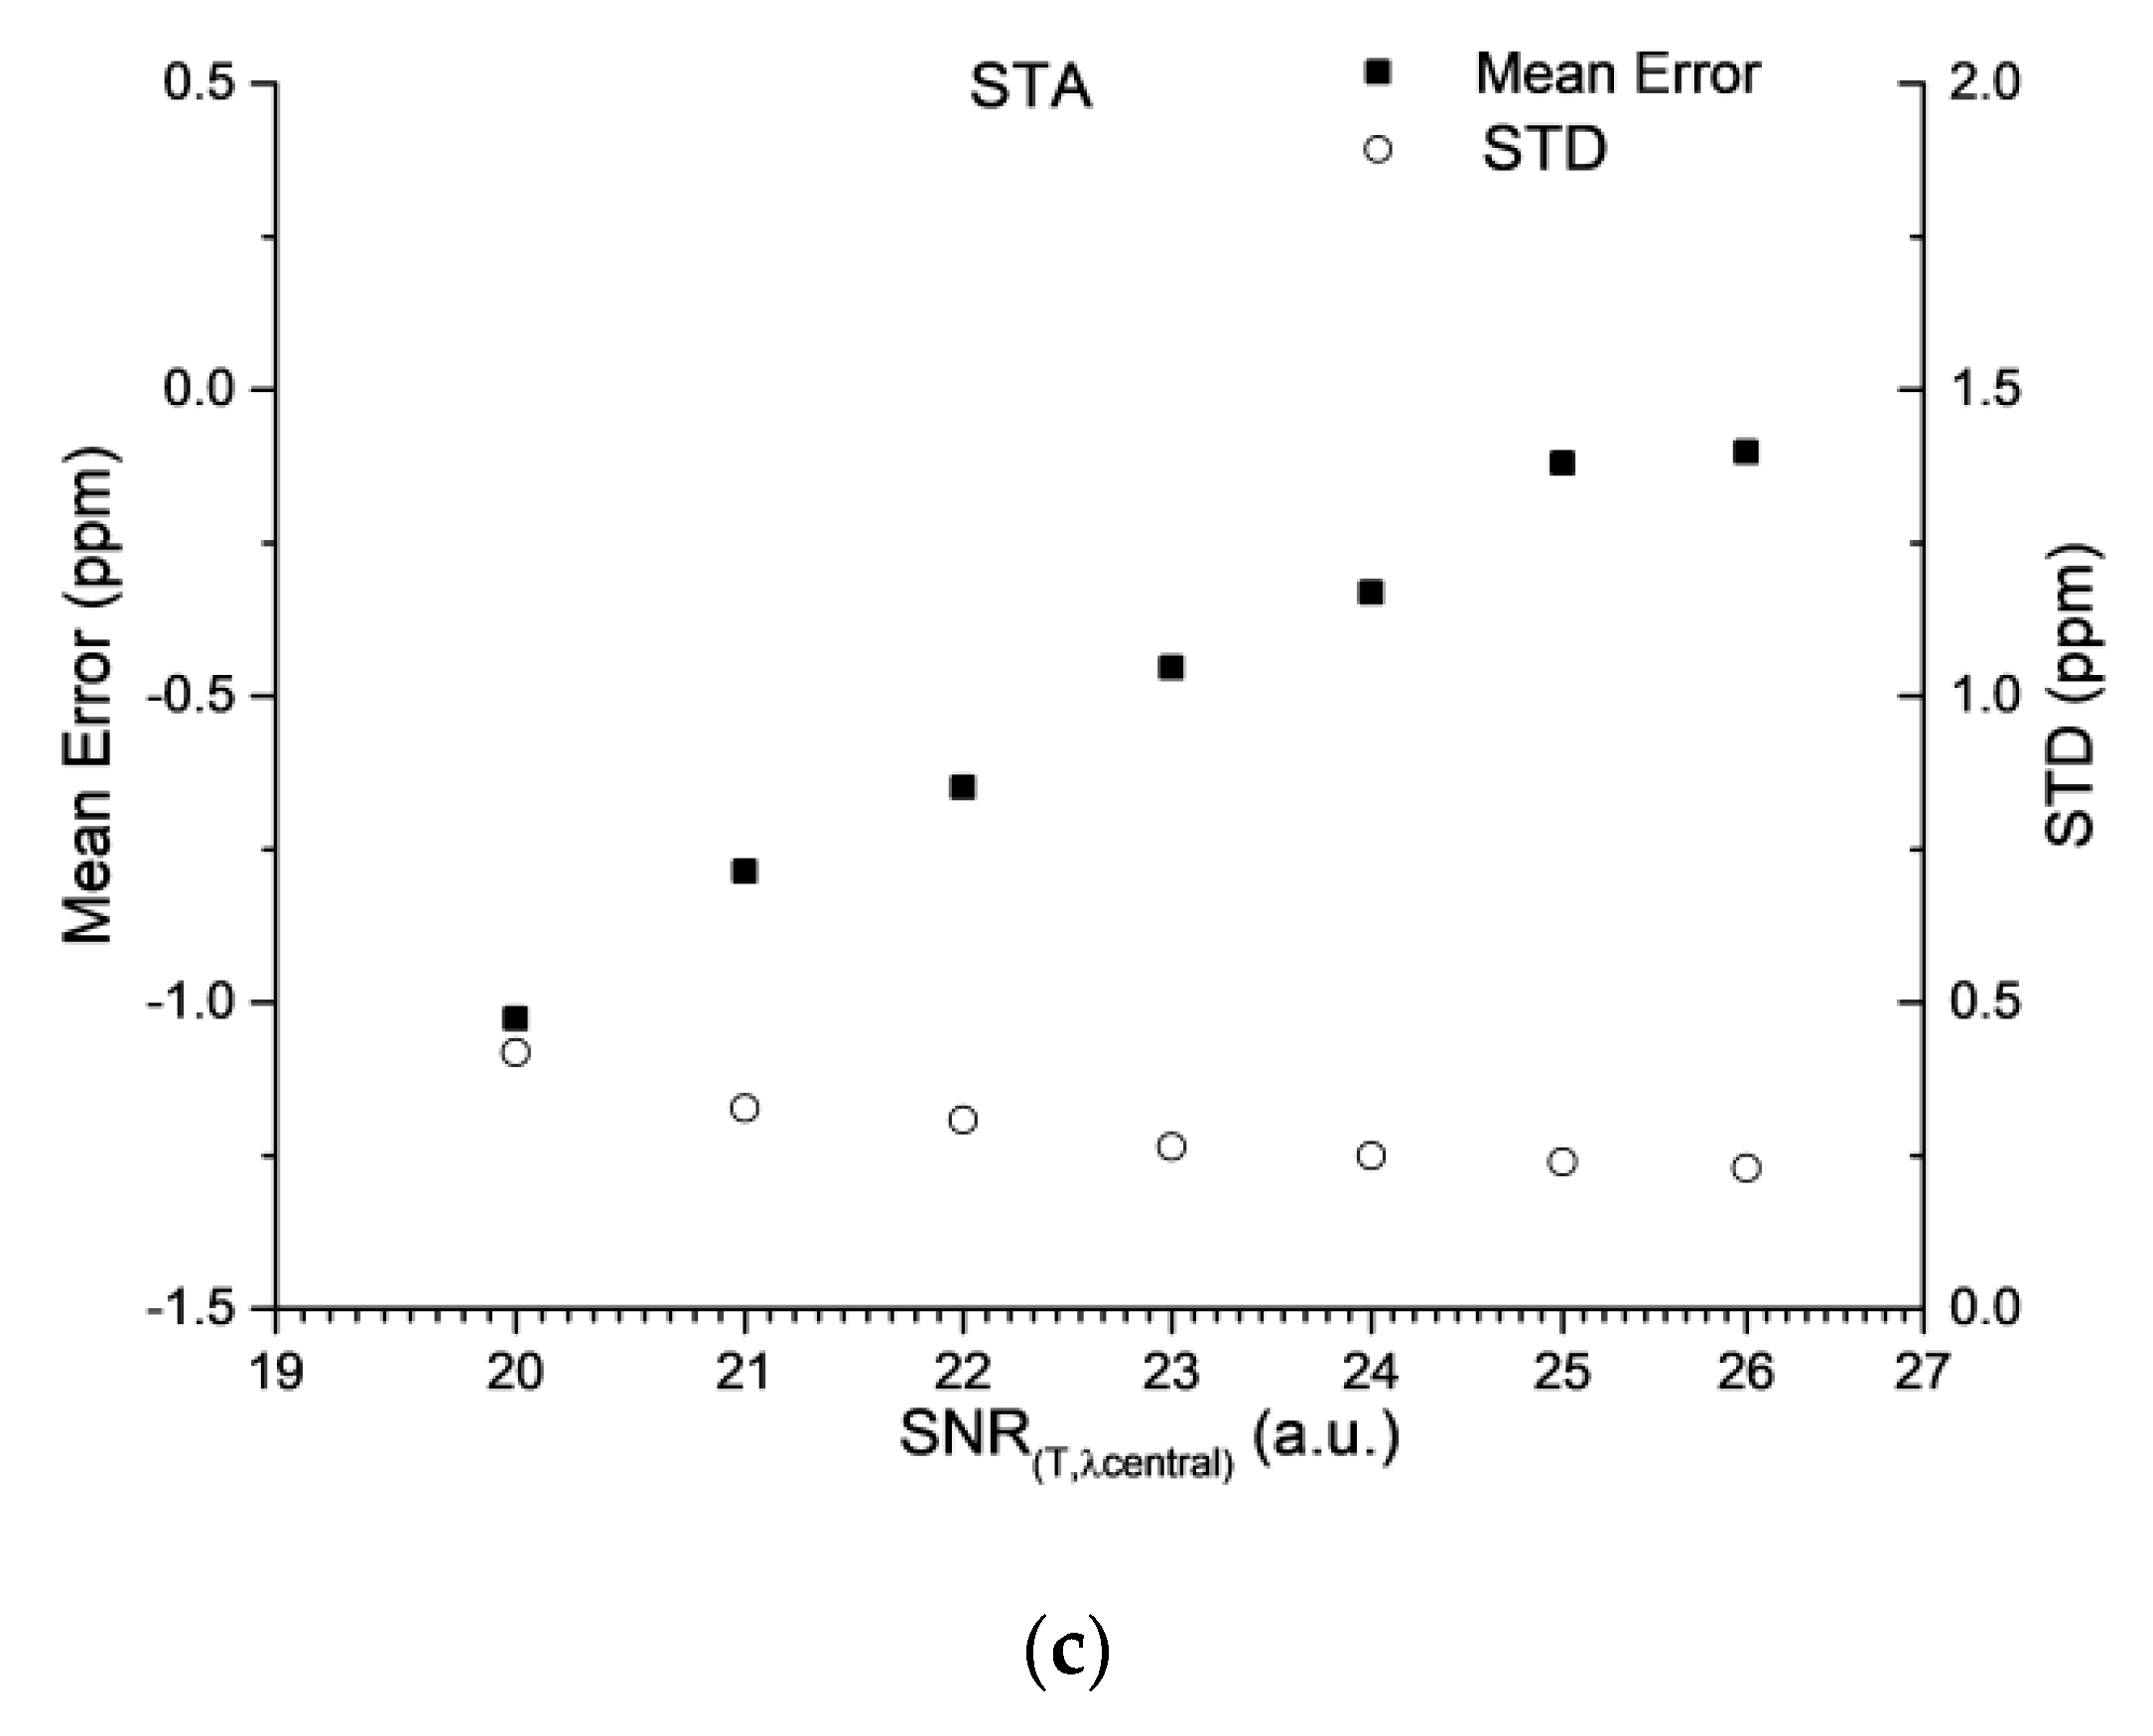
In order to evaluate the influence of SNR(T,λcentral) on the final results, we performed 10,000 simulations to evaluate the performance of our recommended method under different SNR(T,λcentral) (20–26) values. The number of wavelengths is 22 and the assumed ABLH is 1.5 km. Then, the xCO2 of three sliced layers was retrieved, as shown in Figure 1. Atmospheric profiles of pressure and temperature were preset using the US standard atmosphere model. The temperature and pressure of the surface are 297 K and 101.32 hPa, respectively. In the subsequent experiments of other subsections, we used the same settings of the atmosphere, unless we have declared otherwise.
As is shown in Figure 1, the mean error (ME) decreases with the increasing SNR(T,λcentral). It is worth nothing that MEs would be −0.98 ppm, 0.27 ppm, and −0.15 ppm in ABL, FT, and STA, respectively, when SNR(T,λcentral) is 25 dB. STD has a negative relationship with the SNR(T,λcentral) in three layers. However, both ME and STD performance slightly change when SNR(T,λcentral) is larger than 25 db. Hence, we set SNR(T,λcentral) to 25 db in the following simulations. Moreover, it is necessary to discuss the feasibility of an SNR(T,λcentral) of 25 db. We have used the performance simulator and configurations of China’s CO2-IPDALiDAR described in our previous work [38] to calculate the SNR and found that it is higher than 25 db. Moreover, according to the flight test reported by Zhu et al., an SNR of 25 db is feasible in real conditions [39].

3.2. Effect of the Number of Wavelengths and Selecting Modes

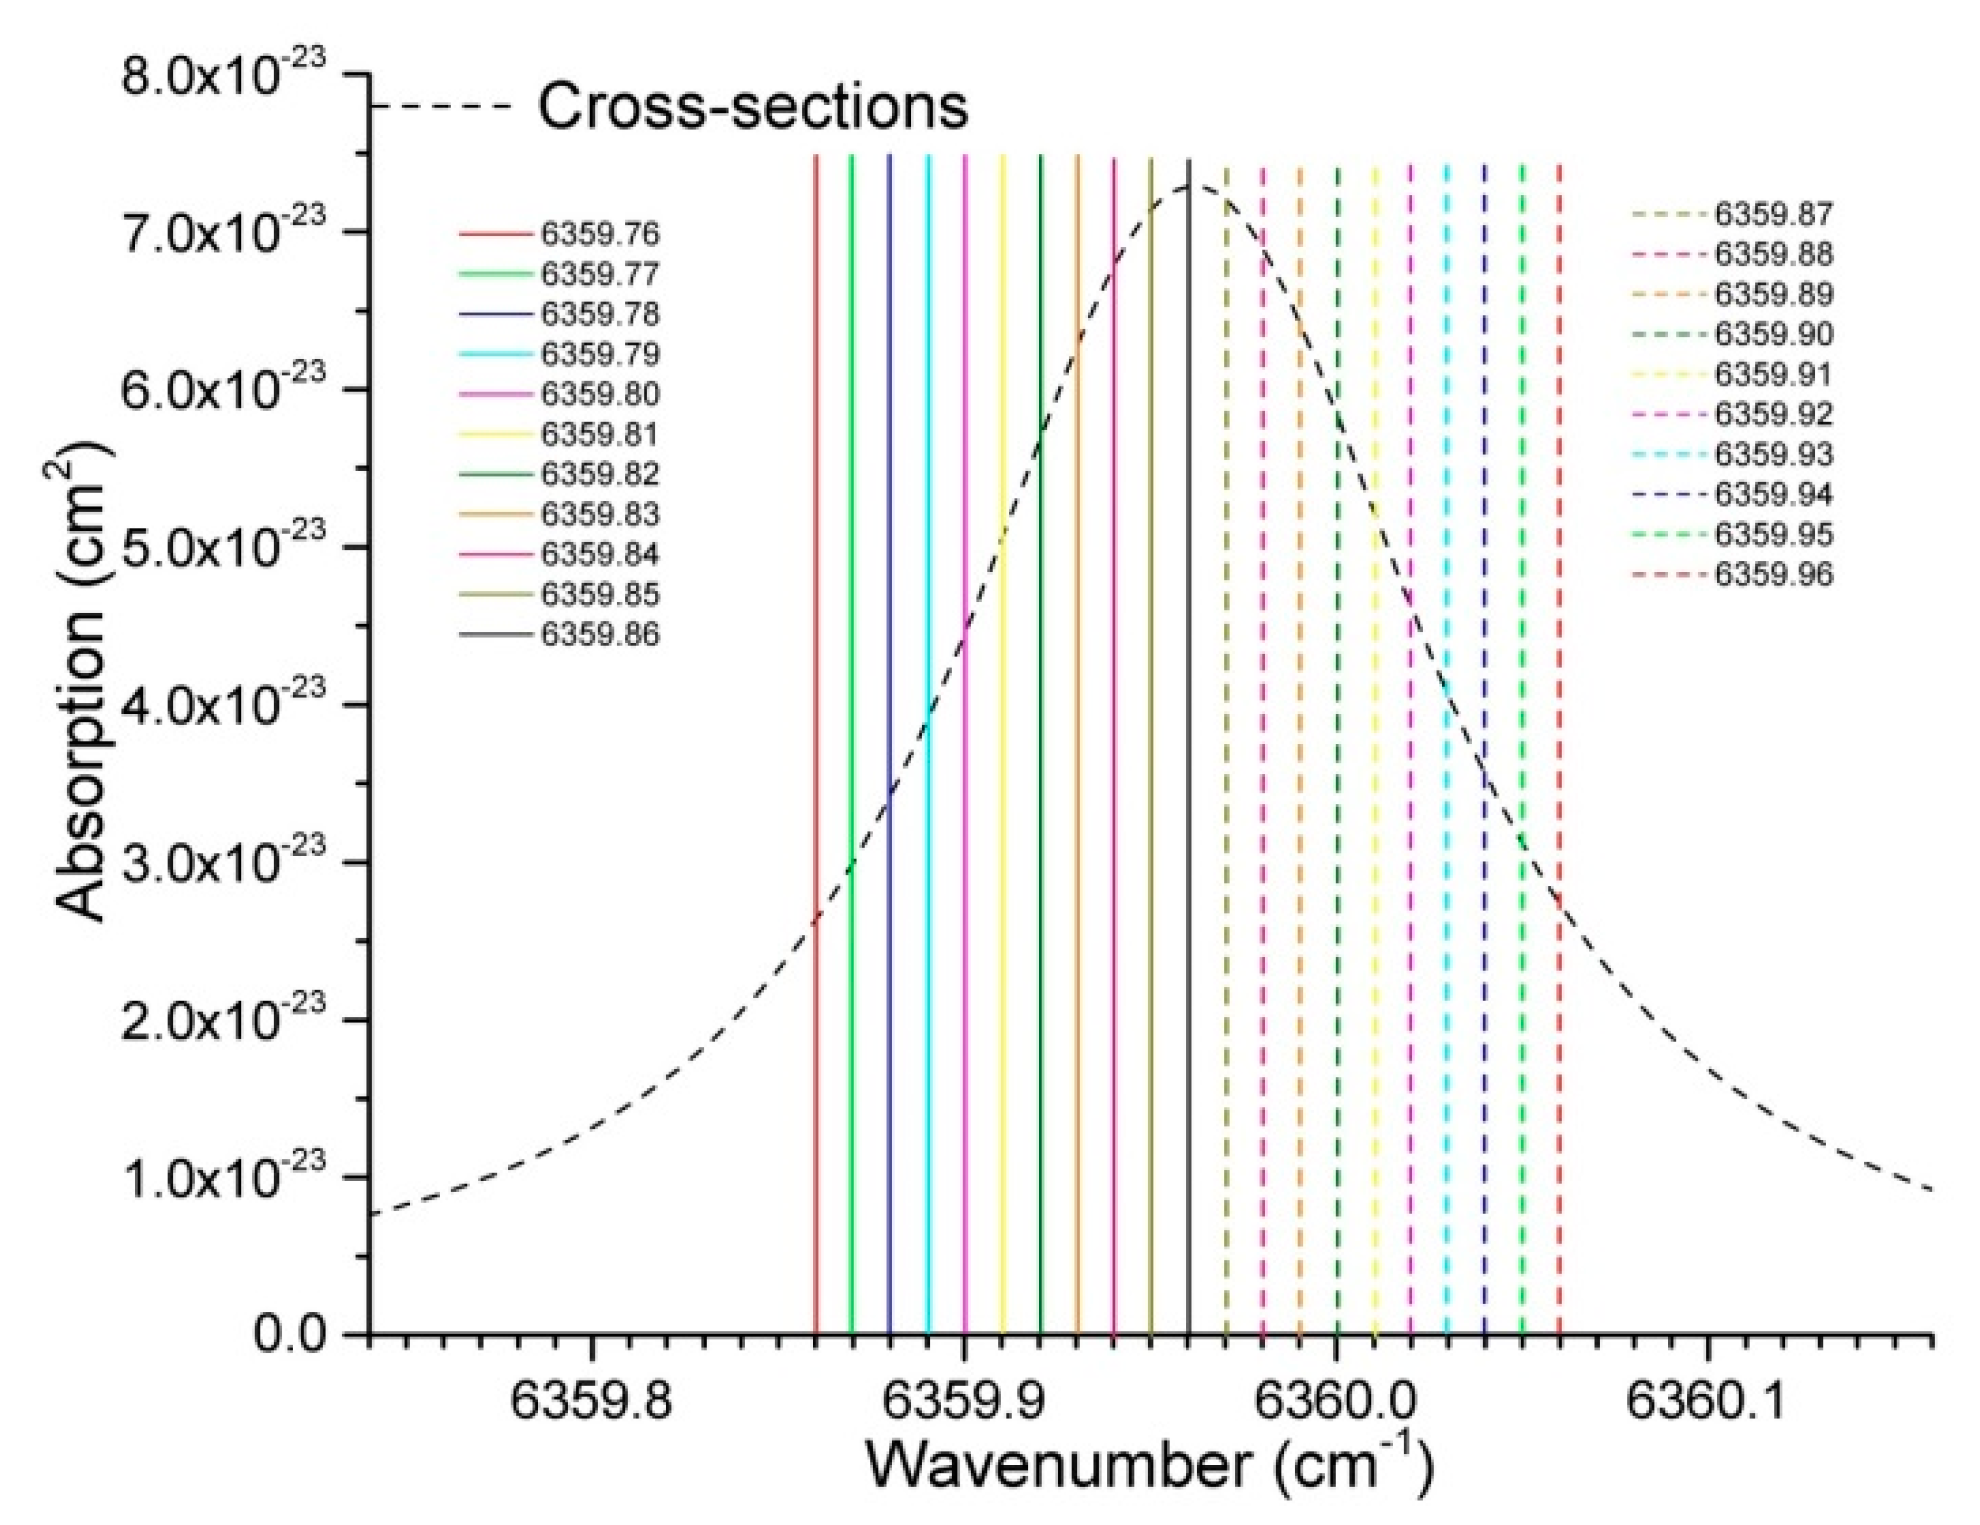
A series of experiments was carried out to explore the effect of the number of wavelengths, in which the central wavelength was set to 1572.335 nm. Except for the number of wavelengths, two types of sampling mode were tested to determine whether the strategy of wavelength sampling would exert influences on outcomes. In two different sampling modes, we set the same wavelength step. With such a configuration, we can determine what the dominant factor is, the wavelength number or the wavelength step, in determining the performance of the proposed multi-wavelength method. Figure 2 demonstrates an example of symmetric sampling with 22 wavelengths (off-line wavelength is not shown), using both solid and dotted lines. An example of unilateral sampling with 12 wavelengths is also shown in this figure, using only the solid lines.
In the next experiment, we wanted to investigate whether different sampling modes would cause differences in the performance of the proposed method. The center wavelength of a CO2 spectrum would move towards the shorter wavelength with the decreasing pressure. Such a phenomenon is called pressure-induced shift [40]. Therefore, symmetric sampling in the absolute sense is not possible. This effect has been taken into consideration in the simulations to include possible errors. In our experiments, two sample modes were used: symmetric distribution sampling and unilateral distribution sampling. The SNR(T,λcentral) was set to 25 dB and the ABLH is 1.5 km. For the simulations in this section, the setting of the number of wavelengths is shown in Table 2 and the detailed setting of the layers and concentration of CO2 in each layer is shown in Table 1.
Figure 2 illustrates two sampling modes in the following simulations. For the symmetric sampling, wavelengths are chosen on both sides of the center wavelength (the black solid line). For the unilateral mode, wavelengths are chosen on one side of the center wavelength (all solid lines or all dotted lines).
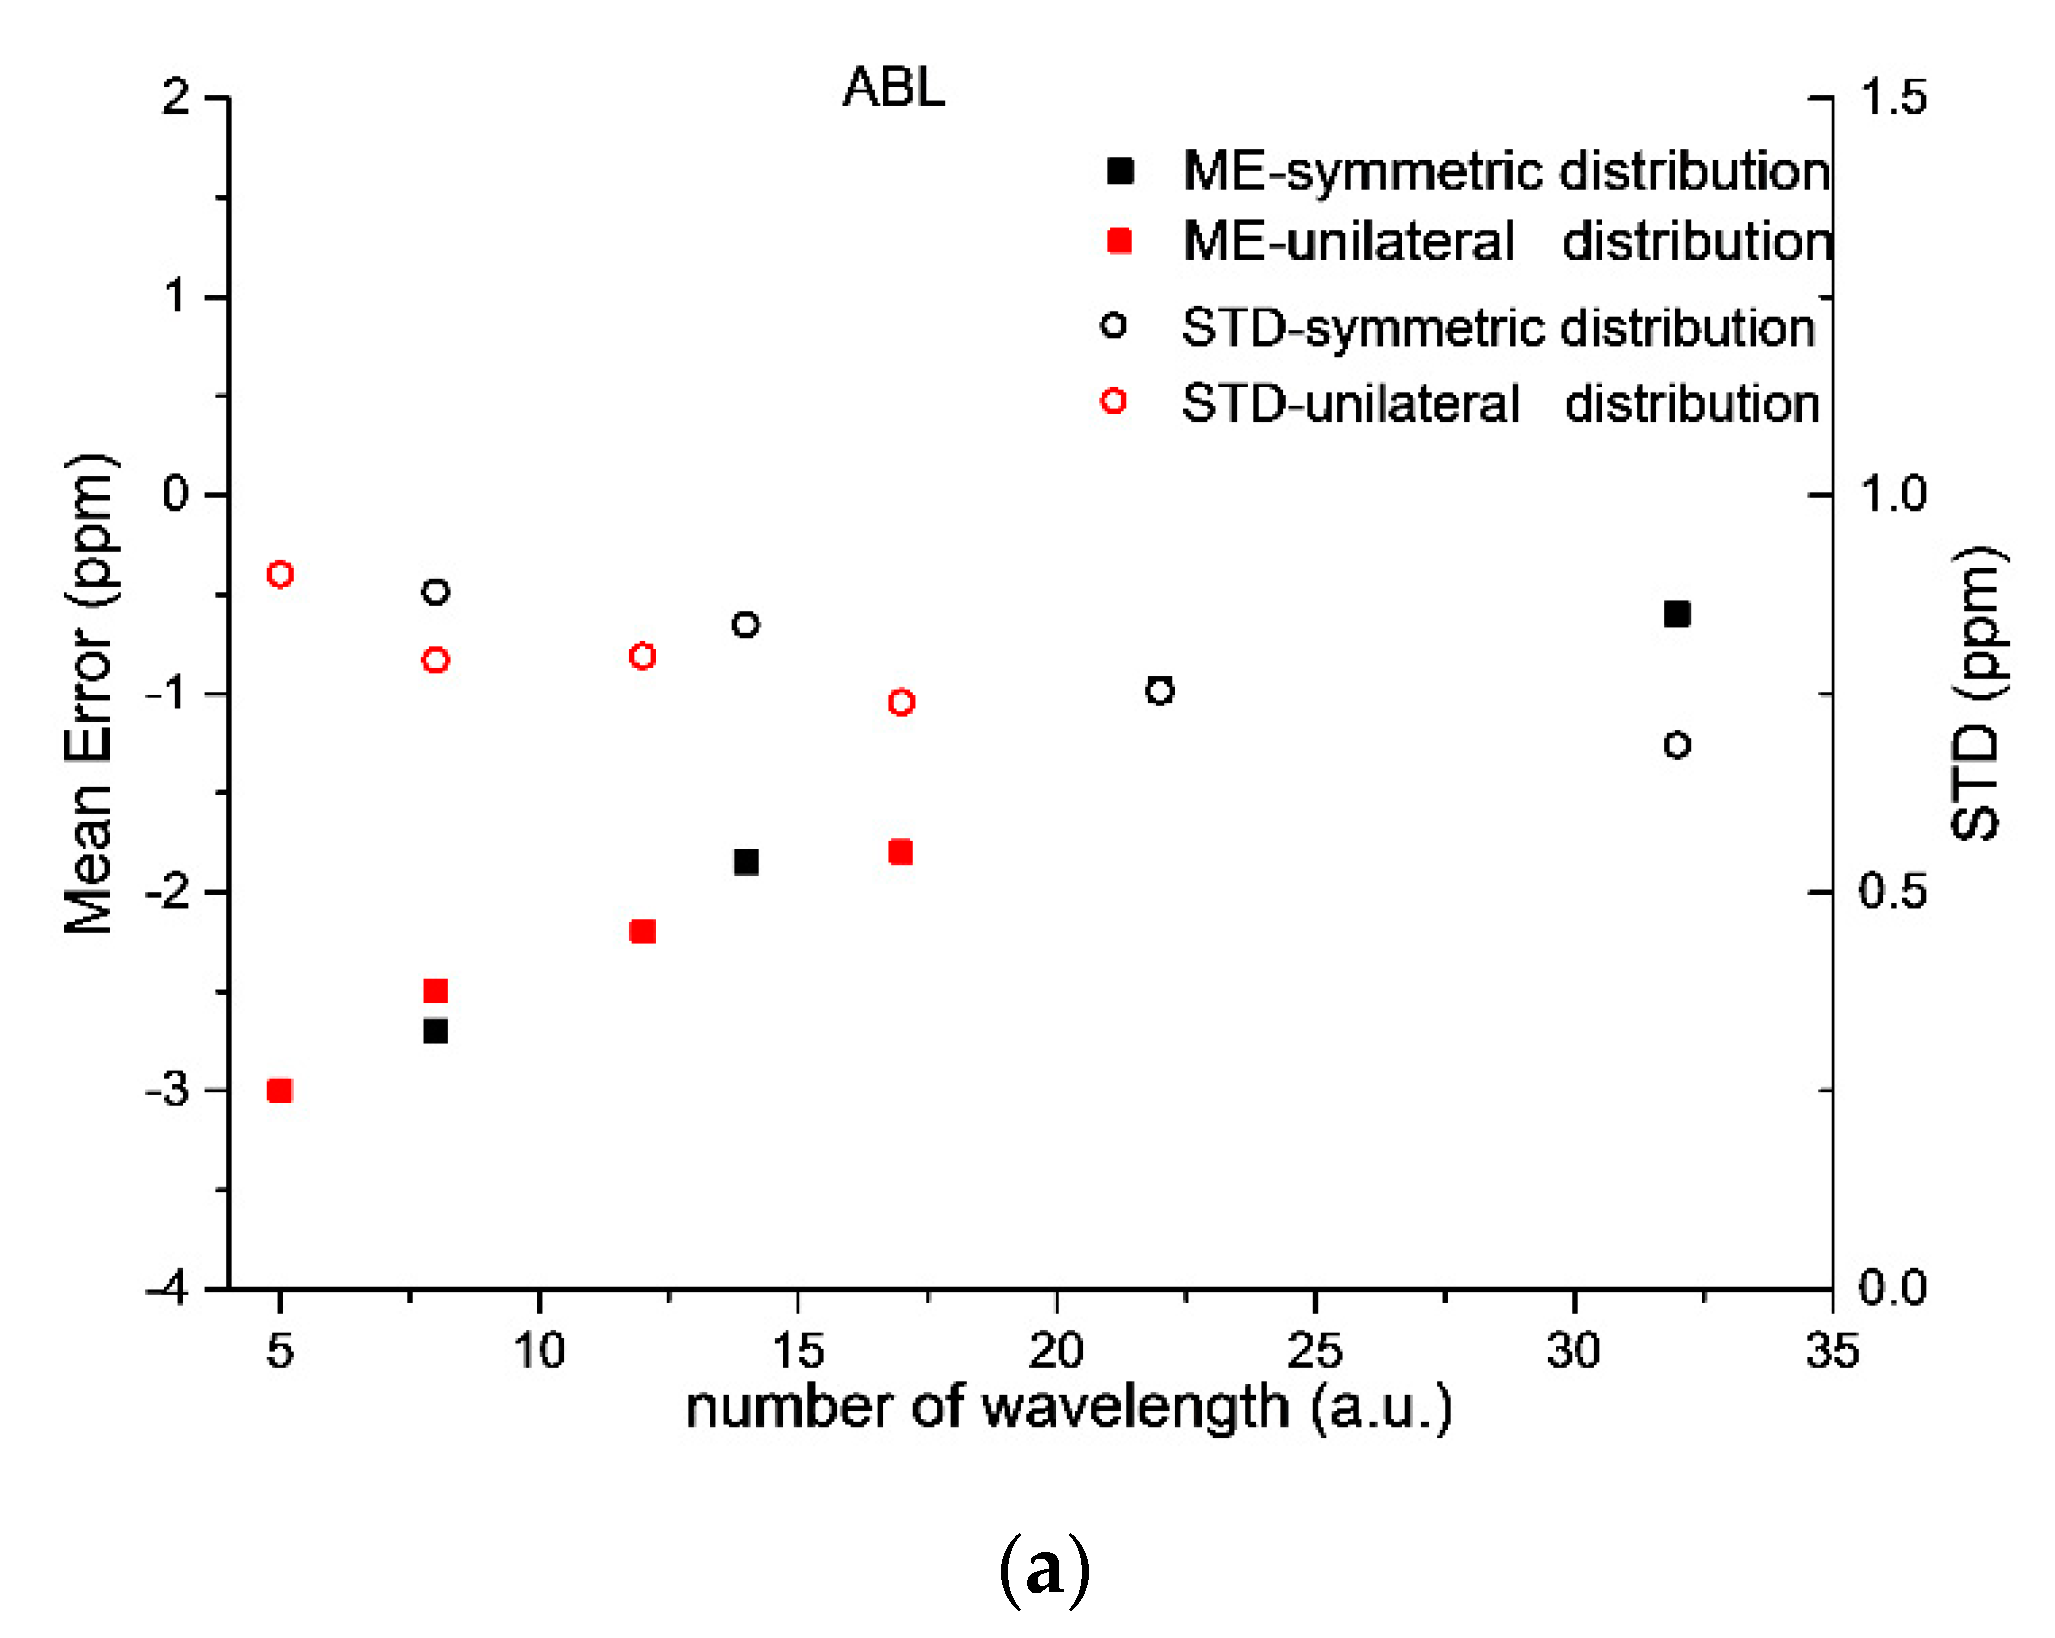
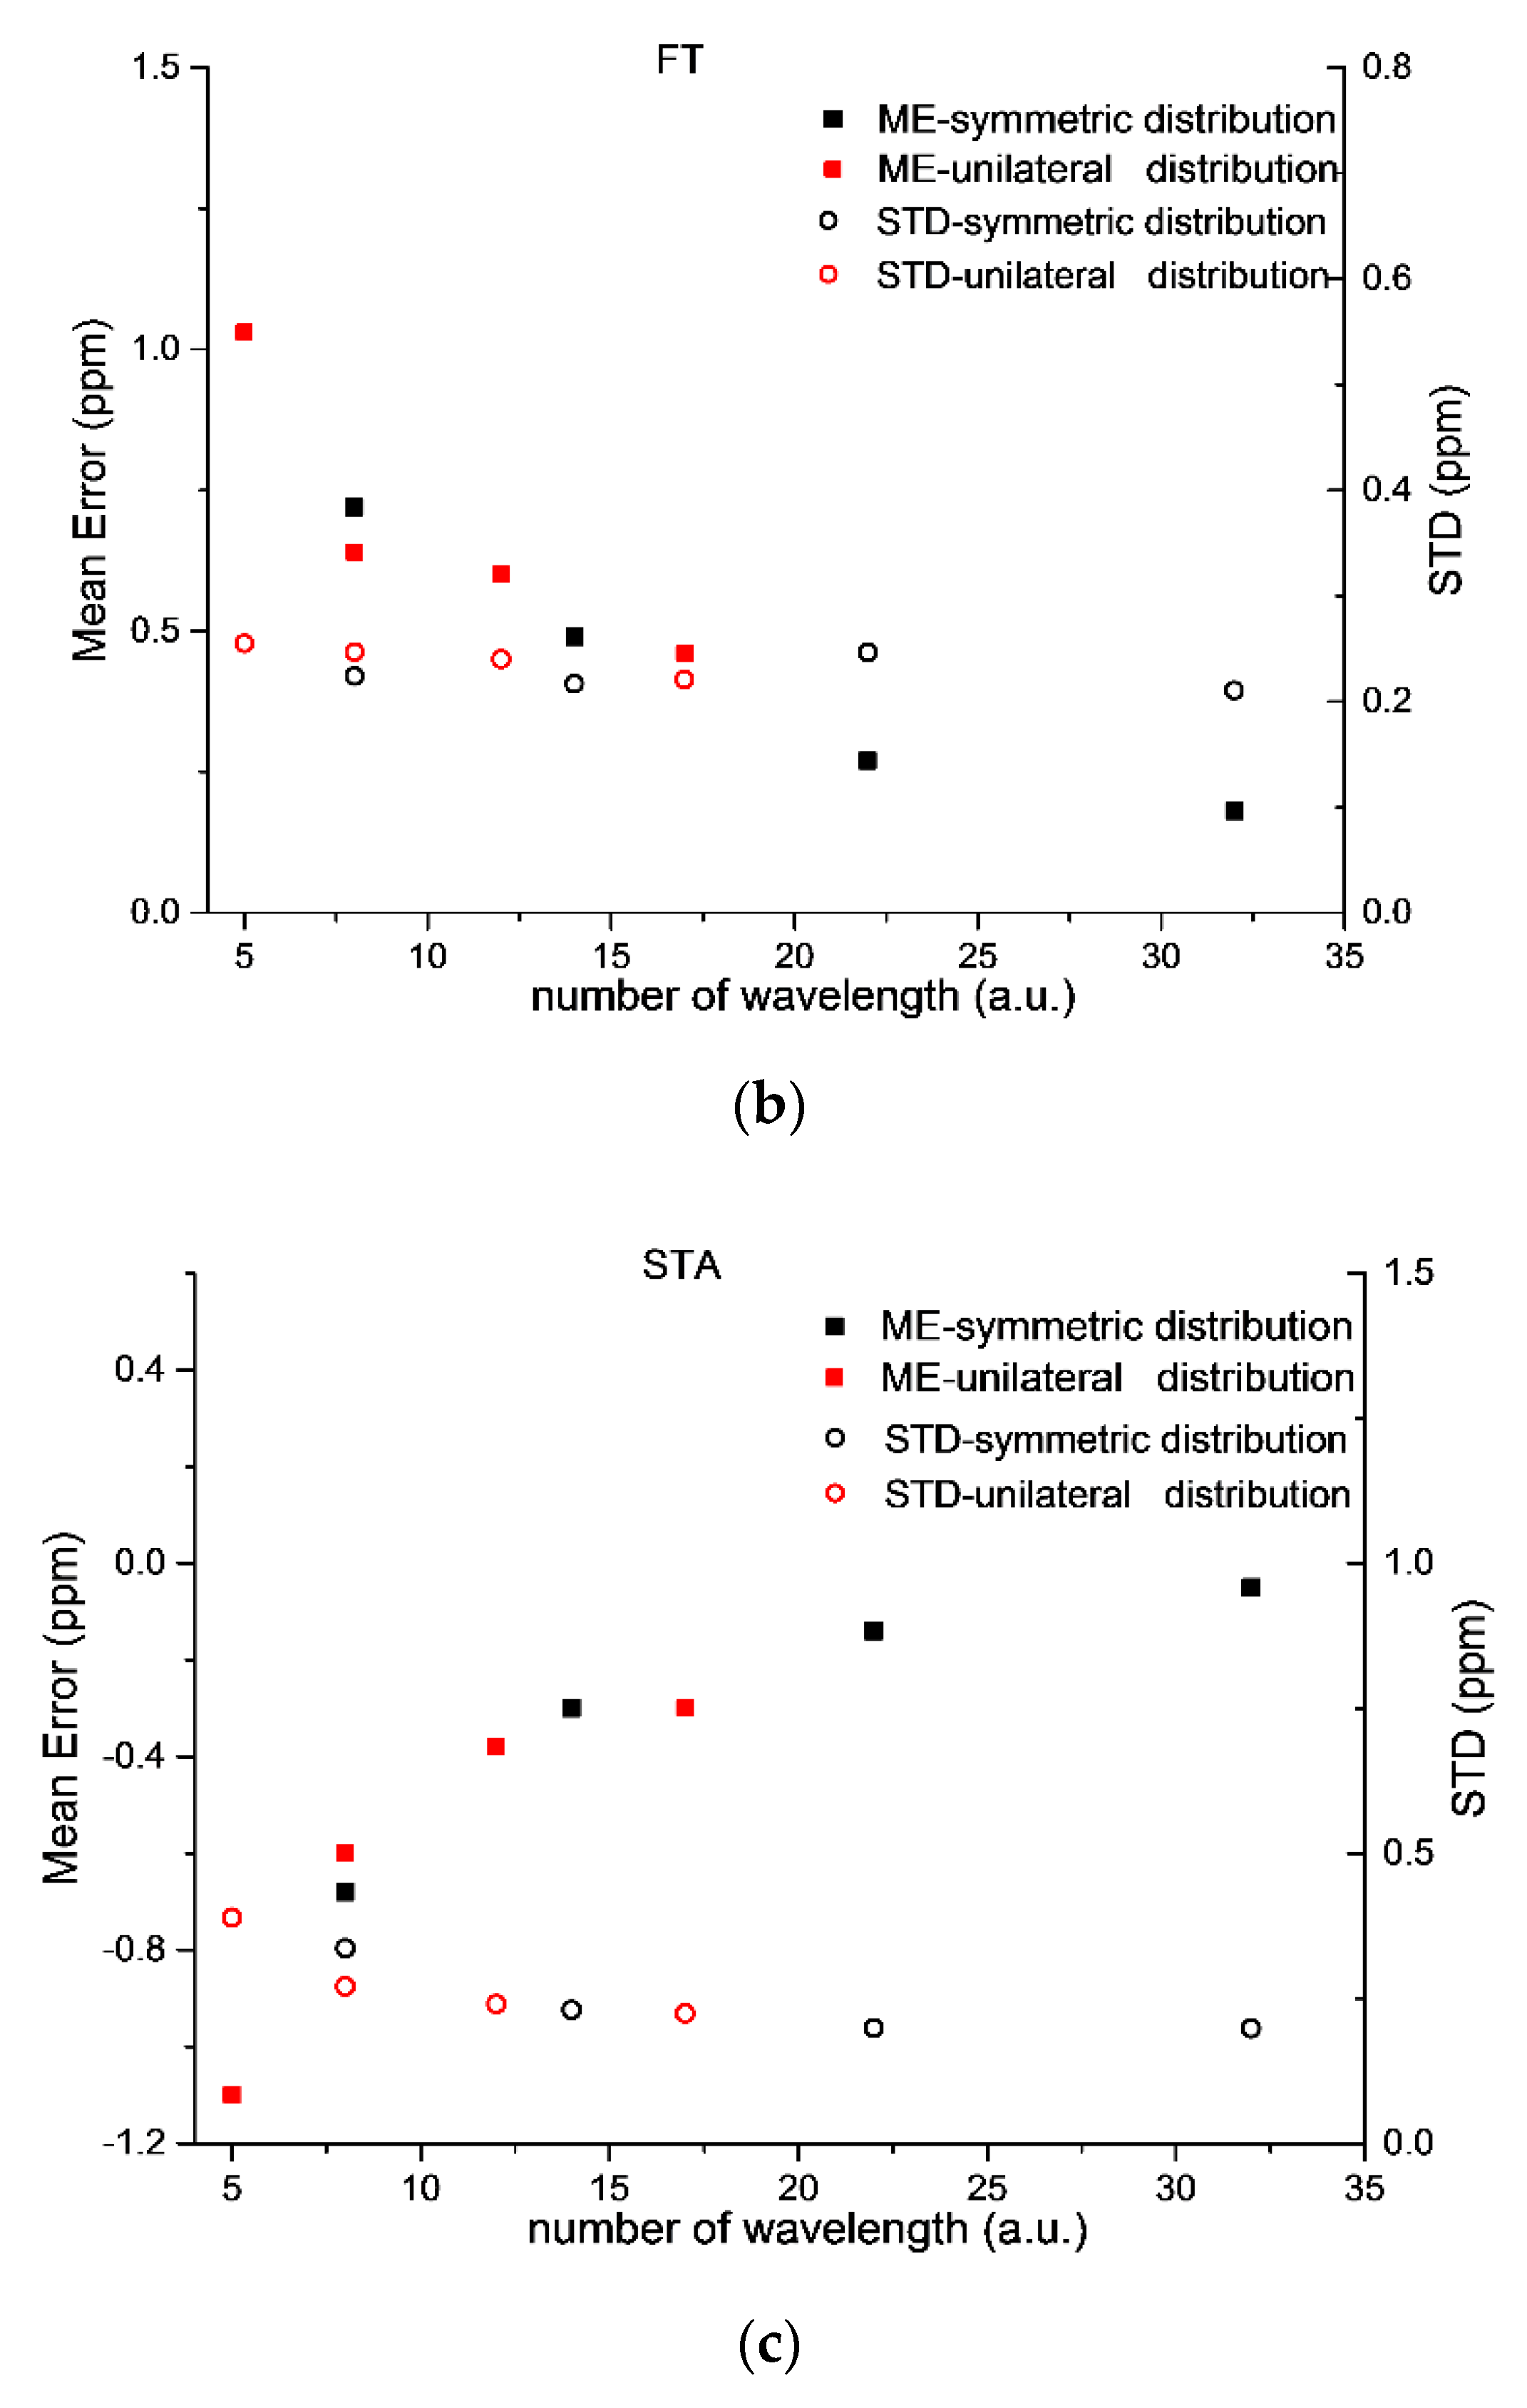
Figure 3 shows that both ME and STD decrease with the increasing number of wavelengths in three layers. We also found that the number of wavelengths, rather than the wavelength step, is the dominant factor in determining the performance of inversions. Two sampling modes yield very similar performance with the same number of wavelengths. With 22 wavelengths, MEs of retrievals are −0.98 ppm, 0.27 ppm, and −0.15 ppm in ABL, FT, and STA, respectively. We think that 22 wavelengths are adequate and appropriate to obtain retrievals of each layer with an error of less than 1 ppm. Consequently, we set the number of wavelengths to 22 in the following simulations.

3.3. Effect of the Number of Layers

In order to determine the optimal number of sliced layers, we discussed different options for the number of slicing layers, including two, three, and four layers, into the inversion. In this experiment, we changed the default setting of the CO2 profile into a four-layer profile, as shown in Table 3. The simulated signals were then generated on this basis and were used to obtain sliced xCO2 of two-layer and three-layer. We also calculated the pseudo-truth of sliced xCO2 using weighted averaging in terms of sums of atmospheric pressures in different layers for two-layer and three-layer inversions. Then, the mean error was calculated as the difference between retrieved XCO2 and the corresponding pseudo-truths. The results of the simulations are shown in Table 3. In this section, the SNR(T,λcentral) was set to 25 dB, the setting of the number of wavelengths was 22, and the detailed setting of the layers and concentration of CO2 in each layer shown in Table 1.
ABLB represents the layer below ABLH, ABLU represents the layer upper ABLH, LFT represents the lower free troposphere, and UFT represents the upper free troposphere. The column, xCO2, represents preset xCO2 in each layer.
Table 3 shows that the number of sliced layers have evident influence on the performance of our retrieval model. Both the accuracy and the precision of retrievals decrease with the increasing number of sliced layers. The scheme of two layers yields results with the highest accuracy and precision, in which MEs are −0.46 ppm and 0.11 ppm, respectively, whose corresponding STDs are also the lowest among the three schemes. Moreover, these results exhibit that both the accuracy and the precision are related to the range of each layer. The proposed method can obtain xCO2 with errors of less than 1 ppm for each layer when the number of sliced layers is less than three.
More sliced layers help us to gain more information on the vertical mixing of CO2 but lead to lower accuracy and precision. Hence, there is a compromise in terms of the selection of an appropriate number of sliced layers. Near-surface CO2 has a strong relationship with human activity and ecosystems. The CO2 gradient around PBL is meaningful for us to quantitatively calculate carbon fluxes. If we sliced the atmosphere into two layers, the concentration of CO2 in ABL would be acquired with high accuracy, but the range of ABLU layer is too large compared with the range of ABLB. It is thus not reasonable to calculate the CO2 gradient around the ABL. If we sliced the atmosphere into four layers, the accuracy of retrievals in the ABL and FT would be insufficient to obtain accurate estimates of CO2 gradients between ABL and FT. Therefore, three sliced layers would be the most appropriate.

3.4. Effect of the Atmospheric Boundary Layer Height (ABLH)

The ABL is the lowest layer of the atmosphere, which is directly affected by the Earth’s surface and responds to radiative forcing. LiDAR is capable of measuring the ABLH with high accuracy. ABLH has a relationship with the location, the landform, and meteorological conditions. To evaluate the performance of the proposed retrieval method with respect to different heights of PBL, we carried out inversion simulations under different settings of the PBLH, namely 1.0 km, 1.5 km, and 2.0 km. In this section, the SNR(T,λcentral) was set to 25 dB, and the setting of the number of wavelengths was 22.
Table 4 shows that the accuracy of the retrieved xCO2 in ABL would increase with the ascending ABLH. Especially for the xCO2 in ABL, the mean error of xCO2 in ABL was −1.76 ppm when ABLH was set to 1 km. Along with the ME, STD also falls with the increasing ABLH, implying that the precision of xCO2 is also affected by the ABLH. We believe that the mechanism by which the ABLH affects the performance of the proposed method can be explained by Equation (9). A thicker ABL means a longer optical path, which leads to a higher DAOD. This would produce better adjustment in the ABL layer to promise the accuracy for xCO2 in ABL during the process of our retrieval model.

3.5. Ability to Retrieve Gradients of xCO2

In this subsection, experiments are designed to explore the ability of the proposed multi-wavelength method to retrieve gradients of CO2 under different circumstances. The ultimate goal of any space-based CO2 sensor is to map the dynamic distribution of carbon sources and sinks. The vertical gradient of CO2 is a critical parameter for distinguishing carbon sources and sinks. With enough accuracy, the vertical gradient of CO2 can provide the potential ability to estimate carbon fluxes quantitatively. Three typical CO2 profiles are assumed, as shown in Table 5, to simulate the possible characteristics of different carbon fluxes. In this series of experiments, we assumed three scenarios according to differences between XCO2 in ABL and FT and named them as shown in Table 5. It is worth noting that the vertical profiles of CO2 are determined by many factors. In some extreme cases, a lower xCO2 in ABL with respect to FT could be witnessed for CO2 source regions and vice versa. Herein, we utilized the potential source, sink, and neutral to name the three scenarios, purely for simplification. In this group of experiments, the number of wavelengths was set to 22, the SNR(T,λcentral) was set to 25 dB, and the wavelength range was set to 1572.305–1572.365 nm.
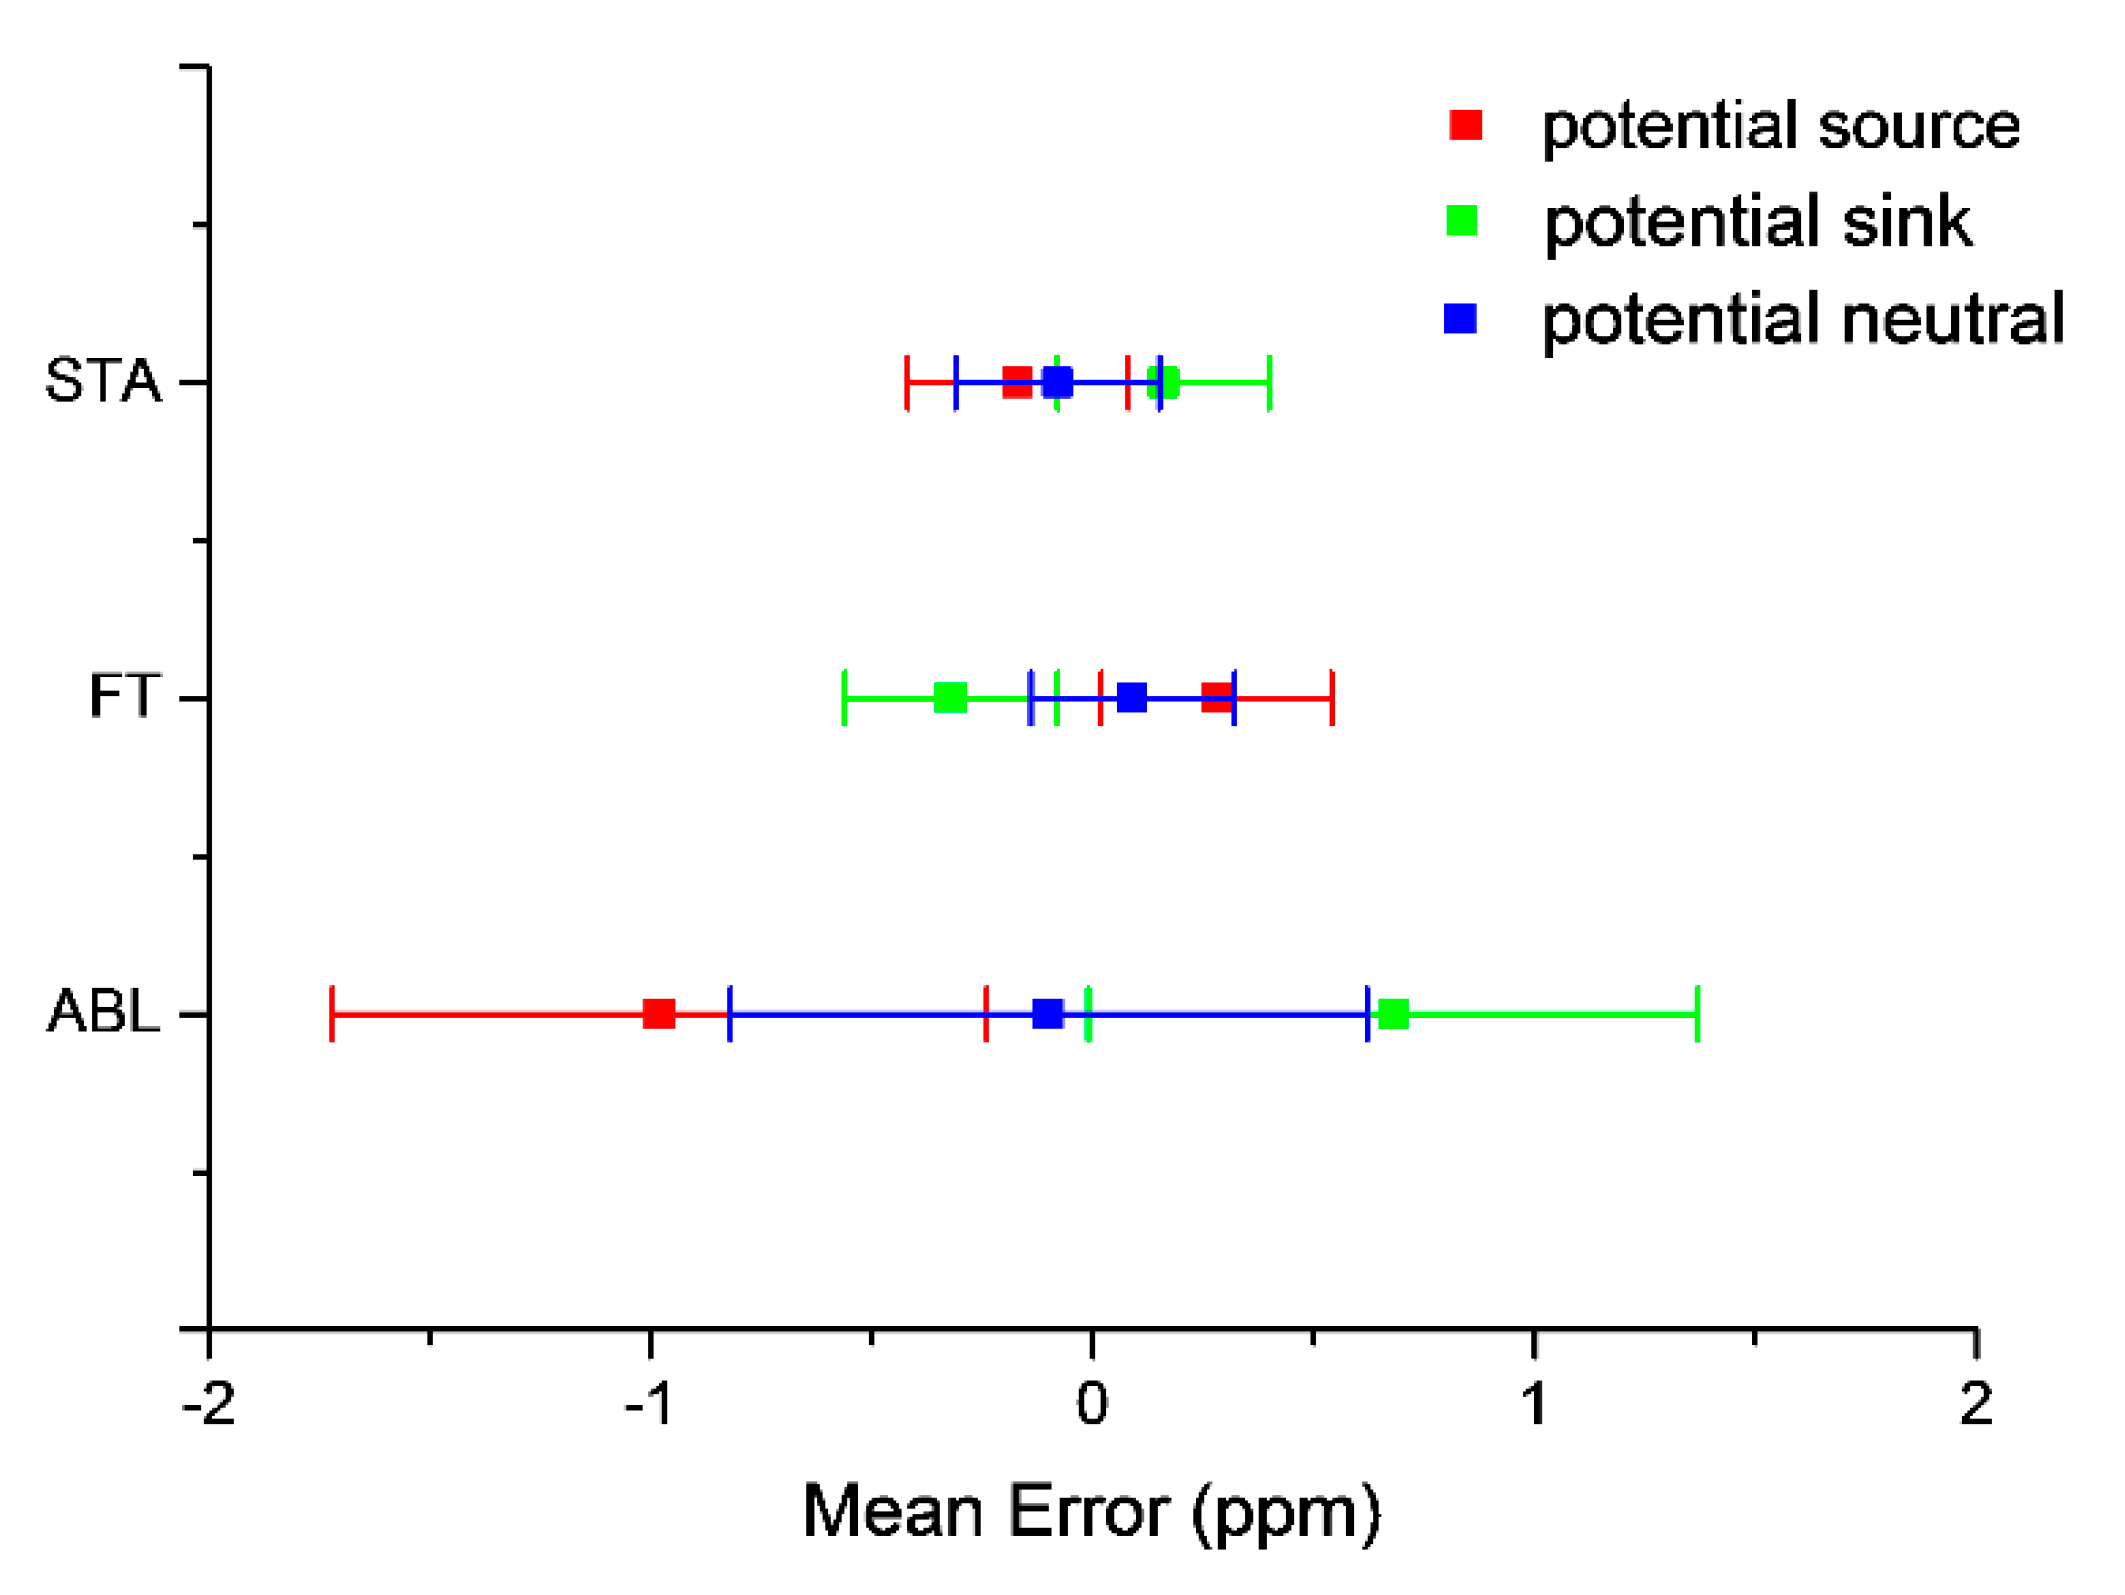
Figure 4 shows the ME and STD of retrievals in different layers for three scenarios. Each subfigure shows the performance of the proposed method in a specific layer and different colors are used to represent different characteristics of CO2 vertical profiles, namely a potential source, a potential sink, and a potential neutral area. The MEs of xCO2 retrievals in ABL are −0.98 ppm, −0.31 ppm, and −0.11 ppm for a potential carbon source, a potential sink, and a potential neutral region, respectively. Compared with retrievals in ABL, retrievals in the other two layers are much more accurate, yielding an ME of no more than 0.34 ppm regardless of carbon characteristics. The STD never exceeds 0.73 ppm in any case. These results indicate that the proposed method can obtain accurate and precise results regardless of carbon characteristics.
The mean errors of xCO2 in ABL and xCO2 in FT would be anti-correlated (one is positive while the other negative) for the source and sink cases because, in the retrieval model, it would adjust the value of DAOD in each layer according to the weight matrix W in the manuscript. Additionally, it would promise that the total DAOD is certain. The DAOD in STA is larger than that of ABL and FT. Hence, the main adjustments of DAOD occur in ABL and FT, and mean errors in DAODs in ABL and FT would have a neutralized relationship. Meanwhile, it is also worth noting that the performance of the proposed method varies with different characteristics of CO2 vertical profiles.
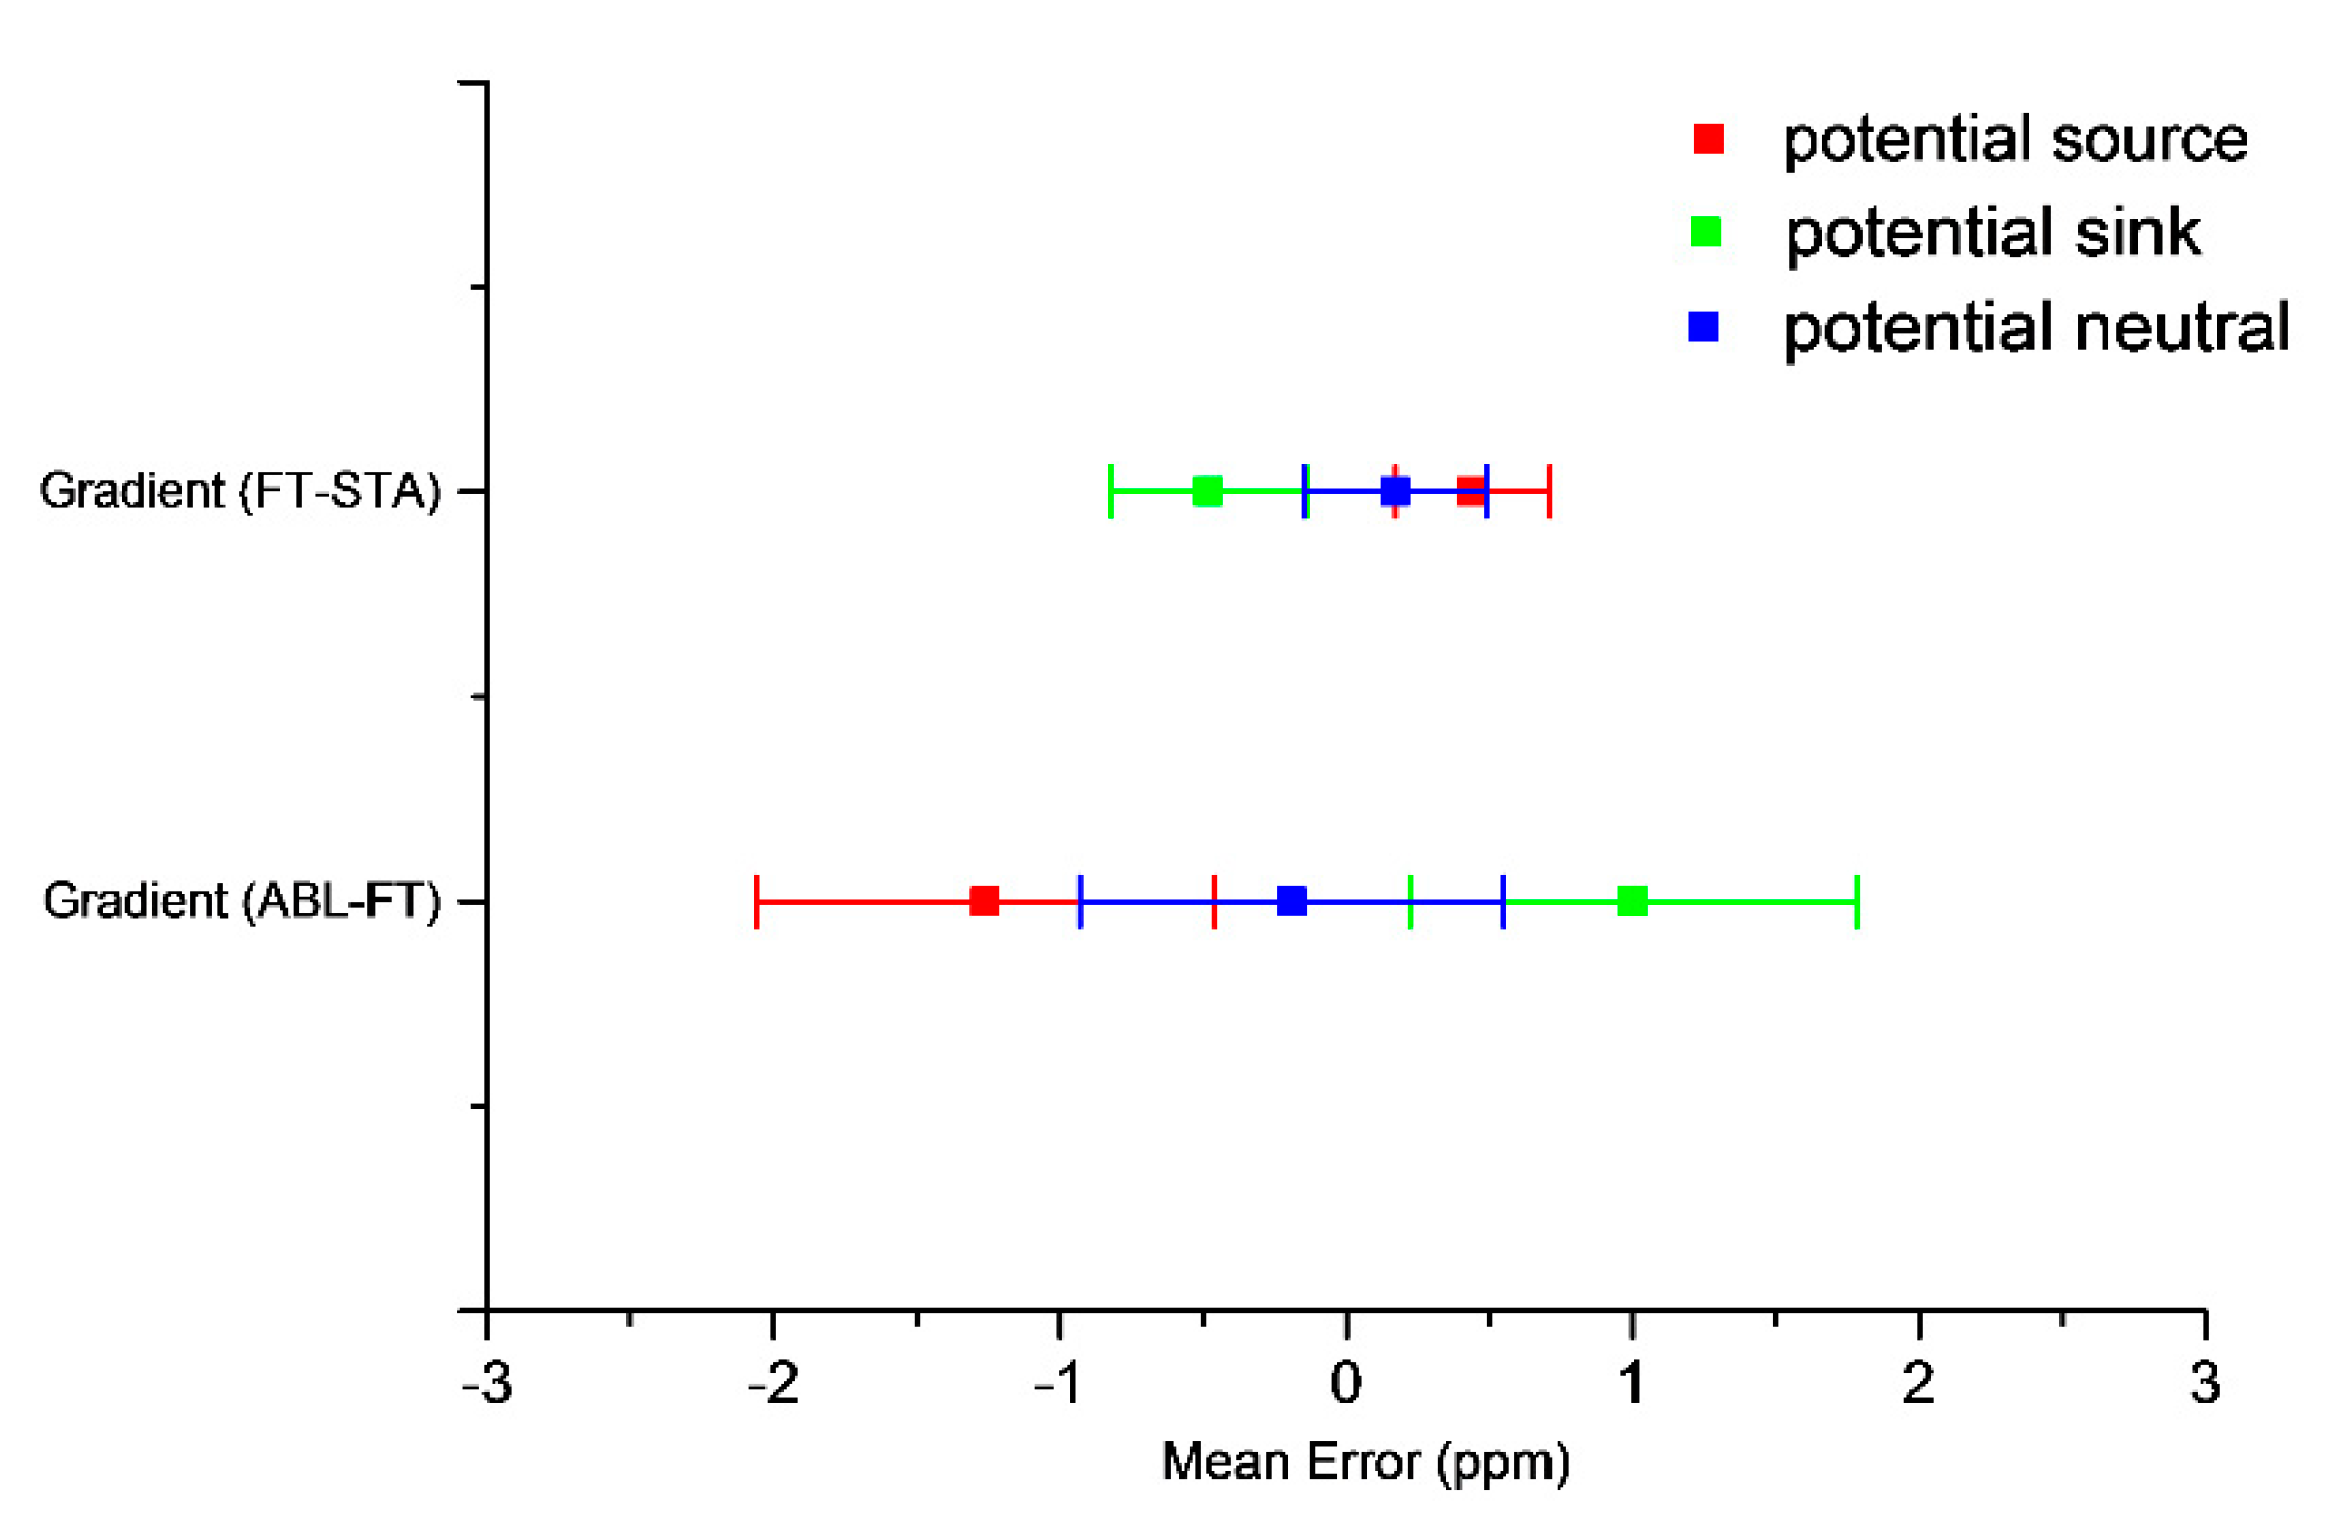
Figure 5 shows the ME and STD of retrieved xCO2 gradients, including the xCO2 gradient between ABL and FT and between FT and STA. For a potential carbon source, the ME and STD of the retrieved xCO2 gradient (xCO2ABL- xCO2FT) are −1.25 ppm and 1.05 ppm, xCO2ABL is xCO2 in ABL, and xCO2FT is xCO2 in FT. For a potential carbon sink, the ME and STD of the retrieved xCO2 gradient (xCO2ABL- xCO2FT) are -1.03 ppm and 1.02 ppm. For a potential neutral region, the ME and STD of the retrieved xCO2 gradient (xCO2ABL- xCO2FT) are −0.17 ppm and 0.99 ppm. Consequently, the accuracy and precision of the retrieved xCO2 gradients are also influenced by the characteristics of the vertical CO2 profiles. Considering that the true carbon gradient (xCO2ABL- xCO2FT) is set to 8 and −12 ppm, its accuracy would be acceptable for its largest uncertainty of only around 16%.
As for the xCO2 gradient between FT and STA, the uncertainty of the retrieved xCO2 gradients is less than 7.5% in all three scenarios. Moreover, both the accuracy and precision of the retrieved xCO2 gradients between FT and STA are higher than the carbon gradients between ABL and FT. Referring to Figure 4, we believe that the lower accuracy and precision of the xCO2 retrievals in ABL are responsible for such a phenomenon.

4. Discussion

The water vapor is widely regarded as the most significant interference in measuring CO2 by using the IPDA LiDAR. In the previous experiments, we ignored interferences from water vapor, which may result in misleading conclusions. Hence, we try to determine the influence on CO2 concentration derived from the errors in water vapor information in this subsection.

4.1. Interference of Water Vapor in the Absorb Spectrum

For a CO2-IPDA LiDAR working near 1.6 μm, there are three commonly used candidate lines, namely R14, R16, and R18 in the 30012←00001 band of CO2. We select all lines of water between 6358 and 6362 cm−1 and then set a cutoff of 1E-28 cm/molecule to the line intensity to screen useful lines. After this, there are 24 lines left, in which there are 9, 12, and 3 lines of H2O, HDO, and H218O, respectively. Spectroscopic parameters of CO2 and water vapor used in this experiment would be acquired from HITRAN 2016 [41].
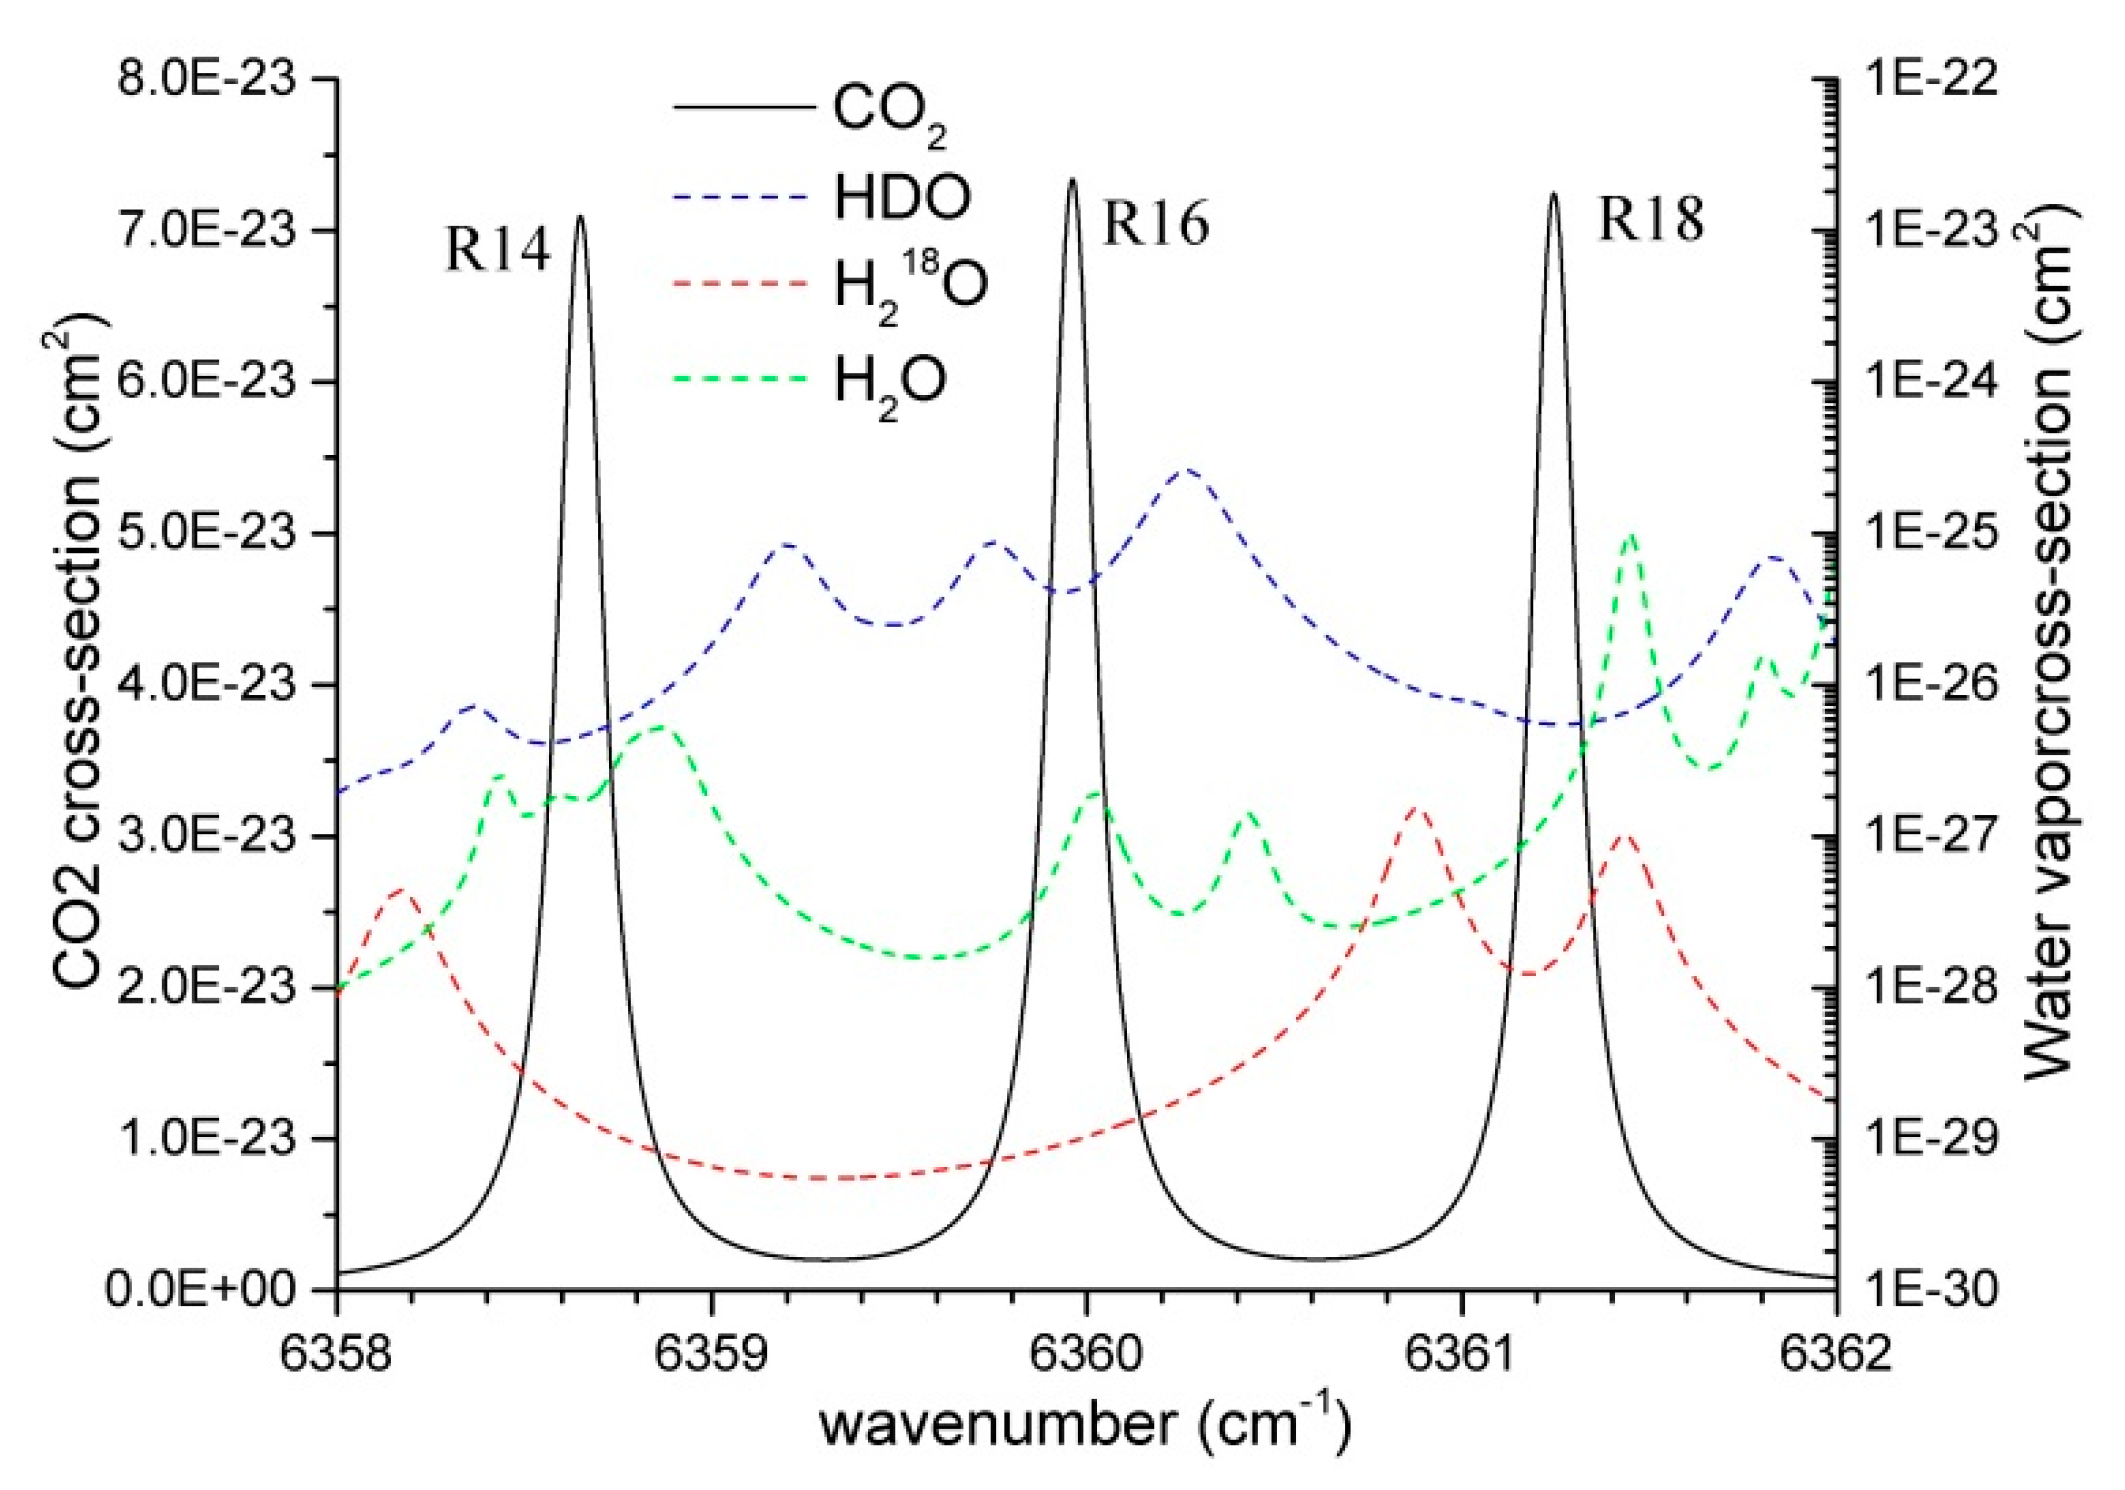
Figure 6 shows cross-sections of CO2 and water vapor in the wave number span of 6358 cm-1 to 6362 cm-1. Since line intensities of water vapor are smaller than those of CO2 by several orders, cross-sections of two molecules mark different vertical axes. Moreover, line intensities of water vapor are diverse in terms of absorption lines. Therefore, cross-sections of water vapor are shown in a logarithmic scale. Different isotopologues of the water vapor are shown in different colors, helping readers to understand the effect of isotopologues on the water vapor. The natural abundances of HDO, H218O, and H2O are set to 0.00031, 0.002, and 0.998, respectively.
Figure 6 shows that the majority of water interferences are related to HDO. One line of H2O is located at the right wing of the R18 line of CO2, whose central wave number is 6361.250 cm−1. From the perspective of the absorption of a single molecule, the water vapor would cause evident errors because the cross-section of water vapor is about 0.1–1% of that of CO2. The total error budget for a space-borne XCO2 measurement is merely 0.3% [42]. Therefore, the interference from water has been regarded as a critical error source for a long time.
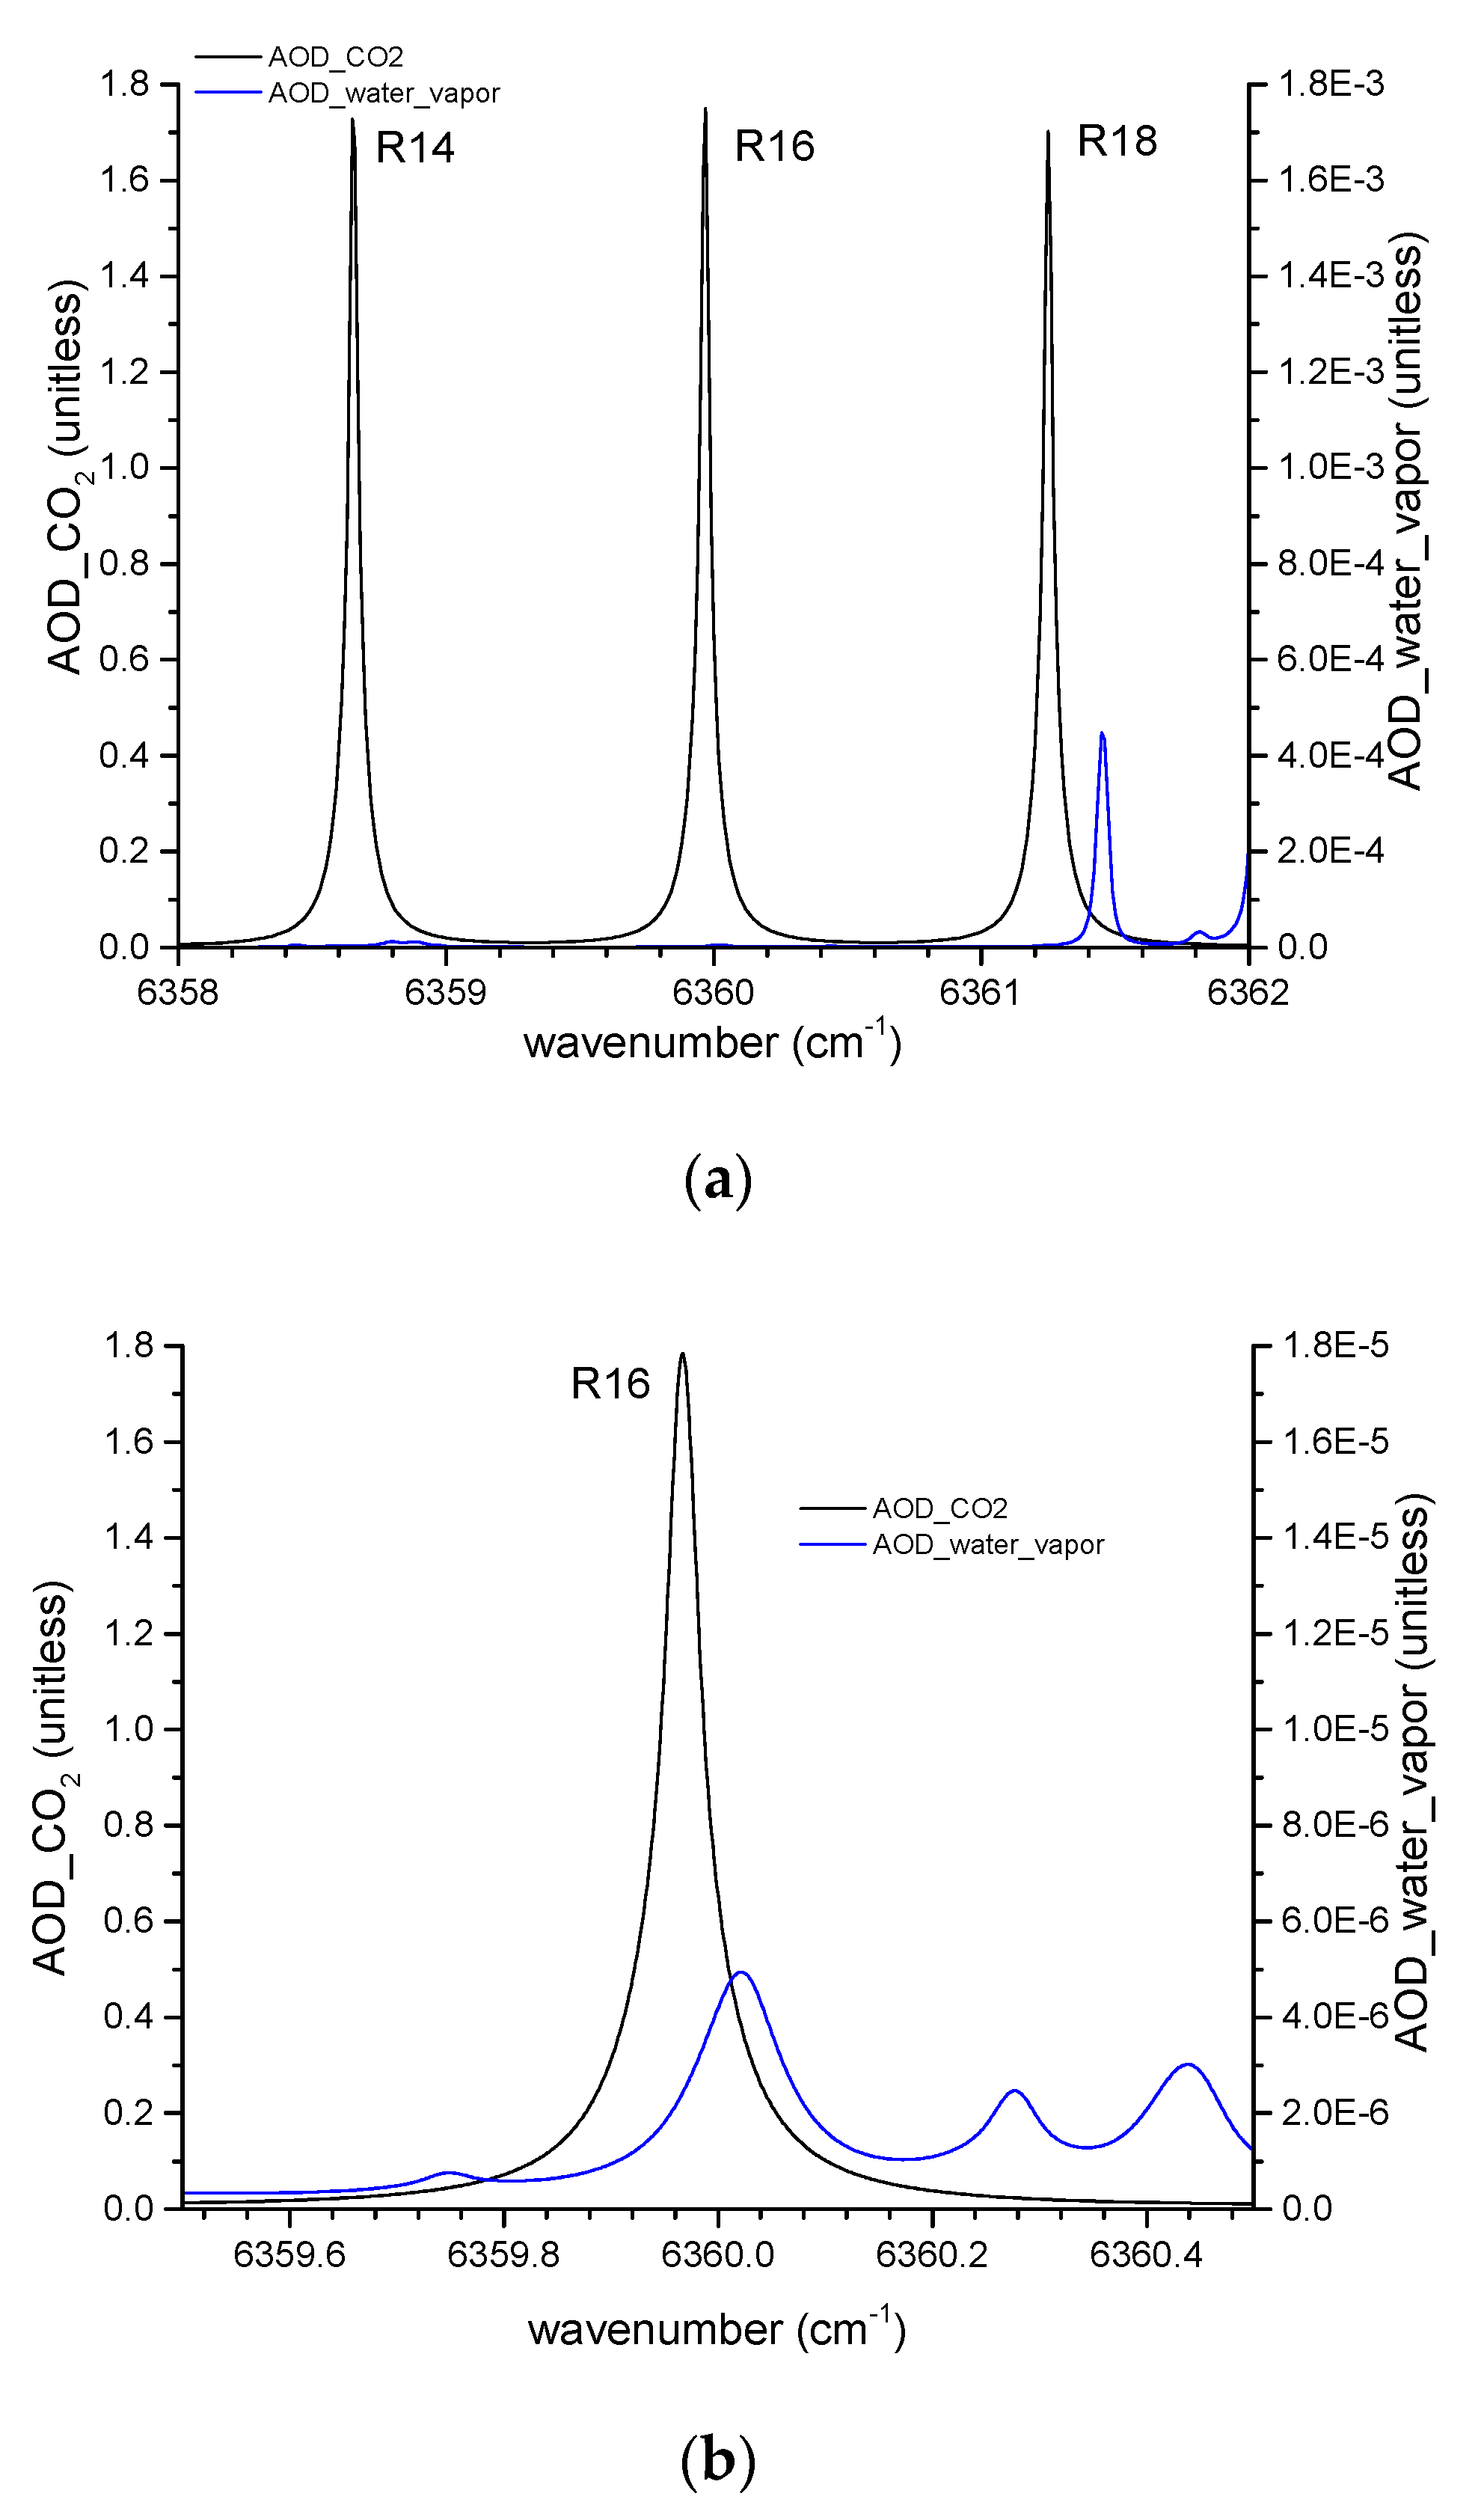
However, in the application of measuring atmospheric CO2 in natural conditions, we should focus on the measured absorption optical depth due to trace gases but not cross-sections. Figure 7 shows the simulated absorption optical depth of carbon dioxide and water vapor from the top of the atmosphere to the surface. In this experiment, we used US standard atmosphere 1976 to provide atmospheric parameters such as T, P, air density, and g. Concentrations of carbon dioxide and water vapor are set to constants 400 ppm and 15 g/kg, respectively. It is worth noting that the concentration of water vapor would decrease quickly with the altitude. Consequently, we have already overestimated significantly the effect of water vapor in this experiment. Figure 7a also shows that interferences from water vapor are negligible for R14 and R16 in terms of the measured absorption optical depth. For R18, there are evident interferences at the right wing. However, interferences are negligible at the left wing of R18. Consequently, one can select appropriate on-line and off-line wavelengths to avoid interference from the water vapor. For the multi-wavelength inversion framework, we need to scan a whole spectrum. Figure 7b shows a detailed comparison of absorption optical depth (AOD) in R16 line. The ratio of AOD_water and AOD_CO2 fluctuates between 0.00001% and 0.02%. If we further confine the range of wavelengths to 1572.305–1572.365 nm, namely 6359.846–6360.089 cm-1, the ratio would fluctuate between 0.0013% and 0.0019%, which accounts for merely less than 1% of the total error budget. Hence, the influence of water vapor on the absorption spectrum would be neglected.

4.2. The Influence of Water Vapor on the Value of Dry-Air Mixing Ratio of CO2

Though the last subsection has demonstrated that interference from water vapor can be ignored in terms of measuring DAOD, there is another mechanism by which additional errors would be introduced owing to the neglect of water vapor. The DAOD is proportional to the number density of CO2 molecules. Water vapor would influence the value of DAOD of CO2. After obtaining the number density of CO2 molecules, we need to transform it into the dry-air mixing ratio. That is to say, we need to exclude water vapor molecules from the wet air molecules. To consider such an effect, we simulated the vertical profile of water vapor using the concept of water vapor saturation pressure, as shown in Equation (16).
W = M ( H 2 O ) M ( a i r ) ( p w P p w ) 1000
where W is the content of water in the atmosphere (g/kg), M(H2O) is the molar mass of water vapor, M(air) is the molar mass of air molecular, P is the atmospheric pressure, and pw represents the water vapor saturation pressure, which could be calculated using the Goff–Gratch method, recommended by WMO (World Meteorological Organization) [43]. However, in actual experiments, it would exclude errors in water vapor information regardless of whether they were obtained by reanalysis meteorological data or by actual measurements. Hence, we discussed the influence of different accuracies of water vapor on the final retrieval results, including 1%, −1%, 5%, and −5%, which could be calculated by Equations (17) to (18). The results are presented in Table 6.
x C O 2 ( i ) = N C O 2 ( i ) N a i r ( i ) ( 1 r a t i o ( H 2 O ) ( i ) )
N C O 2 ( i ) = D A O D C O 2 i + D A O D H 2 O i 2 r i [ σ C O 2 , λ o n σ C O 2 , λ o f f ]
where Nair(i) is the number density of air molecules in layer i, i = 1,2,3. ratio(H2O)(i) is the dry-air mixing ratio of water vapor in layer i (i = 1,2…n, n = 4). NCO2(i) is the number density of CO2 molecules in layer i, ri is the range interval of layer i.   D A O D C O 2 i and A O D H 20 i represent the DAOD of CO2 and DAOD of water vapor in layer i (i = 1,2…n, n = 4).
As is shown in Table 6, water vapor has a larger influence on xCO2 in ABL than in FT and STA. Since the concentration of water vapor mostly exists in the lower atmosphere, there is nearly no water vapor when the altitude is higher than 20 km. However, this amount would be only 0.06 ppm even though the uncertainty of water vapor information is 5%. In conclusion, the influence of water vapor on sliced xCO2 would be neglected based on our recommended retrieval model.

5. Conclusions

A multi-wavelength inversion framework for CO2-IPDA LiDAR is proposed to obtain sliced xCO2. In this framework, we slice the atmosphere into three layers, ABL, FT, and STA. Then, we construct multiple differential absorption equations using different on-line wavelengths. On this basis, the constrained linear least-squares technique can be used to obtain the optimum solution. Our method achieves a reliable performance when the SNR(T, λcentral) value is 25 and the wavelength number of 22. Further experiments confirmed the potential ability to distinguish different carbon characteristics by our recommended method. Even the largest error in the sliced xCO2 would be less than 0.03%, while the accuracy of the xCO2 gradient is within 1.25 ppm. Moreover, the results of sliced xCO2 would be reasonable to neglect the influence of the present uncertainty of water vapor information. Therefore, if a multi-wavelength IPDA launched successfully, it would produce meaningful data to help us learn more about the vertical diffusion of CO2 globally.

Author Contributions

Conceptualization, G.H. and T.S.; software, T.S.; validation, X.M.; writing—original draft preparation, G.H. and T.S.; writing—review and editing, G.H., X.M., H.X., T.S. and M.Z.; visualization, T.S., W.G. and Q.L.; funding acquisition, G.H. All authors have read and agreed to the published version of the manuscript.

Funding

This work was supported by the National Natural Science Foundation of China (Grant No. 41971283, 41801261, 41827801), the National Key Research and Development Program of China (2017YFC0212600), and the Postdoctoral Science Foundation of China (2017T100580).

Acknowledgments

We thank anonymous reviewers and editors for their kind comments and suggestions.

Conflicts of Interest

The authors declare no conflict of interest.

Appendix A

As shown in Equation (10) in the manuscript, there are two types of constraint conditions, namely equality constraints and inequality constraints. For the optimization problem with equality constraints, the Lagrange multiplier method can be directly applied to obtain the optimal solution.
To obtain the optimal solution of f(x) with constraints of g(x), as shown in Equation (1), we can firstly turn to an unconstrained optimization problem, L(x, α, β), as shown in Equation (2), using the Lagrange multiplier.
{ f ( x ) = min W x o b s 2 g j ( x ) = { x i 425 0 , i = 1 , 2 , ..... , m x i 375 0 , i = 1 , 2 , .... , m A x b 0  
L ( x , α , β ) = f ( x ) + i = 1 m β i g i ( x )  
On the above basis, we can further determine that a feasible solution, x, of Equation (10) should fulfill the following conditions, as shown in Equation (3). These conditions are referred to as Kuhn–Tucker conditions.
{ x L ( x , β ) = 0 β j g j ( x ) = 0 , j = 1 , 2 , ... , n g j ( x ) 0 , j = 1 , 2 , ... , n β j 0 , j = 1 , 2 , ... n

Appendix B

The constrained Lagrange multiplier methods:
1. Equality constraints like Equation (1):
{ min f ( x ) g i ( x ) = 0       i = 1 , 2 , 3
We supposed the Lagrangian function like Equation (2):
L ( x , λ ) = f ( x ) + λ i g i ( x )
Then, solving Equation (3)
{ x L ( x , λ ) = 0 λ L ( x , λ ) = 0
Finally, the calculated x substitutes into f(x) to be treated as an extreme value; we can determine whether it is the minimum value after verification.
2. Inequality constraints like Equation (4):
{ m i n f ( x ) g i ( x ) 0       i = 1 , 2 , 3
We supposed the Lagrangian function like Equation (5):
L ( x , λ ) = f ( x ) + λ i g i ( x )
It could be proven that KKT conditions are sufficient and necessary conditions for the objective function to obtain the minimum value, based on Equation (6).
{ x L = x f + i λ i x g i = 0 g i ( x ) 0 λ 0 λ i g i ( x ) = 0       i = 1 , 2 , 3
Then, we could calculate the KKT conditions to acquire the extreme minimum value of f ( x ) .
3. Both equality and inequality constraints like Equation (7) are calculated as follows:
{ min f ( x ) g i ( x ) = 0       i = 1 , 2 , 3 , m h j ( x ) 0       j = 1 , 2 , 3 , n
The solution of x should satisfy the following conditions, as in Equation (8):
{ x L = x f + i λ i x g i + j μ j x h j = 0 g i ( x ) = 0       i = 1 , 2 , 3 , m h j ( x ) 0       j = 1 , 2 , 3 , n μ j 0       j = 1 , 2 , 3 , n μ j h j ( x ) = 0       j = 1 , 2 , 3 , n
Then, the solution of x could be satisfied by the KKT conditions and minimize the Lagrangian function to obtain a feasible solution under these constraints.

References

  1. Sabine, C.L.; Feely, R.A.; Gruber, N.; Key, R.M.; Lee, K.; Bullister, J.L.; Wanninkhof, R.; Wong, C.S.; Wallace, D.W.R.; Tilbrook, B.; et al. The oceanic sink for anthropogenic CO2. Science 2004, 305, 367–371. [Google Scholar] [CrossRef] [PubMed] [Green Version]
  2. Rayner, P.; O’Brien, D. The utility of remotely sensed CO2 concentration data in surface source inversions. Geophys. Res. Lett. 2001, 28, 175–178. [Google Scholar] [CrossRef] [Green Version]
  3. Qiu, R.; Han, G.; Ma, X.; Sha, Z.; Shi, T.; Xu, H.; Zhang, M. CO2 concentration, a critical factor influencing the relationship between solar-induced chlorophyll fluorescence and gross primary productivity. Remote Sens. 2020, 12, 1377. [Google Scholar] [CrossRef]
  4. Liang, A.; Han, G.; Gong, W.; Yang, J.; Xiang, C. Comparison of global XCO2 concentrations from OCO-2 with tccon data in terms of latitude zones. IEEE J. Sel. Top. Appl. Earth Obs. Remote Sens. 2017, 10, 2491–2498. [Google Scholar] [CrossRef]
  5. Abshire, J.B.; Ramanathan, A.; Riris, H.; Mao, J.P.; Allan, G.R.; Hasselbrack, W.E.; Weaver, C.J.; Browell, E.V. Airborne measurements of CO2 column concentration and range using a pulsed direct-detection ipda lidar. Remote Sens. 2014, 6, 443–469. [Google Scholar] [CrossRef] [Green Version]
  6. Amediek, A.; Ehret, G.; Fix, A.; Wirth, M.; Budenbender, C.; Quatrevalet, M.; Kiemle, C.; Gerbig, C. Charm-f-a new airborne integrated-path differential-absorption lidar for carbon dioxide and methane observations: Measurement performance and quantification of strong point source emissions. Appl. Opt. 2017, 56, 5182–5197. [Google Scholar] [CrossRef]
  7. Amediek, A.; Fix, A.; Wirth, M.; Ehret, G. Development of an opo system at 1.57 μm for integrated path dial measurement of atmospheric carbon dioxide. Appl. Phys. B 2008, 92, 295–302. [Google Scholar] [CrossRef] [Green Version]
  8. Ehret, G.; Kiemle, C.; Wirth, M.; Amediek, A.; Fix, A.; Houweling, S. Space-borne remote sensing of CO2, ch4, and n2o by integrated path differential absorption lidar: A sensitivity analysis. Appl. Phys. B 2008, 90, 593–608. [Google Scholar] [CrossRef] [Green Version]
  9. Kiemle, C.; Ehret, G.; Amediek, A.; Fix, A.; Quatrevalet, M.; Wirth, M. Potential of spaceborne lidar measurements of carbon dioxide and methane emissions from strong point sources. Remote Sens. 2017, 9, 1137. [Google Scholar] [CrossRef] [Green Version]
  10. Han, G.; Xu, H.; Gong, W.; Liu, J.; Du, J.; Ma, X.; Liang, A. Feasibility study on measuring atmospheric CO2 in urban areas using spaceborne CO2-ipda lidar. Remote Sens. 2018, 10, 985. [Google Scholar] [CrossRef] [Green Version]
  11. Du, J.; Zhu, Y.D.; Li, S.G.; Zhang, J.X.; Sun, Y.G.; Zang, H.G.; Liu, D.; Ma, X.H.; Bi, D.C.; Liu, J.Q.; et al. Double-pulse 1.57 mu m integrated path differential absorption lidar ground validation for atmospheric carbon dioxide measurement. Appl. Opt. 2017, 56, 7053–7058. [Google Scholar] [CrossRef] [PubMed]
  12. Lin, B.; Nehrir, A.R.; Harrison, F.W.; Browell, E.V.; Ismail, S.; Obland, M.D.; Campbell, J.; Dobler, J.; Meadows, B.; Fan, T.-F.; et al. Atmospheric CO2 column measurements in cloudy conditions using intensity-modulated continuous-wave lidar at 1.57 micron. Opt. Express 2015, 23, A582–A593. [Google Scholar] [CrossRef] [PubMed]
  13. Mao, J.; Ramanathan, A.; Abshire, J.B.; Kawa, S.R.; Riris, H.; Allan, G.R.; Rodriguez, M.; Hasselbrack, W.E.; Sun, X.; Numata, K. Measurement of atmospheric CO2 column concentrations to cloud tops with a pulsed multi-wavelength airborne lidar. Atmos. Meas. Tech. 2018, 11, 1–26. [Google Scholar] [CrossRef] [Green Version]
  14. Shi, T.; Han, G.; Ma, X.; Zhang, M.; Pei, Z.; Xu, H.; Qiu, R.; Zhang, H.; Gong, W. An inversion method for estimating strong point carbon dioxide emissions using a differential absorption lidar. J. Clean. Prod. 2020, 271, 122434. [Google Scholar] [CrossRef]
  15. Shi, T.; Ma, X.; Han, G.; Xu, H.; Qiu, R.; He, B.; Gong, W. Measurement of CO2 rectifier effect during summer and winter using ground-based differential absorption lidar. Atmos. Environ. 2020, 220, 117097. [Google Scholar] [CrossRef]
  16. Helliker, B.R.; Berry, J.A.; Betts, A.K.; Bakwin, P.S.; Davis, K.J.; Denning, A.S.; Ehleringer, J.R.; Miller, J.B.; Butler, M.P.; Ricciuto, D.M. Estimates of net CO2 flux by application of equilibrium boundary layer concepts to CO2 and water vapor measurements from a tall tower. J. Geophys. Res. Atmos. 2004, 109. [Google Scholar]
  17. Gatti, L.V.; Gloor, M.; Miller, J.B.; Doughty, C.E.; Malhi, Y.; Domingues, L.G.; Basso, L.S.; Martinewski, A.; Correia, C.S.C.; Borges, V.F.; et al. Drought sensitivity of amazonian carbon balance revealed by atmospheric measurements. Nature 2014, 506, 76–80. [Google Scholar] [CrossRef]
  18. Han, G.; Gong, W.; Ma, X.; Xiang, C.Z.; Liang, A.L.; Zheng, Y.X. A ground-based differential absorption lidar for atmospheric vertical CO2 profiling. Acta Phys. Sin. 2015, 6, 244206. [Google Scholar]
  19. Qiu, R.; Han, G.; Ma, X.; Xu, H.; Shi, T.; Zhang, M. A comparison of OCO-2 sif, modis gpp, and gosif data from gross primary production (gpp) estimation and seasonal cycles in north america. Remote Sens. 2020, 12, 258. [Google Scholar] [CrossRef] [Green Version]
  20. Aiuppa, A.; Fiorani, L.; Santoro, S.; Parracino, S.; Nuvoli, M.; Chiodini, G.; Minopoli, C.; Tamburello, G. New ground-based lidar enables volcanic CO2 flux measurements. Sci. Rep. 2015, 5. [Google Scholar] [CrossRef] [Green Version]
  21. Gibert, F.; Edouart, D.; Cenac, C.; Le Mounier, F.; Dumas, A. 2-mu m ho emitter-based coherent dial for CO2 profiling in the atmosphere. Opt. Lett. 2015, 40, 3093–3096. [Google Scholar] [CrossRef] [PubMed]
  22. Warren, R.E. Detection and discrimination using multiple-wavelength differential absorption lidar. Appl. Opt. 1985, 24, 3541–3545. [Google Scholar] [CrossRef] [PubMed]
  23. Fukuchi, T.; Goto, N.; Fujii, T.; Nemoto, K. Error analysis of so2 measurement by multiwavelength differential absorption lidar. Opt. Eng. 1999, 38, 141–145. [Google Scholar] [CrossRef]
  24. Fujii, T.; Fukuchi, T.; Cao, N.W.; Nemoto, K.; Takeuchi, N. Trace atmospheric SO2 measurement by multiwavelength curve-fitting and wavelength-optimized dual differential absorption lidar. Appl. Opt. 2002, 41, 524–531. [Google Scholar] [CrossRef] [PubMed]
  25. Chen, J.R.; Numata, K.; Wu, S.T. Error reduction in retrievals of atmospheric species from symmetrically measured lidar sounding absorption spectra. Opt. Express 2014, 22, 26055–26075. [Google Scholar] [CrossRef] [PubMed]
  26. Xiang, C.; Ma, X.; Liang, A.; Han, G.; Gong, W.; Yan, F. Feasibility study of multi-wavelength differential absorption lidar for CO2 monitoring. Atmosphere 2016, 7, 89. [Google Scholar] [CrossRef] [Green Version]
  27. Han, G.; Xu, H.; Gong, W.; Ma, X.; Liang, A. Simulations of a multi-wavelength differential absorption lidar method for CO2 measurement. Appl. Opt. 2017, 56, 8532–8540. [Google Scholar] [CrossRef] [PubMed]
  28. Ramanathan, A.K.; Mao, J.P.; Abshire, J.B.; Allan, G.R. Remote sensing measurements of the CO2 mixing ratio in the planetary boundary layer using cloud slicing with airborne lidar. Geophys. Res. Lett. 2015, 42, 2055–2062. [Google Scholar] [CrossRef]
  29. Tedeschi, L.O. Assessment of the adequacy of mathematical models. Agric. Syst. 2006, 89, 225–247. [Google Scholar] [CrossRef]
  30. Han, G.; Cui, X.; Liang, A.; Ma, X.; Zhang, T.; Gong, W. A CO2 profile retrieving method based on chebyshev fitting for ground-based dial. IEEE Trans. Geosci. Remote Sens. 2017, 55, 6099–6110. [Google Scholar] [CrossRef]
  31. Chan, K.L.; Ning, Z.; Westerdahl, D.; Wong, K.C.; Sun, Y.W.; Hartl, A.; Wenig, M.O. Dispersive infrared spectroscopy measurements of atmospheric CO2 using a fabry-perot interferometer sensor. Sci. Total Environ. 2014, 472, 27–35. [Google Scholar] [CrossRef] [PubMed]
  32. Heinz, D.C.; Chang, C.I. Fully constrained least squares linear spectral mixture analysis method for material quantification in hyperspectral imagery. IEEE Trans. Geosci. Remote Sens. 2001, 39, 529–545. [Google Scholar] [CrossRef] [Green Version]
  33. LAI, C.T.; Schauer, A.J.; Owensby, C.; Ham, J.M.; Helliker, B.; Tans, P.P.; Ehleringer, J.R. Regional CO2 fluxes inferred from mixing ratio measurements: Estimates from flask air samples in central kansas, USA. Tellus B 2006, 58, 523–536. [Google Scholar] [CrossRef]
  34. Gong, W.; Liang, A.; Han, G.; Ma, X.; Xiang, C. Sensitivity of on-line wavelength during retrieval of atmospheric CO2 vertical profile. Photonics Res. 2015, 3, 146–152. [Google Scholar] [CrossRef]
  35. Han, G.; Gong, W.; Lin, H.; Ma, X.; Xiang, Z. Study on influences of atmospheric factors on vertical profile retrieving from ground-based dial at 1.6 μm. IEEE Trans. Geosci. Remote Sens. 2015, 53, 3221–3234. [Google Scholar] [CrossRef]
  36. Stephens, B.B.; Gurney, K.R.; Tans, P.P.; Sweeney, C.; Peters, W.; Bruhwiler, L.; Ciais, P.; Ramonet, M.; Bousquet, P.; Nakazawa, T. Weak northern and strong tropical land carbon uptake from vertical profiles of atmospheric CO2. Science 2007, 316, 1732–1735. [Google Scholar] [CrossRef] [Green Version]
  37. Gatti, L.V.; Miller, J.B.; D’Amelio, M.T.S.; Martinewski, A.; Basso, L.S.; Gloor, M.E.; Wofsy, S.; Tans, P. Vertical profiles of CO2 above eastern amazonia suggest a net carbon flux to the atmosphere and balanced biosphere between 2000 and 2009. Tellus Ser. B-Chem. Phys. Meteorol. 2010, 62, 581–594. [Google Scholar] [CrossRef] [Green Version]
  38. Han, G.; Ma, X.; Liang, A.; Zhang, T.; Zhao, Y.; Zhang, M.; Gong, W. Performance evaluation for China’s planned CO2-ipda. Remote Sens. 2017, 9, 768. [Google Scholar] [CrossRef] [Green Version]
  39. Zhu, Y.; Yang, J.; Chen, X.; Zhu, X.; Zhang, J.; Li, S.; Sun, Y.; Hou, X.; Bi, D.; Bu, L.; et al. Airborne validation experiment of 1.57-μm double-pulse ipda lidar for atmospheric carbon dioxide measurement. Remote Sens. 2020, 12, 1999. [Google Scholar] [CrossRef]
  40. Gong, W.; Han, G.; Ma, X.; Lin, H. Multi-points scanning method for wavelength locking in CO2 differential absorption lidar. Opt. Commun. 2013, 305, 180–184. [Google Scholar] [CrossRef]
  41. Gordon, I.E.; Rothman, L.S.; Hill, C.; Kochanov, R.V.; Tan, Y.; Bernath, P.F.; Birk, M.; Boudon, V.; Campargue, A.; Chance, K.V. The hitran2016 molecular spectroscopic database. J. Quant. Spectrosc. Radiat. Transf. 2017, 130, 4–50. [Google Scholar] [CrossRef]
  42. Ingmann, P.; Bensi, P.; Durand, Y. A-Scope-Advanced Space Carbon and Climate Observation of Planet Erath; Report for Assessment; 2008; pp. SP-1311, 1313. [Google Scholar]
  43. Wexler, A. Vapor pressure formulation for water in range 0 to 100 °C. A revision. J. Res. Natl. Bur. Stand. Sect. A Phys. Chem. 1976, 80A, 775–785. [Google Scholar] [CrossRef] [PubMed]
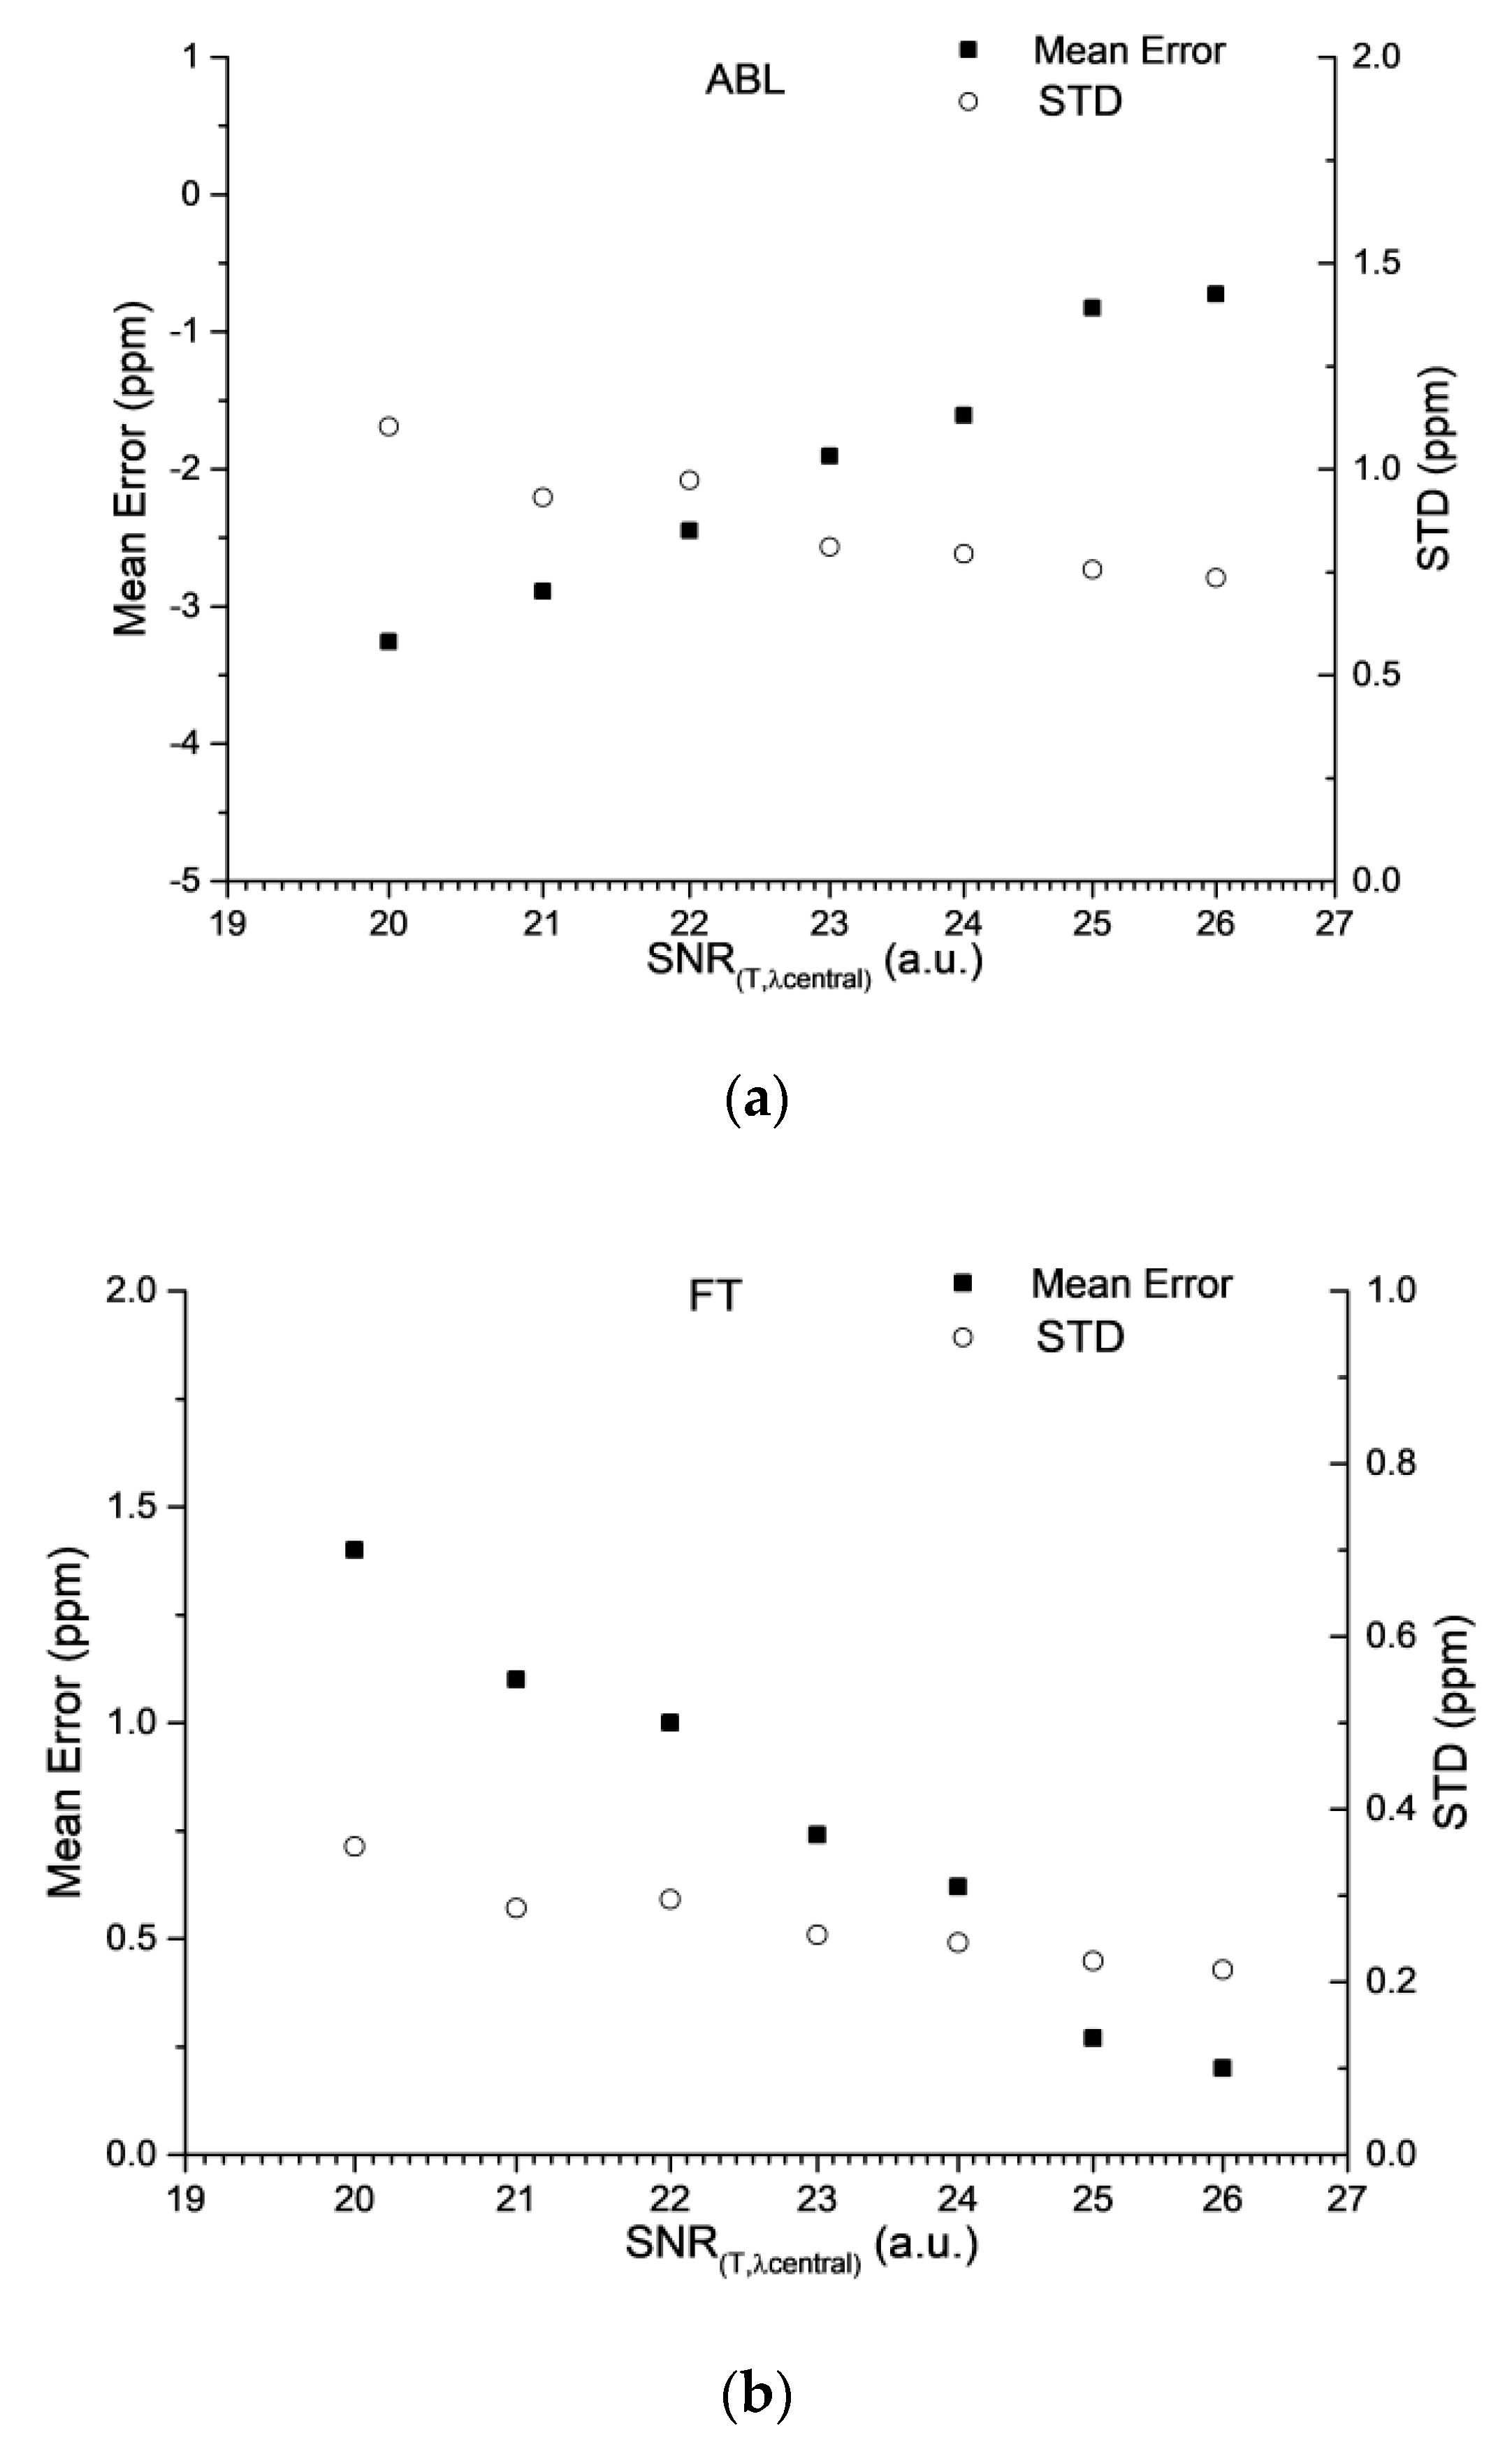
Figure 1. SNR(T,λcentral) (with a log scale) with mean error and STD in three layers; the square represents the mean error, and the hollow circle represents STD for (a) ABL, (b) FT, and (c) STA. The mean error herein is defined as the average of random errors of 10,000 simulations. STD is the standard deviation of the calculated results.
Remotesensing 12 02395 g001aRemotesensing 12 02395 g001b
Figure 2. Distribution of 21 on-line wavelengths across R16 line in the 3001200001 CO2 band.
Remotesensing 12 02395 g002
Figure 3. Effect of the number of wavelengths on mean error (ME) and STD in ABL, FL, and STA. In Figure 3ac, red circles and squares represent the ME and STD obtained using the symmetric sampling mode. Black circles and squares represent the ME and STD obtained using the unilateral sampling mode.
Remotesensing 12 02395 g003aRemotesensing 12 02395 g003b
Figure 4. The retrievals of sliced xCO2 with settings of the potential areas of carbon source (red), carbon sink (green), and neutral (blue) characteristics, corresponding to ABL, FT, and STA layers, respectively.
Remotesensing 12 02395 g004
Figure 5. The retrievals of XCO2 gradient with settings of the potential areas of carbon source (red), carbon sink (green), and neutral characteristics (blue) corresponding to the carbon gradient between ABL and FT and the carbon gradient between FT and STA.
Remotesensing 12 02395 g005
Figure 6. Cross-section of water vapor and carbon dioxide. Three isotopologues of water mark the right vertical axis in a logarithmic scale. Only 12C16O2 is shown in this figure and marks the left vertical axis in a linear scale.
Remotesensing 12 02395 g006
Figure 7. Absorption optical depths of water vapor and carbon dioxide. In both subfigures, the absorption optical depth (AOD) of CO2 marks the right vertical axis while the AOD of water vapor marks the left axis. Concentration of CO2 and water vapor are set as 400 ppm and 15 g/kg, respectively. Figure 7 (b) is the enlargement of Figure 7 (a) at the R16 line.
Remotesensing 12 02395 g007
Table 1. Settings of xCO2 in different layers.
AbbreviationRange (km)xCO2 (ppm)
ABL0–1.5410
FT1.5–12402
STA>12395
Table 2. Different settings of wavelength numbers.
ModeSymmetricUnilateral
range(nm)1572.305–1572.3651572.305–1572.335
number3222148171285
step(pm)2351023510
Table 3. Performance evaluation of different number of sliced atmospheric layers.
Number of LayersRange (km)Pseudo-Truth of xCO2 (ppm)Mean Error (ppm)STD (ppm)
20–1.5410−0.460.37
>1.54000.110.15
30–1.5410−0.960.81
1.5-124020.330.32
12395−0.180.30
40–1.5410−1.771.02
1.5–7.54031.200.43
7.5–12399−1.700.81
>123950.200.52
Table 4. The effect of ABLH on the performance of the proposed method.
Mean Error (ppm)STD (ppm)
ABLH (km)ABLFTSTAABLFTSTA
2.0−0.840.31−0.200.580.240.21
1.5−0.980.27−0.150.740.240.24
1.0−1.760.29−0.200.910.180.23
Table 5. Assumed CO2 profiles of the carbon source, carbon sink, and neutral region.
LayersxCO2 (ppm)
Potential SourcePotential SinkPotential Neutral
ABL410390402
FT402402402
STA395395395
Table 6. The influence of water vapor on the dry-air mixing ratio of CO2.
LayersAccuracy of Water Vapor
0%+1%−1%+5%−5%
ABL (xCO2)409.02409.03409.00409.07408.96
FT (xCO2)402.27402.27402.27402.28402.26
STA (xCO2)394.85394.85394.85394.85394.85