Article

Contrasting Effects of Temperature and Precipitation on Vegetation Greenness along Elevation Gradients of the Tibetan Plateau

1
Key Laboratory of Digital Earth Science, Aerospace Information Research Institute, Chinese Academy of Sciences, Beijing 100094, China
2
University of Chinese Academy of Sciences, Beijing 100049, China
3
State Key Laboratory of Earth Surface Processes and Resource Ecology, Faculty of Geographical Science, Beijing Normal University, 100875 Beijing, China
4
Institute of Atmospheric Physics, Chinese Academy of Science, Beijing 100029, China
5
Meteorological and Marine Brigade, Beijing 100081, China
6
Department of Earth System Science, Tsinghua University, Beijing 100084, China
7
Beijing Research Center for Information Technology in Agriculture, Beijing 100097, China
8
State Key Laboratory of Remote Sensing Science, Jointly Sponsored by Beijing Normal University and Institute of Remote Sensing and Digital Earth of Chinese Academy of Sciences, Beijing100875, China
9
Beijing Engineering Research Center for Global Land Remote Sensing Products, Institute of Remote Sensing Science and Engineering, Faculty of Geographical Science, Beijing Normal University, Beijing 100875, China
*
Author to whom correspondence should be addressed.
Remote Sens. 2020, 12(17), 2751; https://doi.org/10.3390/rs12172751
Submission received: 6 July 2020 / Revised: 12 August 2020 / Accepted: 22 August 2020 / Published: 25 August 2020
(This article belongs to the Special Issue Remote Sensing of Greening-Browning Trends in Tree-Grass Ecosystems)

Abstract

:
The Tibetan Plateau (TP) is one of the most sensitive regions to global climate warming, not only at the inter-annual time scale but also at the altitudinal scale. We aim to investigate the contrasting effects of temperature and precipitation on vegetation greenness at different altitudes across the TP. In this study, interannual and elevational characteristics of the Normalized Difference Vegetation Index (NDVI), temperature, and precipitation were examined during the growing season from 1982 to 2015. We compared the elevational movement rates of the isolines of NDVI, temperature, and precipitation, and the sensitivities of elevational NDVI changes to temperature and precipitation. The results show that from 1982 to 2015, the elevational variation rate of isolines for NDVI mismatched with that for temperature and precipitation. The elevational movements of NDVI isolines were mostly controlled by precipitation at elevations below 2400 m and by the temperature at elevations above 2400 m. Precipitation appears to plays a role similar to temperature, and even a more effective role than the temperature at low elevations, in controlling elevational vegetation greenness changes at both spatial and interannual scales in the TP. This study highlights the regulation of temperature and precipitation on vegetation ecosystems along elevation gradients over the whole TP under global warming conditions.

1. Introduction

The Tibetan Plateau (TP) is known as the ‘roof of the world’ and ‘the Earth’s third pole’. It has an area of about 2.5 × 10⁶ km2, over half of which lies above 4000 m [1,2]. The TP is covered by a variety of vegetation up to a height of about 6000 m and can be divided into several vegetation ecosystems [3,4]. Numerous evidence indicate that the TP has been experiencing continuous climate warming during the past few decades, particularly since the 1980s [5,6,7]. Compared to the Northern Hemisphere, such warming started earlier [8,9] and is taking place faster than the global mean warming rate [10]. Warming-induced snowmelt causes the snowline to rise, and this process creates continuous positive feedback by stimulating the surface to receive more solar radiation [11,12,13]. The TP is characterized by arid and semi-arid climate [14,15]. Annual precipitation ranges from tens to hundreds of millimeters, with an overall increasing trend during the period 1979–2013 despite a distinct spatial variability [16,17]. Summer monsoons, westerlies, and local hydrological recycling are the water sources regulating moisture on the TP [10,18]. There is strong evidence that clear interactions exist between terrestrial ecosystems and climate variables [19,20,21], and vegetation greenness on the TP is highly sensitive to climate change [16,22]. Hydrothermal conditions play an essential role in the vegetation growth cycle [22,23]. Temperature is considered one of the most important factors that limit vegetation growth on the TP [24,25]. Previous studies indicated that a continuous increase in temperature leads to vegetation greenness amplitude changes on the TP [20,26,27], and also impacts the leaf-unfolding date [28,29]. For example, the nighttime temperature may play a key role in advancing greenup [30]. Higher air temperature could also indirectly result in vegetation growth reduction by increasing land surface evaporation and thus limiting water availability [31,32]. The role of temperature, however, may be overestimated according to recent research on ecosystem optimal air temperature, which suggested that colder regions have a lower optimal temperature [33]. Precipitation also affects spring phenology, and preseason precipitation can lead to earlier SOS (starting date of vegetation growing season) and reduce SOS sensitivity to preseason rainfall [34,35]. The vegetation of drier areas was found to be more dependent on precipitation [36,37]. Normalized Difference Vegetation Index (NDVI) dynamics influenced by precipitation on the northeastern and southwestern TP was also investigated by recent studies [23]. Fu et al. [38] found that the heat requirements of vegetation vary with precipitation availability, indicating the indirect effects of precipitation on vegetation growth. A comprehensive analysis was also conducted by Li et al. to quantify the contribution of temperature, precipitation, and solar radiation on vegetation growth [39]. Warming and wetting facilitate vegetation variation along elevation gradients in the alpine region [24,40]. Some studies have also described the effects of warmer temperature on biodiversity and ecological structure in alpine regions [41,42,43]. For example, elevation and slope influenced the distribution of vegetation cover while such an effect could be attributed to the variation of temperature and water availability [44,45]. Studies based on field and remote sensing also suggested the upward movement of species [46,47]. Pepin et al. has illustrated elevation-dependent warming in alpine areas [48].
Previous studies either did not take the synchronicity between the vegetation greenness variation and climate change into account or only analyzed the elevation-dependent relationship between temperature and greenness over 3000 m above sea level, thus excluded the role of precipitation and areas below 3000 m [24]. In addition, previous studies in other areas have found nonlinear and spatially heterogeneous interactions between temperature and greenness, implying that there could be a non-negligible effect of precipitation on greenness [35,49,50,51,52]. Therefore, it is necessary to find out how vegetation greenness responds to temperature and precipitation at different elevations over the whole TP under global warming conditions.
Because of the profound consequences for the terrestrial ecosystem [53], it is important to study the vegetation response to climate change over a long time scale [29,37,54]. In this study, Global Inventory Modeling and Mapping Studies (GIMMS) Normalized Difference Vegetation Index (NDVI) 3g data, which is the existing NDVI product with the longest time series and the finest spatial resolution, were used in combination with temperature and precipitation data from 1982 to 2015. We first explored the synchronicity of the elevational variation in vegetation greenness and climate variables (i.e., temperature and precipitation). Then we investigated how vegetation greenness variation responds to climate change along elevation. There is no previous study on this subject that covered the entire TP over the period from 1982 to 2015. Our findings will provide insights for further understanding of the spatial changes of vegetation greenness along with altitude on the TP or other alpine regions affected by climate over the years.

2. Materials and Methods

2.1. Datasets

GIMMS NDVI3g (8 km) from 1982 to 2015 was downloaded from https://ecocast.arc.nasa.gov/data/pub/gimms/3g.v1/. The dataset was produced using 15-day maximum value composites with a spatial resolution of 8 km [55]. Moderate Resolution Imaging Spectroradiometer (MODIS) NDVI (250 m) from 2000 to 2015 extracted from the MOD13Q1 Version 6 product with a spatial resolution of 250m (https://reverb.echo.nasa.gov) was also obtained. MODIS NDVI data were produced by the constrained view angle-maximum value composite for each 16-day period. NDVI from GIMMS and MODIS were used to describe vegetation greenness. Precipitation and temperature from 1982 to 2015 were obtained from the China Meteorological Forcing Data (CMFD) of the National Tibetan Plateau Data Center (https://data.tpdc.ac.cn/en/data/). The precipitation and temperature data were produced by the fusion of remote sensing products, reanalysis datasets, and in situ observation data from weather stations. The temporal resolution of the CMFD is 3 h, and the horizontal spatial resolution is 0.1 degrees [56,57]. We also downloaded the WorldClim dataset (http://worldclim.org/version2), which includes monthly average temperature and precipitation data. Monthly average temperature (or precipitation) data has 12 bands (from January to December), each of which results from the average value of the corresponding month from 1970 to 2000. The WordClim dataset was generated with data collected from between 9000 and 60,000 weather stations using the thin-plate splines method [58]. The ASTER (Advanced Spaceborne Thermal Emission and Reflected Radiometer) GDEM (Global Digital Elevation Model) V2 (30 m) was jointly released by NASA and the Ministry of Economy, Trade, and Industry of Japan (METI) can be downloaded from http://earthexplorer.usgs.gov/. Before the analysis, temperature and precipitation of CMFD were resampled by bilinear interpolation to match the spatial resolution of GIMMS NDVI3g [24]. The bilinear interpolation method averages the sum of the values of the four pixels (top, bottom, left, and right) adjacent to the target pixel as the output value of target pixel [59], which can provide satisfactory results for resampling of images with smooth texture while ensuring image quality [60]. Since we intended to reflect the integrated altitude in a GIMMS NDVI3g pixel, the pixel aggregate method was applied to resample the DEM data to the resolution of GIMMS NDVI3g by the pixel aggregate method [61]. The pixel aggregate method averages all of the pixel values that contribute to the output pixel.

2.2. Method

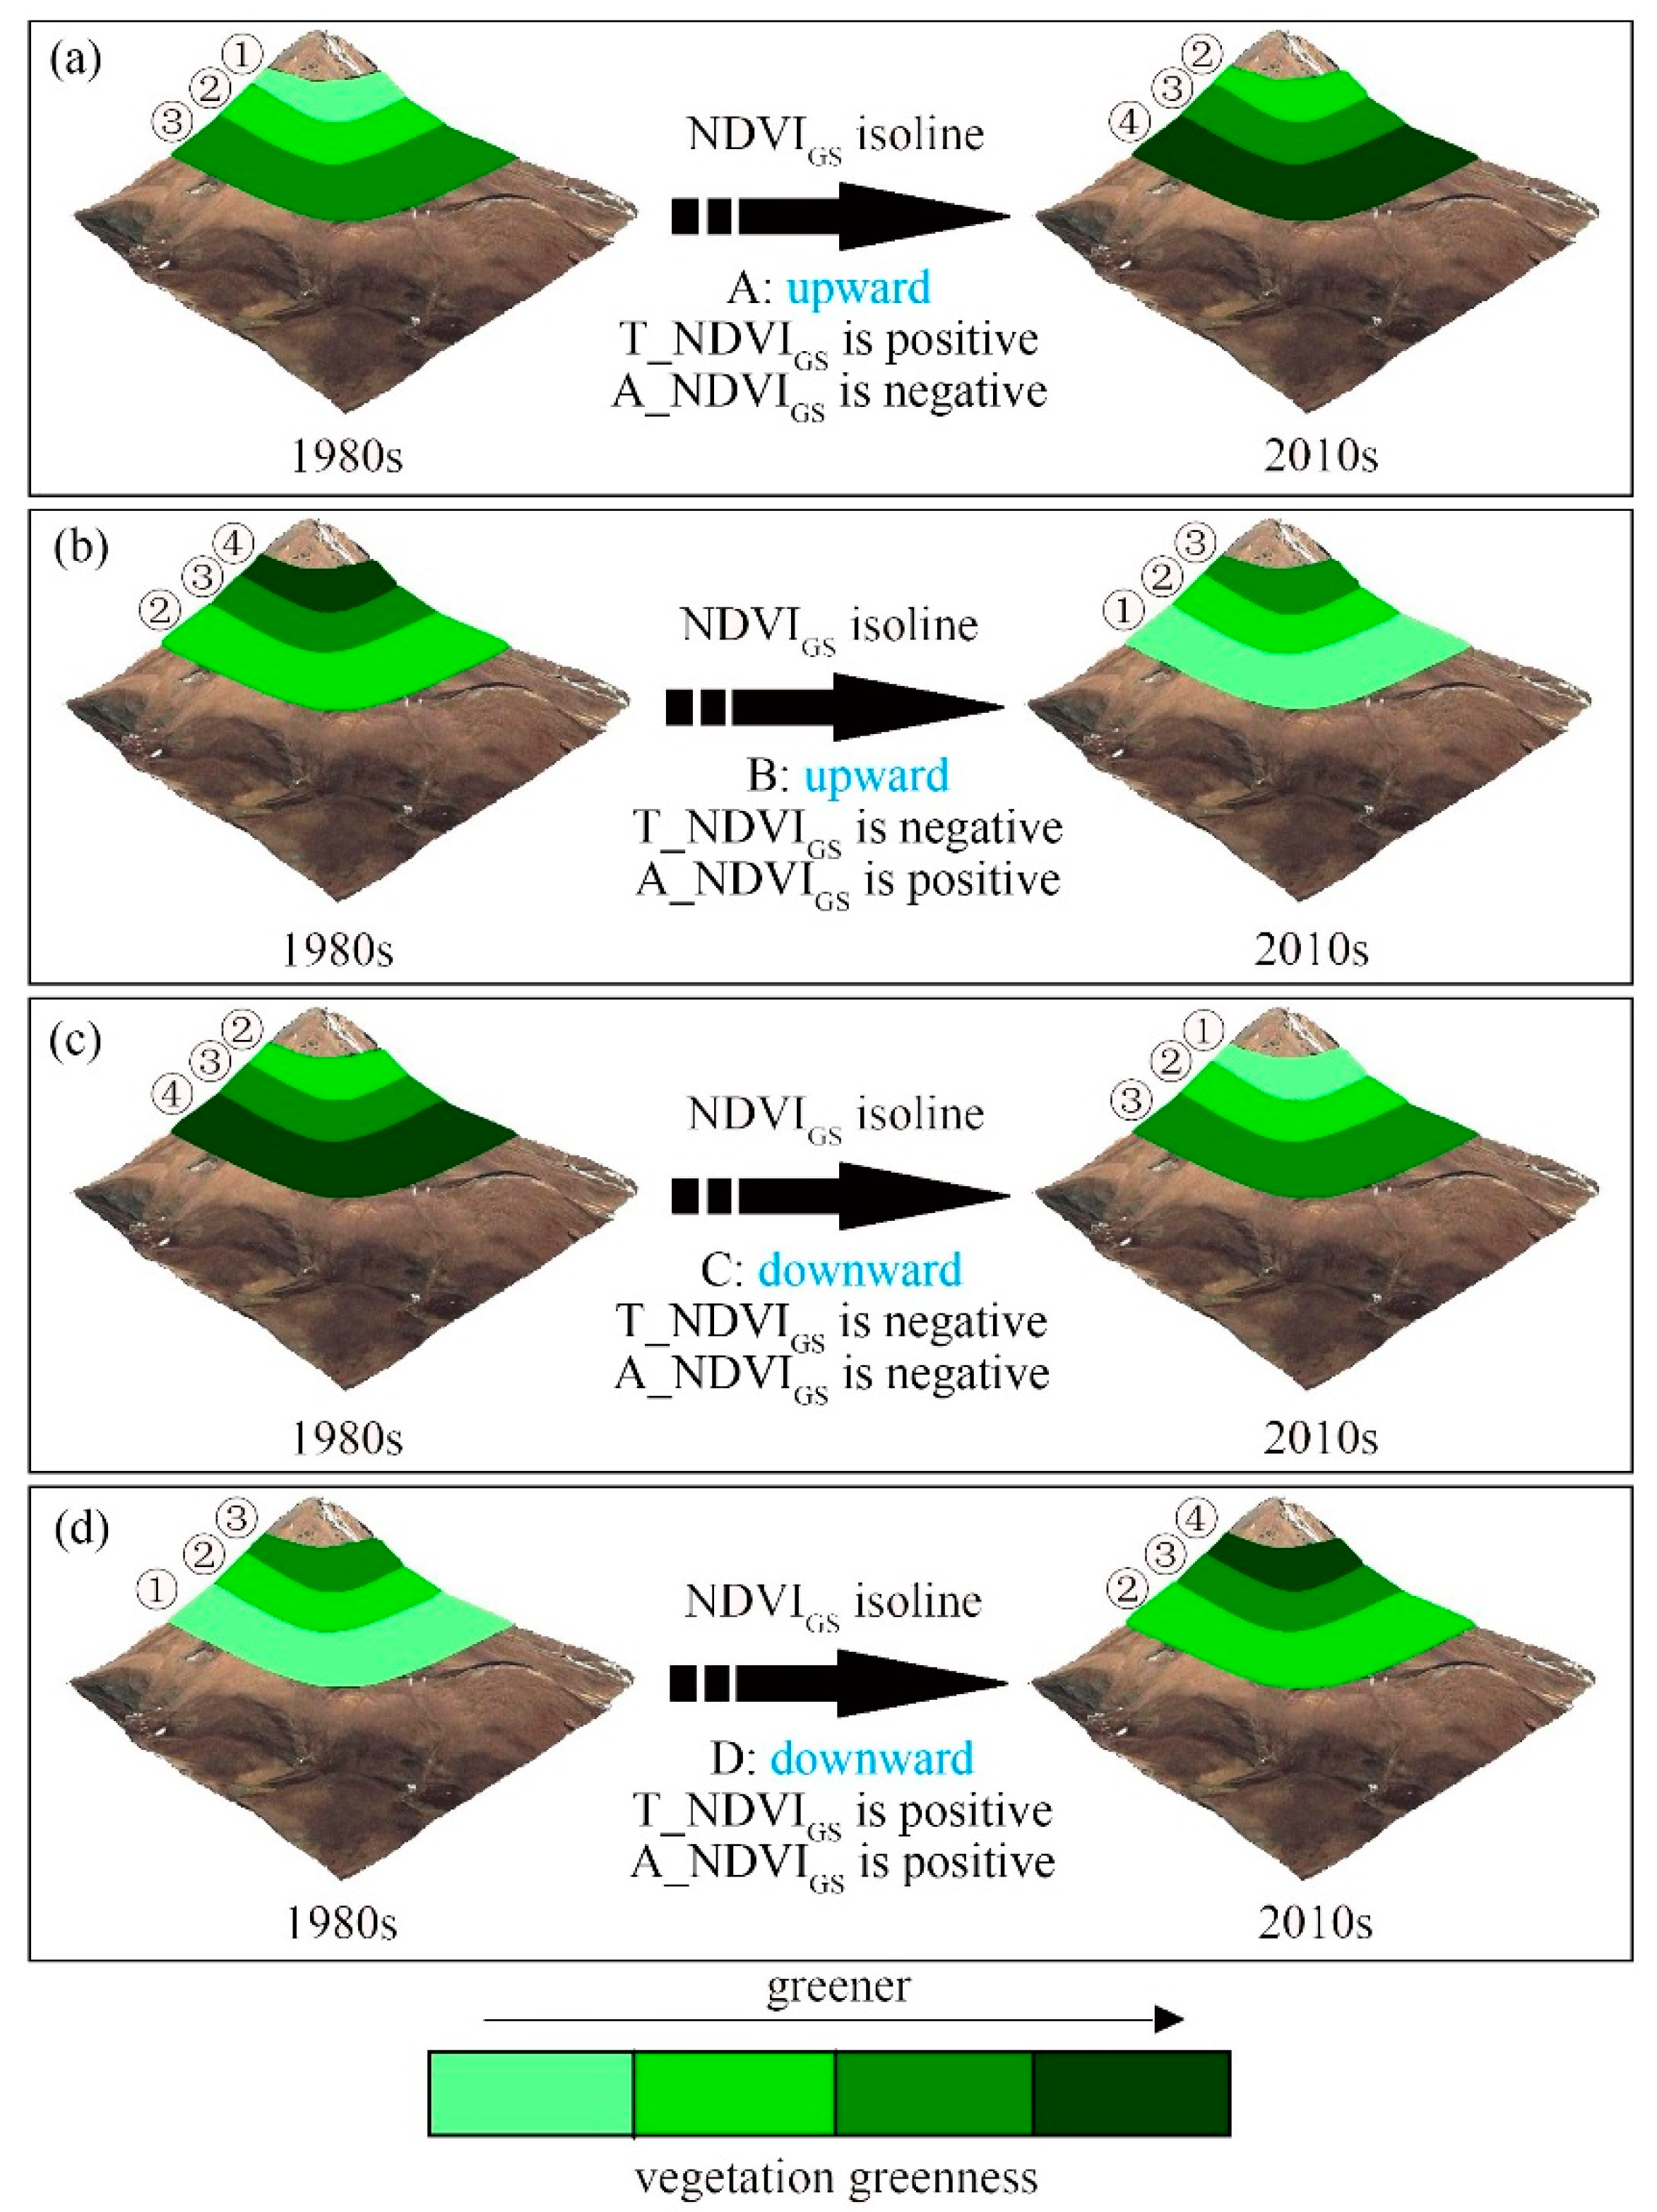
2.2.1. Elevation Dependence of the Rates of NDVIGS, TGS and PGS Isoline

We calculated the annual mean NDVI over the TP. We excluded the pixels with a minimum annual mean NDVI value of less than 0.1, which were considered to be unvegetated (barren rock, sand, or snow) [62]. We then identified the pixels that had a 34-year mean NDVI value greater than 0.4 as the regions with medium or dense evergreen vegetation cover. These regions were included as part of the vegetation areas [24]. The following two criteria were then used to extract pixels corresponding to deciduous vegetation from the remaining pixels: (1) the peak value of seasonal NDVI occurred between June and August; and (2) the peak value of seasonal NDVI was at least 1.2 times the mean NDVI from January to March [24].
The vegetation growing season for the TP was considered to extend from May to September [24]. We calculated the mean NDVI (NDVIGS), mean temperature (TGS, unit: °C), and accumulated precipitation (PGS, unit: mm) for the growing season. In addition, we calculated the temporal trends of NDVIGS (T_NDVIGS, unit: 1/year), TGS (T_TGS, unit: °C/year), and PGS (T_PGS, mm/year) for the period 1982–2015 for each pixel.
At the regional level, the TP was divided into 51 elevation intervals of 100 m in the range from 600 m to 5600 m. The altitude “h” defines an elevation interval from (h − 50) m to (h + 50) m. The first five and last two elevation sections were excluded because of very few valid NDVI pixels. The altitudinal gradient of NDVIGS (A_NDVIGS, unit: 1/m), TGS (A_TGS, unit: °C/m), and PGS (A_PGS) were then calculated for each elevation section. A_NDVIGS was defined as:
A _ NDVI GS ( h ) = NDVI GS ( h 100 : h ) NDVI GS ( h : h + 100 ) E ( h 100 : h ) E ( h : h + 100 )
Where NDVIGS represents the mean value of the NDVI during the growing season for the elevation section h (unit: meters), E represents the elevation (unit: meters), and E(h − 100: h) represents the mean elevation of all valid pixels in the elevation sections from h-100 to h. E(h: h + 100), NDVIGS(h − 100: h), and NDVIGS(h: h + 100) are similarly defined.
The elevation variation rates of the NDVIGS (or PGS, TGS) isolines were defined as the annual change in the growing season NDVI (or PGS, TGS) within the given altitude section h. The elevation variation rate of the NDVIGS (or TGS, PGS) isolines, i.e., V_NDVIGS (or V_TGS, V_PGS) (unit: m/year), was calculated by dividing T_NDVIGS (or T_TGS, T_PGS) by A_NDVIGS (or A_TGS, A_PGS). Therefore, the direction of the elevational movement of the NDVIGS isoline was jointly determined by T_NDVIGS(h) and A_NDVIGS(h).

2.2.2. Elevation Dependence of the Sensitivity of the NDVIGS Isoline Movement to Temperature and Precipitation

The sensitivity of the elevational motion of the NDVIGS isolines to temperature (S_NDVIGS_T, unit: m/°C) and precipitation (S_NDVIGS_P) were calculated for each elevation section:
S _ NDVI GS _ T ( h ) = L _ NDVI GS _ T ( h ) A _ NDVI GS ( h )
S _ NDVI GS _ P ( h ) = L _ NDVI GS _ P ( h ) A _ NDVI GS ( h )
where L_NDVIGS_T(h) (unit: 1/°C) (or L_NDVIGS_P(h), unit: 1/mm) is defined as the coefficient of TGS(h) (or PGS(h)) and obtained from a linear regression of NDVIGS(h) with TGS(h) and PGS(h). The direction of the sensitivity is determined by the coefficient of TGS (or PGS) in the regression equation and by A_NDVIGS(h).
The elevational movement of the NDVIGS, TGS, and PGS isolines can be either upward or downward, with the direction being determined by the altitudinal gradient and temporal trend of the variables. Specifically, taking NDVIGS as an example, the upward movements of the NDVIGS isolines include: A mode (Figure 1a), i.e., a positive temporal trend (greenness increases with time) with a negative altitudinal gradient (greenness decreases with increasing altitude); and B mode (Figure 1b), i.e., a negative temporal trend (greenness decreases with time) with a positive altitudinal gradient (greenness increases with altitude). The downward movements of the NDVIGS isolines include: C mode, i.e., a negative temporal trend with a negative altitudinal gradient (Figure 1c); and D mode, i.e., a positive temporal trend with a positive altitudinal gradient (Figure 1d). This method can be used to determine if the direction of the sensitivity of the NDVIGS isolines to temperature and precipitation is upward or downward.
At the pixel level, we used a 3 × 3 moving window to find the altitudinal gradient of the central pixels. Specifically, a 3 × 3-pixels region can be divided into four directions through the central pixel ‒ horizontal, vertical, and two oblique directions. The direction was retained if the elevation increased or decreased monotonically from one side to another in this direction. We then selected the direction with the largest elevation difference from the remaining directions as the final direction and calculated the altitudinal gradient of the central pixel using the altitude value of the three pixels lying in this final selected direction. Then, the elevational variation rate of the NDVIGS, TGS, and PGS isolines was calculated for the central pixel as well as the sensitivity of the isoline elevational movement to temperature and precipitation.
Finally, the altitudinal gradient and elevational movement of the isolines for temperature and precipitation derived from the CMFD and the WorldClim dataset were calculated. We also compared the sensitivities of the elevational movement of the NDVIGS isolines to temperature and precipitation using both 250-m MODIS NDVI and 8-km GIMMS NDVI3g to examine the responses of vegetation greenness to climate changes using imagery with two different spatial resolutions.

3. Results

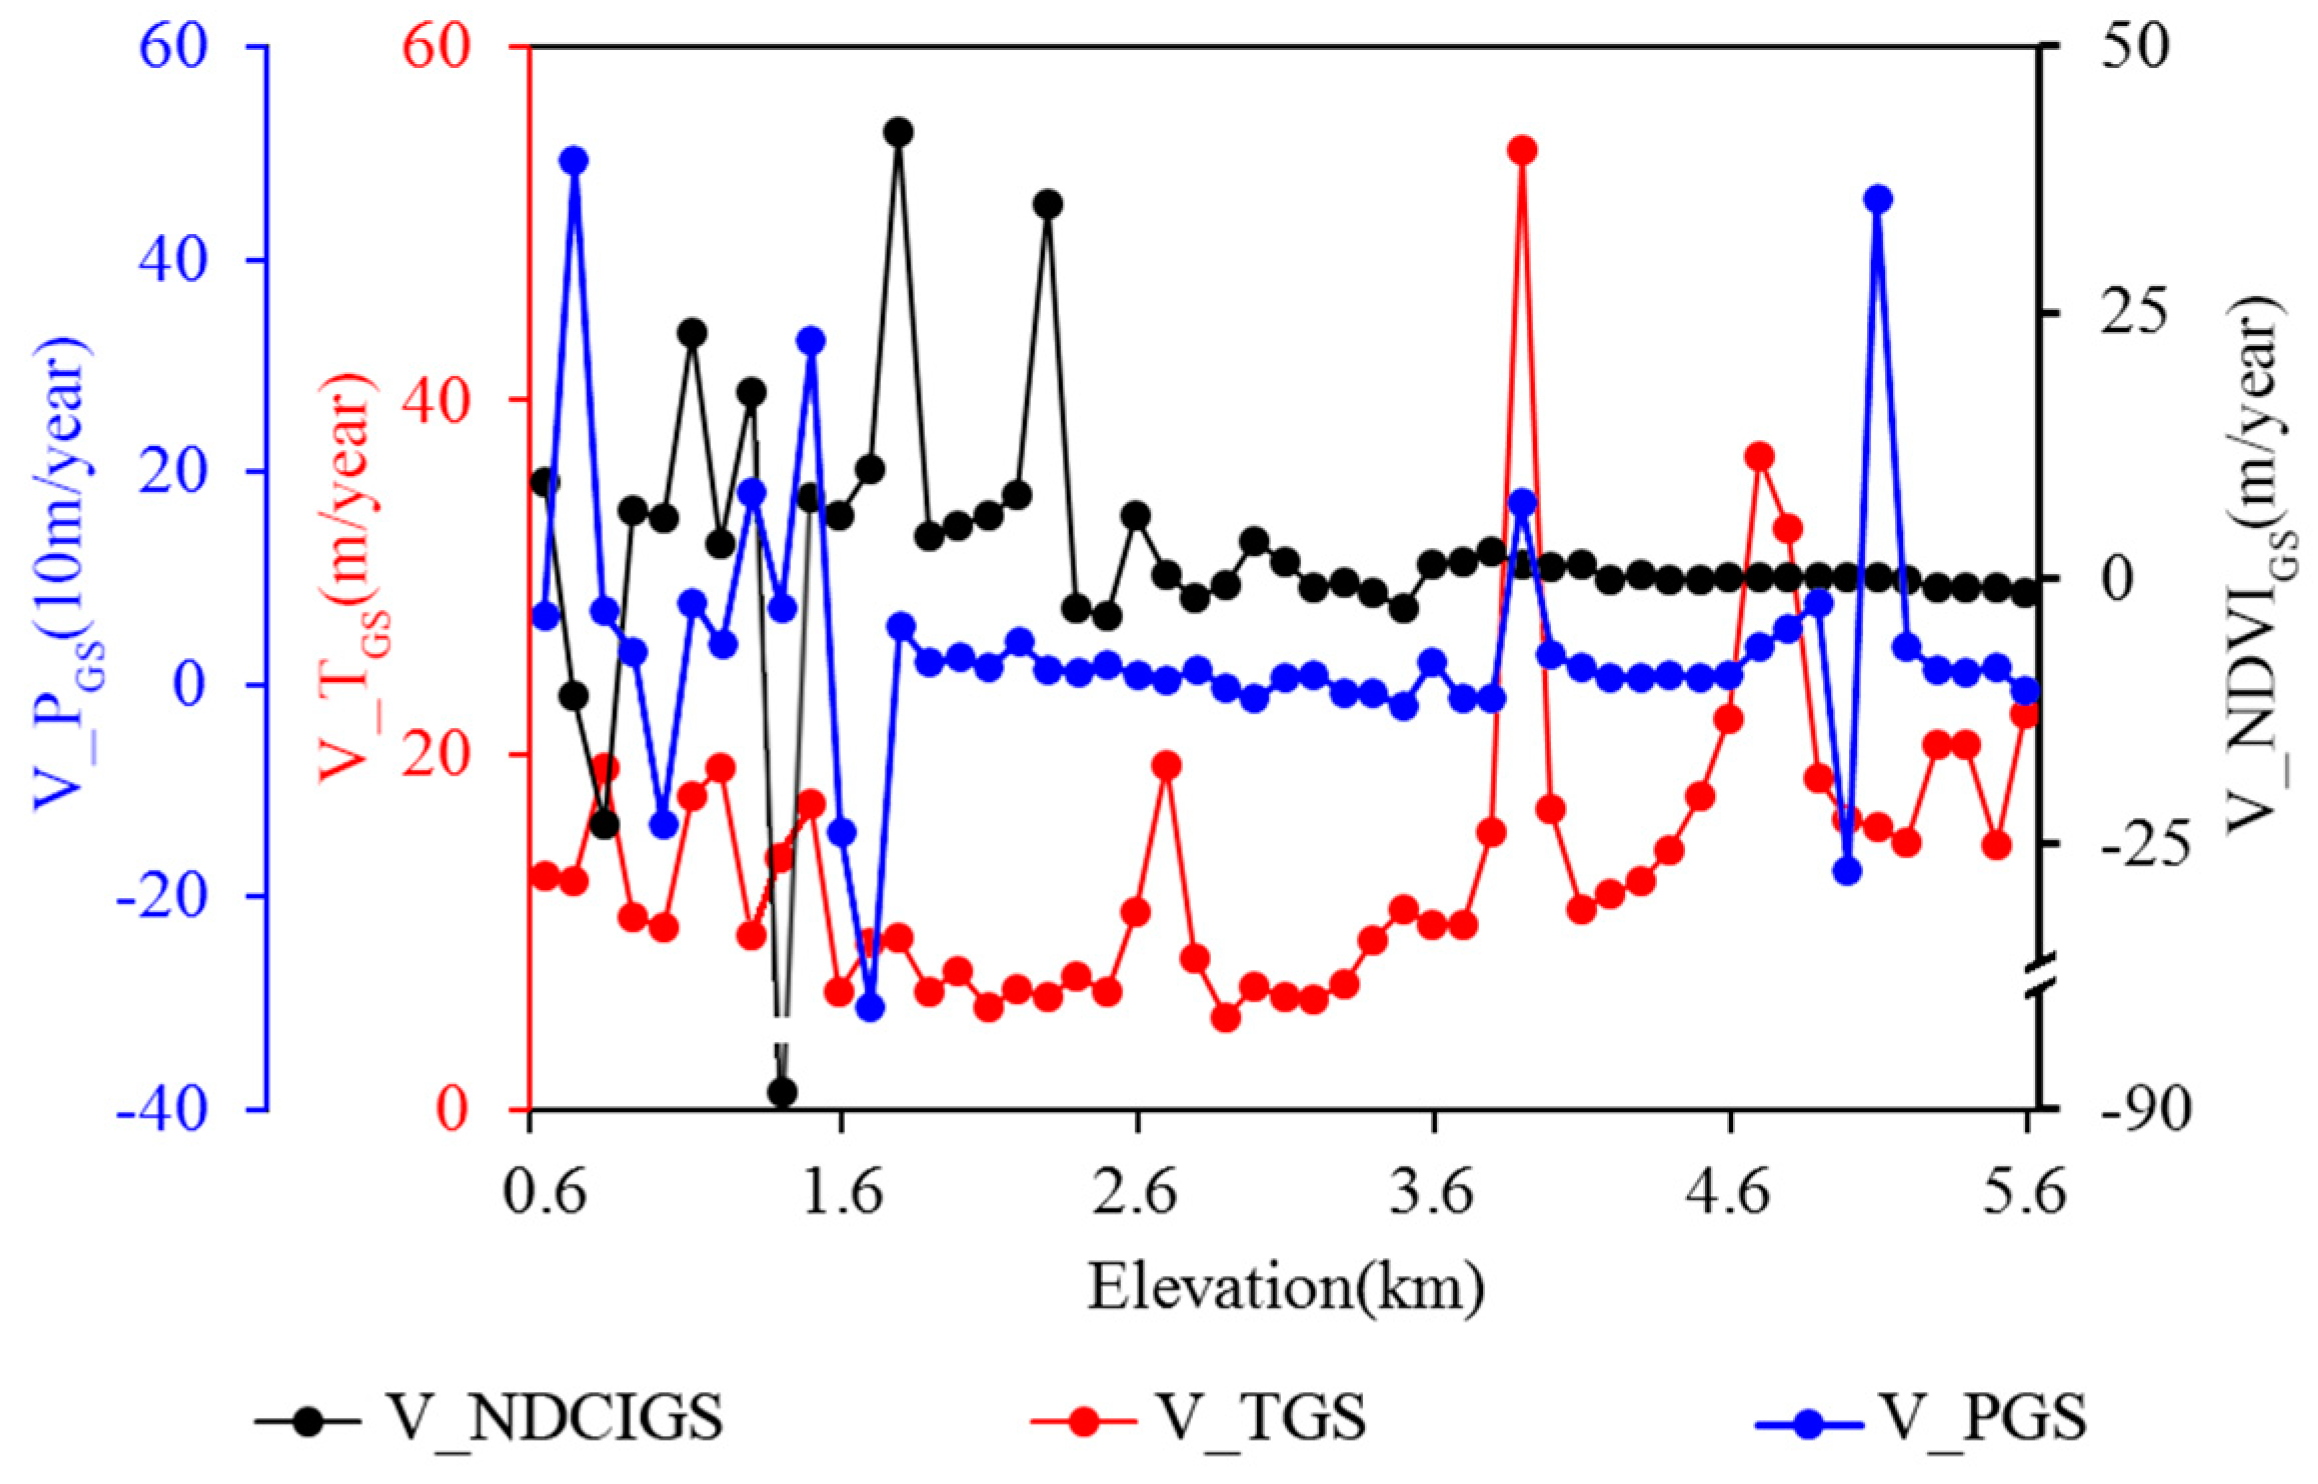
3.1. Dependence of the Rate of NDVIGS, TGS, and PGS Isolines on Elevation

The elevational movement of the vegetation greenness isolines mismatched with that of the temperature and precipitation isolines (Figure 2). The elevational variation rate of the TGS isoline was positive for almost the whole TP whereas the rate of NDVIGS and PGS isoline were both positive and negative (Figure 2). In addition, the value of the NDVIGS isoline variation rate along the elevation was much smaller than that of TGS isoline and PGS isoline. For most areas, the elevational variation rate of the NDVIGS isoline was concentrated in the intervals of 0‒10 m/year and −10‒0 m/year, accounting for 37% and 33% of the TP, respectively (Figure 2a). Pixels with the NDVIGS isoline motion rate of >20 m/year or <−20 m/year accounted for only 9% and 8% of the TP, respectively. The elevational variation rate of the NDVIGS isoline was higher at lower altitudes than that at higher altitudes. There were upward and downward movements of the NDVIGS isolines across the TP (Figure 2b), with the movement being upward for 53% of the TP. The temporal trend of NDVIGS and the gradient of NDVIGS with altitude caused either upward or downward motion of the NDVIGS isolines. Our results show that 67% of all NDVI pixels decreased with altitude, and 37% of these NDVIGS isolines moved upward (A in Figure 2b) while 30% moved downward (C in Figure 2b). The remaining 33% of the area of the TP had positive gradients of NDVIGS with altitude, 16% of which were upward because NDVIGS decreased. V_TGS on the TP was mainly in the range of 0‒20 m/year (Figure 2c). Overall, The TGS isolines mainly moved upward, accounting for about 90% of all pixels (A in Figure 2d). The upward movement of the TGS isolines was due to the negative gradient of TGS with altitude and the positive temporal trend of TGS. The elevational variation rate of the PGS isoline was within the ranges of −50–0 (21%) and 0 50 m/year (26%) (Figure 2e). The PGS isolines in 47% of all the pixels moved upward due to the negative altitudinal gradient of PGS, and PGS isolines moved downwards along with the positive altitudinal gradient in about 40% pixels (Figure 2f).
At the regional level, a mismatch was also found between the elevational movement of the vegetation greenness isolines and those of the temperature and precipitation isolines. The elevational variation rate of the NDVIGS isolines was smaller than the rate of TGS and PGS isolines (Figure 3). The elevational variation rate of the NDVIGS isolines was greater at low altitudes (below 2400 m) than that at high altitudes with strong fluctuations (Figure 3). The elevational variation rate of the NDVIGS isoline varied gently from 2500 m to 5600 m. Compared with the variation at low altitudes, the value of the elevational variation rate (between 1 m/year and 10 m/year) from 2500 m to 4100 m was an order of magnitude lower than that below 2400 m. Above 4100 m, the value was an order of magnitude lower than in the 2500–4100 m interval and remained between −1 m/year and 1 m/year. The movement of the TGS isolines was uniformly upward, with the minimum variation rate of the TGS isoline at 3100 m (3.85 m/year). Above that, the elevational variation rate of TGS increased with two peaks of 54 m/year at 3900 m and 37 m/year at 4700 m and decreased to 22 m/year at 5600 m. The elevational variation rate of the PGS isolines fluctuated greatly between 600 m and 1700 m. The maximum negative rate was about −300 m/year at 1700 m and the maximum positive rate was about 300 m/year at 1500 m. Above 1700 m, except for the 3900 m, 5000 m, and 5100 m sections, the rate was about 10 m/year.

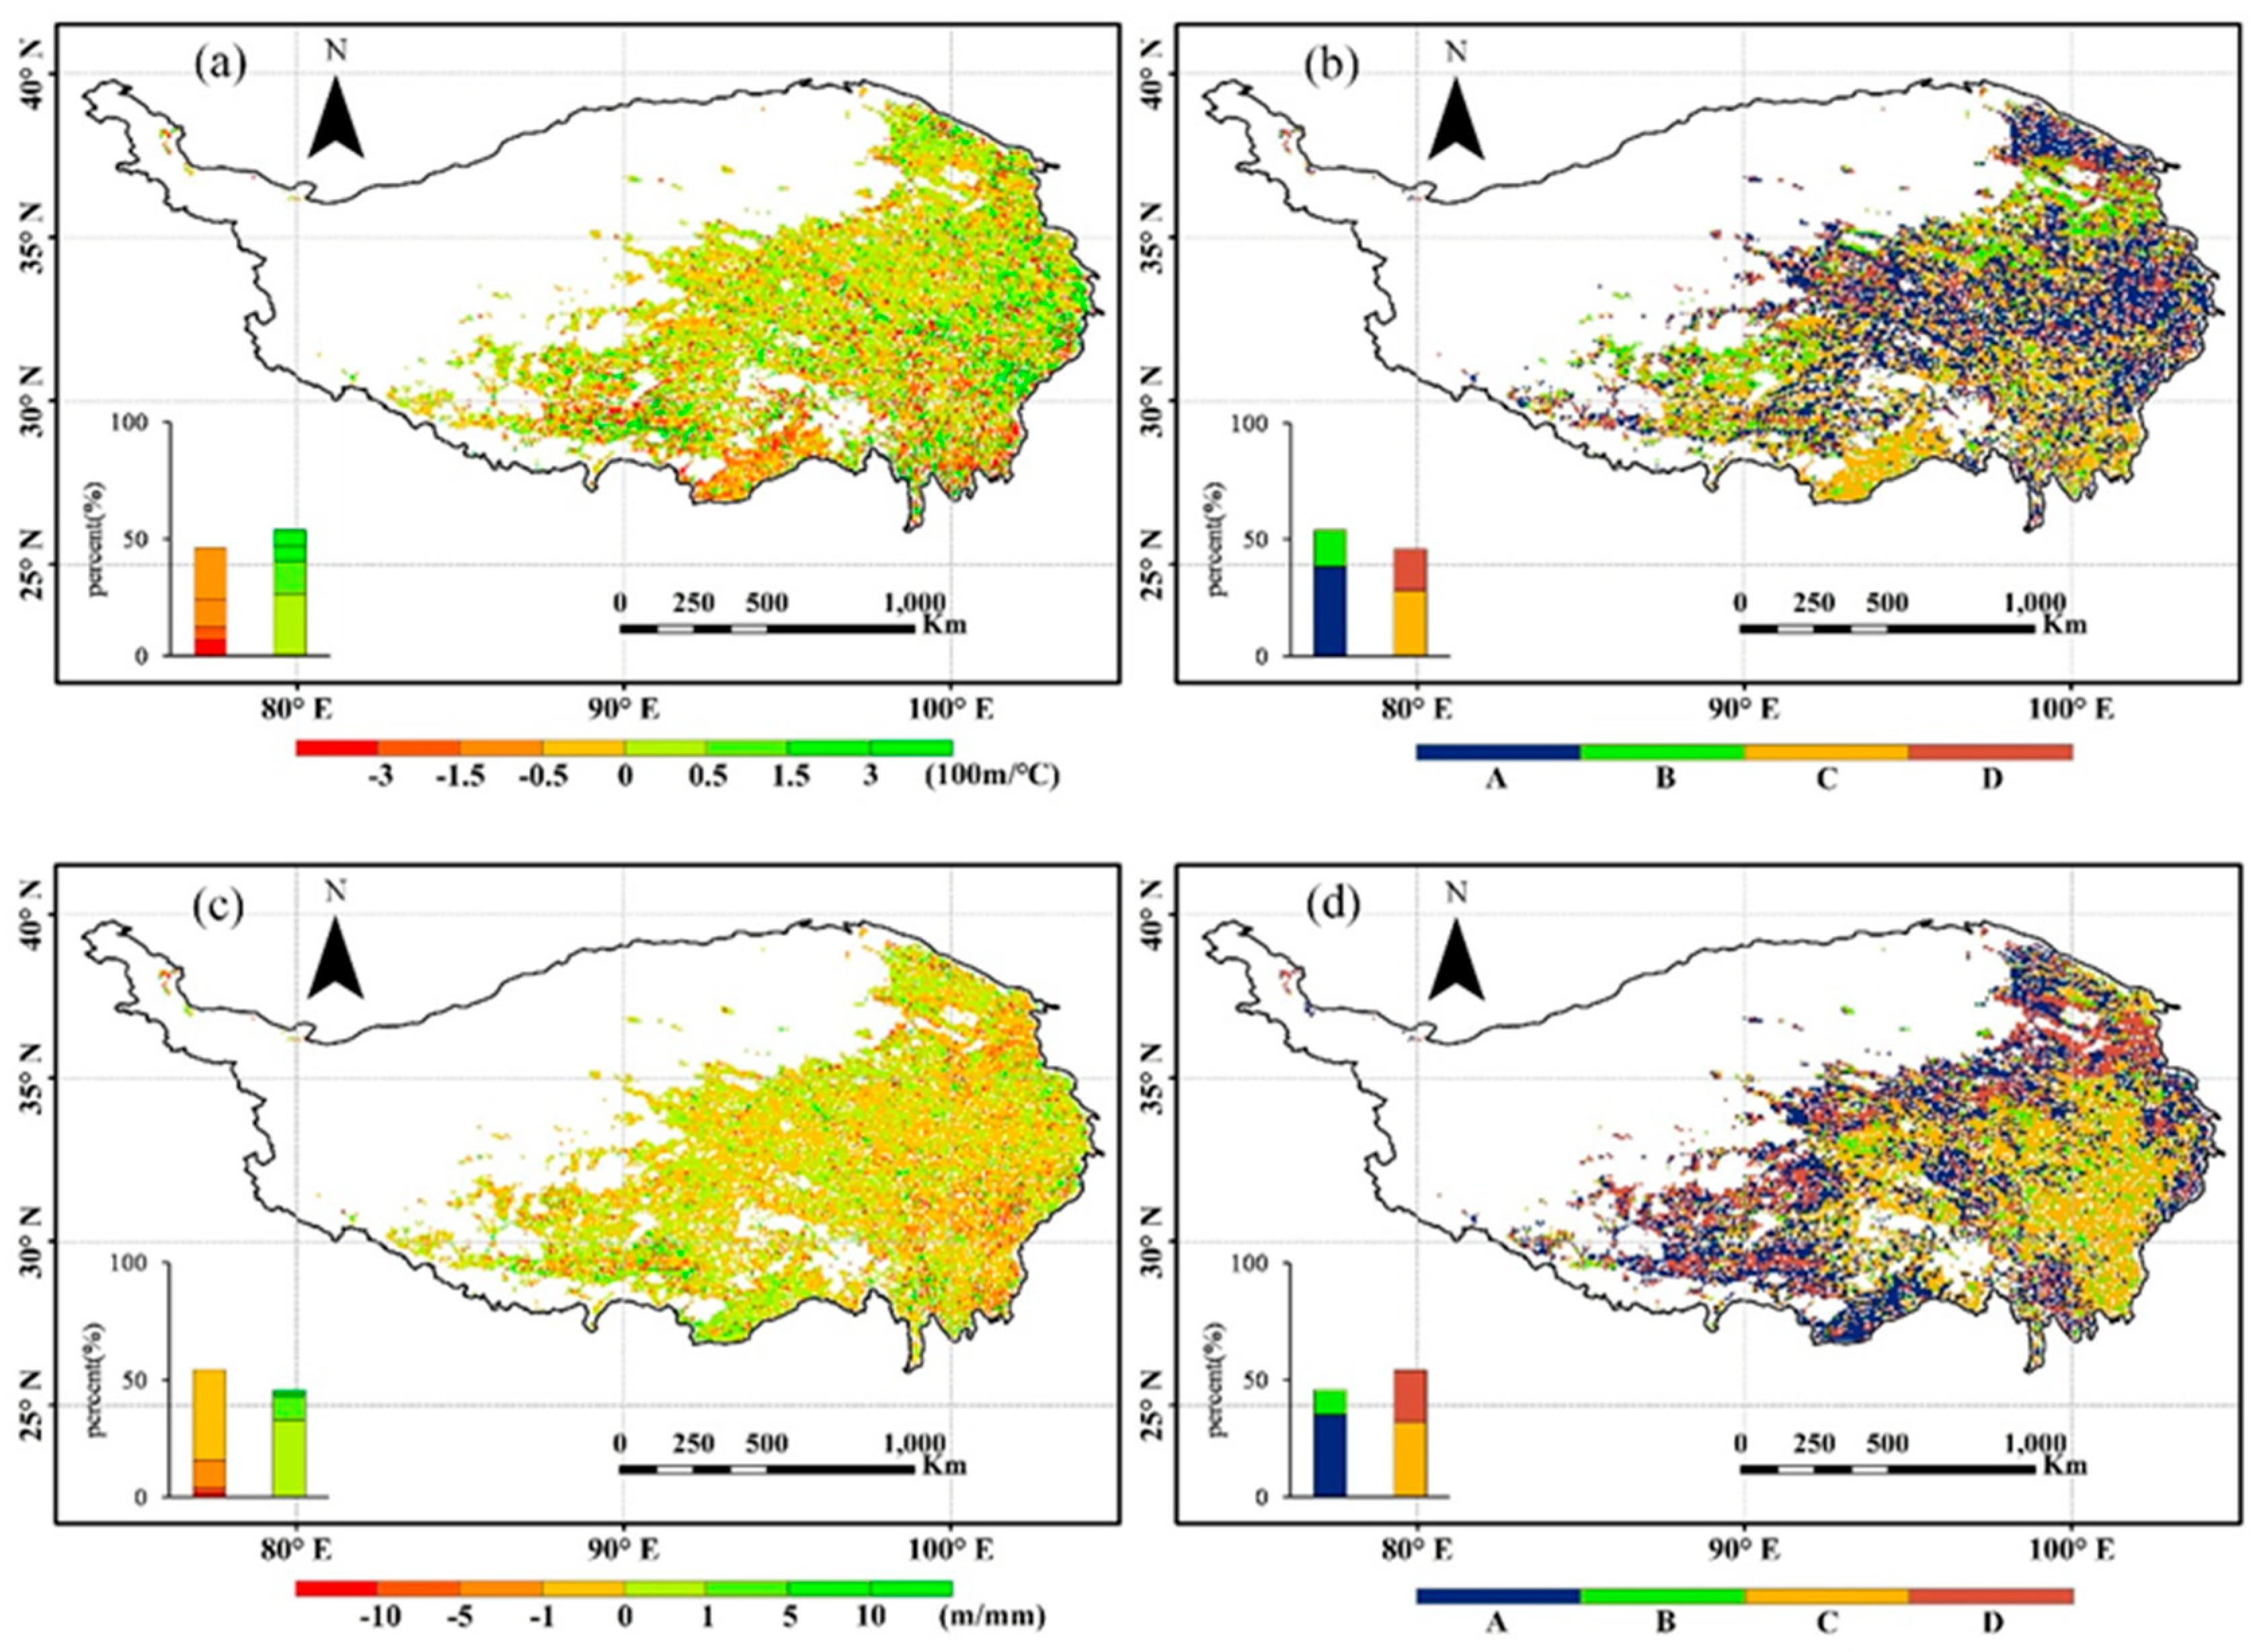
3.2. Sensitivity of the Movement of the NDVIGS Isolines to Temperature and Precipitation

The sensitivity of the elevational movement of the NDVIGS isolines to temperature was higher at low altitudes than at high altitudes (Figure 4a), whereas this trend was not obvious for the sensitivity to precipitation. The sensitivity to temperature was within the interval of −50–0 m/°C for 22% of all the pixels and within the interval of 0–50 m/°C for 27% of all the pixels. For most pixels, the sensitivity to precipitation was within the ranges of −1–0 m/mm (about 39%) and 0–1 m/mm (for about 33%) (Figure 4c). The NDVIGS isolines had both positive and negative responses to changes in precipitation and temperature. Specifically, the NDVIGS isolines responded positively to temperature increase (i.e., moved upward) for about 54% of the area and negatively for the remaining 46% of the area (Figure 4b). The expected positive responses to temperature occurred in the eastern TP whereas negative responses occurred in the southern TP (Figure 4a). Precipitation had an opposite effect on the movement of the NDVIGS isolines. About 54% of the NDVIGS isolines moved downward in response to increased precipitation (Figure 4d).
Below 2400 m, the elevational variation rate of the NDVIGS isoline and the sensitivity of the NDVIGS isoline elevational variation to precipitation were both positive (or negative) (Figure 5b). Above 2500 m, the elevational variation rate of the NDVIGS isoline and the sensitivity of the NDVIGS isoline elevational variation to temperature were both positive or negative (Figure 5a). The values of the sensitivity to temperature were generally within the range between −193 m/°C and 144 m/°C below 3600 m, which was larger than the values above 3700 m (Figure 5a). The values of the sensitivity to precipitation were between −1 m/mm and 1 m/mm except for the values of −4.6 m/mm at 1400 m, 3.4 m/mm at 1800 m, and 2.0 m/mm at 2300 m (Figure 5b).

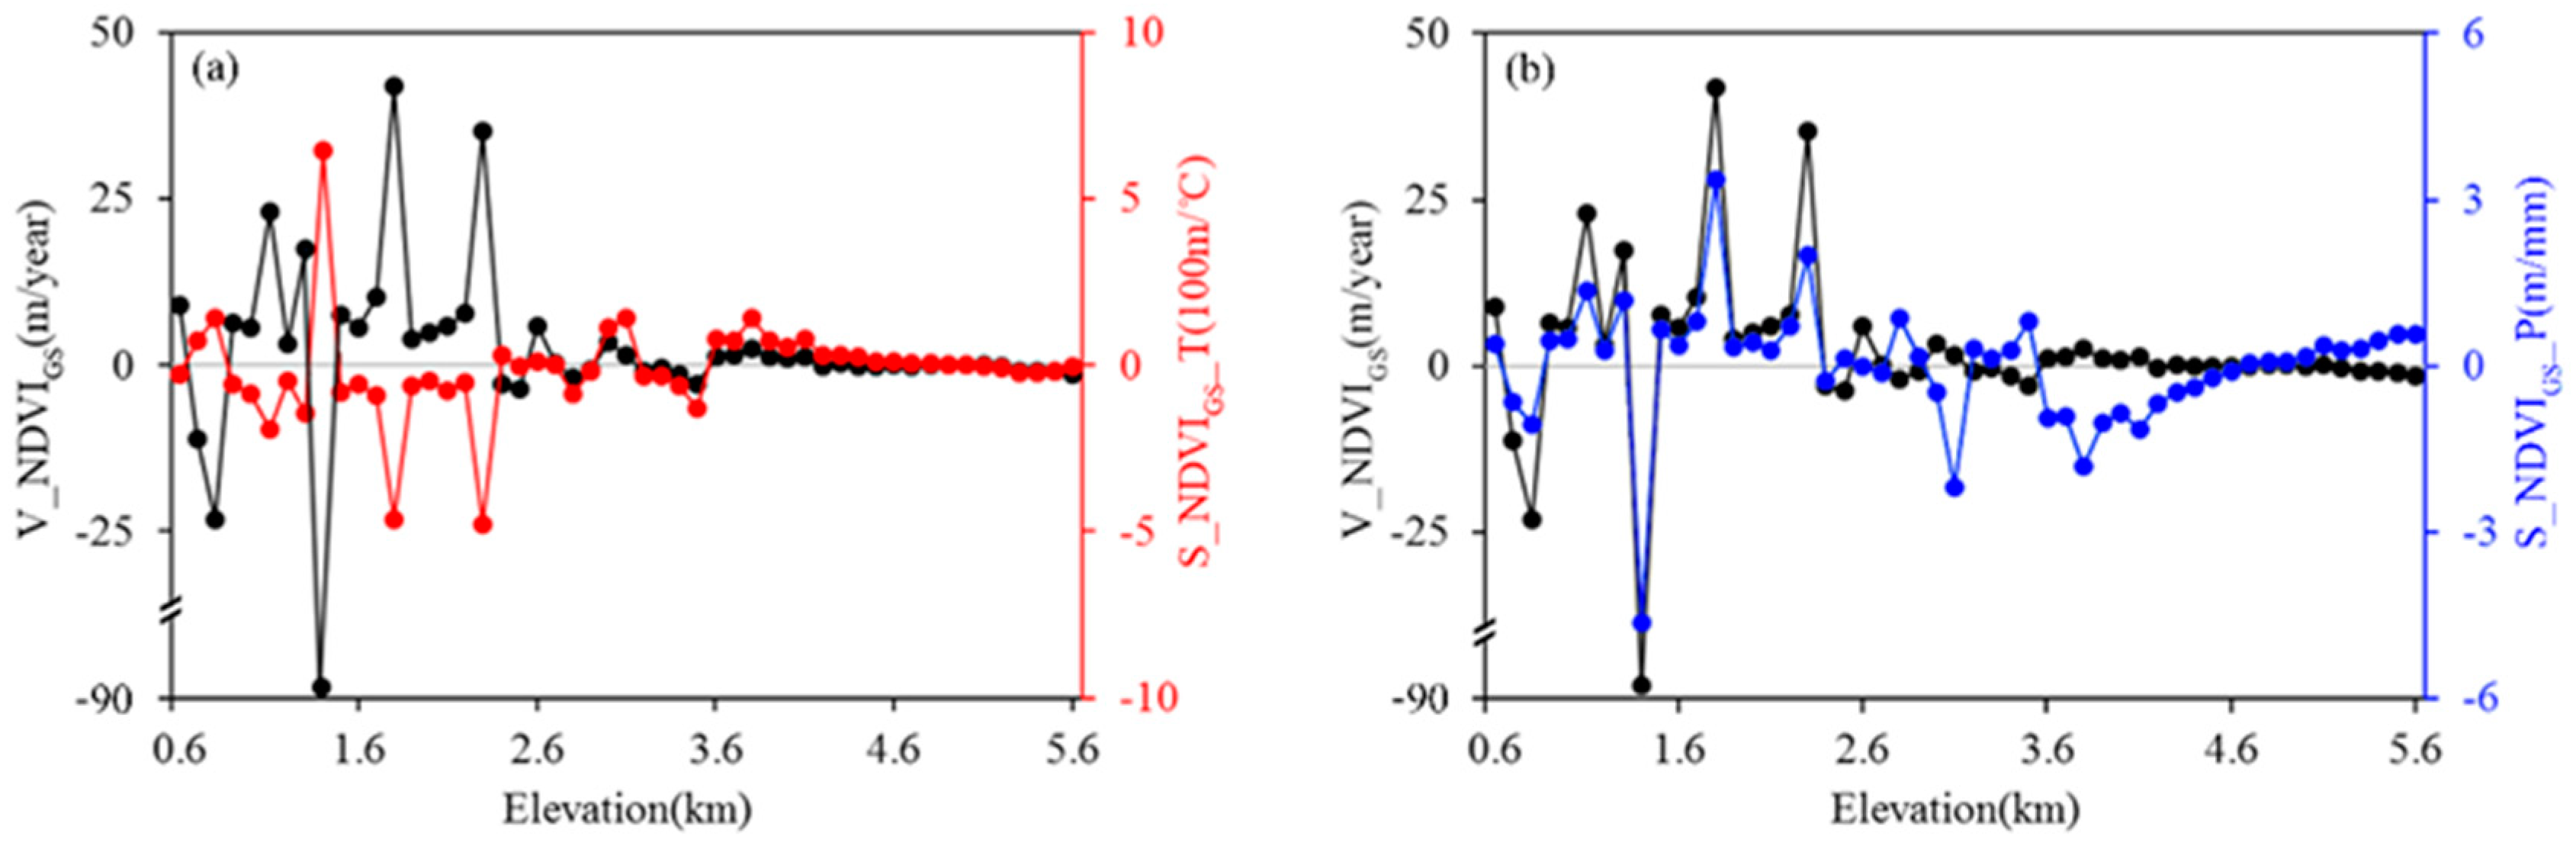
3.3. The Responses of Vegetation Greenness to Climate at Different Spatial Scales

We compared the elevational variation rates of temperature and precipitation isolines to investigate the uncertainties caused by differences in spatial resolutions, i.e., 0.1-degrees for CMFD and 1-km for WorldClim (Figure 6). The results show that the rates obtained from the two climate datasets were highly consistent in space, and about 80% elevational variation rates of TGS isolines were concentrated in the range of 0–5 m/year (Figure 6a,b). More heterogeneities can be observed for the spatial distribution of the elevational variation rate of the PGS isolines (Figure 6c,d). However, there was also consistency between the two sets of elevational variation rates of the PGS isolines.
We used 8-km GIMMS NDVI3g and 250-m MODIS NDVI from 2000 to 2015 to calculate the elevational movement of the NDVIGS isolines and then examined their sensitivities to temperature and precipitation. Significant correlations were found for their sensitivities to temperature (r = 0.52, p < 0.001) (Figure 7a) and to precipitation (r = 0.84, p < 0.001) (Figure 7b). Our results indicate that 8-km GIMMS NDVI showed similar elevational contrasting effects of temperature and precipitation across the TP compared with 250-m MODIS NDVI. Moreover, GIMMS NDVI, taking advantage of a longer time series (from 1982 to 2015) than MODIS NDVI, is more useful to explore long-term vegetation responses to climate change.

4. Discussion

Climate warming has caused upward movements of growing season temperature isolines; growing season precipitation isolines have also moved upward over about half of the TP. However, the elevational movement of the vegetation greenness isolines does not always match the isoline movements of temperature and precipitation. The rate of change of the vegetation greenness isolines is lower than that of the temperature and precipitation isolines (Figure 3). There may be several reasons for this: first, the elevational movement of the growing season temperature and precipitation isolines is asynchronous. The availability of heat and water changes with increasing altitude and the combined effect of these also changes [50,63]. High temperatures may have little positive effect on vegetation when water availability is limited [20,35,49,64]. This may also cause a slow movement of the temperature isolines and a rapid movement of the precipitation isolines [65]. A previous study showed that the warming rate is faster at high altitudes [48], which might result in faster evaporation in these areas and cause a hydrothermal imbalance due to temperature and water availability. The amount of precipitation does not equate to the amount of water available to vegetation on the TP, which mostly consists of high mountains. Particularly, steep slopes can affect water storage and cause water loss, meaning that water cannot effectively be used by vegetation when the ground is saturated [44,65]. Differences in aspect also affect the local humidity due to differences in the duration of sunshine. Terrain further affects the distribution of vegetation types because the forest is often found in areas with the steepest slopes while meadows are concentrated in flatter areas. Another point to consider is that while accelerating warming can alleviate the environmental constraints on vegetation growth, vegetation will also concurrently require more nutrients [39,66,67,68]. Our results showed that there was a continuous increase in temperature over the TP during the study period and that precipitation also increased. As a result, vegetation’s need for nutrients such as nitrogen and CO2 may have increased, faster than they were supplied. It has also been shown that the start of the growing season on the TP has become earlier [28,29]. In some areas of the TP, moreover, the date of autumn leaf senescence was delayed more significantly than the spring green-up date was anticipated [69]. Although these phenomena may lead to a prolonged growing season, it does not necessarily mean that vegetation becomes greener. Rapid growth early in the growing season may be offset by a rapid decline at the end of the growing season due to environmental limitations (e.g., water stress) [70]. Vegetation may also become more tolerant of warmer and wetter conditions [71,72].
Human activities may have an impact on vegetation growth. The decline in grazing on the alpine grasslands of the TP may have offset the negative impacts of climate change over the last decade [73]. Conservation efforts such as the Three-North Shelterbelt Project, The Natural Forest Protection Project, and Program to Return Farmland to Forests also contributed to vegetation recovery, especially in the northeast of the TP [45]. All these facts indicate that anthropogenic activities have a significant effect on alpine ecosystems [54].
Previous studies have shown that interactions among species can postpone the upward movement of treelines and shrub lines on the TP. For example, treeline establishment under warming condition is controlled by many abiotic factors (e.g., temperature, precipitation, human disturbance) and biotic factors (e.g., mean root-zone, proximity to trees, canopy cover), and the importance of these factors may fluctuate under different conditions [74,75,76,77,78]. Biotic interspecific competition between the tree population and its upper-elevation population (e.g., shrub or grass) cannot be ignored when the treeline varies along elevation [77,79,80]. The denser the shrub population, the greater the restrictions imposed on treeline establishment [40]. Upper vegetation, however, also provides an ameliorated biotic microenvironment for seedlings and saplings growth [81]. Proximity to a tree is also a significant biotic factor, which maintains the biological requirement or prevents seedlings or saplings from frost or more Ultraviolet-B radiation due to the existence of understory vegetation cover or canopy cover [75,77,82,83]. These earlier studies provided insights into how the composition of species communities affects the elevational movement of the vegetation greenness isolines [40], and into how climate change may have different effects on species composition and vegetation at different altitudes [84,85]. The TP plays an important role in controlling environmental changes in surrounding regions and across the northern hemisphere as a whole [86]. Many abiotic and biotic factors affect alpine vegetation. Therefore, future studies of the variation in vegetation greenness along the elevational gradients of the TP should integrate external environmental factors with the biophysical processes regulating vegetation growth.
Our results suggest that the temperature and precipitation together regulate the greening of vegetation on the TP, indicating that the elevational variation in vegetation greenness isolines over the years were influenced more by precipitation at elevations below 2400 m (Figure 5b), while above 2400 m, it depended more on temperature (Figure 5a). Such a phenomenon is consistent with Zhang et al. [45], who suggested that temperature is the dominant control on the vegetation fractional coverage at a higher elevation. The transitional elevation zone from precipitation dominated to temperature dominated behaved differently. Such discrepancy may be because of differences in the study period and in the elevational intervals. Changes in climatic conditions caused by latitudinal differences also cause changes in the main factors limiting vegetation growth [87]. Such effect may exist in some alpine regions [88] where vegetation greening might be more sensitive to precipitation at lower altitudes in areas where the temperature is relatively moderate. At higher altitudes, i.e., the colder regions, a small increase in temperature can produce a relatively large increase in the thermal balance [45,89]. Therefore, vegetation may be more sensitive to temperatures at high altitudes once the limitations caused by low temperatures are removed. During the growing season, the ratio of accumulated precipitation to ≥5 °C accumulated temperature varies with elevation, and this ratio determines which factor (precipitation or temperature) is more important to vegetation growth [88,90], indicating that the regulation of vegetation growth is jointly affected by precipitation and temperature. Vegetation types are another factor affecting the response of the vegetation greenness isolines to climate variables. For example, forests need a lot of rain whereas grasslands are more drought-tolerant. Generally, the TP exhibits a vegetation gradient from forest and meadow to steppe and desert corresponding as altitude increases, and the sensitivity of different vegetation types to temperature and precipitation also varies with elevation [3,24,34].

5. Conclusions

In this study, we used a 34-year GIMMS NDVI3g dataset and temperature and precipitation data for the same period to analyze the elevational movement of vegetation isolines from 1982 to 2015 on the TP. Besides the influence of temperature on vegetation greening, we also highlighted the significant impact of precipitation on vegetation growth. Our main conclusions are: (1) vegetation greenness on the TP was controlled jointly by temperature and precipitation. Below 2400 m, the elevational movement of the vegetation greenness isolines was controlled more by precipitation than by temperature, and above 2400 m, it was controlled more by temperature than by precipitation. (2) Mismatched elevation variation rates exist between the vegetation greenness isolines and the temperature and precipitation isolines. There are many abiotic and biotic factors that might affect the elevational movement of the vegetation greenness isolines. This mismatch may lead to changes in the structure of the ecosystem of the TP. Given that the temperature on the Tibetan Plateau will continue to increase in the future, we believe that precipitation will still dominate vegetation greenness variation in low-altitude areas, and the alleviated temperature pressure in high-altitude areas will continue to promote vegetation greening in these regions. These findings will benefit ecological conservation efforts on the Tibetan Plateau.

Author Contributions

Data curation, Y.W., D.P., X.Y., S.Z. and H.Z.; Formal analysis, Y.W., D.P., M.S. and X.Y.; Funding acquisition, D.P.; Investigation, D.P. and X.X.; Methodology, Y.W., D.P., M.S., L.Y., L.L. and C.L.; Project administration, D.P.; Resources, D.P., M.S. and X.X.; Software, Y.W., D.P., S.Z. and H.Z.; Supervision, D.P.; Validation, M.S., W.H., L.Y., L.L., C.L. and X.L.; Visualization, D.P., M.S. and X.X.; Writing—original draft, Y.W., D.P., M.S. and X.Y.; Writing—review & editing, Y.W., D.P., M.S., X.X., X.Y., W.H., L.Y., L.L., C.L. and X.L. All authors have read and agreed to the published version of the manuscript.

Funding

This study is funded by Strategic Priority Research Program of the Chinese Academy of Sciences, CASEarth (XDA19070203; XDA19090112), the National Key Research and Development Program of China [2016YFB0501501], the 2nd Scientific Expedition to the Qinghai-Tibet Plateau (2019QZKK0405), the National Key Scientific and Technological Infrastructure project “Earth System Science Numerical Simulator Facility” (EarthLab) and National Natural Science Foundation of China (41671435).

Acknowledgments

The authors acknowledge the following data providers the NASA/NOAA for GIMMS NDVI3g, NASA LP DAAC at the USGS EROS Center for MODIS NDVI products, the National Tibetan Plateau Data Center for China meteorological forcing dataset, the WorldClim data website for WorldClim version2 data and NASA and the Ministry of Economy, Trade, and Industry (METI) of Japan for ASTER GDEM.

Conflicts of Interest

The authors declare no conflict of interest.

References

  1. Li, C.; Kang, S. Review of the studies on climate change since the last inter-glacial period on the Tibetan plateau. J. Geogr. Sci. 2006, 16, 337–345. [Google Scholar] [CrossRef]
  2. Qiu, J. China: The third pole. Nature 2008, 454, 393–396. [Google Scholar] [CrossRef] [Green Version]
  3. Zhang, B.P.; Chen, X.D.; LI, B.L.; Yao, Y.H. Biodiversity and conservation in the Tibetan plateau. J. Geogr. Sci. 2002, 12, 135–143. [Google Scholar]
  4. Ding, M.; Zhang, Y.; Shen, Z.; Liu, L.; Zhang, W.; Wang, Z.; Bai, W.; Zheng, D. Land cover change along the Qinghai-Tibet highway and railway from 1981 to 2001. J. Geogr. Sci. 2006, 16, 387–395. [Google Scholar] [CrossRef]
  5. Cai, D.; You, Q.; Fraedrich, K.; Guan, Y. Spatiotemporal temperature variability over the tibetan plateau: Altitudinal dependence associated with the global warming hiatus. J. Clim. 2017, 30, 969–984. [Google Scholar] [CrossRef]
  6. Kuang, X.; Jiao, J.J. Review on climate change on the Tibetan plateau during the last half century. J. Geophys. Res. Atmos. 2016, 121, 3979–4007. [Google Scholar] [CrossRef]
  7. Song, C.; Pei, T.; Zhou, C. The role of changing multiscale temperature variability in extreme temperature events on the eastern and central Tibetan plateau during 1960–2008. Int. J. Climatol. 2014, 34, 3683–3701. [Google Scholar] [CrossRef]
  8. Liu, X.; Chen, B. Climatic warming in the Tibetan plateau during recent decades. Int. J. Climatol. 2000, 20, 1729–1742. [Google Scholar] [CrossRef]
  9. Niu, T.; Chen, L.; Zhou, Z. The characteristics of climate change over the tibetan plateau in the last 40 years and the detection of climatic jumps. Adv. Atmos. Sci. 2004, 21, 193–203. [Google Scholar] [CrossRef]
  10. Yao, T.; Xue, Y.; Chen, D.; Chen, F.; Thompson, L.; Cui, P.; Koike, T.; Lau, W.K.-M.; Lettenmaier, D.; Mosbrugger, V.; et al. Recent third pole’s rapid warming accompanies cryospheric melt and water cycle intensification and interactions between monsoon and environment: Multidisciplinary approach with observations, modeling, and analysis. Bull. Am. Meteorol. Soc. 2019, 100, 423–444. [Google Scholar] [CrossRef]
  11. Chen, B.; Chao, W.C.; Liu, X. Enhanced climatic warming in the Tibetan plateau due to doubling co2: A model study. Clim. Dyn. 2003, 20, 401–413. [Google Scholar] [CrossRef]
  12. Rangwala, I.; Miller, J.R.; Russell, G.L.; Xu, M. Using a global climate model to evaluate the influences of water vapor, snow cover and atmospheric aerosol on warming in the Tibetan plateau during the twenty-first century. Clim. Dyn. 2010, 34, 859–872. [Google Scholar] [CrossRef]
  13. Zhang, Q.-B.; Cheng, G.; Yao, T.; Kang, X.; Huang, J. A 2,326-year tree-ring record of climate variability on the northeastern Qinghai-Tibetan plateau. Geophys. Res. Lett. 2003, 30, 1739. [Google Scholar] [CrossRef] [Green Version]
  14. Huang, J.; Li, Y.; Fu, C.; Chen, F.; Fu, Q.; Dai, A.; Shinoda, M.; Ma, Z.; Guo, W.; Li, Z.; et al. Dryland climate change: Recent progress and challenges. Rev. Geophys. 2017, 55, 719–778. [Google Scholar] [CrossRef]
  15. Huang, J.P.; Ji, M.X.; Xie, Y.K.; Wang, S.S.; He, Y.L.; Ran, J.J. Global semi-arid climate change over last 60 years. Clim. Dyn. 2016, 46, 1131–1150. [Google Scholar] [CrossRef] [Green Version]
  16. Yao, T.; Thompson, L.; Yang, W.; Yu, W.; Gao, Y.; Guo, X.; Yang, X.; Duan, K.; Zhao, H.; Xu, B.; et al. Different glacier status with atmospheric circulations in Tibetan plateau and surroundings. Nat. Clim. Chang. 2012, 2, 663–667. [Google Scholar] [CrossRef]
  17. Zhang, C.; Tang, Q.H.; Chen, D.L. Recent changes in the moisture source of precipitation over the Tibetan plateau. J. Clim. 2017, 30, 1807–1819. [Google Scholar] [CrossRef]
  18. Chen, B.; Zhang, W.; Yang, S.; Xu, X.D. Identifying and contrasting the sources of the water vapor reaching the subregions of the tibetan plateau during the wet season. Clim. Dyn. 2019, 53, 6891–6907. [Google Scholar] [CrossRef]
  19. Cao, M.; Woodward, F.I. Dynamic responses of terrestrial ecosystem carbon cycling to global climate change. Nature 1998, 393, 249–252. [Google Scholar] [CrossRef]
  20. Shen, M.; Piao, S.; Jeong, S.-J.; Zhou, L.; Zeng, Z.; Ciais, P.; Chen, D.; Huang, M.; Jin, C.-S.; Li, L.Z.X.; et al. Evaporative cooling over the Tibetan plateau induced by vegetation growth. Proc. Natl. Acad. Sci. USA 2015, 112, 9299–9304. [Google Scholar] [CrossRef] [Green Version]
  21. Yao, Y.T.; Wang, X.H.; Li, Y.; Wang, T.; Shen, M.G.; Du, M.Y.; He, H.L.; Li, Y.N.; Luo, W.J.; Ma, M.G.; et al. Spatiotemporal pattern of gross primary productivity and its covariation with climate in china over the last thirty years. Glob. Chang. Biol. 2018, 24, 184–196. [Google Scholar] [CrossRef] [PubMed]
  22. Zhong, L.; Ma, Y.; Xue, Y.; Piao, S. Climate change trends and impacts on vegetation greening over the Tibetan plateau. J. Geophys. Res. Atmos. 2019, 124, 7540–7552. [Google Scholar] [CrossRef]
  23. Li, P.L.; Hu, Z.M.; Liu, Y.W. Shift in the trend of browning in southwestern Tibetan plateau in the past two decades. Agric. For. Meteorol. 2020, 287, 107950. [Google Scholar] [CrossRef]
  24. An, S.; Zhu, X.; Shen, M.; Wang, Y.; Cao, R.; Chen, X.; Yang, W.; Chen, J.; Tang, Y. Mismatch in elevational shifts between satellite observed vegetation greenness and temperature isolines during 2000–2016 on the tibetan plateau. Glob. Chang. Biol. 2018, 24, 5411–5425. [Google Scholar] [CrossRef]
  25. Guo, M.; Zhang, Y.; Liu, S.; Gu, F.; Wang, X.; Li, Z.; Shi, C.; Fan, Z. Divergent growth between spruce and fir at alpine treelines on the east edge of the Tibetan plateau in response to recent climate warming. Agric. For. Meteorol. 2019, 276, 107631. [Google Scholar] [CrossRef]
  26. Piao, S.; Tan, K.; Nan, H.; Ciais, P.; Fang, J.; Wang, T.; Vuichard, N.; Zhu, B. Impacts of climate and co2 changes on the vegetation growth and carbon balance of Qinghai–Tibetan grasslands over the past five decades. Glob. Planet. Chang. 2012, 98–99, 73–80. [Google Scholar] [CrossRef]
  27. Wang, S.; Duan, J.; Xu, G.; Wang, Y.; Zhang, Z.; Rui, Y.; Luo, C.; Xu, B.; Zhu, X.; Chang, X.; et al. Effects of warming and grazing on soil n availability, species composition, and anpp in an alpine meadow. Ecology 2012, 93, 2365–2376. [Google Scholar] [CrossRef]
  28. Shen, M.; Piao, S.; Dorji, T.; Liu, Q.; Cong, N.; Chen, X.; An, S.; Wang, S.; Wang, T.; Zhang, G. Plant phenological responses to climate change on the Tibetan plateau: Research status and challenges. Natl. Sci. Rev. 2015, 2, 454–467. [Google Scholar] [CrossRef] [Green Version]
  29. Zhang, G.; Zhang, Y.; Dong, J.; Xiao, X. Green-up dates in the Tibetan plateau have continuously advanced from 1982 to 2011. Proc. Natl. Acad. Sci. USA 2013, 110, 4309–4314. [Google Scholar] [CrossRef] [Green Version]
  30. Shen, M.; Piao, S.; Chen, X.; An, S.; Fu, Y.H.; Wang, S.; Cong, N.; Janssens, I.A. Strong impacts of daily minimum temperature on the green-up date and summer greenness of the Tibetan plateau. Glob. Chang. Biol. 2016, 22, 3057–3066. [Google Scholar] [CrossRef]
  31. Ganjurjav, H.; Gao, Q.; Gornish, E.S.; Schwartz, M.W.; Liang, Y.; Cao, X.; Zhang, W.; Zhang, Y.; Li, W.; Wan, Y.; et al. Differential response of alpine steppe and alpine meadow to climate warming in the central Qinghai–Tibetan plateau. Agric. For. Meteorol. 2016, 223, 233–240. [Google Scholar] [CrossRef] [Green Version]
  32. He, B.; Wang, H.; Guo, L.; Liu, J. Global analysis of ecosystem evapotranspiration response to precipitation deficits. J. Geophys. Res. Atmos. 2017, 122, 13308–313318. [Google Scholar] [CrossRef]
  33. Huang, M.T.; Piao, S.L.; Ciais, P.; Penuelas, J.; Wang, X.H.; Keenan, T.F.; Peng, S.S.; Berry, J.A.; Wang, K.; Mao, J.F.; et al. Air temperature optima of vegetation productivity across global biomes. Nat. Ecol. Evol. 2019, 3, 772–779. [Google Scholar] [CrossRef] [PubMed]
  34. Chen, Z.; Wang, W.; Fu, J. Vegetation response to precipitation anomalies under different climatic and biogeographical conditions in china. Sci. Rep. 2020, 10, 830. [Google Scholar] [CrossRef] [Green Version]
  35. Shen, M.; Piao, S.; Cong, N.; Zhang, G.; Jassens, I.A. Precipitation impacts on vegetation spring phenology on the Tibetan plateau. Glob. Chang. Biol. 2015, 21, 3647–3656. [Google Scholar] [CrossRef] [Green Version]
  36. Chen, X.; Li, J.; Xu, L.; Liu, L.; Ding, D. Modeling greenup date of dominant grass species in the inner Mongolian grassland using air temperature and precipitation data. Int. J. Biometeorol. 2014, 58, 463–471. [Google Scholar] [CrossRef]
  37. Cong, N.; Wang, T.; Nan, H.; Ma, Y.; Wang, X.; Myneni, R.B.; Piao, S. Changes in satellite-derived spring vegetation green-up date and its linkage to climate in china from 1982 to 2010: A multimethod analysis. Glob. Chang. Biol. 2013, 19, 881–891. [Google Scholar] [CrossRef]
  38. Fu, Y.H.; Piao, S.; Zhao, H.; Jeong, S.J.; Wang, X.; Vitasse, Y.; Ciais, P.; Janssens, I.A. Unexpected role of winter precipitation in determining heat requirement for spring vegetation green-up at northern middle and high latitudes. Glob. Chang. Biol. 2014, 20, 3743–3755. [Google Scholar] [CrossRef]
  39. Li, L.; Zhang, Y.; Wu, J.; Li, S.; Zhang, B.; Zu, J.; Zhang, H.; Ding, M.; Paudel, B. Increasing sensitivity of alpine grasslands to climate variability along an elevational gradient on the Qinghai-Tibet plateau. Sci. Total Environ. 2019, 678, 21–29. [Google Scholar] [CrossRef]
  40. Liang, E.; Wang, Y.; Piao, S.; Lu, X.; Camarero, J.J.; Zhu, H.; Zhu, L.; Ellison, A.M.; Ciais, P.; Peñuelas, J. Species interactions slow warming-induced upward shifts of treelines on the Tibetan plateau. Proc. Natl. Acad. Sci. USA 2016, 113, 4380–4385. [Google Scholar] [CrossRef] [Green Version]
  41. Bertrand, R.; Lenoir, J.; Piedallu, C.; Riofrío-Dillon, G.; de Ruffray, P.; Vidal, C.; Pierrat, J.-C.; Gégout, J.-C. Changes in plant community composition lag behind climate warming in lowland forests. Nature 2011, 479, 517–520. [Google Scholar] [CrossRef] [PubMed]
  42. Crimmins, S.M.; Dobrowski, S.Z.; Greenberg, J.A.; Abatzoglou, J.T.; Mynsberge, A.R. Changes in climatic water balance drive downhill shifts in plant species’ optimum elevations. Science 2011, 331, 324–327. [Google Scholar] [CrossRef] [PubMed]
  43. Saikkonen, K.; Taulavuori, K.; Hyvönen, T.; Gundel, P.E.; Hamilton, C.E.; Vänninen, I.; Nissinen, A.; Helander, M. Climate change-driven species’ range shifts filtered by photoperiodism. Nat. Clim. Chang. 2012, 2, 239–242. [Google Scholar] [CrossRef]
  44. Zeng, B.; Yang, T.-B. Impacts of climate warming on vegetation in Qaidam area from 1990 to 2003. Environ. Monit. Assess. 2008, 144, 403–417. [Google Scholar] [CrossRef]
  45. Zhang, Y.X.; Xu, G.C.; Li, P.; Li, Z.B.; Wang, Y.; Wang, B.; Jia, L.; Cheng, Y.T.; Zhang, J.X.; Zhuang, S.H.; et al. Vegetation change and its relationship with climate factors and elevation on the Tibetan plateau. Int. J. Environ. Res. Public Health 2019, 16, 4709. [Google Scholar] [CrossRef] [PubMed] [Green Version]
  46. Beckage, B.; Osborne, B.; Gavin, D.G.; Pucko, C.; Siccama, T.; Perkins, T. A rapid upward shift of a forest ecotone during 40 years of warming in the green mountains of vermont. Proc. Natl. Acad. Sci. USA 2008, 105, 4197–4202. [Google Scholar] [CrossRef] [Green Version]
  47. Løkken, J.O.; Evju, M.; Söderström, L.; Hofgaard, A. Vegetation response to climate warming across the forest–tundra ecotone: Species-dependent upward movement. J. Veg. Sci. 2020. [Google Scholar] [CrossRef]
  48. Pepin, N.; Bradley, R.S.; Diaz, H.F.; Baraer, M.; Caceres, E.B.; Forsythe, N.; Fowler, H.; Greenwood, G.; Hashmi, M.Z.; Liu, X.D.; et al. Elevation-dependent warming in mountain regions of the world. Nat. Clim. Chang. 2015, 5, 424–430. [Google Scholar]
  49. Cong, N.; Shen, M.; Yang, W.; Yang, Z.; Zhang, G.; Piao, S. Varying responses of vegetation activity to climate changes on the tibetan plateau grassland. Int. J. Biometeorol. 2017, 61, 1433–1444. [Google Scholar] [CrossRef]
  50. Liu, L.; Wang, Y.; Wang, Z.; Li, D.; Zhang, Y.; Qin, D.; Li, S. Elevation-dependent decline in vegetation greening rate driven by increasing dryness based on three satellite ndvi datasets on the Tibetan plateau. Ecol. Indic. 2019, 107, 105569. [Google Scholar] [CrossRef]
  51. Wang, C.; Guo, H.; Zhang, L.; Liu, S.; Qiu, Y.; Sun, Z. Assessing phenological change and climatic control of alpine grasslands in the Tibetan plateau with modis time series. Int. J. Biometeorol. 2015, 59, 11–23. [Google Scholar] [CrossRef] [PubMed]
  52. Dorji, T.; Totland, Ø.; Moe, S.R.; Hopping, K.A.; Pan, J.; Klein, J.A. Plant functional traits mediate reproductive phenology and success in response to experimental warming and snow addition in Tibet. Glob. Chang. Biol. 2013, 19, 459–472. [Google Scholar] [CrossRef] [PubMed]
  53. Change, Intergovernmental Panel on Climate. Climate Change 2013: The Physical Science Basis. Contribution of Working Group I to the Fifth Assessment Report of the Intergovernmental Panel on Climate Change; Stocker, T.F., Qin, D., Plattner, G.-K., Tignor, M., Allen, S.K., Boschung, J., Nauels, A., Xia, Y., Bex, V., Midgley, P.M., Eds.; Cambridge University Press: Cambridge, UK; New York, NY, USA, 2014; p. 1535.
  54. Gao, M.; Piao, S.; Chen, A.; Yang, H.; Liu, Q.; Fu, Y.H.; Janssens, I.A. Divergent changes in the elevational gradient of vegetation activities over the last 30 years. Nat. Commun. 2019, 10, 2970. [Google Scholar] [CrossRef] [PubMed]
  55. Tucker, C.J.; Pinzon, J.E.; Brown, M.E.; Slayback, D.A.; Pak, E.W.; Mahoney, R.; Vermote, E.F.; El Saleous, N. An extended avhrr 8-km ndvi dataset compatible with modis and spot vegetation ndvi data. Int. J. Remote Sens. 2005, 26, 4485–4498. [Google Scholar] [CrossRef]
  56. He, J.; Yang, K.; Tang, W.; Lu, H.; Qin, J.; Chen, Y.; Li, X. The first high-resolution meteorological forcing dataset for land process studies over china. Sci. Data 2020, 7, 25. [Google Scholar] [CrossRef] [Green Version]
  57. Yang, K.; He, J. China meteorological forcing dataset (1979–2018). Natl. Tibetan Plateau Data Cent. 2018. [Google Scholar] [CrossRef]
  58. Fick, S.E.; Hijmans, R.J. Worldclim 2: New 1-km spatial resolution climate surfaces for global land areas. Int. J. Climatol. 2017, 37, 4302–4315. [Google Scholar] [CrossRef]
  59. Teoh, K.K.; Ibrahim, H.; Bejo, S.K.; IEEE. Investigation on several basic interpolation methods for the use in remote sensing application. In Proceedings of the 2008 IEEE Conference on Innovative Technologies in Intelligent Systems and Industrial Applications, Cyberjaya, Malaysia, 12–13 July 2008; p. 60. [Google Scholar]
  60. Amanatiadis, A.; Andreadis, I. A survey on evaluation methods for image interpolation. Meas. Sci. Technol. 2009, 20, 104015. [Google Scholar] [CrossRef]
  61. Goward, S.N.; Davis, P.E.; Fleming, D.; Miller, L.; Townshend, J.R. Empirical comparison of landsat 7 and ikonos multispectral measurements for selected earth observation system (eos) validation sites. Remote Sens. Environ. 2003, 88, 80–99. [Google Scholar] [CrossRef]
  62. Gandhi, G.M.; Parthiban, S.; Thummalu, N.; Christy, A. Ndvi: Vegetation Change Detection Using Remote Sensing and Gis—A Case Study of Vellore District. Procedia Comput. Sci. 2015, 57, 1199–1210. [Google Scholar] [CrossRef] [Green Version]
  63. Tao, J.; Zhang, Y.; Dong, J.; Fu, Y.; Zhu, J.; Zhang, G.; Jiang, Y.; Tian, L.; Zhang, X.; Zhang, T.; et al. Elevation-dependent relationships between climate change and grassland vegetation variation across the Qinghai-Xizang plateau. Int. J. Climatol. 2015, 35, 1638–1647. [Google Scholar] [CrossRef] [Green Version]
  64. Zhao, W.; Hu, Z.; Guo, Q.; Wu, G.; Chen, R.; Li, S. Contributions of climatic factors to interannual variability of the vegetation index in northern china grasslands. J. Clim. 2019, 33, 175–183. [Google Scholar] [CrossRef]
  65. Deng, S.-F.; Yang, T.-B.; Zeng, B.; Zhu, X.-F.; Xu, H.-J. Vegetation cover variation in the Qilian mountains and its response to climate change in 2000–2011. J. Mt. Sci. 2013, 10, 1050–1062. [Google Scholar] [CrossRef]
  66. Liu, Y.; Lei, H. Responses of natural vegetation dynamics to climate drivers in china from 1982 to 2011. Remote Sens. 2015, 7, 10243. [Google Scholar] [CrossRef] [Green Version]
  67. Rumpf, S.B.; Hülber, K.; Klonner, G.; Moser, D.; Schütz, M.; Wessely, J.; Willner, W.; Zimmermann, N.E.; Dullinger, S. Range dynamics of mountain plants decrease with elevation. Proc. Natl. Acad. Sci. USA 2018, 115, 1848–1853. [Google Scholar] [CrossRef] [Green Version]
  68. Zhu, Z.; Piao, S.; Myneni, R.B.; Huang, M.; Zeng, Z.; Canadell, J.G.; Ciais, P.; Sitch, S.; Friedlingstein, P.; Arneth, A.; et al. Greening of the earth and its drivers. Nat. Clim. Chang. 2016, 6, 791–795. [Google Scholar] [CrossRef]
  69. Sun, Q.; Li, B.; Zhou, G.; Jiang, Y.; Yuan, Y. Delayed autumn leaf senescence date prolongs the growing season length of herbaceous plants on the Qinghai-Tibetan plateau. Agric. For. Meteorol. 2020, 284, 107896. [Google Scholar] [CrossRef]
  70. Wang, H.; Liu, H.; Cao, G.; Ma, Z.; Li, Y.; Zhang, F.; Zhao, X.; Zhao, X.; Jiang, L.; Sanders, N.J.; et al. Alpine grassland plants grow earlier and faster but biomass remains unchanged over 35 years of climate change. Ecol. Lett. 2020, 23, 701–710. [Google Scholar] [CrossRef] [Green Version]
  71. Hikosaka, K.; Ishikawa, K.; Borjigidai, A.; Muller, O.; Onoda, Y. Temperature acclimation of photosynthesis: Mechanisms involved in the changes in temperature dependence of photosynthetic rate. J. Exp. Bot. 2005, 57, 291–302. [Google Scholar] [CrossRef] [Green Version]
  72. Smith, N.G.; Keenan, T.F. Mechanisms underlying leaf photosynthetic acclimation to warming and elevated co(2)as inferred from least-cost optimality theory. Glob. Chang. Biol. 2020, 26, 5202–5216. [Google Scholar] [CrossRef]
  73. Chen, B.; Zhang, X.; Tao, J.; Wu, J.; Wang, J.; Shi, P.; Zhang, Y.; Yu, C. The impact of climate change and anthropogenic activities on alpine grassland over the qinghai-tibet plateau. Agric. For. Meteorol. 2014, 189, 11–18. [Google Scholar] [CrossRef]
  74. Cairns, D.M. Alpine treelines: Functional ecology of the global high elevation tree limits. Arctic Antarct. Alp. Res. 2014, 46, 292. [Google Scholar]
  75. Neuschulz, E.L.; Merges, D.; Bollmann, K.; Gugerli, F.; Boehning-Gaese, K. Biotic interactions and seed deposition rather than abiotic factors determine recruitment at elevational range limits of an alpine tree. J. Ecol. 2018, 106, 948–959. [Google Scholar] [CrossRef]
  76. Smith, W.K.; Germino, M.J.; Johnson, D.M.; Reinhardt, K. The altitude of alpine treeline: A bellwether of climate change effects. Bot. Rev. 2009, 75, 163–190. [Google Scholar] [CrossRef]
  77. Stueve, K.M.; Isaacs, R.E.; Tyrrell, L.E.; Densmore, R.V. Spatial variability of biotic and abiotic tree establishment constraints across a treeline ecotone in the Alaska range. Ecology 2011, 92, 496–506. [Google Scholar] [CrossRef]
  78. Wiegand, T.; Camarero, J.J.; Ruger, N.; Gutierrez, E. Abrupt population changes in treeline ecotones along smooth gradients. J. Ecol. 2006, 94, 880–892. [Google Scholar] [CrossRef]
  79. Turner, M.G. Disturbance and landscape dynamics in a changing world. Ecology 2010, 91, 2833–2849. [Google Scholar] [CrossRef] [Green Version]
  80. Zhang, J.; Huang, S.; He, F. Half-century evidence from western canada shows forest dynamics are primarily driven by competition followed by climate. Proc. Natl. Acad. Sci. USA 2015, 112, 4009–4014. [Google Scholar] [CrossRef] [Green Version]
  81. Chen, J.; Yang, Y.; Wang, S.; Sun, H.; Schob, C. Shrub facilitation promotes selective tree establishment beyond the climatic treeline. Sci. Total Environ. 2020, 708, 134618. [Google Scholar] [CrossRef]
  82. Graae, B.J.; Ejrnaes, R.; Lang, S.I.; Meineri, E.; Ibarra, P.T.; Bruun, H.H. Strong microsite control of seedling recruitment in tundra. Oecologia 2011, 166, 565–576. [Google Scholar] [CrossRef] [Green Version]
  83. Mamet, S.D.; Kershaw, G.P. Multi-scale analysis of environmental conditions and conifer seedling distribution across the treeline ecotone of northern Manitoba, Canada. Ecosystems 2013, 16, 295–309. [Google Scholar] [CrossRef]
  84. Körner, C. Significance of temperature in plant life. In Plant Growth and Climate Change; Blackwell Publishing: Oxford, UK, 2007; pp. 48–69. [Google Scholar]
  85. Liu, B.; Wang, Y.; Zhu, H.; Liang, E.; Camarero, J.J. Topography and age mediate the growth responses of smith fir to climate warming in the southeastern Tibetan plateau. Int. J. Biometeorol. 2016, 60, 1577–1587. [Google Scholar] [CrossRef] [PubMed]
  86. Liu, X.; Zheng, H.; Zhang, M.; Liu, C. Identification of dominant climate factor for pan evaporation trend in the Tibetan plateau. J. Geogr. Sci. 2011, 21, 594–608. [Google Scholar] [CrossRef]
  87. Karnieli, A.; Bayasgalan, M.; Bayarjargal, Y.; Agam, N.; Khudulmur, S.; Tucker, C.J. Comments on the use of the vegetation health index over Mongolia. Int. J. Remote Sens. 2006, 27, 2017–2024. [Google Scholar] [CrossRef]
  88. Wang, Z.; Luo, T.; Li, R.; Tang, Y.; Du, M. Causes for the unimodal pattern of biomass and productivity in alpine grasslands along a large altitudinal gradient in semi-arid regions. J. Veg. Sci. 2013, 24, 189–201. [Google Scholar] [CrossRef]
  89. Prevéy, J.; Vellend, M.; Rüger, N.; Hollister, R.D.; Bjorkman, A.D.; Myers-Smith, I.H.; Elmendorf, S.C.; Clark, K.; Cooper, E.J.; Elberling, B.; et al. Greater temperature sensitivity of plant phenology at colder sites: Implications for convergence across northern latitudes. Glob. Chang. Biol. 2017, 23, 2660–2671. [Google Scholar] [CrossRef] [Green Version]
  90. Shen, M.; Tang, Y.; Klein, J.; Zhang, P.; Gu, S.; Shimono, A.; Chen, J. Estimation of aboveground biomass using in situ hyperspectral measurements in five major grassland ecosystems on the Tibetan plateau. J. Plant Ecol. 2008, 1, 247–257. [Google Scholar] [CrossRef] [Green Version]
Figure 1. Illustration for the elevational movement of the NDVIGS isolines. Upward movement of the NDVIGS isolines, including A mode: the interannual variation trend of NDVIGS isolines is positive and the altitudinal gradient is negative (a), and B mode: the interannual variation trend is negative and the altitudinal gradient is positive (b). Downward movement of the NDVIGS isolines, both the interannual variation trend of NDVIGS isolines and the altitudinal gradient are negative (C mode, (c)) or positive (D mode, (d)).
Remotesensing 12 02751 g001
Figure 2. Spatial patterns of the elevational movement of (a) NDVI isolines (V_NDVIGS), (c) temperature isolines (V_TGS), and (e) precipitation isolines (V_PGS), and of the direction of elevational movement of (b) NDVI isolines, (d) temperature isolines, and (f) precipitation isolines during the growing season. A, B, C, and D modes in (b,d,f) has the same indications as defined in Figure 1. The proportion of pixels in each interval is shown at the lower left of each graph.
Remotesensing 12 02751 g002
Figure 3. Dependence upon elevation of the elevational variation rate of NDVIGS isoline (V_NDVIGS, black solid line), TGS isoline (V_TGS, red solid line), and PGS isoline (V_PGS, blue solid line) plotted against elevation.
Remotesensing 12 02751 g003
Figure 4. Distributions of (a) the sensitivity of the NDVIGS isolines elevational movements to temperature (S_NDVIGS_T), (b) the direction of the sensitivity of the NDVI isolines elevational movement to temperature, (c) the sensitivity of NDVIGS isolines elevational movement to precipitation (S_NDVIGS_P), and (d) the direction of the sensitivity of the NDVI isolines elevational movement to precipitation. A, B, C, and D modes in (b,d) are defined in Figure 1. The bar charts in the lower-left corner of each graph show the percentage of pixels in each interval.
Remotesensing 12 02751 g004
Figure 5. (a) The sensitivity of the elevational movement of the NDVIGS isolines to temperature (S_NDVIGS_T, red solid line) plotted along with the elevational variation rate of NDVIGS (V_NDVIGS, black solid line) against the elevation; (b) the sensitivity of the elevational movement of the NDVIGS isolines to precipitation (S_NDVIGS_P, blue solid line) plotted along with the elevational variation rate of NDVIGS (black solid line) against the elevation.
Remotesensing 12 02751 g005
Figure 6. Spatial patterns of elevational variation rate of (a) temperature isolines with a spatial resolution of 0.1 degrees, (b) temperature isolines with a spatial resolution of 1 km, (c) precipitation isolines with a spatial resolution of 0.1 degrees, and (d) precipitation isolines with a spatial resolution of 1 km.
Remotesensing 12 02751 g006
Figure 7. Correlation between the sensitivities of the elevational movements of GIMMS NDVIGS and MODIS NDVIGS to temperature (S_NDVIGS_T and S_MODIS NDVIGS_T) (a) and to precipitation (S_NDVIGS_P and S_MODIS NDVIGS_P) (b). *** indicates the significant correlation at the level of p < 0.001.
Remotesensing 12 02751 g007

