Article

Insar Maps of Land Subsidence and Sea Level Scenarios to Quantify the Flood Inundation Risk in Coastal Cities: The Case of Singapore

1
IDL, Faculdade de Ciências, Universidade Lisboa, 1749-016 Lisboa, Portugal
2
National Technology Centre for Ports, Waterways and Coasts, Chennai 600 036, India
3
Consiglio Nazionale delle Ricerche, Istituto per le Applicazioni del Calcolo; 70126 Bari, Italy
4
Earth Institute, Saint Petersburg State University, 199034 Saint Petersburg, Russia
*
Author to whom correspondence should be addressed.
Remote Sens. 2020, 12(2), 296; https://doi.org/10.3390/rs12020296
Submission received: 14 December 2019 / Revised: 13 January 2020 / Accepted: 14 January 2020 / Published: 16 January 2020
(This article belongs to the Collection Feature Papers for Section Environmental Remote Sensing)

Abstract

:
Global mean sea level rise associated with global warming has a major impact on coastal areas and represents one of the significant natural hazards. The Asia-Pacific region, which has the highest concentration of human population in the world, represents one of the larger areas on Earth being threatened by the rise of sea level. Recent studies indicate a global sea level of 3.2 mm/yr as measured from 20 years of satellite altimetry. The combined effect of sea level rise and local land subsidence, can be overwhelming for coastal areas. The Synthetic Aperture Radar (SAR) interferometry technique is used to process a time series of TerraSAR-X images and estimate the land subsidence in the urban area of Singapore. Interferometric SAR (InSAR) measurements are merged to the Representative Concentration Pathway (RCP) 4.5 and RCP 8.5 sea-level rise scenarios to identify projected inundated areas and provide a map of flood vulnerability. Subsiding rates larger than 5 mm/year are found near the shore on the low flat land, associated to areas recently reclaimed or built. The projected flooded map of Singapore are provided for different sea-level rise scenarios. In this study, we show that local land subsidence can increase the flood vulnerability caused by sea level rise by 2100 projections. This can represent an increase of 25% in the flood area in the central area of Singapore for the RCP4.5 scenario.

Graphical Abstract

1. Introduction

Changes in climate with the associated sea level rise and subsidence of populous coastal cities, have major impacts on the economy, environment, societal and human utilization; and represent one of the most significant natural hazards [1]. The Asia-Pacific region, which has the highest concentration of human population in the world, represents one of the larger areas on Earth being threatened by the rise of sea level [2,3,4].
According to the last results based on the analysis of satellite altimetry over twenty-five years, sea level rise is accelerating and the present-day annual rate of 3 mm/yr could more than triple to 10 mm per year by 2100 [5]. This means that the sea level could rise by 65 cm by the end of the century with a serious impact on coastal cities and low-lying areas. Mean sea level increase also contributes to an intensification in the number and intensity of storms and associated intense rainfall and storm surges with relevant impact on coastal and low-lying areas [6].
Although the mean sea level variation is globally well quantified, locally, sea level rise may vary significantly due to post glacial rebound or tectonic adjustment processes [7,8] as well as the subsidence of the soil associated with compaction of sediments or aquifers [9,10,11]. The phenomenon of subsidence when associated with low-lying coastal regions contributes to the increased risk of flooding associated with rising mean sea level and meteorological storms [12]. Subsidence rate can provide a useful information for the estimation of the local relative sea level rise and contributes to the mapping of vulnerability and flood risk due to the sea level rise.
Presently, the use of space geodetic techniques, such as GPS and Synthetic Aperture Radar (SAR) interferometry, can provide a vast spatial coverage (hundreds of kilometers) of the land surface vertical variability with a high spatial resolution and precision compatible with estimates of sea level variability [13]. Higgins et al., applied interferometric SAR (InSAR) technique to the coast of the Yellow river delta in China and concluded that the subsidence rate was as high as 250 mm/yr, exceeding both local and global sea level rise by nearly 2 orders of magnitude [14]. Time-series analysis methods, namely Persistent Scatterers Interferometry (PSI) [15,16] were developed to address the limitations of InSAR such as atmospheric propagation delay [17,18] and loss of coherence. Chaussard et al., applied the PSI technique to western Indonesia and found a significant subsidence rate up to 22 cm/yr in nine areas, and estimated that Jakarta city will be below the sea level in 20 years [10]. The most likely cause of subsidence observed in Jakarta city is water extraction for industrial and agricultural use. The same cause for subsidence was identified in Bangkok, Thailand, with a subsidence rate up to 20 mm/yr [9]. These studies reveal that coastal land subsidences are generally characterized by a complex pattern of deformation as the result of variable soil characteristics, composition and anthropogenic activities with environmental impact as the ground water withdrawal [19] or soil impervious [11].
Many areas of known subsidence are along the coast such as S. Francisco [20], Venice [21], Alexandria, [13,22] or Jacarta [10,23] and thus exposed to the increasing sea level rise due to climate change. Singapore island, with more than 30% of its territory below the 5 m height, is highly exposed to the increase of sea level rise rate due to global warming. Furthermore, it was shown that some of Singapore’s lowland areas were subsiding in the past with a mean subsidence rate of 2 mm/year and reaching in some areas 6 mm/year [24,25]. Submergence also accelerates coastal erosion because it facilitates greater inland penetration of storm sea waves such as those observed accelerated erosion in East Coast of Singapore. Tkalich et al. have analyzed the sea level trend variability in the Singapore strait using tide gauge records and have concluded that relative sea level trend was 4.1 mm/yr during the period 1993–2009 [26]. The observed trend is similar to the sea level rise of 4.2 mm/yr estimated in Malaysia with tide gauge records for the same period [27] and corresponds to a significant increase relative to the trend of 1.7 mm/yr observed during the past century. Nowadays, the projections for the cumulative sea level rise were revised by the Intergovernmental Panel on Climate Change (IPCC) [28] with considerable increase in the dynamic sea level rise by 42 to 167 cm by 2100, relative to 2000.
The impact of sea level rise in Singapore has been studied in [29]. The authors have analyzed the area of inundated land under three sea level rise scenarios from 2000 to 2100, based on IPCC 2001 projections, and calculated the value of potentially lost market land. In the worst scenario, the area of inundated land is 2.19 squared kilometers in 2100. However, such maps do not incorporate revised trends for sea level rise, or different emission scenarios, neither the relative sea level rise due to local land subsidence.
In this study, we investigate the impact of local land subsidence on the inundation vulnerability in Singapore in view of present day sea level rise. We study how and to what extent land subsidence is likely to increase sea level rise impacts in terms of exposed assets and population. We use the PSI technique to determine the spatial variation in vertical land motion (VLM) along the coast of the Singapore over the past decade, and combine PSI results with CGPS (continuous GPS) observations, to examine the impact of spatially variable VLM on relative sea level trends. TerraSAR-X images acquired between 2011 and 2016 were used to provide updated estimates of subsidence in Singapore island and surroundings.
The paper is organized as follows. Section 2 introduces the study area with geological settings and data, respectively. Data processing is described in Section 3. Results are presented and discussed in Section 4. Finally, a few conclusions are drawn in Section 5.

2. Study Area, Geological Settings and Data

2.1. Geological Settings

Singapore is a city state on the island of Singapore, at the southern tip of the Malay Peninsula, between latitude 1°09′N and 1°28′N and longitude 103°38′E and 104°06′E. Singapore Island and the offshore islands cover an area of about 700 squared km. The climate is hot and humid, with annual precipitation ranging from 1600 mm in the southwest to 2500 mm in the central regions. Under these conditions, the vegetation is dense covering most of the central part of the island and the rocks are deeply weathered. The drainage has shaped the topography with rivers of low gradient and the relief is moderately low with the highest point with 166 m. Most of Singapore is below 50 m [30].
The island can be divided into four main geological units: (a) igneous rocks in the north and central north; (b) sedimentary rocks in the west and southwest; (c) the quaternary deposits of the former alluvium in the east; and d) recent deposits of the Kallang Formation distributed throughout the island [30,31]. In the scope of this study, the most relevant geologic structure is the Kallang formation due to the recent formation and dominance on the lowlands, river courses and on the coast. Marine clay and peaty soil are the two most distinct soft deposits of the Kallang Formation. Soft marine clays are often encountered in the downtown and the Central Business District, the eastern part of Singapore, and along the coastal area where many infrastructures have been built or will be built in the near future. As such, the properties of marine clays are of most interest and have been studied in the past by a number of researchers (e.g., [32,33]). Soft marine clays are very sensitive to changes in the stress system, moisture content and system chemistry of the pore fluid. The maximum reported thickness so far is 55 m for a reclamation site off Pulau Tekong [30]. The reclaimed areas are usually sand over existing geological material which in most places is marine clay. The landfill of sand is not consolidated and its depth is usually between 10 and 20 m.

2.2. Data

This section provides a short description of data used in this study.

2.2.1. Digital Terrain Model for Singapore

A photogrammetric Digital Terrain Model (DTM) of Singapore island, named SingDTM, was used for the processing of InSAR data. The SingDTM has a planimetric resolution of 1 meter [34], and it is referred to the Singapore Height Datum (SHD) defined in 2009 after a readjustment of the levelling network in 2009. The SHD origin is set to the mean sea level determined at Victoria Dock tide gauge 1935–1937. The projected coordinates are referred to the Singapore cartographic coordinate system and the geodetic datum is WGS84. Figure 1 displays the SingDTM with overlaid five GPS permanents stations belonging to the SiReNT network. The relief is generally smooth with a maximum height of 165 m a.s.l., at the centre of the island. The model accuracy was assessed by comparison with ellipsoidal heights measured by GPS at 4779 sample points, well distributed over the Singapore area. The RMSE for the whole DTM came out to be 0.35 m [34]. The definition of a high-water mark (HWM) is a key point in a study assessing the flood inundation risk. The Singapore HWM, obtained as average of all high waters observed over a period of 2 years, is of 0.96 m referred to SHD (2.55 m referred to the Almiralty Chart Datum).
SingDTM was converted to geodetic coordinates, resampled to a grid of 10 m and complemented with SRTM DTM in the outer area of Singapore. The orthometric heights, referred to the SHD, were converted to ellipsoidal heights using EGM08 geopotential model from NASA/JPL. The resulting model, named SingDTM-SRTM, covers a larger area including Singapore, the southern Malaysia and some Indonesian islands. The SRTM global model available for these areas has a spatial resolution of about 90 m and a 16 m vertical accuracy.

2.2.2. Sar Data

A set of 49 VV-polarized TerraSAR-X images acquired from 2011 to 2016 along the descending pass (track 009) was used. Images have a view angle of 32 degree, nominal azimuth and range resolutions of 3 m, and cover the whole island of Singapore, except a small area in the western and the southern of the island (see Figure 1).
Interferograms were generated using the SAR image acquired on the 24 April 2014 as reference (master image) to minimize both the temporal and perpendicular baselines of the whole InSAR time series. The diagram in Figure 2 summarizes the temporal and perpendicular baselines of the interferometric dataset, the master image is displayed as a red star.

3. Data Processing

This section describes a new methodology to customize the Persistent Scatterers (PS) processing of time series of X-band SAR images over urban areas, characterized by a high density of skyscrapers and tall buildings. The use of X-band SAR images is preferred to measure displacements in urban areas because of their higher spatial resolution and precision in the displacement measurement [35]. The main limitations of PS technique when applied to study displacements in urban areas having the above characteristics, are the multipath of electromagnetic waves resulting in excess path and erroneous displacement rate measurements [36]. Besides, if the digital terrain model is referred to the ground surface and do not represent the elevation of man-made structures (buildings and infrastructures), the PS’ on the building facades are likely to be erroneously geolocated over other structures or on the ground [37]. It is important to stress that the deformation estimated for such reflectors is the result of the movement of these surfaces and may result in misinterpretation of the deformation. Such PS’ may reflect two problems: incorrect geolocation and overestimated surface deformation. Recently, an approach based on the use of generic urban models has been proposed [38]. However, the applicability of this approach is quite limited and expensive when based on a laser scanning Digital Surface Model (DSM) of the city. Here we describe a new iterative technique that avoid the use of external DSM models to both correctly link PS to the correct urban targets and provide more accurate estimates of target displacements. Figure 3a shows the sketch of SAR acquisition geometry in urban areas. The point A on the top of the building is at the same range distance from the satellite of point A’ on the ground and so they cannot be distinguished. This is the well know layover effect, that impacts also on the PS processing as targets on the building façade seem to be located on the ground close to the building. Figure 3a displays this effect. PS’ linked to targets on the building appear to be distributed on the ground within a patch of size ds in range direction given by [39]:
d s = d H sin θ
where θ is the local incidence angle and d H is the building height. The location error resulting from the lack of information to distinguish buildings and ground surface in DTM models can be up to hundreds of meters in case of very tall buildings. In the case of Singapore, some areas have buildings with more than 290 m so that location errors of PS’ up to 390 m are expected. The corrected geolocation is given in terms of the satellite heading ( α ) and the distance ds:
{ M = M 0 + d s × sin R P = P 0 + d s × cos R
where R   = ( α   +   π 2 ) 2 π , and M0 and P0 are the initial pixel cartographic coordinates, easting and northing respectively.
This introduces an error in linking a PS to the corresponding target. For instance, Figure 4a shows a detail of the displacement map as obtained by the PS processing. It is evident a spreading of PS’ in the right direction The correct location of PS’, displayed in Figure 4b, can correctly link PS’ to targets on the building.
These results have been obtained using the following iterative algorithm to correct the geolocation error of the PS, based on the PS processing and without relying on an external DSM of the city. At a first step, PS candidates are found following the standard PS processing [40]. The interferometric phase of PS candidates with coordinates (x, y) in the k-th interferogram has the following five main contribution [16]: the ϕ d i s p ,   the phase change due to the pixel displacement along the satellite Line of Sight (LoS) direction, the ϕ α , the phase due to the difference in atmospheric delays between satellite passes, the ϕ o r b ,   the residual phase due to satellite orbit inaccuracies and the ϕ d t m ,   the residual phase due to DTM errors (or, equivalently, the residual phase due to look angle view) and n is the noise. Assuming that the atmospheric phase delay difference between two nearby pixels (within 1 ÷ 2 km) is negligible, the phase difference between these two pixels can be written as a function of the relative height h ( x , y ) and displacement d errors as [41]:
ϕ ( x , y ) k = β ( x , y ) k · h ( x , y ) 4 π λ T k · d ( x , y )
where β ( x , y )   k is a parameter depending on the perpendicular baseline and Tk is the temporal baseline between the master and the kth image. The problem is that the estimation of the parameters from the observed wrapped phase image is a non linear inversion problem that cannot be solved by direct inversion. The absolute value of the complex ensemble coherence γ is used as a cost function and a search through the solution space must be performed [41]:
γ =   1 K exp ( ϕ ( x , y ) k ( β ( x , y ) k · h ( x , y ) 4 π λ T k · d ( x , y ) ) )
Pixels with an estimated ensemble coherence below a certain threshold, e.g., less than 0.75, are discarded. The number of pixels that finally can be used, is in the order of a few hundred points per squared kilometer and are the selected PS where displacement measurement is provide. Several parameters may influence the estimated deformation rate along the LoS direction. In the first step, it is assumed that there is no deformation and the DTM error is estimated for each PS. For this, the displacement rate was considered zero in Equation (5) and the DTM error domain was increased to a large value (p.e. 100 m). The estimated DTM error is used to geolocate the PS using Equation (2). In a second step, the displacement rate of the PS’, with improved geolocation, is estimated by constraining the solution to have an error of DTM and displacement rate of 10 m and 10 m/yr, respectively. The results of this procedure are shown in Figure 4 where it is clear that PS’ spread around the buildings after the PSI processing, are correctly linked to the building they refer to after the correction.
The estimated height of the PS’ is a good indicator of the overall quality. Large errors on the estimated height are possibly associated to large errors on other estimated quantities displacement rate and propagation delay in atmosphere. The estimated heights were compared to the DTM and residuals larger than 6 m (2σ) were eliminated. The STAMPS software [16] was used to identify PS’ and the Kampes approach [41] for the fine estimation of the DSM error and displacement. This is a key step in the proposed methodology to correct the artifacts due to the presence of tall building in the study area. In fact, the DTM information was used in the interferometric processing and this means that the phase error due to neglecting buildings has to be corrected. As a co-product of the iterative correction of geolocation error, the interferometric phase at PS’ is corrected for the phase contribution due to the height error in DTM and so a more accurate estimate of displacements at PS’ is obtained.
The second part of the proposed processing methodology focus on a way to derive the subsidence information from LoS displacements. The subsidence rates were obtained by the LoS displacement measurements by merging PS estimates of LoS displacements rates and 3D velocity vectors provided by a network of GNSS receivers [42]. We used the GNSS station at the National Singapore University (NUS), the available IGS (International GNSS service) station and 4 GNSS stations from the SireNet (Singapore GNSS network) (see Figure 1 for the location of all the stations). The velocity for NUS was provided by SOPAC (Scripps Orbit and Permanent Array Center) and is −1.0 mm/yr. Sirenet GNSS stations were processed for the period 2005–2007 and the mean rate was found to be −1.2 mm/yr [11]. Singapore is tectonically stable with a subsidence rate which did not changed significantly in the last decade.
For each GPS station we selected the PS’ within a radius of 200 m and compute the mean and standard deviation of the difference. We found a relatively small negative bias (mean of the difference) and a standard deviation around 1 mm/yr. After the integration, the bias was completely removed from PS data, leaving unchanged their dispersion. This means that the original data are free of long wavelength errors and suffers only of a bias problem. The accuracy of PS’ vertical displacement rates given by the comparison with GPS vertical velocities is better that 2 mm/yr with a confidence level of 95%. The resulting PS’ vertical displacement rates are unbiased and geo-referenced to ITRF08 which is the reference system used for GPS processing.
The advantage of this synergistic approach is it uses GPS to get long-term stability, good resolution of horizontal motions and broad scale control on rates and patterns of subsidence and InSAR to provide high spatial resolution and high sensitivity to vertical displacement.

4. Results and Discussion

This paragraph describes the results which have been obtained by an advanced PSI processing of TerraSAR-X data based on the methodologies described in Section 3 and the analysis of the resulting accurate measurements of subsidence in terms of subsidence models and sea-level rise scenarios in order to provide maps of the urban areas prone to be flooded in the near future due to the joint effects of subsidence and sea-level rise.

4.1. Subsidence Results

The results obtained from the PSI analysis over the period 2011–2016 are presented in Figure 5. It shows that the overall ground surface is stable, but there are some areas affected by a subsidence rate up to 13.7 mm/yr (e.g., see area within the rectangular box). The mean land displacement rate, relative to the global coordinate reference frame is 1 mm/yr and the standard deviation is 0.93 mm/yr. More than 80% of the PS’ are within one standard deviation and those with a subsidence rate larger than 2 mm/yr are about 5%. The uncertainty of the PS subsidence rates was estimated to be 0.8 mm/yr by considering the standard deviation of the residuals between the PSI and GNSS measurement of subsidence rates (4 GNSS stations were used).
The map of land deformation rate in Figure 5 shows an irregular pattern of uplift and subsidence due to local site disturbances such as the soil consolidation, underground interventions, new infrastructures or land cover change. On the northern part of Singapore, we find a strong subsidence of 9 mm/yr in Puggol Timor Island (see area with the circle A) associated with the consolidation of a sand deposit, and subsidence of 5 mm/yr on the south of Malaysia (Johor city) related with the development of a new urban area (see are within the circle B). The highest subsidence rate (12 mm/yr) is localized at the centre of the island (longitude 103°55′) and it is also associated with the consolidation of a sand deposit. The most critical areas, in view of the exposition to the sea level rise, are the central area of Singapore, Business district, Arab district and the Marine Parade (all within the rectangular box), with relatively high values of subsidence, between 2 mm/yr and 5 mm/yr, low altitude (below 5 m) and short distance to the coastline.

4.2. Subsidence Modelling

Recently, two studies have been published on the study of subsidences in Singapore by SAR interferometry, using ERS-1 (1995–1999) and ALOS-1 and 2 (2010–2012) SAR data [24,25]. Both studies found a subsidence in the central area of Singapore, including the Arab district and Marine Parade, with a rate higher than 2 mm/yr. These results are similar to those we found in this work, even if they have been obtained using different SAR sensors and are referred to previous years. Although the subsidence may vary with time, the aforementioned estimates of subsidence rates in the time intervals 1995–1999 and 2010–2012, the results presented in Figure 5 referring to the time interval 2011–2016, as well as the observation that Singapore is tectonically stable, bring us to conclude that the subsidence rate did not change significantly in the last decade.
In the Arab district the spatial pattern of subsiding PS’ is quite well contained within the boundaries of the district. The subsidence rate of these PS’ is between 2 to 5 mm/yr. This district consists of a dense network of old buildings built along the time. A long process of differential subsidence is clearly visible in buildings characterized by different levels and successive steps built between neighboring houses and the road. This is also an area prone to be flooded due to the flat topography and relative lower altitude with respect to the neighboring roads. As far as the Marine Parade area, the mean subsidence rate is 2.1 mm/yr with a maximum value of 5 mm/yr.
It is interesting to carry out a statistical analysis the displacement rates as a function of the geological units, e.g., as done in case of landslides [43]. As the focus of the paper is to study the impact of subsidence on the inundation vulnerability in view of sea level rise due to global warming, we limit our analysis to geological units close to the coastline. Therefore, the analysis was conducted only on low land areas that are prone to flooding due to sea level rise. These areas are located on the central and east side of Singapore that are highlighted in Figure 5. The following Figure 6 shows the cumulative distribution functions of topographic heights for the geological units of the Singapore (see the legend). The maximum height has been set to 20 m a.s.l.to focus on the areas close to the coastline. We can observe that all reclaimed land and Kallang Formation lay close to the coast, below an altitude of 10 m a.s.l. In particular, for the Kallang Formations we found the following fractions: Kl (100%), Kt (90%) and Ka (87%). As far as the other geological units are concerned, we found the relative fractions lying below 10 m a.s.l. are varying between 30% and 50%.
The corresponding cumulative density function of subsidence rates estimated at PS’ lying in the above geological units are reported in the following Figure 7, we limited our analysis to PS’ lying on the geological units of interest, i.e., the Kallang Formations and the reclaimed lands, almost totally concentrated close to the coastline, below the height of 20 m a.s.l., and the Old Alluvium (OA) which is quite abundant in the Eastern part of the island where the largest subsidence rates were estimated. We set the maximum frequency of cumulative distribution functions to 10%. We observe that if we take the 1-percentile tails we can select PS’ with a subsidence rate higher than 2 mm/yr, so above the dispersion of InSAR measurements, and clearly distinguish the subsidence behaviours of PS’ lying the Kallang Formations, Reclaimed Land and OA.
Figure 8 shows a clear correlation between PS distribution and the geological formation in the Marine Parade area. The main geologic formation in the area is the Kallang Formation, which includes both marine and terrestrial sediment but the most important component is the soft marine clay although other materials are found: loose alluvial muddy sand, loose beach sand, soft peaty and organic mud, and coral. The most important are Littoral member immediate offshore zone and the Alluvial member inside. Both are unconsolidated sediments although weakly consolidate or consolidate beds may be found in the later [30,31]. We observe a correlation between the geologic formations and the subsidence rate. For consolidated materials, the subsidence rate is lower than for unconsolidated materials. This can be observed in Figure 6, within the red rectangle. The displacement rate is changing as a function of the geologic formation. On the Old alluvium (purple) the rate is around 2 mm/yr and on the Kallang formation (orange) it is around 4 mm/yr. The mean height, on this area, is below 5 m, having some parts below mean sea level (Figure 1). The underground water table is close to the surface. The morphologic and geologic characteristics of this area combined with intensive soil waterproofing due manmade constructions favors the soil consolidation. The intensive urbanization has resulted in a vast impervious surface which has reduced the infiltrated water and increased the run-off water. The consequence has been the decrease in water content of a saturated soil without replacement of water by air and the reduction of the volume which has caused the land subsidence. The combined effect of the unconsolidated sediments of the Kallang formation, the low elevation of terrain and the anthropogenic interventions has resulted in a long-term process of consolidation, dating back to two centuries ago during the human settlement in Singapore. We have employed the 1D compaction model based on Terzaghi’s principle of effective stress to investigate the impact of clay thickness and water vertical flow on the present-day rates of compaction. In the calculations we used the coefficient of consolidation due to vertical flow (cv) determined by Sharma et al. [31]. For the Kallang formation we found that rate variations are negligible over the next 80 years for different thickness, within the reported thickness range ([30]) and different degrees of consolidation (from 50% up to 90%). This brings us to assume that the estimated vertical displacement rates and the subsidence patterns in the central area of Singapore are likely to reflect the subsidence rate over a period of many decades, confirming the steady subsidence observed by InSAR in the last decade.
To better understand the effect of the subsidence on the exposure to the sea level rise hazard, the estimated mean subsidence rates were compared with the PS’ height extracted from de DTM. The subsiding areas are concentrated in the lower lands of Singapore corresponding to reclaimed areas or alluvial deposits. Furthermore, the subsiding areas are located on the coast or along the inland water channels. All this emphasizes the increased exposure to the risk of flood for those areas due to the joint effects of subsidence and sea level rise.

4.3. Inundation Scenarios

The extent of inundation due to sea level rise and the combined effect of land subsidence and sea level rise, were assessed considering several projections for sea level rise (SLR) according to different scenarios of global warming and emissions [28]. The considered scenarios are: RCP2.6, RCP4.5 and RCP8.5, that foresee for 2100, at their upper limit with a probability of 67%, the sea level rise of 0.61, 0.71 and 0.83 m, respectively. RCP2.6 scenario corresponds to an emission volume equal to the objectives of the Paris 2015 agreement, while scenario RCP8.5 corresponds to a scenario in which there is no emission reduction. We also consider a scenario in which in the second half of the century Antarctica and Greenland will lose large amounts of ice [44].
These projections are a conservative estimate that does not consider the effects of storms, storm surge, periods of high rainfall that may increase water level and increase flood vulnerability relative to the maps we present in this study. Moreover, it is very likely that during this century sea level rise will increase due ocean warming and loss of mass from glaciers and ice sheets. For RCP8.5 the projections by 2100 for sea level rate is 8 to 16 mm/yr. It is important to notice that more intense rainfall events and weather hurricanes are likely to increase the subsidence rate and may also increase the risk of flooding. The combined effect of land subsidence and sea level rise would increase damages due to further inland storm surge penetration.
The measurements of subsidence rates were interpolated on a regular grid of 10 m collocated with the elevation model (DTM) grid. The interpolation function is the inverse distance weight with a search radius of 20 m. A blank node is assigned if less than 2 pixels are found within the search radius distance. Two inundation scenarios are analyzed, one of which, we consider only the effect of sea level rise and a second in which we consider the joint effect of sea level rise and local land subsidence. The projection of subsidence in 2050 and 2100 was obtained by extrapolating the subsidence value in the period 2011–2016, assuming a linear behaviour in time based on the analysis presented in Section 4.2. According to the model presented in Section 4.2, the subsidence rates are expected to be constant over the next 80 years regardless of the thickness of materials.
In order to calculate the inundation level at each pixel, the sea level rise given by each scenario was assumed, as well as the highest tide recorded in Singapore, the High-Water Mark with a value of 0.986 m [45]. The inundation level of each pixel was computed as the sum of three components: the maximum tide height registered in Singapore (HWM), sea level rise projections for 2100 based on RCP4.5 (0.71 m) and RCP8.5 (0.83 m) and the cumulative subsidence rate in the analyzed period. If the sum of the three components for each pixel is higher than the pixel height then the pixel is prone to be flooded. In this study, only the physical vulnerability of the area was considered and no considerations were made about the economic and social vulnerability [46]. The vulnerability is understood as the extent of damaged area, which can be expected under the present-day conditions of exposure to future scenarios of inundation due to the combined effect of sea level rise and subsidence.
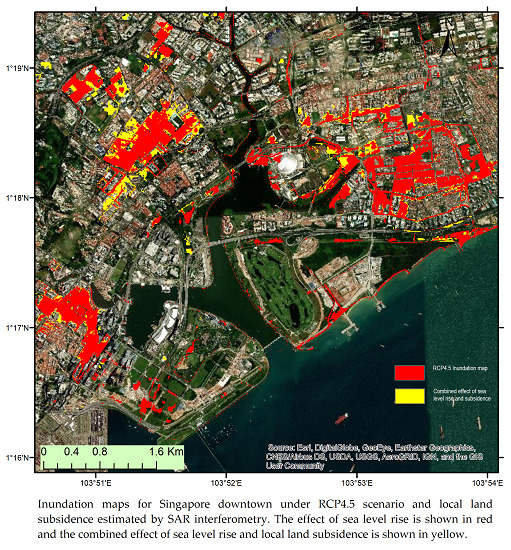
Inundation vulnerability maps due to the combined effect of sea level rise and local land subsidence, according to scenario RCP2.6 and RCP8.5, are presented in Figure 9a,b, respectively. The inundated areas due to sea level rise are represented in red while the areas at risk to be inundated due to the combined effect of subsidence and sea-level rise are presented in yellow.
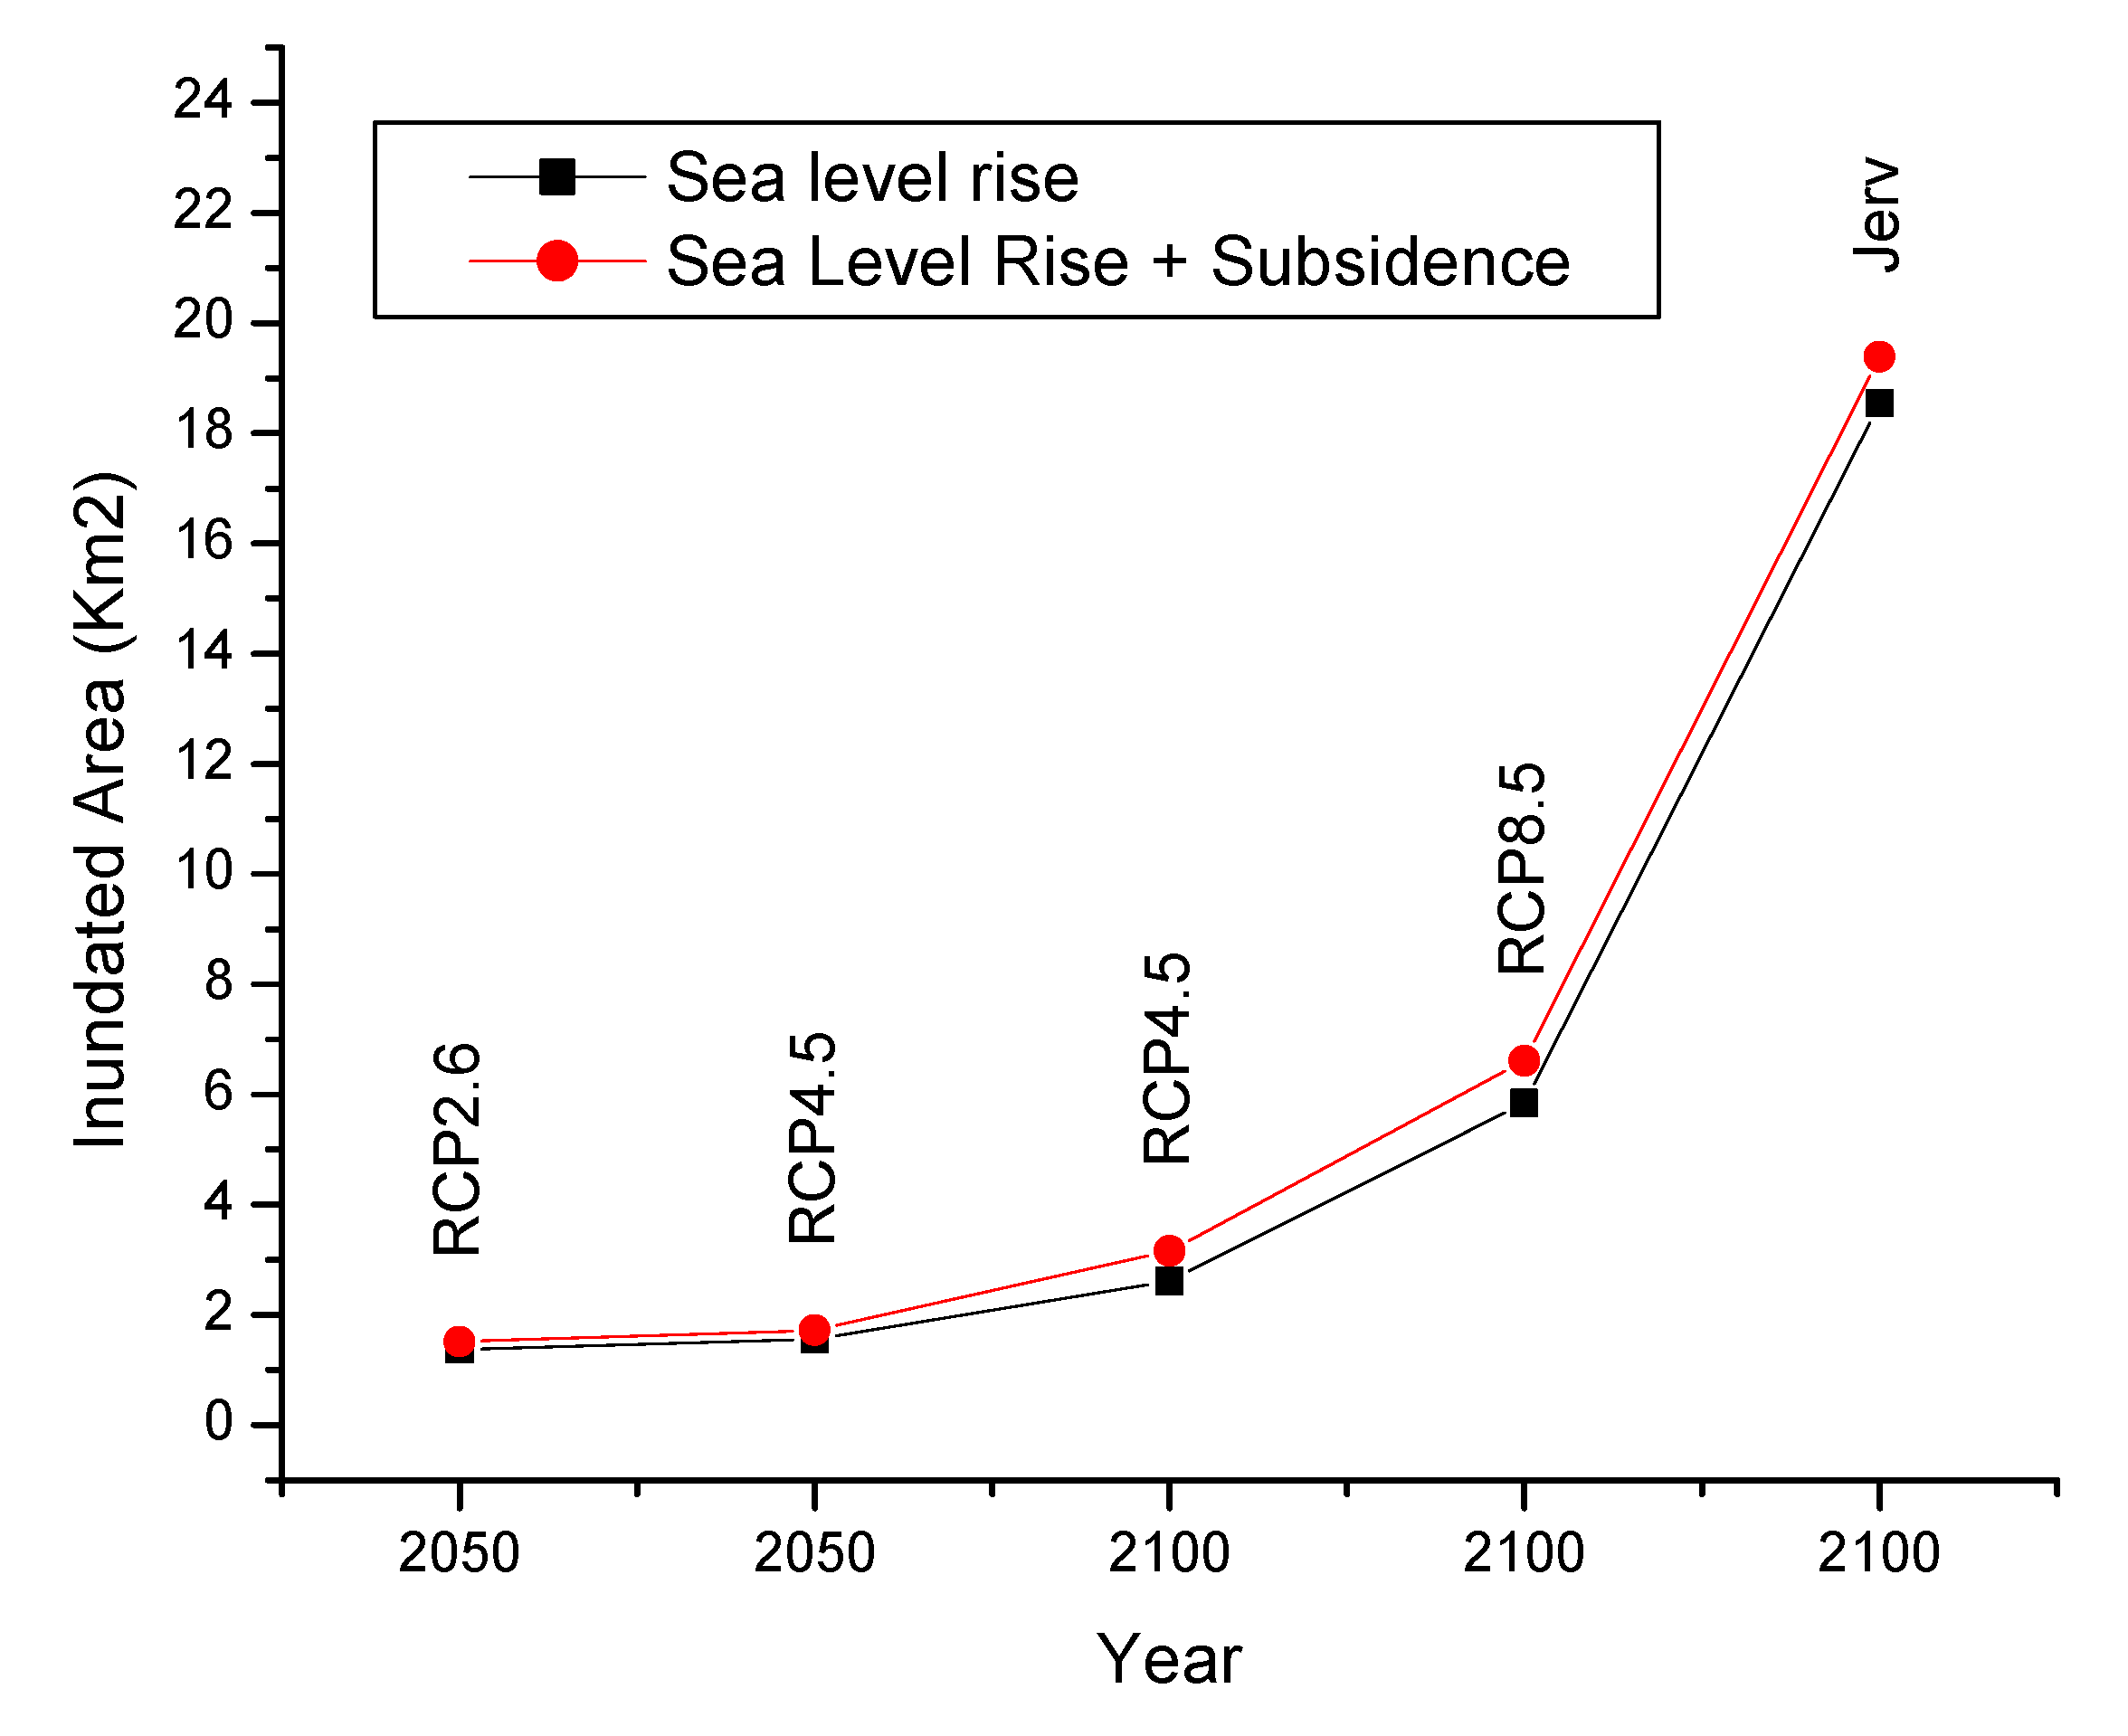
Inundation due only to the rising sea level affects large areas of central Singapore, exposing above and underground infrastructures, as well as some parks and gardens along the canals. The areas with the greatest flood vulnerability coincide to those with the greatest subsidence rates, such as the Marine Parade and the Arabic District. According to the various sea level rise projections we estimate that the affected area in 2100 can vary between 2.61 km2 and 5.84 km2, for RCP4.5 and RCP8.5 scenarios, respectively (Figure 10). For the combined effect of sea level rise and subsidence, the estimated flooded areas are 3.16 and 6.61 km2, for the same two scenarios. These values are two times higher than those presented in [29] for the commercial and business zones. This can be explained partially with the use of different IPCC projections and mainly with the fact that NG and Mendelsohn did not take into consideration the combined effect of sea level rise and land subsidence. This last point is the main reason for the larger extension of areas that we estimate as prone to be flooded.
Figure 10 shows the projected inundated areas for 2050 and 2100, under various RCP scenario, for the central area of Singapore. We verify that there is a significant contribution of local land subsidence to the flood vulnerability starting from 2100 projections, which can represent an increase of 21% of the flooded area for the RCP4.5 scenario. In this scenario, the mean sea level will have in 2100 a value of 0.71 m, in its upper limit, to a probability of 67%. The impact of the subsidence on the inundation area is reduced for higher values of mean sea level rise. This can be explained by the fact that the higher values of subsidence are localized on low land areas below 5 m height. At the upper limit, considering the scenario presented in [44], the affected area in the center of Singapore could reach an extension of 18.55 km2 in 2100. It is worth noting that the vulnerability projections foresee that the inland water flow in the channels is maintained through the existing network of channels. In fact, it is through the network of channels that the innermost areas are flooded.

5. Conclusions

In this work, we presented a study which integrates the estimate of subsidence rates by PSI in Singapore with a simple modelling of soil compaction and different sea-level rise scenarios to provide maps of areas at risk of inundation due to the combined effects of land subsidence and sea-level rise. It has been found that subsidence rates larger than 2 mm/yr are found for PS’ with a height below 5 m are mainly located in areas with a geology characterized by Kallang formation and reclaimed land. This has been explained by the fact that these soils are recent deposits under compaction. It was shown that local land subsidence has increased the flood vulnerability caused by sea level rise in the central area of Singapore. Maps of inundated areas were obtained for RCP4.5 and RCP8.5 sea-level scenario, by using the subsidence rates provided by the PSI analysis. It was found that the extension of the area which would be affected by inundation in 2100 can vary between2.61 km2 and 3.16 km2, for the RCP4.5 scenario and between 5.84 km2 and 6.61 km2 for the RCP8.5 scenario. A methodology for the accurate location of PS’ obtained in urban areas using high-resolution X-band SAR images and estimate of vertical displacement is a further contribution of this paper. It allows to distinguish the subsidence rate of tall buildings and increase the number of independent estimates of subsidence rates, obtained at different time using different spaceborne sensors, so covering longer time intervals. The approach presented in this paper can be applied to other coastal areas and used for mapping the flood vulnerability and inform the policy decisions.

Author Contributions

Conceptualization, J.C. and D.R.; methodology, J.C. and D.R.; software, J.C. and G.N.; investigation, J.C.; writing—original draft preparation, J.C.; writing—review and editing, G.N. and J.C.; funding acquisition: D.R. All authors have read and agreed to the published version of the manuscript.

Funding

This research was developed in the scope of the LandMov project, under a contract research agreement between National University of Singapore (NUS) and Instituto D.Luiz, University of Lisbon (IDL-UL).

Acknowledgments

Authors acknowledge DLR for providing the TerraSAR-X SAR images under project COA-1268, issued on 20 October 2011. We acknowledge Filipe Jeremias from Laboratório Nacional de Engenharia Civil for the insights on consolidation model. We would like also to acknowledge Victor Khoo, Director, Survey & Geomatics Division, Singapore Land Authority, Singapore.

Conflicts of Interest

The authors declare no conflict of interest. The funders had no role in the design of the study; in the collection, analyzes, or interpretation of data; in the writing of the manuscript, or in the decision to publish the results.

References

  1. Bijlsma, L.; Ehler, C.N.; Klein, R.J.T.; Kulshrestha, S.M.; McLean, R.F.; Mimura, N.; Nicholls, R.J.; Nurse, L.A.; Nieto, H.P.; Stakhiv, E.Z.; et al. Coastal Zones and Small Islands. In Climate Change 1995: Impacts, Adaptations and Mitigation of Climate Change: Scientific-Technical Analyses; Watson, R.T., Zinyowera, M.C., Moss, R.H., Eds.; Contribution of Working Group II to the Second Assessment Report of the Intergovernmental Panel on Climate Change; Cambridge University Press: Cambridge, UK, 1995; pp. 289–324. [Google Scholar]
  2. Scussolini, P.; Tran, T.V.T.; Koks, E.; Diaz-Loaiza, A.; Ho, P.L.; Lasage, R. Adaptation to Sea Level Rise: A Multidisciplinary Analysis for Ho Chi Minh City, Vietnam. Water Resour. Res. 2017. [Google Scholar] [CrossRef] [Green Version]
  3. Choblet, G.; Husson, L.; Bodin, T. Probabilistic Surface Reconstruction of Coastal Sea Level Rise during the Twentieth Century. J. Geophys. Res. Solid Earth 2014. [Google Scholar] [CrossRef]
  4. Hsieh, C.S.; Shih, T.Y.; Hu, J.C.; Tung, H.; Huang, M.H.; Angelier, J. Using Differential SAR Interferometry to Map Land Subsidence: A Case Study in the Pingtung Plain of SW Taiwan. Nat. Hazards 2011. [Google Scholar] [CrossRef]
  5. Nerem, R.S.; Beckley, B.D.; Fasullo, J.T.; Hamlington, B.D.; Masters, D.; Mitchum, G.T. Climate-Change–Driven Accelerated Sea-Level Rise Detected in the Altimeter Era. Proc. Natl. Acad. Sci. USA 2018. [Google Scholar] [CrossRef] [PubMed] [Green Version]
  6. Bhatia, K.T.; Vecchi, G.A.; Knutson, T.R.; Murakami, H.; Kossin, J.; Dixon, K.W.; Whitlock, C.E. Recent Increases in Tropical Cyclone Intensification Rates. Nat. Commun. 2019. [Google Scholar] [CrossRef] [PubMed]
  7. Whitehouse, P.L. Glacial Isostatic Adjustment Modelling: Historical Perspectives, Recent Advances, and Future Directions. Earth Surf. Dyn. 2018. [Google Scholar] [CrossRef] [Green Version]
  8. Simons, W.J.F.; Naeije, M.C.; Brown, B.E.; Niemnil, S.; Pradit, S.; Thongtham, N.; Mustafar, M.A.; Towatana, P.; Darnsawasdi, R.; Yucharoen, M.; et al. Vertical Motion of Phuket Island (1994–2018) Due to the Sumatra-Andaman Mega-Thrust Earthquake Cycle: Impact on Sea-Level and Consequences for Coral Reefs. Mar. Geol. 2019. [Google Scholar] [CrossRef]
  9. Aobpaet, A.; Cuenca, M.C.; Hooper, A.; Trisirisatayawong, I. InSAR Time-Series Analysis of Land Subsidence in Bangkok, Thailand. Int. J. Remote Sens. 2013. [Google Scholar] [CrossRef]
  10. Chaussard, E.; Amelung, F.; Abidin, H.; Hong, S.H. Sinking Cities in Indonesia: ALOS PALSAR Detects Rapid Subsidence Due to Groundwater and Gas Extraction. Remote Sens. Environ. 2013. [Google Scholar] [CrossRef]
  11. Catalão, J.; Nico, G.; Lollino, P.; Conde, V.; Lorusso, G.; Silva, C. Integration of InSAR Analysis and Numerical Modeling for the Assessment of Ground Subsidence in the City of Lisbon, Portugal. IEEE J. Sel. Top. Appl. Earth Obs. Remote Sens. 2016, 9. [Google Scholar] [CrossRef]
  12. Ji, T.; Li, G.; Zhang, Y. Observing Storm Surges in China’s Coastal Areas by Integrating Multi-Source Satellite Altimeters. Estuar. Coast. Shelf Sci. 2019. [Google Scholar] [CrossRef]
  13. Wöppelmann, G.; Le Cozannet, G.; De Michele, M.; Raucoules, D.; Cazenave, A.; Garcin, M.; Hanson, S.; Marcos, M.; Santamaría-Gõmez, A. Is Land Subsidence Increasing the Exposure to Sea Level Rise in Alexandria, Egypt? Geophys. Res. Lett. 2013. [Google Scholar] [CrossRef] [Green Version]
  14. Higgins, S.; Overeem, I.; Tanaka, A.; Syvitski, J.P.M. Land Subsidence at Aquaculture Facilities in the Yellow River Delta, China. Geophys. Res. Lett. 2013. [Google Scholar] [CrossRef]
  15. Ferretti, A.; Prati, C.; Rocca, F. Nonlinear Subsidence Rate Estimation Using Permanent Scatterers in Differential SAR Interferometry. IEEE Trans. Geosci. Remote Sens. 2000. [Google Scholar] [CrossRef] [Green Version]
  16. Hooper, A.; Segall, P.; Zebker, H. Persistent Scatterer Interferometric Synthetic Aperture Radar for Crustal Deformation Analysis, with Application to Volcán Alcedo, Galápagos. J. Geophys. Res. Solid Earth 2007. [Google Scholar] [CrossRef] [Green Version]
  17. Nico, G.; Tomé, R.; Catalao, J.; Miranda, P.M.A. On the Use of the WRF Model to Mitigate Tropospheric Phase Delay Effects in SAR Interferograms. IEEE Trans. Geosci. Remote Sens. 2011, 49. [Google Scholar] [CrossRef]
  18. Mateus, P.; Nico, G.; Catalao, J. Uncertainty Assessment of the Estimated Atmospheric Delay Obtained by a Numerical Weather Model (NMW). IEEE Trans. Geosci. Remote Sens. 2015. [Google Scholar] [CrossRef]
  19. Chaussard, E.; Wdowinski, S.; Cabral-Cano, E.; Amelung, F. Land Subsidence in Central Mexico Detected by ALOS InSAR Time-Series. Remote Sens. Environ. 2014. [Google Scholar] [CrossRef]
  20. Shirzaei, M.; Bürgmann, R. Global Climate Change and Local Land Subsidence Exacerbate Inundation Risk to the San Francisco Bay Area. Sci. Adv. 2018. [Google Scholar] [CrossRef] [Green Version]
  21. Tosi, L.; Da Lio, C.; Teatini, P.; Strozzi, T. Land Subsidence in Coastal Environments: Knowledge Advance in the Venice Coastland by TerraSAR-X PSI. Remote Sens. 2018, 10, 1191. [Google Scholar] [CrossRef] [Green Version]
  22. Gaber, A.; Darwish, N.; Koch, M. Minimizing the Residual Topography Effect on Interferograms to Improve DInSAR Results: Estimating Land Subsidence in Port-Said City, Egypt. Remote Sens. 2017, 9, 752. [Google Scholar] [CrossRef] [Green Version]
  23. Ward, P.J.; Marfai, M.A.; Yulianto, F.; Hizbaron, D.R.; Aerts, J.C.J.H. Coastal Inundation and Damage Exposure Estimation: A Case Study for Jakarta. Nat. Hazards 2011. [Google Scholar] [CrossRef] [Green Version]
  24. Catalao, J.; Raju, D.; Fernandes, R.M.S. Mapping Vertical Land Movement in Singapore Using Insar and Gps. ESA Spec. Publ. 2013, 722, 54. [Google Scholar]
  25. Wan, Q.; Liew, S.C.; Kwoh, L.K. Persistent Scatterer InSAR for Ground Deformation Mapping Using ALOS PALSAR Data: A Case Study in Singapore. In Proceedings of the International Geoscience and Remote Sensing Symposium (IGARSS), Quebec City, QC, Canada, 13–18 July 2014. [Google Scholar] [CrossRef]
  26. Tkalich, P.; Vethamony, P.; Luu, Q.H.; Babu, M.T. Sea Level Trend and Variability in the Singapore Strait. Ocean Sci. 2013. [Google Scholar] [CrossRef] [Green Version]
  27. Din, A.H.M.; Zulkifli, N.A.; Hamden, M.H.; Aris, W.A.W. Sea Level Trend over Malaysian Seas from Multi-Mission Satellite Altimetry and Vertical Land Motion Corrected Tidal Data. Adv. Space Res. 2019. [Google Scholar] [CrossRef]
  28. Church, J.A.; Clark, P.U.; Cazenave, A.; Gregory, J.M.; Jevrejeva, S.; Levermann, A.; Merrifield, M.A.; Milne, G.A.; Nerem, R.S.; Nunn, P.D.; et al. 2013: Sea Level Change. In Climate Change 2013: The Physical Science Basis; Stocker, T.F., Qin, D., Plattner, G.-K., Tignor, M., Allen, S.K., Boschung, J., Nauels, A., Xia, Y., Bex, V., Midgley, P.M., et al., Eds.; Contribution of Working Group I to the Fifth Assessment Report of the Intergovernmental Panel on Climate Change; Cambridge University Press: Cambridge, UK; New York, NY, USA, 2013. [Google Scholar]
  29. Ng, W.S.; Mendelsohn, R. The Impact of Sea Level Rise on Singapore. Environ. Dev. Econ. 2005. [Google Scholar] [CrossRef]
  30. Woon, L.K.; Yingxin, Z. Geology of Singapore, 2nd ed.; Defence Science and Technology Agency: Singapore, 2009.
  31. Sharma, J.S.; Chu, J.; Zhao, J. Geological and Geotechnical Features of Singapore: An Overview. Tunn. Undergr. Space Technol. 1999. [Google Scholar] [CrossRef]
  32. Rahardjo, H.; Aung, K.K.; Leong, E.C.; Rezaur, R.B. Characteristics of Residual Soils in Singapore as Formed by Weathering. Eng. Geol. 2004. [Google Scholar] [CrossRef]
  33. Arulrajah, A.; Bo, M.W. Characteristics of Singapore Marine Clay at Changi. Geotech. Geol. Eng. 2008. [Google Scholar] [CrossRef]
  34. Raju, D.K.; Santosh, K.; Chandrasekar, J.; Tiong-Sa, T. Coastline Change Measurement and Generating Risk Map for the Coast Using Geographic Information System. Int. Arch. Photogramm. Remote Sens. Spat. Inf. Sci. 2010, 38, 492–497. [Google Scholar]
  35. Schunert, A.; Soergel, U. Assignment of Persistent Scatterers to Buildings. IEEE Trans. Geosci. Remote Sens. 2016. [Google Scholar] [CrossRef]
  36. Auer, S.; Gernhardt, S.; Bamler, R. Ghost Persistent Scatterers Related to Multiple Signal Reflections. IEEE Geosci. Remote Sens. Lett. 2011. [Google Scholar] [CrossRef] [Green Version]
  37. Crosetto, M.; Monserrat, O.; Barra, A.; Cuevas-González, M.; Krishnakumar, V.; Mróz, M.; Crippa, B. A Persistent Scatterer Interferometry Procedure to Monitor Urban Subsidence. In Proceedings of the International Archives of the Photogrammetry, Remote Sensing and Spatial Information Sciences—ISPRS Archives, Enschede, The Netherlands, 10–14 June 2019. [Google Scholar] [CrossRef] [Green Version]
  38. Yang, M.; Lopez-Dekker, P.; Dheenathayalan, P.; Biljecki, F.; Liao, M.; Hanssen, R.F. Linking Persistent Scatterers to the Built Environment Using Ray Tracing on Urban Models. IEEE Trans. Geosci. Remote Sens. 2019. [Google Scholar] [CrossRef]
  39. Gernhardt, S.; Bamler, R. Deformation Monitoring of Single Buildings Using Meter-Resolution SAR Data in PSI. ISPRS J. Photogramm. Remote Sens. 2012. [Google Scholar] [CrossRef]
  40. Crosetto, M.; Monserrat, O.; Cuevas-González, M.; Devanthéry, N.; Crippa, B. Persistent Scatterer Interferometry: A Review. ISPRS J. Photogramm. Remote Sens. 2016. [Google Scholar] [CrossRef] [Green Version]
  41. Kampes, B.M. Radar Interferometry: Persistent Scatterer Technique; Springer: Berlin/Heidelberg, Germany, 2006. [Google Scholar] [CrossRef]
  42. Catalão, J.; Nico, G.; Hanssen, R.; Catita, C. Merging GPS and Atmospherically Corrected InSAR Data to Map 3-D Terrain Displacement Velocity. IEEE Trans. Geosci. Remote Sens. 2011, 49. [Google Scholar] [CrossRef] [Green Version]
  43. Nico, G.; Oliveira, S.C.; Catalão, J.; Zêzere, J.L. Generation of Persistent Scatterers in Non-Urban Areas: The Role of Microwave Scattering Parameters. Geosciences 2018, 8, 269. [Google Scholar] [CrossRef] [Green Version]
  44. Jevrejeva, S.; Grinsted, A.; Moore, J.C. Upper Limit for Sea Level Projections by 2100. Environ. Res. Lett. 2014. [Google Scholar] [CrossRef] [Green Version]
  45. Khoo, V. Land Survey Division, S. land A. Height Datum & Height Determination Using GNSS in Singapore. In FIG, Technical Seminar on Vertical References Frame in Practice; FIG: Singapore, 2015. [Google Scholar]
  46. Balica, S.F.; Wright, N.G.; van der Meulen, F. A Flood Vulnerability Index for Coastal Cities and Its Use in Assessing Climate Change Impacts. Nat. Hazards 2012. [Google Scholar] [CrossRef] [Green Version]
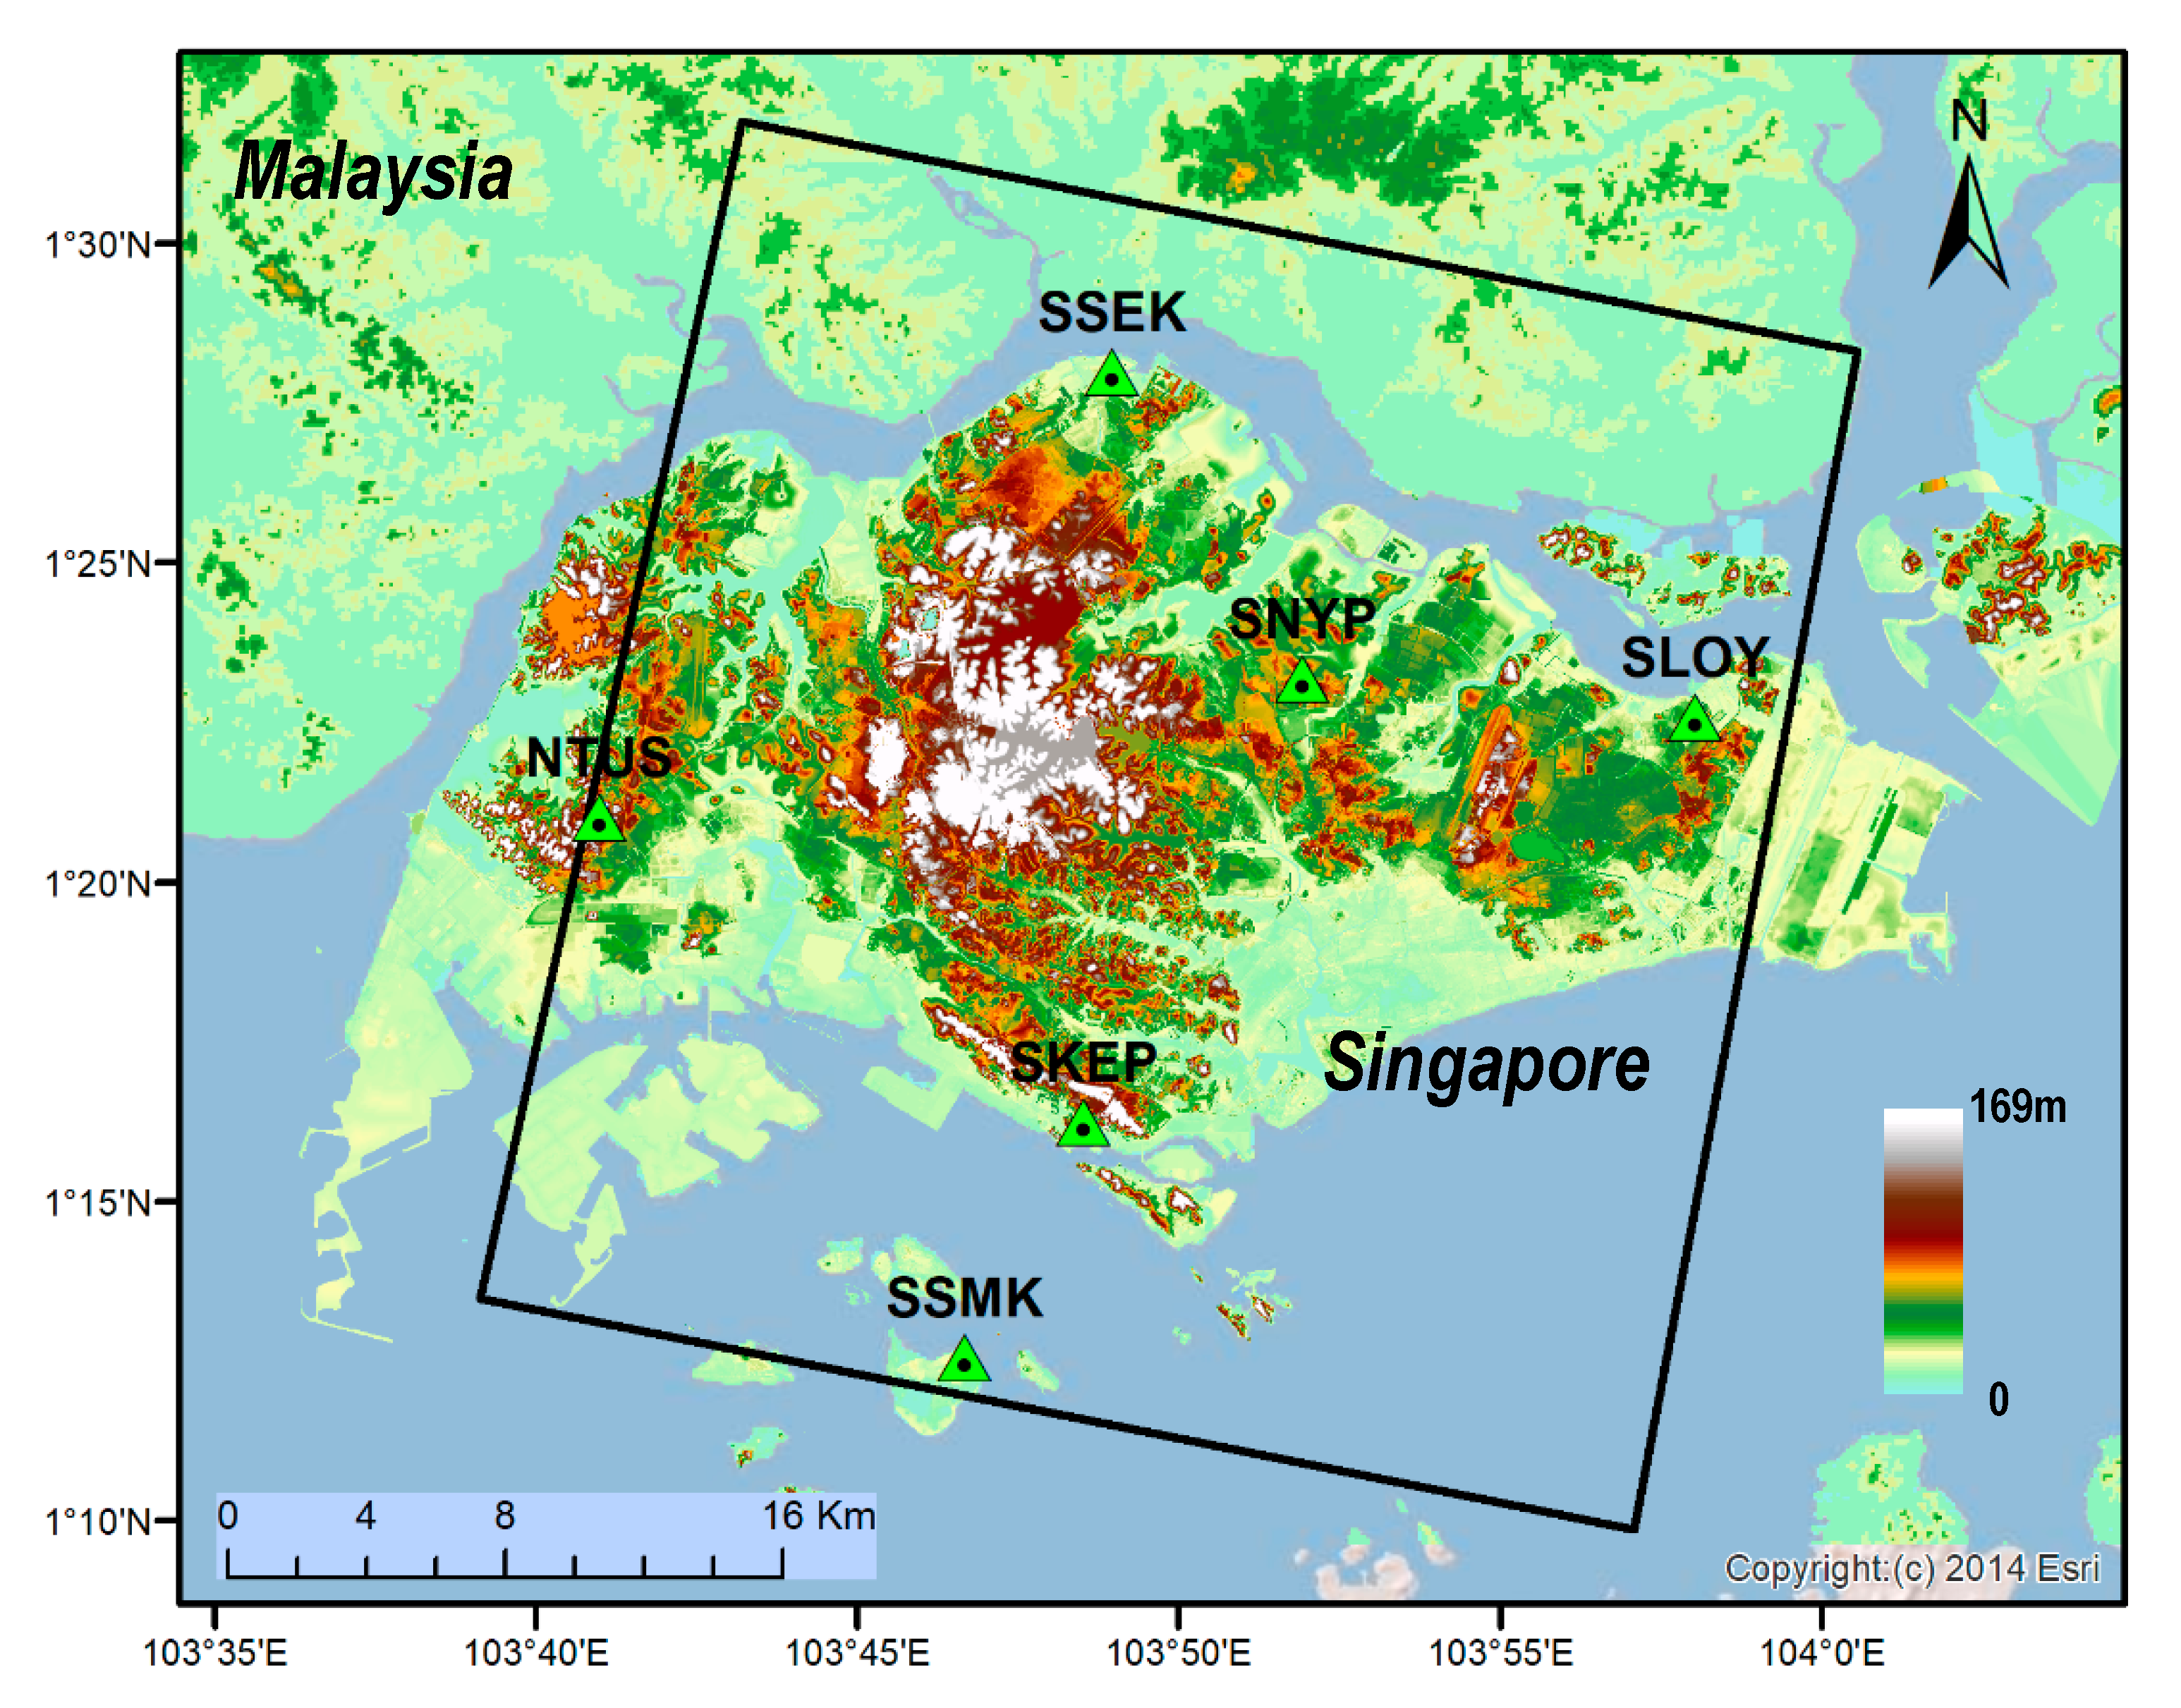
Figure 1. Footprint of TSX SAR images and the SiReNT GNSS permanent stations (green triangles) used for the vertical land displacement calibration and validation. The background is the digital terrain model hypsometric map (SingDTM-SRTM) with 10 m spatial resolution.
Remotesensing 12 00296 g001
Figure 2. Temporal and perpendicular baselines of TerraSAR-X images. The red star denotes the image acquired on 24 April 2014 used as master image.
Remotesensing 12 00296 g002
Figure 3. (a) SAR acquisition geometry of a building and (b) planimetric view of the geolocation error.
Remotesensing 12 00296 g003
Figure 4. Geolocation of the Persistent Scatterers: (a) original position, (b) corrected position. Displacement rates in mm·yr−1.
Remotesensing 12 00296 g004
Figure 5. Local land deformation rate between 2011 and 2016 estimated by PSI. Negative rates are referred to subsidence. Deformation rate in mm/yr.
Remotesensing 12 00296 g005
Figure 6. Cumulative distribution functions of topographic heights for the geological units of the Singapore island. The maximum height has been set to 20 m a.s.l.to focus on the areas close to the coastline.
Remotesensing 12 00296 g006
Figure 7. Detail of cumulative distribution functions of subsidence rate at PS’ located on Kallang Formations, Reclaimed Lands and Old Alluvium (OA) for frequencies below 10%.
Remotesensing 12 00296 g007
Figure 8. (left panel) Stratigraphy of marine Parade overlaid with persistent scatterers. Orange: Kallang formation (Ka); Purple: Old Alluvium (OA); yellow: reclaimed; Green: Juron Formation (Jt), Dark purple: Granite (BTgdt). Red dots are persistent scatterers with deformation rate between 2 and 5 mm/yr. Details of the area within the red rectangle are shown in right panel.
Remotesensing 12 00296 g008
Figure 9. Inundation maps for Singapore downtown under two RCPs scenarios and local land subsidence estimated by SAR interferometry. The effect of sea level rise is shown in red and the combined effect of sea level rise and local land subsidence is shown in yellow. (a) Inundated area under RCP4.5 projection and (b) inundation area under RCP8.5 projection.
Remotesensing 12 00296 g009
Figure 10. Projected inundated area under different RCP scenarios.
Remotesensing 12 00296 g010