1. Introduction
Dramatic changes have occurred in many wetland ecosystems in the previous decades and have been attributed to the influence of climatic changes and human activities [
1]. Research demonstrated that wetland conversion and loss on the global scale has exceeded 50% since 1990 [
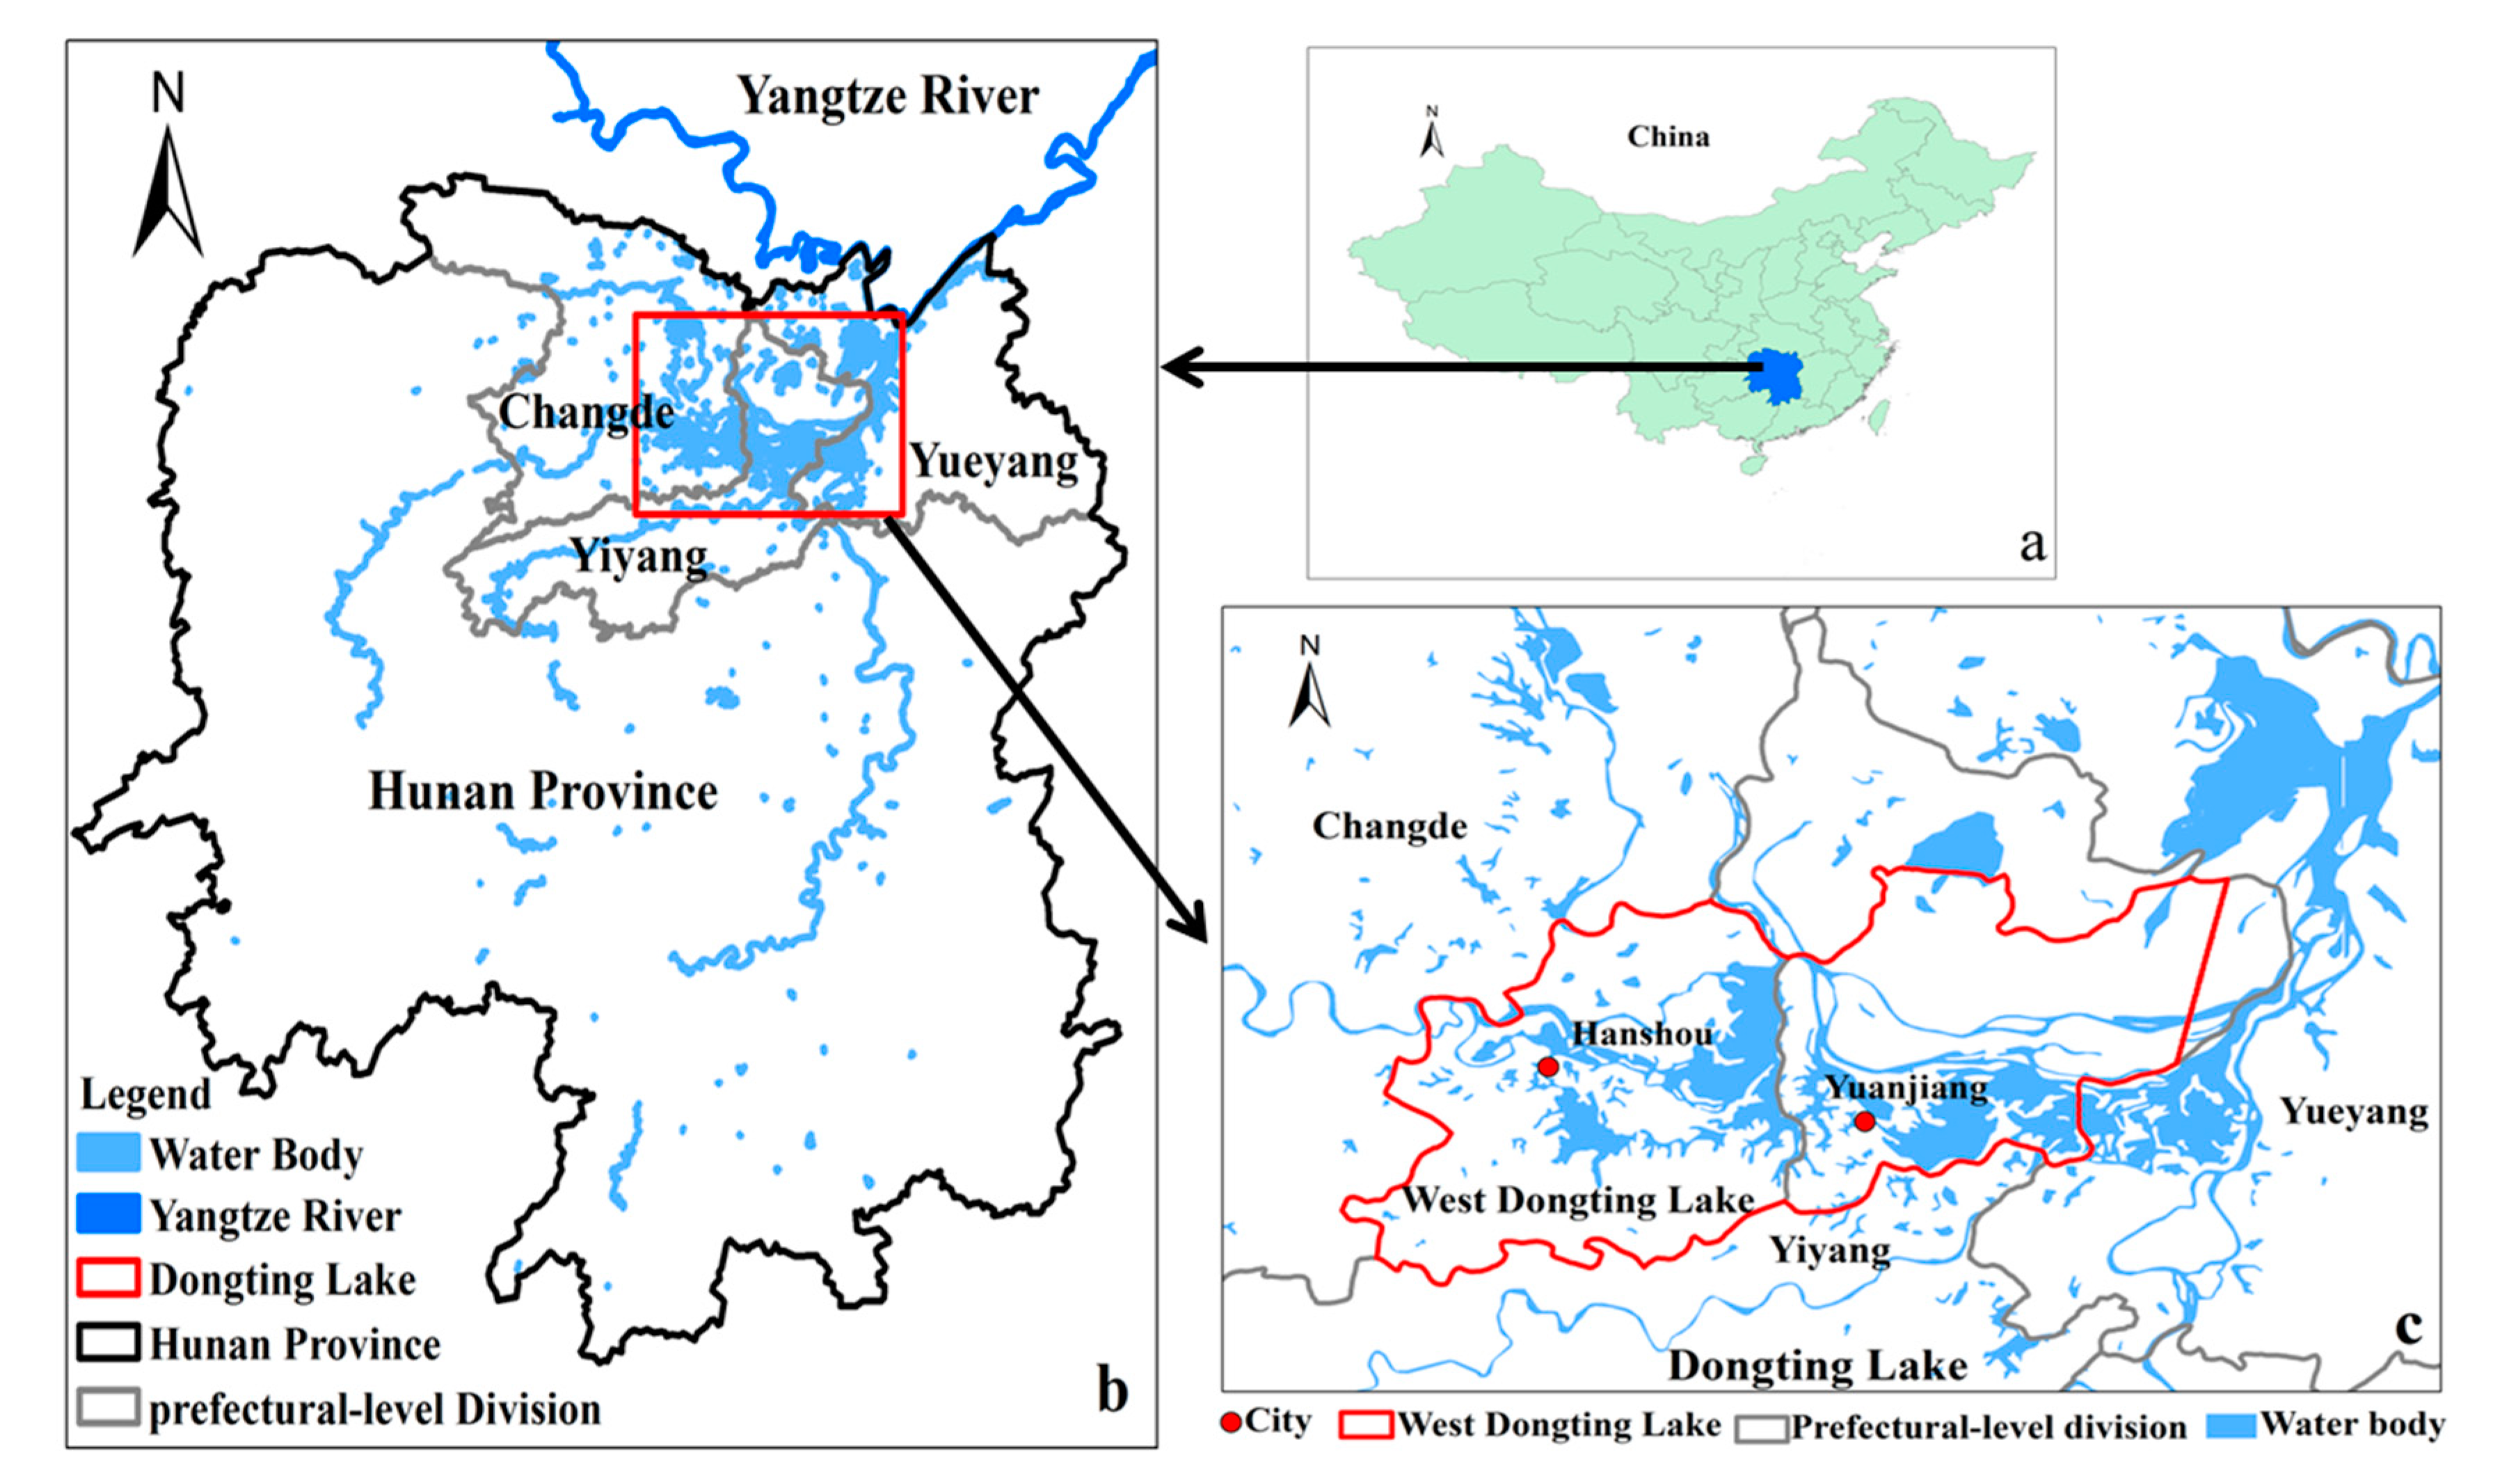
2]. As the second largest freshwater lake in China, Dongting Lake is also one of the important wetland ecosystems. However, the land cover changes, such as land reclamation for developing agriculture and industry, and rapid urbanization have significantly threatened the ecological security of Dongting Lake wetland [
3]. With the drop in grain prices and profitable papermaking, a variety of land cover categories, such as paddy fields and bottomland, especially water body, have been transformed to plant the economic forests (i.e.,
Populus euramericana) for papermaking since the late 1990s. A large number of
Populus plantations have accelerated the desiccation of wetland [
4], resulting in a decrease of the wetland area [
5,
6,
7]. This situation leads to the death of wetland vegetation [
8]; induces biodiversity loss [
7]; and influences the community composition [
4], structure [
7] and function [
4] of the wetland ecosystem. Therefore, accurately detecting the land cover changes related to forests and then monitoring spatiotemporal dynamics of forests in the Dongting Lake region are critical for protecting wetland ecosystems.
With the accessibility and accumulation of remotely sensed images on the spatiotemporal scale, remote sensing is a valid alternative for monitoring ecosystem changes. For monitoring spatiotemporal dynamics of forests in the Dongting Lake region with remote sensing, there are the following questions need to be answered: (1) how to accurately detect land cover change? (2) how to acquire the process information of ecosystem change, including land cover change, not just the final results? (3) how to distinguish land cover change from other change types? and (4) how to get the detailed “from what, to what” information on the premise that the land cover change has been identified?
The early common methods, which are quite simple and straightforward, include image differencing, principal component analysis, tasseled cap transform, post-classification comparison, and change vector analysis [
9,
10,
11]. The ideas of these methods are that the changes are generally detected through comparing the difference between the images in two different time phases. Nevertheless, the accuracy of change detection using these methods is dependent on the set threshold [
11,
12], the availability of ideal images in the same season or the classification accuracy of two images. Another disadvantage of these methods is that the changes are generally detected through comparing the difference between the images in two different time phases without considering the context information in the time dimension, lacking change law and process research [
13,
14]. Therefore, these methods based on two-temporal images cannot answer questions 1 and 2.
Thus, some change-detection methods based on change trajectories of time series, including Vegetation Change Tracker and Landtrendr, have been developed for studying the change law and process [
15,
16] and have been widely used for forest disturbances and regrowth monitoring and land cover change detection [
17,
18,
19]. For example, Griffiths et al. employed the LandTrendr and an annual Landsat time series to derive annual forest disturbance maps along with recovery dynamics for answering the question of how the drastic institutional and socio-economic transformation after the collapse of socialism in Romania affected forestry [
17]. Kennedy et al. utilized the LandTrendr to detect change and then employed the random forest (RF) classifier (RFC) to label agents of change including urbanization, forest management, and natural change for monitoring habitat in the Puget Sound region, USA [
18]. The frequency of time series within these methods is typically one image per year in the same season to minimize seasonal variation and sun angle differences. However, these methods developed at yearly resolution have failed in accurately capturing the timing of the change at the sub-annual scale. This situation results in the detected timing delay of land cover change. Therefore, the optimal result that these methods could provide is generally annual or biennial change [
20,
21]. Similarly, these methods based on multi-temporal images also cannot answer question 2.
Only the time series with high frequency (e.g., monthly) could describe the entire process of land cover change over shorter time intervals because of the abrupt characteristic of land cover change. Therefore, only change detection with dense satellite time series indeed satisfies the requirement of dynamic monitoring of land cover change [
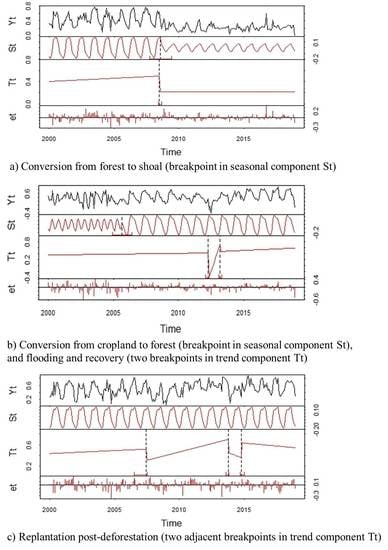
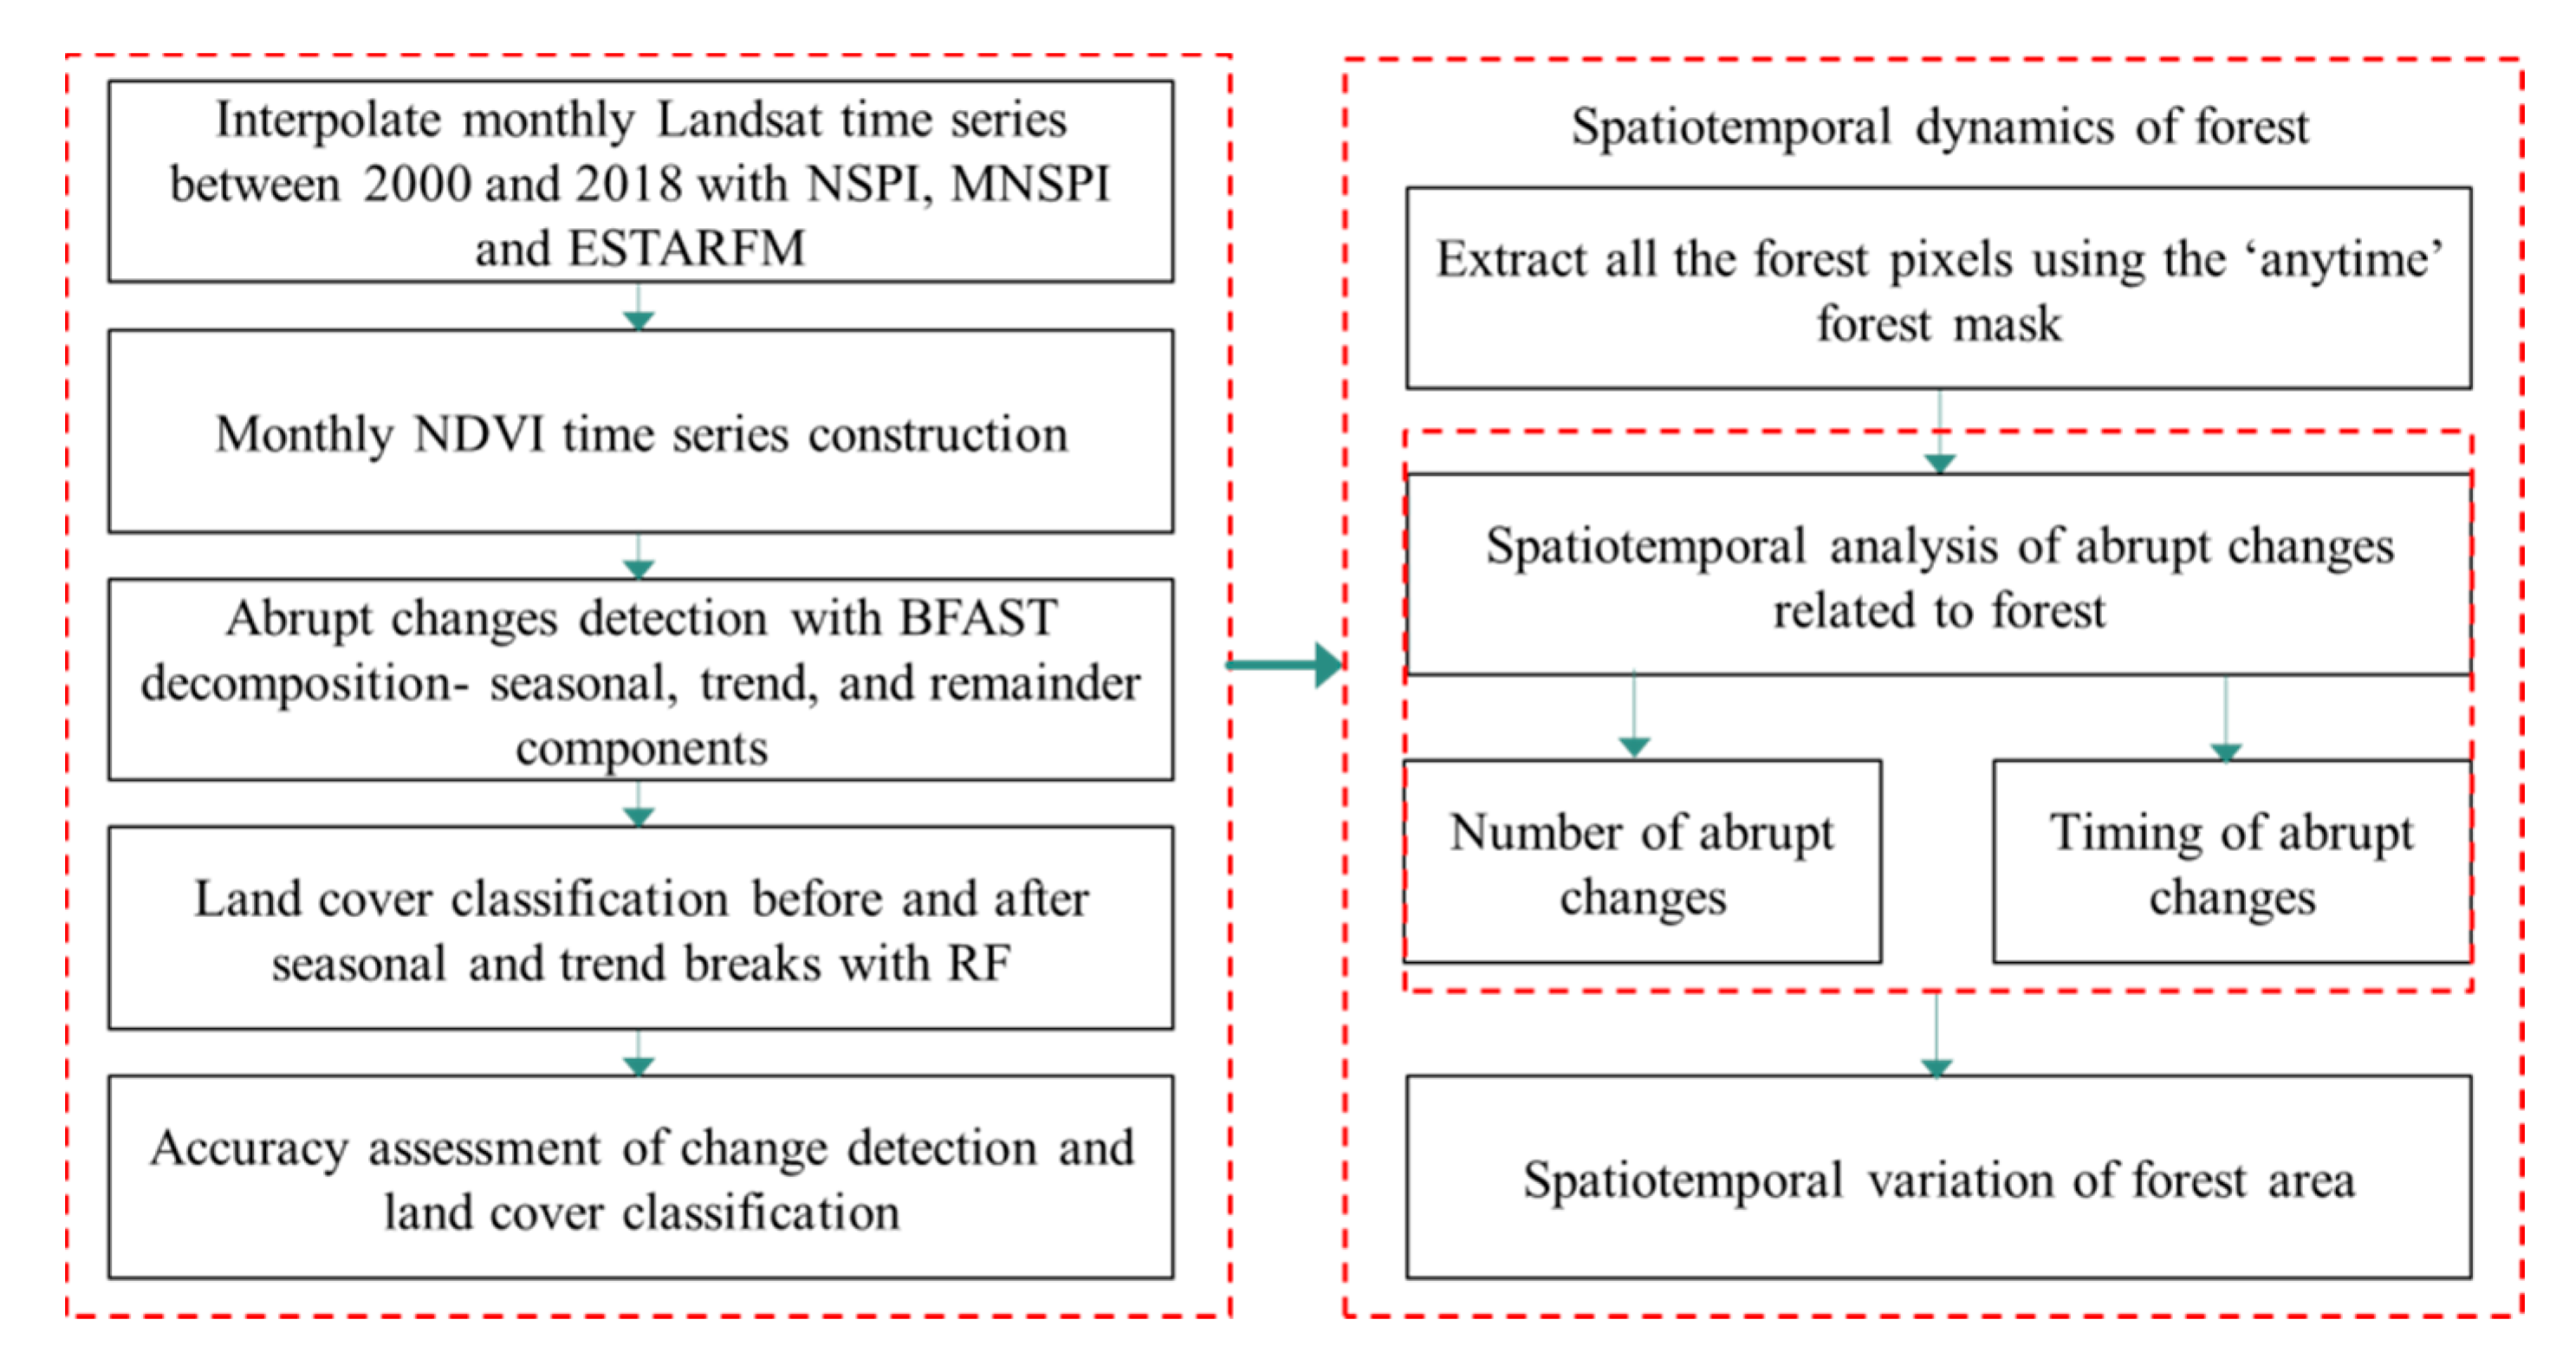
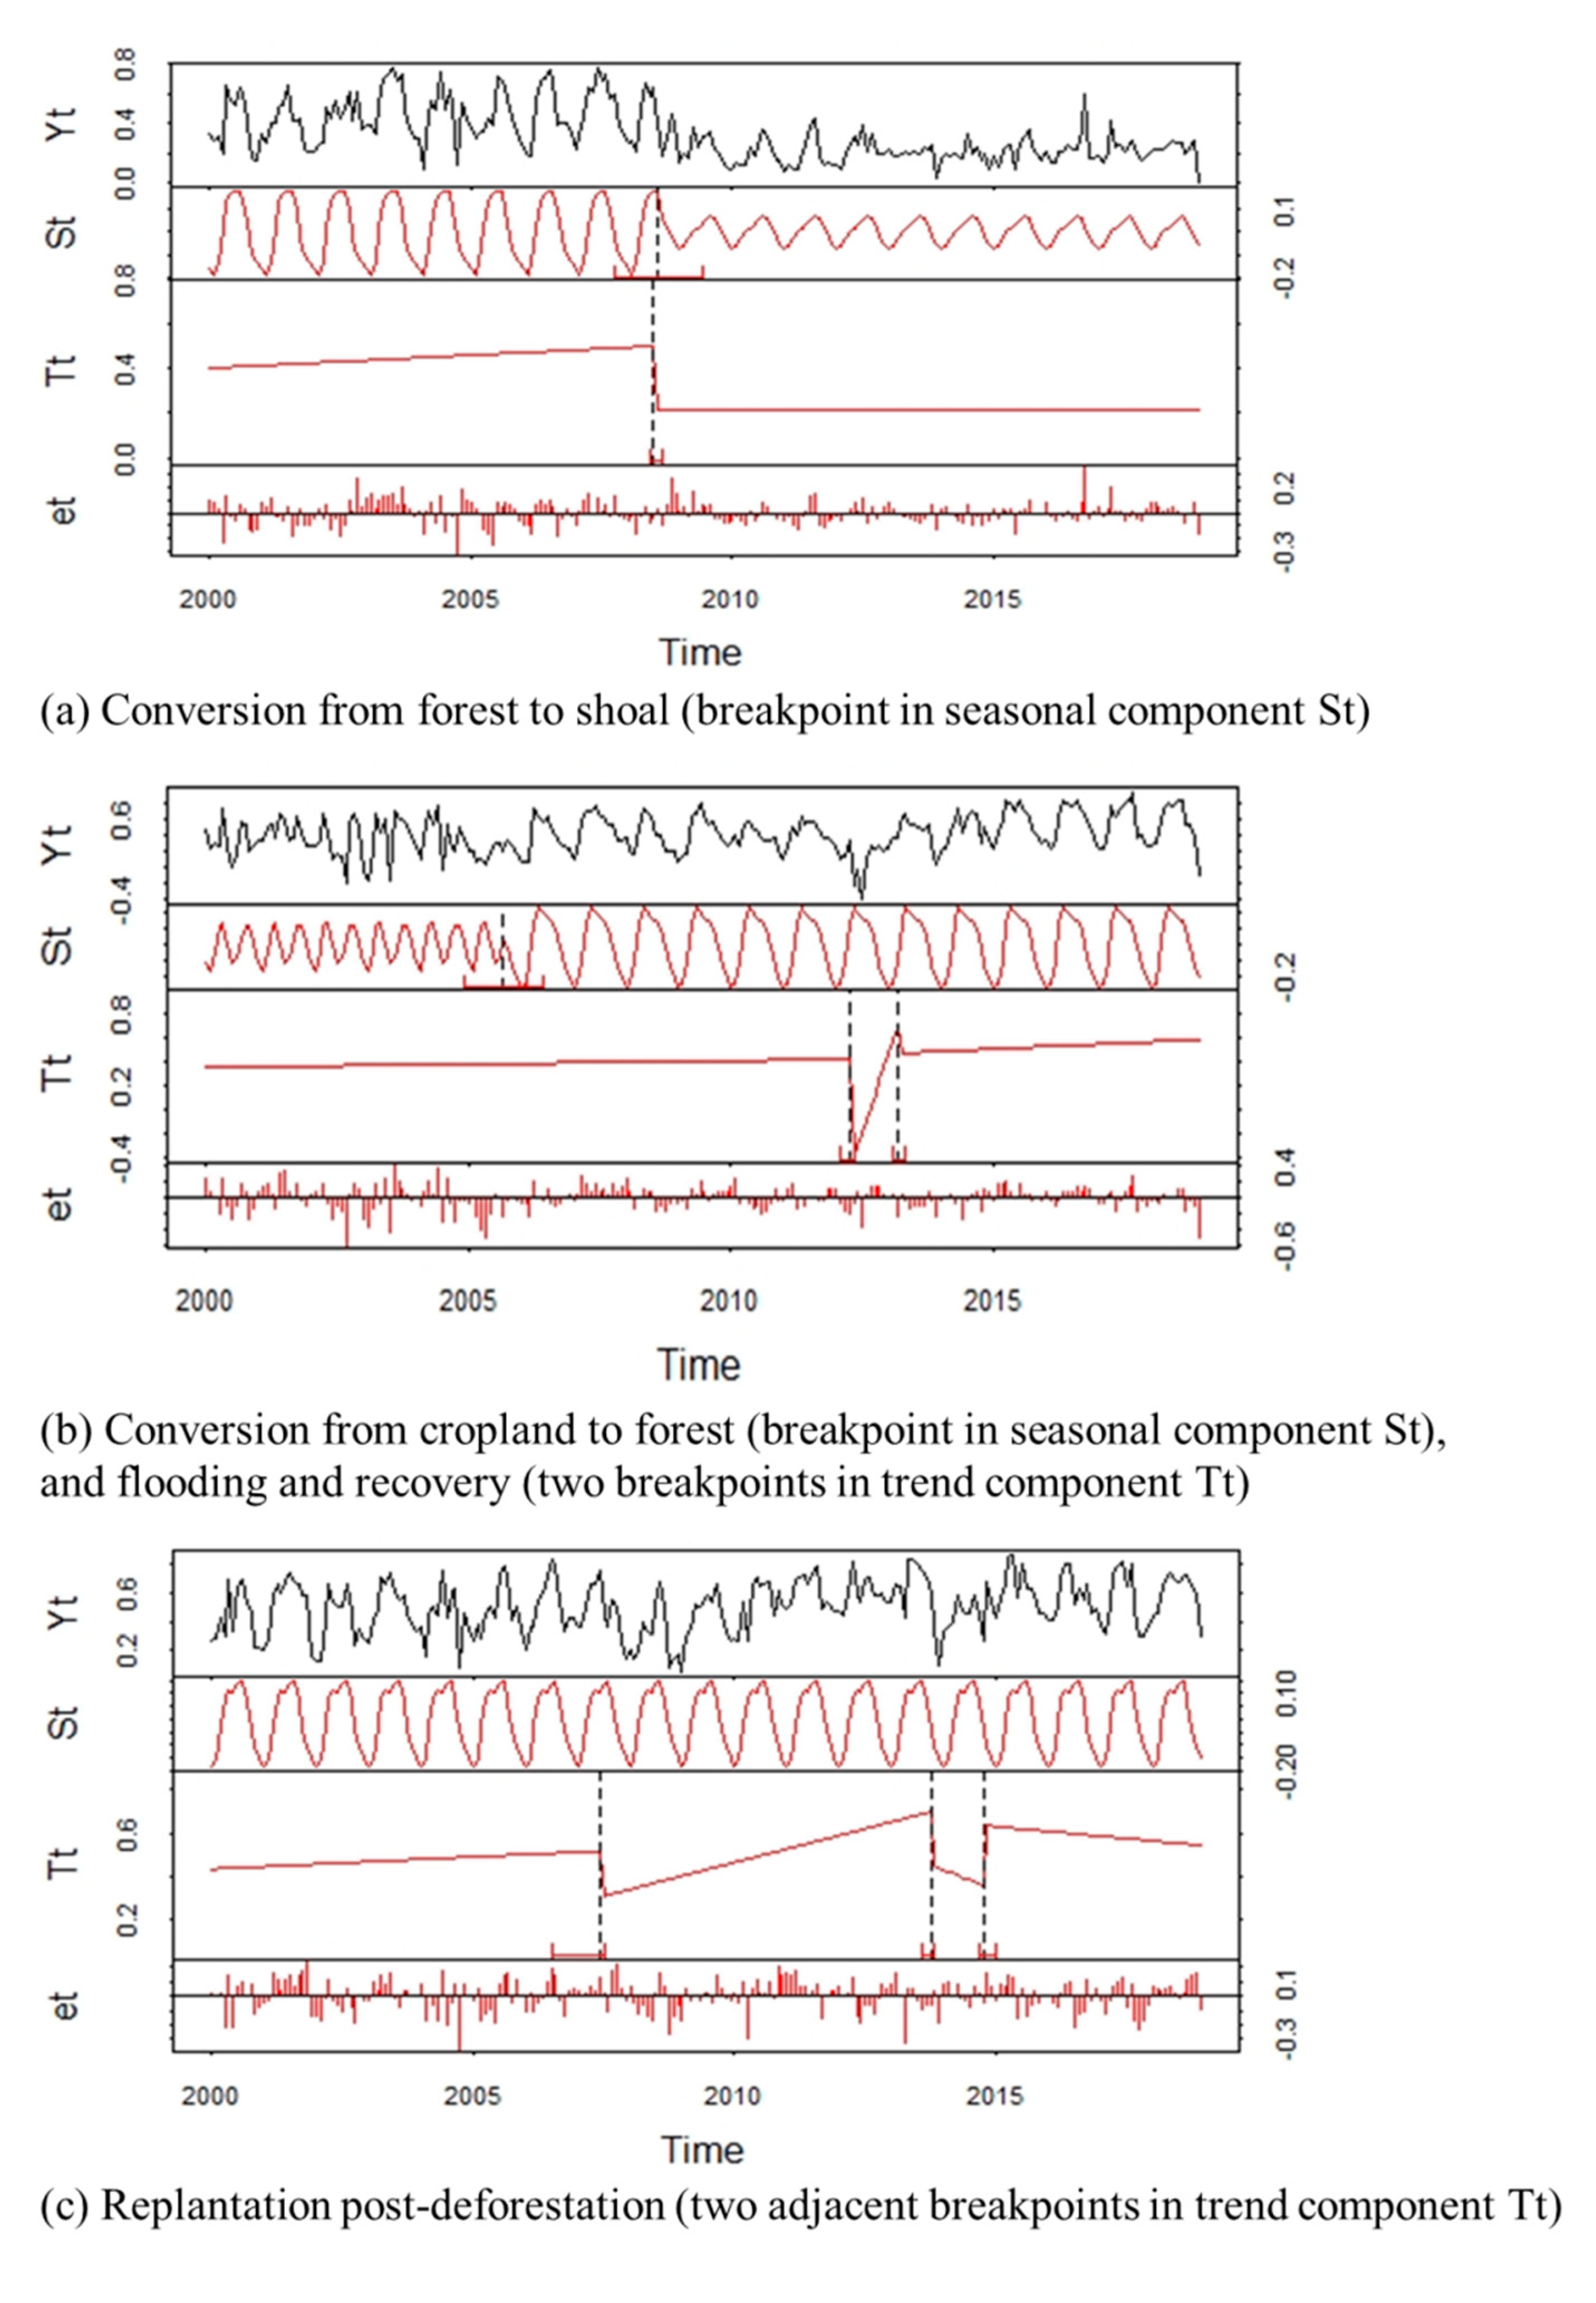
22]. One of the major challenges of change detection with dense time series is to distinguish land cover change from other change types on the premise of minimizing the influences of seasonal phenological variation. The Breaks For Additive Seasonal and Trend (BFAST) meet the challenge through the iterative decomposotion of the time series into trend, seasonal and remainder components [
12,
23]. The breaks detected in the trend component represent an ephemeral disturbance [
24,
25], while the breaks detected in the seasonal component represent a land cover change because of the seasonal pattern (phenology) difference between different land cover categories [
25,
26]. BFAST has been applied in many different land cover categories, such as wetland [
24], wildlife nature reserve [
25], city [
26], tropical dry forest [
27], vegetation [
28,
29], agriculture [
30], and abandoned energy development sites [
31]. Although BFAST can identify land cover changes (question 1), acquire the process information of land cover change (question 2), and distinguish land cover change from other change types (question 3), it still cannot provide the detailed “from what, to what” information (question 4). Therefore, the land cover categories should be classified before and after abrupt changes while finding the timing and location of land cover change [
14,
32]. Zhu and Woodcock proposed a continuous change detection and classification (CCDC) algorithm for land cover change detection and land cover categories classification after change detection by using all available Landsat images [
21]. The advantage of CCDC is that the coefficients of the fitting time series model and the root mean square error (RMSE) of it are treated as the input parameters of the RFC for land cover classification before and after abrupt changes (question 4).
The Dongting Lake region, in which farmland is one of the major land use categories, is one of the important grain production bases in China. The inter-conversion between farmland and other land cover categories, including forest, frequently occurred because of the policy orientation and economic profit motivation in recent decades. Therefore, the phenological trajectory of all kinds of land cover categories, including farmland with complex intra-annual variations (such as double- or even triple-crop patterns within a year), must be well described for land cover change detection and classification before and after abrupt change. However, the CCDC just adopted a simple sinusoidal model for the phenological trajectory description for a variety of land cover categories, which means it cannot answer any one of four questions in Dongting Lake region with complex change processes [
21,
33]. Although the BFAST algorithm exhibits difficulty in interpreting the land cover categories before and after the detected abrupt changes, a multi-harmonic model adopted in BFAST could be satisfactory for the complex shape of phenological trajectory and could be applied in the Dongting Lake region. Therefore, BFAST may be feasible for not only detecting the land cover changes related to forest but also classifying the land cover categories before and after abrupt changes by integrating BFAST and classification algorithm.
BFAST is initially proposed to detect change based on high temporal resolution MODIS data, which means it needs dense time series images. However, MODIS data with coarse spatial resolution have the limitation of detecting small changes because of the high fragmentation degree of land cover in the West Dongting Lake region [
34]. Lots of medium-resolution data could be freely captured with the Landsat data archive’s opening in 2008. This event enabled change detection with dense remotely-sensed time series at finer spatial resolution [
35]. In comparison with the MODIS time series, the Landsat time series possess several advantages, such as higher spatial resolution (30 m) and longer archive (exceeding 47 years), which means more accurate change detection and longer terms of monitoring [
36,
37,
38]. However, the relatively low temporal resolution and frequent cloud cover and shadows result in excessive temporal gaps in the Landsat archive for certain regions or time periods [
39], such as the West Dongting Lake region in South China (subtropical region with low optical data availability) in summer. Therefore, for investigating the spatiotemporal dynamics of forest in the West Dongting Lake region with dense Landsat time series by using BFAST, we should answer the new question in this study: (5) how does one acquire the dense Landsat time series with high quality for change detection using BFAST?
This research aims to investigate the spatiotemporal dynamics of forest in the West Dongting Lake region with dense Landsat time series using BFAST through answering five questions. In this research, the timing and location of forest changes, changing types (from forest to what, or from what to forest), and process are acquired by integrating BFAST and classification algorithm. Then the spatiotemporal variations of forest and the potential drivers in the West Dongting Lake region are analyzed on the basis of the information of change detection and classification.
4. Discussion
The accuracy assessment results of change detection show higher user accuracy for stable pixels and higher producer accuracy for change pixels (
Table 5), indicating more commission errors than omission errors in the detected change pixels. The errors are possibly due to the following reasons: (1) noise; (2) partial change; (3) and influence of classification accuracy. Although the validity of the NSPI, MNSPI and ESTARFM are verified in this study and our previous experiment [
44], the noise cannot be removed completely, which is mistakenly detected as change (commission error). The partially changed pixels are difficult to be detected by BFAST due to the insufficiently large spectral change (omission error). The similarity between shoal covered by other vegetation and forest in the spectral characteristics within the Landsat image with 30 m resolution may result in misclassification, and then the inter-conversion between them cannot be identified even if the conversions have been detected by BFAST before classification (omission error).
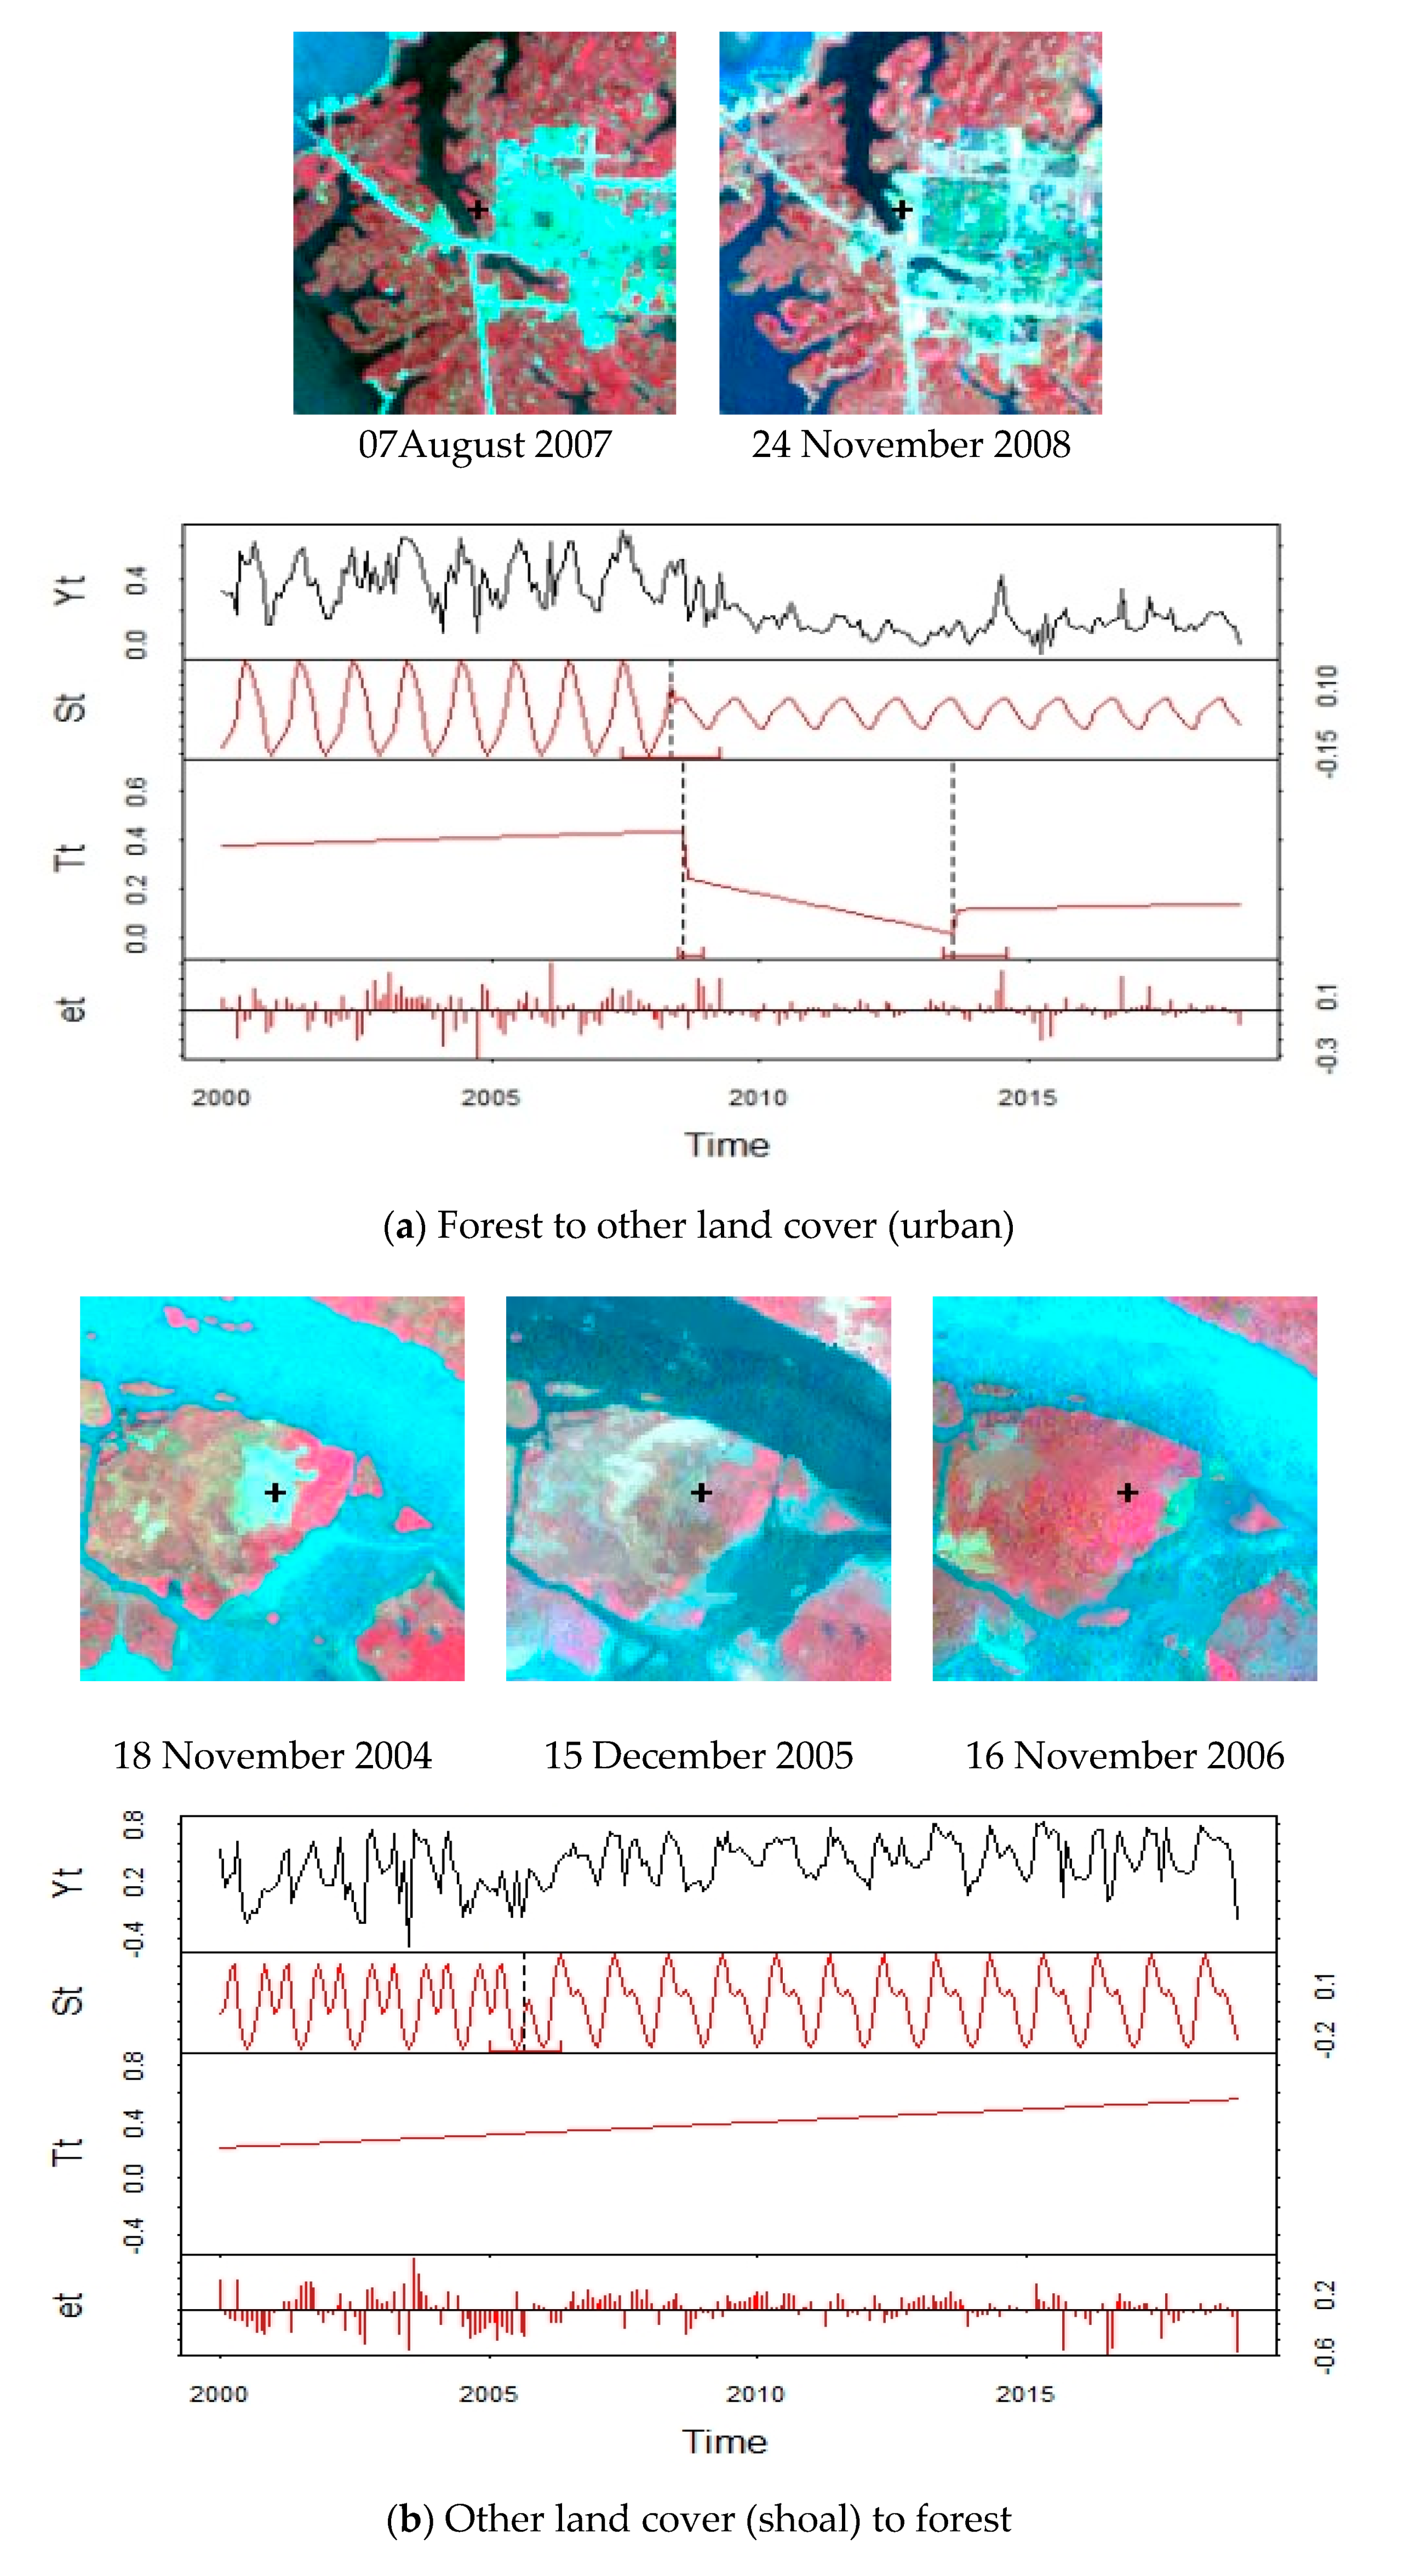
The timing errors of change detection are possibly due to the following reasons: (1) slow change; (2) reconstruction effect of time series; and (3) parameter setting of BFAST. As shown in
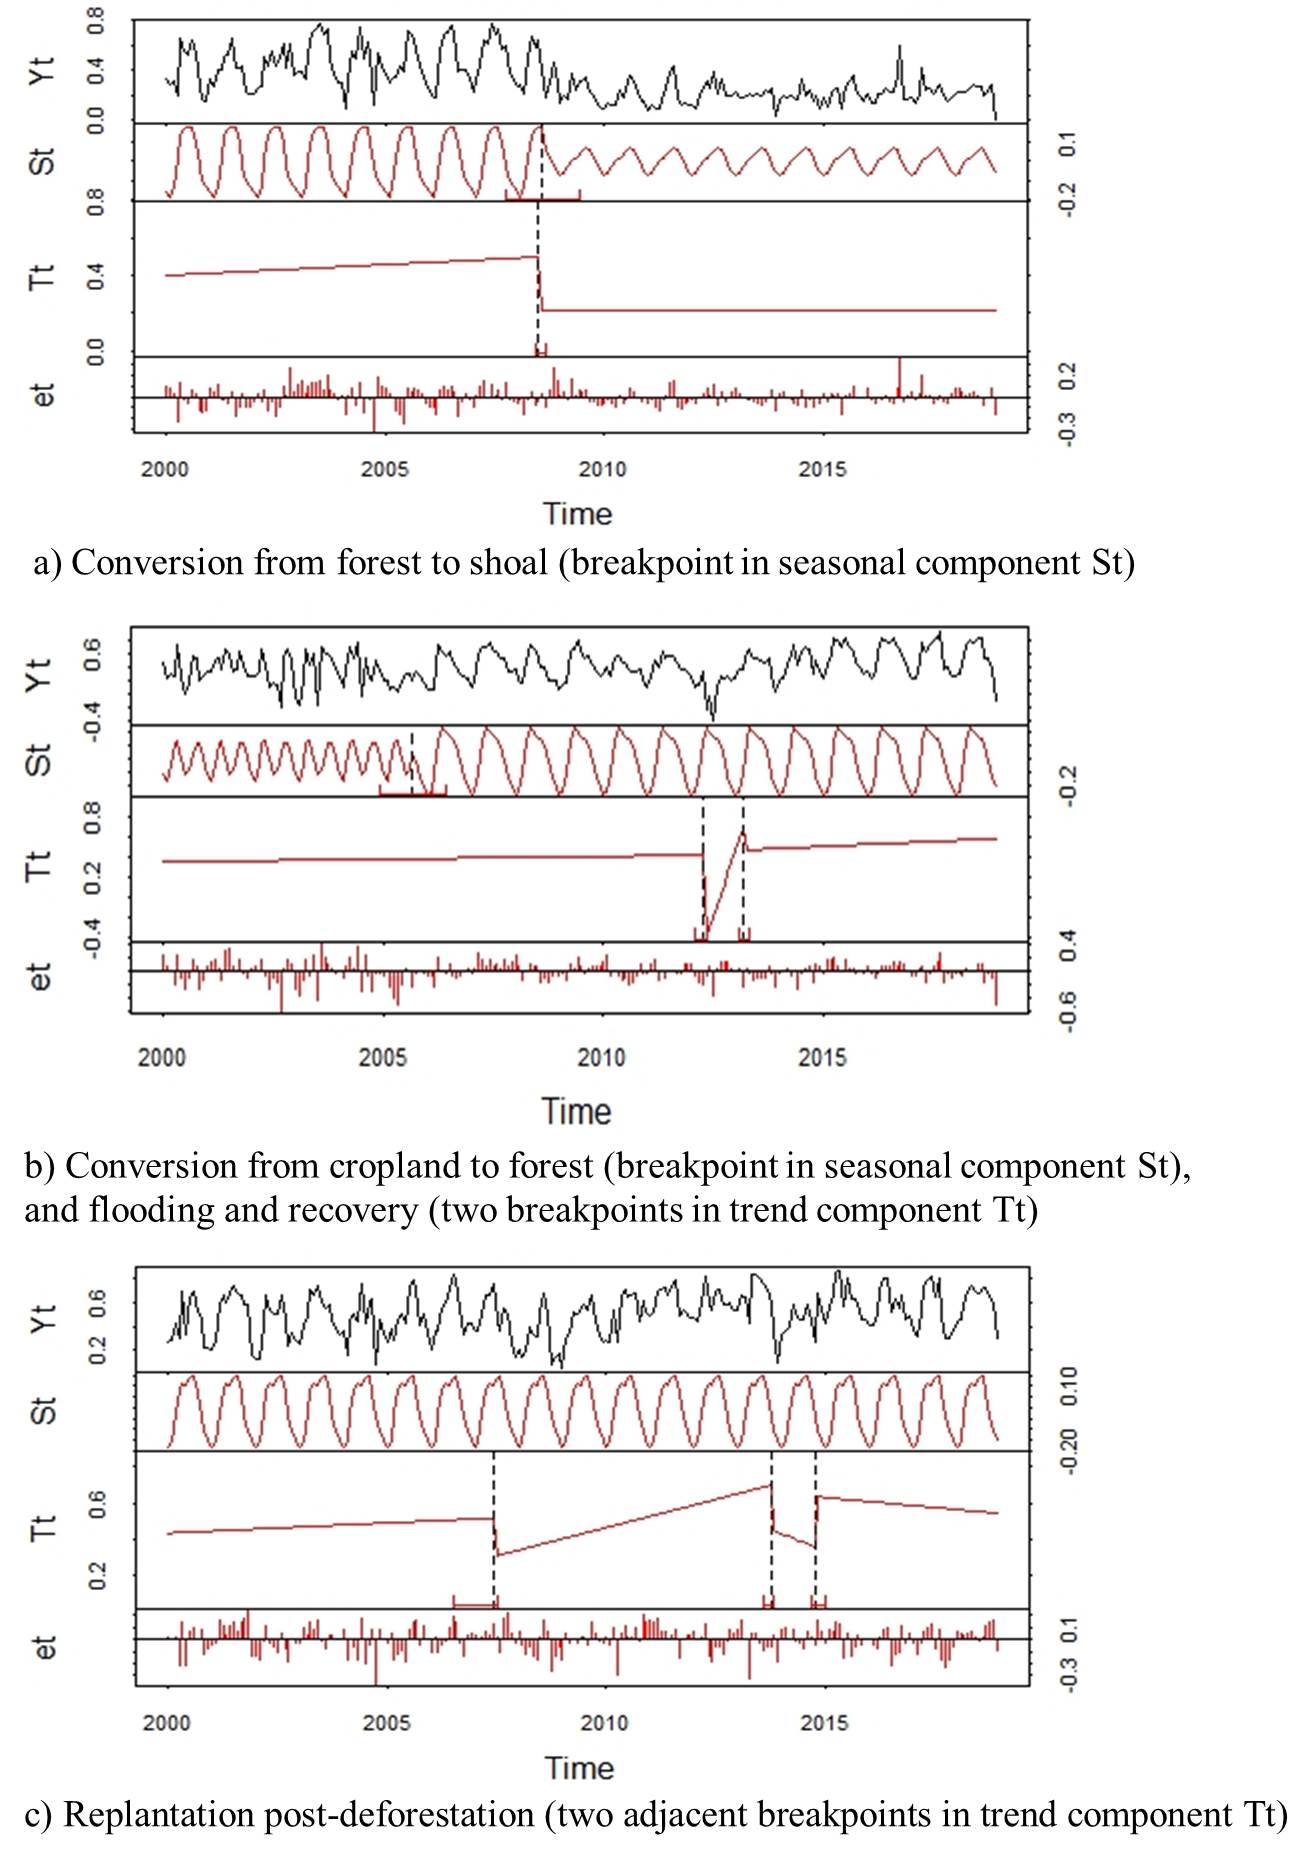
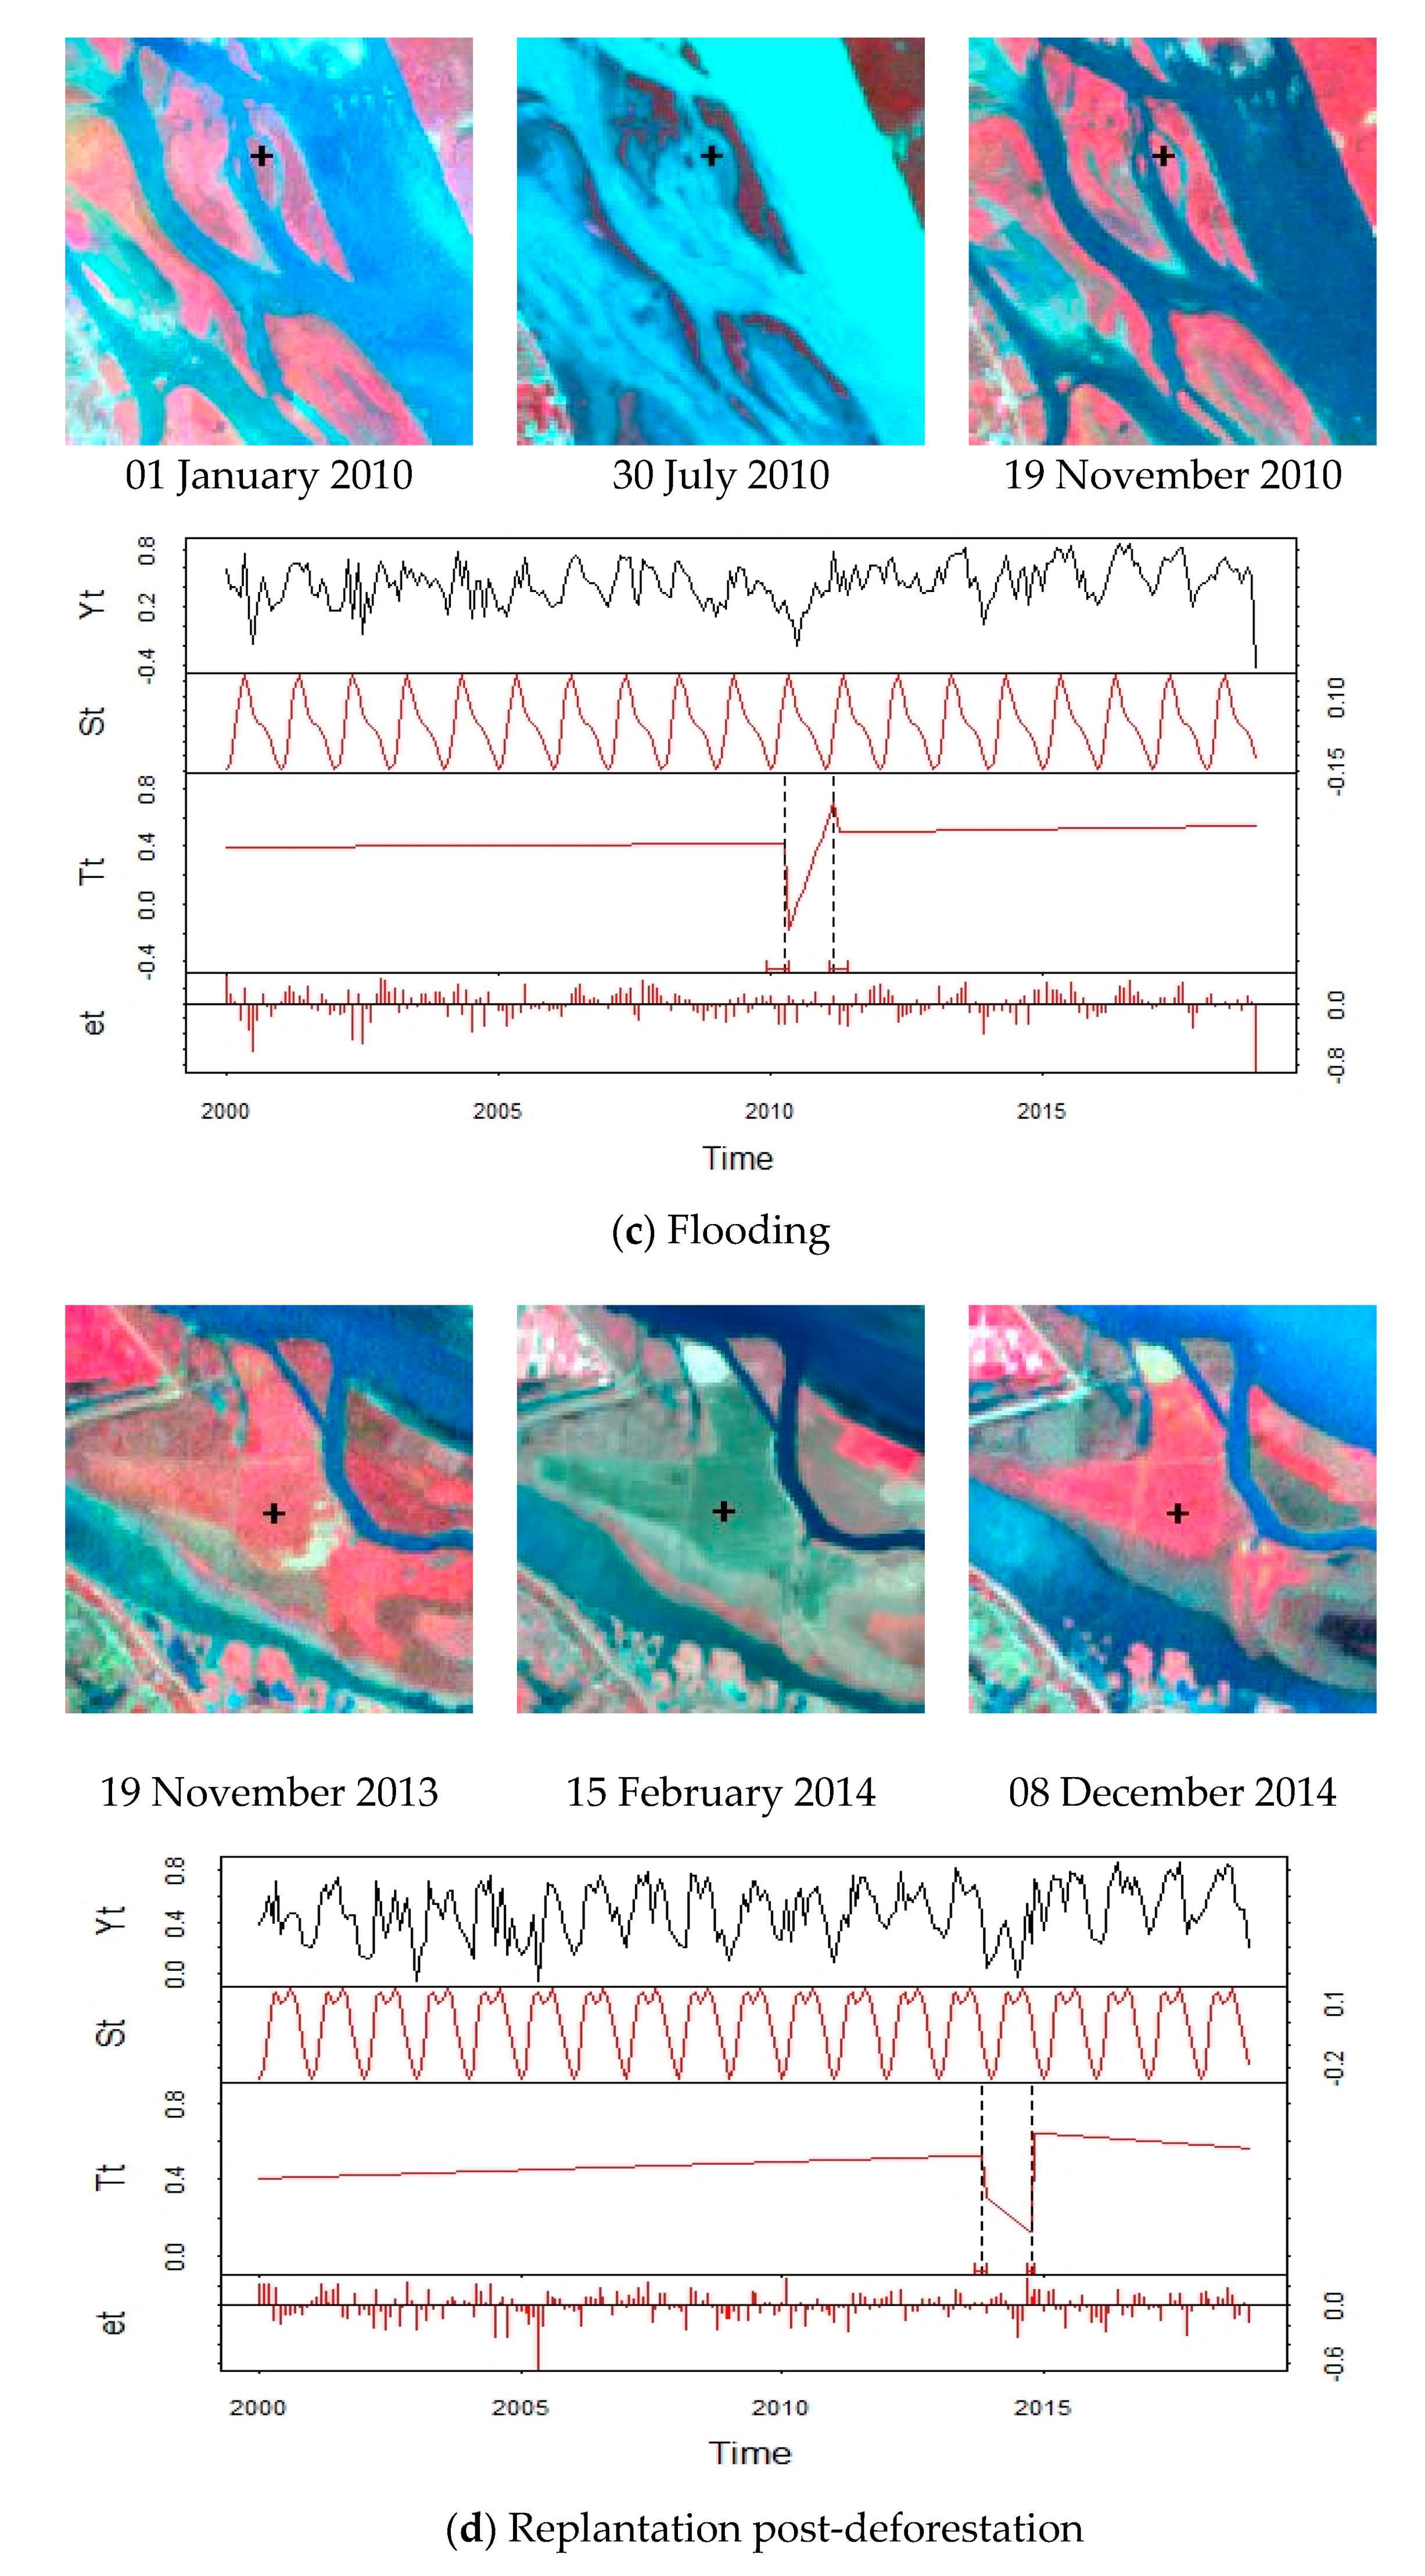
Figure 5a, the slow urban expansion resulted in a partial forest cut within the pixel, in which this spectral change was insufficiently large to be detected by the BFAST algorithm until it was totally changed. Accordingly, the timing of change detected by BFAST was a little later (2 months) than the actual timing observed from the reference data. NSPI, MNSPI and ESTARFM algorithms interpolated the contaminated pixels and reconstructed the missing images without considering possible land cover change at that time phase, which means that the land cover category of the interpolated or reconstructed pixel with actual land cover change may have mistakenly remain unchanged at that time phase. This situation may have resulted in the land cover change detected timing delay of one or several months. We set 1 year as the minimal segment size between successive change detections in BFAST to reduce pseudo changes. However, this strategy caused the interval of two breakpoints closely adjacent to each other in the trend component, representing the short-term disturbances (such as flooding and replantation post-deforestation), to be just 1 year. In fact, the cycle of the short-term disturbances is generally less than 1 year, and it may delay the timing of the recovery process.
On the basis of the error analysis, there are some feasible strategies as follows: (1) change detection through integrating temporal and spatial information and (2) classification using deep learning. Similar to most change detection methods utilizing time-series data, the BFAST adopted in this study is mainly focused on the information on the temporal domain and independently processes each pixel, without considering the change characteristics generated on the spatial domain [
14,
58]. This results in the accuracy of change detection relying heavily on the quantity and quality of time-series data in the temporal domain, such as the reconstruction accuracy of the monthly Landsat time series in this study. In fact, the change essentially occurs in the spatial domain and is reflected in the temporal domain, in other words, change determines the necessity of defining ‘time’ by human. Therefore, time series analysis based on an independent pixel is insufficient to accurately and roundly describe a series of change characteristics. Several algorithms recently eliminated the noise and other change (such as seasonal change) interference through integrating spatial information, which improved the change detection accuracy [
18,
59,
60,
61,
62]. These methods have less reliance on the quantity and quality of time-series data. For example, Hamunyela et al. used spatially normalized NDVI values on the basis of setting the various window sizes to reduce phenological differences and lower latency in change detection [
59], and Guttler et al. developed the object-based change detection method [
62]. They may be used to resolve the problem mentioned in the previous paragraph. Therefore, additional algorithms that use the spatiotemporal data analytical techniques (such as spatiotemporal geo-statistic methods) [
63,
64], which consider the correlativity and heterogeneity of spatiotemporal data, are anticipated. In addition, the improvement of the classification accuracy can also contribute to change detection. Deep learning methods have recently progressed considerably and have played a key role in addressing remote sensing image classification [
65,
66]. The validity of classification using Convolutional Neural Network (CNN) in South China has been verified in our previous studies [
67,
68,
69]. Compared with traditional classification methods, including support vector machine and decision tree, the CNN improves the accuracy of classification through extracting deep features of spatial and spectral trajectories. Specifically, the abandoned land and even paddy rice field with different rice-cropping systems are classified well.
Although the West Dongting Lake region is small in spatial scale, the generation, storage, and processing of the monthly Landsat Time series between 2000 and 2018 and the change detection with BFAST still requires expensive storage and computation. Therefore, time series data analysis in the large regional scale (such as global scale) and long temporal scale (such as the 47-year archive of Landsat) needs more expensive storage and computation because of the large amount of data and its processing [
21]. Computing capability, such as the cloud-computing technology with the Google Earth Engine (GEE) platform [
70], has been greatly improved in the last few years. GEE synchronously archives the Landsat data from USGS and effectively performs data processing by using the cloud computing technology through utilizing millions of servers worldwide. This technology shows potentials and prospects of the emerging GEE platforms in large regional and long temporal scales for land cover change research, and several studies have proved its feasibility [
31,
71,
72]. Therefore, the data storage, processing, and analysis will be conducted by using the GEE platform in the next exploration.
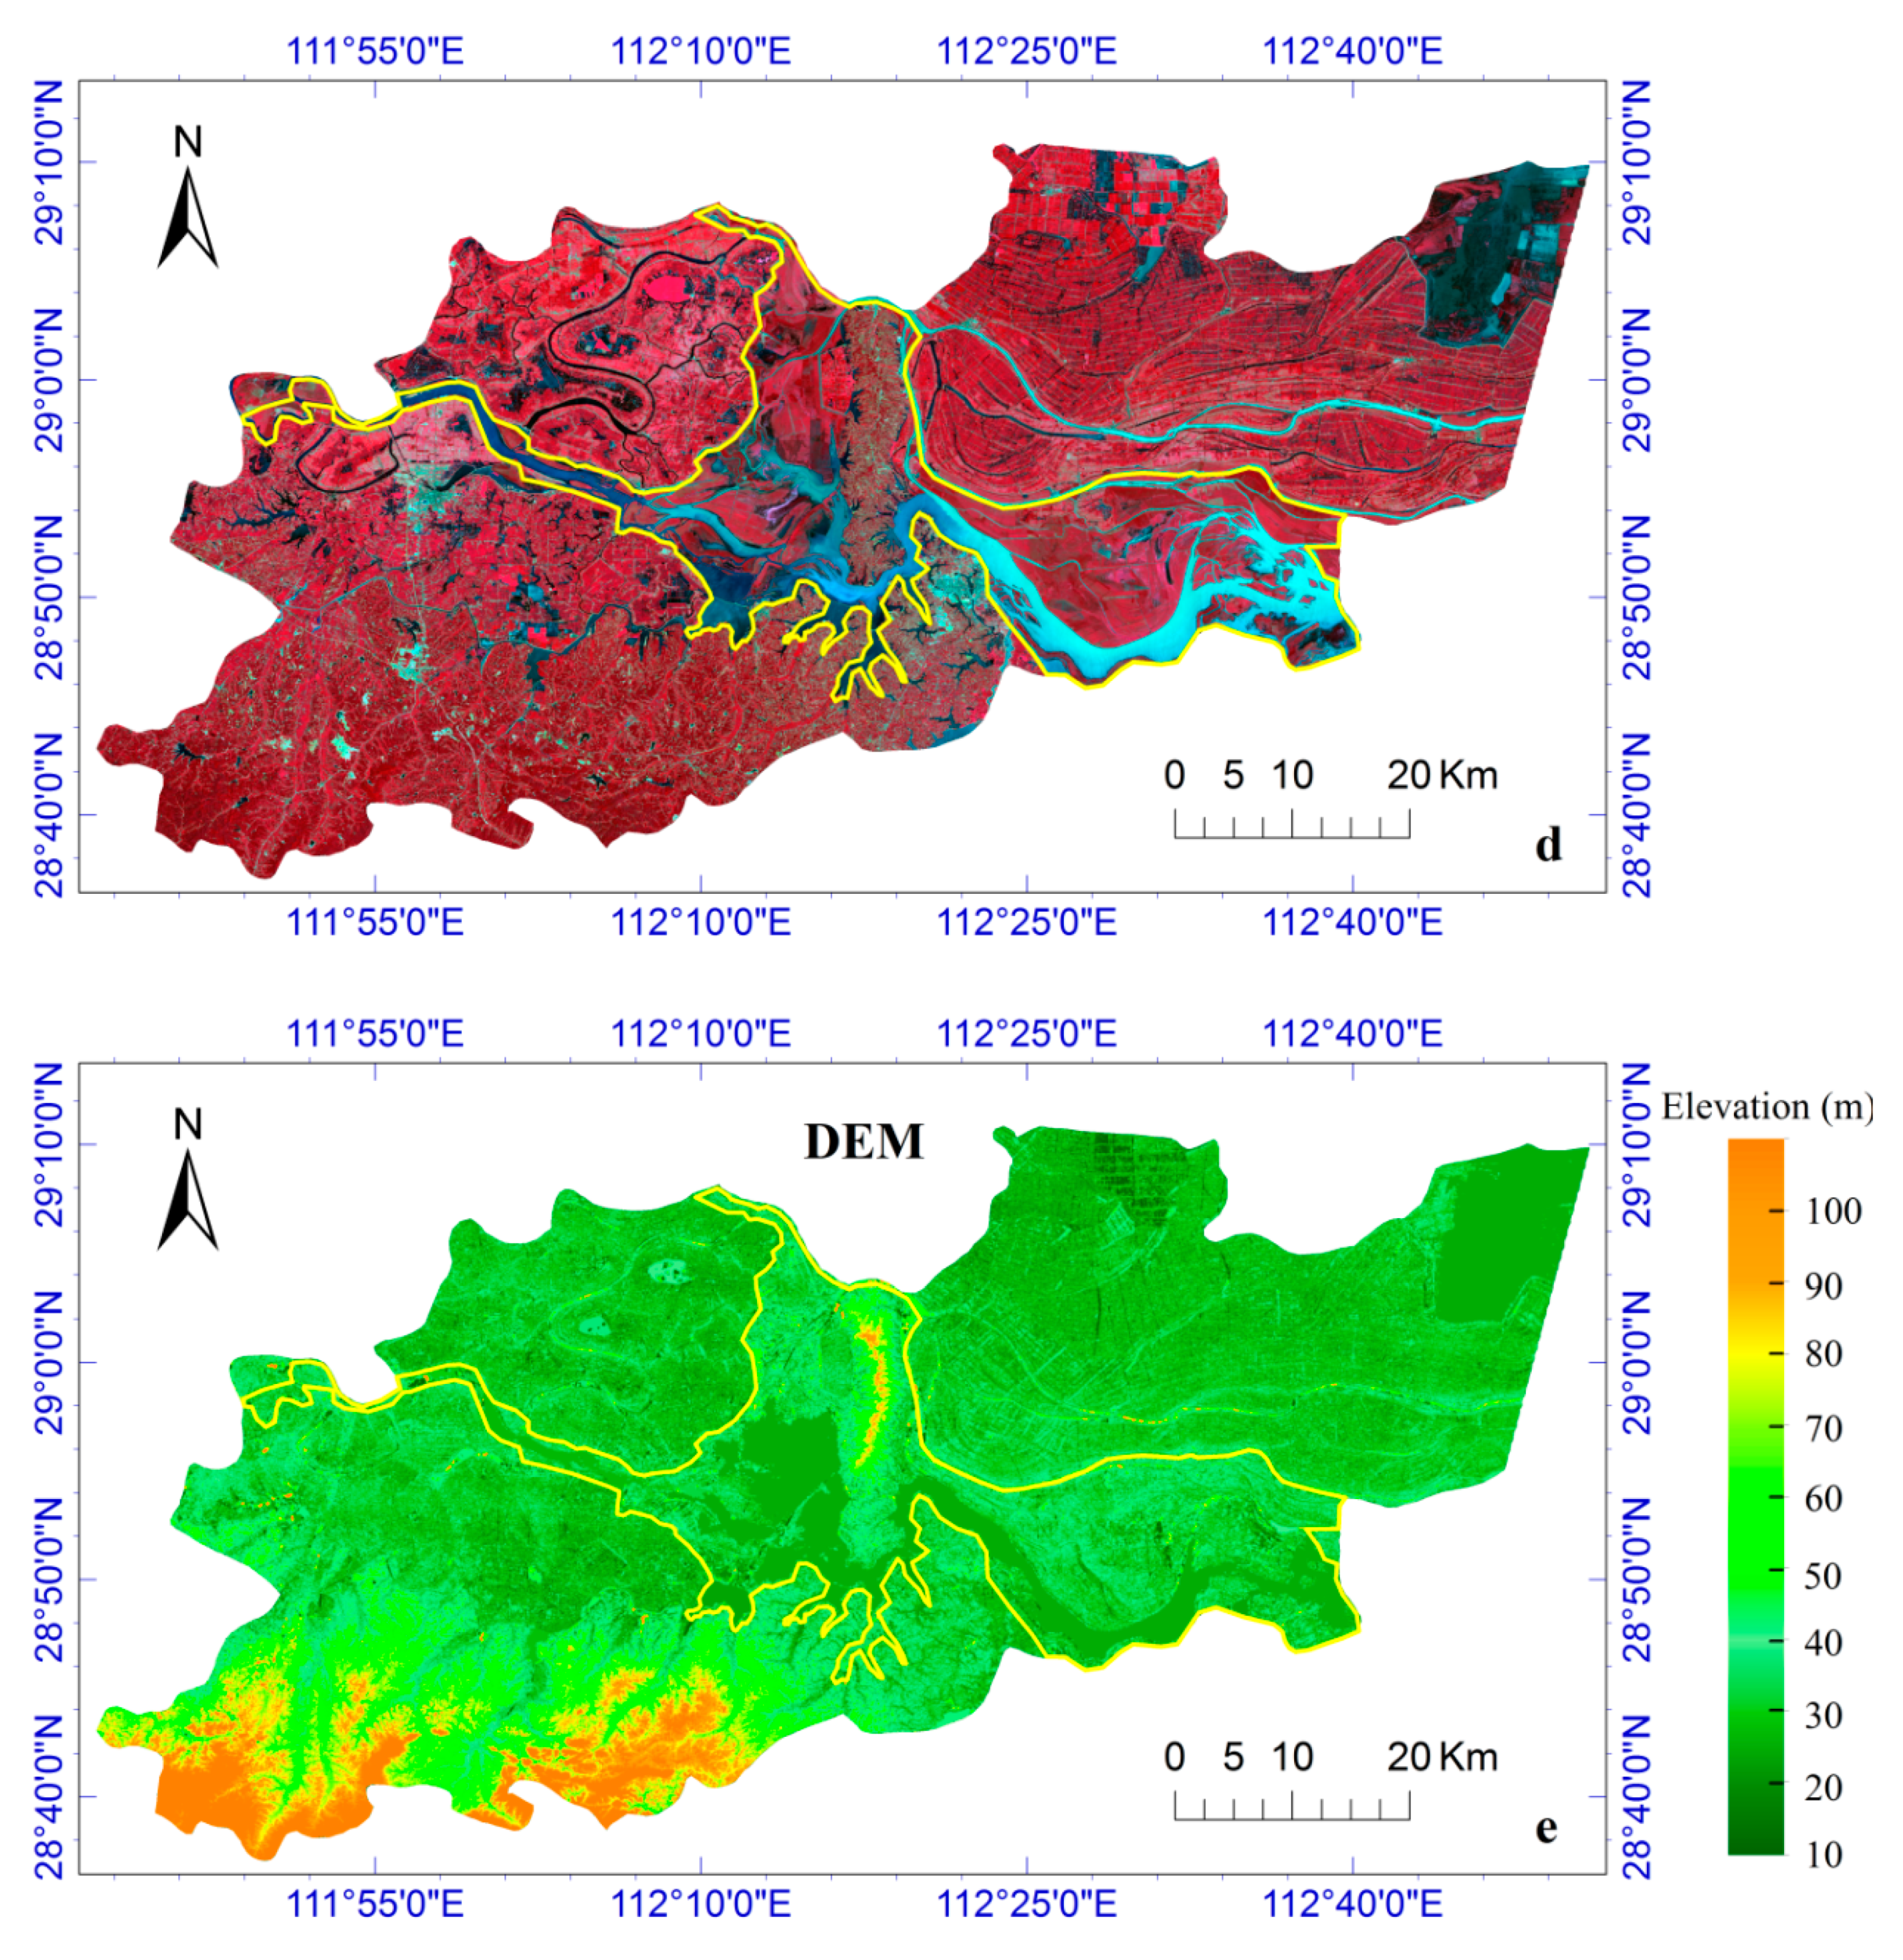
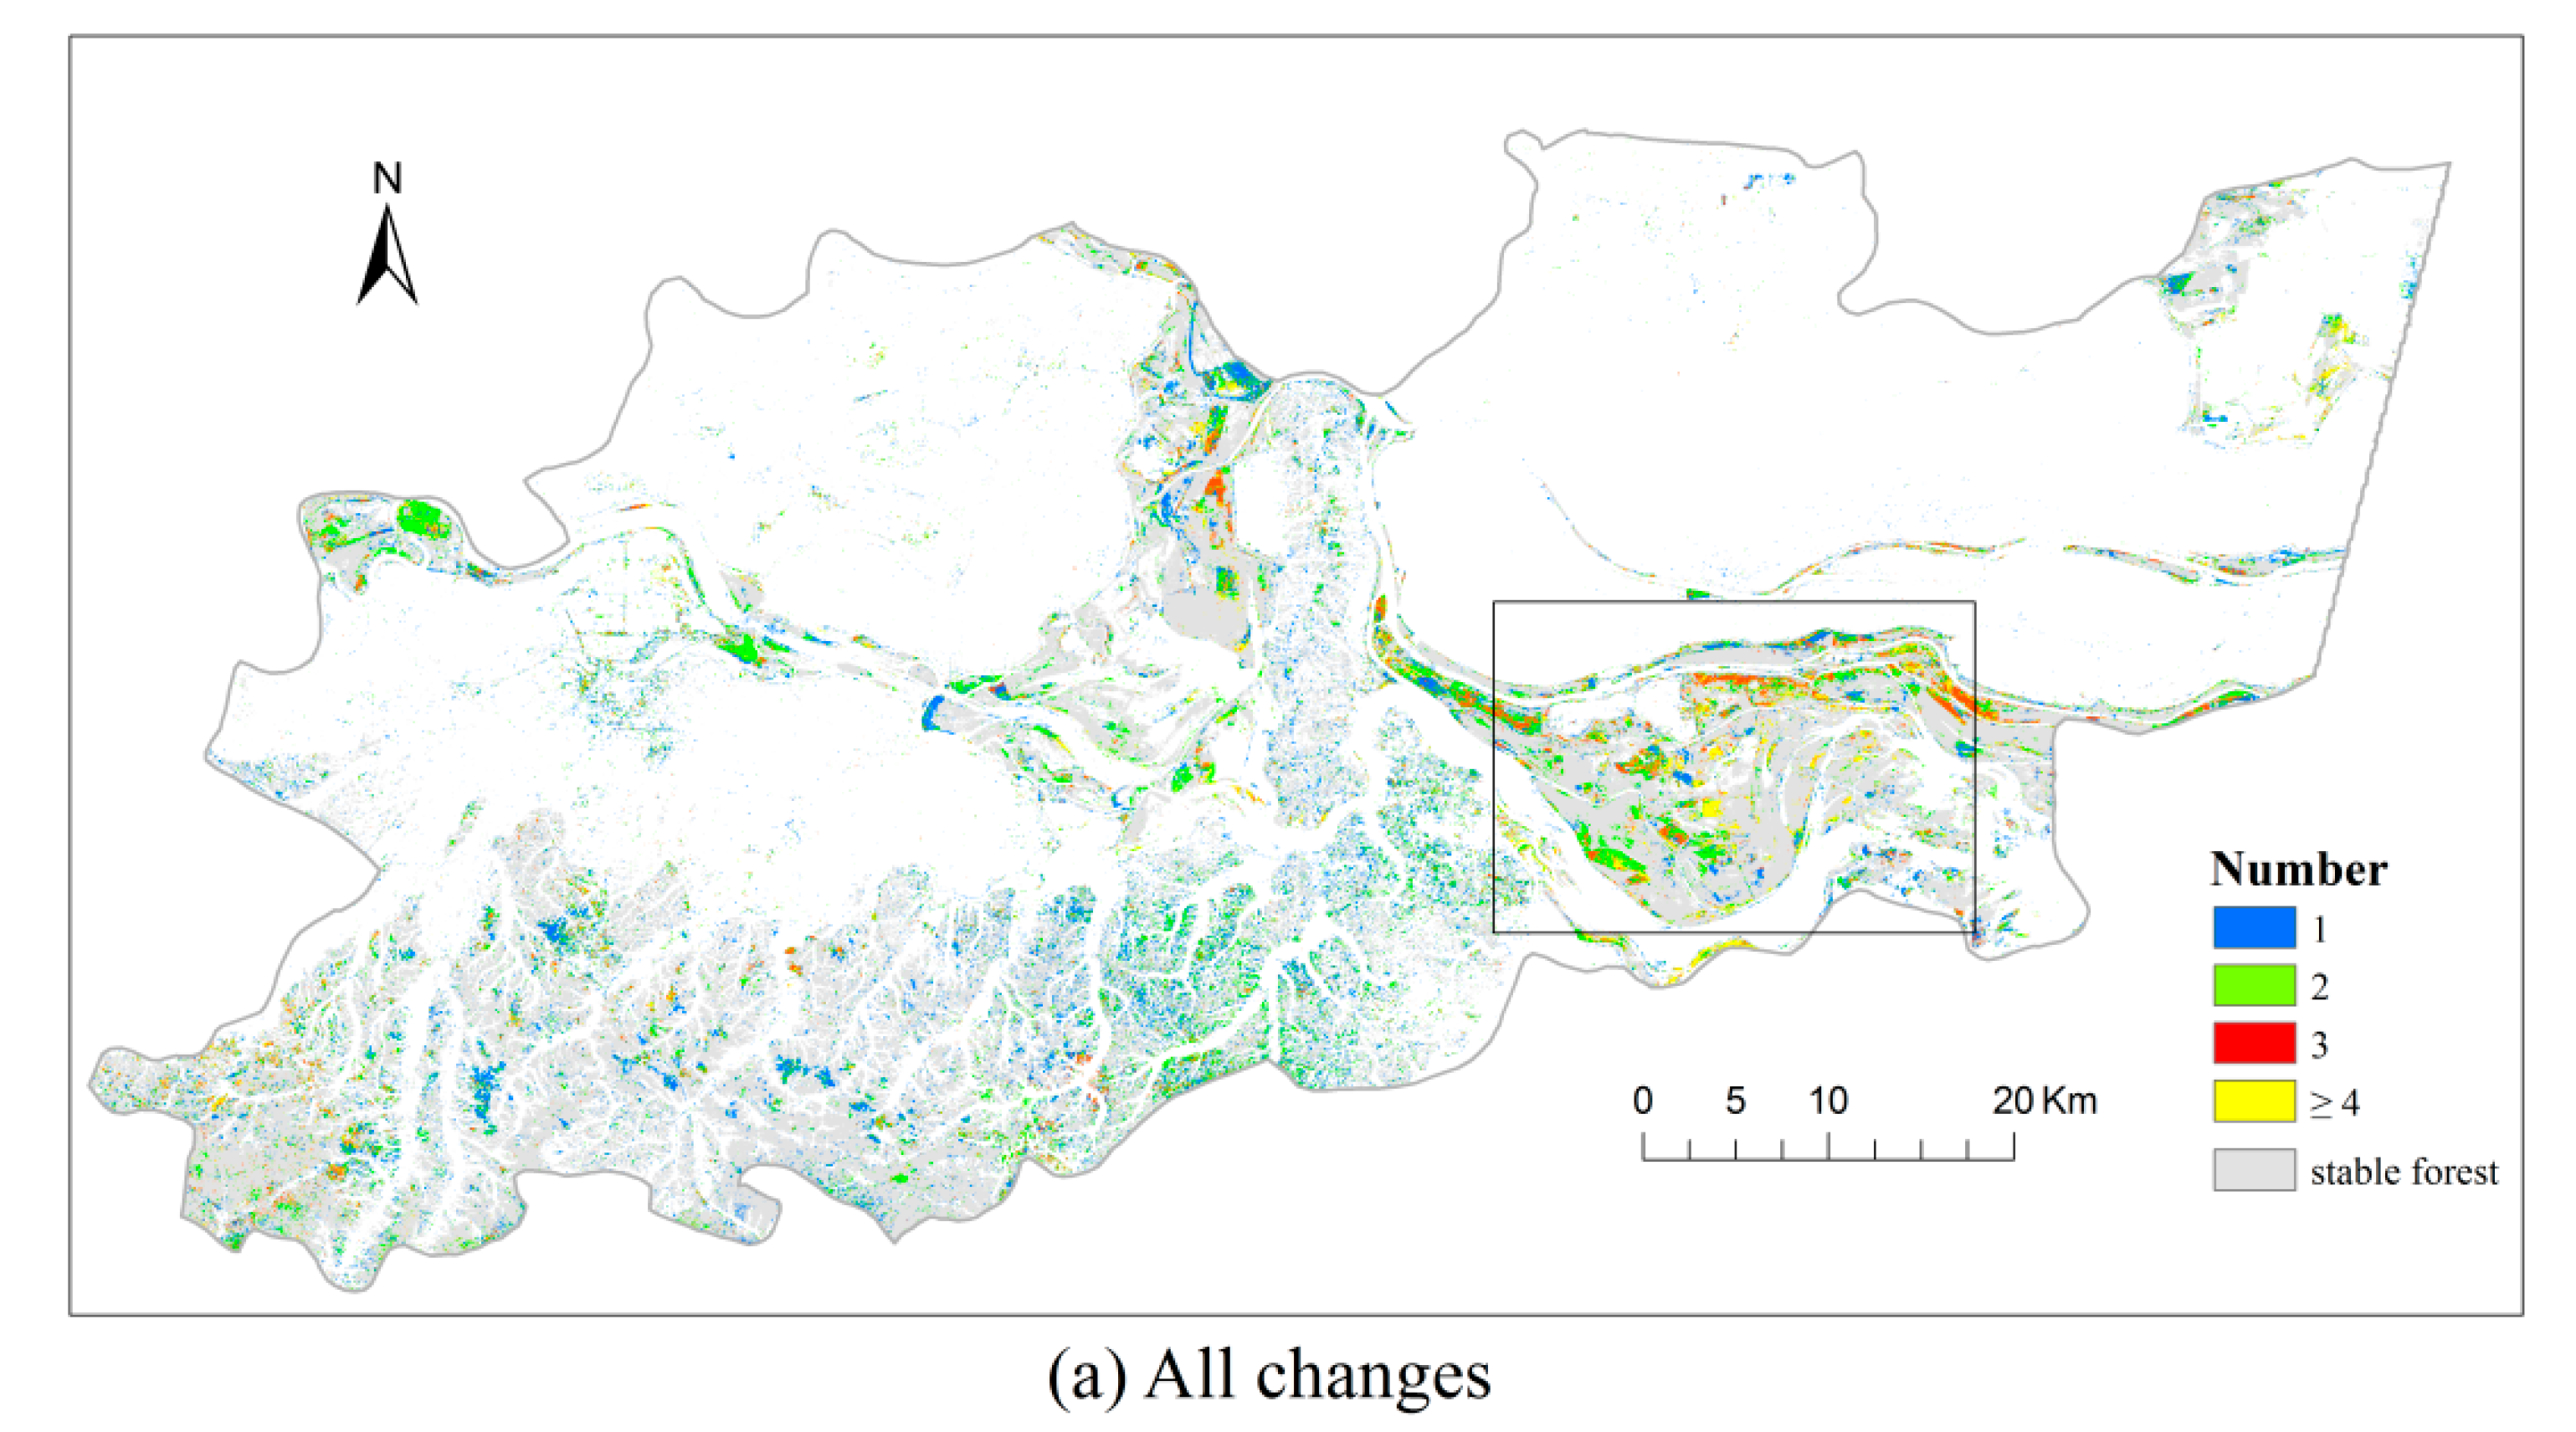
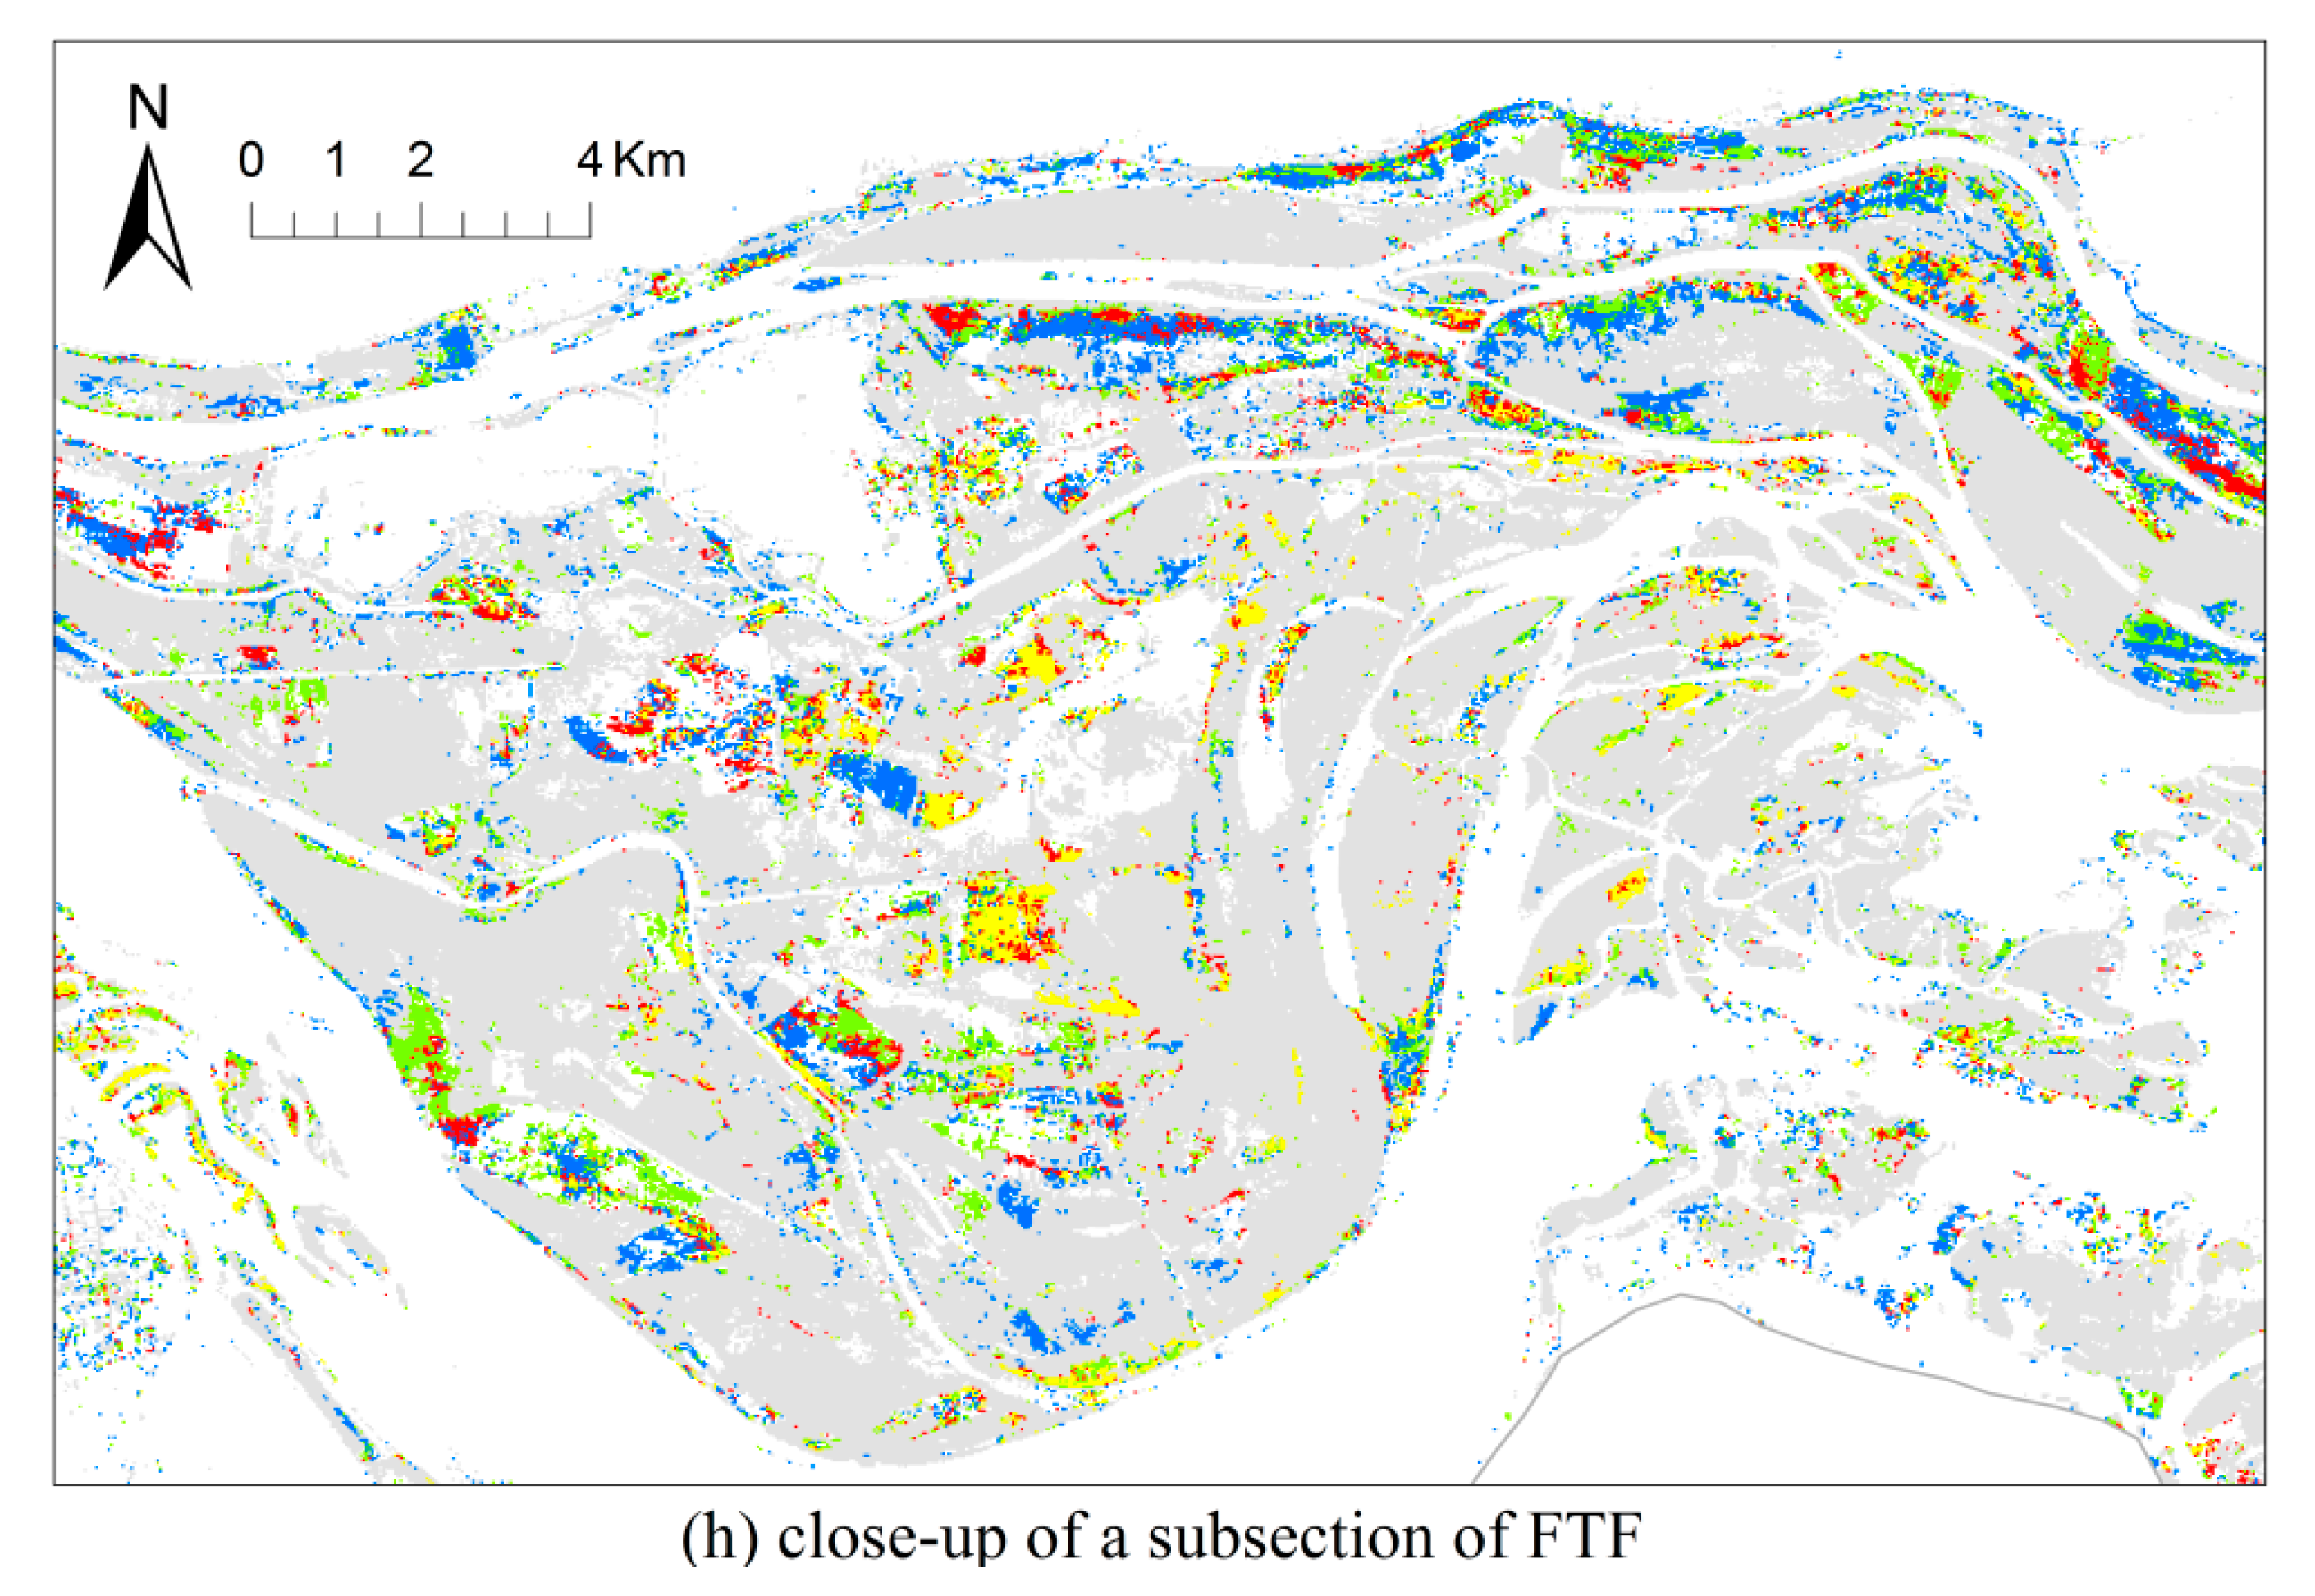
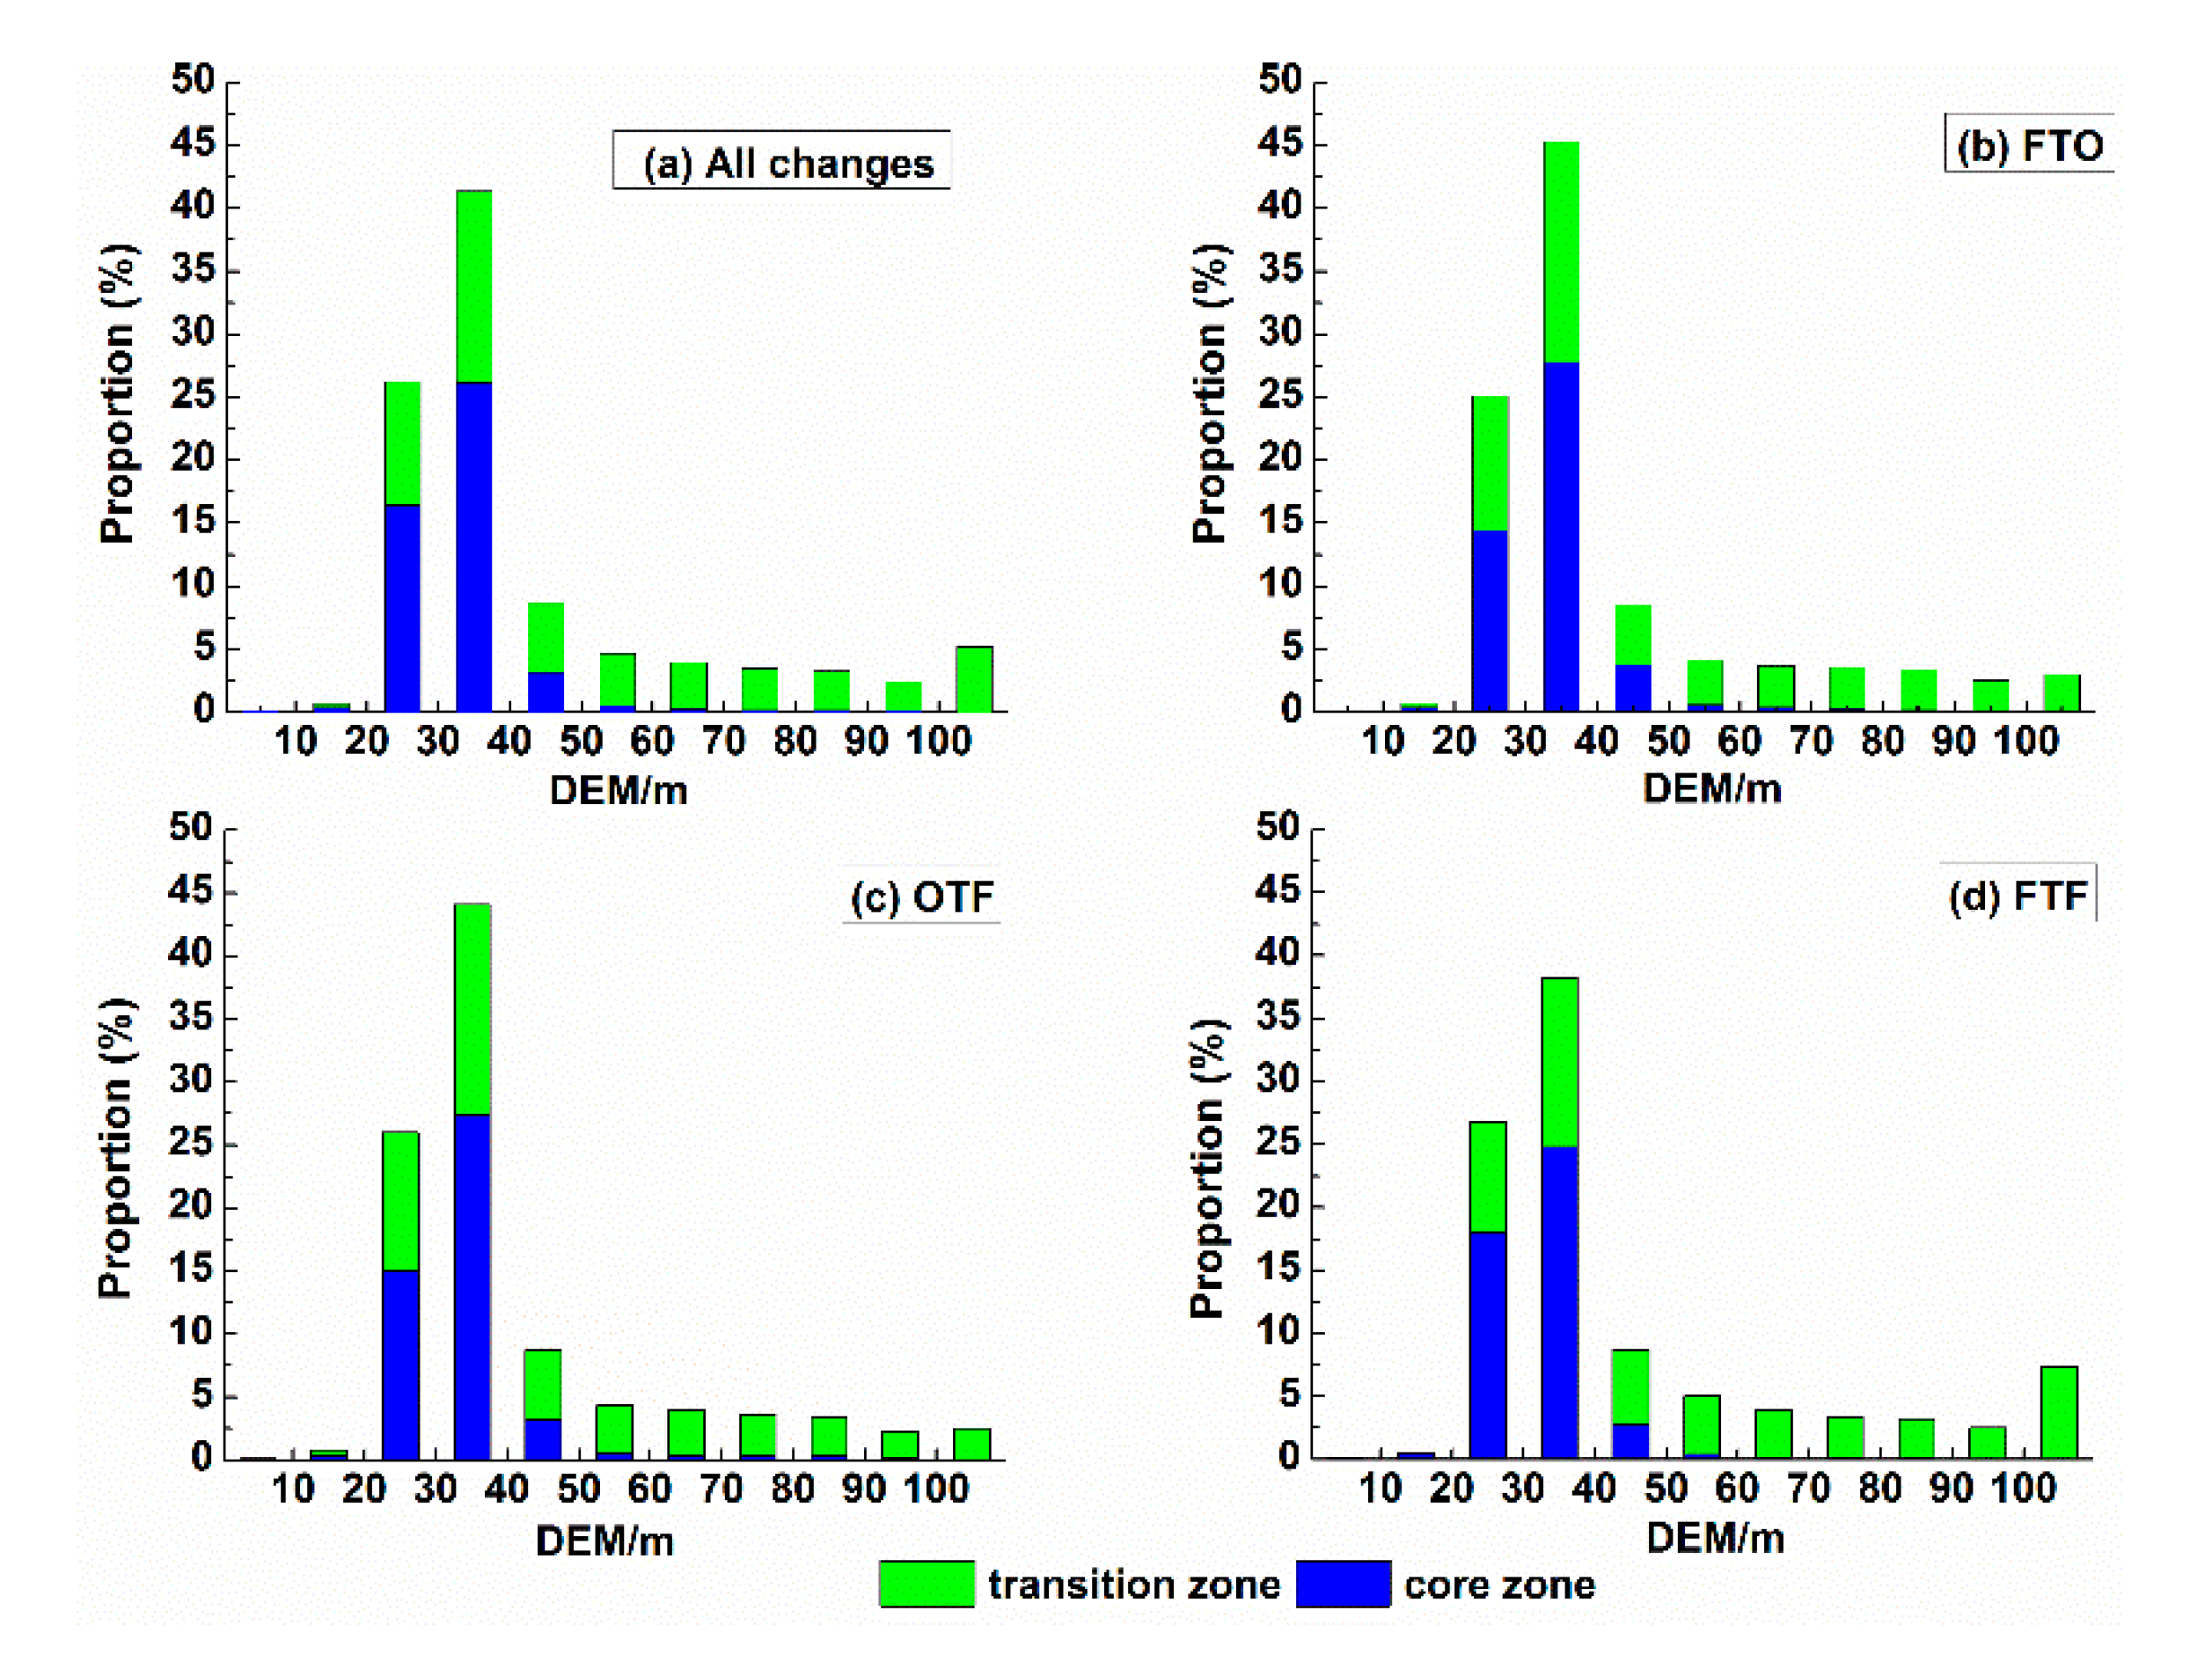
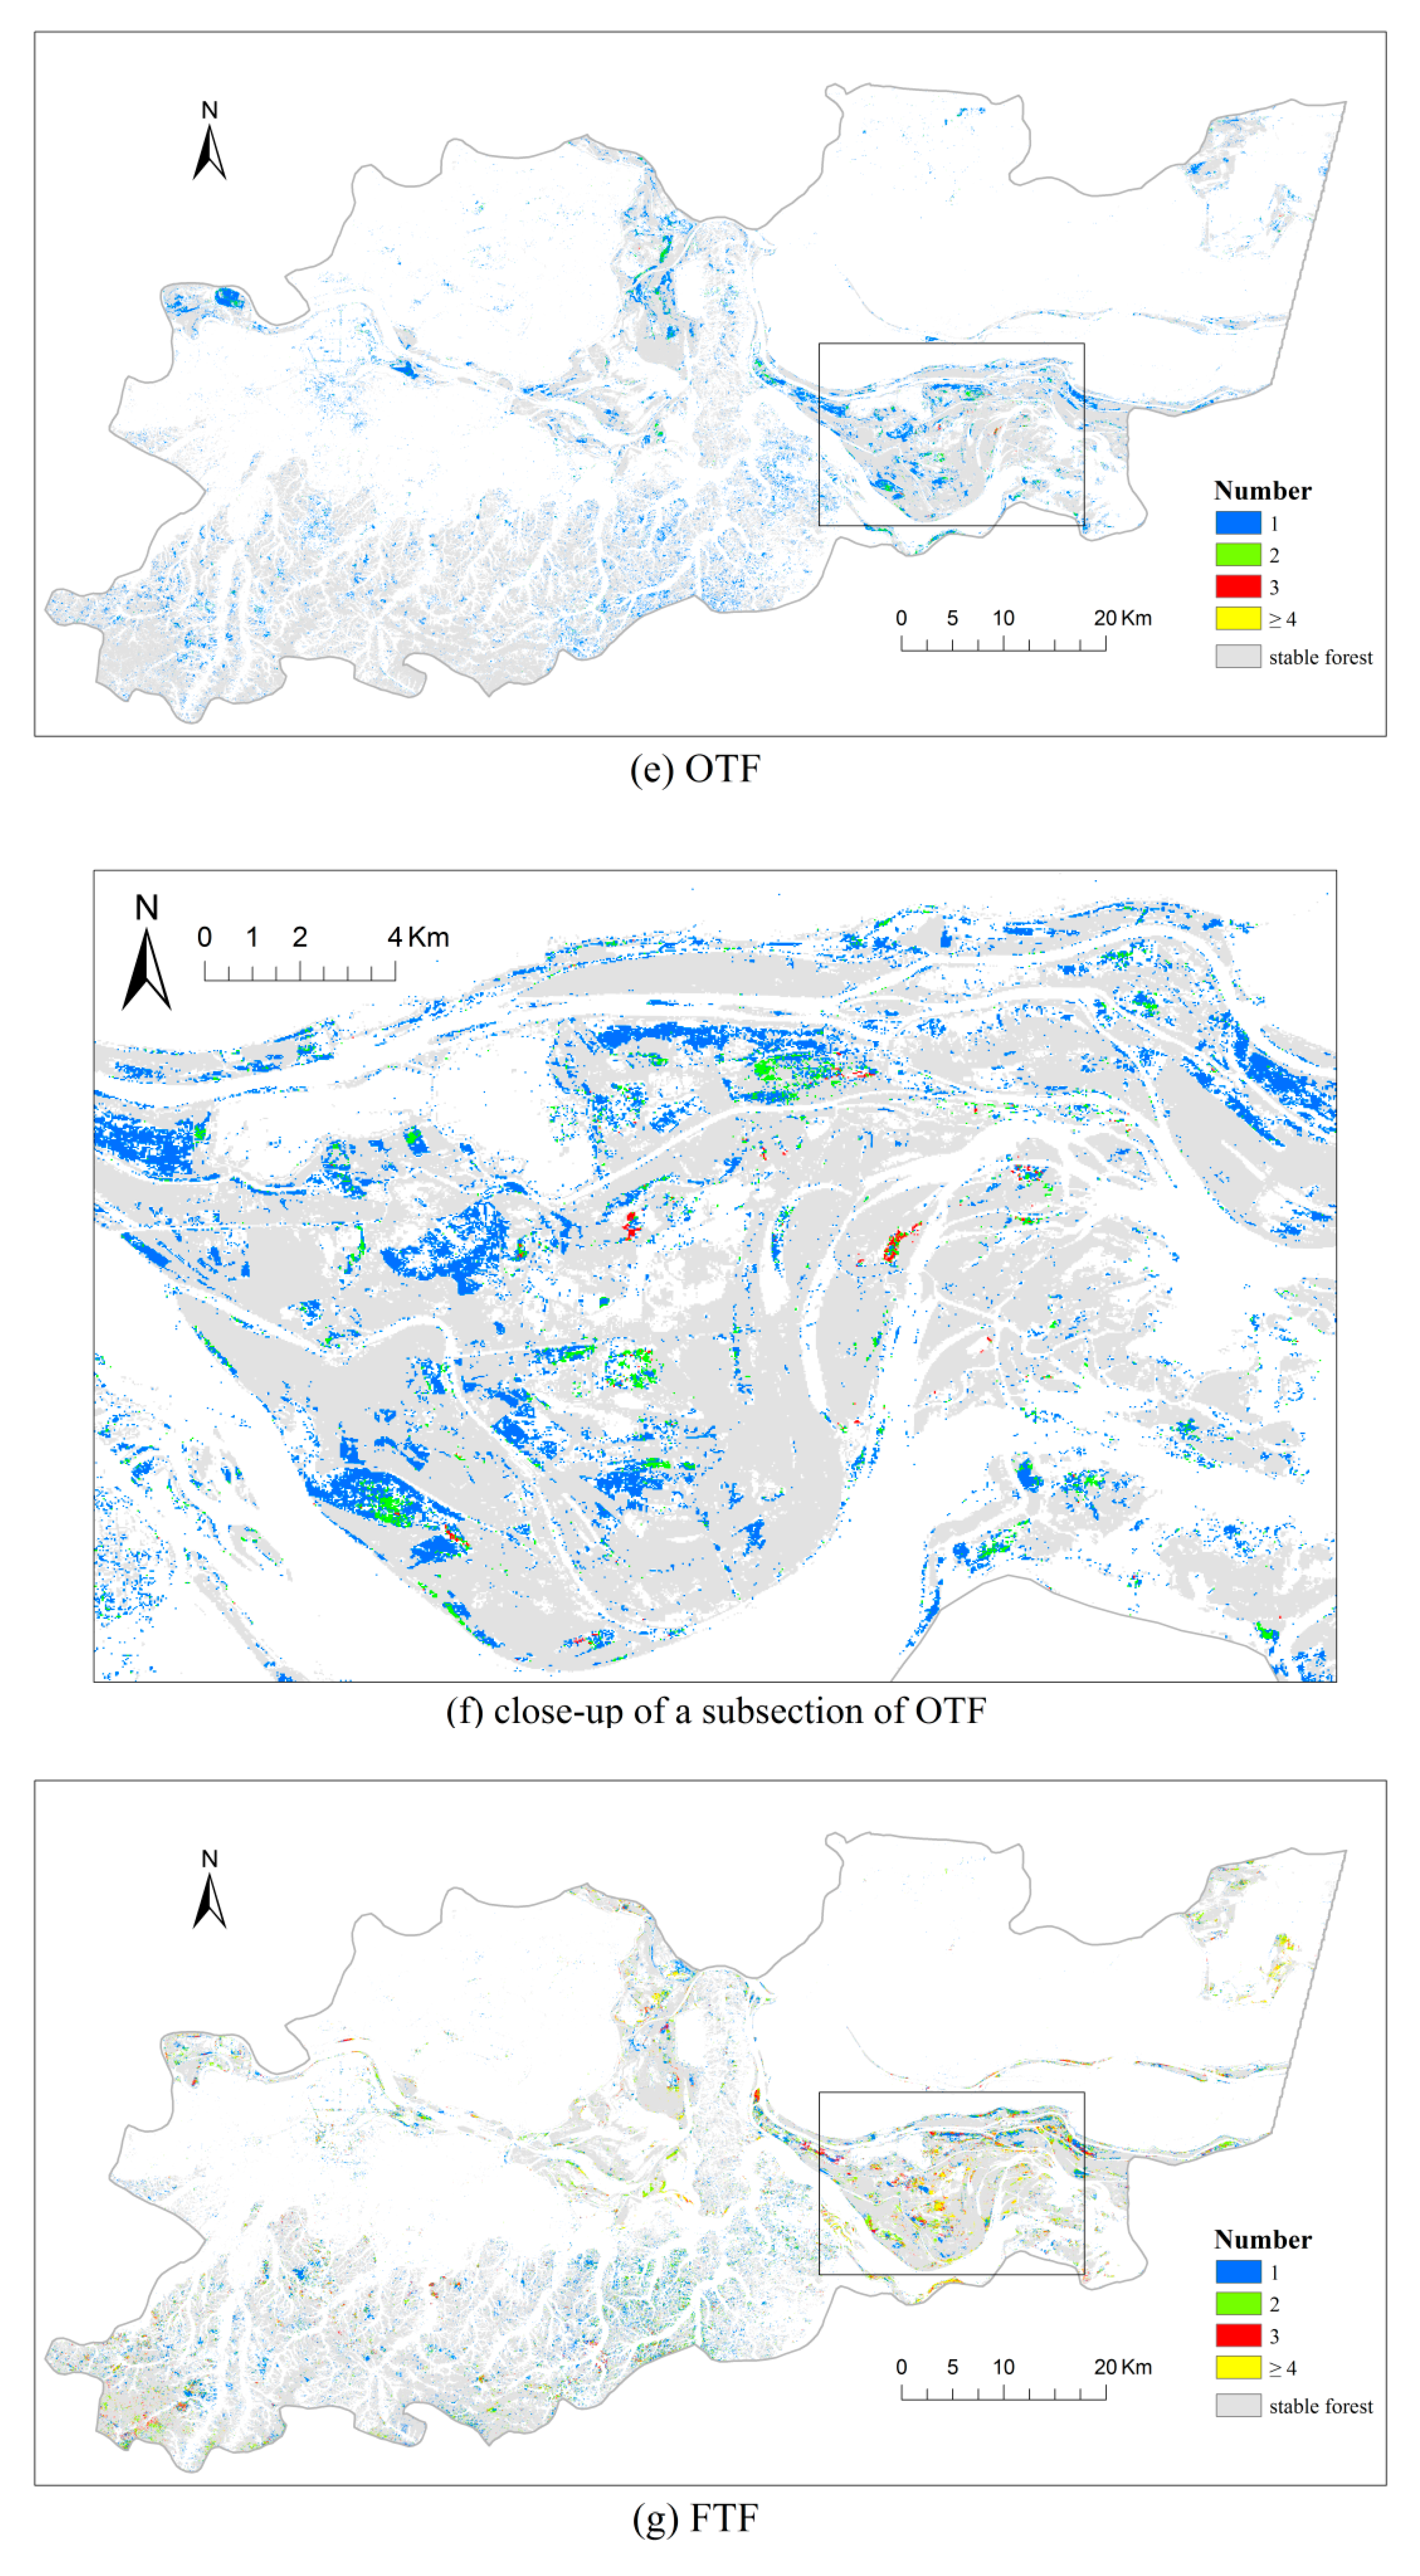
Although the proportion of forests in the core zone is lower than that in the transition zone, the proportion of changed forests in all the forests in the former is higher than that in the latter, especially in the areas with low elevation. The forests in the core zone are mainly distributed in the region with DEM ranging from 20 to 40 m, while over two-thirds of the forests in the transition zone were planted in the region with DEM exceeding 40 m (
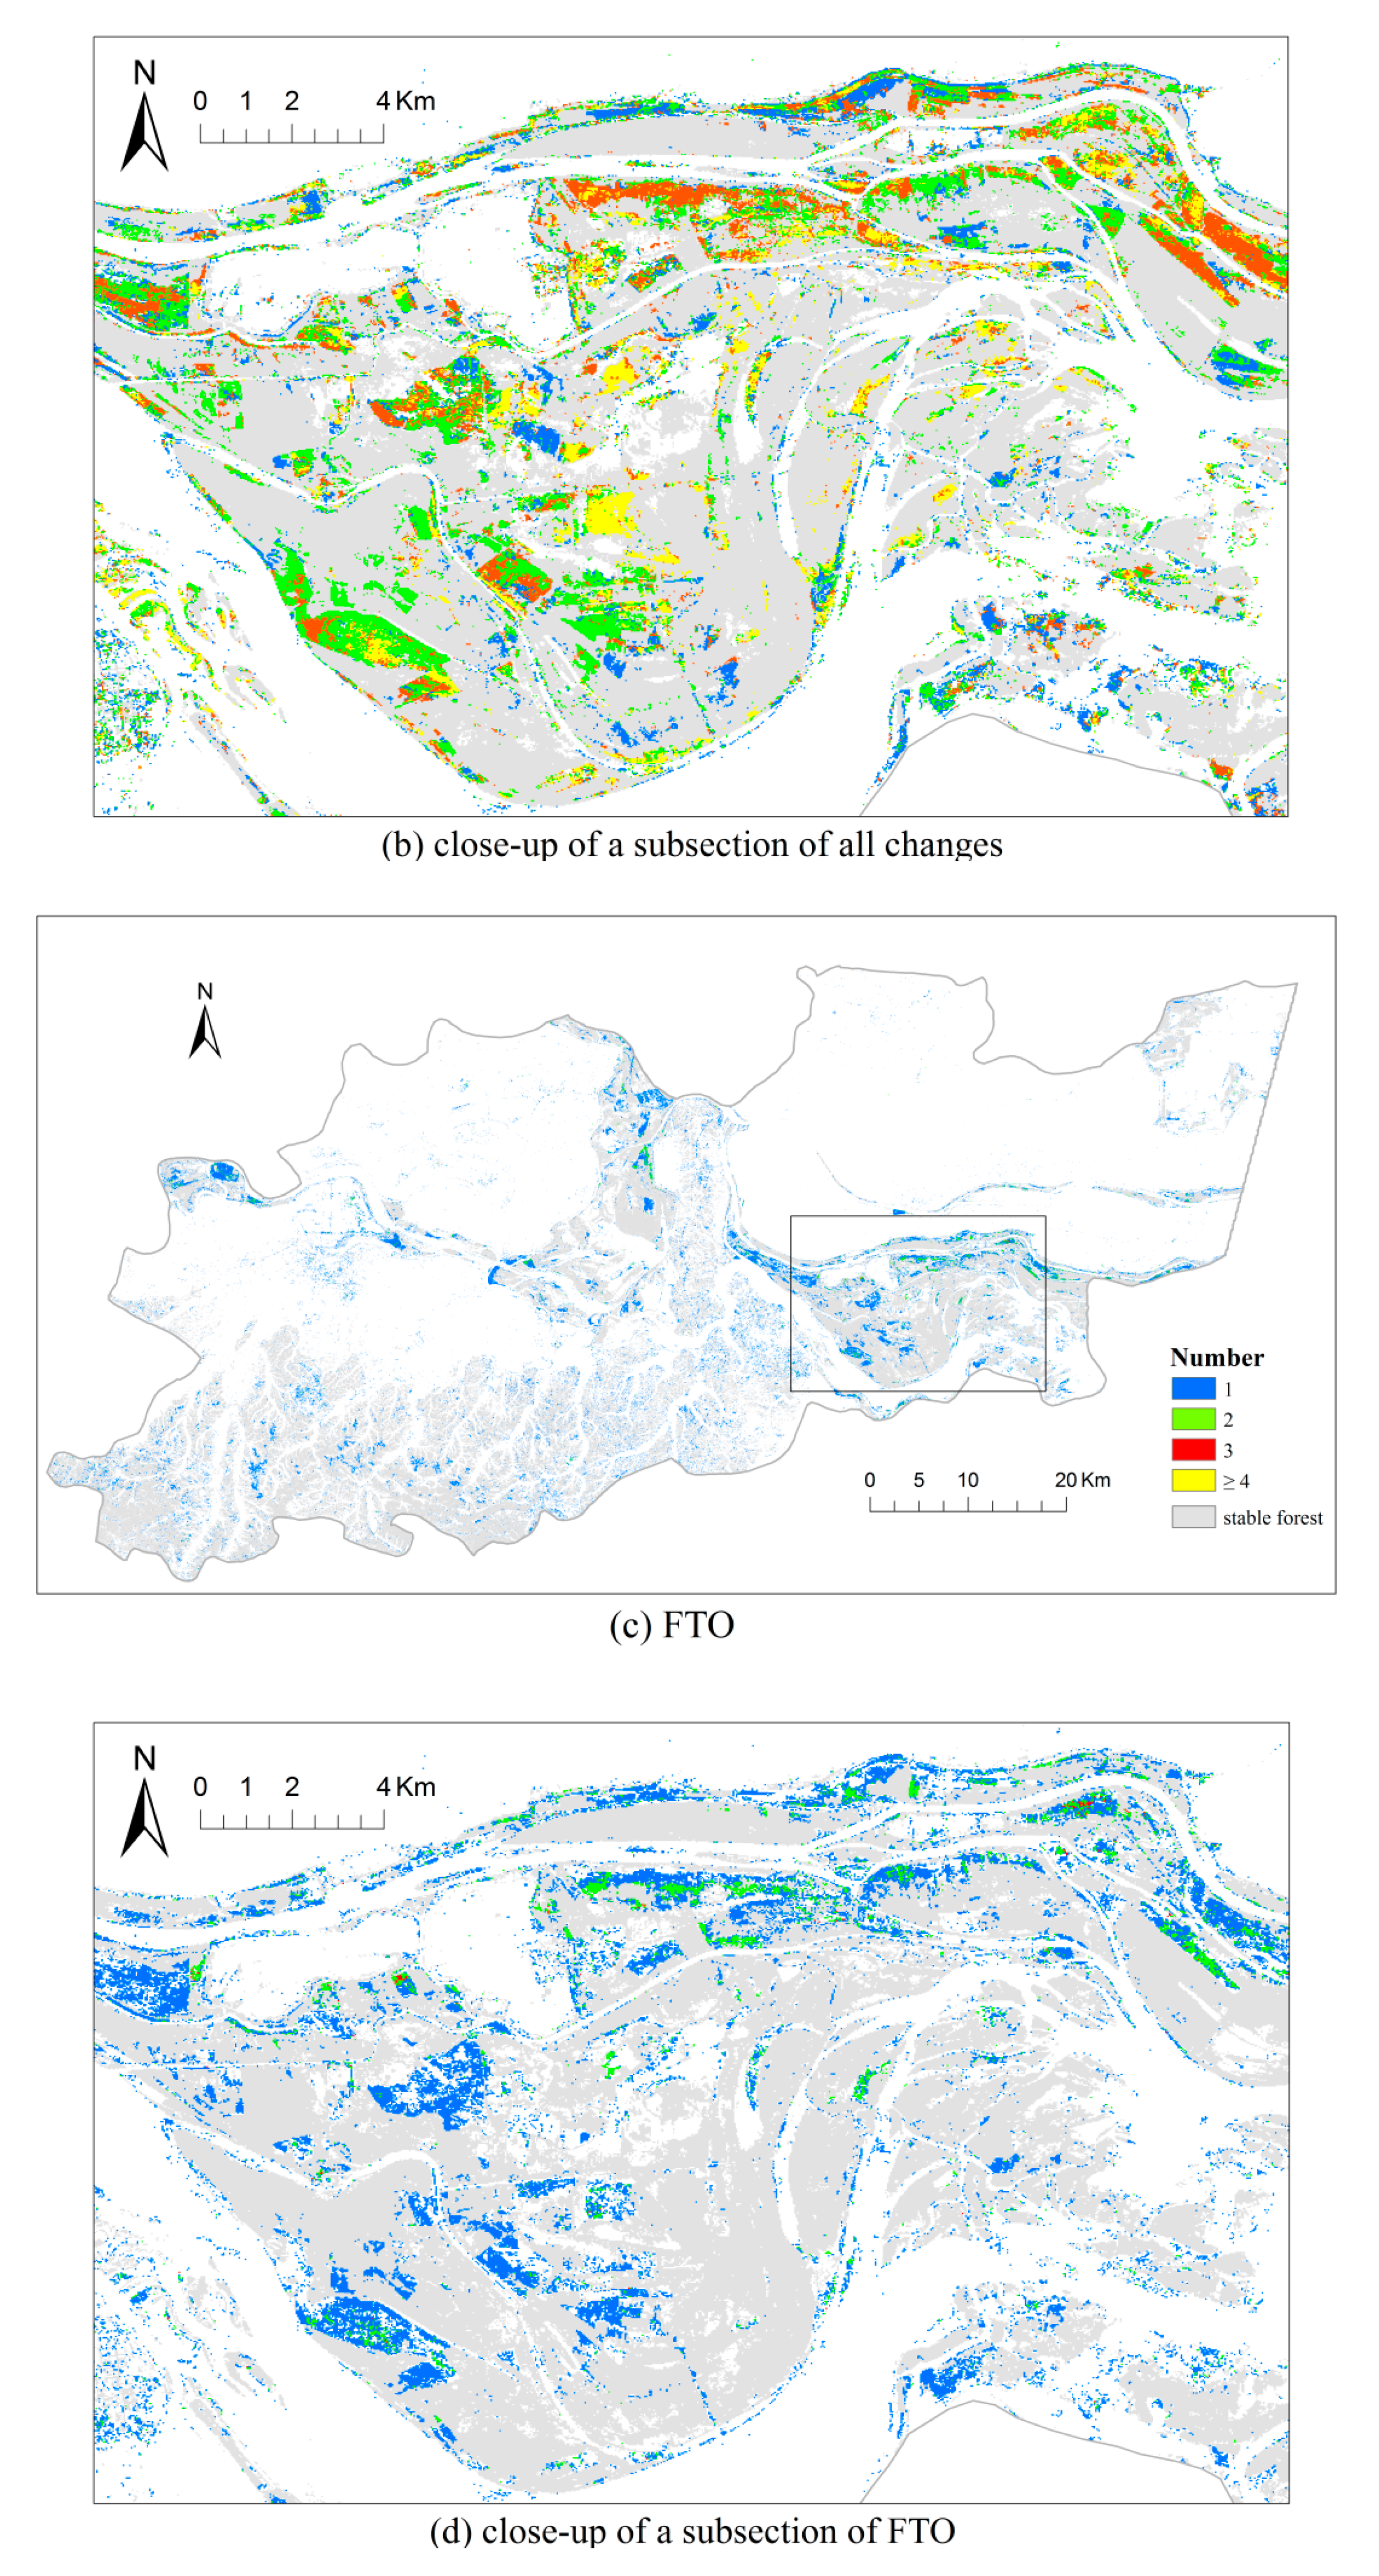
Table 8), and these forests are concentrated in the southwestern mountain with DEM over 50 m. Therefore, the forests with low elevation surrounding the water body in the core zone are easily flooded, which increases the number of FTF. In addition, the variation of timber price caused other land cover categories, such as cropland or shoal, to be switched to forest and replantation post-deforestation when prices rose, or the forest to be switched to other land cover when the price fell because of economic profit motivation, increasing the number of OTF or FTO. Meanwhile, the southwestern mountain with high elevation is suitable for tree plantation and unsuitable for growing crop and settlement, which leads to a relatively low proportion of OTF and FTO compared with the proportion of OTF and FTO in the core zone. These situations result in a high change frequency in the core zone.
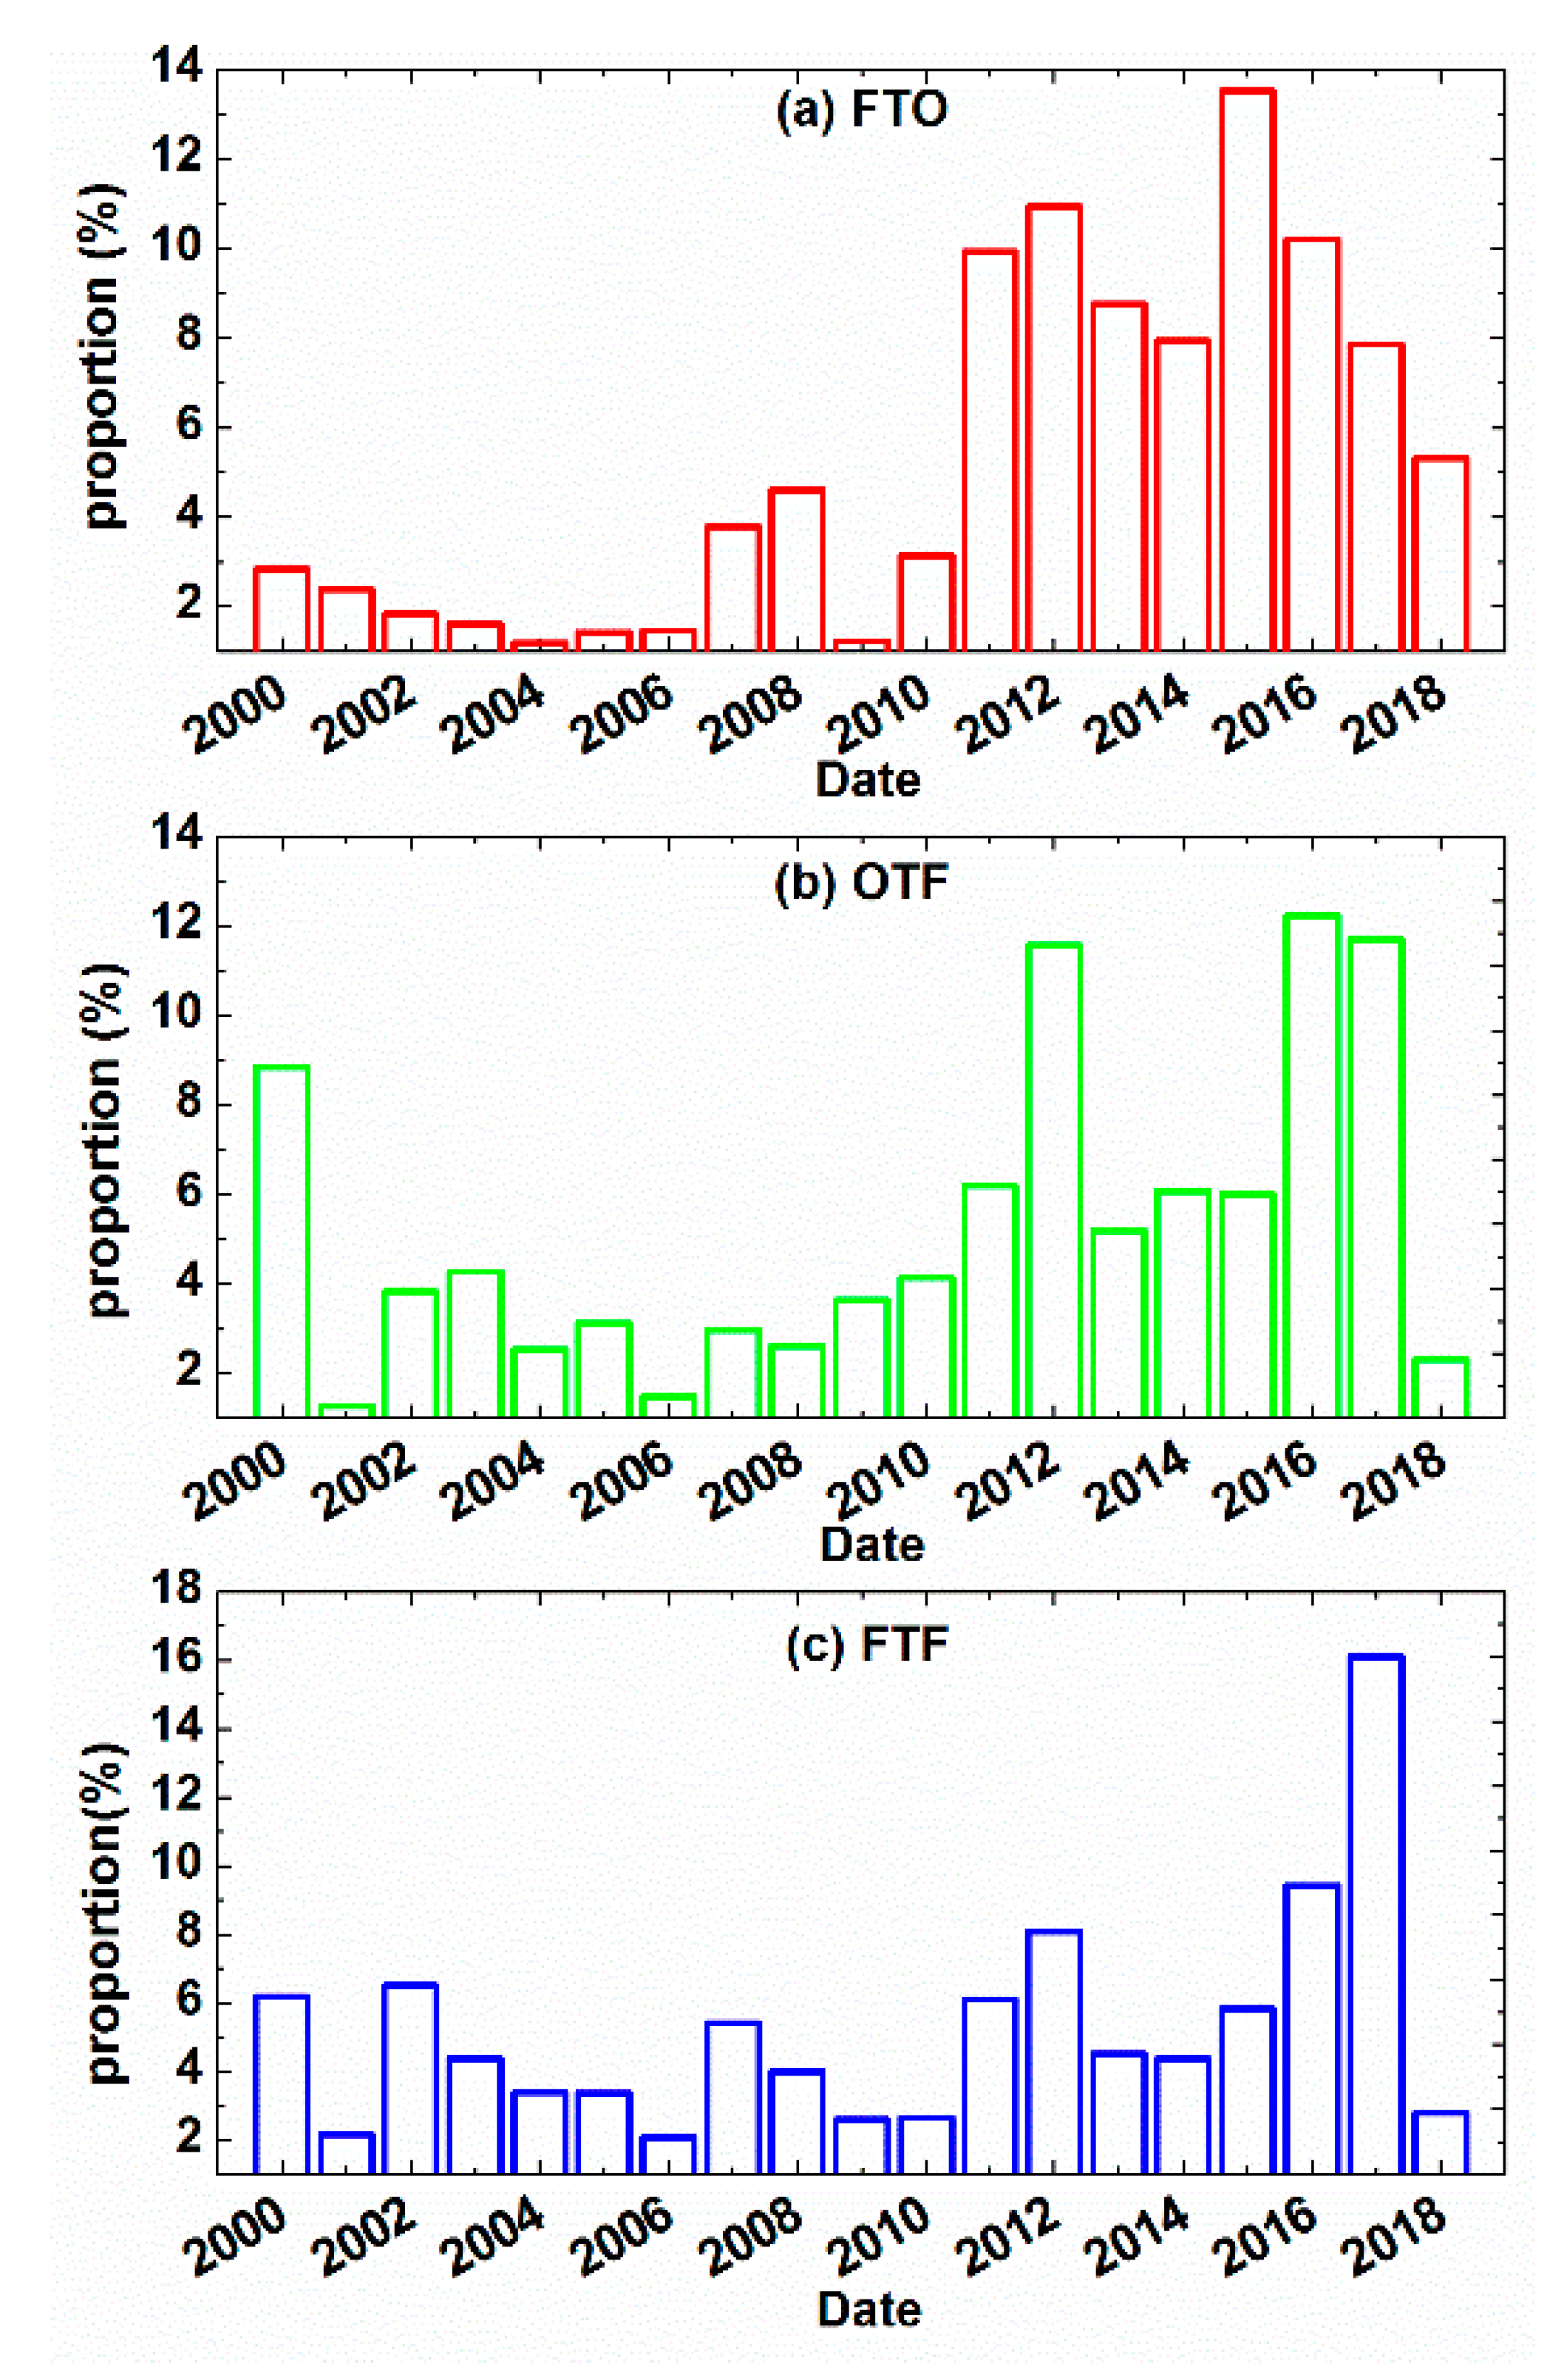
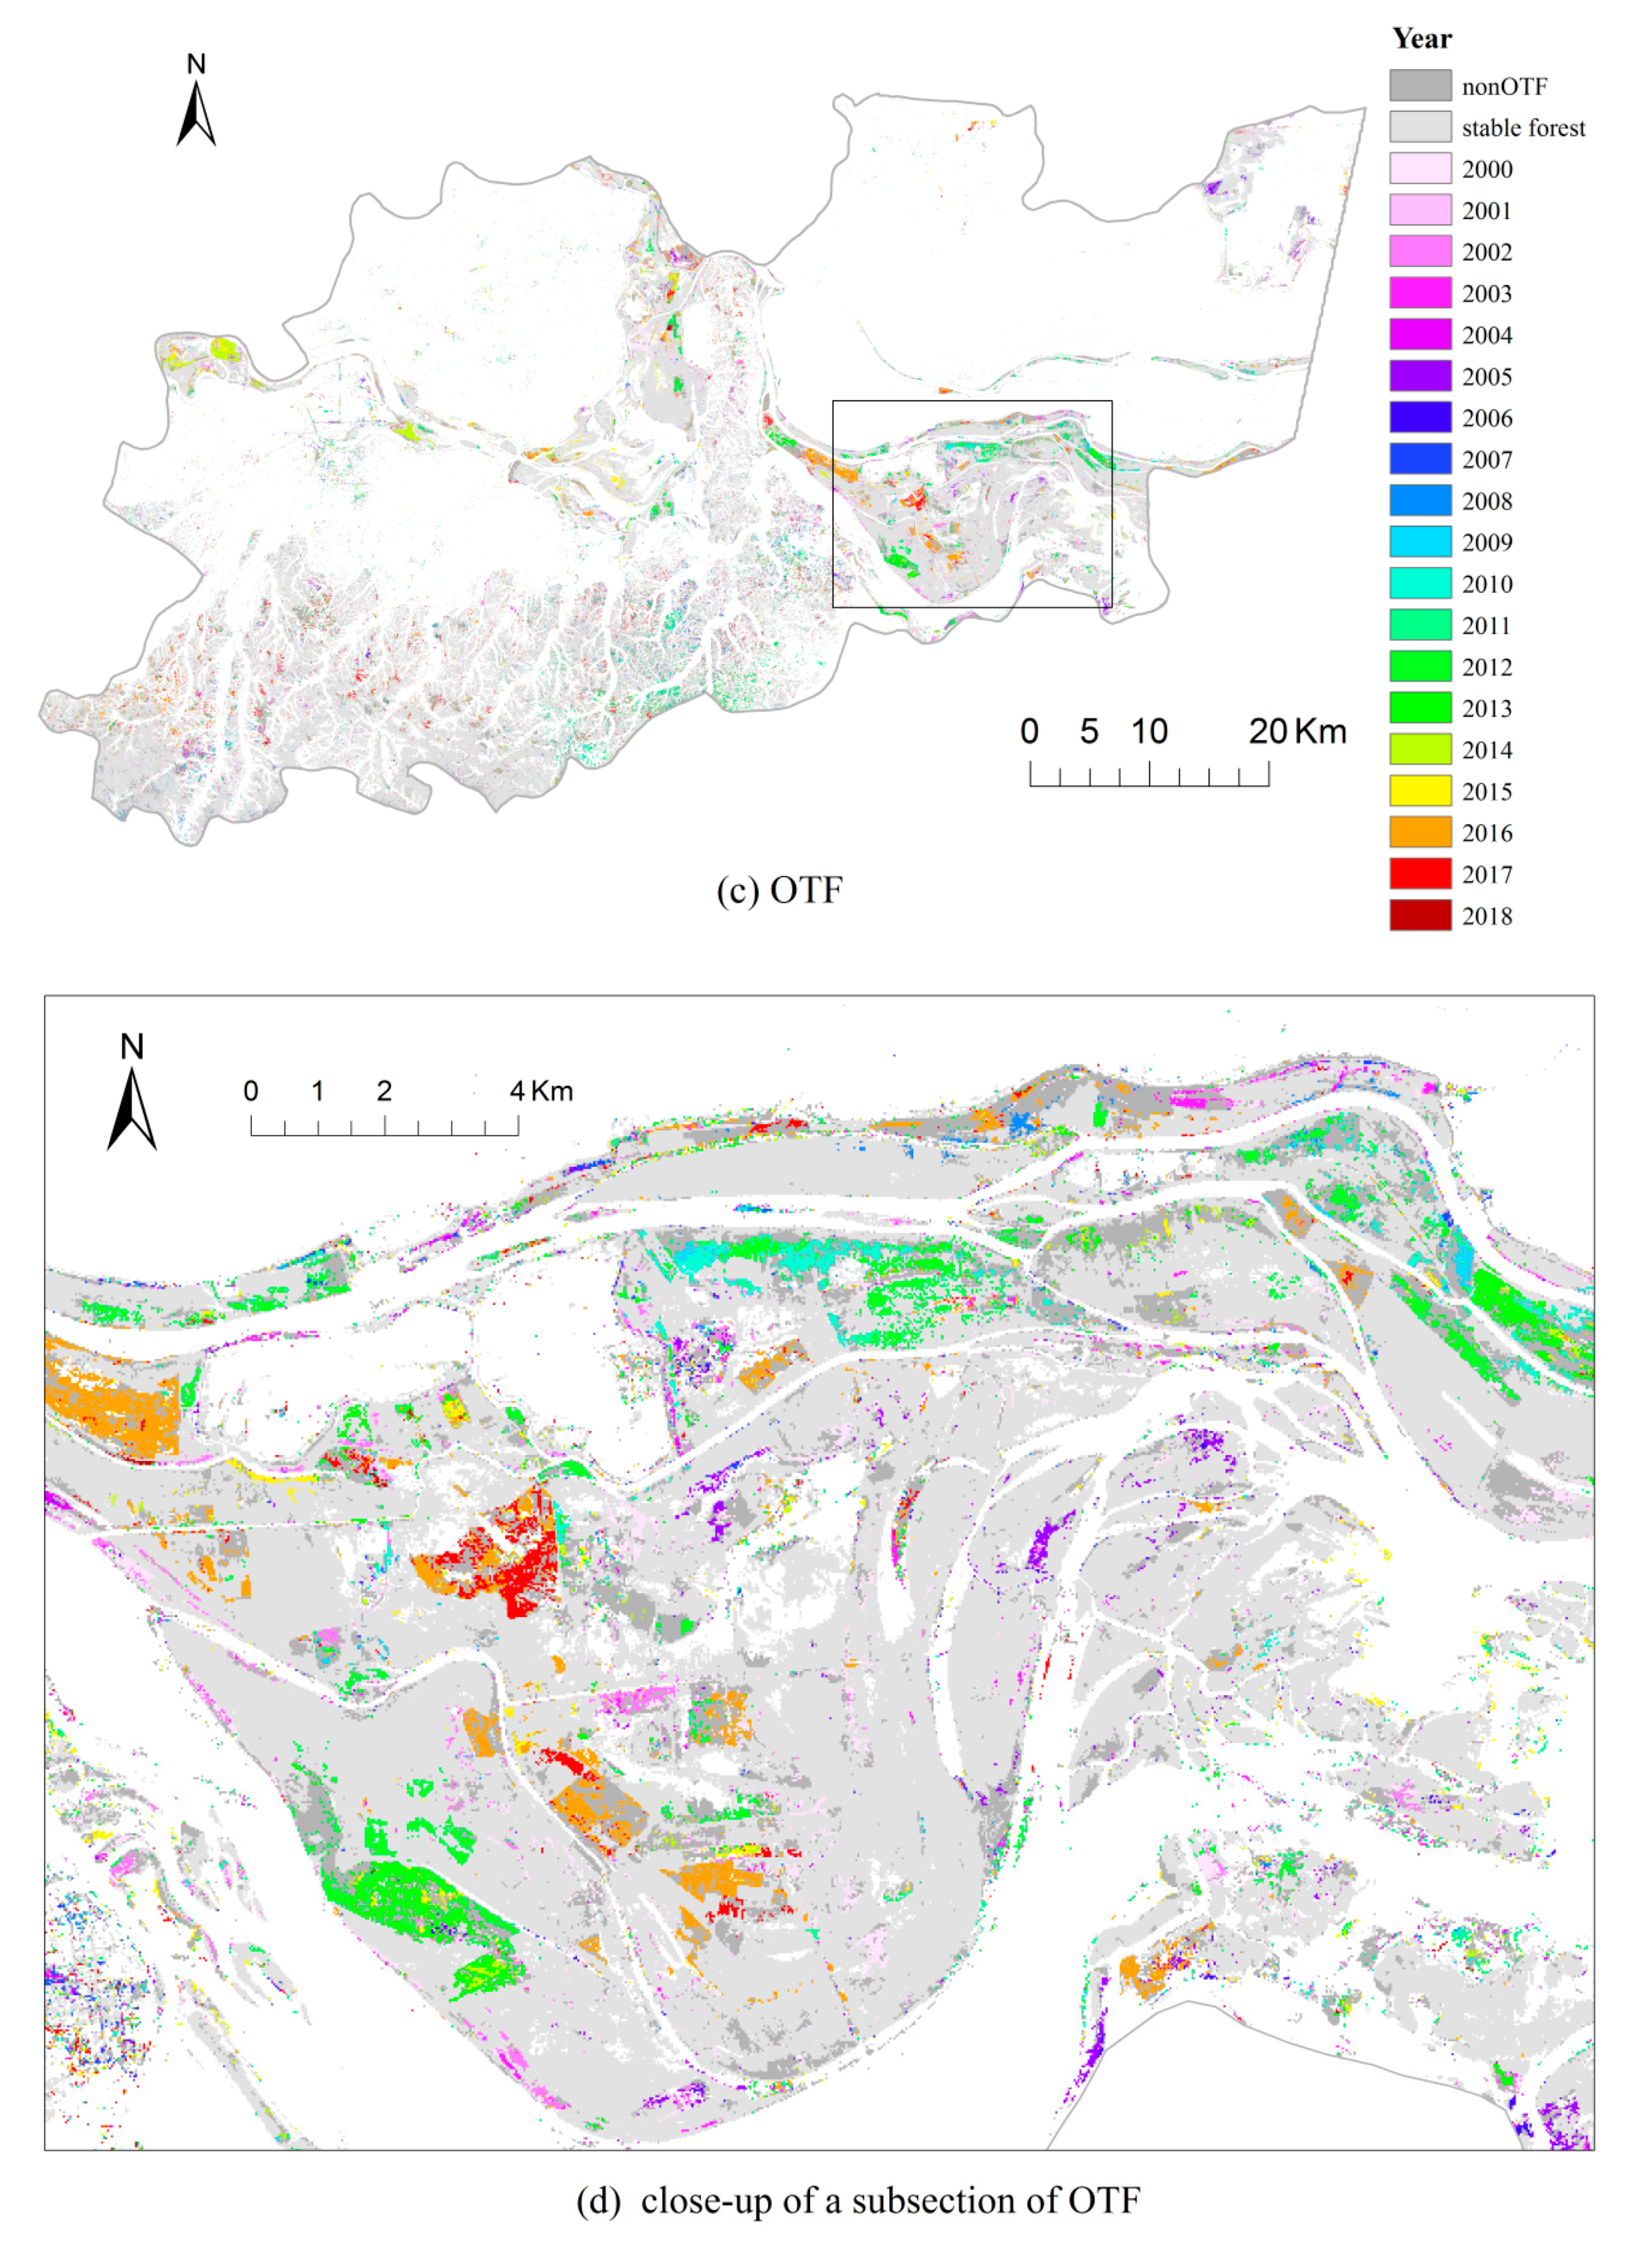
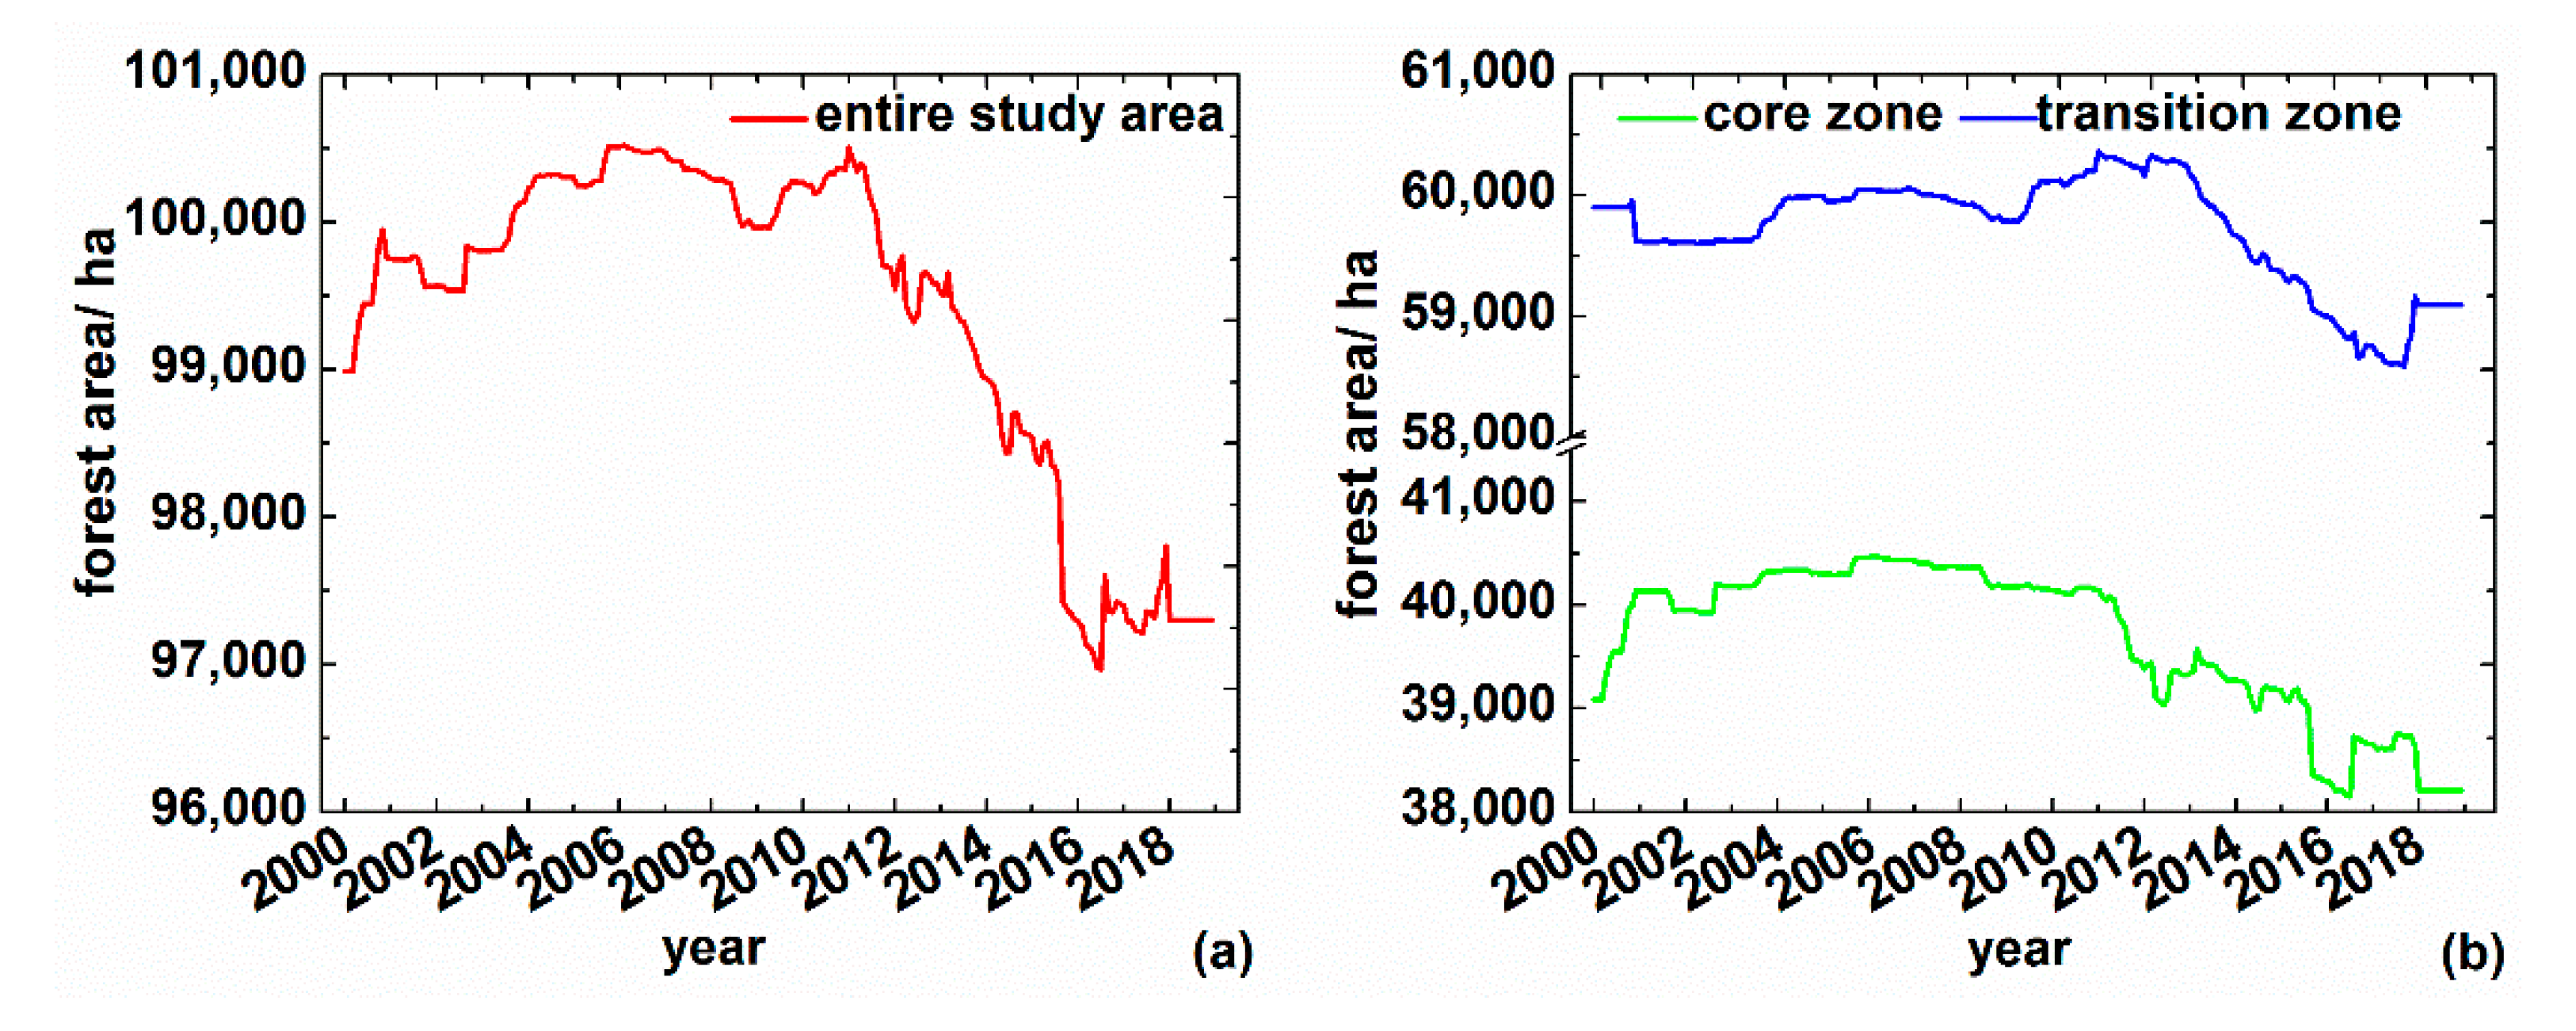
The low grain price and high timber price, policy incentives and market demand resulted in a rapid expansion of forest plantation in the West Dongting Lake region from 2000 to 2005. The early expansion mainly occurred in the core zone, and then in the transition zone since 2003. One potential factor is the transferal of parts of forest plantation from the core zone surrounding the water body to the transition zone due to TGD raising the water level of Dongting Lake. A possible reason for forest areas keeping relatively steady from 2006 to 2011 is a recovery in the grain price and stable timber price. Since 2011, a series of policies for protecting wetlands and restoring ecology made by the local government, especially the project of returning forest to wetland after 2013, forbade poplar plantation in the Dongting Lake region. It is the key driver of the difference of changes between before and after 2011. These policies have led to a continuing decline of the forest areas since 2011, except for the forest areas in the core zone sharply fluctuating with the fluctuating price of timber in 2014 and 2016. The policy of cleaning the poplar plantation in 2017 further accelerated the transferal of forest plantation from the core zone to the transition zone, resulting in a decline of forest areas in the core zone and an increasing trend in the transition zone during 2017. It also explained the high proportions of OTF and FTF in 2017 (
Figure 10b,c). Therefore, the variation trend of forest areas indicated that anthropogenic factors, such as government policies and economic profits, are the dominating drivers of forest plantation in the West Dongting Lake region.
Results in this study effectively showed not only the final results of forest variations, but also the spatiotemporal dynamic process of forests and the potential drivers in West Dongting Lake, providing abundant knowledge for wetland ecosystem protection.


 ,
, 


