Article

Active Tectonics of the Frontal Himalayas: An Example from the Manzai Ranges in the Recess Setting, Western Pakistan

Department of Earth & Atmospheric Sciences, University of Houston, Houston, TX 77204, USA
*
Author to whom correspondence should be addressed.
Remote Sens. 2020, 12(20), 3362; https://doi.org/10.3390/rs12203362
Submission received: 8 September 2020 / Revised: 11 October 2020 / Accepted: 13 October 2020 / Published: 15 October 2020
(This article belongs to the Special Issue Advances of Remote Sensing in Environmental Geoscience)

Abstract

:
The Himalayan main frontal thrust (MFT) accommodates most of the present-day Indo–Asia convergence with related periodic earthquakes. The seismicity and deformation mechanism varies considerably across the frontal Himalayas. We mapped a segment (Manzai Ranges) of the MFT at the western margin of the Himalayas and analyzed its deformation mechanism and active tectonics using geomorphic indices and the Interferometric Synthetic Aperture Radar (InSAR) Small Baseline Subset (SBAS) technique. Two frontal thrust faults (Khirgi and Jandola) were mapped using Sentinel-2B band ratios in the study area. Water gaps were present in the form of deflected streams at the tip of the growing anticlines. The C-band RADAR interferometry (Sentinel-1A) showed an average uplift of 5–9 mm/year in the satellite line of sight (LOS) from May 2018 to October 2019. The velocity profiles show an uplift variation across the anticlines and may be related to the displacement transfer from the zone of compression in the Manzai Ranges to the zone of transpression in the Pezu–Bhittani Ranges. Four types of morphometric analyses were carried out to assess the relative tectonic activity, namely mountain front sinuosity index (Smf), valley floor width to height ratio (Vf), normalized longitudinal river profile, and normalized channel steepness index (Ksn). The landscape response to active tectonics in the study area was recorded as a deep fluvial incision in V-shaped valleys, convex river profiles, topographic breaks as knickpoints, and a high Ksn index. The geomorphic parameters show a relative increase in tectonic uplift and deformation from the Kundi anticline to the Khirgi and Manzai anticline. We concluded that the frontal structures in the western Himalayas are still going through an active phase of deformation and landscape development with both seismic and aseismic creep.

Graphical Abstract

1. Introduction

The Indo–Asia collision created the ~2500 km-long seismically active Himalayan mountain belt (55 Ma) [1,2]. The main frontal thrust (MFT) marks the southern boundary of this collisional zone (Figure 1). This youngest frontal thrust of the foreland fold and thrust belt of the northwestern Indian plate lacks a detailed quantitative landscape assessment to categorize the relative tectonic activity. The MFT’s active growth and development are essential for understanding the mechanism of deformation and preparing for the future hazards associated with active tectonics. The geodetic data show the movement of the Indian plate at a rate of ~35 mm/year and ~38 mm/year in the northwestern and northeastern margin, respectively [3]. Lave and Avouac [4] proposed that the MFT accommodates most of the present-day Himalayan deformation. The calculated deformation in the northwestern, central and eastern Himalayas are 9 ± 3 mm/year [4,5], 21 ± 1.5 mm/year [6,7], 23.4 ± 6.2 mm/year [8], respectively. The MFT is a narrow zone with a high degree of cross-sectional taper in the central and eastern Himalayas; however, it is more than 100 km wide, with a low degree of cross-sectional taper in the western Himalayas, Pakistan [9,10]. Moreover, the trend of regional structures shifts abruptly from NW–SE in the central and eastern Himalayas to NE–SW in Pakistan, which is attributed to an anti-clockwise rotation of the Indian plate [11].
The western Himalayas in north Pakistan extend from the Jhelum Basement Fault in the east to the Ophiolite Belt in the west [12]. The MFT in the western Himalayas was categorized as Salt and Trans Indus Ranges (TIR). The western and central Salt Range show an average of 10 and 5 mm/year of southward translation over the Punjab Foreland inferred from Interferometric Synthetic Aperture Radar (InSAR) and geodetic studies [13,14,15]. However, the TIR was separated by the active, transpressional Kalabagh Fault zone that shows an average displacement of 5.3 mm/year [16,17]. Blisniuk et al. [18] and Abir et al. [19] proposed that the Salt Range Formation forms the basal detachment along the MFT in the western Himalayas, and across-strike structural variations are related to basement ramping. In addition, the chronostratigraphic studies of the molasses suggest an earlier thrusting along the Salt Range Thrust (SRT) (~2.5 Ma) than the TIR (~1 Ma), indicative of active quaternary tectonics [20]. This implies that the TIR (an extension of MFT) in the western Himalayas represents the youngest collisional phase and are still undergoing active deformation [21,22].
The TIR are sub-divided into the Surghar Ranges, Marwat–Khisor Ranges, Bhittani Ranges, and Manzai Ranges. These ranges have pronounced lateral structural variations and show compressional deformation along the salient and recess and transpressional deformation along the flanks (strike–slip faults) [10,18]. The Marwat–Khisor salient separates the two prominent Kalabagh and Tank recesses in the TIR. Most recent studies conducted in the Kangra and Dehradun recesses separated by Nahan salient in the central Himalaya and Gorubathan recess and Dharan salient in the eastern Himalaya indicate active tectonics and across-strike variation in deformation by forming transitional structures such as oblique or lateral ramps (Figure 1) [23,24,25,26]. However, the active tectonics and the deformation mechanism in the recesses of the western Himalayas are poorly constrained.
This study analyzes the structural and tectonic variation of the frontal fold–thrust belt in the Tank recess. This study will help to understand the tectono-geomorphic evolution of the western Himalayas in one of the less studied regions. Our study will contribute to understanding (1) the deformation pattern in the Himalayan recess and its lateral variation extending from Bhutan, Nepal, India to the Pakistan Himalayas, (2) the relative and InSAR-derived displacement rate of the major tectonic elements relative to the western Salt Range, and (3) the landscape development in response to the active tectonics of the western Himalayas.

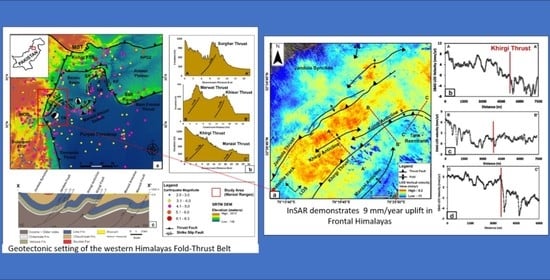
2. Geotectonic Setting of the Study Area

The study area comprises the Manzai Ranges, the westernmost extension of the Trans Indus Ranges surrounded by the densely populated towns of Tank, Bannu, and Jandola in the south, northeast, and northwest, respectively. This represents the youngest mountain segment of the active frontal thrust in the western Himalayas and constitutes the Tertiary Siwalik sediments all along its map trace [18,27]. The major structural elements of this fold–thrust belt are the Khirgi Thrust, Jandola Thrust, Manzai anticline, Jandola anticline, Khirgi anticline, Kundi anticline, and Jandola syncline (Figure 2a). The Khirgi Thrust has truncated the doubly plunging Kundi and Khirgi anticlines in the core, while the Jandola anticline is disrupted by the Jandola Thrust along its map trace [28]. The MFT, locally known as the Khirgi Thrust, places the older Chinji and Nagri Formations over the younger Chaudhwan Formation in the Tank recess. Younger alluvial surfaces concealed the fault trace, and the frontal thrust is recognizable only in a few sections. The northwest–southeast oriented compression initiates the formation and development of east-verging and northwest-dipping thrusts, showing an eastward advance of the tectonic deformation [29]. Laterally, it merges with the transpressional Pezu transfer fault system along the Tank recess in the east. The western boundary is represented by an obducted Waziristan Ophiolitic Belt (WOB) or Melange zone. In contrast, the northern and southern boundaries are marked by the transpressional Kurram Thrust (KT) and Suleiman Fold-and-Thrust belt (SFTB), respectively [27,28].
The hanging wall of the thrust sheet has a hectometric scale anticlinal and synclinal structures, showing gentle dips of ~20°–45°. Structural complexity increases towards the Melange zone to the west, where the Manzai Ranges merges with the SFTB. The surface geology implicates a thin-skinned deformation style representative of compressional tectonics (Figure 2b). These thrusts join a basal detachment at a depth of 8.5 km [28]. The drainage network flows perpendicular to the major structural lineaments, eroding the quaternary alluvial deposits. The study area has low topographic ridges of sandstone interbedded with claystone and conglomerate beds of the Siwalik Group (Pliocene) [27]. Most of the quaternary deformation associated with the frontal thrusts has modified alluvial fans’ geometry, terraces, and boulder deposits. The seismicity pattern is uniformly distributed along the range front thrust with tens of events <5 Mw (Figure 2a). However, a few shallow earthquakes with magnitudes of 6.3 (16.3 km deep) and 5.8 (10 km deep) that occurred in the Kohat Fold–Thrust belt (1992) and eastern Salt Range (Jhelum Fault) (2019) were more destructive, claiming the lives of dozens of people [30,31].

3. Materials and Methods

3.1. Remote Sensing

The Sentinel-2 mission provides the continuity of the Landsat and SPOT missions to acquire land cover classification maps with a short revisit cycle (five days for Sentinel-2A and B) and has been found very useful for geological applications [34,35]. Two images of Sentinel-2B, in conjunction with the previous mapping [27,28], were analyzed in detail for geological mapping and the structural interpretation of the Manzai Ranges. The multi-spectral instrument (MSI) of Sentinel-2B has thirteen spectral bands with a spatial resolution of 10, 20, and 60 m in the Visible Near Infra-Red (VNIR), Near Infra-Red (NIR), and Short-Wave Infra-Red (SWIR) bandwidth, respectively [36]. The study area has very little to no vegetation, and the scenes analyzed were acquired during the winter of November 2019 with 0% cloud cover. The images have the product type L2A, which is geometrically, radiometrically, and atmospherically corrected by the European Space Agency (ESA) using the Sentinel-2 toolbox. Additionally, the product L2A shows the bottom of atmosphere reflectance. Finally, both scenes were stitched together seamlessly to cover the extent of the study area.
The VNIR (2, 3, 4, 8), NIR (5, 6, 7), and SWIR (11, 12) bands were used in this study. Spectral characteristics were enhanced by band ratios by dividing one spectral band by another. Band ratios 12/7-12/3-12/11 (Figure 3a), 11/12-12/7-8/11 (Figure 3b), and 8/11-11/12-12/7 (Figure 3c) were found useful to differentiate the different types of sedimentary rocks and alluvial deposits. Geological mapping by Hemphill and Kidwai [27] was helpful as a reference map in our study area. High-resolution (12 m) Tandem-X Digital Elevation Model (DEM) data were obtained from the German Aerospace Center. DEM and Hillshade images were used to extract the stream network, drainage anomalies/deflection (Figure 3d), river offsets, and fault scarps.

3.2. InSAR (SBAS) Processing

InSAR is a powerful technique that measures surface deformation relative to the satellite line of sight (LOS) by calculating an offset between the incident and return waves [37]. It provides a low-cost and short-time measurement of ground displacement [38]. A small baseline subset (SBAS) is an advanced interferometric technique that uses short spatial and temporal baseline to measure the surface deformation. Recent neotectonic studies successfully employed the SBAS technique to estimate the displacement rate along faults. Examples include a creep along the Chaman Fault System and Salt Range Thrust in west Pakistan [13,39,40], the Altyn–Tagh Fault in China [41], and the growth faulting in Houston, Texas [42].
The launch of Sentinel-1A (S1) satellite by the ESA in 2014 provided day and night and all-weather C-band data with a shorter revisit cycle (12 days) than the European Remote Sensing (ERS) 1/2 and the Envisat mission [43,44]. For this study, 90 ascending S1 images extending from 10 May 2018, to 20 October 2019, were acquired from the ESA sentinel data hub. Figure 4 summarizes the processing steps and the parameters employed to measure the displacement rate along the frontal Khirgi Thrust in the Manzai Ranges with the Sarscape module of ENVI software. Sentinel-1A data specification and the mean coherence of the 380 interferograms used for this study are shown in Supplementary Data (Figure S1, Table S1).

3.3. Geomorphic Indices

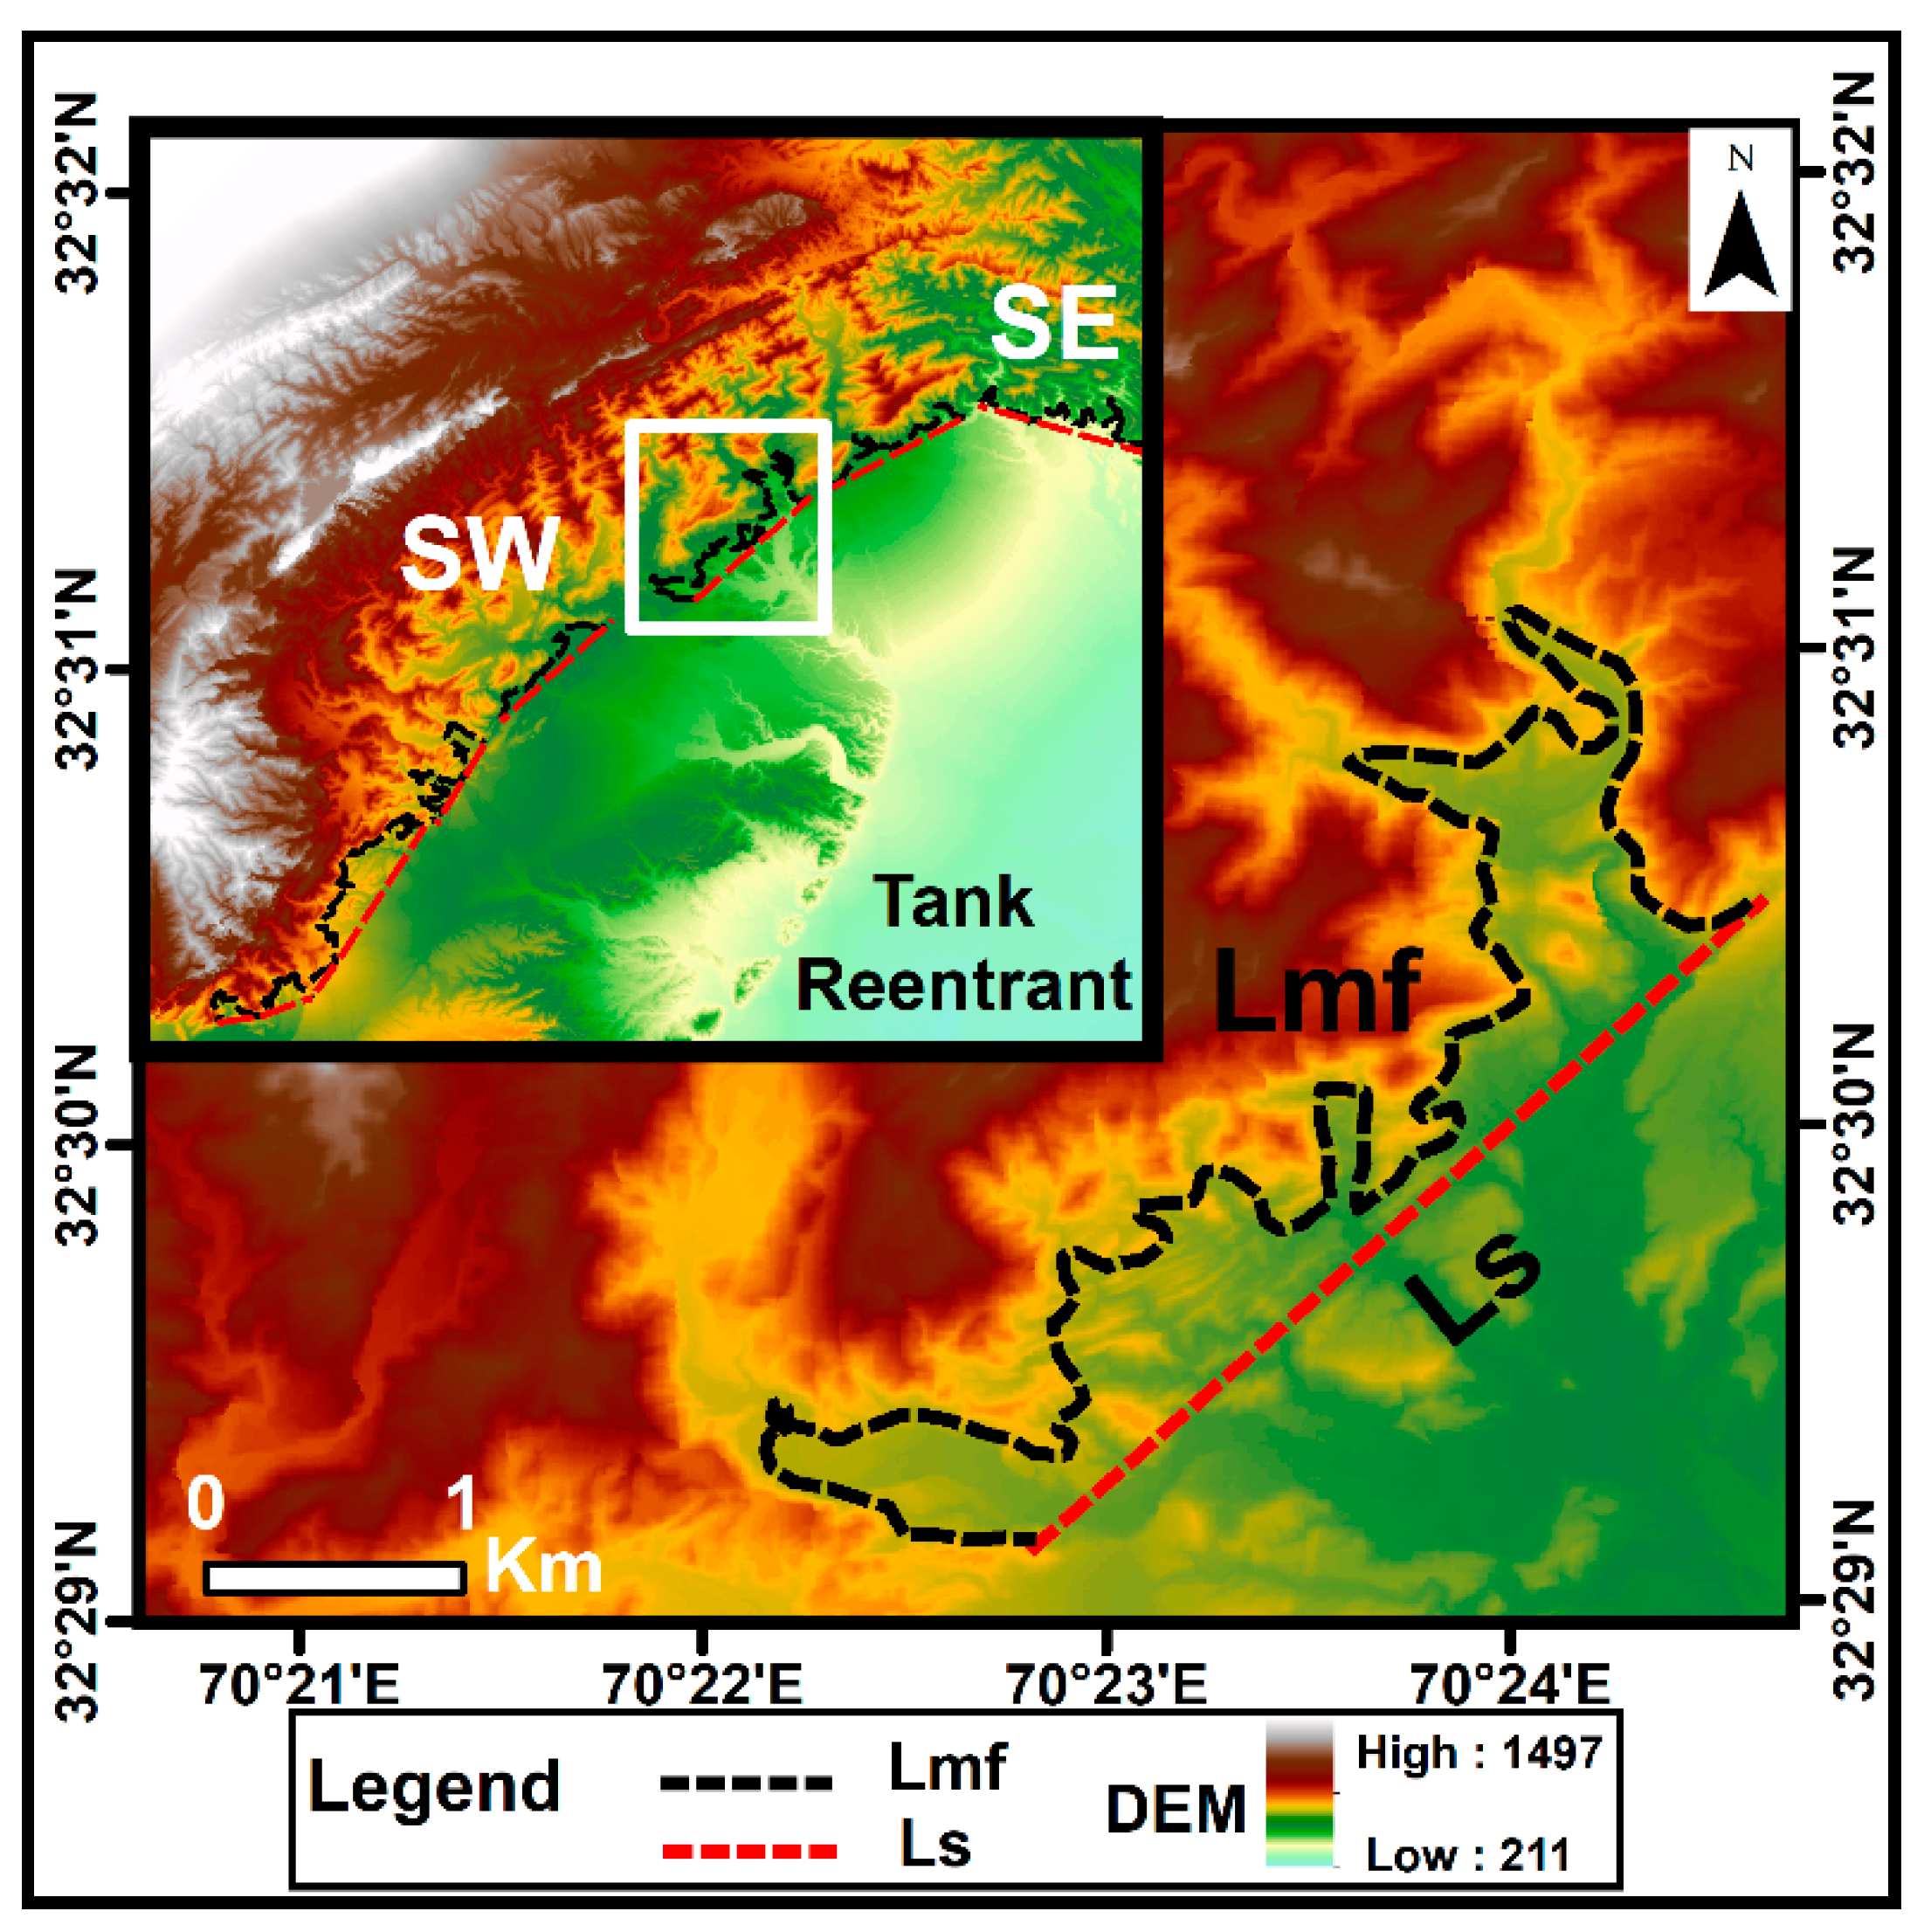
3.3.1. Mountain Front Sinuosity (Smf)

The fault-bounded topographic escarpment represents the mountain fronts in the fold–thrust belt (FTB) and their geomorphological characteristics hold important information about the past and current tectonic activity [45]. Mountain front sinuosity was defined by Bull [46] as:
Smf = Lmf/Ls
where Lmf represents the length of the mountain front along the foot of the mountain (slope break), and Ls represents the straight-line length of the mountain front. This study calculates Smf along the southwest and southeast segments of mountain fronts along the Manzai Ranges using high-resolution satellite imagery, a DEM, and a world topographic map with the help of the methods described by Goswami et al. [47] at a 1:30,000 map scale (Figure 5).

3.3.2. Valley Floor Width to Height Ratio (Vf)

Vf was defined by Keller and Pinter [48] to distinguish the U or V shape valley and it is expressed as
Vf = 2 * Vfw/ [(Eld − Esc) + (Erd − Esc)]
where Vfw shows valley floor width, Esc is valley floor elevation, and Erd and Eld are elevations on the right and left sides of valley divides, respectively. Vf < 1 indicates active downcutting, V-shape stream valley representative of tectonic uplift, while Vf > 1 indicates a broad U-shape valley associated with tectonic quiescence [48,49]. The higher resolution DEM-derived elevation contour and world topographic map were used to calculate Vf values for all the major channels using spatial analyst tools in ArcMap 10.7. Figure 6 shows the longitudinal and transverse swath profile and highlights the mean, minimum, and maximum elevation and local relief in the study area. The deep V-shaped fluvial incision is also visible. To get more accurate results and to avoid user bias, the Vf index was calculated twice above the specified distance of 500–1500 m from the mountain front (Khirgi Thrust). Finally, the mean Vf values were used to show the type of valley.

3.3.3. River Normalized Profiles

The longitudinal profile of rivers results from an equilibrium between the erosion rate and the tectonic uplift and has been found very useful to deduce the information related to the geomorphic history of an area [49,50]. In the state of equilibrium, the river profile shows no aggradation or degradation and shows a concave-up profile. However, it is sensitive to linear changes in a tectonically active drainage basin [51,52]. Tectonic disequilibrium and lithological variation cause changes in the river profile in the form of inflection points (known as knickpoints). The profile concavity will change accordingly both upstream and downstream. Hence, an analysis of the longitudinal river profile is important to discern these lithologic and tectonic controls. Normalized river profiles proposed by Demoulin [51] consider the normalized elevation and distance to the total channel length and relative elevation. This method calculates the profile concavity defined as the triangle percent area between the straight line connecting the source and mouth and the river profile. The normalized distance (MaxL) was defined from the source to the point of maximum concavity. We extracted and computed all trunk rivers traversing the frontal geological structures in the Manzai Ranges for their normalized river profiles from the digital elevation model using the Strahler [53] stream ordering technique in ArcMap 10.7 at a spatial resolution of 12 m (Figure 6). The computed indices are percent concavity, maximum concavity (Cmax), and maximum distance (MaxL).

3.3.4. Channel Steepness Index

An exponential relationship between the channel slope and the upstream discharge area of the graded river is described by the power law as
dz/dx = (U/K)1/n A(x)−m/n
where dz/dx represents the channel slope, U is the uplift rate, K is erodibility coefficient, A is the drainage area, and m and n are the constants [54]. The first half of the equation (U/K) is the channel steepness (ks), while the concavity index (Ɵ) is represented by m/n. The linear regression of the channel slope against the drainage area can be used to estimate the channel steepness (ks) and concavity (Ɵ). However, the concavity index has a relatively low sensitivity to the uplift rate and lithology and shows variations in a narrow range (0.4–0.6). In comparison, the channel steepness index is more sensitive to tectonic uplift (U), changes in climatic conditions and to lithology, which make it more suitable to calculate landscape dynamics [55,56,57]. The increasing availability of open source codes made the topographic analysis more efficient and effective. We used the 12 m resolution DEM to extract the drainage network and followed the methodology of Forte and Whipple (2019) to calculate the channel steepness index in the tectonically active frontal region at a fixed reference concavity of 0.45 in the graphic user interface (GUI) of the topographic analysis kit (TAK) [58].

4. Results

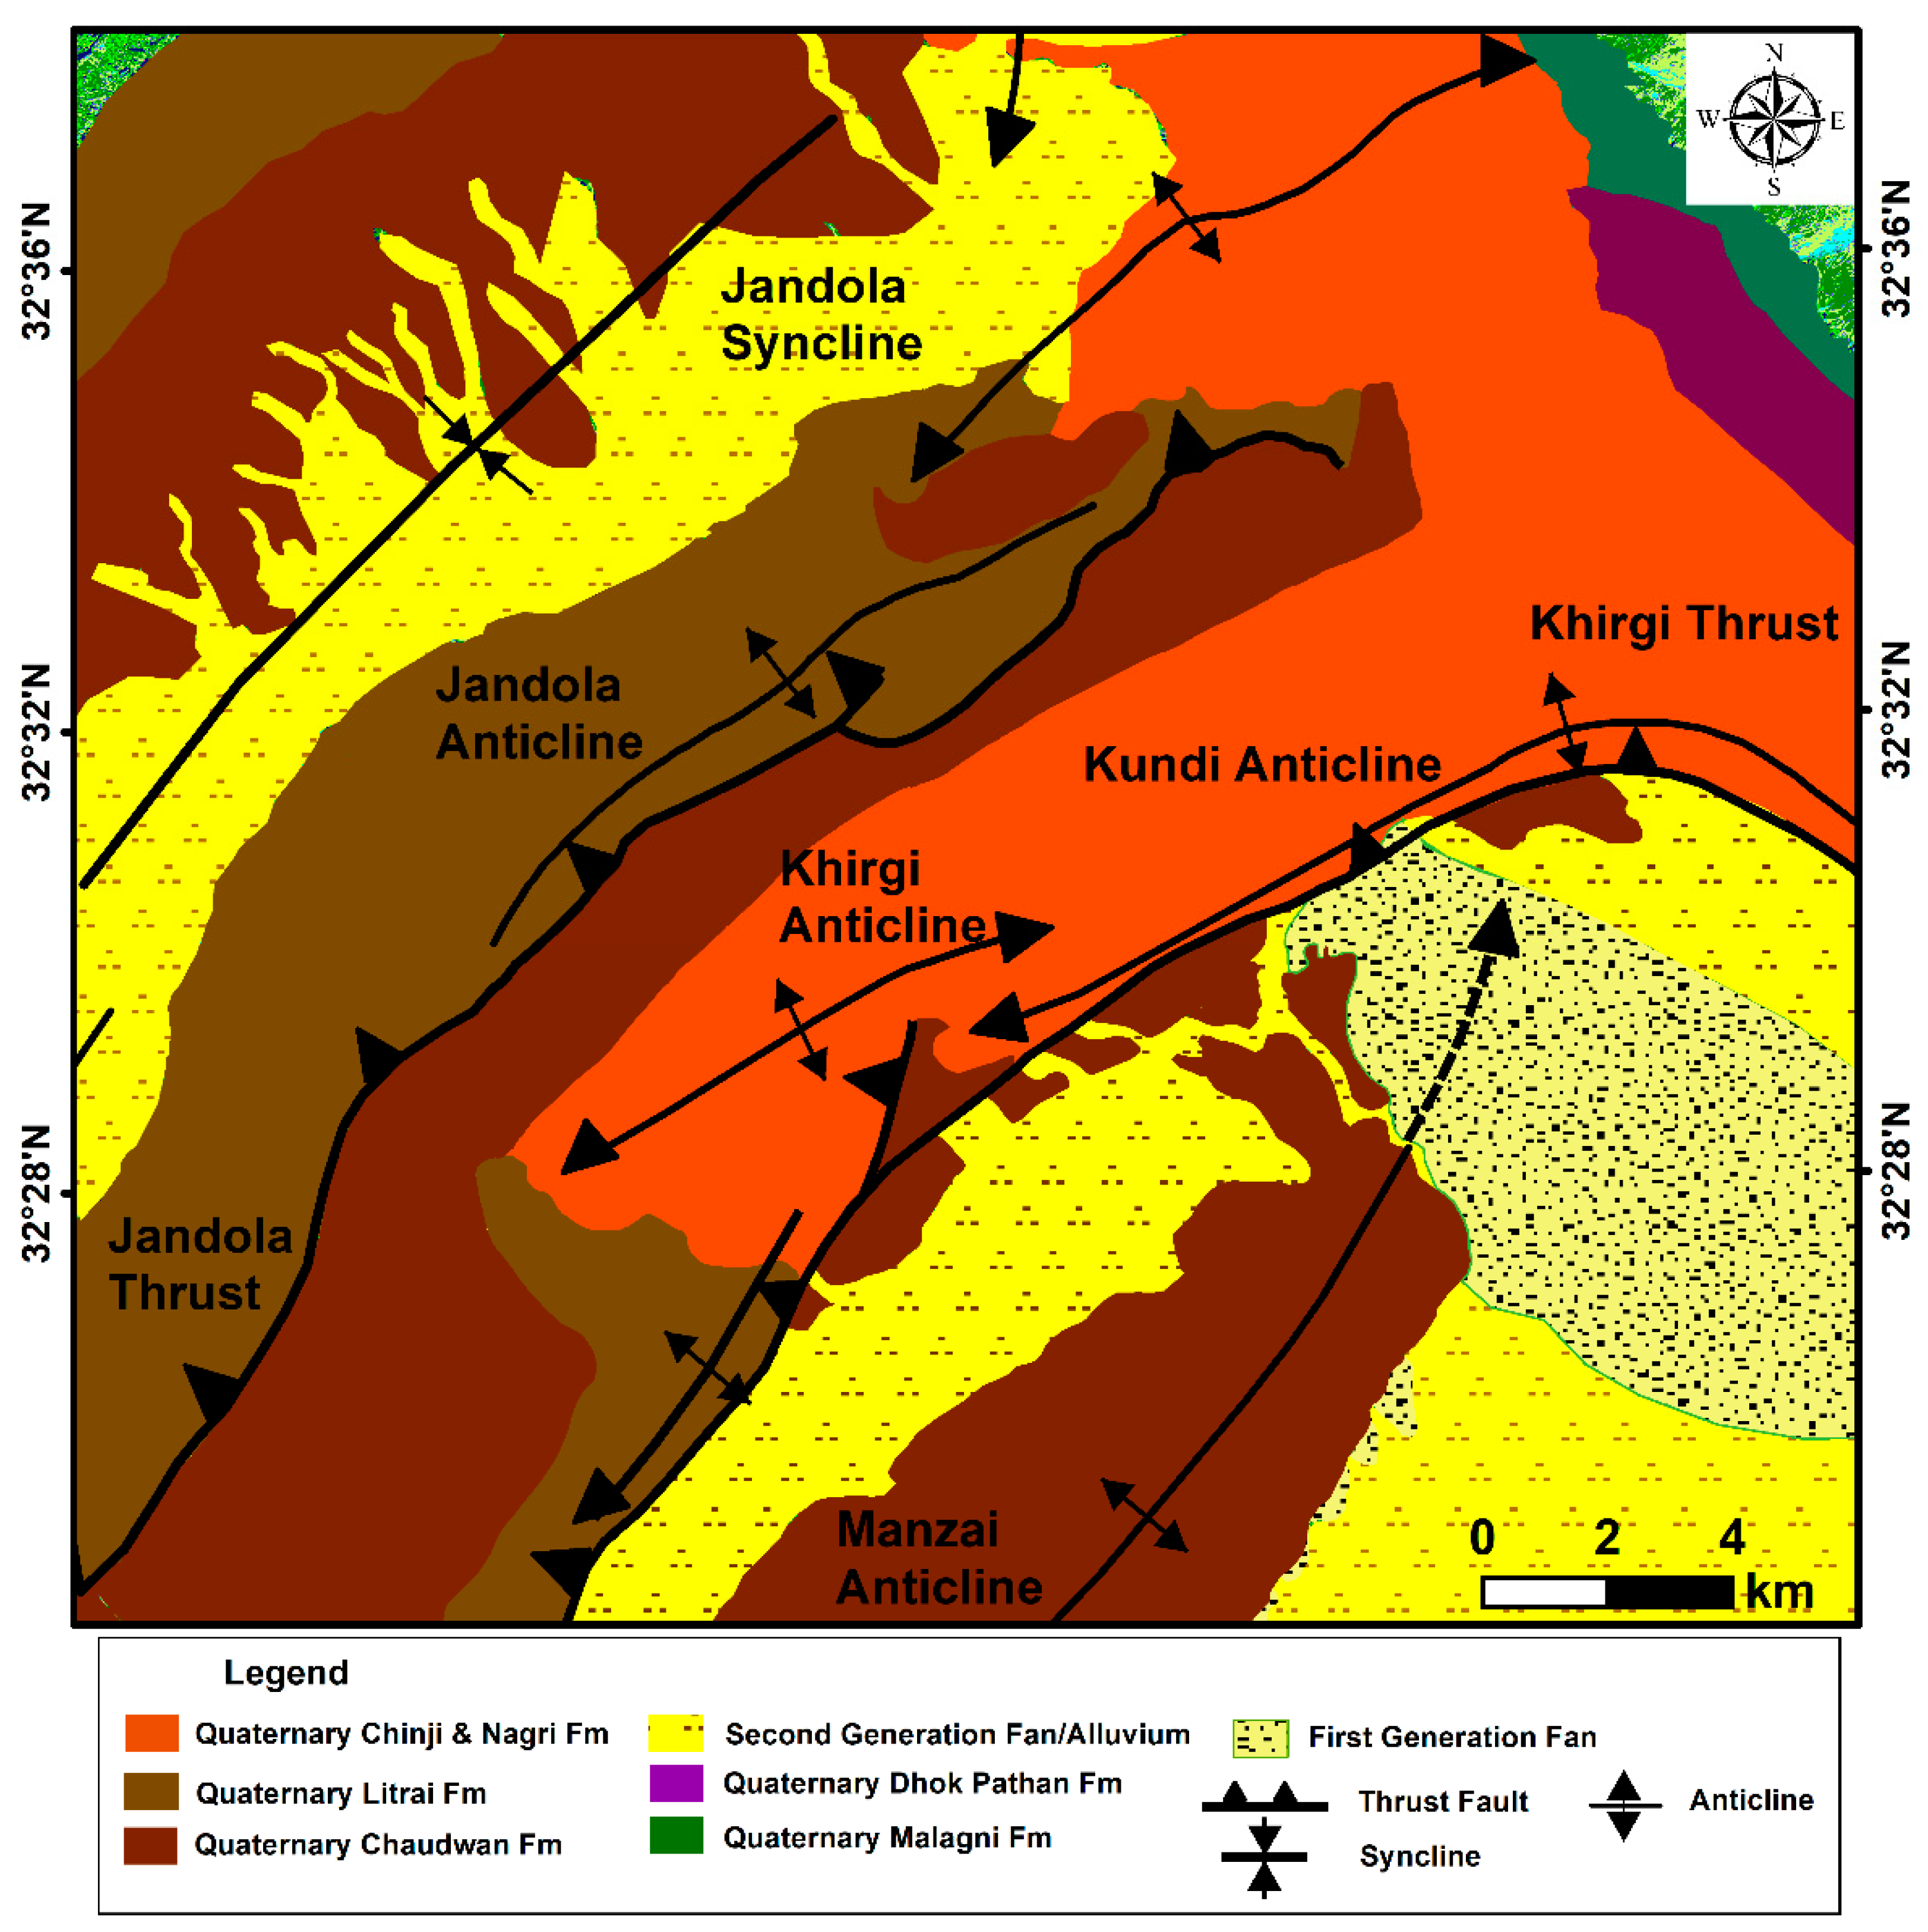
4.1. Geological Mapping

The geological map of the Manzai Ranges was prepared using Sentinel-2 data and previously published maps [27,28]. The band ratios enhanced lithological contacts, competent and incompetent rock units, and different generations of alluvial deposits and deflected streams; however, some individual rock units/formations remained undivided (Figure 7). Quaternary sedimentary rocks are the dominant rock types mapped in these ranges. The two mapped thrusts are the Khirgi and Jandola ones, as displayed. The Jandola Thrust emplaces the older Litra Formation over the younger Chaudwan Formation while the Khirgi Thrust emplaced the older Chinji and Nagri Formation (undivided) over the younger Chaudwan Formation in the foreland. Three different generations of stream mouth deposits/alluvial fans were identified. The regional slope direction is southeast; however, the active streams are deflected to the west at the fault contact. Major streams are actively entrenched into the old alluvial surfaces. Additionally, the Manzai anticline, composed of the quaternary Chaudwan Formation, shows an active fold growth into the recent alluvial deposits.

4.2. InSAR (SBAS)

Figure 8 shows the displacement map of the Manzai Ranges for eighteen (18) months (May 2018–October 2019). Based on the thrust tectonic and focal mechanism solution, the mean vertical displacement (VD) values are plotted with respect to the satellite LOS. The satellite has an ascending path, i.e., it moves from south to north with the antenna pointed to the right and an LOS incidence angle of 41°. Positive values (red color) indicate an uplift, i.e., movement towards the satellite, while negative values (dark blue color) indicate subsidence, i.e., movement away from the satellite. The average vertical displacement values in the Manzai Ranges vary between 6 and 9 mm/year (Figure 8). Both the upthrown and downthrown blocks have different surface displacements, as observed from the abrupt displacement gradient changes across the fault line (Figure 8a). The across-fault velocity profile AA’ shows an approximately 9 mm/year vertical displacement, while the profile CC’ shows the displacement of 6 mm/year (Figure 8b–d).

4.3. Geomorphology

4.3.1. Smf

The total length of the mountain front analyzed was 31.59 km (southwest) and 6.98 km (southeast), with mean Smf values of 1.65 and 1.74, respectively (Table 1). Using the Smf ranges compiled by Bull [46] for very active mountain fronts (1.0–1.6), less active fronts (~1.4–3.0), and inactive fronts (>3.0), the mountain front associated with both anticlinal segments (SW and SE) were characterized as active (Table 1). Relatively, the Khirgi anticline mountain front segment was more active than the Kundi anticline.

4.3.2. Vf

The Vf index was calculated for all the major stream valleys traversing the plunging Kundi and Khirgi anticlines. The analyzed segments (i.e., southeast and southwest) show an average value of 1.39 and 0.85, respectively (Table 1). The valleys, in proximity to the tectonic structures, are V-shaped and have low Vf values (Figure 6). The southeast and southwest segments are located on the hanging wall of the Khirgi Thrust and have a uniform lithology comprised of quaternary sandstone and claystone but show variations in their Vf values (Figure S2).

4.3.3. Normalized River Profile

High concavity and low MaxL indicate concave profiles approaching the stage of equilibrium. In contrast, low concavity (convex profiles) indicate a tectonically uplifted region [51,59]. Figure 9 shows the normalized longitudinal river profiles of the twelve (12) major rivers traversing the frontal anticlinal structures in the Manzai Ranges. The concavity percent varies from −1.04% to a maximum of 31.4%, with an average value of 11.23%. Ten out of twelve normalized river profiles show less than 20% concavity. They indicate a disequilibrium state in unstable young basins of the Manzai Ranges. The distance to maximum concavity (MaxL) varies from 0.27 to 0.79. The normalized longitudinal river profiles show an abrupt break in slope at knickpoints and are related to tectonic uplift or lithological contrast. However, lithological contrast in the Manzai Ranges is limited to the sandstone and claystone of the quaternary Chinji and Nagri Formations. We identified major knickpoints that are associated with higher Ksn, maximum concavity, and maximum distance from the source to the point of maximum concavity. Some of the knickpoints do not correlate with tectonic structures or lithologic contact and are not considered. Additionally, a few knickpoints are identified in the western end of the Kundi anticline with low Ksn values (Figure 9) and may indicate low tectonic activity.

4.3.4. Normalized Steepness Index

The channel steepness index values in the study area ranged from 0 to 224. These values across the frontal structures show a distinctive pattern. The eastern part of the study area comprises Kundi anticline and has low to moderate Ksn values. However, the study area’s central and western part shows a moderate to high steepness index across the Khirgi anticline and the frontal Manzai anticline (Figure 10). The overall distribution of channel steepness index appears to be tectonically controlled, as the highest values are distributed both along and across the growing folds and faults. The knickpoints observed in the high channel steepness are plotted and are interpreted to be of tectonic origin.

5. Discussion

Since there are no geodetic data available for the Trans Indus Manzai Ranges, we assessed the effects of tectonic activity using geomorphological indices and InSAR time series.

5.1. Relative Active Tectonics in the Manzai Ranges

The sensitivity of river/stream channels to deformation is a common indicator of active tectonic modification in a Fold–Thrust belt [52]. In a tectonically active region, the drainage pattern is continuously modified in response to changes in the landscape development as a result of fold growth. The drainage network in the Manzai Ranges was modified following the evolution of the frontal foreland thrusts (<1 Ma) [20,60] and the present day stream network traverses through the axial surface of the folded and faulted Kundi and Khirgi anticlines. The interplay between the tectonic and climatic conditions control the formation of wind and water gaps in the growing fold [61]. No wind gaps were identified in the study area; however, the water gaps in the form of deflected streams at the folding tip indicate that the uplift along an anticline has not exceeded the erosive power of a stream (Figure 3a,d). A strong deflection is observed in the Shahkar and Qulpe Narai River along the imbricate thrust of the Khirgi Fault (Figure 6). The drainage network flowing southeast shows a deflection to the southwest, following the fault trace and then regaining its initial path geometry. The fault scarp becomes prominent at a few stratigraphic sections along the 38 km-long studied segment of the Khirgi Thrust; however, most of the fault trace is buried by quaternary alluvial deposits. These geomorphic parameters, such as drainage asymmetry and the active incision of alluvial surfaces, show anticlinal growth. Additionally, medium-high Ksn values are distributed along the major rivers in the study area indicating recent tectonic uplift [62]. The spatial correlation of high Ksn values with the low concavity of normalized river profiles and the topographic breaks confirm active tectonic uplift and deformation (Figure 10).
The longitudinal river profile shows prominent topographic breaks as knickpoints in upstream, midstream and downstream segments (Figure 9). The upstream segment represents the hanging wall of the Khirgi Thrust, the midstream segment is the footwall covered with alluvial deposits, and the downstream segment is the Manzai anticline. The development of knickpoints is influenced by lithological contrast (soft and hard rocks), tectonic uplift or faulting, and the climatic conditions which are responsible for variations in the base-level [63]. The mapped stratigraphic units with the help of Sentinel-2 data show that the rivers/streams in the Manzai foreland region flow over the uniform lithology from upstream to downstream and show different locations and number of knickpoints (Figure 10). In addition, the knickpoints were developed at various elevations (448–921 m) away from the coast with no evidence of quaternary base-level fluctuations. We refined our knickpoints’ selection by choosing their association with high Ksn and maximum concavity. Although topographic breaks were present in the eastern end of the Kundi anticline with low Ksn values and may indicate low tectonic uplift. Hence, we conclude tectonic origin as the main controlling factor for a topographic break in our study area. The convexity of the downstream river profiles flowing across the Manzai anticline indicates warping or uplifting along the Manzai Fault (Figure 9). The anticlinal growth associated with the Manzai anticline deforms the quaternary alluvial fan, along with deep entrenching, which is obvious from the channel incision and convex river profile (Figure 6).
Tectonic uplift causes changes in the landscape dynamics and an increase in the channel gradient that ultimately leads to an increase in the erosive power of streams and hence more erosion. The quantitative characterization of the drainage evolution and landscape development in the Manzai Ranges was analyzed using river incision styles and the associated mountain fronts. The present-day mountain front is categorized as actively evolving fronts with rapid stream dissection in most valleys, forming V-shaped valleys proximal to mountain fronts (Figure 6, Table 2). The valley floor index is an indicator of active tectonics for uplifting mountain fronts that undergo incision [64].

5.2. Creeping Fault Segment

This study identified a 38 km-long, unlocked segment of the Main Frontal Thrust in the western Himalayas, which showed an aseismic creep inferred from InSAR. Additionally, there was no recorded instrumental seismicity from the last century earthquake data in the study area (Figure 2). The creep measured in the Manzai Ranges using InSAR was relatively small compared to the adjacent foreland Salt Range Thrust/Potwar Plateau, which showed an average of 10–14 mm/year of southern translation over Punjab foreland [65]. Additionally, the Khirgi Thrust cut through the axial trace of both the Kundi and Khirgi anticline, the rate of vertical displacement varies across them. The velocity profile AA’ across the Khirgi anticline shows an uplift of 9 mm/year while the profile BB’ and CC’ across the Kundi anticline shows vertical displacement of 6 and 5 mm/year, respectively (Figure 9). Our InSAR results indicate that the anticline (Kundi) at the junction of the Pezu–Bhittani Ranges and Manzai Ranges has an uplift that is smaller than the anticline (Khirgi) in the Manzai Ranges. There are two possible explanations for this change in displacement; (1) the change from compressional tectonics in the Manzai Ranges to transpressional tectonics in the Pezu–Bhittani Ranges or (2) the thrust component changes to strike–slip. A similar low creep rate has been observed in the adjacent foreland thrust, i.e., at the junction of the Surghar Ranges and the northern Kalabagh Fault zone [10,16]. However, the displacement decomposition into thrust and strike–slip components using InSAR is quite challenging and beyond this study’s scope. The installation of the GPS station in the fold–thrust belt of Western Pakistan will be useful to integrate with InSAR data and resolve the displacement into its components.

6. Conclusions

This study analyzed the western Himalaya’s frontal fold–thrust belt to quantify and understand the deformation, surface processes, and landscape development in the tectonically active regions. Quantitative geomorphic analysis, remote sensing mapping, and SBAS InSAR techniques were employed. The Manzai Ranges landscape is going through active river incision by forming V-shaped valleys to achieve equilibrium. The disequilibrium caused by active tectonics in the frontal ranges is achieved by an adjustment in the river longitudinal profiles, topographic breaks or knickpoints, and medium–high channel steepness index. The InSAR results show an uplift of 5–9 mm/year from May 2018 to October 2019 in the Manzai Ranges. The magnitude of uplift varies in the Kundi and Khirgi anticline and is interpreted to be related to the displacement transfer from the zone of compression to the transpression zone. This study concludes that the western Himalaya’s frontal structures are tectonically active and accommodate the shortening of the present-day Himalayan convergence.

Supplementary Materials

The following are available online at https://www.mdpi.com/2072-4292/12/20/3362/s1. Figure S1: No. of final interferograms and the mean coherence. Table S1: Sentinel-1A data specification. Figure S2: DEM of the Manzai Ranges showing the calculated values of Smf and Vf.

Author Contributions

Conceptualization by K.A.Q. and S.D.K., writing—original draft preparation by K.A.Q.; data processing by K.A.Q.; writing—review and editing, K.A.Q., and S.D.K.; supervision and funding acquisition S.D.K. All authors have read and agreed to the published version of the manuscript.

Funding

GeoRS Lab. directed by S.D.K. supported software\hardware and field trip.

Acknowledgments

K.A.Q. thanks Mehdi Darveshi, John Suppe, Onur Karaca and Aydin Shahtakhtinskiy for their help and discussions on various aspects of this research. S.D.K. thanks DLR for providing TanDEM-X data. We are very thankful to three anonymous reviewers for beneficial suggestions. We also thank the editorial team for their hard work; their efforts are highly appreciated for obtaining rapid reviews.

Conflicts of Interest

The authors declare no conflict of interest.

References

  1. Yin, A. Cenozoic tectonic evolution of the Himalayan orogen as constrained by along-strike variation of structural geometry, exhumation history, and foreland sedimentation. Earth Sci. Rev. 2006. [Google Scholar] [CrossRef]
  2. Treloar, P.J.; Rex, D.C.; Guise, P.G.; Coward, M.P.; Searle, M.P.; Windley, B.F.; Petterson, M.G.; Jan, M.Q.; Luff, I.W. K-Ar and Ar-Ar geochronology of the Himalayan collision in NW Pakistan: Constraints on the timing of suturing, deformation, metamorphism and uplift. Tectonics 1989, 8, 881–909. [Google Scholar] [CrossRef]
  3. Zhang, P.; Shen, Z.-K.; Wang, M.; Gan, W.; Bürgmann, R.; Molnar, P.; Wang, Q.; Niu, Z.; Sun, J.; Wu, J.; et al. Continuous deformation of the Tibetan Plateau from global positioning system data. Geology 2004, 32, 809–812. [Google Scholar] [CrossRef]
  4. Lave, J.; Avouac, J.P. Active folding of fluvial terraces across the Siwaliks Hills, Himalayas of central Nepal. J. Geophys. Res. Solid Earth 2000, 105, 5735–5770. [Google Scholar] [CrossRef]
  5. Lave, J.; Yule, D.; Sapkota, S.; Basant, K.; Madden, C.; Attal, M.; Pandey, R. Evidence for a great medieval earthquake (~1100 AD) in the central Himalayas, Nepal. Science 2005, 307, 1302–1305. [Google Scholar] [CrossRef] [PubMed] [Green Version]
  6. Malik, J.N.; Nakata, T. Active faults and related Late Quaternary deformation along the Northwestern Himalayan Frontal Zone, India. Ann. Geophys. 2003, 46, 917–936. [Google Scholar] [CrossRef]
  7. Senthil, K.; Wesnousky, S.G.; Rockwell, T.K.; Briggs, R.W.; Thakur, V.C.; Jayangondaperumal, R. Palaeoseismic evidence of great surface rupture earthquakes along the Indian Himalaya. J. Geophys. Res. 2006, 111. [Google Scholar] [CrossRef]
  8. Burgess, W.P.; Yin, A.; Dubey, C.S.; Shen, Z.-K.; Kelty, T.K. Holocene shortening across the Main Frontal Thrust zone in the eastern Himalaya. Earth Planet. Sci. Lett. 2018, 357, 152–167. [Google Scholar] [CrossRef]
  9. Jaume, S.C.; Lillie, R.J. Mechanics of the Salt Range-Potwar Plateau, Pakistan: A fold-and-thrust belt underlain by evaporites. Tectonics 1988, 7, 57–71. [Google Scholar] [CrossRef]
  10. McDougall, J.W.; Khan, S.H. Strike-slip faulting in a foreland fold-thrust belt: The Kalabagh Fault and Western Salt Range, Pakistan. Tectonics 1990, 9, 1061–1075. [Google Scholar] [CrossRef]
  11. Treloar, P.J.; Coward, M.P.; Chambers, A.F.; Izatt, C.N.; Jackson, K.C. Thrust geometries, interferences and rotations in the Northwest Himalaya. Thrust Tecton. 1992, 325–342. [Google Scholar] [CrossRef]
  12. DiPietro, J.A.; Pogue, R.K. Tectonostratigraphic subdivisions of the Himalaya: A view from the west. Tectonics 2004, 23. [Google Scholar] [CrossRef]
  13. Abir, I.A.; Khan, S.D.; Ghulam, A.; Tariq, S.; Shah, M.T. Active tectonics of western Potwar Plateau-Salt Range, northern Pakistan from InSAR observations and seismic imaging. Remote Sens. Environ. 2015, 168, 265–275. [Google Scholar] [CrossRef] [Green Version]
  14. Jouanne, F.; Awan, A.; Pêcher, A.; Kausar, A.; Mugnier, J.-L.; Khan, I.; Khan, N.A.; Van Melle, J. Present-day deformation of northern Pakistan from Salt Ranges to Karakorum Ranges. J. Geophys. Res. Solid Earth 2014. [Google Scholar] [CrossRef]
  15. Khan, M.A.; Bendick, R.; Bhat, M.I.; Bilham, R.; Kakar, D.M.; Khan, S.F.; Lodhi, S.H.; Qazi, M.S.; Singh, B.; Szeliga, W.; et al. Preliminary geodetic constraints on plate boundary deformation on the western edge of the Indian plate from TriGGnet (Tri-University GPS Geodesy Network). J. Himal. Earth Sci. 2008, 41, 71–87. [Google Scholar]
  16. Chen, L.; Khan, S.D. InSAR observation of the strike-slip faults in the northwest Himalayan frontal thrust system. Geosphere 2010, 6, 731–736. [Google Scholar] [CrossRef]
  17. Khan, S.D.; Chen, L.; Ahmad, S.; Ahmad, I.; Ali, F. Lateral structural variation along the Kalabagh Fault Zone, NW Himalayan foreland fold-and-thrust belt, Pakistan. J. Asian Earth Sci. 2012, 50, 79–87. [Google Scholar] [CrossRef]
  18. Blisniuk, P.M.; Sonder, L.J.; Lillie, R.J. Northwest Himalayan thrust front development. Tectonics 1998, 17, 766–779. [Google Scholar] [CrossRef]
  19. Abir, I.A.; Khan, S.D.; Aziz, G.M.; Tariq, S. Bannu Basin, fold-and-thrust belt of northern Pakistan: Subsurface imaging and its implications for hydrocarbon exploration. Mar. Pet. Geol. 2017, 85, 242–258. [Google Scholar] [CrossRef]
  20. Burbank, D.W.; Raynolds, R.G.H. Stratigraphic keys to the timing of thrusting in terrestrial foreland basins: Applications to the northwestern Himalaya. In New Perspectives in Basin Analysis; Springer: Berlin/Heidelberg, Germany, 1988; p. 33151. [Google Scholar]
  21. Khan, M.J.; Opdyke, N.D.; Tahirkheli, R.A.K. Magnetic stratigraphy of the Siwalik group, Bhittani, Marwat and Khisor ranges, northwestern Pakistan and the timing of neogene tectonics of the Trans Indus. J. Geophys. Res. Solid Earth. 1988, 93, 11773–11790. [Google Scholar] [CrossRef]
  22. Munthe, J. Lithostratigraphy of fluvial deposits of late Pliocene and Pleistocene age in Bhittani and Marawat Ranges, northwestern Pakistan. In Field Conference on Neogene-Quaternary Boundary, India; Geological Survey of India Calcutta: Calcutta, India, 1981; pp. 101–105. [Google Scholar]
  23. Kaushal, R.K.; Singh, V.; Mukul, M.; Jain, V. Identification of deformation variability and active structures using geomorphic markers in the Nahan salient, NW Himalaya, India. Quat. Int. 2017, 462, 194–210. [Google Scholar] [CrossRef]
  24. Matin, A.; Mukul, M. Himalayan cross faults affect thrust sheet geometry: An example from the Munsiari thrust sheet near the Gish Transverse fault zone, frontal Darjiling Himalaya, India. J. Asian Earth Sci. 2020, 199, 104400. [Google Scholar] [CrossRef]
  25. Srivastava, V.; Mukul, M.; Mukul, M. Quaternary deformation in the Gorubathan recess: Insights on the structural and landscape evolution in the frontal Darjiling Himalaya. Quat. Int. 2017, 462, 138–161. [Google Scholar] [CrossRef]
  26. Whipple, K.X.; Shirzaei, M.; Hodges, K.V.; Arrowsmith, J.R. Active shortening within the Himalayan orogenic wedge implied by the 2015 Gorkha earthquake. Nat. Geosci. 2016, 9, 711–716. [Google Scholar] [CrossRef]
  27. Hemphill, W.; Kidwai, A. Stratigraphy of the Bannu and Dera Ismail Khan areas, Pakistan. U.S. Geol. Surv. Prof. 1973, 716b, 36. [Google Scholar]
  28. Ali, A. Structural Analysis of Trans Indus Ranges, Implications for the Hydrocarbon Potential of the NW Himalayas, Pakistan. Unpublished Ph.D. Thesis, National Center of Excellence in Geology, University of Peshawar, Peshawar, Pakistan, 2010. [Google Scholar]
  29. Khan, A.A. Bhittani Range, North Pakistan: The Tectonic Evolution and Hydrocarbon Prospectivity—A Geological and Geophysical Approach. Pakistan J. Hydrocarbon Res. 2012, 22, 1–11. [Google Scholar]
  30. Meigs, A.; Madden, C.; Yule, J.; Gavillot, Y.; Hebeler, A.; Hussain, A.; Bhat, M.; Kausar, A.; Malik, M.; Ramzan, S. Pattern, rate, and timing of surface rupturing earthquakes across the northwest Himalaya. J. Himal. Earth Sci. 2012, 45, 111–114. [Google Scholar]
  31. Satyabala, S.P.; Yang, Z.; Bilham, R. Stick-slip advance of the Kohat Plateau in Pakistan. Nat. Geosci. 2012, 5, 147–150. [Google Scholar] [CrossRef]
  32. Kazmi, A.H.; Rana, R.A. Tectonic Map of Pakistan 1: 2,000,000: Map Showing Structural Features and Tectonic Stages in Pakistan; Geological Survey of Pakistan: Quetta, Pakistan, 1982. [Google Scholar]
  33. Khwaja, A.A.; Lisa, M. Seismic Activity in the Western Extension of the Salt Range, Focal Mechanism Studies. J. Meteorol. 2005, 2, 35–47. [Google Scholar]
  34. Drusch, M.; Del Bello, U.; Carlier, S.; Colin, O.; Fernandez, V.; Gascon, F.; Hoersch, B.; Isola, C.; Laberinti, P.; Martimort, P.; et al. Sentinel-2: ESA’s Optical High-Resolution Mission for GMES Operational Services. Remote Sens. Environ. 2012, 120, 25–36. [Google Scholar] [CrossRef]
  35. Van Der Werff, H.; Van Der Meer, F. Sentinel-2A MSI and Landsat 8 OLI provide data continuity for geological remote sensing. Remote Sens. 2016, 8, 883. [Google Scholar] [CrossRef] [Green Version]
  36. Gascon, F.; Bouzinac, C.; Thépaut, O.; Jung, M.; Francesconi, B.; Louis, J.; Lonjou, V.; Lafrance, B.; Massera, S.; Gaudel-Vacaresse, A.; et al. Copernicus Sentinel-2A calibration and products validation status. Remote Sens. 2017, 9, 584. [Google Scholar] [CrossRef] [Green Version]
  37. Rucci, A.; Ferretti, A.; Guarnieri, A.M.; Rocca, F. Sentinel 1 SAR interferometry applications: The outlook for sub millimeter measurements. Remote Sens. Environ. 2012, 120, 156–163. [Google Scholar] [CrossRef]
  38. Aimaiti, Y.; Yamazaki, F.; Liu, W.; Kasimu, A. Monitoring of land-surface deformation in the Karamay oilfield, Xinjiang, China, using SAR interferometry. Appl. Sci. 2017, 7, 772. [Google Scholar] [CrossRef] [Green Version]
  39. Crupa, W.E.; Khan, S.D.; Huang, J.; Khan, A.S.; Kasi, A. Active tectonic deformation of the western Indian plate boundary: A case study from the Chaman Fault System. J. Asian Earth Sci. 2017, 147, 452–468. [Google Scholar] [CrossRef]
  40. Fattahi, H.; Amelung, F. InSAR observations of strain accumulation and fault creep along the Chaman Fault system, Pakistan and Afghanistan. Geophys. Res. Lett. 2016, 43, 8399–8406. [Google Scholar] [CrossRef] [Green Version]
  41. Qiu, J.; Liu, L.; Wang, C.; Wang, Y. Present-day tectonic activity along the central section of the Altyn Tagh fault derived from time series InSAR. Geodesy Geodyn. 2019, 10, 307–314. [Google Scholar] [CrossRef]
  42. Qu, F.; Lu, Z.; Kim, J.-W.; Zheng, W. Identify and Monitor Growth Faulting Using InSAR over Northern Greater Houston, Texas, USA. Remote. Sens. 2019, 11, 1498. [Google Scholar] [CrossRef] [Green Version]
  43. Miranda, N. Definition of the TOPS SLC Deramping Function for Products Generated by the S-1 IPF; European Space Agency (ESA): Paris, France, 2014. [Google Scholar]
  44. Wegnüller, U.; Werner, C.; Strozzi, T.; Wiesmann, A.; Frey, O.; Santoro, M. Sentinel-1 Support in the GAMMA Software. Procedia Comput. Sci. 2016, 100, 1305–1312. [Google Scholar] [CrossRef] [Green Version]
  45. Wells, S.; Bullard, T.; Menges, C.; Drake, P.; Karas, P.; Kelson, K.; Ritter, J.; Wesling, J. Regional variations in tectonic geomorphology along a segmented convergent plate boundary pacific coast of Costa Rica. Geomorphology 1988, 1, 239–265. [Google Scholar] [CrossRef]
  46. Bull, W.B. Tectonic Geomorphology of the Mojave Desert: US Geological Survey Contract Report 14-08-001-G-394; Office of Earthquakes, Volcanoes, and Engineering: Menlo Park, CA, USA, 1977; 188p. [Google Scholar]
  47. Goswami, P.K.; Pant, C.C.; Pandey, S. Tectonic controls on the geomorphic evolution of alluvial fans in the Piedmont Zone of Ganga Plain, Uttarakhand, India. J. Earth Syst. Sci. 2009, 118, 245–259. [Google Scholar] [CrossRef] [Green Version]
  48. Keller, E.A.; Pinter, N. Geomorphic Indices of Active Tectonics. In Active Tectonics: Earthquakes, Uplift, and Landscape; Prentice Hall: Upper Saddle River, NJ, USA, 1996; pp. 121–147. [Google Scholar]
  49. Bull, W.B. Tectonic Geomorphology of Mountains: A New Approach to Paleo-Seismology; Blackwell Publishing: Malden, MA, USA, 2007. [Google Scholar]
  50. Hovius, N. Macroscale process systems of mountain belt erosion. In Geomorphology and Global Tectonics; Wiley & Sons: Hoboken, NJ, USA, 2000. [Google Scholar]
  51. Demoulin, A. Testing the tectonic significance of some parameters of longitudinal river profiles: The case of the Ardenne (Belgium, NW Europe). Geomorphology 1998, 24, 189–208. [Google Scholar] [CrossRef]
  52. Holbrook, J.; Schumm, S. Geomorphic and sedimentary response of rivers to tectonic deformation: A brief review and critique of a tool for recognizing subtle epeirogenic deformation in modern and ancient settings. Tectonophysics 1999, 305, 287–306. [Google Scholar] [CrossRef]
  53. Strahler, A.N. Hypsometric (area-altitude) analysis of erosional topography. Geol. Soc. Am. Bull. 1952, 63, 1117–1142. [Google Scholar]
  54. Perron, J.T.; Royden, L. An integral approach to bedrock river profile analysis. Earth Surf. Process. Landforms 2012, 38, 570–576. [Google Scholar] [CrossRef] [Green Version]
  55. Kirby, E.; Whipple, K.X. Expression of active tectonics in erosional landscapes. J. Struct. Geol. 2012, 44, 54–75. [Google Scholar] [CrossRef]
  56. Wobus, C.; Whipple, K.X.; Kirby, E.; Snyder, N.; Johnson, J.; Spyropolou, K.; Crosby, B.; Sheehan, D. Tectonics from topography: Procedures, promise, and pitfalls. Spec. Pap. Geol. Soc. Am. 2006, 398, 55–74. [Google Scholar] [CrossRef] [Green Version]
  57. Andreani, L.; Gloaguen, R. Geomorphic analysis of transient landscapes in the Sierra Madre de Chiapas and Maya Mountains (northern Central America): Implications for the North American-Caribbean-Cocos plate boundary. Earth Surf. Dyn. 2016, 4, 71–102. [Google Scholar] [CrossRef] [Green Version]
  58. Forte, A.M.; Whipple, K.X. Short communication: The Topographic Analysis Kit (TAK) for TopoToolbox. Earth Surf. Dyn. 2019, 7, 87–95. [Google Scholar] [CrossRef] [Green Version]
  59. Pérez-Peña, J.; Al-Awabdeh, M.; Azañón, J.; Galve, J.P.; Booth-Rea, G.; Notti, D. SwathProfiler and NProfiler: Two new ArcGIS Add-ins for the automatic extraction of swath and normalized river profiles. Comput. Geosci. 2017, 104, 135–150. [Google Scholar] [CrossRef]
  60. Beck, R.A.; Burbank, D.W.; Sercombe, W.J.; Riley, G.W.; Barndt, J.K.; Berry, J.R.; Afzal, J.; Khan, A.M.; Jurgen, H.; Metje, J.; et al. Stratigraphic evidence for an early collision between northwest India and Asia. Nature 1995, 373, 55–58. [Google Scholar] [CrossRef]
  61. Ramsey, L.A.; Walker, R.; Jackson, J. Fold evolution and drainage development in the Zagros mountains of Fars province, SE Iran. Basin Res. 2008, 20, 23–48. [Google Scholar] [CrossRef]
  62. Keller, E.A.; Pinter, N. Active Tectonics: Earthquakes, Uplift, and Landscape; Princeton Hall: Hoboken, NJ, USA, 2002. [Google Scholar]
  63. Font, M.; Amorese, D.; Lagarde, J.-L. DEM and GIS analysis of the stream gradient index to evaluate effects of tectonics: The Normandy intraplate area (NW France). Geomorphology 2010, 119, 172–180. [Google Scholar] [CrossRef]
  64. Silva, P.G.; Goy, J.; Zazo, C.; Bardají, T. Fault-generated mountain fronts in southeast Spain: Geomorphologic assessment of tectonic and seismic activity. Geomorphology 2003, 50, 203–225. [Google Scholar] [CrossRef]
  65. Jouanne, F.; Munawar, N.; Mugnier, J.-L.; Ahmed, A.; Alam Awan, A.; Bascou, P.; Vassallo, R. Seismic coupling quantified on inferred decollements beneath the western syntaxis of the Himalaya. Tectonics 2020, 1–20. [Google Scholar] [CrossRef]
Figure 1. Satellite imagery showing the Himalayan arc and the southernmost youngest active thrust (MFT) with the associated historical earthquakes of a magnitude higher than seven (7) that had ruptured the surface. The across-strike structural variations are shown in the form of salient and recess. The calculated slip-rates along the MFT is also shown. The rectangular box indicates our study area in the Tank recess. Earthquake data were downloaded from the United States Geological Services (USGS). Faults were modified from Yin [1]. SRT: Salt Range Thrust, TIR: Trans Indus Ranges, KB: Katawaz Basin, WO: Waziristan Ophiolite, JBF: Jhelum Basement Fault, SFTB: Suleiman Fold–Thrust Belt, KFTB: Kirthar Fold–Thrust Belt.
Remotesensing 12 03362 g001
Figure 2. (a) Shuttle Radar Topography Mission (SRTM, 30 m) digital elevation model (DEM) showing the geotectonic setting of the western Himalayas Fold–Thrust Belt in the TIR. Earthquake data were acquired from the Pakistan Meteorological Department (PMD) and the United States Geological Services (USGS). Structures are modified after Kazmi and Rana [32]. The focal mechanism solution (FMS) of earthquakes are from Khwaja and Monalisa [33]; (b) and 2D seismic interpretation of profile XX’ modified after Ali [28]. The northwest–southeast oriented seismic line cuts across almost all the perpendicular to the major structural elements. This shows the cross-sectional geometry of the Jandola syncline, Jandola Fault, Khirgi anticline, Khirgi Thrust, Manzai anticline and Blind Manzai Fault. These structural elements are dipping northwest and show southeast vergence. Stratigraphic units identified on seismic lines are Pleistocene and younger, while Eocene and older age rocks are undifferentiated and are shown as a single unit. NPDZ: Northern Potwar Deformed Zone, SRT: Salt Range Thrust, KF: Kalabagh Fault, KR: Kalabagh Reentrant, SR: Surghar Range, PF: Pezu Fault, KhT: Khirgi Thrust, TR: Tank Reentrant, WOB: Waziristan Ophiolite Belt, DT: Domanda Thrust.
Remotesensing 12 03362 g002
Figure 3. Sentinel-2B band ratios (a) 12/7-12/3-12/11; (b) 11/12-12/7-8/11; (c) 8/11-11/12-12/7 displayed as a RGB composite to discriminate lithology and structural elements. The interpreted lithologic units correlate well with the previously mapped units. The band ratios in (a) differentiate younger wetter alluvial fans from older drier alluvial fans based on hydroxyl ion (OH). The older drier alluvium appears in light blue, while the younger wetter one appears in plum color. The light pink color shows the vegetation on the fan. The band ratios in (b) and (c) discriminate the different types of sedimentary rocks based on the clay content and surface texture. In (b), the violet color shows intact and homogenous sedimentary rock type, and the light green color represents the loose surface clays within active streams entrenching the older drier alluvial fans. While (c) shows more heterogeneous lithology in the form of interbedded competent yellow-green sandstone and incompetent dark blue clays in the hanging wall of Khirgi Thrust, the yellow color depicts the Manzai anticline actively growing into the older alluvial fan; (d) Sentinel-2 true color composite (RGB: 432) showing streams deflection in an actively evolving fold–thrust belt.
Remotesensing 12 03362 g003
Figure 4. SBAS algorithm workflow for deformation studies. PhU refers to phase unwrapping, IFG to interferograms, MCF to minimum cost flow, Atm. to atmospheric.
Remotesensing 12 03362 g004
Figure 5. Calculation of the mountain front sinuosity index (Smf) along the southwest and southeast segment of the Manzai Ranges. Ls: straight-line length of the mountain front; Lmf: length along the foot of the mountain front.
Remotesensing 12 03362 g005
Figure 6. (a) Shaded relief image of the Manzai Ranges with the drainage network highlighted in blue. Yellow lines are the traverse and longitudinal swath profiles calculated with a strip width of 4 km. The rivers highlighted in purple are extracted and analyzed for their longitudinal profiles; (b) east–west longitudinal swath profile along the frontal anticlines, showing the mean (blue), minimum (black), maximum (orange) elevation, and local relief (red). This shows the higher erosion rate in the highest western part of the profile related to the uplift produced by the frontal thrust; (c,d) are the north–south oriented transverse swath profiles. The transverse profiles show asymmetric relief and can be related to neotectonic activity caused by the frontal thrusts.
Remotesensing 12 03362 g006
Figure 7. Geological map of the Manzai Ranges prepared using the Sentinel-2B dataset and older map. Quaternary sedimentary rocks outcrop all along the Manzai Ranges. The mapped thrusts are Khirgi and Jandola. The splay of the Khirgi Thrust and an unknown anticline are also mapped. Both faults are emplaced in older quaternary rocks over the younger in the foreland region. The active tectonic leads to the deformation of the alluvial fans, deflected and entrenched streams.
Remotesensing 12 03362 g007
Figure 8. (a) Line of sight (LOS) vertical displacement map, derived from the InSAR SBAS analysis over the eastern part of Manzai Ranges with an ascending C-band Sentinel-1A, for eighteen (18) months extending from 10 May 2018 to 20 October 2019. Assuming the observed InSAR deformation is vertical, the Khirgi Thrust shows an uplift of approximately 9 mm/year relative to the satellite LOS. The red lines indicate the profile drawn across the anticlines; (b) the velocity profile across the Khirgi anticline. The solid red line indicates an approximate fault trace; (c,d) velocity profiles across the Kundi anticline.
Remotesensing 12 03362 g008
Figure 9. Normalized longitudinal river profiles in the study area. The shape of profiles varies from linear to convex with a maximum concavity of 35%. These profiles represent unstable young basins. The knickpoints shown are in agreement with the Ksn and the maximum curvature; MaxC: maximum concavity, MaxL: distance where the maximum concavity occurs.
Remotesensing 12 03362 g009
Figure 10. Shaded relief image showing the channel steepness index distribution and its association with the structural elements. The medium to high values were distributed both across the Khirgi anticline and the Manzai anticline. In contrast, the index value decreases along the Kundi anticline and may be related to low tectonic uplift. Knickpoints are plotted along the moderate to high Ksn segments values.
Remotesensing 12 03362 g010
Table 1. Smf and valley floor width to height ratio (Vf) values were calculated across the Khirgi Thrust. Smf for two different mountain front segments, i.e., southwest and southeast. The mean values for each segment was also indicated. Values of Vf (valley floor width to height ratio) along the major streams traversing perpendicular to the anticlinal structures in the study area where Vfw is the width of the valley floor, Eld is an elevation on the left side of the valley floor, Erd is the elevation on right side of the valley floor, and Esc is the elevation on the valley floor. All calculations were limited to 500–1500 m of the mountain front and were constrained to the same lithology. Mean, median and standard deviation were calculated to better distribute the values.
SegmentValley No.Vfw
(m)
Eld
(m)
Erd
(m)
Esc
(m)
VfLmf
(km)
Ls
(km)
Smf
Southwest163.5621653535.50.639.865.81.7
2826126005160.914.913.661.34
336584.2588.25210.5511.547.511.53
441598.5580.7500.50.468.474.811.76
589.5579.55895351.826.843.42.01
6816126125250.934.392.421.81
743603.1597.75330.645.763.991.44
832.5571.55585120.62---
939.5555.7557.5517.51.01---
1048362370.9310.50.86---
Mean Vf0.85Median0.75Stand. Dev.0.39Mean Smf1.65
Southeast186479.5476350.50.684.842.921.66
299.5510.2501.23860.833.522.221.59
331366.7369.6343.21.246.143.391.81
419326.7327.53151.578.284.311.92
521349.9349.5337.21.68---
628339.4343.1326.41.89---
728.5343.4350.1331.051.81---
Mean Vf1.39Median1.04Stand. Dev. 0.51Mean Smf1.74
Table 2. The relative tectonic activity subdivision of the two segments of the Manzai Ranges using geomorphological indices, i.e., mountain front sinuosity (Smf) and valley floor (Vf). The division is based on a classification scheme by Bull [46] and Keller and Pinter [48]. Class 1 defines active tectonic while class 2 is moderately active.
Fault Segments
SouthwestSoutheast
Mt. Front Length (km)31.596.98
Max. Relief (m)1085782
Avg. Smf1.651.74
Smf Range1.34–2.011.59–1.92
Avg. Vf0.851.39
Vf Range0.39–1.820.51–1.89
Class12
Publisher’s Note: MDPI stays neutral with regard to jurisdictional claims in published maps and institutional affiliations.

