Abstract
It is commonly believed that changes in the use of the catchment area have a direct impact on the quality of the water environment. Rivers with dams and reservoirs are characterized by a disturbed outflow of sediments and nutrients from the catchment area. The research was based on indicating the variation in time and space of loads of selected parameters of the water quality of the Brda River (Northern Poland) against the land cover changes based on the CORINE Land Cover (CLC) data for the 1990–2018 period. In the lower part of the Brda catchment area, there are three hydropower dams with reservoirs in the form of a cascade, whose work clearly affects the hydrological regime of the river. The analysis of the dependence of the dynamics of water quality changes on the usage of CLC was based on indicators such as sediments (suspended sediment load) and nutrients (total phosphorus load and total nitrogen load). The use of hydrological data on the Brda discharge above and below the reservoirs made it possible to calculate sediment and nutrient trapping efficiency. Linking the CLC data with the indices responsible for the mechanical denudation of the catchment area made it possible to show the strength of changes taking place in the catchment area. The results of the research do not indicate any direct correlation between land cover changes and the dynamics of the denudation process and matter transport in the Brda catchment area. As our research shows, the strong influence on the hydrological regime of the catchment points out the necessity to search for still other research methods supporting the decision-making cycle in the field of water management in the face of climate change.
1. Introduction
The reservoirs located on the rivers can accumulate a great deal of the matter supplied from the catchment area above the profile. The scale of the matter circulation transformation in the catchment area is illustrated e.g., by the Iberian Peninsula, where c.a. 1500 large and over 50000 small dams and reservoirs are functioning [1]. In terms of the world large rivers, only 37% of them continue free-flowing for the entire length, and 23% flow unhindered to the ocean [2]. Generally, more than 50% of the large rivers in the world have lost their hydromorphological and ecological continuity [3]. Thus, the determination of the water quality in the reservoir and changes in quality above and downstream may be an indicator of the impact of anthropopressure. In particular, the balance of transported sediments and nutrients will affect the ecological status of waters, in accordance with the provisions of the Water Framework Directive (WFD) [4]. The process of water eutrophication recognized in the middle and late stages of the 20th century [5], is intensified as a result of human activity in the catchment area. Water eutrophication is an environmental problem that limits the possibilities of using water for economic purposes [6] and has a negative impact on the field of aquatic fauna and flora [7]. As it is commonly accepted, the data contained in the CORINE Land Cover (CLC) database may prove the transformation of the quality of the water environment in the catchment area, and the changes in the quality of water in reservoirs along rivers may be indicators of these changes [8]. As it has been proven many times, land use changes can affect the balance of sediment transport on a local [9] and global [10] scale. Determining the long-term trends of changes in the above-mentioned processes will enable the achievement of environmental goals included in the WFD [4] while respecting the principle of sustainable development.
Human pressure on the aquatic environment may be direct (point pollution, wastewater treatment plant failure, oil spill, etc.,) or indirect, related to land cover changes (catchment deforestation, surface hardening of cities, change in plant species, wetland farming, etc.,). The first actions usually have an immediate effect on water quality. Examples of extreme pollution of the aquatic environment may be the case of the Deepwater Horizon failure in the Gulf of Mexico of 20th April 2010 where 7.0 × 10⁵ m3 oil spill into the Ocean [11] or the failure of wastewater treatment plants after seismic events [12]. On the other hand, area pressures that occur throughout the catchment area tend to have longer response and impact times.
Impact on surface waters of anthropogenic pressures can be a long-term indicator of changes in environmental quality [13,14]. Water quality monitoring in the catchment area is one of the elements of the EU water policy, where the provisions of the WFD [4] regulate the requirements for hydromorphological monitoring of surface water bodies (SWB).
As it turns out, one of the most important area pressures on the aquatic environment is the change of the catchment area cover [15,16]. As pointed by Dosdogru et al. [17] there is a connection between ecologically relevant flows and change of climate and land use. Climate change impacts the land use/land cover structure, which reflects itself in the increased occurrence of droughts and floods, which can have a negative influence on many species of aquatic organisms. Therefore, in the context of global warming, in predicting the future state of aquatic ecosystems, the assessment of a group of land use scenarios and nutrient loads should be considered [18]. Registered changes in the use of the catchment area may also be the most important factor in the forecasting of water quality [19]. Land use analysis can be used for monitoring of nutrient pollution in rivers [13]. The research of Kroll et al. [20] shows a strong correlation between land use (urban, agriculture, and forest areas) and nutrients indices. Natural changes occur as a result of natural transformation of, for example, a meadow into a forest or a lake into a fen, and they are incomparably slower than human interference. However, they are to a greater extent caused by economic and social changes. The largest changes occurred in agricultural and forest areas as a result of the extensification of agriculture, deforestation, afforestation, and urbanization [21]. These are the trends observed in Europe [22].
Using quantitative and qualitative data in combination with land cover information can evaluate the impact of human activities [23,24,25], in particular pressures on the aquatic environment in a predominantly agricultural catchment land use [26]. Land cover change allows estimating nitrogen balance [27,28]. Also, soil quality [29,30] and soil erosion risk [21,31,32,33,34,35] can be reflected. Research on land use changes allows simulating sediment yield [36,37,38,39,40,41,42] using morphometric indicators [43,44]. The intensity of erosion also depends on the morphological conditions of the catchment area, e.g., energy of relief, water distribution along the slope, hillslope runoff potential, etc. The analysis of CLC changes in terms of topographic indicators will enable the identification of areas exposed to water erosion or areas actively participating in the surface and linear transport of matter in the catchment area. The link between catchment response to precipitation depending on historical land cover changes was shown in the research of Juez and Nadal-Romero [45]. Indirectly, the change of the land use can be used to model the water balance [46,47] and analyze the flood events [48] in the catchment. Also, hysteresis loops analyses (discharge and suspended sediment load) allow determining the geomorphological evolution of the river basin channel network, indirect to land cover change, as in the research [49]. Generally, land use change models on a regional scale [50,51,52] were used. In small catchments, they were used as well [9].
Determination of water quality by remote sensing techniques is commonly used, e.g., Sentinel–2 Multispectral Imager (MSI) data allow to prepare dissolved organic carbon concentration map using an algorithm of water color inland lakes [53], determine water quality parameters of black lakes in Estonia [54], or define the effectiveness of the satellite sensors (Operational Land Imager—OLI), MSI, and Ocean and Land Color Instrument—OLCI) to identify the optimal band combination with a concentration of water quality parameters [55]. Research of Ritchie et al. [56] shown wavelength between 700 and 800 nm as optimal to determine suspended sediment concentration. The use of remote sensing techniques is adequate for modeling homogeneous fluvial systems that have water quality data in order to properly correlate input data.
The aim of the research was to show the relationship between the dynamics of changes in selected parameters of the Brda River water quality and changes in land cover based on the CLC data for the period 1990–2018. We particularly wanted to demonstrate direct and indirect pressure on matter transported with water on the “dammed up river system.” The indicators used were: suspended sediment load, total phosphorus load, and total nitrogen load measured at the positions located at the inflow and outflow of the Brda River reservoirs cascade and on the direct inflows of reservoirs. An additional goal is to identify the factors that affect the problem with demonstrating a strong relationship between land cover changes and water quality changes. The achievement of the goal was made possible because of the statistical analysis of CLC data and quantitative analysis of topographic indicators of the catchment. The conducted research is important not only from the point of view of the organization of the methodology of monitoring of SWB of the Brda River and future water management in the catchment area but also the usefulness of CLC data for long-term observations of environmental pressures. The research opens a discussion on the need to search for new research methods to assess the impact of land cover changes on water quality, for the “dammed up river system” on the catchment.
2. Materials and Methods
2.1. The Study Area
The study area is located on the Brda River catchment, which is a left tributary of the Vistula River (Figure 1). Our detailed research was focused on Brda River’s tributaries and their catchments, inflow to the Koronowski, Tryszczyn, and Smukała reservoirs. The diagram of detailed catchments in the study area is presented in Figure 1.
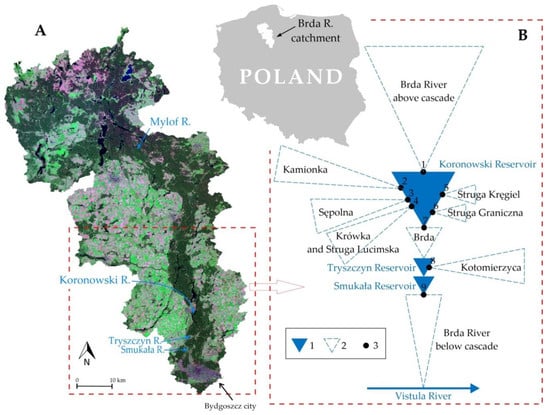
Figure 1.
Sketch of the study area: (A) analyzed subcatchment on the background of the Brda catchment area, (B) diagram of water objects within the studied subcatchment: 1. reservoirs, 2. tributaries subcatchment names, 3. measurement stations (water gauge) of State Environment Monitoring with numbering.
According to the physical and geographical description of Kondracki [57], the study area is a part of three units: West Pomeranian Lake District, South Pomeranian Lake District, and Thorn-Eberswalde Urstromtal. Brda River is flowing in the Brda Valley glacial outwash sands surrounded by postglacial formations: Świecie Upland at the east side and Krajna Lake District at the west side. The Brda Valley is made up of fluvioglacial deposits of sand surrounded by postglacial uplands made mainly of moraine clay [58].
The Brda River catchment amounts to 4299 km2 and subcatchments of Koronowski Reservoir amount to 1693 km2 [59]. The average discharge of the Brda River is 23.7 m3s−1 in Piła Młyn (station 1) and 26.4 m3s−1 in Smukała (station 9) [60]. The water flow of the Brda River in the hydrological year is very regular as a result of the high afforestation of the area and the existence of many lakes in the upper part of the catchment [61]. The average discharge of tributaries to Brda cascade reservoirs in period 1962–2015 amounted to: Kamionka (station 2) 2.3 m3s−1, Sępolenka (station 3) 0.9 m3s−1, Krówka and Struga Lucimska (station 4) 0.6 m3s−1, Struga Kręgiel (station 5) 0.1 m3s−1, Struga Graniczna (station 6) 0.1 m3s−1, and Kotomierzyca (station 8) 0.3 m3s−1 [59].
The Brda catchment area is heavily anthropogenically transformed. There are four artificial reservoirs (Mylof—capacity 16.2 million m3 [62], Koronowski—capacity 81.0 million m3 [59], Tryszczyn and Smukała—overall capacity of about 3.2 million m3 [63]). Also estuary part of the Brda River in Bydgoszcz City has significant hydrostructure pressures [60].
2.2. Materials
2.2.1. Corine Land Cover Database
Data on land use was obtained from the Copernicus Land Monitoring Service (CLMS). COoRdination and INformation on the Environment (CORINE) Land Cover (CLC) database for 1990, 2006, and 2018 was used. CORINE CLC uses a Minimum Mapping Unit (MMU) of 25 ha for area phenomena and a minimum width of 100 m for linear phenomena [64]. Detailed technical specifications about the products used are presented in Table 1. Characteristics CLC, e.g., land cover nomenclature, identification methodology, and quality of the data is in the research of Feranec et al. [65].

Table 1.
Technical specifications for used CORINE Land Cover (CLC) dataset [64].
2.2.2. Water Quality and Water Flow Data
The relationship between changes in selected parameters of water quality in lowland reservoirs and changes in land cover was determined using two groups of indicators. The first group concerns the indicator relating to the intensity of the mechanical denudation process, responsible for the formation of transported sediments in the form of Suspended Sediment Load (SSL). The second group includes indicators relating to the area and point pollution from agricultural and urbanized areas, i.e., nutrients in the form of total nitrogen load (TNL) and total phosphorus load (TPL).
Water quality data from State Environmental Monitoring (SEM) of the measurement stations for the period 1987–2013 was used. The method of conducting the monitoring is regulated by the Act of 20 July 2017 [66]. Data for Brda River were provided by the local branch of the Inspectorate of Environmental Protection in Bydgoszcz for measurement stations located at the inflow and outflow to the first main reservoir (measurement stations no. 1 and 7) and rivers that end their course into this reservoir (stations no. 2–6), at the inflow and outflow of the subsequent reservoirs of the cascade (stations no. 8 and 9) (Figure 1).
Monthly average discharge data were provided by the Polish Institute of Meteorology and Water Management—National Research Institute for stations no. 1, 7, and 9 for the period 1987–2013 and by the local branch of the Inspectorate of Environmental Protection in Bydgoszcz (no. 2–6, 8), for the years 1988, 1995, and 2013.
2.2.3. Digital Elevation Model for Mechanical Denudation Analysis
The CLC data for the Brda River catchment area were related to selected indicators responsible for mechanical denudation of the catchment area. The basis for the analyzes was the 5 × 5 m cell size of the digital elevation model (DEM) obtained from the resources of the Head Office of Geodesy and Cartography in Poland. Data in the form of ASCII XYZ GRID files in the national coordinate system “1992” was obtained.
2.3. Methods
2.3.1. Land Use/Land Cover Changes
All CLC databases (1990, 2006, 2018) were clipped to the study area (geoprocessing tools—Clip) using the open-source Geographic Information System software QuantumGIS (version 3.4.12). The next step was to intersect the CLC layers and layers of subcatchments of the Brda River (geoprocessing tools—Intersect). The area covered with the appropriate CLC type was calculated using QGIS—field calculator. The CLC classification was standardized to three-level nomenclature of land cover [64]. At the third (European) level, 44 forms were distinguished, 31 of which occur in Poland. There are 21 forms (at level 3) in the research area that have been aggregated for work into five main forms of land cover (at level 1): artificial surfaces (A), agricultural areas—intensive (aI) and extensive (aE), forests and semi-natural areas (F), wetlands and water bodies (W) (Table 2). The dynamics of changes in the land cover in the period 1990–2018 was determined by comparing the percentage of changes occurring in individual catchments.
Table 2.
Aggregated CLC classes used in the analysis.
2.3.2. Sediment and Nutrients Flux Dynamics
For stations 1, 7, and 9 the monthly average data of the following indicators was analyzed: total suspended sediment (in mg l−1), total nitrogen (in mg l−1), and total phosphorus (in mg l−1) for the period 1987–2013. Taking into account the discharge provided by the Polish Institute of Meteorology and Water Management—National Research Institute, the SSL (in tons) and nutrients (TNL and TPL, in tons) balance was calculated in the longitudinal profile of the Brda River for the period 1987–2013 and a detailed monthly balance of the inflow and outflow of SSL and nutrients in the cascade, including inflows (no. 2–6, 8), for the years 1988, 1995, and 2013.
The load of SSL, TNL, and TPL was calculated using formulas:
where: monthly average concentration of water quality indicators in mg l−1: TSS is the total suspended sediment, TN is the total nitrogen, TP is the total phosphorus; Qt is the monthly average discharge, in m3s−1, and t is the amount of seconds in a month.
The load trapping efficiency (β) by the reservoir cascade was calculated using the formula:
where: LI is the amount of load delivered (in tons) and LO is the amount flushed off the reservoir.
2.3.3. Topographic Indicators
Morphometric analyzes were performed using SAGA v.2.3.2 software [67]. The basis DEM was transformed into the 30 × 30 m cell size GRID format file. GRID was clipped to extent of layers of subcatchments of the Brda River layers (Clip Grids). In the next step, GRID was hydrologically transformed to remove sinks (Fill Sinks), using the formula proposed by Planchon and Darboux [68]. The minimum slope angle (0.1°) preserved from one cell to the next was determined. Using output Filled DEM (GRID) the following indicators using SAGA modules were determined: (i) LS Factor—LSF [69] used by the Universal Soil Loss Equation (USLE) [70], (ii) Melton Ruggedness Number—MRN [71] as a flow accumulation related index [72], (iii) Topographic Wetness Index—TWI as a potential generation of runoff [73], and (iv) Stream Power Index—SPI, determining erosive power of flowing water [69]. Output GRIDs enable the spatial analyses of topographic indicators distribution and to estimate a correlation with CLC databases in time. Taking into account the size of the surface of the detailed subcatchments, the probability factor was determined using the principle described by Phillips, Dudík [74] for 10000 random points for every subcatchment, to ensure efficient statistical calculations. Statistics were applied to assess the relationship between individual CLC types (1990, 2006, 2018) and the values of morphometric and physical indicators of the catchment.
3. Results
3.1. CLC Changes
The land cover of the Brda River catchment area is dominated by forests (F) and intensive agricultural land (aI) in the analyzed period (Figure 2). Land use has changed over recent decades, with a systematic reduction of forest areas (F) and an increase of arable (aI) and urban (A) areas. In 1990, forests (F) covered 45.7%, and arable land (aI) covered 38.7% of the total catchment area. In 2018, the above-mentioned coverage types were 47.0% and 36.6%, respectively. The largest change in coverage took place in the type of artificial surfaces (A), where in the analyzed period their surface increased from 2.4% to 4.2%. This is a result of strong anthropogenic pressures, especially in the lower part of the Brda River catchment area.
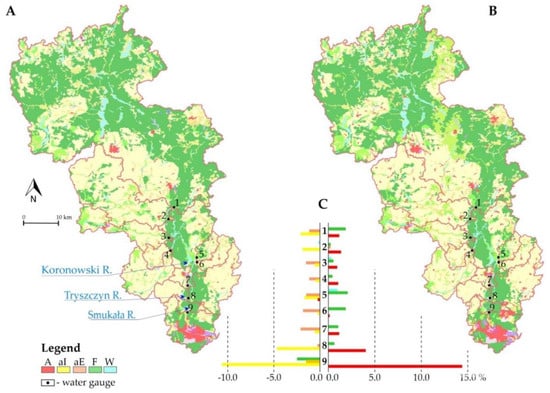
Figure 2.
CLC land use of the Brda catchment area: (A) in 1990, (B) in 2018, (C) changes in subcatchments [%] between 1990 and 2018, no. 1 to 9 there are catchments showed on Figure 1.
In the analyzed period, in the catchment area above the inflow to the Koronowski Reservoir (measurement station no. 1), the surface of A and F areas increased by 1.2% and 1.9%, respectively, at the cost of aI 2.1% and aE 1.0%. The direct catchment area of the Koronowski Reservoir and the partial catchments of all its tributaries followed the same trend. An increase in the percentage of areas A (from 0.1% to 1.4%) and F (from 0.1% to 2.1%) dominated at the expense of aI (from 0.2% to 1.8%) and aE (from 0.2 to 1.8%). Subsequent partial catchments along the Brda River were characterized by a trend of intensifying the increase in the surface of A areas (from 1.9% to 14.6%) at the expense of other types of cover.
When analyzing the changes in land cover in the first period (1990–2006), there was a change at the level of 1.1% to 3.8%, resulting in an increase in area A at the cost of aI. These changes mainly concerned partial catchments located near Bydgoszcz. In the next period (2006–2018), the dynamics of these changes increased, the growth in A areas (4.0%–11.5%) was at the expense of aI and aE. Again, the partial catchments below the Smukała reservoir showed the highest dynamics (Figure 2).
3.2. Water Quality Changes
3.2.1. SSL Transport Dynamics
In the analyzed period, the SSL in the longitudinal Brda River profile was gradually decreasing (Figure 3). The average load delivered to the Koronowski Reservoir in the period 1987–2013 was 3.6 thousand tons, with the load flushed out from the cascade of reservoirs at the level of 2.9 thousand tons. Until 1990, the SSL delivered into the main reservoir of the cascade oscillated in the range of 4.9–14.7 thousand tons (Figure 3). In the period 1990–2006, the SSL significantly decreased, reaching the level below 3.5 thousand tons. In the last analyzed period (after 2006) a slow increase in the SSL was observed in the Brda River longitudinal profile (Figure 3).
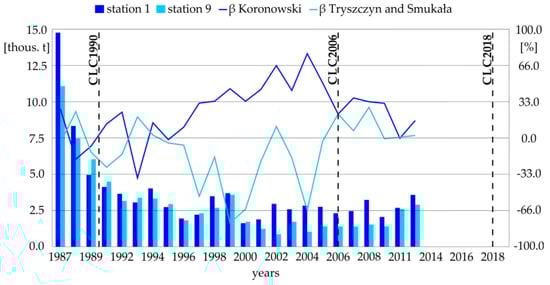
Figure 3.
The course of changes in the inflow and outflow of the SSL for the cascade of Brda River reservoirs against the course of changes in the suspended sediments trapping efficiency (β) in the main reservoir of the cascade—Koronowski Reservoir and the below lying reservoirs—Tryszczyn and Smukała for the period 1987–2013.
The SSL balance for the Koronowski Reservoir and the lower Tryszczyn and Smukała reservoirs until 1996 has the values of −36 <β <28, with the sequence, that in the case of accumulation in the Koronowski Reservoir, the SSL is removed from the lower reservoirs (Tryszczyn and Smukała) (Figure 3). In the following years (until 2005) the accumulation of the SSL in the Koronowski Reservoir (44.5% on average) can be observed, at the cost of removing (31.4% on average) the SSL from the lower reservoirs. Since 2006, the observed trend has changed again, indicating a continuous uninterrupted accumulation of sediments in all cascade reservoirs, oscillating in the range of 0.2–33.7% (Figure 3).
The analysis of the loop systems of the SSL transport balance in conjunction with the discharge indicates a large seasonal variation and the impact of the operation regime of reservoirs. The shift toward the value of the positive loop curves over time (1988–2013) indicates a decrease in the flushed material from the reservoirs (Figure 4). This confirms the above conclusions regarding the reduction of loads inflowed to and outflowed from the reservoirs. It should be noted that the majority of the load is delivered by the Brda River, in the case of the Koronowski Reservoir it is on average from 83.3% (1988) to 74.7% (2013), and for the Smukała Reservoir from 96.6% (1988) to 98.0% (2013). This is mainly due to the absolute size of the SSL transport medium, i.e., the volume of the Brda River flows compared to the other tributaries of the cascade reservoirs, conditioned by the areas and formations building the catchments. At the same time, the monthly values of outflowed sediments (β < 0) are getting lower and lower, respectively from the maximum level of −268% for the Koronowski Reservoir in 1988, to −60% in 2014 for the Smukała Reservoir (Figure 4).
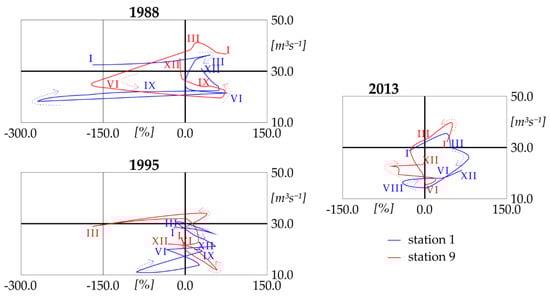
Figure 4.
Relation of the discharge (Q) to the SSL balance inflowed to and outflowed from the Brda River reservoirs cascade (β) in selected years.
According to the rise and fall of discharge (Q), the β relationship formed different variations of figure-eight pattern loops, with clockwise or anti-clockwise loops of the first peak (Figure 4). Detailed analysis for selected years shows two periods of increased accumulation of SSL in the Koronowski Reservoir. The first spring period—with a shift to the early summer period (March–June), and the second—at the end of the year (October–December). The loop system indicates that during the first period the nearest channel is the sediment source, while in the summer the sediment source is a remote upstream area, in both cases with extended delivery times. On the other hand, for the reservoirs ending the Brda River cascade, located closer to the city of Bydgoszcz, the reverse loop system is characteristic, where the first phase of SSL accumulation takes place in spring—with a shift to the early summer period (February–May), and the second (July–August) occurs in summer. A clear reduction in the rate of accumulation during the first phase and its flattening over time is the result of the activity of the first reservoir in the cascade—Koronowski Reservoir. However, the second phase, related to the delivery of SSL from the nearest channel, corresponds to the period of heavy rains, in this case occurring in the catchments with the highest share of anthropogenic areas (A). The correlation coefficient between Q and the SSL load inflowed to the reservoirs is from 0.332 to 0.509 for the Koronowski Reservoir, and from 0.275 to 0.505 for outflowed, which confirms the fact that it is not the discharge that determines the accumulation and flushed-off of SSL in the Brda River cascade of reservoirs, but the mode of their operation regime.
3.2.2. Phosphorus and Nitrogen Flux Dynamics
In the case of the transport of nutrients from the catchment area, in the period 1987–2013 an increase in the inflow of the TNL and a decrease in the inflow of the TPL to the Koronowski Reservoir from the Brda catchment area was observed (Figure 5). Loads of the above-mentioned nutrients inflowed to the first reservoir of the Brda cascade oscillate in the range of 0.43–1.28 thousand tons, and 0.06–1.05 thousand tons, respectively (Figure 5). The average inflow of nutrients in the studied multi-year period was 0.71 thousand tons of total nitrogen and 0.20 thousand tons of total phosphorus. At the outflow from the Smukała Reservoir, the same trend is observed, an increase in the outflow of the TNL, and a decrease in the outflow of the TPL (Figure 5). Average loads of total nitrogen discharged from the cascade for the period 1987–2013 amount to 0.92 thous. tons, with an average value of 0.21 thous. tons for total phosphorus.
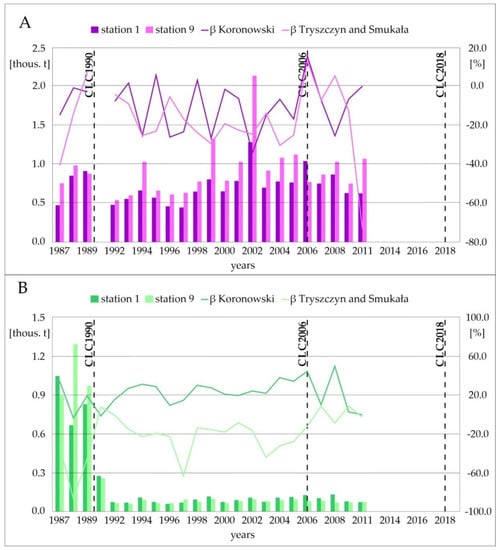
Figure 5.
Changes in the inflow and outflow of nutrients total nitrogen load (TNL) (A) and total phosphorus load (TPL) (B) for the cascade of Brda River reservoirs against the course of changes in the nutrient loads trapping efficiency (β) in the main reservoir of the cascade—Koronowski Reservoir, and the below lying reservoirs—Tryszczyn and Smukała for the period 1987–2013.
The TNL balance for the Brda River cascade reservoirs in the majority of the 1987–2013 period is negative (Figure 5). The average balance is −10.1% for the Koronowski Reservoir and −18.0% for the next two reservoirs of the cascade. Almost throughout the whole analyzed period (with the exception of two years), the balance of the TPL for the Koronowski Reservoir indicates its accumulation. The β values range from −2.9% to 50.1% (Figure 5), taking the mean value at the level of 22.1%. However, for the two below lying reservoirs, the outflow of the TPL is recorded almost throughout the analyzed period. TPL losses reach the level of −86.7%, taking an average value of −20.6%.
3.3. Topographic Indexes Analysis
Morphometric and physical characteristics make it possible to link the dynamics of morphological processes defining the sources of SSL and nutrients supply with the CLC coverage of the catchment area. The values of LSF oscillate in the range from 3.386 to 18.233, assuming a tendency of decreasing mean value along with the course of the Brda River, however, the maximum values are characteristic for edge areas in the partial subcatchments located below the Koronowski Reservoir (Figure 6A). A similar spatial distribution to the LSF index is assumed by the MRN index, indicating areas with a varied topography as potential sources of sediment supply. The maximum values of 2.951 are characteristic for the partial catchment of the Kamionka River (subcatchment no. 2), while the average value of the indicator decreases along with the Brda River, oscillating in the range from 0.056 to 0.162 (Figure 6B). High TWI values in concave forms (river valleys) indicate a high potential for excessive saturation of surface runoff, thus the possibility of washing out the sediments. In the longitudinal profile, an increase in the mean value of the TWI index is observed, ranging from 9.797 to 10.965 (Figure 6C). The last analyzed index, SPI, has a similar dependence (Figure 6D), determining the valley areas as a potential source of material supply (transport).
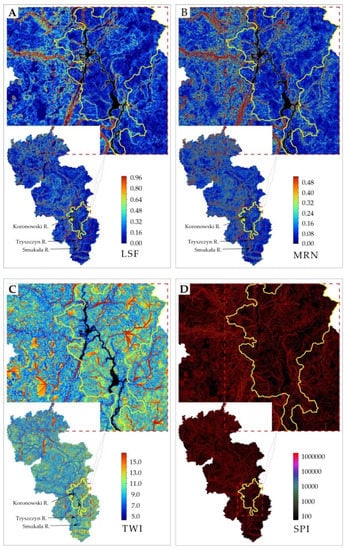
Figure 6.
Spatial image of morphometric and physical characteristics of the Brda River catchment, (A) LS Factor (LSF), (B) Melton Ruggedness Number (MRN), (C) Topographic Wetness Index (TWI), (D) Stream Power Index (SPI).
The correlation between the values of morphometric and physical indicators and the land cover based on the CLC for the years 1990, 2006, 2018 was determined for individual analyzed subcatchments in the longitudinal Brda River profile. Generally, there is no correlation between the CLC and the examined indicators. The values of the probability factor oscillated for the examined morphometric and physical indices in the range of: LSF from −0.156 to 0.155, MRN from −0.073 to 0.226, TWI from −0.118 to 0.354, and SPI from −0.077 to 0.336 (Figure 7). Based on the values shown in Figure 7 it can be assumed that the increase in the values of the LSF and MRN indexes, linking the vertical intensity of the terrain relief with the denudation process, is directly proportional to the probability of their association with the CLC classes. R2 values decrease in the analyzed period (1990–2018), which indicates that the CLC is less and less related to specific denudation index values. The values of the remaining two analyzed parameters (TWI and SPI) are inversely proportional to the probability with the individual CLC classes. R2 values increase in the analyzed period (1990–2018), indicating an increase in the relationship between CLC and indicators determining the dynamics of sediment movement in sections of river valleys. Thus, it can be assumed that the CLC changes taking place directly in the river valleys are more related to the denudation process than the changes taking place in other areas of the catchment area.
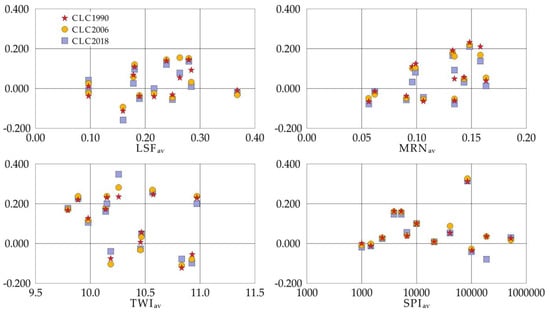
Figure 7.
Probability factor for the mean values of the examined morphometric and physical indicators (LS Factor (LSF), Melton Ruggedness Number (MRN), Topographic Wetness Index (TWI), Stream Power Index (SPI) and the types of land cover (CLC 1990, 2006, 2018) in the Brda River catchment area.
4. Discussion
Natural processes and anthropopression cause changes in the structure of the river catchment area cover. CORINE Land Cover products allow us to easily trace the changes in land cover. Land use change causes showed by Geist and Lambin [75] were divided into two groups: proximate (e.g., infrastructure extension, agricultural expansion, wood extraction, etc.,) and underlying (e.g., demographic, economic, policy, and cultural factors).
In the group of proximate factors, the most important was the historical pressure of charcoal burners settlement, the 16th century [76], and to a lesser extent agriculture, the 17th century, which was presented in the research by Słowiński et al. [77] and results from changes in Prussian / German management of transformation of mixed forests into Scots pine monocultures in the 18th century. We were dealing here with activities contributing to the deterioration of water quality (deforestation, intensification of the supply of material from the catchment area, etc.,). The country’s economy affected the structure of land cover, hence a significant share of agricultural areas in the Brda River catchment, reflecting the historic land use. The increase in arable land was mainly at the expense of green areas (meadows, forests). The process of deforestation is characteristic of Poland’s territory [22]. Such a trend was recorded in the first analyzed period (1990–2006) for the Sępolna River catchment (measurement station no. 3), where aI area increased at the expense of aE. Research of Bhaduri et al. [78] shows that a load of non-point source pollution increased by 15% after forest area reduction and increase of arable land. Also, research of [79,80,81] shows that nitrate concentration is strongly related to arable land in the catchment area. Research by McGuckin et al. [82] shows a strong correlation between phosphorus concentration in surface water and arable land use. However, in general, in the area of research, we dealt with an increase in the area of F and A at the expense of aI. It can be identified with the course of two processes: afforestation and urbanization. Agricultural areas are reduced in Poland [22,83] it coincides with European [84] and global [85] trends. The largest changes in land cover are characteristic for the catchment areas located in the lower reaches of the Brda River, below the Smukała Reservoir (measurement station no. 9), which are part of the administrative area of the city of Bydgoszcz (Figure 2). The typical effect of increasing urban and sub-urban areas around Bydgoszcz City became visible. It is similar to the research close to Leipzig [24]. Also, a reduction of intensive arable areas (aI) did not cause a decrease in food production services.
The second group of factors, described by Geist and Lambin [75], underlying group, took place after 1990 when we were dealing with the migration of society to the outsides of the city. This results in the dispersion of environmental pressure (pollution sources in the catchment area) that may have a potential impact on water quality. On the other hand, the programs in the field of wastewater management carried out at an increasingly higher technological level guarantee the reduction of loads supplied from anthropogenic sources [86].
The observed increase in the TNL inflowed to the Brda River cascade with a simultaneous increase in the load flushed out from the cascade (Figure 5) proves the transport of nitrogen compounds outside the reservoirs. Nitrogen load is strongly correlated with landscape structure [87]. In the case of total phosphorus in the analyzed period, there was a clear decrease in transported loads (Figure 5). Moreover, the catch of loads in the Koronowski Reservoir and their outflow from the next two reservoirs of the cascade (Tryszczyn and Smukała) was reported (Figure 5). Phosphorus compounds limit the course of metabolic processes in the aquatic environment. At relatively low concentrations in the waters of the Brda River, a significant part of the load is used in the primary production process (biomass). This process takes place primarily in the lacustrine zones of the Koronowski Reservoir, which is highly hydromorphologically differentiated [59], resulting in a decrease in the TPL determined in the research. The next two reservoirs of the Brda River cascade (Tryszczyn and Smukała) of a valley character only transported phosphorus loads (transit) to the Vistula River. Hence, the trend of changes in the TPL values better reflects the quantity of primary production and changes in water and sewage management in the catchment area, rather than changes in the structure of the land cover.
Here, the weakness of the point data method of collection for water quality assessment is noted, where demonstrating the impact of land cover changes on water quality may not be noticeable. Matysik et al. [8], on the basis of research on the impact of the character of land use in the catchments of 20 reservoirs, noticed that there is no statistically significant relationship between the TNL and land use (CLC classes 1–5). For all 20 examined reservoirs, the point water quality data at the outlet of the reservoir (below the dam) were analyzed. In the case of large reservoirs, because of the slow water exchange, a significant part of the load may be used in the primary production process (biomass). Similar conclusions can be drawn from the studies by Ding et al. [88], indicating a problem with determining the direct impact of land cover changes on water quality as a result of TNL supply from urbanized areas.
Structural changes in the water and sewage management in the Brda River catchment area are also illustrated by the course of the SSL (Figure 3). The programs conducted in the 1990s, consisting of the reconstruction or modernization of sewage treatment plants, resulted in the improvement of water quality [86]. According to the Kuyavian and Pomeranian Voivodship of State of the Environment Report [89], the supply of untreated sewage was reduced from 73.0 × 10⁶ m3 in 1993 to 3.0 × 10⁶ m3 in 2012 and the type of the treatment plant was modernized from mechanical to biological. This was reflected in a significant reduction in the SSL supply to Brda River waters (Figure 3) in the first analyzed period 1987–2006, which corresponds to the goals of environmental management with sustainable development [24]. However, in the second analyzed period (2006–2013) a weak upward trend in the SSL is noticeable in the longitudinal Brda River profile (Figure 3). This may be due to an increase in anthropogenic surfaces—hardened ones. Taking into account climate change, we may be dealing with extreme hydrological phenomena more and more often [90] including flash floods. Noteworthy, the rise of global air temperature [91], results in increased evapotranspiration from land and water surfaces [92], which will have an impact on the more frequent occurrence of periods with limited precipitation leading to the intensification of droughts [93]. This will be reflected not only in structural changes, e.g., in the reduction of agricultural areas [94], linked with CLC, but most of all in the water cycle, which has a direct relationship with SSL transport. This is reflected in the increased supply of the SSL as a result of extreme rainfall in anthropogenic areas, as also noted by Kundzewicz et al. [95]. It is also marked in the loop systems for the lower reservoirs of the Brda cascade (Tryszczyn and Smukała), where in the case of summertime second load peak, reversed loops are observed (Figure 4), which indicates the supply of material from areas nearby riverbed as a result of surface runoff after heavy rainfall. Also, in experimental research, in non-hardened catchments [45] an impact of climate conditions was observed in terms of long-term hydrological responses, which has an indirect effect on SSL.
The impact of anthropopressure on the Brda fluvial environment also results from the transformation of the water flow regime as a result of the commission of reservoirs [59]. A significant influence on the dynamics of sediment transport caused by reservoirs is observed in research [96,97,98,99]. The change of fluvial to reolimnic character influences the course of biological and physical processes in waters [100]. The existing reservoirs affect the quality of water in the longitudinal profile of the Brda River. In general, we observe an improvement in water quality as a result of sediment accumulation (Figure 3). The negative SSL balance resulting from the role of reservoirs in the Brda catchment area is confirmed by previous studies [59]. As the SSL is one of the physicochemical indicators used to assess the ecological status of waters in accordance with the WFD [4], the presence of reservoirs has a real impact on the assessment of SWB. A decrease in nutrient loads in the longitudinal profile, in particular the accumulation of the TPL (Figure 5), was also observed by Jutrowska [61]. As total phosphorus is taken into account in the classification of the ecological status of rivers [4], reservoirs also contribute to reducing the degree of water eutrophication.
Biogenic elements runoff depends on the arable intensity and soil erosion resistance [26]. Consideration should be given to the type of formation building the catchment area, sediment transport possibilities (e.g., nutrients, SSL) in relation to the discharge amount, etc. In the case of the catchments of the rivers flowing into the Brda cascade reservoirs (measurement stations no. 2–6 and 8), the maximum values of specific morphometric indicators (LSF, MRN, TWI, SPI) are relatively low, indicating a low sediment delivery ratio [59]. Thus, the dynamics of the supply of sediment and nutrients, in relation to the recorded land cover changes, is relatively small.
The dynamics of the SSL passing through reservoirs may be an indicator reflecting the impact of changes in the CLC land cover on the water quality of the catchment area. They are the receivers of all material supplied from the catchment area. On the other hand, their functioning modifies the quality of the waters below them through water retention or the operation regime. A positive balance (Figure 3) indicates sedimentation in reservoirs (Koronowski, Tryszczyn, and Smukała). The conducted studies of the balance of monthly SSL loads for the Brda River cascade of reservoirs show a significant limitation of the material supply from the catchment area between 1988 and 1995 (Figure 4). This can be related to the reflection of changes in the general cover of the catchment area (decrease aI areas) and the introduction of restrictive water and sewage management. Sediment availability, limited by the accumulation role of reservoirs and degradation processes in downstream, limited SSL on the analyzed catchment. However, as the carried out research has shown, the relationship between the CLC and the quality of the environment is not always the case. The impact of the SSL point data collected method is revealed again. The analyzed indicators determining the possibility of denudation in the Brda River catchment (LSF, MRN), or the possibility of washing out and transporting the material (TWI, SPI) did not show a strong correlation (Figure 7). The SSL balance for the Koronowski Reservoir in the period 2006–2013 (Figure 3 and Figure 5) indicates an increased accumulation. This can be directly related to the change of the water flow operating regime of the hydroelectric power plant, the transition from the peak-capacity mode to the constant-flow mode, but also indirectly to the increase in the capacity of the reservoir to capture sediments when the delivered load is reduced. Cascade-dammed water regime and sediment availability have greatly influenced the morphological evolution of the riverbed (degradation or aggradation), which is compatible with the research of Juez et al. [49], Obodowskyi et al. [99], and Gierszewski et al. [101].
Summarizing, fluvial processes in the catchment with dammed waters make it difficult to identify the environmental and non-environmental factors that affect the water quality. Research on the impact of CLC changes on water quality is one of the ways to determine these pressures, in addition to remote sensing techniques, e.g., MSI, OLI, OLCI [53,54,55]. In our research, it was not possible to use the above-mentioned methods because of: (i) strong internal differentiation of reservoirs (lacustrine and riverine parts) [59], (ii) type of suspended sediment transport in pulses mode, resulting from hysteresis [102,103], (iii) water regime of reservoirs [59] modifying the type of transport of suspended sediment and nutrients, into waves, and (iv) lack of qualitative data with adequate resolution to correlate the input data. All the mentioned factors would make it impossible to clearly indicate the impact of changes in CLC on water quality. Therefore, other research methods should be tested to assess the impact of land cover changes on water quality in strongly hydrotechnically transformed catchments (e.g., existing of the hydropower dams with reservoirs) in the face of climate change.
5. Conclusions
Based on the results of conducted studies on the influence of land use change by CLC on the dynamics of SSL and nutrients load in the reservoirs of the Brda River catchment, the following conclusions were drawn:
- Changes in land use in the Brda River catchment area in the period 1990–2018 consisted of an increase in artificial surfaces (A) by 1.8% and forests and semi-natural areas (F) by 1.3%, at the cost of intensive agricultural areas (aI) loss by 2.1%. These are relatively minor changes resulting from the extensification of agriculture, afforestation, and urbanization of the catchment. This corresponds to the generally observed trends in Poland and Europe.
- The results of the water quality research indicate that the reduction of intensive agricultural areas (aI) results in the reduction of the area pressure. In the analyzed period, there was a decrease in loads of suspended sediments and nutrients inflowed to the analyzed reservoirs, resulting in an increase in the ecological status of waters. The decrease in the dynamics of the denudation process is also caused by the afforestation process (an increase of the forests and semi-natural areas—F).
- Hydrological transformations of the Brda River catchment (commission of the cascade of reservoirs) contribute to the improvement of some indicators taken into account in the assessment of the ecological status of waters. Thus, strong transformations of the catchment area may prosaically have the opposite environmental effect.
- Morphometric and physical indicators: LSF, MRN, TWI, and SPI in comparison with changes in CLC land use showed no significant correlation. A detailed analysis of the loads trapping efficiency (β), taking into account the regime mode of reservoirs, showed that only land use changes occurring directly in river valleys can be reflected in water quality.
- Change in the CLC land use can be an indirect indicator to identify pressures affecting water quality in the catchment area. The results of the presented research indicate that the analysis of land cover changes may be applied for the assessment of the state of river water bodies. The current approach to point data collection on water quality needs to be revised as this connection is not straightforward in the case of heavy hydrotechnical changes in the catchment area. Artificial damming of water occurs in many river systems around the world, which makes it difficult to search for dependence of water quality on land use changes. For large rivers, remote sensing methods based on Landsat or Sentinel images can be used to collect water quality data, which can help fill important gaps in spatially varying sediment and nutrient loads in the waters. For smaller rivers, no possibility of using remote sensing results in only one solution—data collection by field campaign to configure the hydrodynamic and sediment transport models, allowing to consider the interactions between classifying factors.
- In the face of climate change and the growth the number of reservoirs on rivers, our research shows the necessity of using new research methods to assess the impact of land cover changes on the quality of water in catchments with dammed waters and reservoirs, because they are probably key elements in future decision-making cycle.
Author Contributions
Conceptualization, D.S. and M.H.; methodology, M.H. and D.S.; software, D.S. and M.H.; validation, M.H. and D.S.; formal analysis, M.H. and D.S.; investigation, D.S. and M.H.; resources, D.S. and M.H.; writing—original draft preparation, D.S. and M.H.; writing—review & editing, M.H. and D.S.; visualization, M.H. and D.S.; supervision, M.H.; project Administration, D.S.; funding acquisition, D.S. and M.H. All authors have read and agreed to the published version of the manuscript.
Funding
This research and APC was funded by the Project Supporting Maintenance of Research Potential of the Institute of Geography at Kazimierz Wielki University [grant number BS/2016/N2].
Acknowledgments
We would like to thank the two anonymous reviewers for very helpful comments that improved substantially our paper.
Conflicts of Interest
The authors declare no conflict of interest.
References
- Lobera, G.; Besné, P.; Vericat, D.; López-Tarazón, J.; Tena, A.; Aristi, I.; Díez, J.; Ibisate, A.; Larrañaga, A.; Elosegi, A.; et al. Geomorphic status of regulated rivers in the Iberian Peninsula. Sci. Total Environ. 2015, 508, 101–114. [Google Scholar] [CrossRef]
- Grill, G.; Lehner, B.; Thieme, M.; Geenen, B.; Tickner, D.; Antonelli, F.; Babu, S.; Borrelli, P.; Cheng, L.; Crochetiere, H.; et al. Mapping the world’s free-flowing rivers. Nature 2019, 569, 215–221. [Google Scholar] [CrossRef]
- Nilsson, C.; Reidy, C.A.; Dynesius, M.; Revenga, C. Fragmentation and Flow Regulation of the World’s Large River Systems. Science 2005, 308, 405–408. [Google Scholar]
- Directive 2000/60/EC of the European Parliament and of the Council of 23 October 2000 Establishing a Framework for Community Action in the Field of Water Policy. Available online: https://eur-lex.europa.eu/eli/dir/2000/60/oj (accessed on 21 October 2019).
- Harper, D. What is eutrophication? In Eutrophication of Freshwaters; Harper, D., Ed.; Springer: Dordrecht, The Netherlands, 1992; pp. 1–28. [Google Scholar]
- Khan, M.; Mohammad, F. Eutrophication: Challenges and Solutions. In Eutrophication: Causes, Consequences and Control; Ansari, A., Gill, S., Eds.; Springer: Dordrecht, The Netherlands, 2014; pp. 1–15. [Google Scholar]
- Schindler, D.W. Recent advances in the understanding and management of eutrophication. Limnol. Oceanogr. 2006, 51, 356–363. [Google Scholar] [CrossRef]
- Matysik, M.; Absalon, D.; Habel, M.; Maerker, M. Surface Water Quality Analysis Using CORINE Data: An Application to Assess Reservoirs in Poland. Remote. Sens. 2020, 12, 979. [Google Scholar] [CrossRef]
- Scopesi, C.; Rellini, I.; Maerker, M.; Firpo, M. Effects of landcover changes on flood generation in a small Mediterranean catchment (T. Teiro, Italy). Rendiconti Online della Società Geologica Italiana 2012, 21, 431–433. [Google Scholar]
- Saito, Y.; Yang, Z.; Hori, K. The Huanghe (Yellow River) and Changjiang (Yangtze River) deltas: A review on their characteristics, evolution and sediment discharge during the Holocene. Geomorphology 2001, 41, 219–231. [Google Scholar] [CrossRef]
- Crone, T.J.; Tolstoy, M. Magnitude of the 2010 Gulf of Mexico Oil Leak. Science 2010, 330, 634. [Google Scholar] [CrossRef]
- Panico, A.; Lanzano, G.; Salzano, E.; de Magistris, F.S.; Fabbocino, G. Seismic Vulnerability of Wastewater Treatment Plants. Chem. Eng. Trans. 2013, 32, 13–18. [Google Scholar]
- Bentivoglio, F.; Calizza, E.; Rossi, D.; Carlino, P.; Careddu, G.; Rossi, L.; Costantini, M.L. Site-scale isotopic variations along a river course help localize drainage basin influence on river food webs. Hydrobiologia 2015, 770, 257–272. [Google Scholar] [CrossRef]
- Johnson, L.; Richards, C.; Host, G.; Arthur, J. Landscape influences on water chemistry in Midwestern stream ecosystems. Freshw. Biol. 1997, 37, 193–208. [Google Scholar] [CrossRef]
- Allan, J.D.; Flecker, A.S. Biodiversity Conservation in Running Waters. Bioscience 1993, 43, 32–43. [Google Scholar] [CrossRef]
- Dube, T.; Sibanda, M.; Bangamwabo, V.; Shoko, C.; Dube, T.; Mbulisi, S. Establishing the link between urban land cover change and the proliferation of aquatic hyacinth (Eichhornia crassipes) in Harare Metropolitan, Zimbabwe. Phys. Chem. Earth. 2018, 108, 19–27. [Google Scholar] [CrossRef]
- Dosdogru, F.; Kalin, L.; Wang, R.; Yen, H. Potential impacts of land use/cover and climate changes on ecologically relevant flows. J. Hydrol. 2020, 584, 124654. [Google Scholar] [CrossRef]
- Trolle, D.; Nielsen, A.; Andersen, M.S.; Thodsen, H.; Olesen, J.E.; Børgesen, C.D.; Refsgaard, J.C.; Sonnenborg, T.O.; Karlsson, I.B.; Christensen, J.P.; et al. Effects of changes in land use and climate on aquatic ecosystems: Coupling of models and decomposition of uncertainties. Sci. Total Environ. 2019, 657, 627–633. [Google Scholar] [CrossRef]
- Uuemaa, E.; Roosaare, J.; Mander, Ü. Landscape metrics as indicators of river water quality at catchment scale. Hydrol. Res. 2007, 38, 125–138. [Google Scholar] [CrossRef]
- Kroll, S.A.; Llacer, C.N.; De La Cruz Cano, M.; De Las Heras, J. The influence of land use on water quality and macroinvertebrate biotic indices in river within Castilla-La Mancha (Spain). Limnetica 2009, 28, 203–214. [Google Scholar]
- Cebecauer, T.; Hofierka, J. The consequences of land-cover changes on soil erosion distribution in Slovakia. Geomorphology 2008, 98, 187–198. [Google Scholar] [CrossRef]
- Feranec, J.; Jaffrain, G.; Soukup, T.; Hazeu, G. Determining changes and flows in European landscapes 1990–2000 using CORINE land cover data. Appl. Geogr. 2010, 30, 19–35. [Google Scholar]
- Uuemaa, E.; Roosaare, J.; Mander, Ü. Scale dependence of landscape metrics and their indicatory value for nutrient and organic matter losses from catchments. Ecol. Indic. 2005, 5, 350–369. [Google Scholar] [CrossRef]
- Burkhard, B.; Kroll, F.; Müller, F.; Windhorst, W. Landscapes’ capacities to provide ecosystem services—A concept for land-cover based assessments. Landsc. Online 2009, 15, 1–22. [Google Scholar] [CrossRef]
- Petrişor, A.-I.; Ianos, I.; Talanga, C. Land cover and use changes focused on the urbanization PROCESSES in Romania. Environ. Eng. Manag. J. 2010, 9, 765–771. [Google Scholar] [CrossRef]
- Matysik, M.; Absalon, D.; Ruman, M. Surface Water Quality in Relation to Land Cover in Agricultural Catchments (Liswarta River Basin Case Study). Pol. J. Environ. Stud. 2015, 24, 175–184. [Google Scholar] [CrossRef]
- Campling, P.; Terres, J.; Walle, S.V.; Van Orshoven, J.; Crouzet, P. Estimation of nitrogen balances from agriculture for EU-15: Spatialisation of estimates to river basins using the CORINE Land Cover. Phys. Chem. Earth 2005, 30, 25–34. [Google Scholar] [CrossRef]
- Marcinkowski, P.; Piniewski, M.; Kardel, I.; Szcześniak, M.; Benestad, R.; Srinivasan, R.; Ignar, S.; Okruszko, T. Effect of Climate Change on Hydrology, Sediment and Nutrient Losses in Two Lowland Catchments in Poland. Water 2017, 9, 156. [Google Scholar] [CrossRef]
- Aksoy, E.; Yigini, Y.; Montanarella, L. Combining Soil Databases for Topsoil Organic Carbon Mapping in Europe. PLoS ONE 2016, 11, 0152098. [Google Scholar] [CrossRef]
- Szilassi, P.; Jordan, G.; Kovacs, F.; Rompaey, A.; Dessel, W. Investigating the link between soil quality and agricultural land use change. A case study in the Lake Balaton catchment, Hungary. Carpathian J. Earth Environ. Sci. 2010, 5, 61–70. [Google Scholar]
- Cerdan, O.; Govers, G.; Le Bissonnais, Y.; Van Oost, K.; Poesen, J.; Saby, N.; Gobin, A.; Vacca, A.; Quinton, J.; Auerswald, K.; et al. Rates and spatial variations of soil erosion in Europe: A study based on erosion plot data. Geomorphology 2010, 122, 167–177. [Google Scholar] [CrossRef]
- Panagos, P.; Meusburger, K.; Van Liedekerke, M.; Alewell, C.; Hiederer, R.; Montanarella, L. Assessing soil erosion in Europe based on data collected through a European network. Soil Sci. Plant. Nutr. 2014, 60, 15–29. [Google Scholar] [CrossRef]
- Zhu, M. Soil erosion risk assessment with CORINE model: Case study in the Danjiangkou Reservoir region, China. Stoch. Environ. Res. Risk Assess. 2011, 26, 813–822. [Google Scholar] [CrossRef]
- Özşahin, E.; Duru, U.; Eroğlu, I. Land Use and Land Cover Changes (LULCC), a Key to Understand Soil Erosion Intensities in the Maritsa Basin. Water 2018, 10, 335. [Google Scholar] [CrossRef]
- Kostadinov, S.; Braunović, S.; Dragićević, S.; Zlatić, M.; Dragović, N.; Rakonjac, N. Effects of Erosion Control Works: Case Study—Grdelica Gorge, the South Morava River (Serbia). Water 2018, 10, 1094. [Google Scholar] [CrossRef]
- El-Sadek, A.; Irvem, A. Evaluating the impact of land use uncertainty on the simulated streamflow and sediment yield of the Seyhan River basin using the SWAT model. Turk. J. Agric. For. 2014, 38, 515–530. [Google Scholar] [CrossRef]
- Van Oost, K.; Cerdan, O.; Quine, T.A. Accelerated sediment fluxes by water and tillage erosion on European agricultural land. Earth Surf. Process. Landf. 2009, 34, 1625–1634. [Google Scholar] [CrossRef]
- Ristić, R.; Ljujić, M.; Despotović, J.; Aleksić, V.; Radić, B.; Nikić, Z.; Milčanović, V.; Malušević, I.; Radonjić, J. Reservoir sedimentation and hydrological effects of land use changes-case study of the experimental Dičina river watershed. Carpathian J. Earth Environ. Sci. 2013, 8, 91–98. [Google Scholar]
- De Vente, J.; Poesen, J.; Govers, G.; Boix-Fayos, C. The implications of data selection for regional erosion and sediment yield modelling. Earth Surf. Process. Landf. 2009, 34, 1994–2007. [Google Scholar] [CrossRef]
- De Vente, J.; Poesen, J. Predicting soil erosion and sediment yield at the basin scale: Scale issues and semi-quantitative models. Earth Sci. Rev. 2005, 71, 95–125. [Google Scholar] [CrossRef]
- Verstraeten, G.; Poesen, J.; De Vente, J.; Koninckx, X. Sediment yield variability in Spain: A quantitative and semiqualitative analysis using reservoir sedimentation rates. Geomorphology 2003, 50, 327–348. [Google Scholar] [CrossRef]
- Pavanelli, D.; Cavazza, C.; Lavrnić, S.; Toscano, A. The Long-Term Effects of Land Use and Climate Changes on the Hydro-Morphology of the Reno River Catchment (Northern Italy). Water 2019, 11, 1831. [Google Scholar] [CrossRef]
- Da Silva, V.; Silva, M.T.; De Souza, E.P. Influence of land use change on sediment yield: A case study of the sub-middle of the São Francisco River Basin. Engenharia Agrícola 2016, 36, 1005–1015. [Google Scholar]
- Llena, M.; Vericat, D.; Cavalli, M.; Crema, S.; Smith, M. The effects of land use and topographic changes on sediment connectivity in mountain catchments. Sci. Total Environ. 2019, 660, 899–912. [Google Scholar] [CrossRef]
- Juez, C.; Nadal-Romero, E. Long-term time-scale bonds between discharge regime and catchment specific landscape traits in the Spanish Pyrenees. Environ. Res. 2020, 191, 110158. [Google Scholar] [CrossRef]
- Montzka, C.; Canty, M.J.; Kunkel, R.; Menz, G.; Vereecken, H.; Wendland, F. Modelling the water balance of a mesoscale catchment basin using remotely sensed land cover data. J. Hydrol. 2008, 353, 322–334. [Google Scholar] [CrossRef]
- Verbeiren, B.; Van De Voorde, T.; Canters, F.; Binard, M.; Cornet, Y.; Batelaan, O. Assessing urbanisation effects on rainfall-runoff using a remote sensing supported modelling strategy. Int. J. Appl. Earth Obs. Geoinf. 2013, 21, 92–102. [Google Scholar] [CrossRef]
- Solin, L.; Ferancec, J.; Nováček, J. Land cover changes in small catchments in Slovakia during 1990–2006 and their effects on frequency of flood events. Nat. Hazards 2010, 56, 195–214. [Google Scholar]
- Juez, C.; Hassan, M.A.; Franca, M.J. The Origin of Fine Sediment Determines the Observations of Suspended Sediment Fluxes Under Unsteady Flow Conditions. Water Resour. Res. 2018, 54, 5654–5669. [Google Scholar] [CrossRef]
- Verburg, P.H.; Soepboer, W.; Veldkamp, A.; Limpiada, R.; Espaldon, V.; Mastura, S.S.A. Modeling the Spatial Dynamics of Regional Land Use: The CLUE-S Model. Environ. Manag. 2002, 30, 391–405. [Google Scholar] [CrossRef]
- Zhang, P.; Liu, Y.; Pan, Y.; Yu, Z. Land use pattern optimization based on CLUE-S and SWAT models for agricultural non-point source pollution control. Math. Comput. Model. 2013, 58, 588–595. [Google Scholar] [CrossRef]
- Kroll, F.; Müller, F.; Haase, D.; Fohrer, N. Rural–urban gradient analysis of ecosystem services supply and demand dynamics. Land Use Policy 2012, 29, 521–535. [Google Scholar] [CrossRef]
- Toming, K.; Kutser, T.; Laas, A.; Sepp, M.; Paavel, B.; Nõges, T. First Experiences in Mapping Lake Water Quality Parameters with Sentinel-2 MSI Imagery. Remote. Sens. 2016, 8, 640. [Google Scholar] [CrossRef]
- Kutser, T.; Paavel, B.; Verpoorter, C.; Ligi, M.; Soomets, T.; Toming, K.; Casal, G. Remote Sensing of Black Lakes and Using 810 nm Reflectance Peak for Retrieving Water Quality Parameters of Optically Complex Waters. Remote. Sens. 2016, 8, 497. [Google Scholar] [CrossRef]
- Niroumand-Jadidi, M.; Bovolo, F.; Bruzzone, L. Novel Spectra-Derived Features for Empirical Retrieval of Water Quality Parameters: Demonstrations for OLI, MSI, and OLCI Sensors. IEEE Trans. Geosci. Remote. Sens. 2019, 57, 10285–10300. [Google Scholar] [CrossRef]
- Ritchie, J.C.; Schiebe, F.R.; McHenry, J.R. Remote sensing of suspended sediment in surface water. Photogramm. Eng. Remote Sens. 1976, 42, 1539–1545. [Google Scholar]
- Kondracki, J. Regional Geography of Poland; Polish Scientific Publishers: Warszawa, Poland, 2000; p. 144. [Google Scholar]
- Galon, R. Morfologia doliny i sandru Brdy. Stud. Soc. Scient. Tor. 1953, 1, 1–116. [Google Scholar]
- Szatten, D.; Habel, M.; Pellegrini, L.; Maerker, M. Assessment of Siltation Processes of the Koronowski Reservoir in the Northern Polish Lowland Based on Bathymetry and Empirical Formulas. Water 2018, 10, 1681. [Google Scholar] [CrossRef]
- Szatten, D. Wpływ zabudowy hydrotechnicznej na występowanie ekstremalnych stanów wody na przykładzie Brdy skanalizowanej. Inżynieria Ekologiczna 2016, 46, 55–60. [Google Scholar]
- Jutrowska, E. Anthropogenic Transformation of Water Conditions in the Brda River Basin; Environmental Monitoring Library Press: Bydgoszcz, Poland, 2007; p. 128. [Google Scholar]
- Biuro Wojewody Bydgoskiego. Pozwolenie wodnoprawne na szczególne korzystanie z wód rzeki Brdy gromadzonych w zbiorniku retencyjnym Mylof; 2015. Available online: http://archiwum.kujawsko-pomorskie.pl/index.php?option=com_content&task=view&id=20512&Itemid=665 (accessed on 10 September 2020).
- Biuro Wojewody Kujawsko-Pomorskiego. Pozwolenie wodnoprawne na szczególne korzystanie z wód rzeki Brdy dla potrzeb elektrowni wodnej Smukała; 2014. Available online: http://archiwum.kujawsko-pomorskie.pl/index.php?option=com_content&task=view&id=20512&Itemid=665 (accessed on 10 September 2020).
- Heymann, Y.; Steenmans, C.; Croisille, G.; Bossard, M. CORINE Land Cover. Technical Guide; Office for Official Publications of the European Communities: Luxembourg, 1994; p. 136. [Google Scholar]
- Feranec, J.; Hazeu, G.; Christensen, S.; Jaffrain, G. Corine land cover change detection in Europe (case studies of the Netherlands and Slovakia). Land Use Policy 2007, 24, 234–247. [Google Scholar] [CrossRef]
- Water Law Act. Journal of Laws 2017, 1566. Available online: https://isap.sejm.gov.pl/isap.nsf/DocDetails.xsp?id=WDU20170001566 (accessed on 5 October 2020).
- Conrad, O.; Bechtel, B.; Bock, M.; Dietrich, H.; Fischer, E.; Gerlitz, L.; Wehberg, J.; Wichmann, V.; Boehner, J. System for Automated Geoscientific Analyses (SAGA) v. 2.1.4. Geosci. Model Dev. 2015, 8, 1991–2007. [Google Scholar]
- Planchon, O.; Darboux, F. A fast, simple and versatile algorithm to fill the depressions of digital elevation models. Catena 2002, 46, 159–176. [Google Scholar] [CrossRef]
- Moore, I.D.; Grayson, R.B.; Ladson, A.R. Digital terrain modelling: A review of hydrological, geomorphological, and biological applications. Hydrol. Process. 1991, 5, 3–30. [Google Scholar] [CrossRef]
- Wischmeier, W.H.; Smith, D.D. Predicting Rainfall Erosion Losses: A Guide to Conservation Planning. In Agriculture Handbook No. 537; USDA: Washington, DC, USA, 1978; p. 66. Available online: https://naldc.nal.usda.gov/download/CAT79706928/PDF (accessed on 7 November 2018).
- Marchi, L.; Fontana, G.D. GIS morphometric indicators for the analysis of sediment dynamics in mountain basins. Environ. Earth Sci. 2005, 48, 218–228. [Google Scholar] [CrossRef]
- Melton, M.A. The Geomorphic and Paleoclimatic Significance of Alluvial Deposits in Southern Arizona. J. Geol. 1965, 73, 1–38. [Google Scholar] [CrossRef]
- Boehner, J.; Koethe, R.; Conrad, O.; Gross, J.; Ringeler, A.; Selige, T. Soil Regionalisation by Means of Terrain Analysis and Process Parameterisation. In Soil Classification 2001. European Soil Bureau, Research Report No. 7; Micheli, E., Nachtergaele, F., Montanarella, L., Eds.; EUR 20398 EN: Luxembourg, 2002; pp. 213–222. [Google Scholar]
- Phillips, S.J.; Dudík, M. Modeling of species distribution with Maxent: New extensions and a comprehensive evaluation. Ecography 2008, 31, 161–175. [Google Scholar]
- Geist, H.J.; Lambin, E.F. Proximate Causes and Underlying Driving Forces of Tropical Deforestation. Bioscience 2002, 52, 143–150. [Google Scholar]
- Stelmachowska, B. Z kultury materialnej Borowiaków Tucholskich. Ziemia 1937, 27, 48–53. [Google Scholar]
- Słowiński, M.; Lamentowicz, M.; Łuców, D.; Barabach, J.; Brykała, D.; Tyszkowski, S.; Pieńczewska, A.; Śnieszko, Z.; Dietze, E.; Jażdżewski, K.; et al. Paleoecological and historical data as an important tool in ecosystem management. J. Environ. Manag. 2019, 236, 755–768. [Google Scholar] [CrossRef]
- Bhaduri, B.; Harbor, J.; Engel, B.; Grove, M.; Harbor, J.M. Assessing Watershed-Scale, Long-Term Hydrologic Impacts of Land-Use Change Using a GIS-NPS Model. Environ. Manag. 2000, 26, 643–658. [Google Scholar] [CrossRef]
- Krause, S.; Jacobs, J.; Voss, A.; Bronstert, A.; Zehe, E. Assessing the impact of changes in landuse and management practices on the diffuse pollution and retention of nitrate in a riparian floodplain. Sci. Total Environ. 2008, 389, 149–164. [Google Scholar] [CrossRef]
- Oenema, O.; Van Liere, L.; Schoumans, O. Effects of lowering nitrogen and phosphorus surpluses in agriculture on the quality of groundwater and surface water in the Netherlands. J. Hydrol. 2005, 304, 289–301. [Google Scholar] [CrossRef]
- Fučík, P.; Kvítek, T.; Lexa, M.; Novak, P.; Bilková, A. Assessing the stream water quality dynamics in connection with land use in agricultural catchments of different scales. Soil Water Res. 2008, 3, 98–112. [Google Scholar] [CrossRef]
- McGuckin, S.O.; Jordan, C.; Smith, R.V. Deriving phosphorus export coefficients for corine land cover types. Water Sci. Technol. 1999, 39, 47–53. [Google Scholar] [CrossRef]
- Cegielska, K.; Noszczyk, T.; Kukulska, A.; Szylar, M.; Hernik, J.; Dixon-Gough, R.; Jombach, S.; Valánszki, I.; Kovács, K.F. Land use and land cover changes in post-socialist countries: Some observations from Hungary and Poland. Land Use Policy 2018, 78, 1–18. [Google Scholar] [CrossRef]
- Levers, C.; Butsic, V.; Verburg, P.H.; Schierhorn, F.; Kuemmerle, T. Drivers of changes in agricultural intensity in Europe. Land Use Policy 2016, 58, 380–393. [Google Scholar] [CrossRef]
- Meiyappan, P.; Dalton, M.; O’Neill, B.C.; Jain, A.K. Spatial modeling of agricultural land use change at global scale. Ecol. Model. 2014, 291, 152–174. [Google Scholar] [CrossRef]
- Marszalewski, W.; Piasecki, A. Analysis of the development of wastewater infrastructure in Poland in ecological and economical aspects. Sci. J. SGGW 2014, 11, 127–137. [Google Scholar]
- Turner, R.; Rabalais, N.; Justic’, D.; Dortch, Q. Global patterns of dissolved N, P and Si in large rivers. Biogeochemistry 2003, 64, 297–317. [Google Scholar] [CrossRef]
- Ding, J.; Jiang, Y.; Fu, L.; Liu, Q.; Peng, Q.; Mu-Yi, K. Impacts of Land Use on Surface Water Quality in a Subtropical River Basin: A Case Study of the Dongjiang River Basin, Southeastern China. Water 2015, 7, 4427–4445. [Google Scholar] [CrossRef]
- Goszczyński, J.; Ślachciak, W. Report of State of the Environment Kuyavian and Pomeranian Voivodship; Environmental Monitoring Library Press: Bydgoszcz, Poland, 2012; p. 186. [Google Scholar]
- Lane, S.N.; Tayefi, V.; Reid, S.C.; Yu, D.; Hardy, R.J. Interactions between sediment delivery, channel change, climate change and flood risk in a temperate upland environment. Earth Surf. Process. Landf. 2007, 32, 429–446. [Google Scholar] [CrossRef]
- Vinnikov, K.Y. Global Warming Trend of Mean Tropospheric Temperature Observed by Satellites. Science 2003, 302, 269–272. [Google Scholar] [CrossRef]
- Novák, V. Evapotranspiration: A Component of the Water Cycle. In Evapotranspiration in the Soil-Plant-Atmosphere System; Novák, V., Ed.; Springer: Dordrecht, The Netherlands, 2012; pp. 1–13. [Google Scholar]
- Dai, A. Drought under global warming: A review. Wiley Interdiscip. Rev. Clim. Chang. 2010, 2, 45–65. [Google Scholar] [CrossRef]
- Kundzewicz, Z.W.; Kozyra, J. Wpływ zmian klimatu na rolnictwo w Polsce. In Zmiany klimatu i ich wpływ na wybrane sektory w Polsce; Kundzewicz, Z.W., Øystein, H., Okruszko, T., Eds.; Instytut Środowiska Rolniczego i Leśnego PAN: Poznań, Poland, 2017; pp. 168–181. [Google Scholar]
- Kundzewicz, Z.W.; Mata, L.J.; Arnell, N.W.; Döll, P.; Jimenez, B.; Miller, K.; Oki, T.; Şen, Z.; Shiklomanov, I. The implications of projected climate change for freshwater resources and their management. Hydrol. Sci. J. 2008, 53, 3–10. [Google Scholar] [CrossRef]
- Van Rijn, L.C. Sediment Transport, Part III: Bed forms and Alluvial Roughness. J. Hydraul. Eng. 1984, 110, 1733–1754. [Google Scholar] [CrossRef]
- Kondolf, G.M. PROFILE: Hungry Water: Effects of Dams and Gravel Mining on River Channels. Environ. Manag. 1997, 21, 533–551. [Google Scholar] [CrossRef]
- Vorosmarty, C.; Meybeck, M.; Fekete, B.; Sharma, K.; Green, P.; Syvitski, J.P. Anthropogenic sediment retention: Major global impact from registered river impoundments. Glob. Planet Chang. 2003, 39, 169–190. [Google Scholar] [CrossRef]
- Obodovskyi, O.; Habel, M.; Szatten, D.; Rozlach, Z.; Babiński, Z.; Maerker, M. Assessment of the Dnieper Alluvial Riverbed Stability Affected by Intervention Discharge Downstream of Kaniv Dam. Water 2020, 12, 1104. [Google Scholar] [CrossRef]
- Kajak, Z. Hydrobiologia—limnologia. Ekosystemy wód śródlądowych; Wyd. Nauk. PWN: Warszawa, Poland, 2002; p. 355. [Google Scholar]
- Gierszewski, P.J.; Habel, M.; Szmańda, J.; Luc, M. Evaluating effects of dam operation on flow regimes and riverbed adaptation to those changes. Sci. Total Environ. 2020, 710, 136202. [Google Scholar] [CrossRef]
- Walling, D.E. Assessing the accuracy of suspended sediment rating curves for a small basin. Water Resour. Res. 1977, 13, 531–538. [Google Scholar] [CrossRef]
- Williams, G.P. Sediment concentration versus water discharge during single hydrologic events in rivers. J. Hydrol. 1989, 111, 89–106. [Google Scholar] [CrossRef]


Publisher’s Note: MDPI stays neutral with regard to jurisdictional claims in published maps and institutional affiliations. |
© 2020 by the authors. Licensee MDPI, Basel, Switzerland. This article is an open access article distributed under the terms and conditions of the Creative Commons Attribution (CC BY) license (http://creativecommons.org/licenses/by/4.0/).