Abstract
Phoenix palms cover more than 1.3 million hectares in the Mediterranean, Middle East, and North Africa regions and they represent highly valued assets for economic, environmental, and cultural purposes. Despite their importance, information on the number of palm trees and the palm distribution across different scenes is difficult to obtain and, therefore, limited. In this work, we present the first region-wide spatial inventory of Phoenix dactylifera (date palm) and Phoenix canariensis (canary palm) trees, based on remote imagery from the Alicante province in Spain. A deep learning architecture that was based on convolutional neural networks (CNN) was implemented to generate a detection model able to locate and classify individual palms trees from aerial high-resolution RGB images. When considering that creating large labeled image datasets is a constraint in object detection applied to remote sensing data, as a strategy for pre-training detection models on a similar task, imagery and palm maps from the autonomous community of the Canary Islands were used. Subsequently, these models were transferred for re-training with imagery from Alicante. The best performing model was capable of mapping Phoenix palms in different scenes, with a changeable appearance, and with varied ages, achieving a mean average precision () value of 0.861. In total, 511,095 Phoenix palms with a probability score above 0.5 were detected over an area of 5816 km2. The detection model, which was obtained from an out-of-the-box object detector, RetinaNet, provides a fast and straightforward method to map isolated and densely distributed date and canary palms—and other Phoenix palms. The inventory of palm trees established here provides quantitative information on Phoenix palms distribution, which could be used as a baseline for long-term monitoring of palms’ conditions. In addition to boosting palm tree inventory across multiple landscapes at a large scale, the detection model demonstrates how image processing techniques that are based on deep learning leverage image understanding from remote sensing data.
1. Introduction
Phoenix palms cover more than 1.3 million hectares of agricultural land in the Mediterranean, Middle East, and North Africa regions [1]. The most common species of the Phoenix genus are the date palm (P. dactylifera L.) and the canary palm (P. canariensis hort. ex Chabaud), because of fruit production [2,3], historic heritage conservation [4,5], and ornamental use [6,7]. Because of their exploitation since ancient times for trade commerce, nutrition, health, landscape, construction, and others, date palms and canary palms represent high-valued assets in the socio-economic development of these regions [2,8,9,10]. According to FAOSTAT [11], in 2017, the top nine producers of dates exported 1.16 million tons with a value of 1.24 billion dollars. In Spain, this study’s area of interest, date palms, and canary palms are central resources for the local communities in the southeast of the country and the Canary Islands [12,13]. Thus, the protection and preservation of Phoenix palms are critical to ensure the well-being of the societies that benefit from their derived products and services.
An individual palm tree inventory is vital for monitoring palm diversity and palm health. Nevertheless, despite Phoenix palms’ importance, information on the number of palm trees and palm distribution is scarce, outdated, and conflicting. For instance, figures on the number of date palm trees in plantations are based on estimations rather than geospatial databases; in the mid-’90s, estimations reported over 100 million palm trees [14] and, in 2012, estimations reported over 120 million palm trees [15]. These estimations are based on the date palm production. However, they exclude palm trees present in non-agricultural scenes, like those intended for domestic use and landscape enhancement or those in natural palm populations. Detailed figures on the number of canary palms are only available in specific locations of high public interest. Besides, general information on the number and location of Phoenix palms in natural habitats, public parks, and private gardens, is not available as palm tree management is nonexistent or differs from a commercial purpose. Such a situation limits the early response to one of the most lethal and world-wide spread pests for Phoenix palms [16,17], the red palm weevil (RPW). The European Commission [18] has identified RPW as a major threat for palm trees, causing a significant economic loss for the affected canary palms in the Mediterranean Basin [19] and date palms in the Gulf region [16]. Because early external symptoms of the RPW infestation are hardly visible [20,21], the capacity to apply timely treatment—vital to guarantee a non-deadly ending—is hampered. In that sense, and especially in non-agricultural areas [22], Phoenix palms inventory is essential to allow close observation, treatment, and risk assessment against this pest.
Conducting tree inventory employing field-based measurements is a resource-intensive and time-demanding process [23], which is quasi impossible at the individual tree level for species that are scattered over large areas. The use of remote sensing (RS) has expanded the scale and has reduced the cost of tree inventory by using laser scanning, satellite, and aerial images [24,25,26]. Computer vision techniques applied to RS imagery, especially deep learning architectures that are based on convolutional neural networks (CNN’s), have proven to be suitable for the detection of trees in forest [27], urban [28], and agricultural [29] scenes. The reason is that CNN’s achieve remarkable performance in object detection tasks, as they are complex enough to extract intrinsic, high-level features to learn to identify and spatially label objects [30,31]. While, at the same time, they do not require more than a set of images and their corresponding annotations as input to train a model in an end-to-end learning approach [31]. At the moment, RS-based research to conduct single palm tree inventory has been mainly applied to oil palm (Elaeis guineensis Jacq.) cultivations, reaching high-performance metrics with detection accuracies above 90% [32,33,34,35,36,37,38]. Nevertheless, oil palm trees in plantations are regularly planted, and they have a homogenous appearance in terms of color, shape, and size. Even though some authors refer to the challenge of detection because of overlapping palm crowns, having a uniform scene lowers the diversity and complexity of geospatial object appearance. Therefore, single palm tree inventory in different scenes—urban, rural, and natural—remains an exciting challenge, and further research with state-of-the-art deep learning architectures is key. Additionally, previous research on single palm tree mapping has mostly utilized high-resolution satellite imagery [32,33,34,36,37,38,39,40], which allows the use of spectral features and arithmetic features for palm detection beyond the red, green, and blue (RGB) bands. Other research has used very-high-spatial resolution imagery acquired by aircraft (e.g., unmanned aerial vehicle (UAV)) [41,42], which allows for a detailed description of palm crowns. However, the acquisition of the images using a small UAV supposes a limitation when the intended individual tree inventory must be conducted at the regional scale—covering hundreds to thousands of square kilometers. The reason is that battery capacity and flight time are inherently limited [43], making mission planning impossible to such a scale. Moreover, RS-based research to conduct palm tree detection at a large scale has been applied to map extended areas of planted palms—industrial oil palm plantations for land cover classification [44,45,46,47,48]—rather than mapping individual palm trees because of the use of a medium to low spatial resolution imagery (30 to 250 m). One reason to use this imagery is that it is cost-free, but it prevents methods from detecting single trees as the resolution is too coarse. Consequently, the individual detection of palm trees across different scenes, relying solely on RGB images, at a regional-scale is addressed in this work.
Based on in situ observations and high-resolution aerial RGB images, Phoenix palm trees in the Spanish regions of Alicante and the Canary Islands occur in natural, semi-natural, and cultivated stands, sparsely and unevenly distributed in small and large groves, and with irregular crown size and height. In this paper, we propose a detection model to locate and classify them individually, based on a state-of-the-art deep learning detection architecture, RetinaNet [49]. First, palm tree detection models are pre-trained, while using a combination of unsupervised and supervised labeled datasets from the Canary Islands. Second, these models are transferred for re-training with a supervised labeled dataset from Alicante. Additionally, third, the best performing model is used to conduct the individual inventory of palms. The study contribution refers to presenting the application of a well-established object detection architecture in Computer Vision into an Earth Observation (EO) problem, such as tree inventory, to demonstrate to the EO community how image processing techniques that are based on deep learning leverage image understanding from RS data.
2. Study Area
The study focused on the Spanish regions of the Canary Islands and Alicante, recognized because of the presence of Phoenix palms. Figure 1 depicts the location and extension of the study sites. Canary palms are characterized by thick trunks, deep green leaves in frondy crowns, and small fruits [7,10,50]. In comparison, date palms have relatively longer thin trunks, produce offshoots, have leaves colored glaucous in a not as dense canopy, and possess larger fruits and seeds [10,50,51]. Obón et al. [10] executed a detailed description of the situation on Phoenix palms in Europe, when considering both natural and semi-natural palm trees over different habitats. By surveying 103 sites—69 in the Canary Islands autonomous community and 10 in the Alicante province, they highlighted the genetic and origin diversity of Phoenix palms, which represents the full range of phenotype and site variation for these palms.
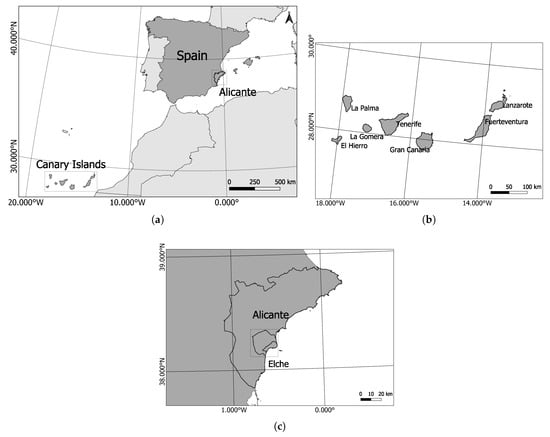
Figure 1.
Overview of the study sites: (a) Alicante province and the Canary Islands location within the Spanish territory, (b) the seven islands from the Canary Islands autonomous community, and (c) the Alicante province and Elche municipality.
2.1. Canary Islands
The Canary Islands autonomous community 28° N, 16° W) is located in the Atlantic Ocean in the south of Spain (Figure 1b). The site contains seven islands that extend over an area of 7493 km2. In the Canary Islands, where the canary palm is an endemic species, a Phoenix palm tree map that was published in 2017 accounted 542,680 Phoenix palms among canary, date, and hybrids [52]. We used the map to help generate a large labeled dataset from three islands, La Gomera (28°06′N, 17°08′W), La Palma (28°40′N, 17°52′W), and El Hierro (27°45′N, 18°00′W). Besides palms in natural habitats and palms in cultivated populations, palms have been found in abandoned farming areas, accompanied by shrubby vegetation [10], which, as later explained, could affect their detection. Hybrids between canary and date—introduced to the islands—are common [10,53].
2.2. Alicante
The Alicante province (38°30′N, 0°30′W) is located in the Valencian autonomous community at the southeast of Spain; encompassing an area of 5816 km2. Here, date palms are cultivated in plantations, while canary palms are grown in nurseries. Semi-natural date palm trees occur as scattered individuals, palm clumps, and palm clusters among abandoned orchards in valleys and ravines [10]. Ornamental date and canary palms are found in public spaces and private gardens. To conduct the region-wide spatial inventory of date palm and canary palm trees over the entire province, the imagery over the municipality of Elche was selected in order to generate a small labeled dataset representing the situation of Phoenix palms in Alicante.
Elche municipality (38°16′1″N, 0°41′54″W, 86 m above sea level) is located in the Alicante province as part of the Valencian autonomous community at the southeast of Spain (Figure 1c). It extends over an area of 326 km2. In Elche, an iconic place for Phoenix palms, a palm census in 1998 accounted 181,138 date palms [54]. In both urban and rural areas in the municipality, date and canary palms can be found in different scenes with diverse features and non-uniform planting patterns. Figure 2 depicts the different scenes that were identified from a top view and the diverse degrees of complexity for individual palm tree inventory.
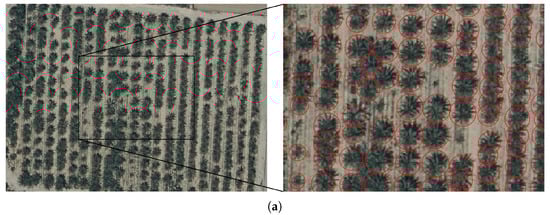
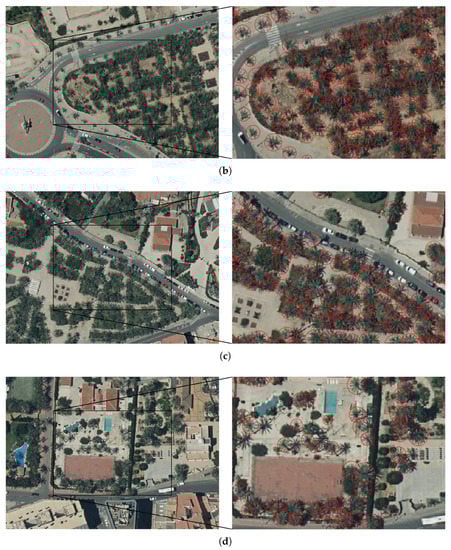
Figure 2.
Top-view images containing Phoenix palms in Elche: (a) date palm plantation, (b) date palm orchard in urban area, (c) public park, and (d) private gardens. A close-up in every scene with manual palm tree annotations—presented as red circles—has been included to portray the detection difficulty. Images derived from Ortofoto RGB 2018 CC BY 4.0 © Institut Cartogràfic Valencià, Generalitat; OrtoPNOA 2018 CC BY 4.0 www.scne.es.
3. Data and Methodology
3.1. Remote Sensing Imagery and Palm Map
The remotely sensed data products that were used over the study areas were obtained from the national and the local governments’ services for spatial data infrastructure, namely: Centro Nacional de Información Geográfica (CNIG: http://www.ign.es/, http://centrodedescargas.cnig.es/), Cartográfica de Canarias S.A. (GRAFCAN: https://www.idecanarias.es/, https://opendata.sitcan.es/), and Institut Cartogràfic Valencià (ICV: http://www.icv.gva.es/, http://www.idev.gva.es/). For the Canary Islands, RGB orthophoto imagery with a spatial resolution of 20 cm was used (resource ID: spagrafcan_226ORTO20cm2018_20190101; Ortofoto RGB 2018 CC BY 4.0 Cartográfica de Canarias S.A, Gobierno de Canarias; OrtoPNOA 2018 CC BY 4.0 www.scne.es). The imagery was acquired between July and September 2018 and published in January 2019. For Alicante—including Elche, we used RGB orthophoto imagery with a spatial resolution of 25 cm (resource ID: OFCV2018RGB_DATO; Ortofoto RGB 2018 CC BY 4.0 © Institut Cartogràfic Valencià, Generalitat; OrtoPNOA 2018 CC BY 4.0 www.scne.es). The imagery was acquired in June and July 2018 and published in December 2018.
Besides, for the Canary Islands, a map containing the position of Phoenix palms was used. The map was released in 2017 by the Biodiversity Service of the local government and financed by the European Regional Development Fund (ERDF) [52]. It was developed between 2015 and 2017, and it contains points showing the position of each Phoenix palm. The aim was to geolocate, categorize the scene, and classify the species of Phoenix palms at the individual level. In that sense, authorities reported that palms are grown 22.71% in natural environments, 21.11% in agricultural-rural environments, 9.69% in domestic-rural environments, 7.02% in interurban roads, 22.46% in public and open urban gardens, 15.79% in private and domestic urban gardens, 1.12% are in different areas, and the remaining 0.10% could not be assigned to one of the above categories [52]. Moreover, authorities reported the species distribution as 97.65% of canary palms, 0.39% of date palms, while the remaining are supposed to be hybrid palms [52].
3.2. Experiments and Experimental Set-Up
We propose to implement a state-of-the-art deep learning detection method, RetinaNet [49], in order to create a deep model able to detect Phoenix palms—date and canary palms—from aerial RGB imagery over the study areas because of three reasons. The first one is that by being RetinaNet a single-stage object detector—combines classification and location learning in one network, this allows a shorter time for inference, compared to double-stage object detectors as Faster-RCNN [55,56]. That is a crucial advantage when intending to predict objects over extended areas as in tree inventories. The second one is that RetinaNet has stood out for the improved detection of small and medium objects [55], which is valuable for detecting small-sized tree crowns in aerial images (below 25 × 25 pixels). Not to mention that the presence of a Feature Pyramid Network (FPN) [57] allows the detector to recognize objects at vastly different levels [58] that guarantee the detection of tree crowns, despite their variable size. In the particular case of Phoenix palms, the datasets contain crowns with a minimum size of 9 × 9 pixels and a maximum of 67 × 67 pixels. Additionally, the third one is that RetinaNet includes a focal loss function that forces the learning principally over hard examples [49,59], significantly improving the detection accuracy [58]. These examples are considered to be challenging detections because they score medium-confidence predictions, so the model struggles in either admitting or rejecting them as the target object. For Phoenix palms, this is key, because hard examples could be expected and decisive in training as palm crowns present in variable appearances and multiple scenes. Appendix A briefly explains how RetinaNet works.
Given that deep learning algorithms require enormous amounts of training samples and that, in the RS domain, there is limited availability of large, labeled image datasets [60,61], two well-known strategies to overcome the resulting issues from the absence of training data were employed. Transfer learning was used to retain the deep visual object extraction learned by initial models, which were trained over a large and similar dataset, and exploited using them as a starting point in the training of new models. On the other hand, data augmentation operations were applied in order to enlarge the size of the datasets. Such operations implied slightly changing the existing image patches by rotating, scaling, flipping, and changing the contrast, brightness, saturation, among other actions. The goal of adding these modified image patches is to introduce an appearance variability that strengthens the model’s descriptive and generalization capacities.
For the creation of the labeled dataset, both the imagery from the Canary Islands and Alicante and the Phoenix palm map of the Canary Islands were used, as depicted in Figure 3. Unsupervised labeled data refers to automatically generated annotations, whereas supervised labeled data refers to manual annotations that are created by visual inspection. The idea of using unsupervised and supervised labeled datasets was inspired by the work of Weinstein et al. [27]. They used a semi-supervised approach to first create noisy data for the initial training using unsupervised methods and re-trained the resulting tree-crown detection model with high quality labeled data. From the point-annotated Phoenix palm map of the Canary Islands, unsupervised and supervised labeled datasets were obtained (available in the Supplementary Material). With these annotations, low-quality, and high-quality, respectively, the deep learning model had the chance to learn the initial palm tree features. The experiments explained below allowed for us to assess the advantages and disadvantages of using and combining these two classes of datasets in transfer learning. Appendix B presents details on the datasets creation and characteristics.
Figure 3.
Flowchart of the creation of unsupervised and supervised labeled datasets from the Canary Islands and Alicante.
We propose three approaches for which the resulting models are compared against a base model regarding their detection performance of Phoenix palms (Figure 4). In each step of the training, a new dataset is fed to the model, so the three of them are kept separated. As the base approach, A0, we trained a detection model with only the small-size, hand-labeled Alicante dataset, using ResNet-50 as the pre-trained network (Figure 4a). In A1, we trained an initial detection model with the medium-size, hand-labeled, Canary Islands dataset, and then re-trained it by refining with the hand-labeled Alicante dataset (Figure 4b). In A2, we trained an initial detection model with the large-size, noisy-labeled Canary Islands dataset and then re-trained it by refining with the hand-labeled Alicante dataset (Figure 4c). In A3, we used the noisy-labeled Canary Islands dataset in order to train a model and later re-trained it with a medium-size, hand-labeled Canary Islands dataset. After that, we re-trained it by refining with the hand-labeled Alicante dataset (Figure 4d). Resnet-50 was used to initialize the training of the three approaches with transfer learning. Posterior to selecting the best approach and considering that, to this point in the learning process, only images containing palms were fed into the deep learning algorithm, a final step of refining was executed. The resulting model was re-trained in order to combine the positive examples of the small-size Alicante dataset with negative examples (Figure 4e).
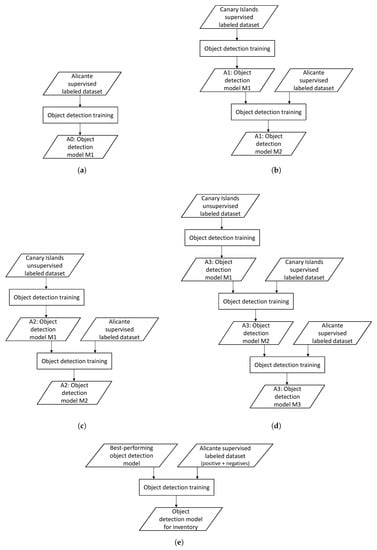
Figure 4.
Flowchart of proposed training approaches, A1, A2, and A3, while using unsupervised and supervised labeled data, and the base training approach A0. Plus, the final step of the learning process. (a) Approach A0, (b) Approach A1, (c) Approach A2, (d) Approach A3, and (e) final training of the best-performing model.
As presented later in the results section, such refining is necessary to better manage the palm detection in scenes, where Phoenix palms are not the predominant vegetation or are not present—no-palm scenes. Thus, the goal of comparing the approaches was defining the best way to exploit the Phoenix palm dataset of the Canary Islands for the Phoenix palm detection in Alicante—i.e., how to find as many palms as possible by transferring the learning on a similar dataset. In contrast, the goal of the final refining was to reduce the rate of false positives in the local context of Alicante. The testing dataset (Table A1) included images from Elche and other locations of Alicante, in order to preliminary assess the generalization capacity of the model. This dataset integrates palm scenes with no-palm scenes.
A Keras implementation of RetinaNet was used to carry out the trainings. It has as a backend Tensorflow and it was executed on a 64-bit Ubuntu 16.04 computer with 8 GB of video memory from a GeForce GTX 1080 graphics processing unit (Nvidia Corp., Santa Clara, CA, USA). The implementation is available at [62]. In the learning process, the image patches were presented through the network in batches of size 4. The experimental results showed that this was the maximum batch size manageable by the graphics processing unit before producing an out of memory (OOM) event. Batch size is a parameter that affects both the model performance and training time; hence, its adjustment is important. Nevertheless, the previous events prevented us from exploring its effects in conjunction with other adjustable parameters. We also defined the number of steps, depending on the dataset size, which allowed for us to have periodic checkpoints that provide performance metrics data on the progress of learning. Moreover, we applied the anchor box optimization reported by [63]; this allows for modification of the minimum size of a candidate location, which in RetinaNat is set to be 32 × 32 pixels [49]. Hence, for every dataset, we set optimized rates and scales to the annotations.
3.3. Evaluation
We calculated different metrics based on the precision, the recall, and the intersection over union, which quantifies the capability for classification and localization, in order to evaluate the performance of the evolving deep learning method [64]. Table 1 summarizes the evaluation metrics used over the datasets, Average Precision (), and Dice similarity coefficient (). The estimates the area under the Precision (P)-Recall (R) curve and it is defined as the mean precision at a set of eleven equally spaced recall levels (from 0 to 1 with a step size of 0.1) by the Pascal VOC Challenge [64]. In our case, since we only have palms as object class, the corresponds to the mean average precision (), which is the computation of over all classes of target objects. The is intended to balance the relevance of Precision and Recall equally; that is why it is defined as the harmonic mean of both metrics.

Table 1.
Performance metrics for evaluation. TP are correct palm detections, FP are wrong palm detections, and FN are missed palm detections.
For all approaches, the datasets were randomly split into training and validation with an 80–20% proportion. The validation datasets allowed for the assessment of the detection performance under the selected metrics. Because of the limited size of the Alicante training dataset, five-fold cross-validation was applied in order to reduce the bias in the randomly splitting operation. Appendix B presents details on the datasets splitting.
4. Results
4.1. Training Performance
The detection results from the validation datasets were evaluated to select the best evolving model for the further Phoenix palms inventory of Alicante. From the three training approaches applied with transfer learning, the resulting model from A1 (Figure 4) achieved the best detection performance, followed by A3 and A2, as presented in Table 2. Because A1 and A3 share the use of manually annotated data previous to the final training, this demonstrates that, in our case, the medium, supervised labeled dataset promotes improvement in the process of learning palm crown features rather than the extensive, unsupervised labeled dataset. The performance metrics of the model from the base approach, A0, were included in the table to be compared with the ones from the transfer learning approaches. As expected, this model has a lower performance, which may indicate that, for RS applications, it is beneficial, when possible, to adapt the pre-trained networks on natural images to RS images rather than directly using pre-trained networks on natural images. With the defined approaches, we intended to provide a pre-trained model that was customized to Phoenix palm crowns detection on aerial images. It is noted that A0 required fewer resources, like training time and memory usage. In the evaluation, all of the metrics were calculated using a predicted probability score threshold of 0.2 and an intersection over union (IoU) of 0.4. This slightly lower than usual threshold considers the fact that the manual annotations for smaller objects than approximately 25 × 25 pixels often contain a human error of up to 5 pixels on average [65].
Table 2.
Evaluation results for the proposed training approaches. Values correspond to the average performance achieved in the five-fold cross-validation datasets of Alicante. The bold represents top values.
The precision-recall curves for the resulting models are plotted in Figure 5. As noted, A1 has the best performance by placing its curve with the highest values. At a threshold of 0.2, all approaches reach the best balance point, which we defined as the minimum difference between the recall and precision reached by each. The curves of the different approaches let us observe that, for equal scores of recall, A1 provides higher scores of precision. In other words, at a probability score threshold of 0.2, when the model predicts a palm, it is correct 78.10% of the time, whereas it correctly identifies 67.66% of all palms. Thus, we can state that adapting the pre-trained network with the supervised labeled data of the Canary Islands supports a conservative higher detection rate of Phoenix palms in the Alicante dataset.
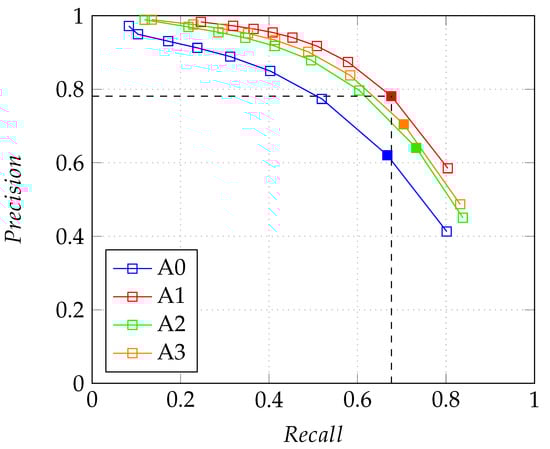
Figure 5.
Precision-recall curves for selecting the best probability score threshold that guarantees a well-balanced trade-off between both metrics. Each point on the curves is averaged from the models’ output at a particular threshold over the five cross-validation iterations. The threshold is spaced from 0.1 to 0.9, with a step size of 0.1. The and the presented in Table 2 were calculated using the selected points. For A1, dashed lines at a probability score threshold of 0.2 are plotted to denote the highest performance with a precision of 78.10% and a recall of 67.66%.
Figure 6 shows examples of the Phoenix palm detection results that were produced by the four approaches. It illustrates the varying capability of the approaches to learn to detect palm crowns, despite their changeable appearance in terms of size, color, age, and shape, and present in multiple scenes. As expected, A1 has superior performance, followed by A3 and A2. A0 has the lowest capacity to detect Phoenix palms. The experimental conclusions that can be drawn from observation are that, in the first place, most of the undetected palms are associated with relative unusual features, which are not well represented in the training dataset by being uncommon individuals. In the second place, the detection is challenging when palms are overlapping, as the model has to define where a palm crown starts and where it ends in a cluttered foreground. Moreover, overlapping palms with different heights can also lead to missing palms due to occlusion. Additionally, in third place, is that the detection faces the challenge of locating Phoenix palms despite their diverse colors. In general, date palms are on the grey-green shade and canary palms on the dark-green shade. However, palms can also have darker colored leaves, which can be the reason why palm shadows are mistakenly detected as palms.
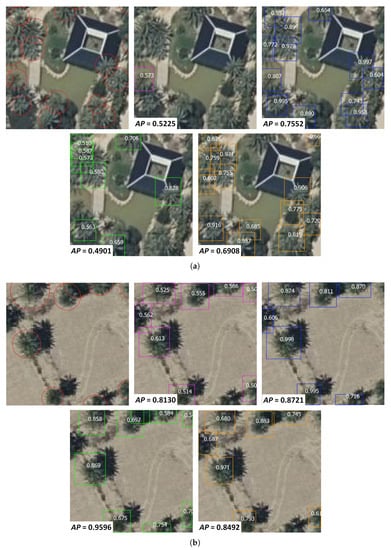
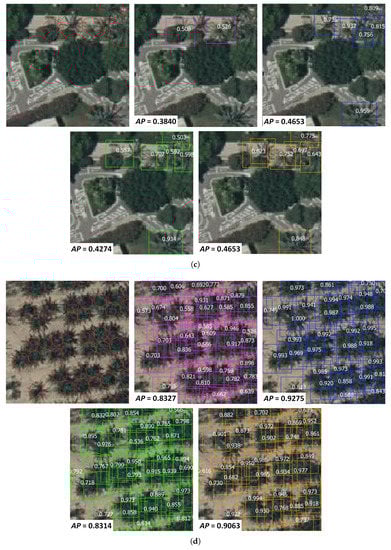
Figure 6.
Some examples of the Phoenix palm predictions generated by the resulting models on the imagery of the Alicante validation dataset. (a) Park, (b) Orchard, (c) Park, and (d) Nursery. Manual annotations are presented as circles; detections of A0 are magenta boxes; detections of A1 are blue boxes; detections of A2 are green boxes, and detections of A3 are orange boxes. The average precision () achieved by each model is presented in the corner of each image. The numbers inside the predictions correspond to the probability score of the object being a palm. Only predictions with a score above 0.5 are shown for readability and trust reasons. Images derived from Ortofoto RGB 2018 CC BY 4.0 © Institut Cartogràfic Valencià, Generalitat; OrtoPNOA 2018 CC BY 4.0 www.scne.es.
Table 3 presents the evaluation results of the intermediate and final models in order to observe the learning achieved in each step of the three approaches with transfer learning. The evaluation was carried out over the five-fold cross-validation datasets of Alicante; thus, the values correspond to the average. It is observed that precision and recall are in constant trade-off. For instance, in A3 from model M2 to model M3, recall is increased 0.45 while precision is decreased 0.20. This situation means, for all approaches, that strengthening the generalization capacity to recognize as many Phoenix palms as possible—minimizing the false negatives, also involved incorrectly detecting other objects as Phoenix palms—increasing the false positives. Overall, the training with the supervised labeled dataset contributed to a higher precision performance of the intermediate models A1-M1 and A3-M2. On the contrary, the unsupervised labeled dataset poorly contributed to the performance of the intermediate models A2-M1 and A3-M1. Hence, in our case, the use of a medium-sized, high-quality labeled dataset gave better detection results than transferring the features that were learned from a large-sized, low-quality dataset.
Table 3.
Evaluation results of the evolving models in the training approaches, using as validation datasets the five-fold cross-validation datasets of Alicante. The bold represents top values.
4.2. Inventory Performance
On the first attempt of inventory with the best-performing model, A1, a high rate of false positives was observed when the area under inference did not have Phoenix palms as predominant vegetation. This meant that other trees were often classified as Phoenix palms. For instance, olive tree farms were characterized by false detections of palms, as depicted in Figure 7a. The same situation happened with shrubs (Figure 7b), which can be problematic for the palms inventory, because shrublands are a typical ecosystem in the Spanish Mediterranean landscape [66]. As the inclusion of negative examples helped to reduce the number of false positives by not forcing the model to learn to see a palm in every image patch, A1-M2 was trained with 70% of positives examples—i.e., the same previous annotated Phoenix palms—and 30% negative examples. The latter referred to images containing other vegetation, bare soil, roads, buildings, water, and others. The resulting model demonstrated a reduced false positive rate, as depicted in Figure 7c.
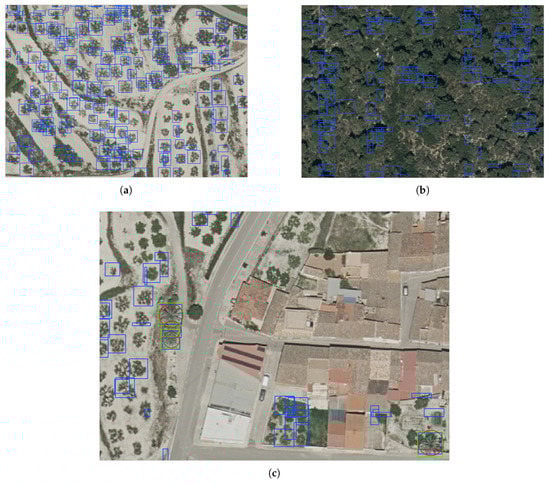
Figure 7.
Some examples of the Phoenix palm predictions generated by the resulting models on the imagery of the testing dataset. When the training only included positive examples, the resulting model generated a high rate of false positives. By including negative examples, the resulting model generated a lower rate of false positives. Blue boxes correspond to detections by the former and green boxes to detections by the latter. Manual annotations are presented as circles. (a) Detection of olive trees as Phoenix palms, (b) detection of shrubs as Phoenix palms, and (c) the detection of Phoenix palms and other vegetation as Phoenix palms. Images derived from Ortofoto RGB 2018 CC BY 4.0 © Institut Cartogràfic Valencià, Generalitat; OrtoPNOA 2018 CC BY 4.0 www.scne.es.
In order to further evaluate both models, one trained with only positive examples A1P and one trained with positive and negative examples A1P+N, the accuracy of their detection capacity was quantitively assessed on an independent testing dataset. Table 4 presents the performance metrics. The dataset included six images that contain single scenes and multiple scenes from Elche and other locations of the Alicante province. In particular, both of the models performed similarly in the first three images where single scenes of Phoenix palms are presented, while, in the last three images, containing multiple scenes, the resulting model from A1P+N reached better performance. These images have mostly scenes where Phoenix palms are not predominant. As these no-palm scenes are typical in the urban, rural, and natural landscape in Elche and the rest of the Alicante province, the reported performance is a reference on the accuracy of the inventory. Because of the overall higher performance of the resulting model from A1P+N, this one was finally used to conduct the individual mapping of Phoenix palms in Alicante.
Table 4.
Evaluation results of the resulting models for different scenes in Elche and other places in Alicante, using as a testing dataset six images that were independent of the models’ training. The bold represents top values.
Figure 8 presents parts of the images from the independent testing dataset. From the first three single-scene images, Figure 8a–c, Phoenix palms are the main predominant vegetation. On the contrary, in the three multiple-scene images, palms do not rule the landscape. Given that the model has to detect palms across these different palm scenes and no-palm scenes, for the further improvement of the detection results, a more diverse dataset for training should be collected. It should contain negative examples and other positive examples—natural and semi-natural scenes of Phoenix palm populations. Usually, in these scenes, palms are individually distant—scattered—or in groups—clumps and clusters. In our case, the training dataset is restrained to images of urban and rural scenes that are dominated by planted Phoenix palms. Nevertheless, in the independent testing dataset, some natural and semi-natural scenes were included in order to observe the generalization capacity of the detection model. The detection results demonstrated that the model is able to classify and locate Phoenix palms in these unseen scenes.
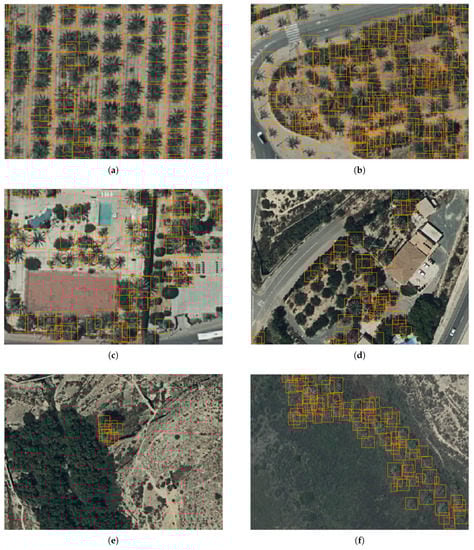
Figure 8.
Some examples of the Phoenix palm predictions generated by the resulting model of A1P+N on the imagery of the testing dataset. (a) Plantation; (b) Orchard; (c) Garden; (d) Multiple 1 “Barranco de Sant Antoni” (38°18′3″N, 0°40′18.10″W, 130–137 m above sea level), it is described to be the habitat of scattered individuals of “palmeras de rambla” (Phoenix iberica) and date palms [10]; (e) Multiple 2 “Vinalopó river” above Elche (38°18’6”N, 0°43’14″W, 90–215 m above sea level), it also contains “palmerales de rambla” and date palms but as scattered individuals and in clumps; and, (f) Multiple 3 “Camino de la Senyeta” (38°16′N, 0°31′54″W, 4–5 m above sea level), with again “palmerales de rambla” and date palms grouped in a palm grove originated from an abandoned palm nursery [10]. The detections are presented as orange boxes. Images derived from Ortofoto RGB 2018 CC BY 4.0 © Institut Cartogràfic Valencià, Generalitat; OrtoPNOA 2018 CC BY 4.0 www.scne.es.
4.3. Inventory
The complete map of Phoenix palms derived from applying inference with the resulting model from A1P+N is presented in https://palmwatchvito.users.earthengine.app/view/palm-inventory-alicante. The palms’ locations are formatted with EPSG:3042 as the projected coordinate system. Each detection box has among its attributes the score, which corresponds with the probability score of the object being a palm, and the geolocation referenced in four points wxmin, wymin, wxmax, and wymax. The users of the map are advised to consider it as a baseline inventory of Phoenix palms to study its distribution at the individual level in Alicante. The number of accounted palms is 511,095 with a probability score above 0.50, from a total of 1,505,605 detected palms. This last value should be used carefully, because the inference process has classified as Phoenix palms other palms or other vegetation—commission errors. Additionally, this value does not compromise all Phoenix palms, since the inference process has missed palms—omission errors.
5. Discussion
Individual tree inventory from high-resolution remote sensing images that are based on deep learning can provide a fast and accurate way to monitor the presence and distribution of different woody species at a wide spatial scale. Nowadays, the unprecedented quantity and quality of remote sensing images are an opportunity to adapt object detection methods from the Computer Vision domain. Nevertheless, as the availability of large, labeled datasets is a persisting issue in the remote sensing domain, research on strategies [27,33] to overcome this is essential. At the same time, efforts [58,67] to create such datasets are also crucial. Intending to build a region-wide Phoenix palm tree inventory and explore the performance of transfer learning when having a limited dataset, a Phoenix palm detection model is presented. The model, based on a deep learning method, can locate and classify individual palm trees in aerial images on the Spanish province of Alicante. The detection performance of three training approaches with different schemes of transfer learning was tested; transfer learning was implemented in order to overcome the lack of a large labeled dataset of Phoenix palms. The experimental results demonstrated that transferring the features learned from a medium, high-quality labeled dataset gave better detection results than transferring the features learned from a large, low-quality dataset. The resulting inventory after applying the detection model over the imagery of Alicante provides a baseline for the long-term monitoring of Phoenix palms for pest management and biodiversity protection.
5.1. Transfer Learning Impact and Detection Limitations
Training with transfer learning from the Phoenix palms of the Canary Islands to the Phoenix palms of Alicante, allowed for obtaining detection models with superior performances than training only with Phoenix palms of Alicante. In other words, experimental results showed that training with a backbone network re-trained with RS images of a similar task gave better results than training with solely a backbone network pre-trained with natural images. By following approaches that had intermediate training steps based on the Phoenix palms of Canary Islands, the Phoenix palm detection model for Alicante was better adapted to the appearance of palms from a top-view. As well explained by Hoeser and Kuenzer [59], the RS images are captured with a bird-view perspective to the objects, but in natural images, the objects appear from a side looking perspective. Thereby, object detection in RS images is more challenging, especially since most algorithms and datasets from the Computer Vision domain are based on natural images. The strategy to transfer a detector re-trained with such images—that was initially trained with natural images, as the one used here, becomes a common practice. On the other hand, more algorithms and datasets from RS are being developed and openly released. A good example is the work of Sumbul et al. [68], where they build a large labeled dataset for scene classification and demonstrate that models trained from scratch perform better than models pre-trained on natural images.
Furthermore, training with a backbone network re-trained with supervised labeled annotations benefited the Phoenix palm detection model for Alicante. The reason is that the supervised labeling that was made by visual inspection generated high-quality examples of Phoenix palms. These are considered to be high-quality as each annotation box is centered with the palm crown center and extends to the size of the palm crown. Equally, each annotation box corresponds to an identifiable palm from the imagery. Opposite to this, the experimental results proved that the use of unsupervised labeled data conducted to great confusion to the intermediate models. These models struggled to distinguish between the target object class—that is, Phoenix palm—and the background class, even though the unsupervised annotations outnumbered the supervised annotations (Table A1). Additionally, this ultimately resulted in lower performing detection models. Unsupervised annotations are problematic because the map used for its generation is not accurate, and palms were assumed to have a unique size. First, the points geolocating palm trees in the Phoenix palm map were not all crown-centered or not even contained within the palm crown, annotations could partially include one palm crown rather than fully containing it. Second, the points could indicate palms that are no longer there or that are not identifiable in the images. Additionally, third, annotation boxes had a unique size; consequently, annotations did not accurately fit the palm crowns despite their variable size. That meant for training, low-quality positive examples of palms that negatively impacted the detection performance as reflected by the large number of false positives and false negatives—expressed by the precision and recall metrics. Plus, this impact from the unsupervised annotations from the Canary Islands dataset could not be corrected on the models’ refining process with the hand-labeled Alicante dataset.
From the quantitative and qualitative evaluation of the model, challenges for Phoenix palms inventory that persist are: detecting palms with a not-common Phoenix appearance, individually separating palms which are overlapping, distinguish a palm from its shadow—in the range of colors that Phoenix present, and perform equally well across all different scenes in the urban, rural, and natural landscapes. These current limitations led to false positives and false negatives. As a way to cope with false positives, height models that are derived from LiDAR data—also publicly available—can be used to filter out detections below a certain height threshold. Additionally, the use of Near Infrared (NIR) band, if available, can be considered to discard the palm shadows.
5.2. Palm Tree Detection: Beyond the Basics
Previous studies on individual palm tree detection [32,33,34,36,37] achieved precision and recall metrics above 90%, which is a performance superior to the results that are presented here. However, the Phoenix palm detection compromised a combination of conditions that were either not existent or not addressed in those works. First, Phoenix palms have a changeable appearance in terms of size, color, age, and shape, which requires the datasets to have representative amounts of annotations containing that diversity. Not to mention that the Phoenix palm detection compromised the detection of two different palm species, which supposes inherent changes in features—better described by Obón et al. [10] and Laguna [50]. In that logic, a more thoughtful selection of images for annotation could correct that under-representation of appearances. Second, Phoenix palms are present in multiple scenes, such as plantations, orchards, nurseries, groves, parks, and gardens, plus a wide range of natural and semi-natural habitats, which also compromises changes in the background and context that the model must handle. For example, this is an issue not present in object detection for agricultural scenes, as in [32,33,34,35,36,37,38,40], where a level of uniformity in the management of the crops provides homogeneous object appearances. Again, this difficulty should be addressed in having enough diversity of scenes in the datasets. Nonetheless, in the particular case of palm detection in date plantations from the testing dataset, the model had a comparable performance by achieving 84.7% of average precision. Third, when observing the learning process performance, during training, we noted that the regression loss—which describes how bad the model locates the detected objects—was not tending to zero as desired. On the contrary, the classification loss decreased over time, which meant that the model was successfully able to identify the palms, but it kept struggling when delimiting each palm crown in a box. The issue here is the changeable palm density in the scenes, which requires the model to learn from the appearance of isolated palms, overlapping palms, and overlapping-with-other-vegetation palms. Of course, this point is not only a difficulty for the model, but also the human eye. Doing the annotation of overlapping palms required more concentration, and it was only carried out by the most experienced people in our team. A strategy to overcome this, as the second stage of detection, could be the use of a local maxima filter over height models to detect tree tops and fusing with palm detection results over high-density areas. If a tree top falls within the area of a palm detection, such detection can be considered a true positive. However, if the palm detection is not linked to a tree top, it can be considered as a false positive. The abovementioned limitations explain, in significant part, why making a direct comparison between models’ performance would not be equitable.
Moreover, previous studies can inspire future research tracks in palm tree detection. For instance, [33,36,38,39,40] made use of different spectral bands to RGB, which allows the extraction of features that could differentiate the target object from the background even better. Freudenberg et al. [33] created an oil palm detection model over very high-resolution satellite images, which was later used as a pre-trained model to detect coconut palms (Cocos nucifera L.). Because the environmental context differed between the oil palm scene and coconut palm scene, they applied transfer learning strategies and re-trained the deep learning model for being applied in the latter, as we did. They used the RGB beside the Near Infrared (NIR) band. Plus, they added the Normalized Difference Vegetation Index (NDVI) as another input. About our work, the use of aerial high-resolution RGB imagery proved that their high spatial resolution compensated for their limited spectral resolution. Not to mention that the imagery is openly published, in contrast to the cost of commercial high-resolution satellite imagery as the one that was used in the abovementioned works. Still, the unprecedented availability of high-resolution remote imagery [69] and the proposal of innovative approaches for counting objects with a size below the ground sampling distance of images [70] are a motivation for future research in tree inventory based on deep learning architectures.
Concerning the detection methods, in [32,33,34,37,71], the authors deployed CNN’s architectures. In particular, Wagner et al. [71] and Freudenberg et al. [33] used an out-of-the-box architecture for semantic segmentation, called U-Net. This offers a per-pixel classification that depending on the training input, can either output polygons representing one palm or a cluster of palms. Thus, in the case of the last, a post-processing step of individualization is required when the inventory is intended at the single tree level. In [32,34,37], the authors followed a more simplified approach by implementing image classification architectures as LeNet and AlexNet, which give as output a binary classification; if the prediction is ’0’, the image does not contain a palm, and if the prediction is ’1’ the image does contain a palm. In this study, the out-of-the-box architecture for object detection directly outputs the localization and classification of individual objects, as demonstrated. Moreover, each predicted box has a probability score that, unlike the previous works’ output, indicates the confidence over the object being a palm. This not only shows an overall confidence of the inventory, but it also provides the opportunity to study those low and medium-scoring predictions to guide a future reselection of the training datasets.
In other studies, such as Tagle et al. [42] and Rizeei et al. [36], object-based image analysis (OBIA) was used to conduct the detection; Wang et al. [35] and AlShidi et al. [40] used hand-crafted operations in combination with machine learning techniques; and Dos Santos et al. [39] and Santoso et al. [38] applied morphology analyses. Al-Ruzouq et al. [41] conducted date palm mapping using OBIA over RGB aerial imagery. The selected technique intends to classify land cover classes instead of individual objects; thus, the detection results referred to areas containing date palms instead of an individual counting of date palm trees. Also, Tagle et al. [42] used the same technique, but they implemented a step to split the crown masks and obtain individual crowns. That allowed the single palm tree counting per species by using the canopy height model. However, the individual segmentation of palm crowns failed when the palms were too close and they had similar heights. Additionally, Dos Santos et al. [39] used a mathematical morphology technique to locate babassu palms in open agricultural environments. By utilizing a shadow extraction process and a shadow object analysis process, they were able to detect juvenile and adult palm trees in farmlands, with low-to-medium palm tree density. When detailing the reported methods and generated results, it is clear to us that RetinaNet provided a much fast and straightforward technique to individually map palms, despite their changeable appearance across multiple scenes over a large scale. Following that order, the available architectures in deep learning could already accelerate tree inventories when datasets and computational power are presented.
5.3. Phoenix Palm Tree Inventory for Future Research
The inventory presented here constitutes the first attempt to map Phoenix palms across different landscapes in Alicante. Therefore, we hope that the current and future released data are referenced products for researchers and practitioners that are interested in testing more state-of-the-art deep learning architectures for object detection in palm tree inventory, such as YOLOv4, Cascade R-CNN, and EfficientDet. Nevertheless, the implications of having such a map go beyond the technical insights of applying Computer Vision methods to RS data and aims to demonstrate the synergy between both domains for the public interest.
In Spain, the individual localization of Phoenix palms in agricultural scenes is possible with the combination of cadastral information, local municipality surveys, and farmers’ management data. Also, individual localization of Phoenix palms in public scenes is possible through the local entities in charge of safeguarding public spaces, who conduct georeferenced palm census. Nevertheless, Phoenix palms localization for health monitoring in non-agricultural or non-public scenes, as oasis and gardens, is challenging, because these places are on restricted or hard-to-access areas—private land or natural habitats [72]. These scenes are of particular interest because research on the dynamics of the major lethal pest of Phoenix palms, the red palm weevil (RPW), has proven that ornamental palms—especially canary palms—are favorable hosts for its spread in comparison with date palm plantations [72,73]. Moreover, the Phoenix palms localization across a diversity of scenes is important as the probability of RPW infestation can be influenced by the palm population and palm ownership. According to [74], in the Spanish city of Palma de Mallorca, the presence of infested date palms belonging to private owners favored the infestation of close-by, public canary palms at the start of the pest outbreak. Hence, a geospatial database of Phoenix palms supports actions that intend to prevent, inspect, and intervene against the pest.
Furthermore, Phoenix palms localization for vegetal biodiversity monitoring is vital to define conservation areas. The detection model also identifies a different type of Phoenix palms, the Phoenix iberica—not recognized as a distinct species yet. This could be relevant, since this palm is a native wild Phoenix that academics think should be protected as part of the Spanish biodiversity [10,75]. It is also considered that other Phoenix species and varieties could have been detected and mapped in the inventory. For instance, Figure 9 presents an individual of Phoenix canariensis var. porphyrococca Vasc. & Franco [76] that was geolocated at 39°27′34.18″N, 0°19′55.61″W [77], which was detected by the model. Besides, the combination of the present distribution of Phoenix palms with biological and cultural evidence is valuable for modelling the expansion and studying the diversity of the genus [78]. Therefore, the inventory can provide a bigger geographical picture of the Phoenix genus impact in the landscape of southern Spain to authorities and researchers. Furthermore, it could provide vital information for studies at the national and global scale of tree palm abundance as the one by Wagner et al. [71] and Muscarella et al. [79].
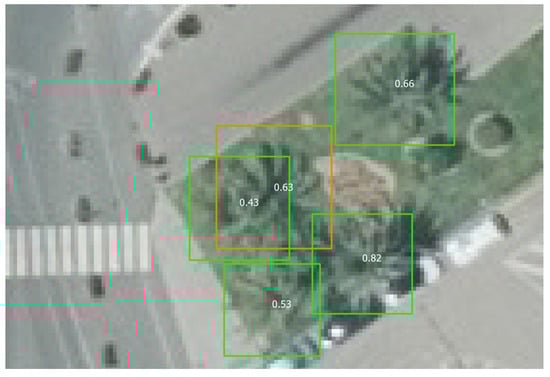
Figure 9.
Detection of an individual of Phoenix canariensis var. porphyrococca Vasc. & Franco. The detection box is presented in orange; surrounding Phoenix palms are in green boxes. The numbers inside the boxes correspond to the probability score of the object being a palm. The detection model is able to classify different species and varieties of Phoenix beyond the ones used in the training dataset. Image derived from Ortofoto RGB 2018 CC BY 4.0 © Institut Cartogràfic Valencià, Generalitat; OrtoPNOA 2018 CC BY 4.0 www.scne.es.
6. Conclusions
The geolocation and counting of Phoenix palms, with a fast and straightforward technique, can be crucial for the preservation of their endangered species. In the European Union, Phoenix palms—including P. theophrasti—occur in native, feral, and planted populations reaching thousands of individuals [10]. As the changeable scenes and appearances of Phoenix palms represent a challenge for deep learning object detection, not to mention that the use of remote sensing data is a challenge itself, here was presented a detection model for generating the first Phoenix palm tree inventory on a region-wide scale. The number of Phoenix palm trees in the Spanish province of Alicante, relying solely on RGB images, was estimated to be 511,095 with a probability score above 0.50, from a total of 1,505,605 detected palms.
When considering the limiting size of the training dataset over Alicante, three different approaches of training were presented to explore the use of transfer learning from a bigger dataset over the Canary Islands. The experimental results demonstrated that transferring the features learned from the medium, manually labeled dataset provided better performance than transferring the features learned from the large, automatically labeled dataset. The model obtained using the better-performing approach achieved a mean average precision () of 86%. Additionally, the experimental results demonstrated that even if the Canary Islands datasets are not entirely representative for the small region of Alicante covered in its training dataset, the detection models still benefit from getting used to remote sensing images instead of only using pre-trained networks on natural images. Similar effectiveness has already been proven in related works of deep learning applied to remote sensing image analysis [68], which persuade us to continue finding techniques that allow for the exploitation of different remote sensing data for object detection. Specifically, over the study areas, data that extends the size and diversity of the current datasets and data that enriches the palm feature learning, all this to train a robust and efficient Phoenix palm detection model. While further work is needed to improve the detection performance across multiple scenes, the work here demonstrates how image processing techniques that are based on deep learning leverage image understanding from remote sensing data.
Supplementary Materials
The following are available online at https://www.mdpi.com/2072-4292/12/21/3476/s1.
Author Contributions
Conceptualization, M.C., S.D. and K.V.T.; methodology, M.C., S.D. and K.V.T.; software, M.C.; validation, M.C., S.D. and K.V.T.; formal analysis, M.C.; investigation, M.C.; resources, S.D. and K.V.T.; writing—original draft preparation, M.C.; writing—review and editing, M.C., S.D. and K.V.T.; visualization, M.C.; supervision, S.D. and K.V.T.; project administration, S.D.; funding acquisition, S.D. All authors have read and agreed to the published version of the manuscript.
Funding
M.C. and S.D. received funding from the European Union’s Horizon 2020 research and innovation programme under the Marie Skłodowska-Curie Actions Grant Agreement No 721995. Field campaign and data processing were partially funded by BELSPO (Belgian Science Policy Office) in the frame of the STEREO III program—project PALMWATCH (SR/67/379).
Acknowledgments
The authors would like to thank Johan Mijnendonckx of VITO, Michel Ferry and Susi Gómez from the Phoenix Research Station (Spain), for helping in the data collection at the field campaign in support for the PALMWATCH project. Also, the authors would like to thank Bart Beusen and Olmo Nieto Silleras of VITO for their technical input in this work. Finally, the authors express their gratitude to the De Lift Education school and their labeling team for the annotation work done for this study.
Conflicts of Interest
The authors declare no conflict of interest.
Appendix A
RetinaNet (Figure A1) is a single-stage object detector because it combines classification and location learning in one network. This allows a shorter time for inference, compared to double-stage object detectors as Faster-RCNN [55,56]. At first, feature maps are extracted from the input image using a 50-layer residual artificial neural network (ResNet-50) [80]. Features are characteristics of an object that are used for recognition purposes. Considering that deep neural networks are demanding when training, regarding time and computer power, and depend highly on being trained with large datasets, pre-trained CNN’s as ResNet-50 are used as a starting point for new detection models. This pre-trained network enables the creation of detection models with relatively little annotated data. Further, as ResNet was thought as a learning framework to ease the training of substantially deeper networks—which are more challenging to train—, we obtain an optimized and efficient model with considerably increased depth to start the training process. The pre-trained ResNet-50 used for RetinaNet was trained with the Microsoft Common Objects in COntext, a large-scale dataset of natural scene images that consists of 328,000 images with annotation on 91 common object categories [81].

Figure A1.
RetinaNet network architecture: Feature Pyramid Network (FPN) backbone (b) is on top of a feedforward ResNet architecture (a), to this backbone is attached two subnetworks, one for classifying (c) and one for regression (d). Taken and modified from [49].
Figure A1.
RetinaNet network architecture: Feature Pyramid Network (FPN) backbone (b) is on top of a feedforward ResNet architecture (a), to this backbone is attached two subnetworks, one for classifying (c) and one for regression (d). Taken and modified from [49].

After the extraction, a Feature Pyramid Network (FPN) [57] is used on top of ResNet-50 to extract these feature maps across a broad range of scales, which allows the detector to recognize objects at vastly different levels. Next, object classification is conducted by predicting the probability of object presence in the input image. At this point and to train the classification capacity of the model, a focus function is applied to force it on learning principally over hard examples. These examples are considered challenging detections because they score medium-confidence predictions, so the model struggles in either admitting or rejecting them as the target object. This function is called focal loss, and it is the main contribution of RetinaNet regarding class imbalance [49]. The researchers that created RetinaNet concluded that a limiting factor for single-stage object detectors to surpass the accuracy of double-stage detectors, was that former detectors propose thousands to millions of candidate locations in an input image to contain the target objects. But the truth is that actually few of those locations contain target objects, which leads to inefficient training since most locations are easy to discard as target objects. Plus, this directs to overwhelming training considering that a large number of locations drive to wrong detections, which ultimately derive in degeneration of the detection models. As a final step, in parallel to the classification, RetinaNet regresses the offset between each predicted object to a nearby ground-truth object to learn from its right localization if existing.
Appendix B
In the past years, the Spanish government has collected an extensive database of RGB orthophotos with a spatial resolution of 25 cm and 20 cm at the national level. In particular, the imagery over the province of Alicante and the autonomous community of the Canary Islands provides an unprecedented opportunity to map Phoenix palms at the individual tree level on a large scale. Efforts from local authorities to produce an inventory on Phoenix palms constitute a source of primary information, but the information is still scarce or outdated. Moreover, the existence of the Phoenix palm tree map in the Canary Islands provides a unique opportunity to overcome one of the major limitations in object detection applied to RS data, which is the availability of large labeled datasets [27,30].
For the unsupervised palm crown labeling, we automatically annotated the palms pointed out in the Phoenix palm tree map at La Gomera. This island has a land extension of 369.76 km2 [82], and according to the map [52], it contains 116,330 Phoenix palms. We created a workflow that draws bounding boxes around the palm points with a size of 55 × 55 pixels. The size is based on the average size of palms with larger crowns in the supervised labeled dataset, intending to have annotations that completely contain the palm crown. Later in the workflow, the image and the annotations are cut into patches with an overlap to guarantee all palms are entirely contained in at least one image. Figure A2a presents an example from this dataset. Annotations are noisy since the given palm points in the map are not precisely geolocated at the crown centers; thus, the bounding boxes are not centered in the palm crowns. Not to mention that the varied size of palm crowns cannot be described with a unique size. Table A1 summarizes the dataset characteristics. For the learning process, only images containing palms are actually fed into the deep learning algorithm; this number is indicated as the number of image patches. Due to image overlapping, one palm annotation can be in multiple images; thus, annotations get multiplied as presented between the number of palm crowns annotated and the actual number of palm crown annotations. The multiplication is not a concern since data augmentation takes care of presenting each image patch with a different appearance to the learning algorithm.
For the supervised palm crown labeling, we manually annotated the palms in La Palma and El Hierro based on the Phoenix palm tree map over the RGB orthophotos. La Palma island has a land extension of 708.32 km2 [82], and according to the map [52], it contains 24,528 Phoenix palms. El Hierro island has a land extension of 268.71 km2 [82] and includes 2185 Phoenix palms. By visual inspection, 17,058 and 1474 palm crowns were annotated, respectively. Because the palm map was created between 2015–2016 and the orthophoto acquired in 2018, discrepancies exist between the registered palms and the visually recognizable palms. Many of the missing palms could have been removed, while others were either blacked out by topographic shadows or distorted by image artifacts. The minimum annotated box size was 13 × 13 pixels, and the maximum was 67 × 67 pixels. For the supervised palm crown labeling of Alicante, palms in Elche were annotated by visual inspection of the RGB orthophotos. Different plantations, orchards, nurseries, groves, and parks were selected for creating this dataset, which covers an area of 12.3 km2, following an in situ inspection. The selection was intended to capture the full range of variability and scene complexity in the urban and rural context. Here, the dominant palm tree species is the date palm, which is representative of the overall population of palms in the town. The minimum annotation box size was 9 × 9 pixels, and the maximum was 45 × 45 pixels. Figure A2b,c present examples and Table A1 summarize the characteristics of the datasets. For these datasets, a workflow cuts the images and annotations into patches with an overlap.
Furthermore, the size of the image patches was determined by experimental results on the detection accuracy over training samples. Using as a reference the work of Weinstein et al. [27], where RetinaNet was implemented to detect tree-crowns over RGB imagery with a spatial resolution of 10 cm and with image patches of 400 × 400 pixels, here tests with 256 × 256 pixels, 128 × 128 pixels, and 64 × 64 pixels were made (Figure A3). Results showed us that the second was the optimal size by providing higher detection metrics. Thus, the Canary Islands imagery was cropped into patches of 128 × 128 pixels with an overlap of 50 pixels. The Alicante imagery was cropped with the same size but with an overlap of 32 pixels. The difference in the overlap is because the Canary Islands imagery has a spatial resolution of 20 cm, while the Alicante imagery has a spatial resolution of 25 cm. Besides, observed Phoenix palms in the Canary Islands have more prominent crowns than the ones in Alicante.
Finally, for the region-wide spatial inventory of Phoenix palm trees in Alicante, RGB orthophotos were cut into overlapping patches. This dataset contains over 13 million image patches, mostly unseen, over which the model inference has to be run. Figure A2d presents a dataset example, and Table A1 summarizes the dataset characteristics. A non-maximum suppression technique is applied to retain predictions with the highest probability score to eliminate the overlapping predictions. Images from this dataset were annotated to provide a qualitative test of the model’s performance.
Table A1.
Datasets’ characteristics for learning.
Table A1.
Datasets’ characteristics for learning.
| Purpose | Study Site | Number of Image Patches | Number of Palm Crowns Annotated | Number of Palm Crown Annotations |
|---|---|---|---|---|
| Training | La Gomera, the Canary Islands autonomous community | 193,202 | 116,330 | 634,064 |
| Training | La Palma and El Hierro, the Canary Islands autonomous community | 42,335 | 18,532 | 75,388 |
| Training | Alicante, Valencian autonomous community | 762 | 5104 | 12,080 |
| Testing | Alicante, Valencian autonomous community | 50,828 | 7473 | 18,217 |
| Inventory | Alicante, Valencian autonomous community | 13,321,770 | - | - |

Figure A2.
Examples of training, testing, and inventory datasets: (a) the Canary Islands unsupervised, (b) the Canary Islands supervised, (c) Alicante supervised, and (d) Alicante for region-wide inventory. Automatic annotations are presented as squares and manual annotations as circles. Images derived from Ortofoto RGB 2018 CC BY 4.0 Cartográfica de Canarias S.A, Gobierno de Canarias; Ortofoto RGB 2018 CC BY 4.0 © Institut Cartogràfic Valencià, Generalitat; OrtoPNOA 2018 CC BY 4.0 www.scne.es.

Figure A3 presents the detection performance for different image patch sizes.

Figure A3.
Comparison of the mean average precision () achieved by different image patch sizes.
Figure A3.
Comparison of the mean average precision () achieved by different image patch sizes.

Table A2 presents the number of images and annotations assigned for training and validation.
Table A2.
Datasets’ characteristics for evaluation.
Table A2.
Datasets’ characteristics for evaluation.
| Study Site | Training and Validation Split (Image Patches) | Training and Validation Split (Annotations) |
|---|---|---|
| La Gomera, the Canary Islands autonomous community | 154,561-38,641 | 506,765-127,299 |
| La Palma and El Hierro, the Canary Islands autonomous community | 33,861-8474 | 60,136-15,252 |
| Alicante, Valencian autonomous community | 609-153 | 1st iteration: 9876-2204 2nd iteration: 9472-2608 3rd iteration: 9728-2352 4th iteration: 9595-2485 5th iteration: 9650-2430 |
References
- Food and Agriculture Organization of the United Nations (FAO). FAOSTAT. Countries by Commodity. Dates. 2017. Available online: http://www.fao.org/faostat/en/#rankings/countries_by_commodity_exports (accessed on 28 July 2019).
- Chao, C.T.; Krueger, R.R. The Date Palm (Phoenix dactylifera L.): Overview of Biology, Uses, and Cultivation. Hortsci. Horts 2007, 42, 1077–1082. [Google Scholar] [CrossRef]
- Ghnimi, S.; Umer, S.; Karim, A.; Kamal-Eldin, A. Date fruit (Phoenix dactylifera L.): An underutilized food seeking industrial valorization. NFS J. 2017, 6, 1–10. [Google Scholar] [CrossRef]
- Rivera, D.; Obón, C.; Alcaraz, F.; Laguna, E.; Johnson, D. Date-palm (Phoenix, Arecaceae) iconography in coins from the Mediterranean and West Asia (485 BC–1189 AD). J. Cult. Herit. 2019, 37, 199–214. [Google Scholar] [CrossRef]
- Chalak, L.; Baydoun, S.A.; Jaradat, A.A. Genetic resources of fruit trees in the Fertile Crescent: A hotspot heritage. Acta Hortic. 2020, 1267, 77–84. [Google Scholar] [CrossRef]
- Zaid, A.; de Wet, P. Botanical and systematic description of the date palm. In Date Palm Cultivation; Zaid, A., Ed.; Food and Agriculture Organization of the United Nations (FAO): Rome, Italy, 2002; Chapter I. [Google Scholar]
- Rivera, D.; Obón, C.; Alcaraz, F.; Egea, T.; Carreño, E.; Laguna, E.; Santos, A.; Wildpret, W. A review of the nomenclature and typification of the Canary Islands endemic palm, Phoenix canariensis (Arecaceae). Taxon 2013, 62, 1275–1282. [Google Scholar] [CrossRef]
- Johnson, D.V.; Al-Khayri, J.M.; Jain, S.M. Introduction: Date Production Status and Prospects in Asia and Europe. In Date Palm Genetic Resources and Utilization: Volume 2: Asia and Europe; Al-Khayri, J.M., Jain, S.M., Johnson, D.V., Eds.; Springer: Dordrecht, The Netherlands, 2015; pp. 1–16. [Google Scholar] [CrossRef]
- Johnson, D.V.; Al-Khayri, J.M.; Jain, S.M. Introduction: Date Production Status and Prospects in Africa and the Americas. In Date Palm Genetic Resources and Utilization: Volume 1: Africa and the Americas; Al-Khayri, J.M., Jain, S.M., Johnson, D.V., Eds.; Springer: Dordrecht, The Netherlands, 2015; pp. 3–18. [Google Scholar] [CrossRef]
- Obón, C.; Rivera, D.; Alcaraz, F.; Carreño, E.; Ríos, S.; Laguna, E.; Sánchez-Balibrea, J.; del Arco, M.; Bergmeier, E.; Johnson, D. What are palm groves of Phoenix? Conservation of Phoenix palm groves in the European Union. Biodivers. Conserv. 2018, 27, 1905–1924. [Google Scholar] [CrossRef]
- Food and Agriculture Organization of the United Nations (FAO). FAOSTAT. Crops: Area Harvested, Dates. 2017; Available online: http://www.fao.org/faostat/en/#data/QC (accessed on 28 July 2019).
- Rivera, D.; Obón, C.; Alcaraz, F.; Carreño, E.; Laguna, E.; Amorós, A.; Johnson, D.V.; Díaz, G.; Morte, A. Date Palm Status and Perspective in Spain. In Date Palm Genetic Resources and Utilization: Volume 2: Asia and Europe; Al-Khayri, J.M., Jain, S.M., Johnson, D.V., Eds.; Springer: Dordrecht, The Netherlands, 2015; pp. 489–526. [Google Scholar] [CrossRef]
- Rivera Núñez, D.; de Castro, C.; Verde, A.; Fajardo, J.; Valdés, A.; Alcaraz Ariza, F.; Carreño Sánchez, E.; Heinrich, M.; Martinez-Garcia, M.; Ríos Ruiz, S.; et al. La palmera datilera y la palmera canaria en la medicina tradicional de España. Rev. Fitoter. 2014, 14, 67–81. [Google Scholar]
- Zaid, A.; de Wet, P. Origin, geographical distribution and nutritional values of date palm. In Date Palm Cultivation; Zaid, A., Ed.; Food and Agriculture Organization of the United Nations (FAO): Rome, Italy, 2002; Chapter II. [Google Scholar]
- Jaradat, A.A. Biodiversity, Genetic Diversity, and Genetic Resources of Date Palm. In Date Palm Genetic Resources and Utilization: Volume 1: Africa and the Americas; Al-Khayri, J.M., Jain, S.M., Johnson, D.V., Eds.; Springer: Dordrecht, The Netherlands, 2015; pp. 19–71. [Google Scholar] [CrossRef]
- El-Sabea, A.M.R.; Faleiro, J.R.; Abo-El-Saad, M.M. The threat of red palm weevil Rhynchophorus ferrugineus to date plantations of the Gulf region in the Middle-East: An economic perspective. Outlooks Pest Manag. 2009, 20, 131–134. [Google Scholar] [CrossRef]
- Al-Dosary, N.; Al-Dobai, S.; Faleiro, J. Review on the management of red palm weevil Rhynchophorus ferrugineus olivier in date palm Phoenix dactylifera L. Emir. J. Food Agric. 2015, 28, 34–44. [Google Scholar] [CrossRef]
- European Commission. The Insect Killing Our Palm Trees EU Eff Orts to Stop the Red Palm Weevil; Office for Official Publications of the European Communities: Luxembourg, 2011; pp. 1–32. [Google Scholar] [CrossRef]
- Dembilio, Ó.; Jacas, J.A. Basic bio-ecological parameters of the invasive Red Palm Weevil, Rhynchophorus ferrugineus (Coleoptera: Curculionidae), in Phoenix canariensis under Mediterranean climate. Bull. Entomol. Res. 2011, 101, 153–163. [Google Scholar] [CrossRef]
- EPPO. Data sheets on quarantine pests: Rhynchophorus ferrugineus. Bull. OEPP/EPPO 2008, 38, 55–59. [Google Scholar] [CrossRef]
- Kontodimas, D.; Soroker, V.; Pontikakos, C.; Suma, P.; Beaudoin-Ollivier, L.; Karamaouna, F.; Riolo, P. Visual Identification and Characterization of Rhynchophorus Ferrugineus and Paysandisia Archon Infestation. In Handbook of Major Palm Pests: Biology and Management; Soroker, V., Colazza, S., Eds.; John Wiley & Sons Ltd.: Hoboken, NJ, USA, 2017; Chapter 9; pp. 187–208. [Google Scholar] [CrossRef]
- Soroker, V.; Suma, P.; La Pergola, A.; Llopis, V.N.; Vacas, S.; Cohen, Y.; Cohen, Y.; Alchanatis, V.; Milonas, P.; Golomb, O.; et al. Surveillance Techniques and Detection Methods for Rhynchophorus ferrugineus and Paysandisia archon. In Handbook of Major Palm Pests: Biology and Management; Soroker, V., Colazza, S., Eds.; John Wiley & Sons Ltd.: Hoboken, NJ, USA, 2017; Chapter 10; pp. 209–232. [Google Scholar] [CrossRef]
- Liang, X.; Kankare, V.; Hyyppä, J.; Wang, Y.; Kukko, A.; Haggrén, H.; Yu, X.; Kaartinen, H.; Jaakkola, A.; Guan, F.; et al. Terrestrial laser scanning in forest inventories. ISPRS J. Photogramm. Remote Sens. 2016, 115, 63–77. [Google Scholar] [CrossRef]
- Wulder, M.A.; White, J.C.; Nelson, R.F.; Næsset, E.; Ørka, H.O.; Coops, N.C.; Hilker, T.; Bater, C.W.; Gobakken, T. Lidar sampling for large-area forest characterization: A review. Remote Sens. Environ. 2012, 121, 196–209. [Google Scholar] [CrossRef]
- White, J.C.; Coops, N.C.; Wulder, M.A.; Vastaranta, M.; Hilker, T.; Tompalski, P. Remote Sensing Technologies for Enhancing Forest Inventories: A Review. Can. J. Remote Sens. 2016, 42, 619–641. [Google Scholar] [CrossRef]
- Barrett, F.; McRoberts, R.E.; Tomppo, E.; Cienciala, E.; Waser, L.T. A questionnaire-based review of the operational use of remotely sensed data by national forest inventories. Remote Sens. Environ. 2016, 174, 279–289. [Google Scholar] [CrossRef]
- Weinstein, B.G.; Marconi, S.; Bohlman, S.; Zare, A.; White, E. Individual Tree-Crown Detection in RGB Imagery Using Semi-Supervised Deep Learning Neural Networks. Remote Sens. 2019, 11, 1309. [Google Scholar] [CrossRef]
- Branson, S.; Wegner, J.D.; Hall, D.; Lang, N.; Schindler, K.; Perona, P. From Google Maps to a fine-grained catalog of street trees. ISPRS J. Photogramm. Remote Sens. 2018, 135, 13–30. [Google Scholar] [CrossRef]
- Saldana Ochoa, K.; Guo, Z. A framework for the management of agricultural resources with automated aerial imagery detection. Comput. Electron. Agric. 2019, 162, 53–69. [Google Scholar] [CrossRef]
- Zhu, X.X.; Tuia, D.; Mou, L.; Xia, G.; Zhang, L.; Xu, F.; Fraundorfer, F. Deep Learning in Remote Sensing: A Comprehensive Review and List of Resources. IEEE Geosci. Remote Sens. Mag. 2017, 5, 8–36. [Google Scholar] [CrossRef]
- O’Mahony, N.; Campbell, S.; Carvalho, A.; Harapanahalli, S.; Hernandez, G.V.; Krpalkova, L.; Riordan, D.; Walsh, J. Deep Learning vs. Traditional Computer Vision BT-Advances in Computer Vision; CVC 2019; Arai, K., Kapoor, S., Eds.; Springer International Publishing: Cham, Switzerland, 2020; pp. 128–144. [Google Scholar] [CrossRef]
- Mubin, N.A.; Nadarajoo, E.; Shafri, H.Z.M.; Hamedianfar, A. Young and mature oil palm tree detection and counting using convolutional neural network deep learning method. Int. J. Remote Sens. 2019, 40, 7500–7515. [Google Scholar] [CrossRef]
- Freudenberg, M.; Nölke, N.; Agostini, A.; Urban, K.; Wörgötter, F.; Kleinn, C. Large scale palm tree detection in high resolution satellite images using U-Net. Remote Sens. 2019, 11, 312. [Google Scholar] [CrossRef]
- Li, W.; Dong, R.; Fu, H.; Yu, L. Large-scale oil palm tree detection from high-resolution satellite images using two-stage convolutional neural networks. Remote Sens. 2019, 11, 11. [Google Scholar] [CrossRef]
- Wang, Y.; Zhu, X.; Wu, B. Automatic detection of individual oil palm trees from UAV images using HOG features and an SVM classifier. Int. J. Remote Sens. 2019, 40, 7356–7370. [Google Scholar] [CrossRef]
- Rizeei, H.M.; Shafri, H.Z.M.; Mohamoud, M.A.; Pradhan, B.; Kalantar, B. Oil Palm Counting and Age Estimation from WorldView-3 Imagery and LiDAR Data Using an Integrated OBIA Height Model and Regression Analysis. J. Sens. 2018, 2018, 13. [Google Scholar] [CrossRef]
- Li, W.; Fu, H.; Yu, L.; Cracknell, A. Deep learning based oil palm tree detection and counting for high-resolution remote sensing images. Remote Sens. 2017, 9, 22. [Google Scholar] [CrossRef]
- Santoso, H.; Tani, H.; Wang, X. A simple method for detection and counting of oil palm trees using high-resolution multispectral satellite imagery. Int. J. Remote Sens. 2016, 37, 5122–5134. [Google Scholar] [CrossRef]
- Dos Santos, A.M.; Mitja, D.; Delaître, E.; Demagistri, L.; de Souza Miranda, I.; Libourel, T.; Petit, M. Estimating babassu palm density using automatic palm tree detection with very high spatial resolution satellite images. J. Environ. Manag. 2017, 193, 40–51. [Google Scholar] [CrossRef]
- Al Shidi, R.H.; Kumar, L.; Al-Khatri, S.A.H.; Albahri, M.M.; Alaufi, M.S. Relationship of Date Palm Tree Density to Dubas Bug Ommatissus lybicus Infestation in Omani Orchards. Agriculture 2018, 8, 64. [Google Scholar] [CrossRef]
- Al-Ruzouq, R.; Shanableh, A.; Gibril, M.B.A.; AL-Mansoori, S. Image Segmentation Parameter Selection and Ant Colony Optimization for Date Palm Tree Detection and Mapping from Very-High-Spatial-Resolution Aerial Imagery. Remote Sens. 2018, 10, 1413. [Google Scholar] [CrossRef]
- Tagle Casapia, X.; Falen, L.; Bartholomeus, H.; Cárdenas, R.; Flores, G.; Herold, M.; Honorio Coronado, E.N.; Baker, T.R. Identifying and Quantifying the Abundance of Economically Important Palms in Tropical Moist Forest Using UAV Imagery. Remote Sens. 2020, 12, 9. [Google Scholar] [CrossRef]
- Chung, S.H.; Sah, B.; Lee, J. Optimization for drone and drone-truck combined operations: A review of the state of the art and future directions. Comput. Oper. Res. 2020, 123, 105004. [Google Scholar] [CrossRef]
- Lee, J.S.H.; Wich, S.; Widayati, A.; Koh, L.P. Detecting industrial oil palm plantations on Landsat images with Google Earth Engine. Remote Sens. Appl. Soc. Environ. 2016, 4, 219–224. [Google Scholar] [CrossRef]
- Szantoi, Z.; Smith, S.E.; Strona, G.; Koh, L.P.; Wich, S.A. Mapping orangutan habitat and agricultural areas using Landsat OLI imagery augmented with unmanned aircraft system aerial photography. Int. J. Remote Sens. 2017, 38, 2231–2245. [Google Scholar] [CrossRef]
- De Petris, S.; Boccardo, P.; Borgogno-Mondino, E. Detection and characterization of oil palm plantations through MODIS EVI time series. Int. J. Remote Sens. 2019, 40, 7297–7311. [Google Scholar] [CrossRef]
- Li, W.; Fu, D.; Su, F.; Xiao, Y. Spatial–Temporal Evolution and Analysis of the Driving Force of Oil Palm Patterns in Malaysia from 2000 to 2018. ISPRS Int. J. Geo-Inf. 2020, 9, 280. [Google Scholar] [CrossRef]
- Sarzynski, T.; Giam, X.; Carrasco, L.; Lee, J.S. Combining Radar and Optical Imagery to Map Oil Palm Plantations in Sumatra, Indonesia, Using the Google Earth Engine. Remote Sens. 2020, 17, 1220. [Google Scholar] [CrossRef]
- Lin, T.Y.; Goyal, P.; Girshick, R.B.; He, K.; Dollár, P. Focal Loss for Dense Object Detection. In Proceedings of the IEEE International Conference on Computer Vision (ICCV), Venice, Italy, 22–29 October 2017; pp. 2980–2988. [Google Scholar] [CrossRef]
- Laguna, E. Las especies cultivadas y asilvestradas de grandes palmeras datileras en tierras valencianas. Bouteloua 2006, 1, 6–12. [Google Scholar]
- Carreño Sánchez, E. Diversidad Genética en Especies del Género Phoenix. Ph.D. Thesis, Universidad Miguel Hernández, Alicante, Spain, 2017. [Google Scholar]
- Cartográfica de Canarias, S.A. Información sobre el Mapa de Palmeras Canarias; Technical Report; Consejería de Transición Ecológica, Lucha contra el Cambio Climático y Planificación Territorial del Gobierno de Canarias: Las Palmas, Spain, 2017; Available online: http://opendata.sitcan.es/upload/medio-ambiente/gobcan_medio-ambiente_mapa-palmeras-info.pdf (accessed on 30 September 2019).
- González-Pérez, M.A.; Caujapé-Castells, J.; Sosa, P.A. Molecular evidence of hybridisation between the endemic Phoenix canariensis and the widespread P. dactylifera with Random Amplified Polymorphic DNA (RAPD) markers. Plant Syst. Evol. 2004, 247, 165–175. [Google Scholar] [CrossRef]
- Alemañ García, G. El Palmeral Histórico de la Ciudad de Elche y su Acequia Mayor: Análisis Patrimonial y Afecciones Urbanísticas Generadas. Ph.D. Thesis, Universidad de Alicante, Alicante, Spain, 2016. [Google Scholar]
- Jiao, L.; Zhang, F.; Liu, F.; Yang, S.; Li, L.; Feng, Z.; Qu, R. A Survey of Deep Learning-Based Object Detection. IEEE Access 2019, 7, 128837–128868. [Google Scholar] [CrossRef]
- Zhang, H.; Hong, X. Recent progresses on object detection: A brief review. Multimed. Tools Appl. 2019, 78, 27809–27847. [Google Scholar] [CrossRef]
- Lin, T.Y.; Dollár, P.; Girshick, R.B.; He, K.; Hariharan, B.; Belongie, S.J. Feature Pyramid Networks for Object Detection. In Proceedings of the IEEE Conference on Computer Vision and Pattern Recognition (CVPR), Honolulu, HI, USA, 21–26 July 2017; pp. 2117–2125. [Google Scholar] [CrossRef]
- Li, K.; Wan, G.; Cheng, G.; Meng, L.; Han, J. Object detection in optical remote sensing images: A survey and a new benchmark. ISPRS J. Photogramm. Remote Sens. 2020, 159, 296–307. [Google Scholar] [CrossRef]
- Hoeser, T.; Kuenzer, C. Object Detection and Image Segmentation with Deep Learning on Earth Observation Data: A Review-Part I: Evolution and Recent Trends. Remote Sens. 2020, 12, 1667. [Google Scholar] [CrossRef]
- Ma, L.; Liu, Y.; Zhang, X.; Ye, Y.; Yin, G.; Johnson, B.A. Deep learning in remote sensing applications: A meta-analysis and review. ISPRS J. Photogramm. Remote Sens. 2019, 152, 166–177. [Google Scholar] [CrossRef]
- Guo, Y.; Liu, Y.; Oerlemans, A.; Lao, S.; Wu, S.; Lew, M.S. Deep learning for visual understanding: A review. Neurocomputing 2016, 187, 27–48. [Google Scholar] [CrossRef]
- Gaiser, H.; de Vries, M.; Lacatusu, V.; Vcarpani; Williamson, A.; Liscio, E.; András; Henon, Y.; Jjiun; Gratie, C.; et al. fizyr/keras-retinanet 0.5.1. 2019. Available online: https://github.com/fizyr/keras-retinanet (accessed on 15 July 2019).
- Zlocha, M.; Dou, Q.; Glocker, B. Improving RetinaNet for CT Lesion Detection with Dense Masks from Weak RECIST Labels BT. In Medical Image Computing and Computer Assisted Intervention—MICCAI 2019; Shen, D., Liu, T., Peters, T.M., Staib, L.H., Essert, C., Zhou, S., Yap, P.T., Khan, A., Eds.; Springer International Publishing: Cham, Switzerland, 2019; pp. 402–410. [Google Scholar]
- Everingham, M.; Van Gool, L.; Williams, C.K.I.; Winn, J.; Zisserman, A. The Pascal Visual Object Classes (VOC) Challenge. Int. J. Comput. Vis. 2010, 88, 303–338. [Google Scholar] [CrossRef]
- Russakovsky, O.; Deng, J.; Su, H.; Krause, J.; Satheesh, S.; Ma, S.; Huang, Z.; Karpathy, A.; Khosla, A.; Bernstein, M.; et al. ImageNet Large Scale Visual Recognition Challenge. Int. J. Comput. Vis. 2015, 115, 211–252. [Google Scholar] [CrossRef]
- Mayor, A.G.; Valdecantos, A.; Vallejo, V.R.; Keizer, J.J.; Bloem, J.; Baeza, J.; González-Pelayo, O.; Machado, A.I.; de Ruiter, P.C. Fire-induced pine woodland to shrubland transitions in Southern Europe may promote shifts in soil fertility. Sci. Total Environ. 2016, 573, 1232–1241. [Google Scholar] [CrossRef] [PubMed]
- Xia, G.; Bai, X.; Ding, J.; Zhu, Z.; Belongie, S.; Luo, J.; Datcu, M.; Pelillo, M.; Zhang, L. DOTA: A Large-Scale Dataset for Object Detection in Aerial Images. In Proceedings of the 2018 IEEE/CVF Conference on Computer Vision and Pattern Recognition, Salt Lake City, UT, USA, 18–23 June 2018; pp. 3974–3983. [Google Scholar] [CrossRef]
- Sumbul, G.; Kang, J.; Kreuziger, T.; Marcelino, F.; Costa, H.; Benevides, P.; Caetano, M.; Demir, B. BigEarthNet Dataset with A New Class-Nomenclature for Remote Sensing Image Understanding. arXiv 2020, arXiv:cs.CV/2001.06372. [Google Scholar]
- Tsagkatakis, G.; Aidini, A.; Fotiadou, K.; Giannopoulos, M.; Pentari, A.; Tsakalides, P. Survey of Deep-Learning Approaches for Remote Sensing Observation Enhancement. Sensors 2019, 19, 3929. [Google Scholar] [CrossRef]
- Rodriguez, A.C.; Wegner, J.D. Counting the Uncountable: Deep Semantic Density Estimation from Space; Brox, T., Bruhn, A., Fritz, M., Eds.; Pattern Recognition; Springer International Publishing: Cham, Switzerland, 2019; pp. 351–362. [Google Scholar]
- Wagner, F.H.; Dalagnol, R.; Tagle Casapia, X.; Streher, A.S.; Phillips, O.L.; Gloor, E.; Aragão, L.E.O.C. Regional Mapping and Spatial Distribution Analysis of Canopy Palms in an Amazon Forest Using Deep Learning and VHR Images. Remote Sens. 2020, 12, 2225. [Google Scholar] [CrossRef]
- Milosavljević, I.; El-Shafie, H.A.F.; Faleiro, J.R.; Hoddle, C.D.; Lewis, M.; Hoddle, M.S. Palmageddon: The wasting of ornamental palms by invasive palm weevils, Rhynchophorus spp. J. Pest Sci. 2019, 92, 143–156. [Google Scholar] [CrossRef]
- Goldshtein, E.; Cohen, Y.; Hetzroni, A.; Cohen, Y.; Soroker, V. The spatiotemporal dynamics and range expansion of the red palm weevil in Israel. J. Pest Sci. 2020, 93, 691–702. [Google Scholar] [CrossRef]
- Sanz-Aguilar, A.; Cortés, I.; Gascón, I.; Martínez, O.; Ginard, S.; Tavecchia, G. Modelling pest dynamics under uncertainty in pest detection: The case of the red palm weevil. Biol. Invasions 2020, 22, 1635–1645. [Google Scholar] [CrossRef]
- Rivera, D.; Obón de Castro, C.; Carreño, E.; Inocencio, C.; Alcaraz, F.; Ríos, S.; Palazón, J.A.; Vázquez, L.; Laguna, E. Morphological Systematics of Date-Palm Diversity (Phoenix, Arecaceae) in Western Europe and Some Preliminary Molecular Results. In Proceedings of the V International Symposium on Taxonomy of Cultivated Plants, Wageningen, The Netherlands, 15–19 October 2007; Number 799. pp. 97–104. [Google Scholar] [CrossRef]
- Laguna, E.; Rivera, D.; Obón, C.; Alcaraz, E. Phoenix canariensis var. porphyrococca en el Levante español. Bouteloua 2012, 9, 3–10. [Google Scholar]
- Laguna, E.; (Generalitat Valenciana, Valencia, Spain). Personal communication, 2020.
- Rivera, D.; Abellán, J.; Palazón, J.A.; Obón, C.; Alcaraz, F.; Carreño, E.; Laguna, E.; Ruiz, A.; Johnson, D. Modelling ancient areas for date palms (Phoenix species: Arecaceae): Bayesian analysis of biological and cultural evidence. Bot. J. Linn. Soc. 2020, 193, 228–262. [Google Scholar] [CrossRef]
- Muscarella, R.; Emilio, T.; Phillips, O.L.; Lewis, S.L.; Slik, F.; Baker, W.J.; Couvreur, T.L.P.; Eiserhardt, W.L.; Svenning, J.C.; Affum-Baffoe, K.; et al. The global abundance of tree palms. Glob. Ecol. Biogeogr. 2020, 1–20. [Google Scholar] [CrossRef]
- He, K.; Zhang, X.; Ren, S.; Sun, J. Deep Residual Learning for Image Recognition. In Proceedings of the IEEE Conference on Computer Vision and Pattern Recognition (CVPR), Las Vegas, NV, USA, 27–30 June 2016; pp. 770–778. [Google Scholar] [CrossRef]
- Lin, T.Y.; Maire, M.; Belongie, S.; Hays, J.; Perona, P.; Ramanan, D.; Dollár, P.; Zitnick, C.L. Microsoft COCO: Common Objects in Context. In Computer Vision–ECCV 2014; Fleet, D., Pajdla, T., Schiele, B., Tuytelaars, T., Eds.; Springer International Publishing: Cham, Switzerland, 2014; pp. 740–755. [Google Scholar]
- Instituto Nacional de Estadística (INE). Anuario Estadístico de España 2005. 2005. Available online: https://www.ine.es/prodyser/pubweb/anuario05/anu05_1entorno.pdf (accessed on 10 February 2020).


Publisher’s Note: MDPI stays neutral with regard to jurisdictional claims in published maps and institutional affiliations. |
© 2020 by the authors. Licensee MDPI, Basel, Switzerland. This article is an open access article distributed under the terms and conditions of the Creative Commons Attribution (CC BY) license (http://creativecommons.org/licenses/by/4.0/).