Abstract
Height assignment is an important problem for satellite measurements of atmospheric motion vectors (AMVs) that are interpreted as winds by forecast and assimilation systems. Stereo methods assign heights to AMVs from the parallax observed between observations from different vantage points in orbit while tracking cloud or moisture features. In this paper, we fully develop the stereo method to jointly retrieve wind vectors with their geometric heights from geostationary satellite pairs. Synchronization of observations between observing systems is not required. NASA and NOAA stereo-winds codes have implemented this method and we processed large datasets from GOES-16, -17, and Himawari-8. Our retrievals are validated against rawinsonde observations and demonstrate the potential to improve the forecast skill. Stereo winds also offer an important mitigation for the loop heat pipe anomaly on GOES-17 during times when warm focal plane temperatures cause infrared channels that are needed for operational height assignments to fail. We also examine several application areas, including deep convection in tropical cyclones, planetary boundary layer dynamics, and fire smoke plumes, where stereo methods provide insights into atmospheric processes. The stereo method is broadly applicable across the geostationary ring where systems offering similar image navigation and registration (INR) performance as GOES-R are deployed.
1. Introduction
Geostationary satellite wind products rely on the tracking of cloud or moisture features in multitemporal sequences of scenes from a single satellite. This method provides a good means of determining the atmospheric motion vector (AMV) but does not directly observe the AMV height within the atmosphere. There are several indirect methods for making AMV height assignments that rely on infrared (IR) brightness temperatures regardless of whether the feature is being tracked in an IR or a visible (VIS) spectral channel. Fundamentally these methods rely on a radiative transfer model based on differential absorption by gas species from the cloud top into space or the use of numerical weather prediction (NWP) forecast temperature profiles [1,2,3,4,5,6,7,8]. Complicated thermodynamics can cause problems for IR height assignments that are made based on a modeled temperature profile.
We argue that stereo methods, which provide a direct observation of the AMV height through geometric parallax, have advantages where there is overlapping coverage by two satellites. The same template that is tracked in time can be observed from two different platforms and its altitude inferred from the observed parallax. Such an approach directly ties the AMV to its height. Stereo imaging from two geostationary (GEO) satellites is an old idea [9] that has been given new life with the new generation of GEO satellites such as the Geostationary Operational Environmental Satellites R-series (GOES-R) operated by the U.S. National Oceanic and Atmospheric Administration (NOAA) that offer imagery with much improved image navigation and registration (INR), i.e., geometric accuracy and stability. We discuss the sensitivity of stereo-wind retrievals to INR and other errors in Section 4 of this paper.
This paper draws on our previously published work in stereo winds [10,11] combining low-Earth orbiting (LEO) and GEO imagery and demonstrating stereo winds using the prior (GOES-NOP) generation of GOES satellites. Our methods, explained in Section 2, do not require that the satellite observations be synchronous with each other in time. Only pixel sampling times need to be known, or accurately modeled, so that an AMV can be jointly solved with its stereo height. This relaxed sampling requirement enables stereo winds to be produced from a heterogeneous constellation that includes pairs in the GEO ring, or LEO–GEO pairs filling gaps in the overlaps between GEO satellites. Other work [12,13] on stereo measurements of cloud-top heights (hence AMV height assignment) assumes synchronous observations, but Merucci et al. [14] describes a method that adjusts for non-simultaneous observations when using the parallax to measure the height of volcanic ash plumes.
Our results, in Section 3, include several applications where jointly determined AMVs and stereo-wind heights provide new insights into some outstanding mesoscale atmospheric dynamic problems: convection and tropical cyclones, planetary boundary layer (PBL), and wildfire plumes. Ultimately, we anticipate that operational stereo winds will benefit numerical weather modeling by providing more, high quality AMVs with accurate height assignments. We demonstrate this potential by validating our stereo winds against rawinsonde observations and comparing these to NOAA’s operational winds. These results reveal a clear benefit to stereo winds. While beneficial in the general case, stereo winds are particularly quite useful for AMV height assignments in the presence of the loop-heat pipe (LHP) anomaly [15,16] when GOES-17 loses its ability to assign AMV heights due to anomalously warm focal plane temperatures during certain times of the day near the equinoxes. In such cases, some IR bands remain operational for AMVs, but others used for IR height assignment in the operational algorithms become nonfunctional. Stereo methods can mitigate the impact of the LHP anomaly on operational winds from GOES-17 in the overlaps between GOES-17 and -16 and GOES-17 and Himawari-8. This is extensively discussed in Section 3.
2. Materials and Methods
This paper worked with data from the American GOES-R series satellites (GOES-16 and -17) and the Japanese Himawari-8 spacecraft. The GOES-R spacecraft carries the Advanced Baseline Imager (ABI) [17,18], which is a 16-channel imager generally covering the full disk (FD) of the Earth once every 10 min from geostationary orbit, a region covering the Continental U.S. (CONUS) or Pacific U.S. (PACUS) every 5 min, and two mesoscale (MESO) frames every 1 min. The Himawari-8 spacecraft carries a similar instrument, the Advanced Himawari Imager (AHI) [19]. We only worked with the AHI FD frames to guarantee geographically overlapping coverage with ABI on GOES-17. The AHI FDs also refresh every 10 min. Both ABI and AHI were manufactured by L3Harris in Ft. Wayne, Indiana USA and are nearly identical in design and construction except for the differences noted in Table 1. AHI offers true-color imaging with a green channel, not present with ABI, while ABI has a near-infrared (NIR) channel (ABI Band 4), where water vapor is a strong absorber, which is useful for the observation of cirrus clouds. There is one channel (Band 5) shared by both that has a finer spatial resolution in ABI. All mid- and long-wave IR channels share very similar spectral and spatial characteristics.

Table 1.
Advanced Baseline Imager (ABI) and Advanced Himawari Imager (AHI) spectral channels match very closely except for a green channel (AHI Band 2) that ABI lacks and a NIR water vapor absorption band (ABI Band 4) that AHI lacks. Their common Bands 5 also have different resolutions. ABI bands are as specified, and Himawari-8 AHI as measured.
The ABI and AHI Level-1 products are both constructed on a fixed grid by resampling calibrated detector samples to form pixels. Each fixed-grid pixel on the Earth has an invariant geographic location assigned to it. The image navigation and registration (INR) process assures the accuracy and stability of the true positions of pixels with respect to their assigned fixed-grid locations. Both fixed grids define their pixel sites in integer and half-integer angular increments of nominal kilometers in accordance with the spatial resolution of the channel. The AHI fixed grid defines a nominal kilometer to be the angular measure of 1 km on the ground at the subsatellite point, which is slightly less than the nominal kilometer used by the ABI fixed grid of exactly 28 μrad. The AHI FD Level-1 product has 22,000 pixels × 22,000 pixels at a 0.5 km resolution, whereas the 0.5 km ABI FD product is 21,696 pixels × 21,696 pixels. The mapping between fixed-grid angles and geographic coordinates is also different. This is defined for ABI in the GOES-R Product User’s Guide (PUG) [20] and for AHI by the Normalized Geostationary Projection defined in a Coordination Group for Meteorological Satellites (CGMS) specification [21]. Both fixed grids are defined with respect to an idealized satellite placed on the equator at a reference longitude, with the geographic assignment for a pixel being the longitude and geodetic latitude where the line-of-sight from the idealized satellite pierces the reference ellipsoid. We used a common ellipsoid for both, the 1984 World Geodetic System (WGS 84). The WGS 84 ellipsoid is essentially the same as the 1980 Geodetic Reference System (GRS 80) ellipsoid referenced in the GOES-R specification but has slightly less flattening than the ellipsoid specified for AHI (differing by 169 m at the poles).
2.1. GOES-GEO Stereo Winds Coverage
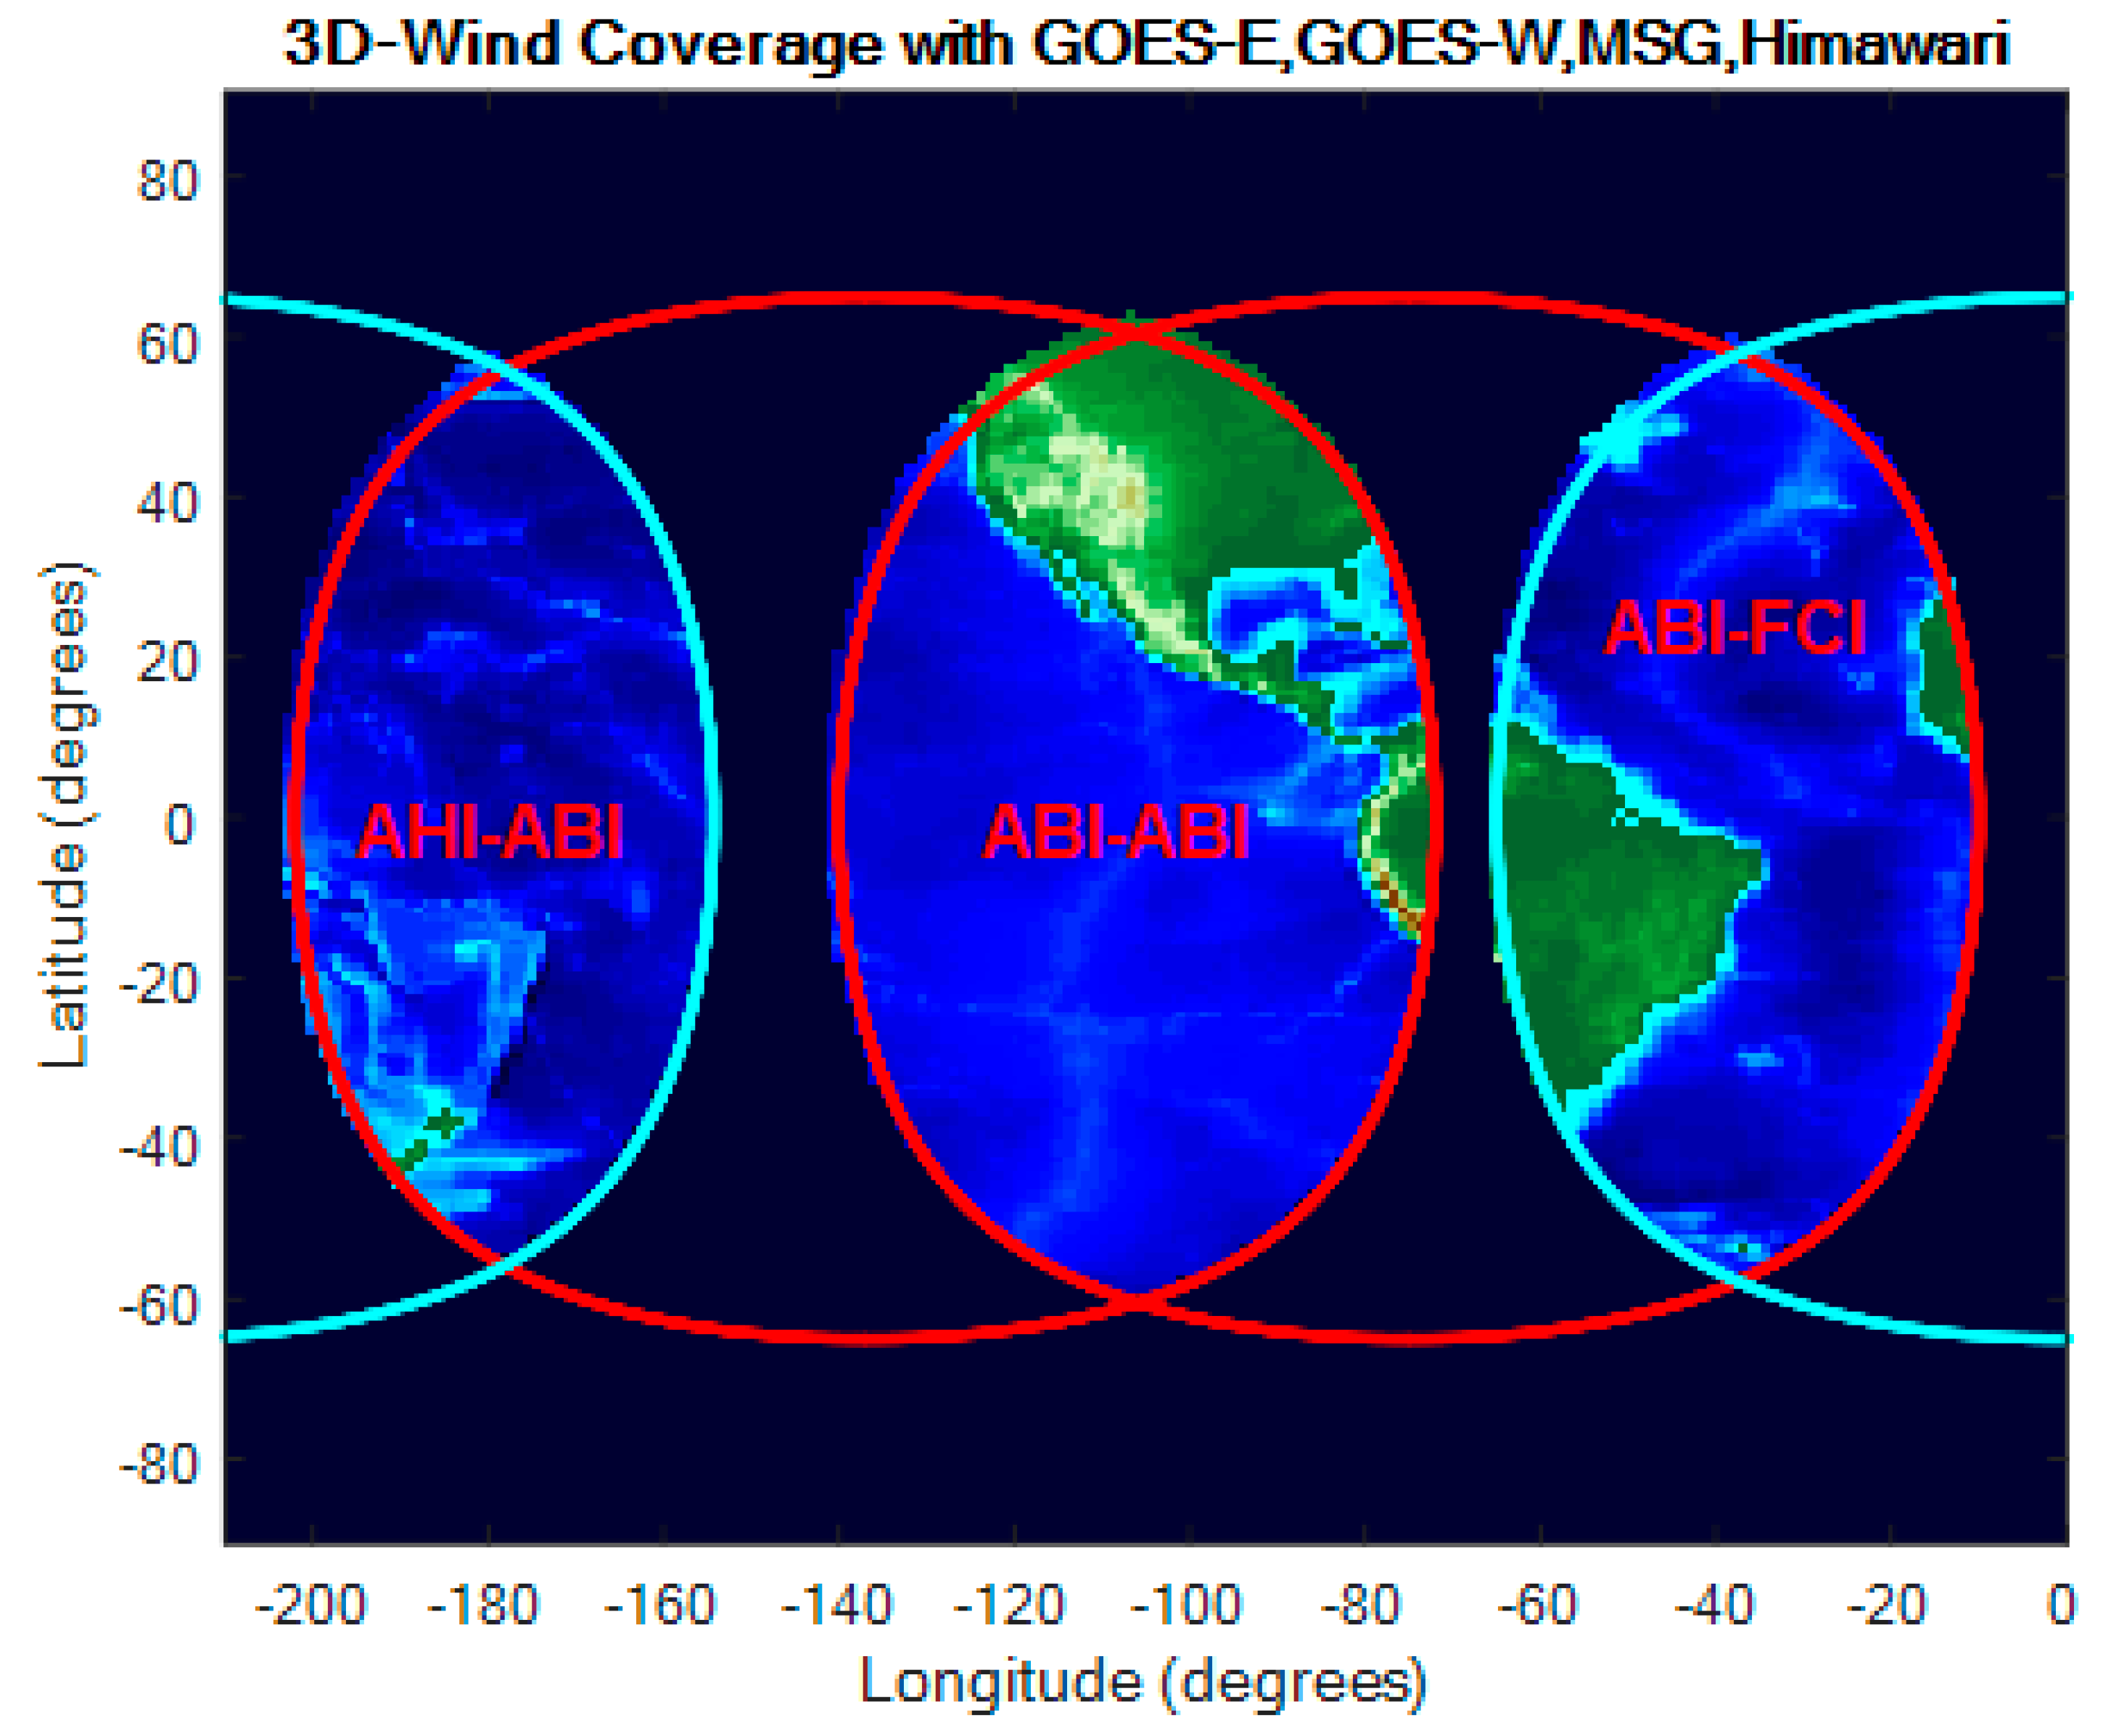
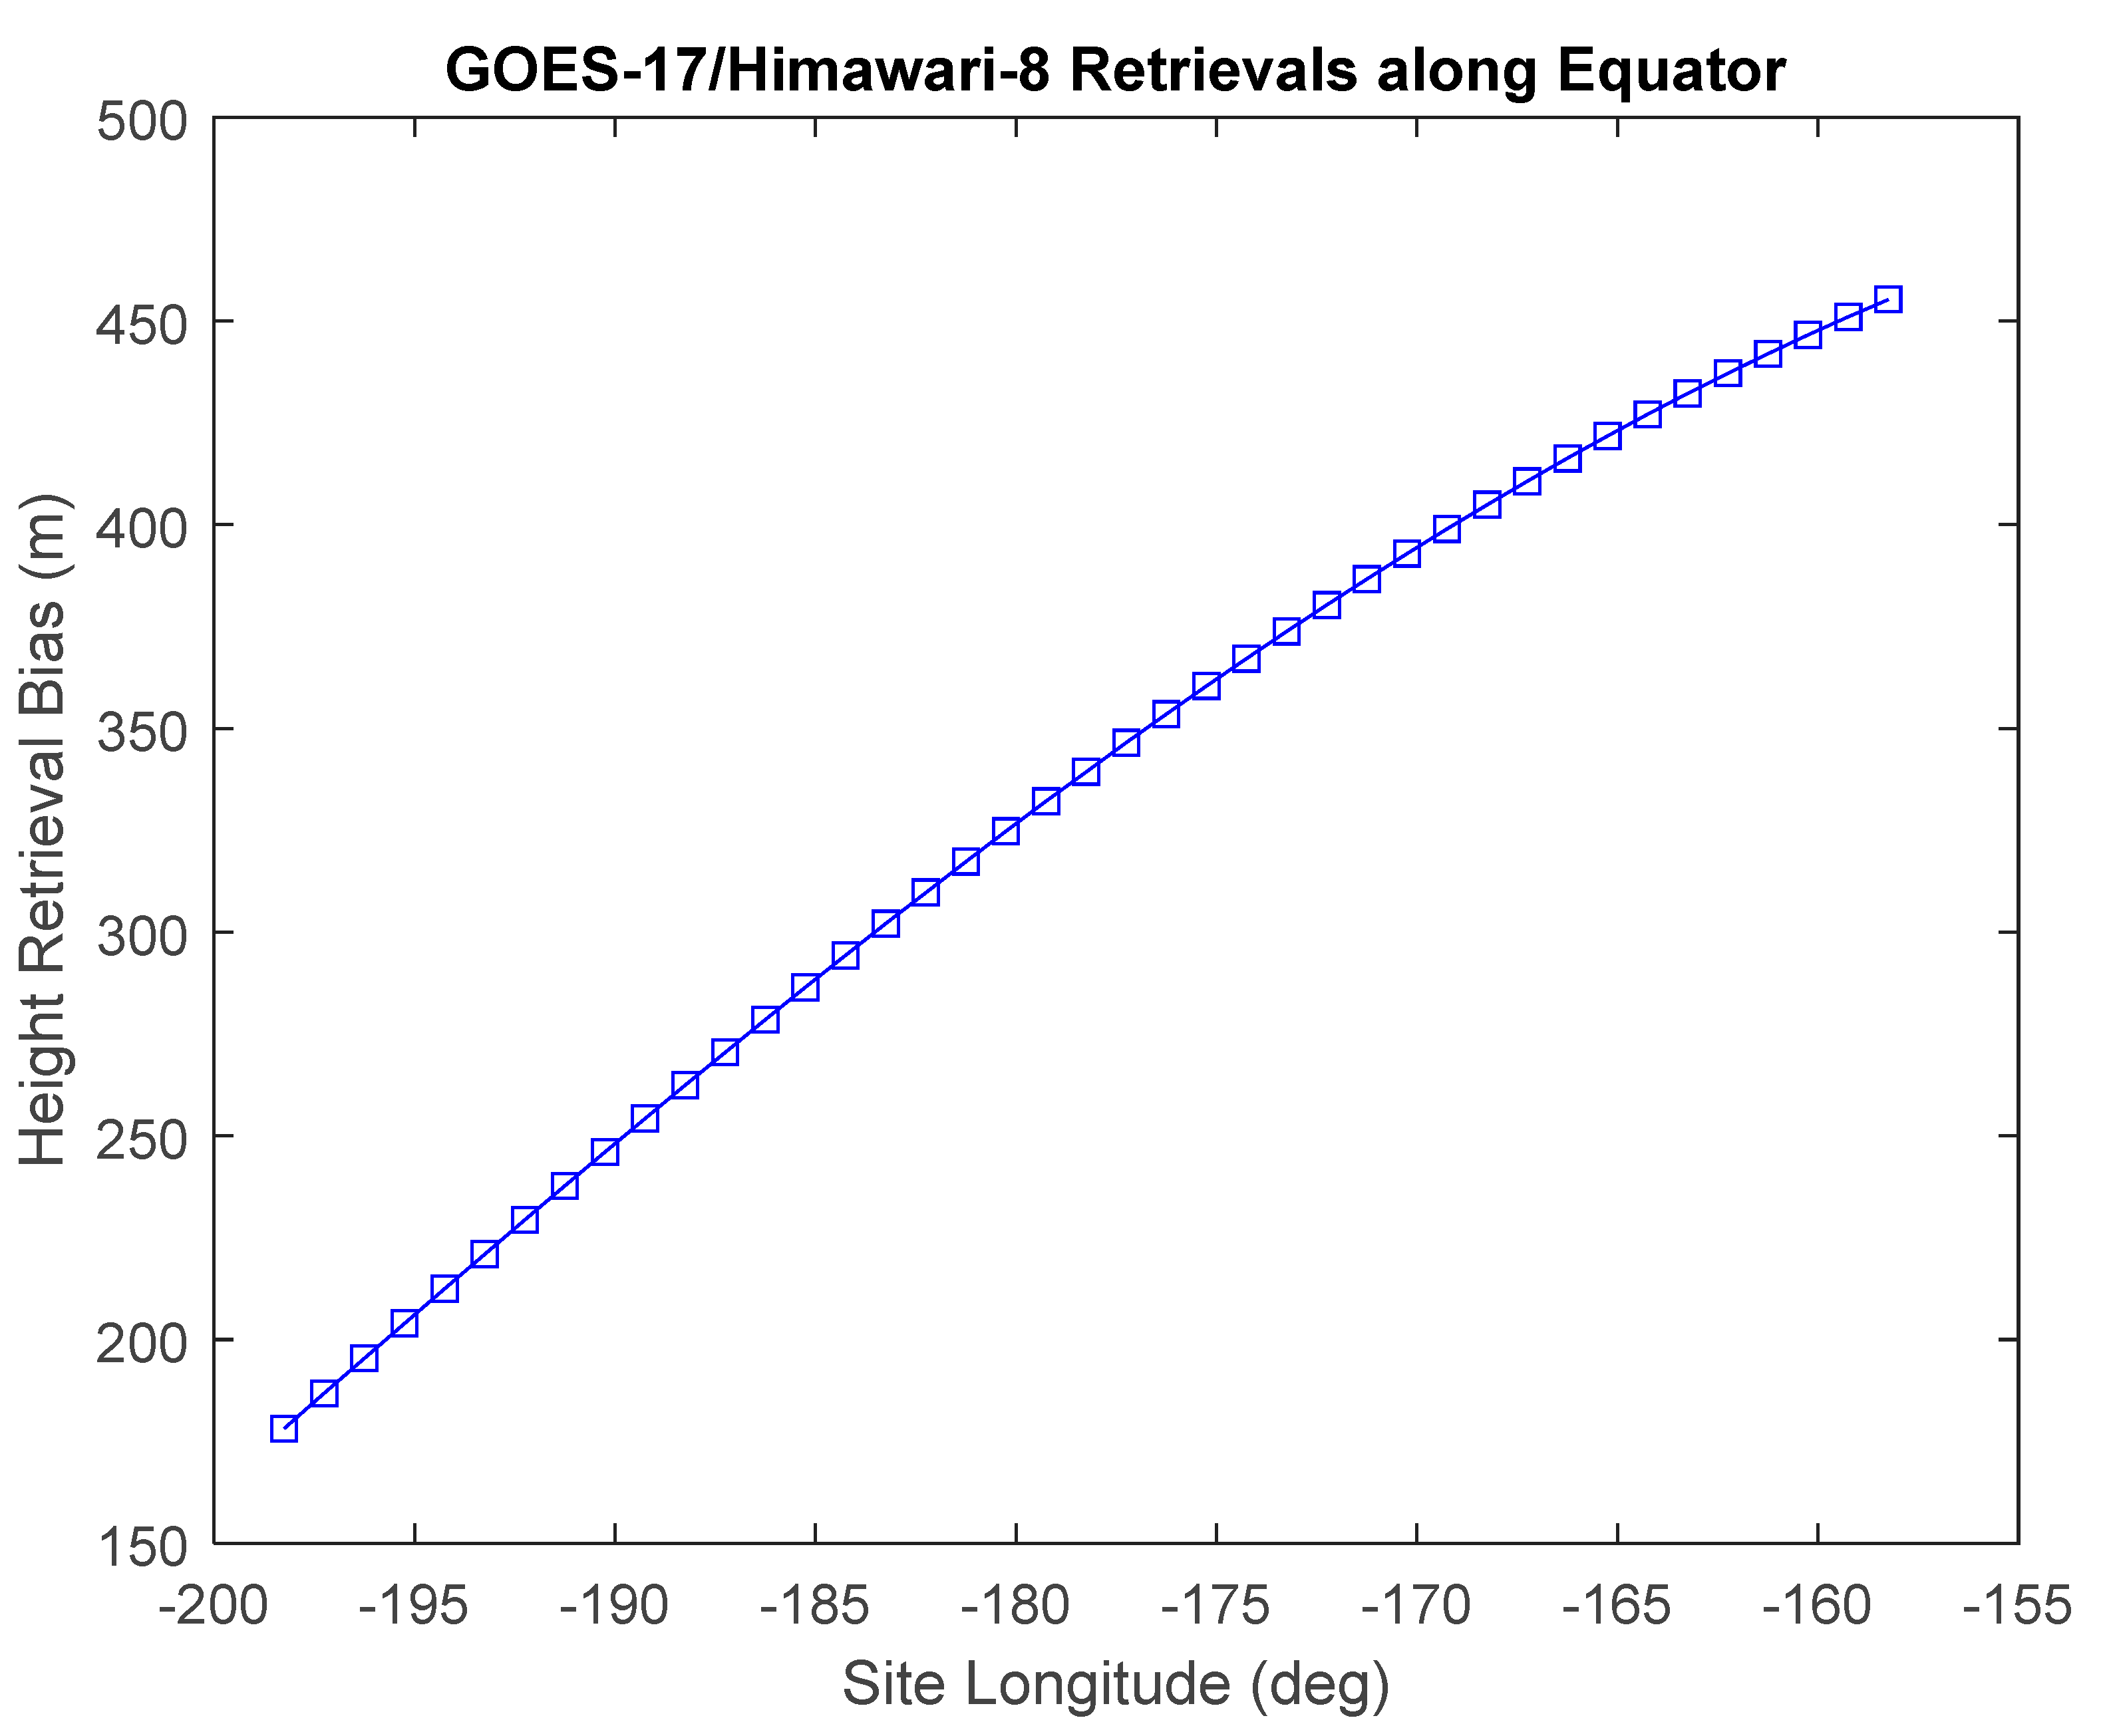
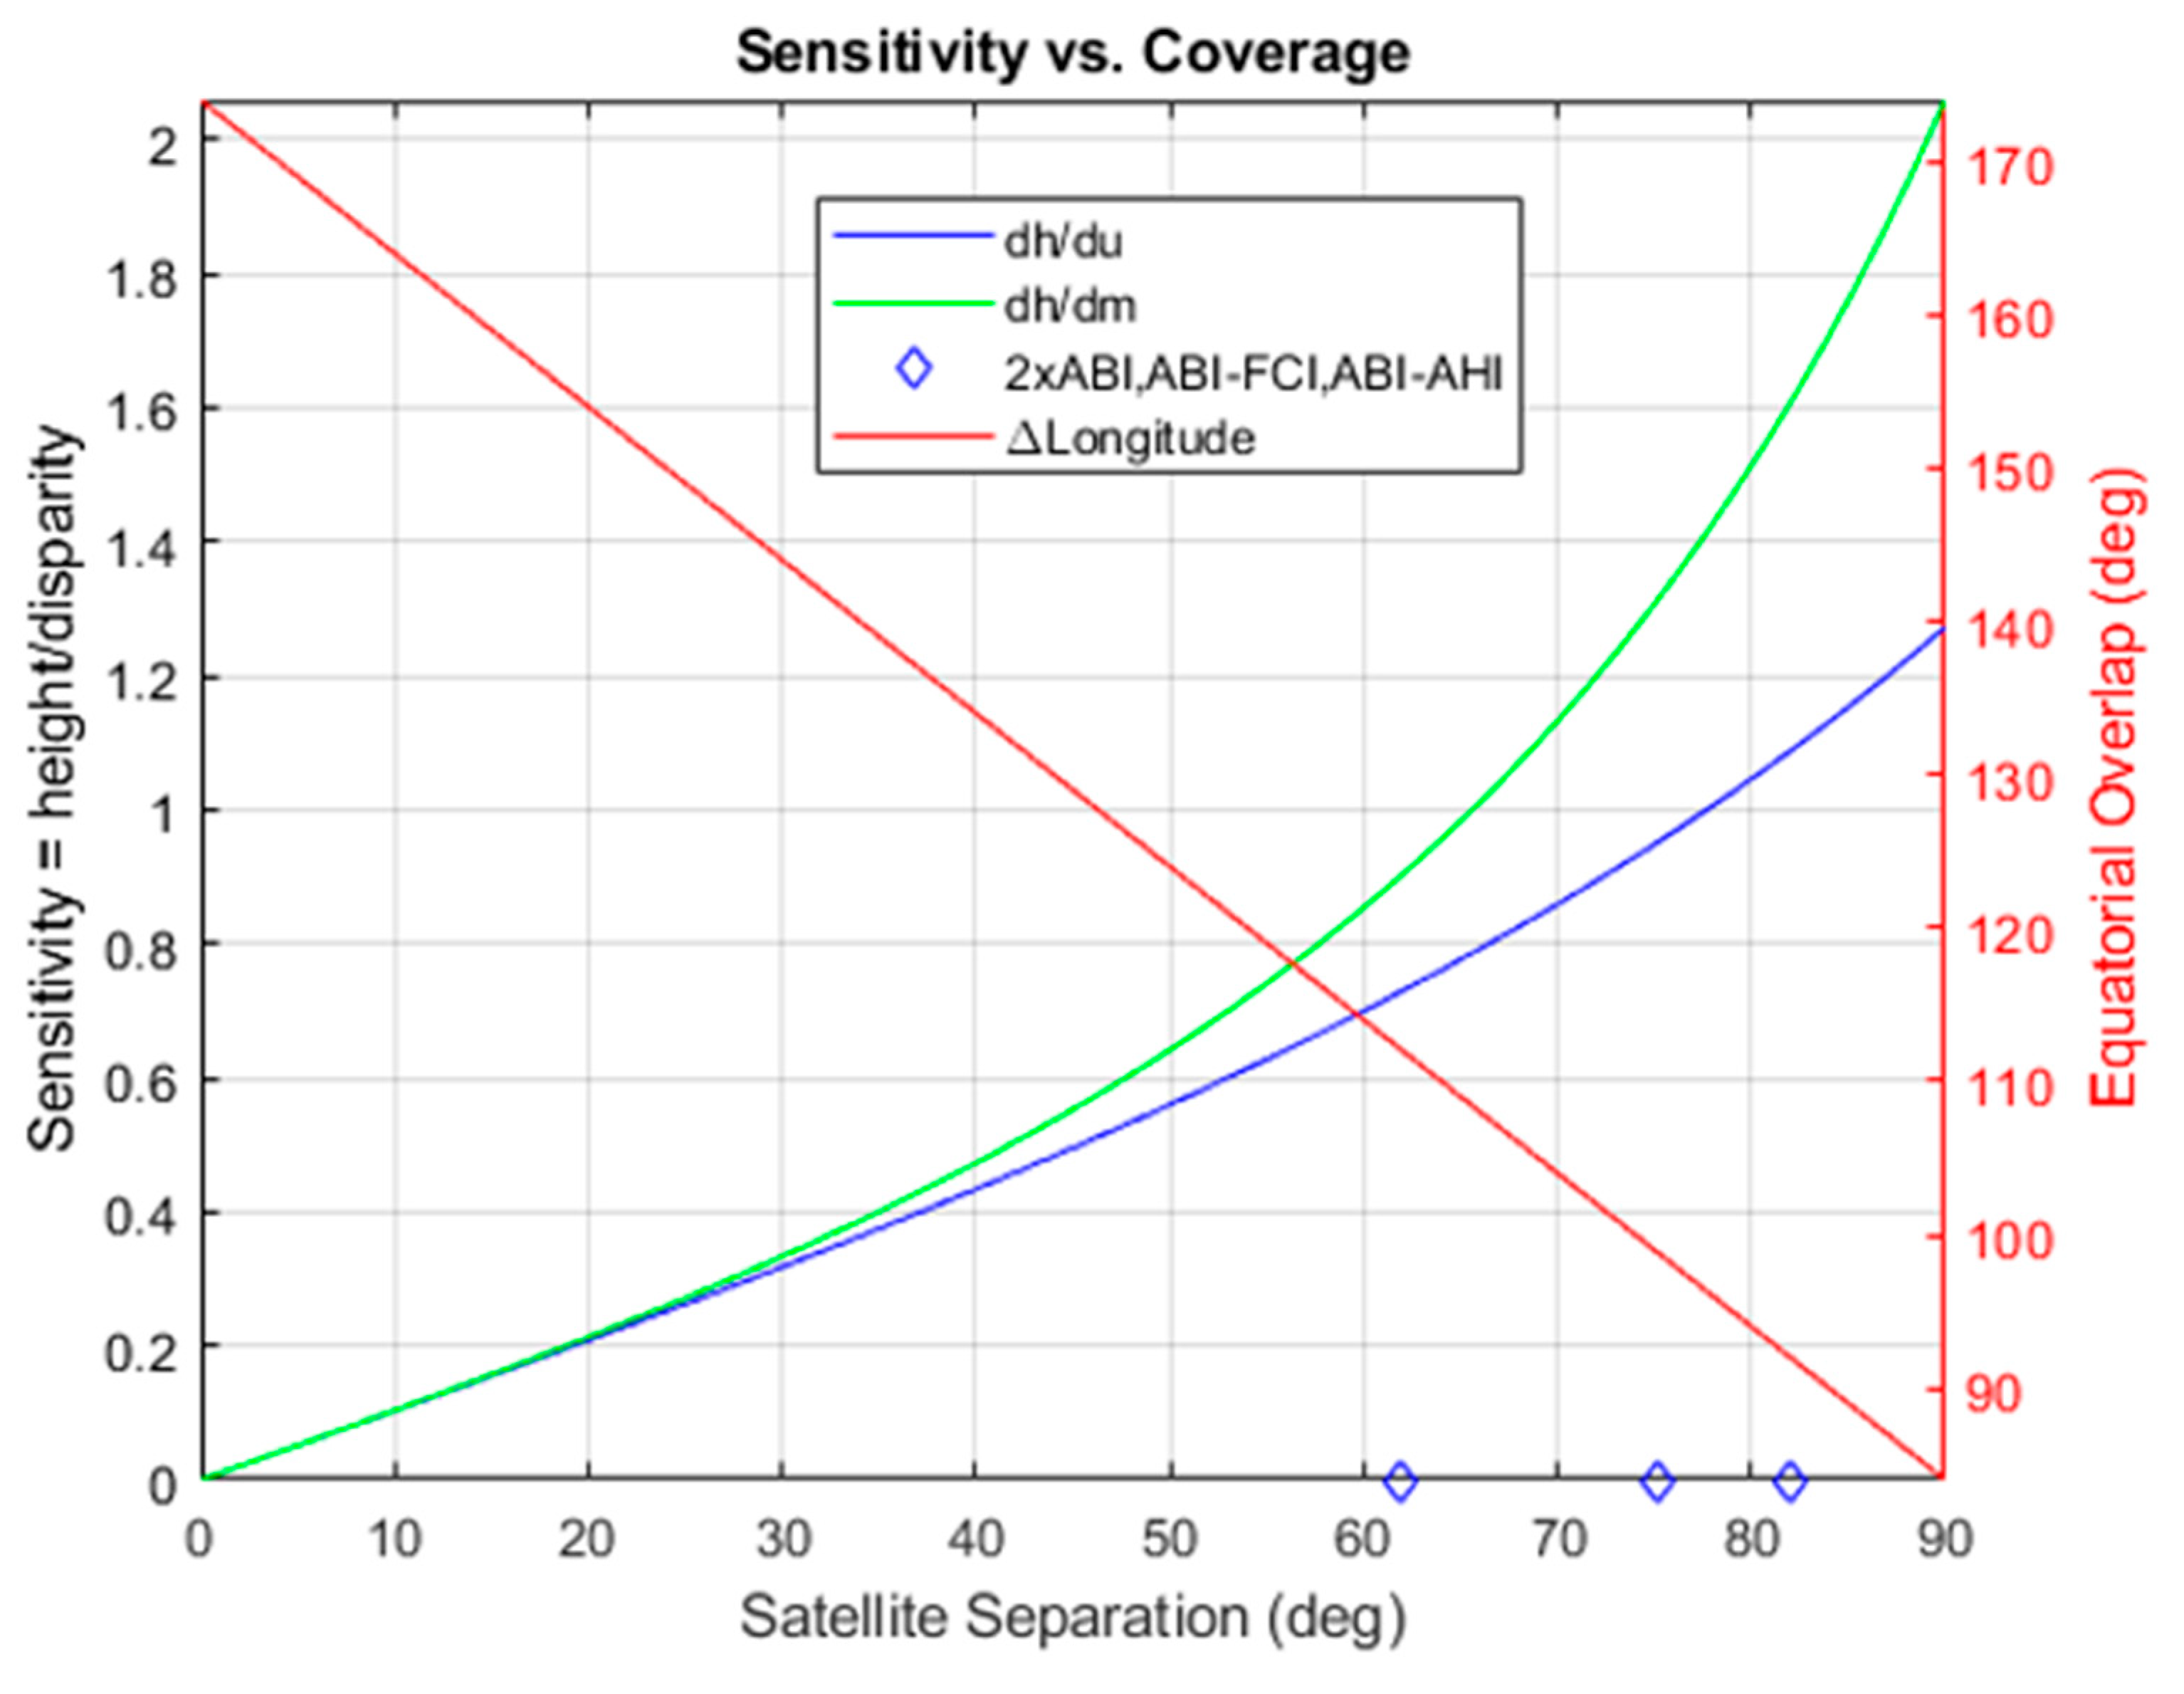
Figure 1 shows the coverage for stereo winds using the GOES-16 and -17 pairing and Himawari-8 paired with GOES-17. GOES-16 is stationed at 75.2° W (with fixed-grid reference longitude of 75° W) and GOES-17 is stationed at 137.2° W (with a fixed-grid reference longitude of 137° W). Himawari-8 is stationed at 140.7° E with the same fixed-grid reference longitude. Dual-GOES coverage is possible over much of CONUS, while the GOES-Himawari pairing covers much of the Pacific west of Hawaii. This Pacific coverage is significant in light of the LHP anomaly onboard GOES-17, which renders the height assignment problematic at certain times of the day in certain seasons but leaves cloud-motion tracking possible with IR Band 14. In such circumstances, an operational GOES wind product with proper height assignments can be created from the GOES-Himawari pairing in the AHI-ABI overlap region where otherwise there would be none. Figure 1 also shows the overlap between GOES-16 and the future Meteosat Flexible Combined Imager (FCI) [22,23]. The FCI will have spectral channels, spatial resolutions, and FD coverage cadence similar to those of ABI, making FCI an excellent candidate for stereo winds over the Atlantic where hurricanes are spawned.
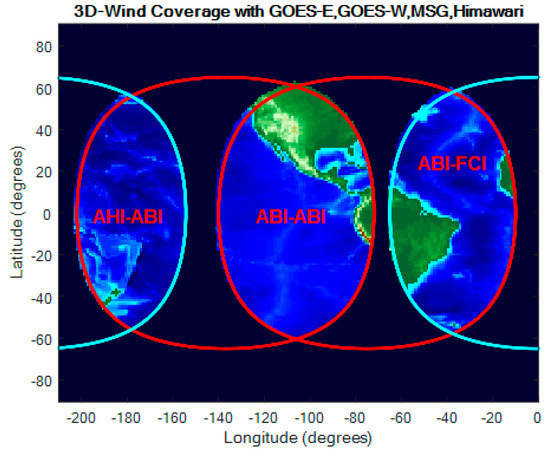
Figure 1.
Geostationary (GEO)-GEO stereo-wind products are possible in the overlaps between the coverage circles of each GEO. The circles drawn are limited to an Earth central angle (ECA) < 65° around the SSP for each of the satellites.
2.2. GOES-GEO Stereo Winds Approach
Two GEO–GEO stereo-winds codes have been developed by the authors. The NASA code is implemented in MATLAB with some C-language plugins. It has been scripted to run on the Discover supercomputer at NASA’s Goddard Space Flight Center (GSFC) to enable production of large multiday datasets. GSFC has a local archive of GOES-R imagery that is easily accessed for large production runs. The NOAA code runs on a cluster at the NOAA Center for Satellite Applications and Research (STAR) with local access to one year of GOES-R and Himawari datasets and forecast background winds, and aircraft and rawinsonde observations. It is implemented in Fortran and uses the STAR Algorithm Processing Framework (SAPF) to enable its transition into an operational context [24]. The NASA code is intended as a research tool to retrospectively process cases of interest. It allows for dense sampling of winds over designated geographic regions of interest (ROIs). The NOAA code is intended as a preoperational prototype for an Enterprise stereo-winds product, as well as being a research tool, and it is integrated with legacy cloud analysis capabilities.
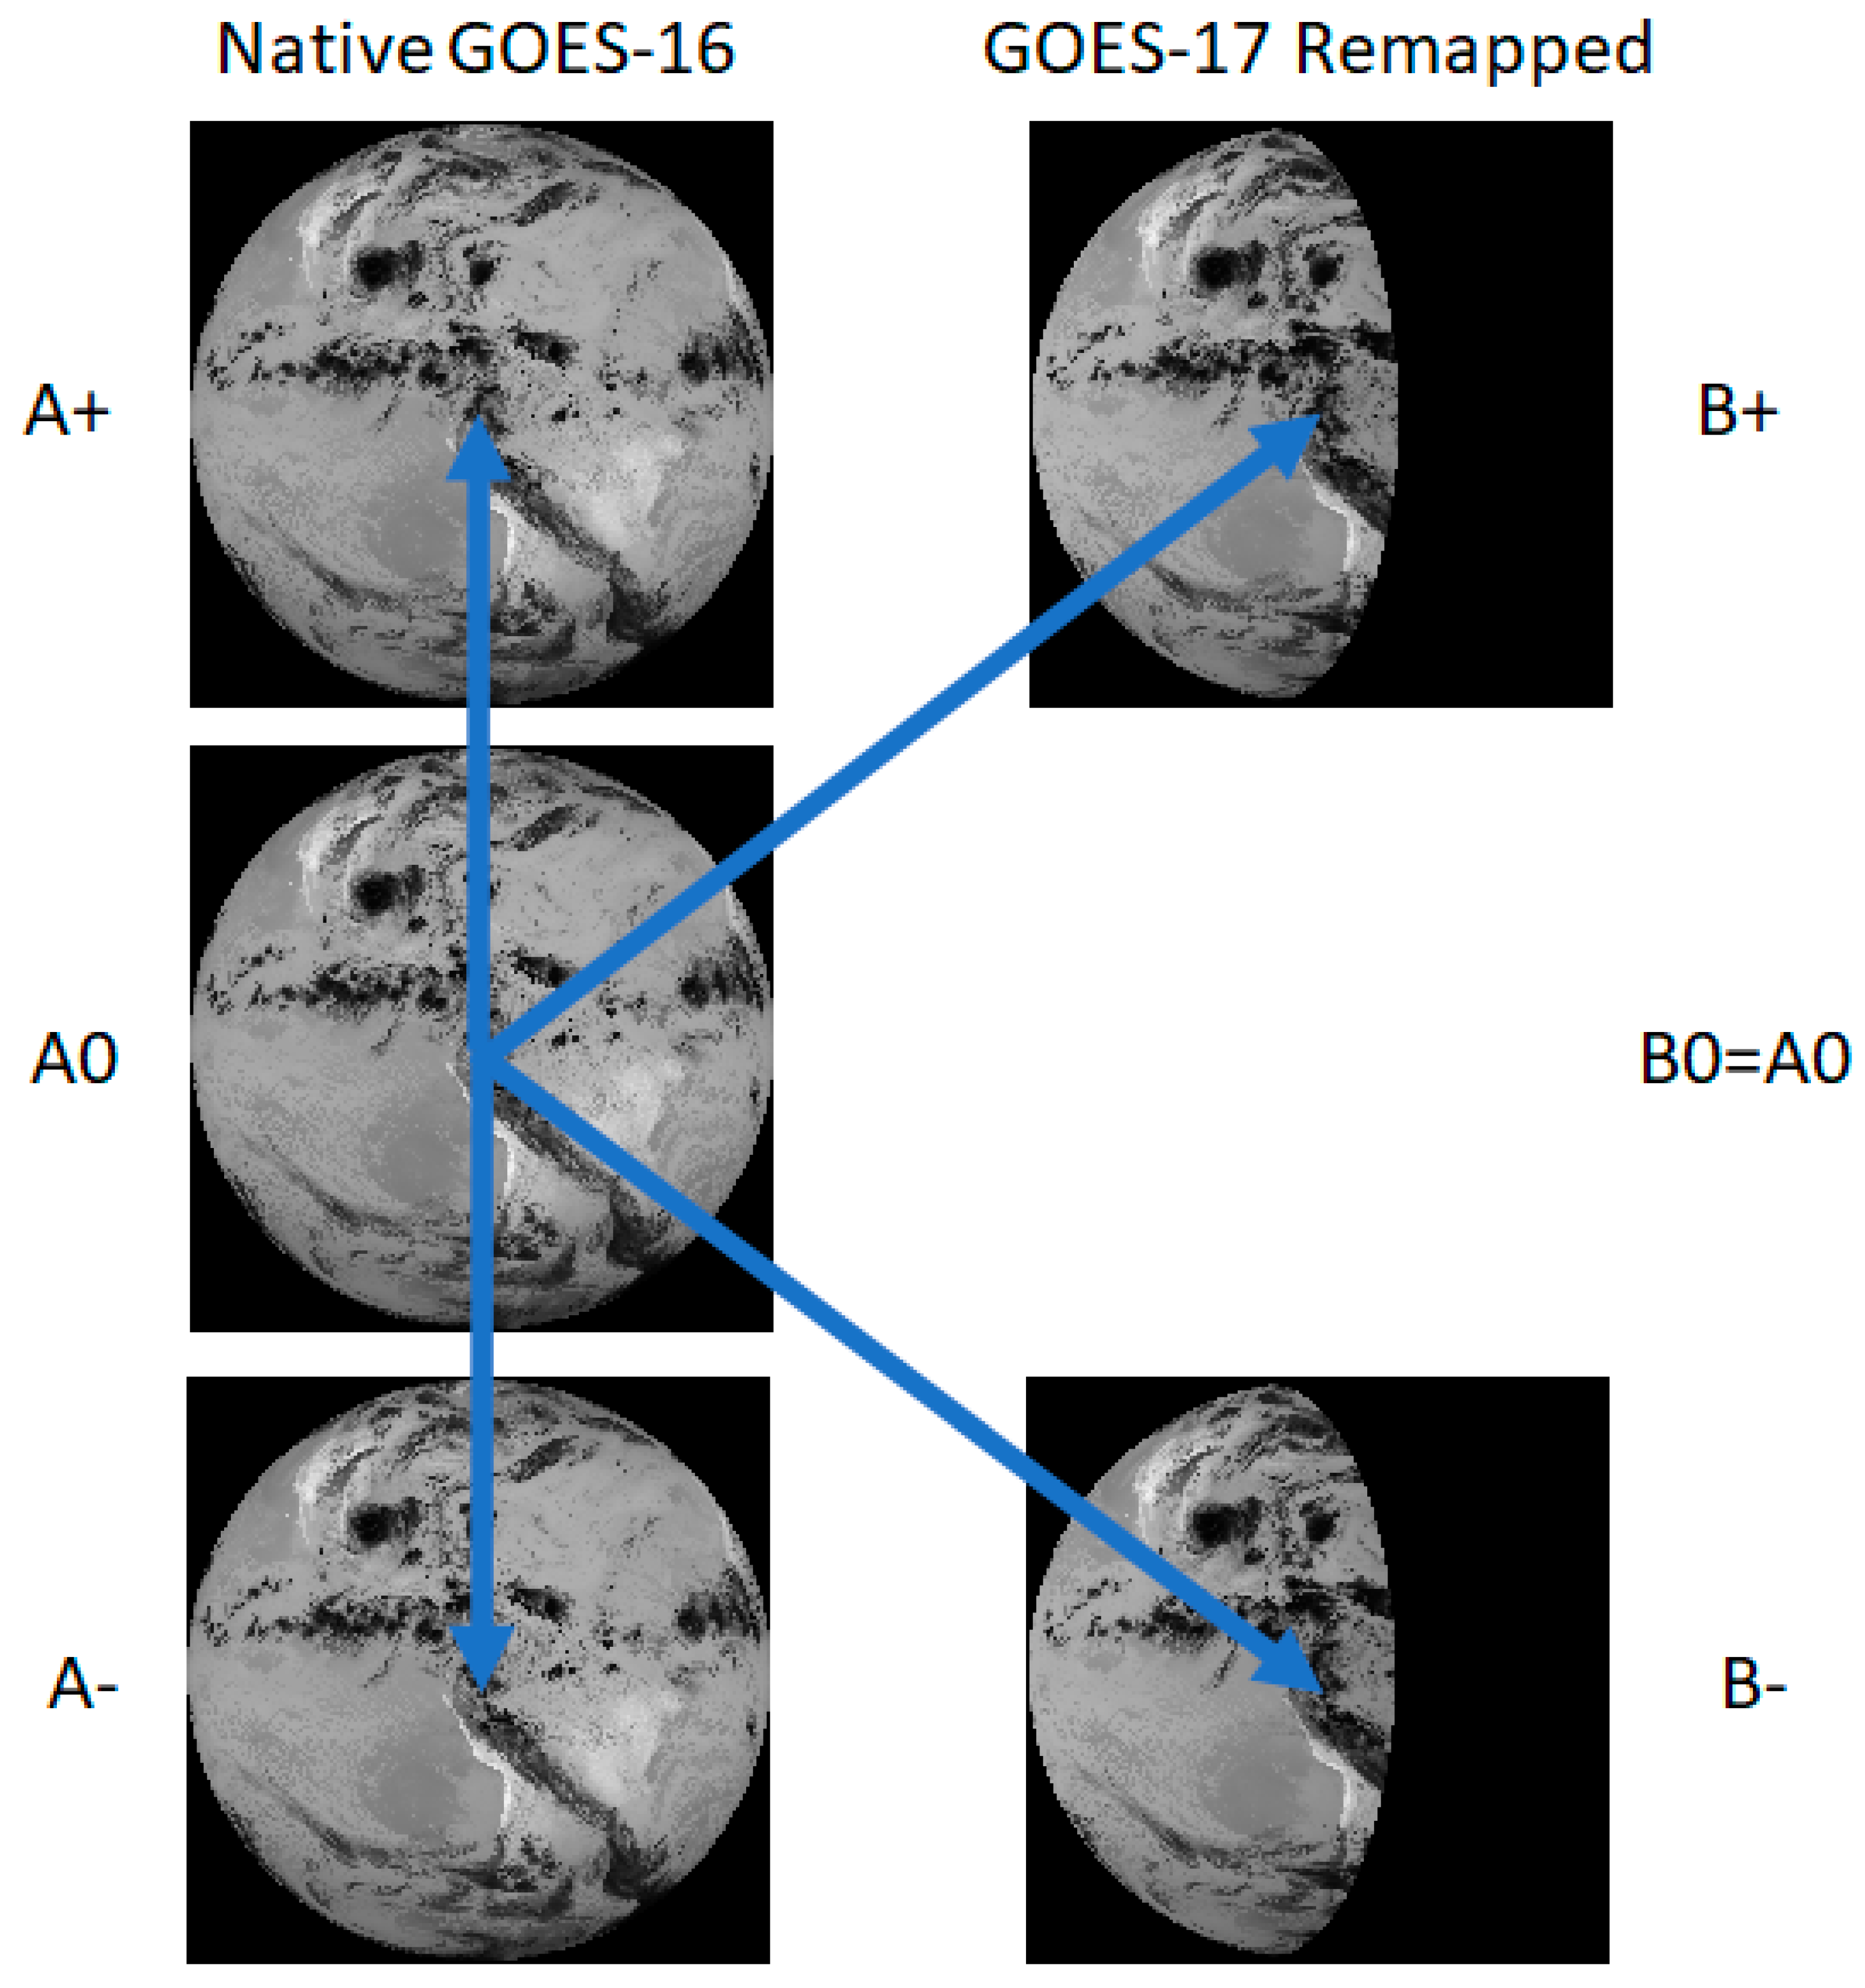
Both codes follow the common approach diagrammed in Figure 2. We designated one satellite as the “A” satellite and remapped the imagery from the other satellite (“B” satellite) into the fixed grid of the A satellite. The remapping uses look-up tables (LUTs) giving the fixed-grid addresses of the B-satellite pixels from which to form each pixel in the A satellite’s fixed grid. Bilinear resampling forms each remapped pixel from the neighboring pixels around the address in the LUT. Target templates are drawn from the middle repetition of a triplet of A satellite scenes (designated the “A0” scene). The targets are tracked in prior and forward repetitions of the A satellite’s scenes (“A−” and “A+”) and in two repetitions of the remapped B satellite’s scenes (“B−” and “B+”) as shown. The NASA code uses simple assignment of template sites on a regular grid covering the A scene and fixed-size templates. We generally sample at half the template dimensions to effectively oversample wind fields 2:1. The NOAA code inherits the tracer selection and nested tracking approach of NOAA’s operational derived motion wind (DMW) product [8]. It takes advantage of the existing DMW paradigm of processing scenes in triplets. In application to stereo winds, two triplets are processed: (A−, A0, A+) and (B−, A0, B+), both sharing the A0 scene from which the same tracking templates are taken, and providing the rationale for the “K” diagram construction in Figure 2.
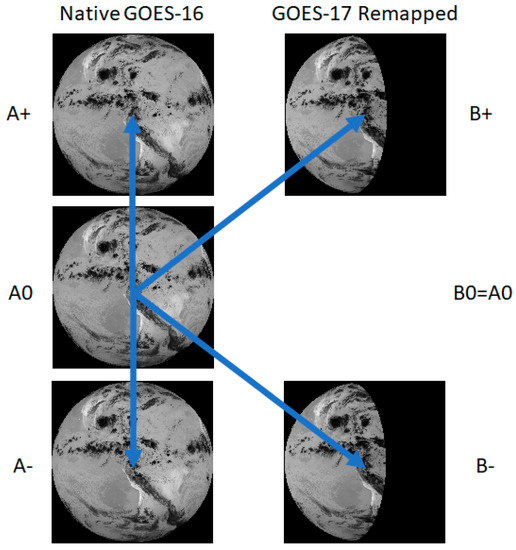
Figure 2.
The GEO–GEO stereo-wind approach uses three A satellite repetitions and two B satellite repetitions. All repetitions of the A scenes must be the same scene type and the same for the B satellite; however, A and B may be a different scene types (e.g., Continental U.S. (CONUS) for A and full disk (FD) for B). In this case, GOES-16 is the A satellite and -17 is the B satellite. The GOES-17 FDs have been remapped into the fixed grid of GOES-16 leaving an area to the east where no remapped pixels could be constructed since they are over the GOES-17 horizon. Band 14 radiances are shown with an arrow to indicate matching for feature tracking with all templates taken from the A0 scene.
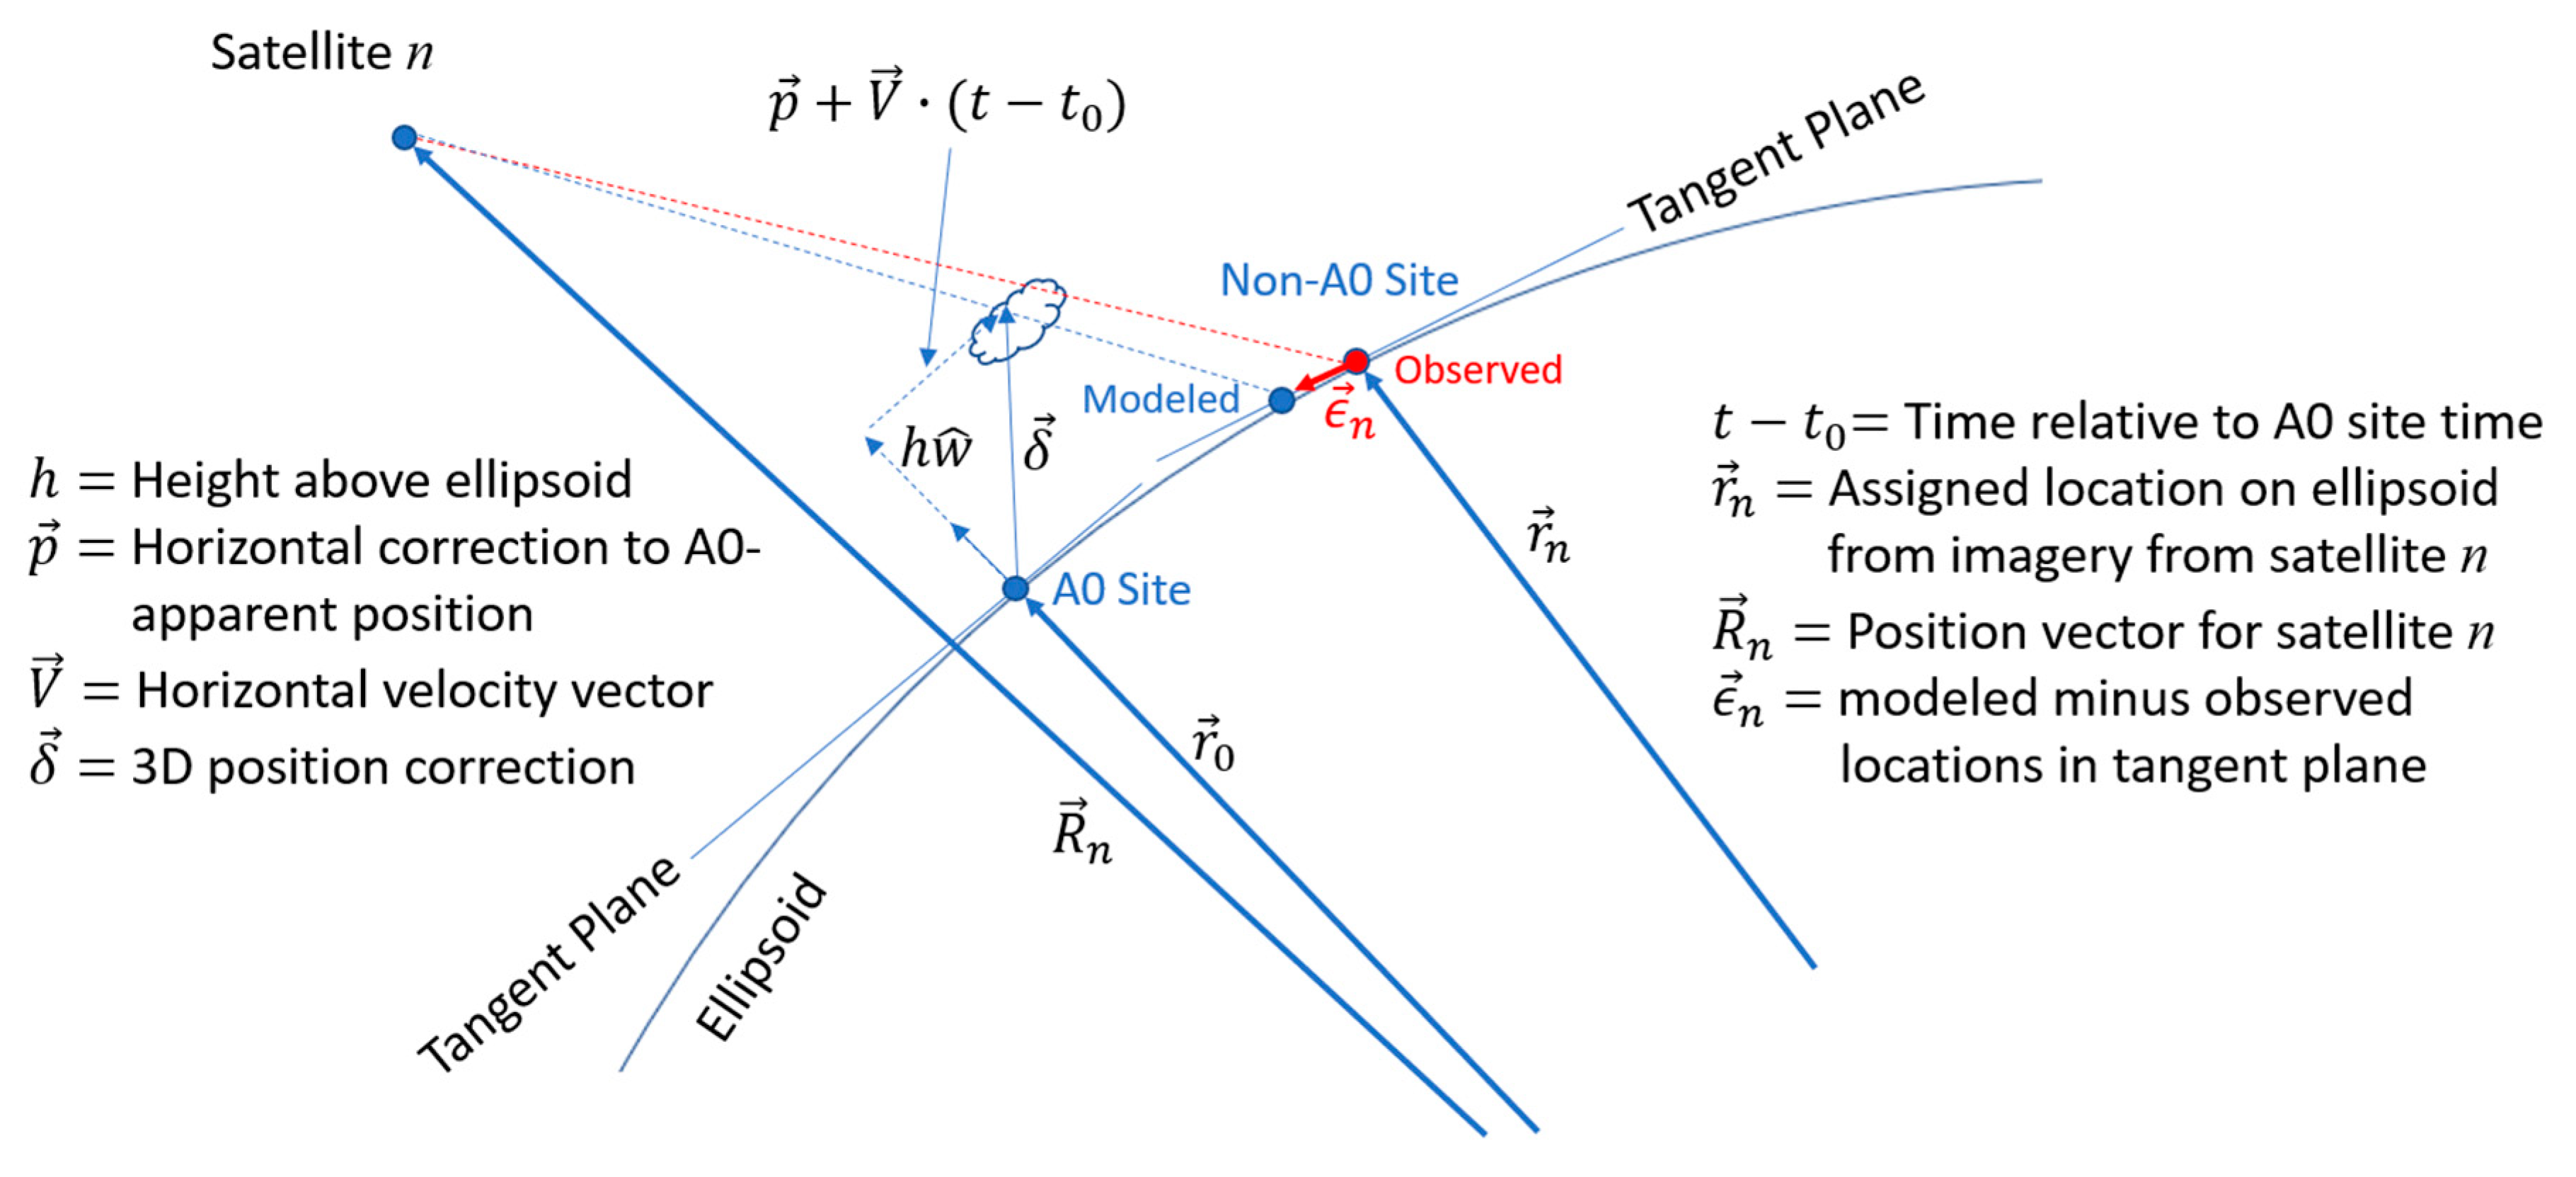
Pattern matching between A0 and A± reveals only cloud or water-vapor feature motion, since they are seen from a common vantage point, while matching between A0 and B± reveals a combination of motion and parallax. The retrieval model unwraps the two and provides estimates of five scalar state variables (“states”) to describe the wind for each A0 site. One state is an altitude () for the tracked feature above the WGS-84 ellipsoid, two states represent a horizontal position correction (), and the remaining two states represent a horizontal wind velocity (). We constructed a local coordinate system at the ellipsoid site for each A0 template and resolve vectors into -components along the cardinal directions in the tangent plane (east along the ellipsoid surface, north along the ellipsoid surface, and local vertical) as is shown in Figure 3. The states describe a displacement of the tracked feature in time from the fixed-grid position vector of the A0 site on the ellipsoid () according to , where the vectors and only have components in the -plane and is the time assignment relative to the A0 template:
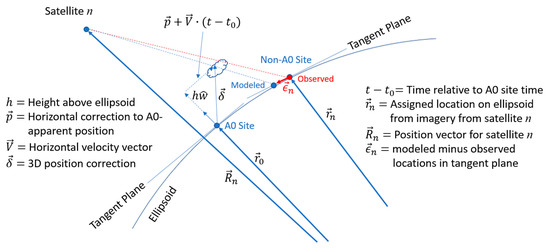
Figure 3.
The states model the position of the tracked feature relative to its apparent location (“A0 Site”) as seen in the A0 imagery, with the optimal state being the one the makes the modeled distance from each observed site minimum in a least-squares sense.
Retrievals for the five states were attempted when there were four successful matches. Each match provided the ellipsoid locations for where the feature represented in the A0 template was found in the A± and B± fixed grids under the assumption that a translation locally describes the change in the feature between compared images. The four apparent translation measurements are called “disparities”, borrowing the term from the field of computer vision. Disparities are measured to subpixel precision using interpolation in the feature matching process. The NASA code uses normalized cross correlation (NCC) with interpolation on an NCC-coefficient surface [25] and the NOAA code uses nested tracking based on a Euclidean norm measure of image similarity with clustering of nested subtemplate matches [8]. Therefore, each disparity measurement provides two displacement components, for a total of eight measurements, from which to calculate the apparent locations of the tracked feature on the ellipsoid as seen by each non-A0 satellite, for {A−, A+, B−, B+}. We estimated the five states by weighted least-squares minimization of the distances in the tangent plane between the observed and modeled locations for the feature, , across all four pairings with A0:
In general, not all can be simultaneously zero but only as close to zero as the weighted () least-squares solution allows. The states that minimizes is found iteratively by nonlinear optimization since is mildly nonlinear in . The assumption that the five states are constant during the observing timespan is implicit in our model. The retrieval process just described was first used in our previous stereo-winds work with GOES and the Multi-angle Imaging SpectroRadiometer (MISR) instrument on NASA’s Terra spacecraft [10] and then with the Moderate Resolution Imaging Spectroradiometer (MODIS) instrument on NASA’s Terra and Aqua spacecraft [11]. A full derivation of the least-squares solution is provided in the Appendix A of the MISR-GOES paper. It includes a coupling between problem states at different sites to represent systematic errors between the MISR and GOES imagery. In the GEO–GEO problem, the solutions at different sites are independent of each other.
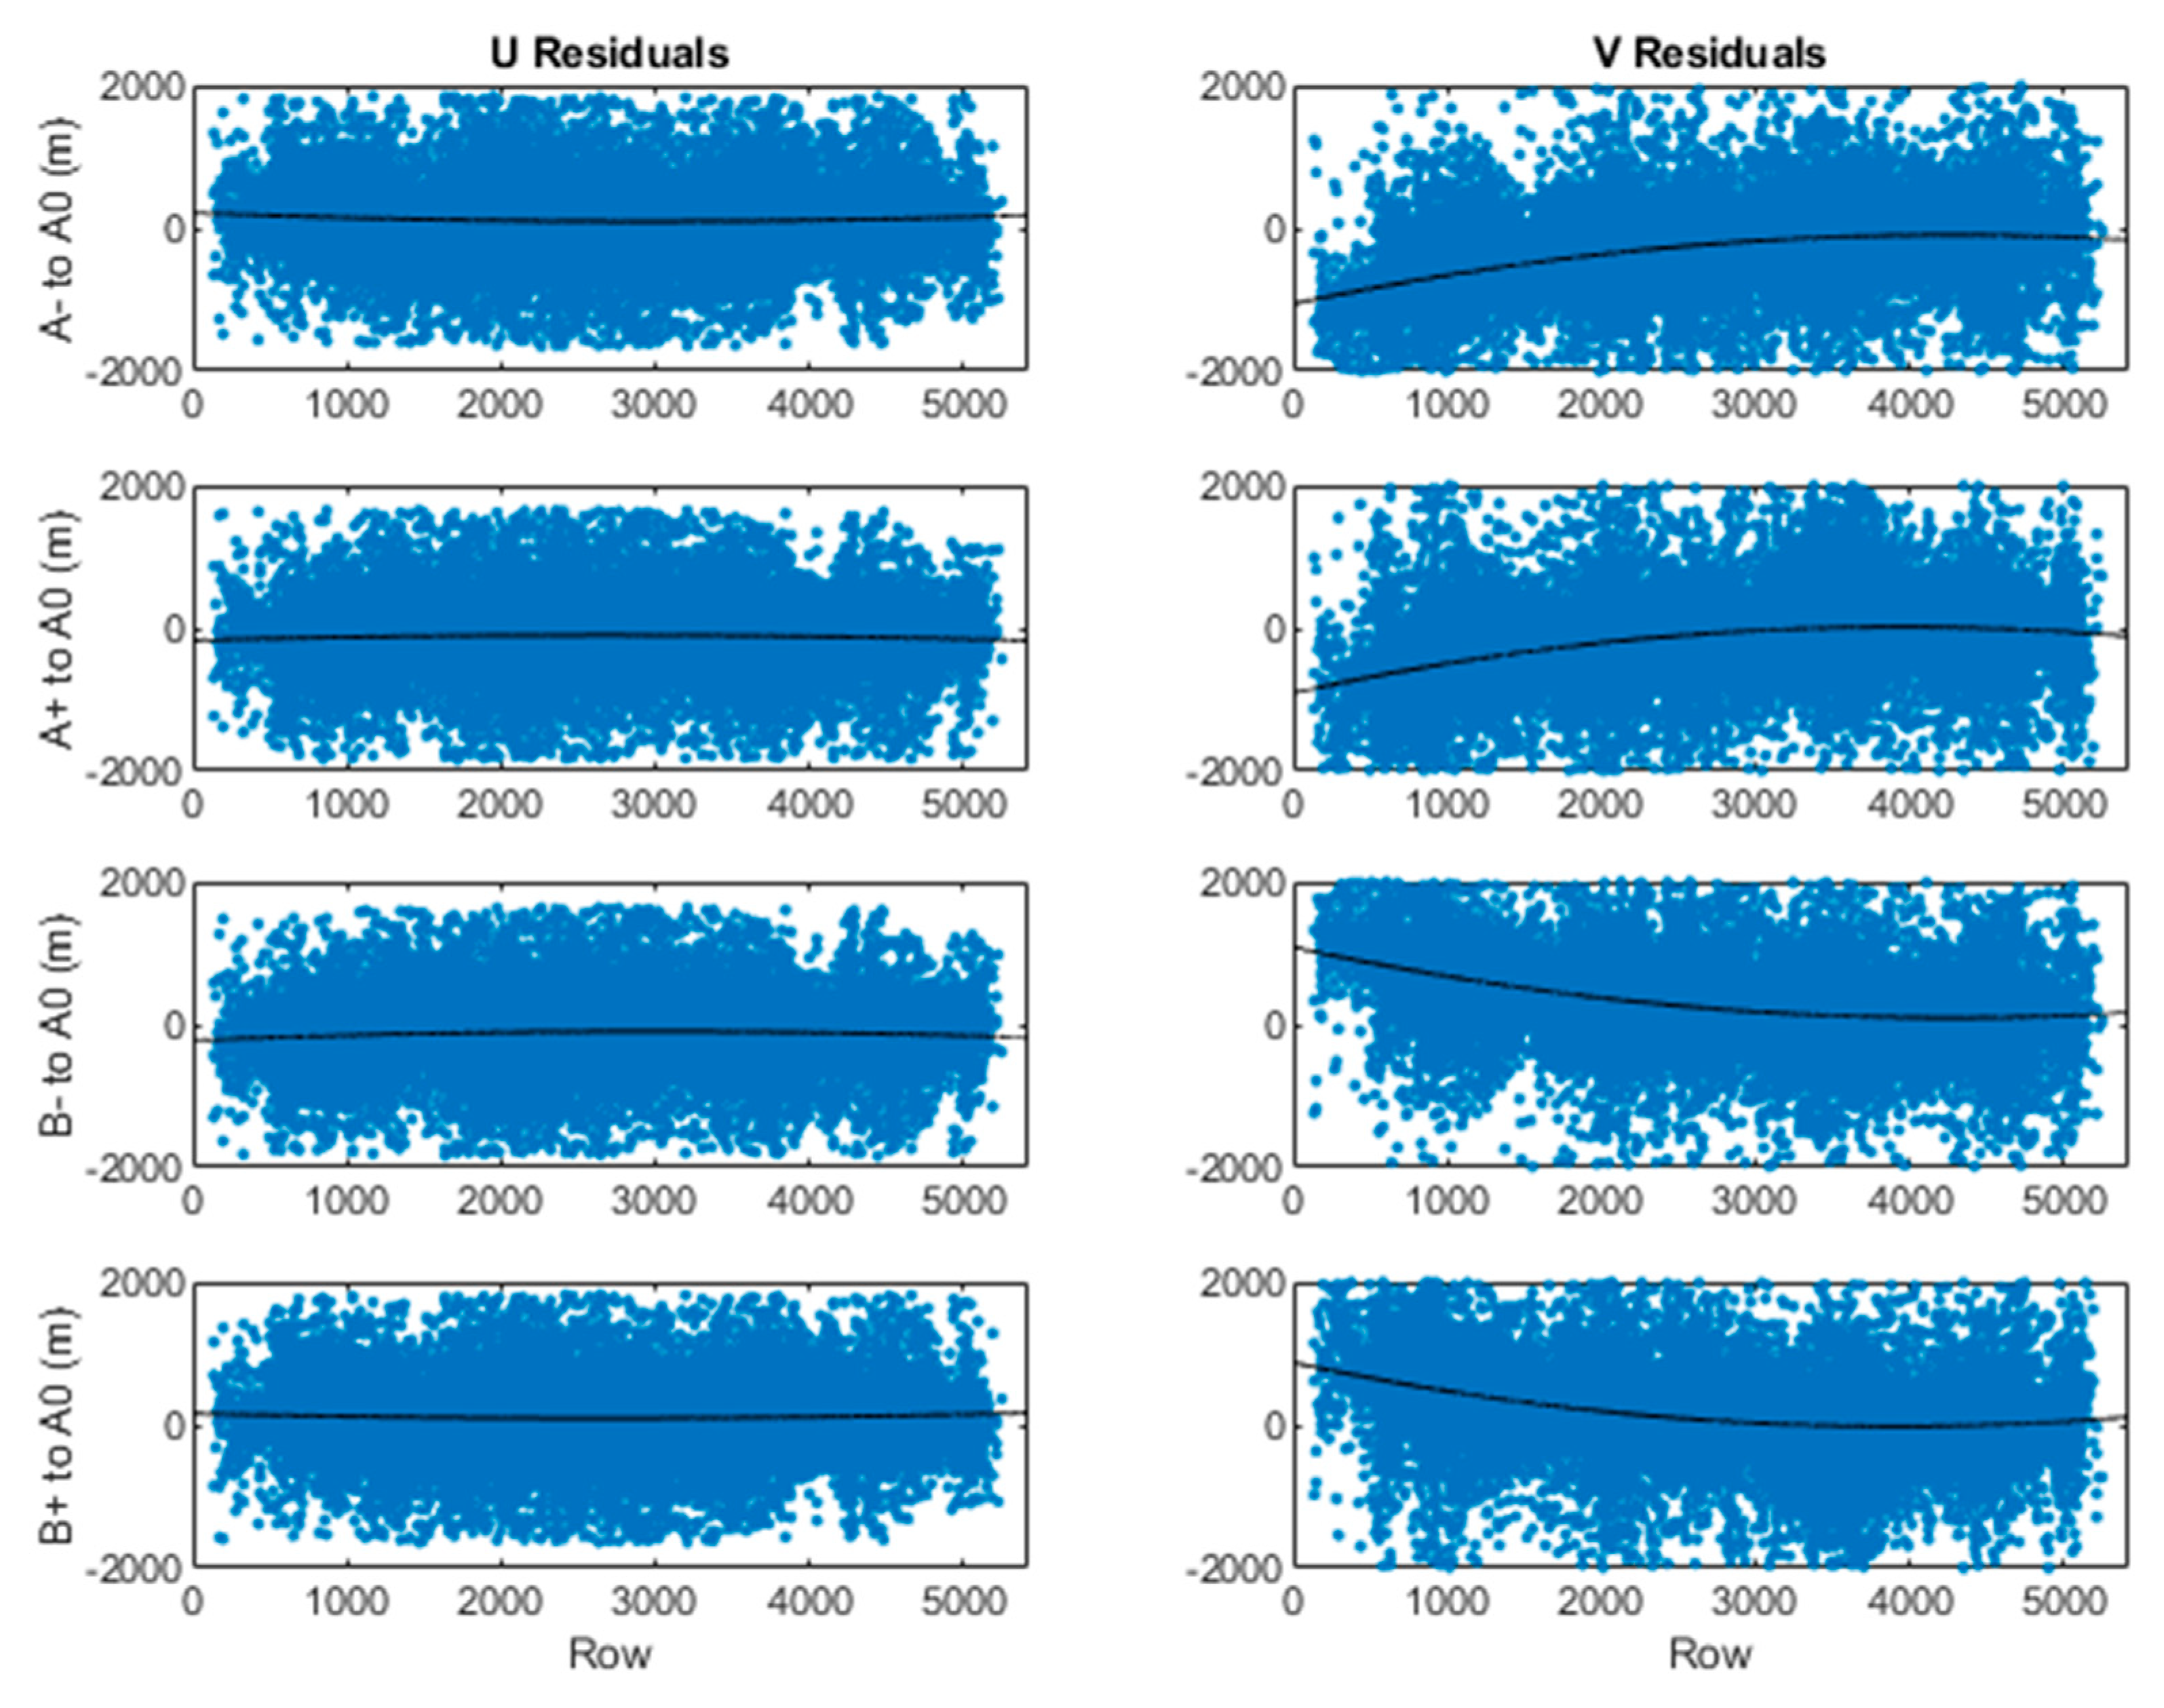
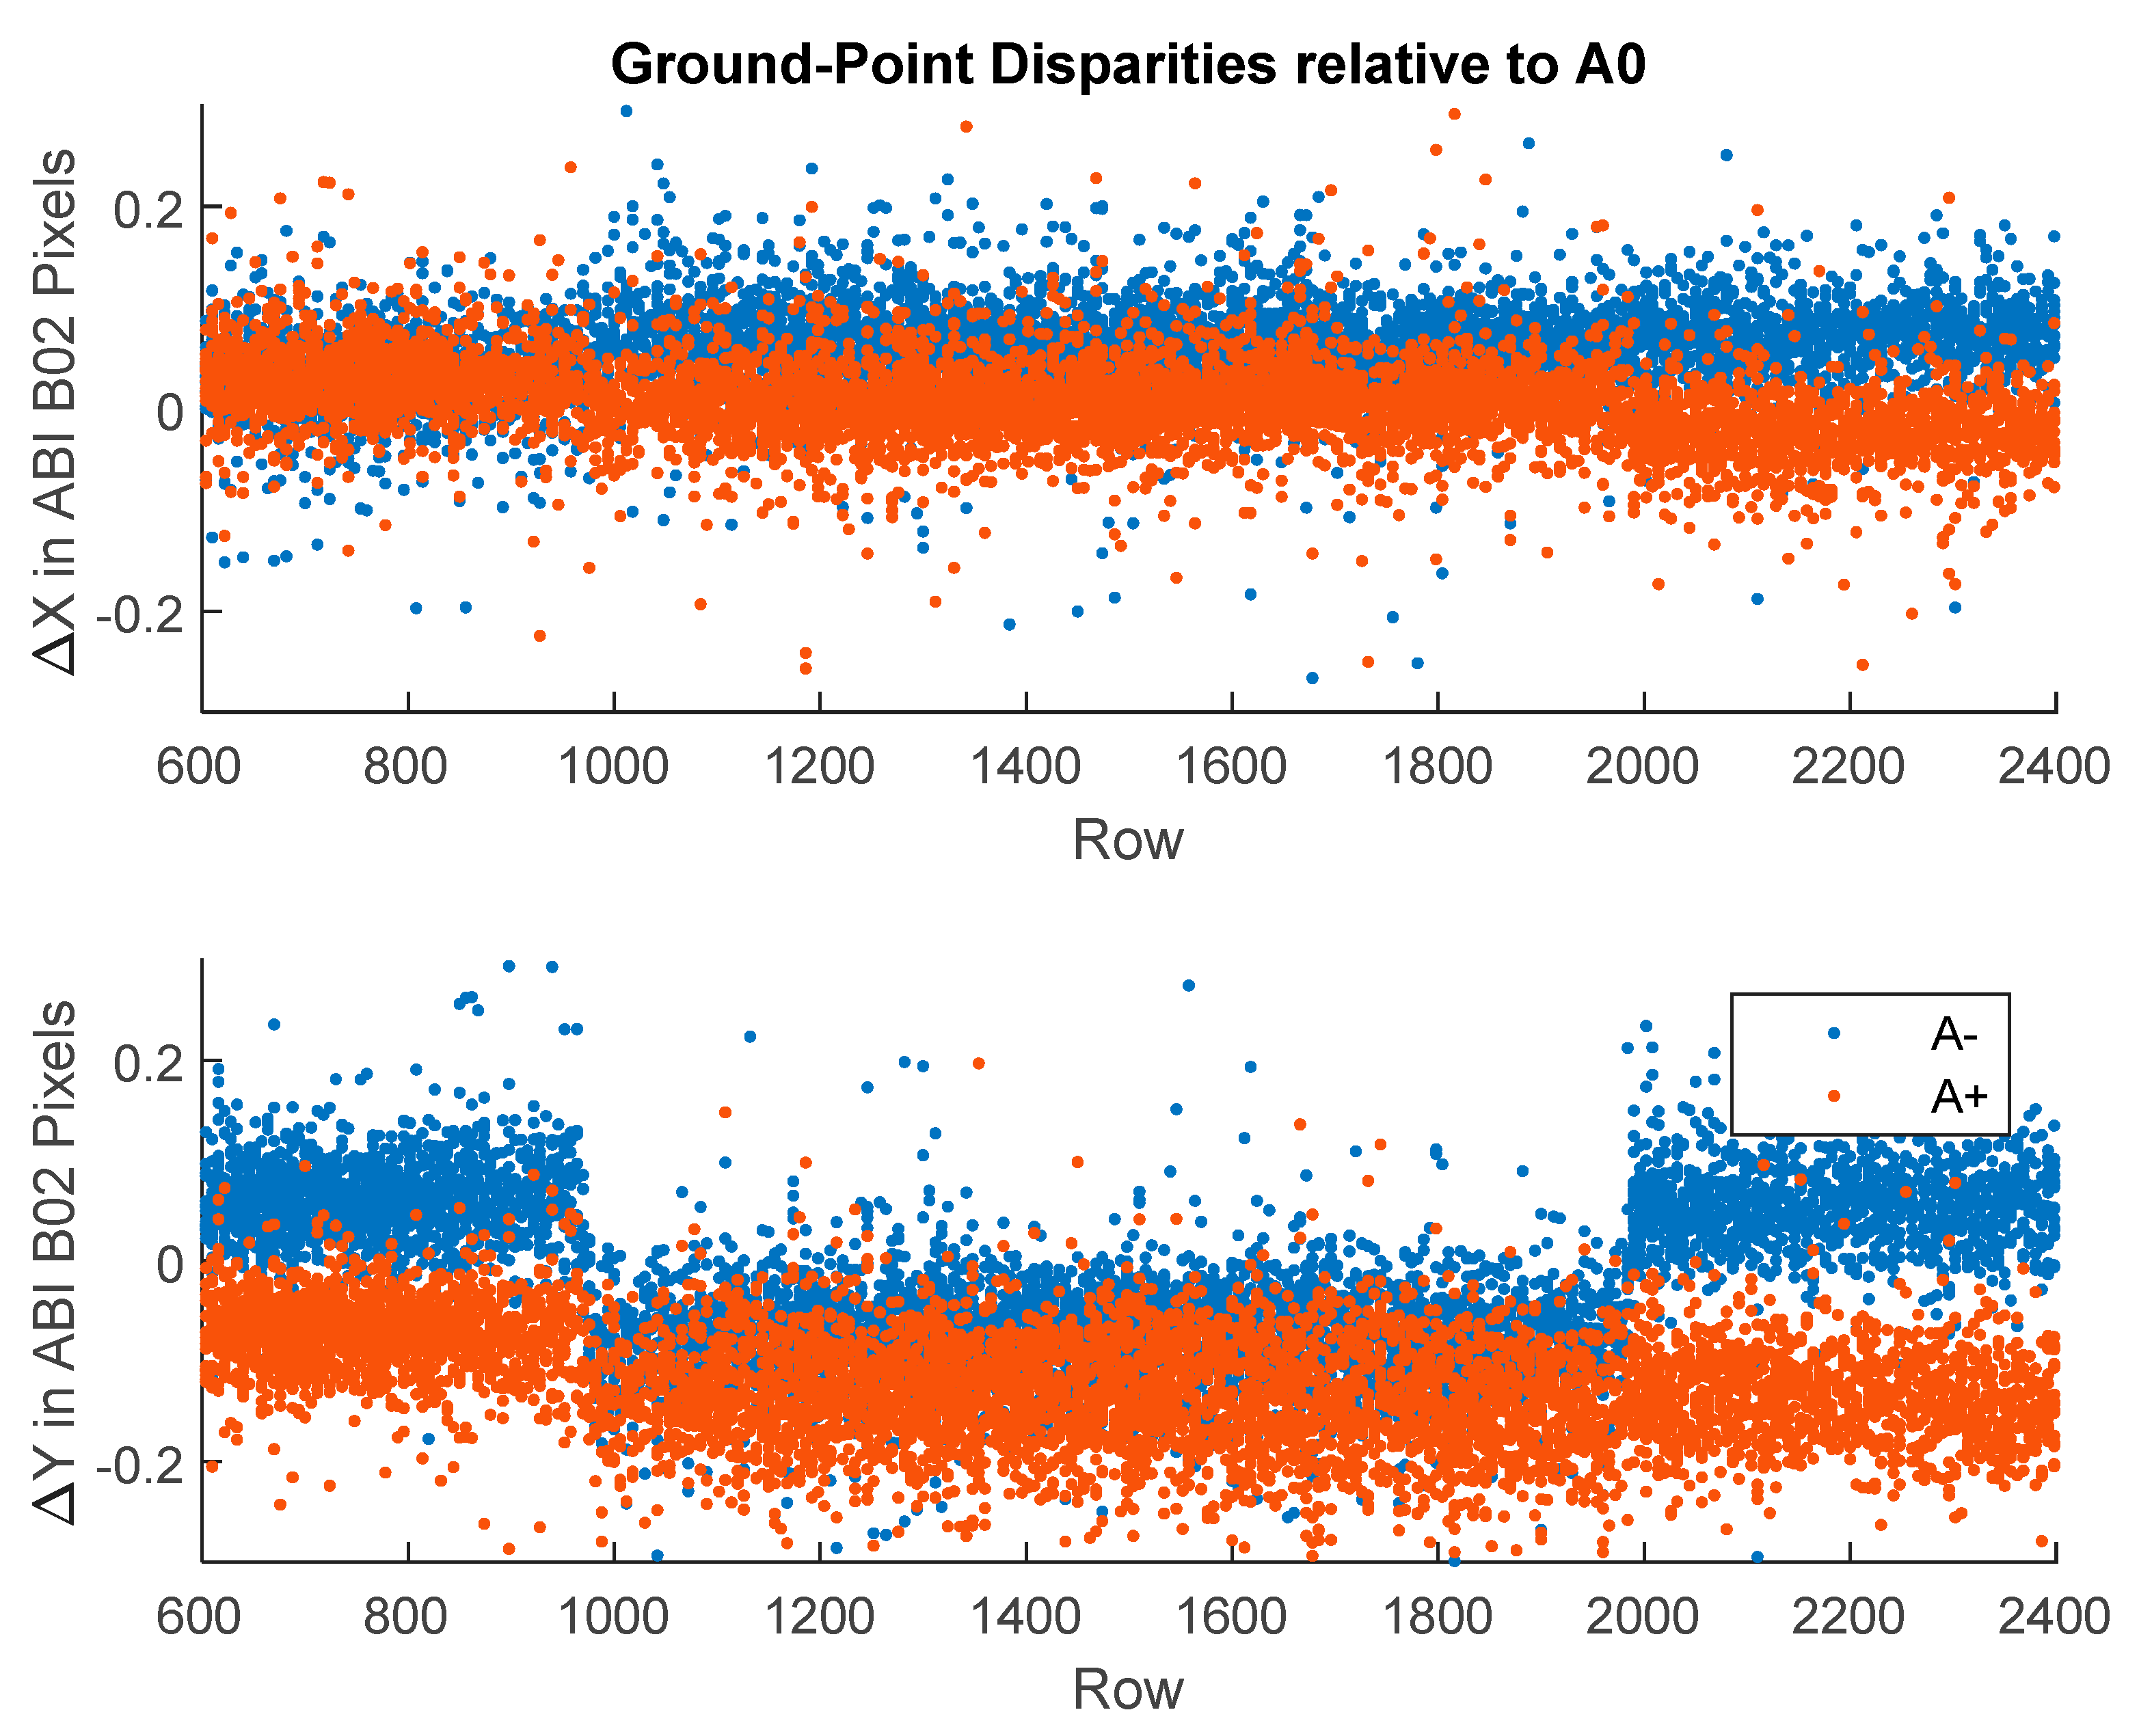
The residuals assuming the estimated states , , provide a measure of how well the disparities are explained by the retrieval model. Plots across of across the population of all retrievals (Figure 4) could reveal small systematic error signatures and anomalous cases where the model did not explain the data. We marked anomalous retrievals with a data quality flag (DQF) to indicate a poor retrieval (i.e., DQF = 1 versus a nominal value of 0). Anomalous cases are identified statistically, with a gross-error test with a fixed threshold on each , an optional median absolute deviation (MAD) filter on the collection of all , or the first followed by the second.
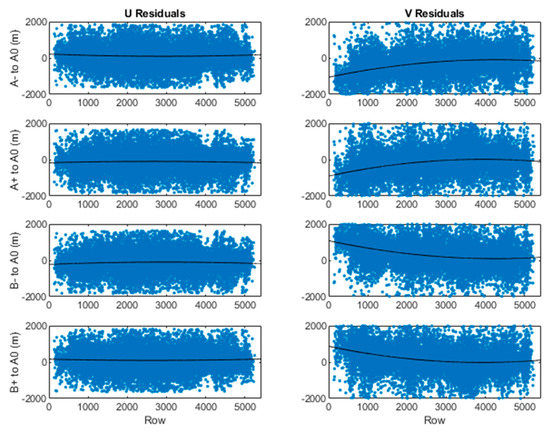
Figure 4.
Residuals for an ABI-AHI FD pair show the signature of a small of systematic error in the Band 14 imagery for Himawari in relation to that of GOES-17. Least-squares second-degree fits are overplotted. For context, an IR resolution element is 2 km at SSP.
Our organization of the processing into two matching steps in triplets (A−, A0, A+) and (B−, A0, B+) is convenient with respect to adding stereo capabilities to NOAA’s operational wind product codes; however, alternative schemes are also possible. Our MODIS-GEO stereo-winds code, with GEO meaning either GOES-R or Himawari, works according to a different scheme. It gathers matches from an (A−, A0, A+) triplet and matches between A0 and a sequence of MODIS granules remapped into the A satellite fixed grid. This scheme provides six measurements for each five-state retrieval, which is still overdetermined, but less so and hence less robust. This would be analogous matching from an (A−, A0, A+) triplet and adding a B0-A0 pair. If the A and B satellite image acquisition were synchronized, the B0-A0 pairing would reveal only parallax, which would be an advantage. However, the construction of the retrieval model with an explicit reference to time in Equation (1) allows its use where image acquisitions by the two satellites are not synchronized. The MODIS-GEO and MISR-GEO applications are two examples. Additionally allowed is a CONUS frame from one GOES-R satellite paired with the FD from another satellite. We discuss pixel times next, knowledge of which enables our algorithm to work without synchronizing the observing systems.
2.3. Pixel Time Tags
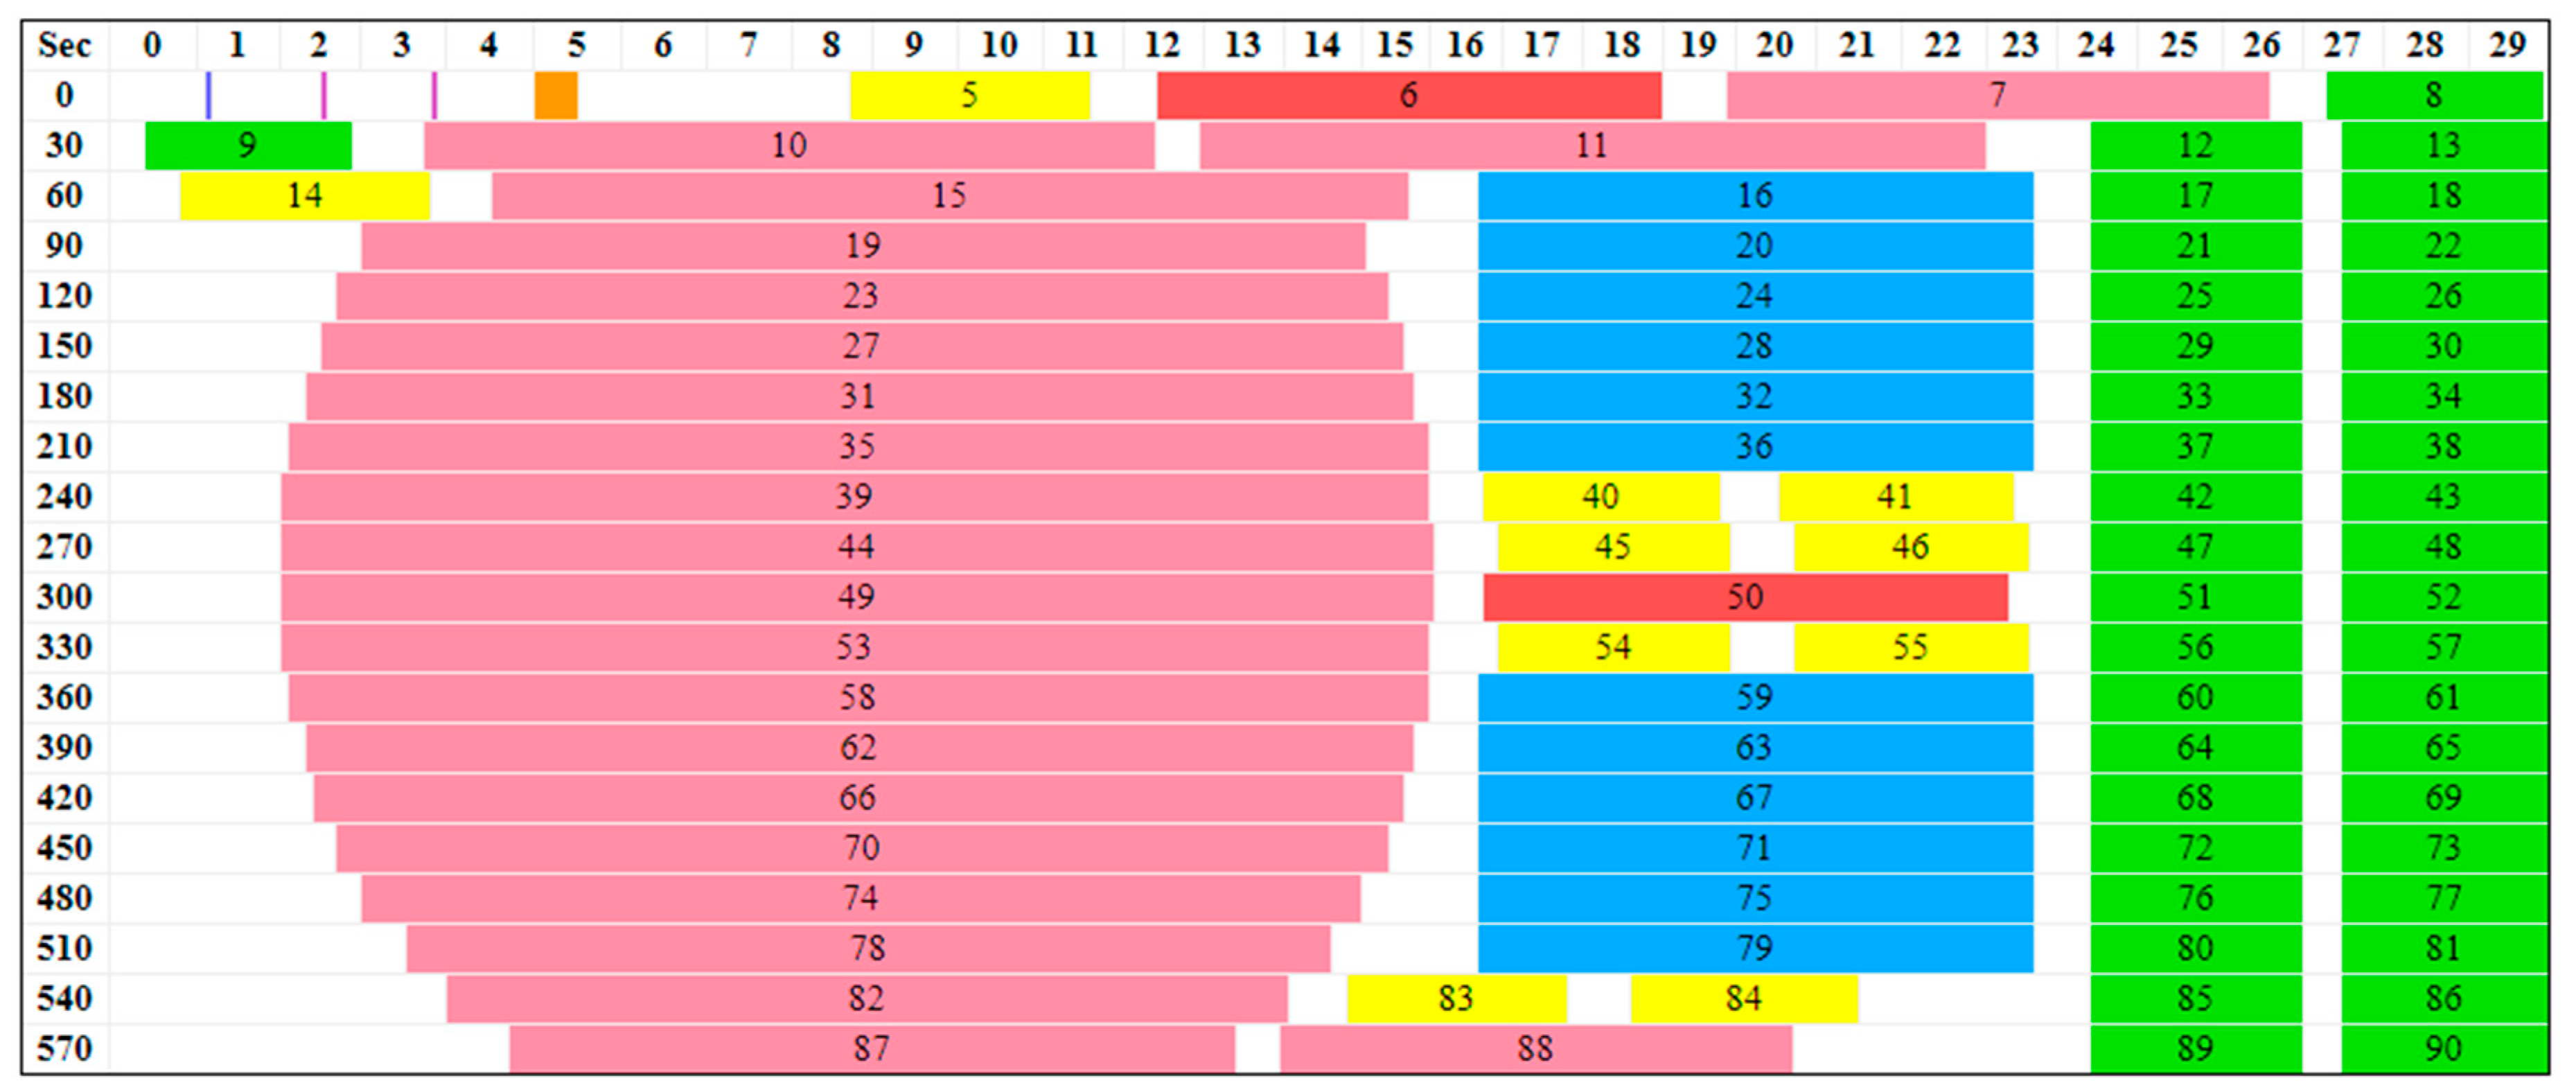
Time-tag metadata for individual ABI pixels are not provided with the ABI Level-1 product, but time metadata are provided within the AHI product files [26]. We can derive the AHI pixel times directly from this temporal metadata, but ABI pixel times must be modeled considering the ABI observational mode and timeline version. Figure 5 is an example of an ABI Mode 6 timeline showing the schedule of activities that ABI conducts within a 10-min period. It consisted of a single repetition of the FD, two repetitions of a CONUS, and 10 MESO repetitions. The ABI FD was covered in 22 scan swaths, the CONUS was covered in six scan swaths, and each MESO was covered in two back-to-back swaths. The ABI product time indicates the time of the first Band 2 detector sample used to form the product. We added an offset from our ABI pixel time model and an adjustment for the spectral band to account for the in-field separation of the detectors of different spectral channels relative to centerline of the focal planes. The time models consist of a LUT for each 2 km pixel in each scene and are included in the Supplementary Materials accompanying this paper as files in the network Common Data Form (netCDF). The time-model LUTs will require revisions as different timelines are defined and used operationally and possibly when there are new releases of the ground Level-1 processing software. Our method for creating the time-model LUTs is described in the Appendix A.
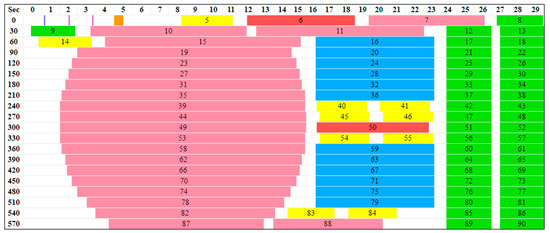
Figure 5.
A GOES timeline for ABI Mode 6 (version 5B) shows twenty 30 s segments in which 22 swaths (salmon) complete one FD, six swaths (blue) make each of two CONUS scenes, and 40 swaths (green) make either one or two mesoscale (MESO) scenes. Other activities such as calibrations and star acquisitions are also shown.
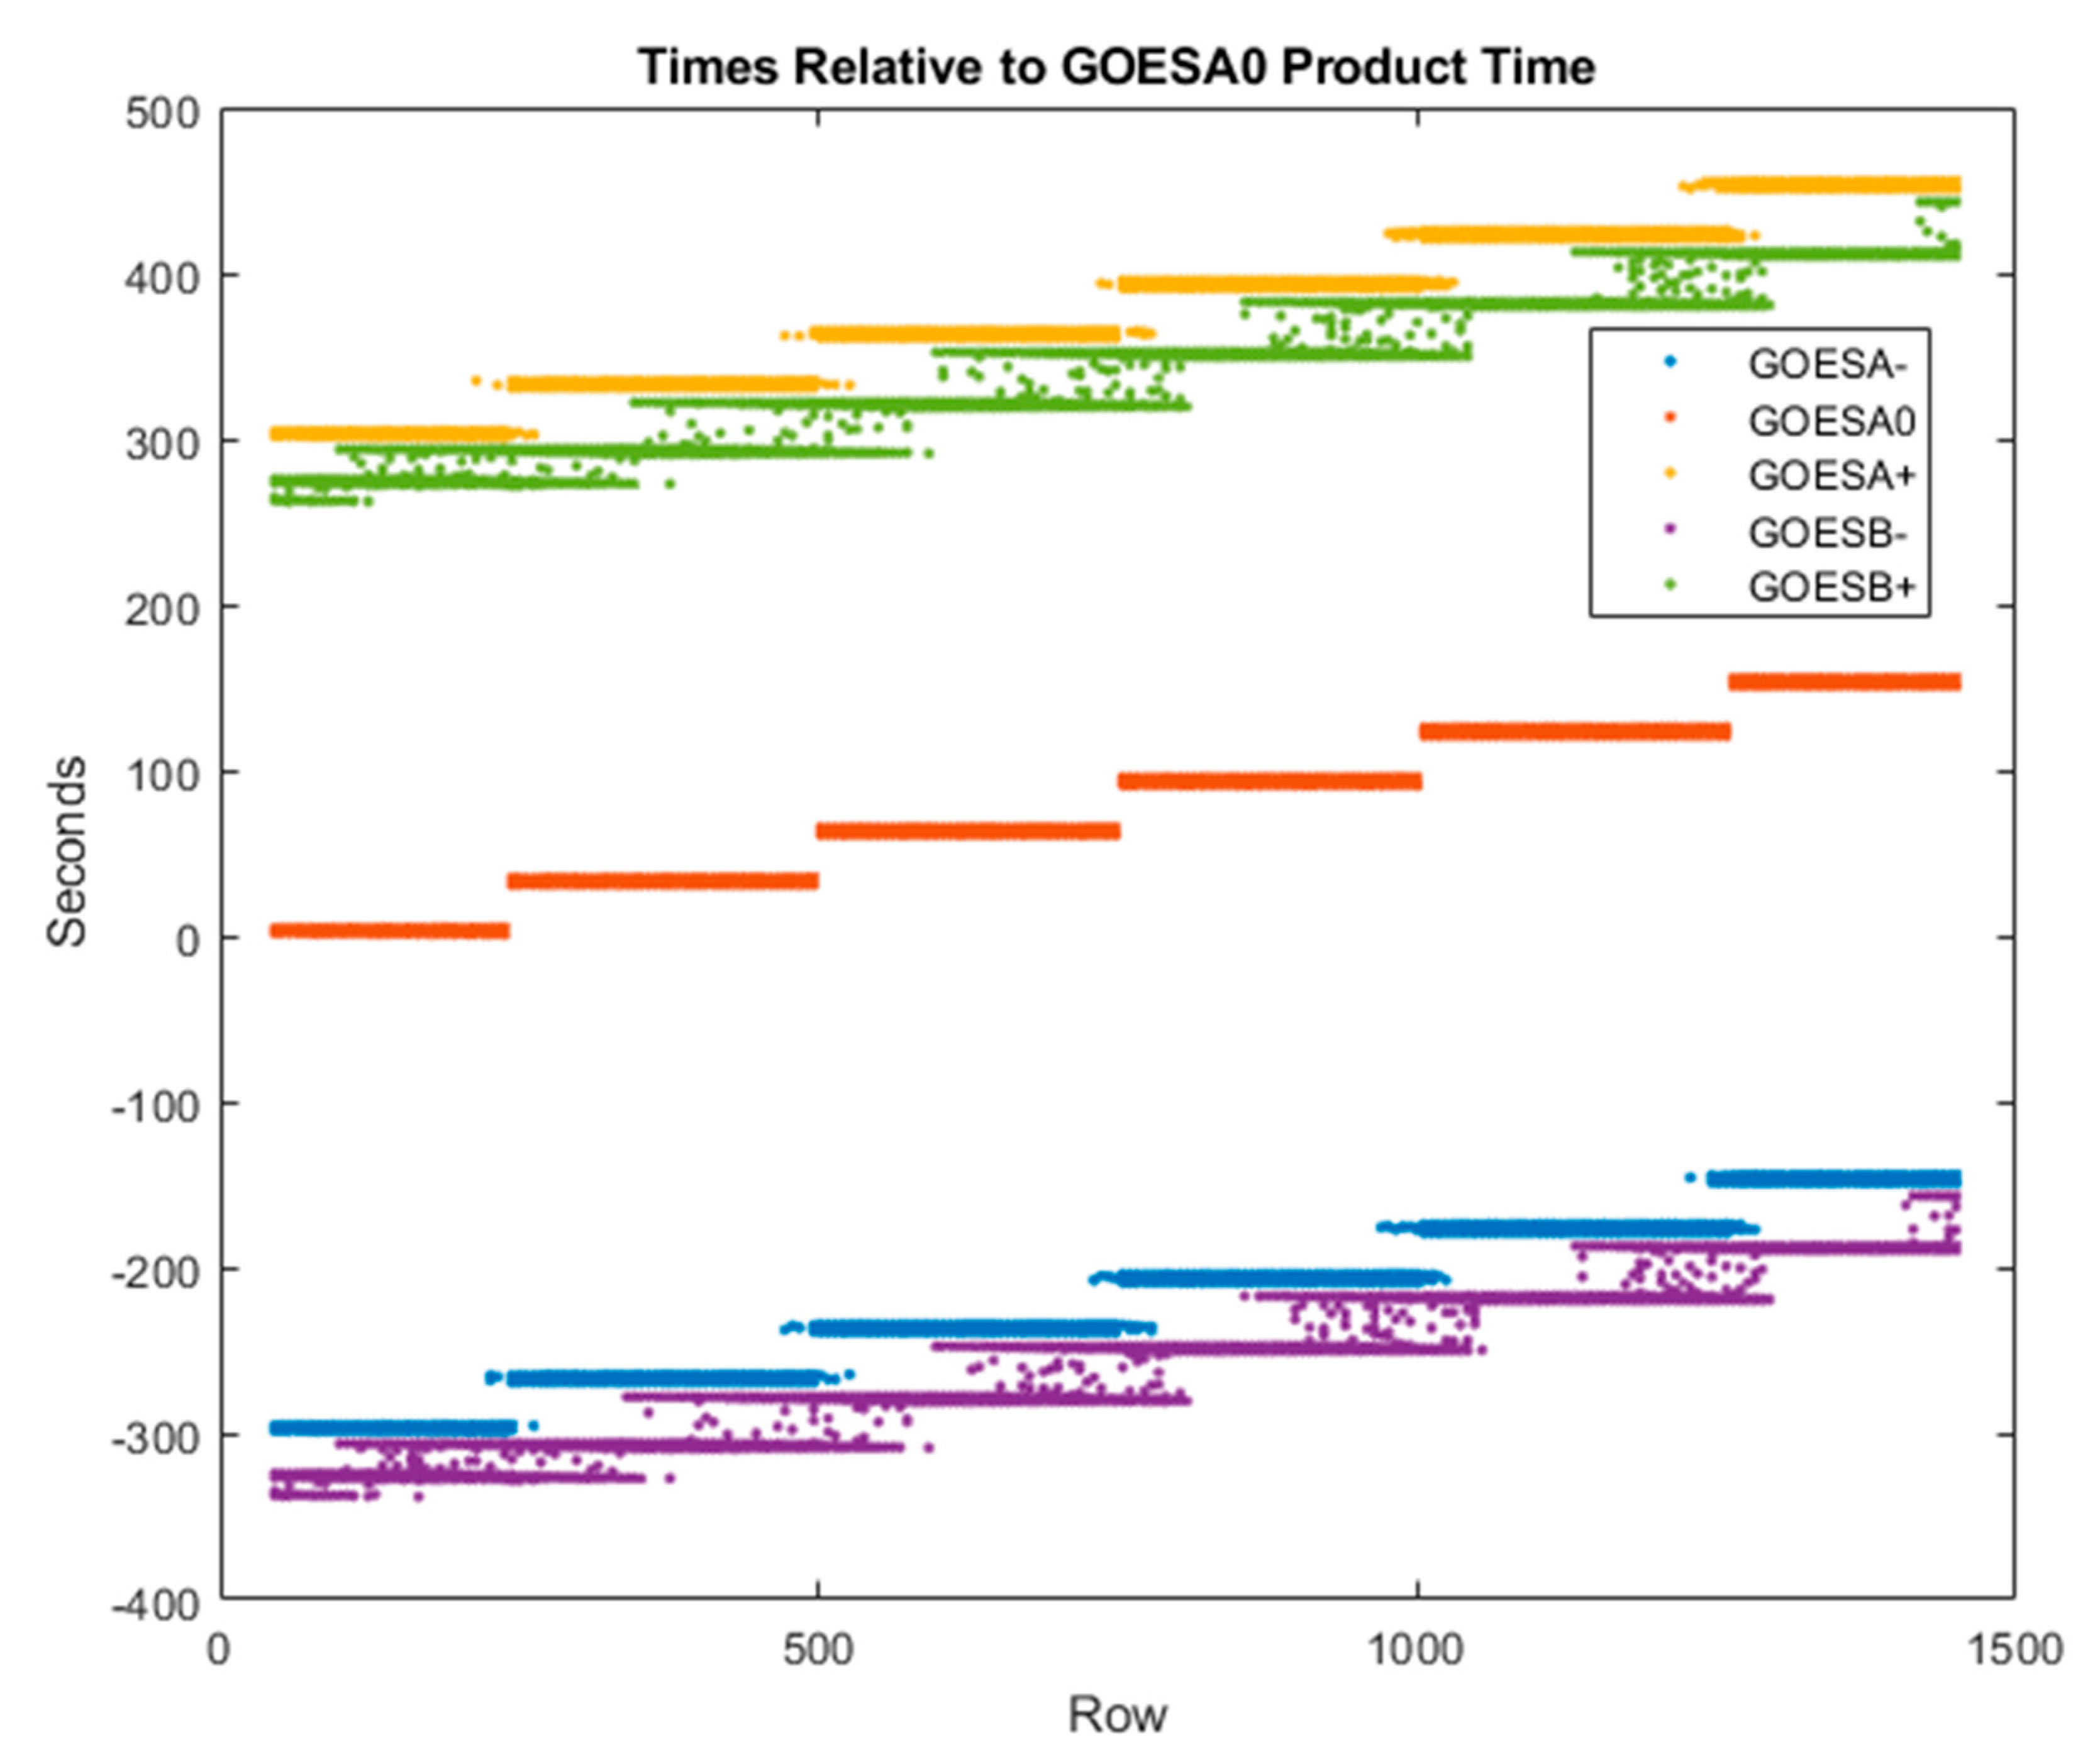
A time is assigned to a template at its center pixel and times at the sites for each match rounded to the nearest pixel. These time assignments are used in the retrieval process as described in Section 2.2. An example from a CONUS-FD case is shown in Figure 6, where time tags are plotted versus the row number in the A0 scene (in this case, GOES-16 CONUS). The pixel times for the B satellite (GOES-17 in this example) were first modeled in the B-satellite fixed grid and then remapped along with B-satellite imagery so that they may be indexed in the fixed grid of the A satellite. Remapping of the time model interpolates between pixels and can mix the times from neighboring swaths near their boundary as is evident in the assignments made to the matches to the B satellite; otherwise, the time assignments are discrete choices governed by the timeline plus a small along-scan variation in relation to the scan rate and the angular distance from the western swath edge.
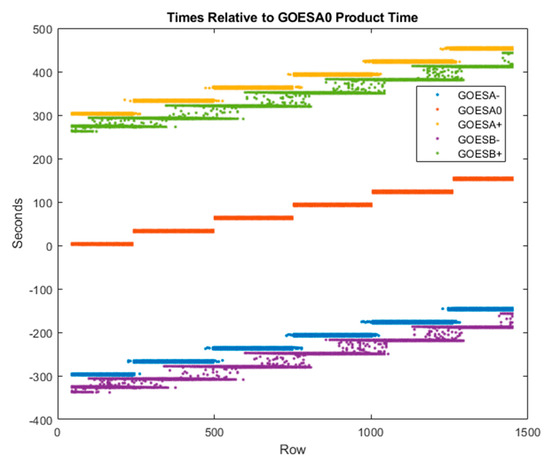
Figure 6.
Assigned times for a CONUS-FD Band 14 case during Hurricane Hanna (A0 GOES-16 CONUS time: 2020/207 17:16Z). Time generally progresses as the row number increases from north to south. Swath transitions are evident as a staircase. The two FDs from GOES-17 fall close to the A± CONUS repetitions from GOES-16, which are the first CONUS repetitions in their respective timelines and the A0 scene is the second repetition of the CONUS scene within its timeline.
2.4. Spacecraft Position Vectors
Spacecraft position vectors are also required for each retrieval. These are quasistatic in a geographic reference frame. We used the assigned satellite stations for GOES-16 and −17 (75.2° W and 137.2° W) and assumed they were on the equator with a nominal orbital radius of 42,164.17478 km. These locations will be accurate to <0.1° depending on the timing within the GOES station-keeping cycle. For Himawari, metadata giving an SSP latitude and longitude and the orbit radius for the scene is provided in the AHI product files [26], which we used directly.
2.5. Divergence and Curl
The NASA code includes the calculation of the divergence and curl of the retrieved wind fields. Similar upper-level wind-field divergence products used operational 6.2-μm AMV data [27,28]. The cloud-top divergence derived from AMVs is a result of the outflows from storm updrafts that can be used to diagnose the updraft intensity and associated precipitation at the surface. The operational divergence product was limited to the 6.2-μm channel (similar to Band 8 in the GOES-R series), because this channel had a roughly uniform weighting function with respect to water vapor (WV). In other words, the height associated with the 6.2-μm AMVs was at the approximately same level, which was required to calculate the wind field divergence. However, one can derive the divergence and curl from the wind field in every channel where there are sufficiently dense retrievals in clearly identifiable layers. In the NASA code, the calculations of divergence and curl are performed at the site of each retrieval with nominal DQF by considering all the nominal retrievals within a horizontal spatial window and within the same layer as determined by a vertical window. We worked with the Cartesian -coordinates constructed as described in Section 2.2 above, with as coordinates for the tangent plane at the site central to the neighborhood. If sufficiently many, well distributed neighboring retrievals are found within the spatial window and layer, these neighboring wind vectors are fit as functions of their sites’ -coordinates. All winds in the fit are regarded as belonging to the same atmospheric layer and therefore assumed to share the same vertical -coordinate. The divergence and curl are computed from the vector field described by this fit. A fit is attempted only when the horizontal spatial window is ≥25% populated by neighboring retrievals with nominal DQFs, all four quadrants have ≥5% of their possible sites populated, and the retrieved wind at the central site is part of the main layer (generally within ±1 km of the median for the window). The fit is in the form of a polynomial in local Cartesian coordinates with degree three in each variable (i.e., bicubic). The total and quadrant population tests are necessary to adequately constrain the fit. The fit was performed as a linear least squares problem with 6-sigma MAD filtering to discard statistical outliers. The fit was redone until either no more data are discarded, or the population criteria fail. We fit the wind retrievals after the central wind (retrieval at the site) was subtracted from all neighboring winds, which did not affect the spatial derivatives. With the central wind removed, we could skip the constant term and fit the retrieved winds to a nine-parameter model that solves for the 2 × 9 coefficient matrix in the model representation:
Therefore, the wind-field fit represents the central wind at the site and differentiable changes surrounding it. The divergence and curl were computed from the fit coefficients:
Only the vertical component of the curl is nonzero since all winds belong to the same layer. Since we are working in the local Cartesian frame attached to the Earth, it is not inertial, and the curl represents the relative vorticity. The units of divergence and curl are both the inverse time.
The wind-field fitting domain can be defined as an input with units of template sizes. As the domain enlarges with respect to the template, the derived divergence and curl becomes more spatially averaged and larger values were averaged down. Since mesoscale severe weather would be a primary application for these derived quantities, smaller domains should be preferred, but the domain must be large enough to represent the spatial variation of the retrieved wind field (oversampled winds will correlate neighboring retrievals because their templates overlap).
The divergence and curl of the retrieved wind field were included in the netCDF output file of the NASA code along with the retrieved wind velocities, their assigned heights above the WGS-84 ellipsoid, the geoid height above the ellipsoid and terrain height above the geoid at the retrieval sites, and a pair of data quality flags. Height assignments and sites for the derived divergence and curl were always the same as their central wind. The separate DQF for the derived divergence and curl indicates whether the fitting process was successful, and if not, the reason. The meanings of all DQF values were documented in the comment attributes of their respective netCDF variables. A retrieved wind DQF is also marked as anomalous (DQF = 2) if the central wind velocity is anomalous with respect to its neighbors within the same layer, which is an effective spatial coherence filter on the retrieved winds. Some applications for these derived wind fields were found in Section 3.3.
3. Results
In principle, stereo winds can be made from any GOES spectral channel or any pairing of similar channels in a mixed constellation. In this section, we featured results from the ABI reflective Bands 2 and 4, water vapor (WV) Bands 8–10, and window-IR Band 14. It should also be possible to use synthetic bands formed from channel differences, ratios, or spectral indices that enhance characteristics such as atmospheric composition or dust. We will use the abbreviation “B02”, “B04”, etc., to identify the spectral bands.
Our first results, in Section 3.1, pertained to validation of the method. Section 3.2 investigated the error characteristics of stereo winds and their height assignments. Section 3.3 provided stereo-wind retrievals that address several application areas where the simultaneous retrieval of wind height is likely to provide some advantages with respect to conventional IR wind height assignments in addition to providing high-quality height assignments for assimilation into numerical weather models. These included studies of deep convection in tropical cyclones, observation of the planetary boundary layer (PBL), and smoke plumes from wildfires.
3.1. Validation
Our validations included tracking stationary ground points under clear-sky conditions and comparisons to rawinsonde observations and the NOAA operational wind algorithm. The ground-point retrievals provide an indication of the accuracy of the stereo retrievals. The rawinsonde results show the potential benefits of stereo winds relative to operational winds where both exist.
3.1.1. Ground Point Retrievals
The NASA code is indiscriminate in its selection of features to track and will track static ground points as if clouds borne in the wind. We know the velocities (zero) and elevations of tracked ground points from terrain models to compare against the retrievals. This method was pioneered with MISR [29] and applied in our work in LEO–GEO stereo winds. We used a similar methodology [10] to identify the class of candidate ground-point retrievals by a combination of height above the ground level and low speed. Statistics over this class were useful for characterizing retrieval errors even if the problem of tracking a cloud in motion may be different than tracking the static terrain as noted by Lonitz and Horvath [30]. Figure 7 shows the statistics of ground-point retrievals using a pair of GOES-16 and -17 FDs in B14; also shown are the derived divergence and curl at these sites. Figure 8 shows the ground-point retrievals for the same scene pair in B02. A visual inspection of the sites that were classified as ground points confirms the correctness of their classification, although this is more difficult for IR scenes. The counts were higher for B02 than B14 both because there were more retrieval sites available and because the smaller footprint of the B02 templates allowed for more clear-sky conditions to be found. As expected, the error statistics were also smaller in B02 than B14 due to the finer precision offered for tracking with a finer spatial resolution. B14 might include some templates contaminated by low clouds. Evidence of bimodality was seen in the B02 velocity histogram. This cluster of ground-point retrievals was concentrated over the Andes. These were most likely traceable to an INR error in the southern portion of the FD.

Figure 7.
Ground-point retrievals in B14 at 2020/207 17:20Z from GOES-16 and -17 FDs using a 24 pixel × 24 pixel template and 12 pixel × 12 pixel sampling.

Figure 8.
Ground-point retrievals in B07 at 2020/207 17:20 Z from GOES-16 and -17 FDs using a 24 pixel × 24 pixel template and 12 pixel × 12 pixel sampling.
A larger collection of ground-point statistics was gathered from our runs on the NASA Discover supercomputer. These were collected by case and summarized in Table 2. These large samples indicate that retrieval errors were 0.1 m/s for B02 AMVs, 200 m for B02 heights, 0.2 m/s for IR AMVs, and 250 m for IR heights. Tracking clouds in motion is a slightly different problem and may have different error characteristics; however, these results should still be indicative of the expect accuracy of stereo methods. All cases used 24 pixel × 24 pixel templates and a GOES-16 CONUS and a GOES-17 FD.

Table 2.
Ground-point mean (μ) and standard deviation (σ) statistics are presented for cases run on the NASA Discover supercomputer indicate the uncertainties in stereo-winds retrievals.
3.1.2. Rawinsondes
Rawinsonde wind observations are routinely used to assess the performance of tropospheric winds retrieved from satellites [31]. We made use of rawinsonde observations originally reported through the Global Telecommunication System (GTS) of the World Meteorological Organization (WMO) where the data are reported in “TEMP” (upper air soundings) alphanumerical code format FM-35. We accessed them through NOAA’s National Centers for Environmental Prediction (NCEP) as “prepBUFR” datasets [32] that have been preprocessed and quality controlled by both NCEP and NOAA’s Product Validation System (NPROVS) [33]. Examples of quality controls performed include checks of rawinsonde reports against GFS background fields, checks to ensure the radiosonde reports meet vertical extent requirements, and checks for the absence of gaps in rawinsonde reports between consecutive levels.
GOES-17/GOES-16 stereo winds and NOAA operational GOES-17 B14 Full Disk winds at 0Z and 11Z were each compared to coincident (within approximately 150 km and 60 min) 0 Z and 12 Z rawinsonde observations. Only the radiosonde launch time and station location were used in the collocation process. Balloon drift information was not used, but we did have plans to make use of this information when high resolution WMO BUFR radiosonde reports [34] are added to NCEP’s prepBUFR datasets. The rawinsonde data were interpolated to pressure (for verification of the operational GOES-17 winds) or geopotential height levels (for verification of the stereo winds) and the determination of the level of best fit to use as the verification level was achieved by minimization of a penalty function as described in Nieman et al. [35]. Checks were done to ensure that a radiosonde wind observation exists above and below the pressure (or height) of the satellite wind and that the closest one was within 25 mb/2 km (above 500 mb) or 50 mb/1 km (below 500 mb) of the satellite wind assigned pressure/geometric height. We assumed that geopotential heights, as reported in the rawinsonde observations, were equivalent to the geometric heights reported with the stereo winds. For the range of stereo winds heights, which are typically below 14 km, this is a reasonable assumption, with maximum differences estimated to be approximately 50 m at 14 km. The 11 Z stereo and operational winds were chosen to be collocated with the 12 Z rawinsonde observations since the GOES-17 ABI loop heat pipe (LHP) anomaly [15,16] resulted in the generation of very few operational winds at 12 Z during the month of April 2020. The stereo and operational winds were generated for the same times and were required to be within approximately 10 km of each other, thus ensuring a one-to-one comparison of the performance between the two using the same rawinsonde observations as “truth”. Table 3 shows the overall (i.e., winds at all levels and at all latitudes) comparison statistics in tabular form between rawinsonde winds (0 Z and 12 Z) and GOES-17/GOES-16 stereo winds and NOAA operational GOES-17 winds for April 1–30, 2020. The satellite/rawinsonde collocation approach and comparison metrics used are those described in the WMO/CGMS guidelines for reporting the performance of satellite-derived winds [31]. The mean vector difference (MVD) is computed from:
where
and

Table 3.
Comparison statistics between rawinsonde winds (0 Z, 12 Z) and GOES-17/GOES-16 stereo winds and National Oceanic and Atmospheric Administration (NOAA) operational GOES-17 winds for April 1–30, 2020.
- u-component of satellite wind,
- v-component of satellite wind,
- u-component of the collocated reference wind,
- v-component of the collocated reference wind and,
- size of collocated sample.
The average speed bias between the satellite and GFS model winds or rawinsonde reference winds was computed from:
The overall comparison metrics (Table 3) show that the GOES-17/GOES-16 stereo winds closely matched the rawinsonde wind observations and perhaps matched better than the operational GOES-17 winds. The reductions observed in the MVD and absolute directional difference metrics for the stereo winds were very encouraging and suggest that the quality of the stereo winds surpassed the quality of the operational GOES-17 winds. The slight increase in the magnitude of the speed bias metric associated with the GOES-17/GOES-16 stereo winds was likely associated with the fact that the stereo cloud heights were placed slightly higher (e.g., closer to the cloud-top boundary) in the atmosphere than the operational cloud heights. This is not unexpected since infrared-based cloud height retrieval approaches retrieve cloud heights at levels consistent with the effective level of emission, which tends to occur below the cloud-top boundary [6,36,37].
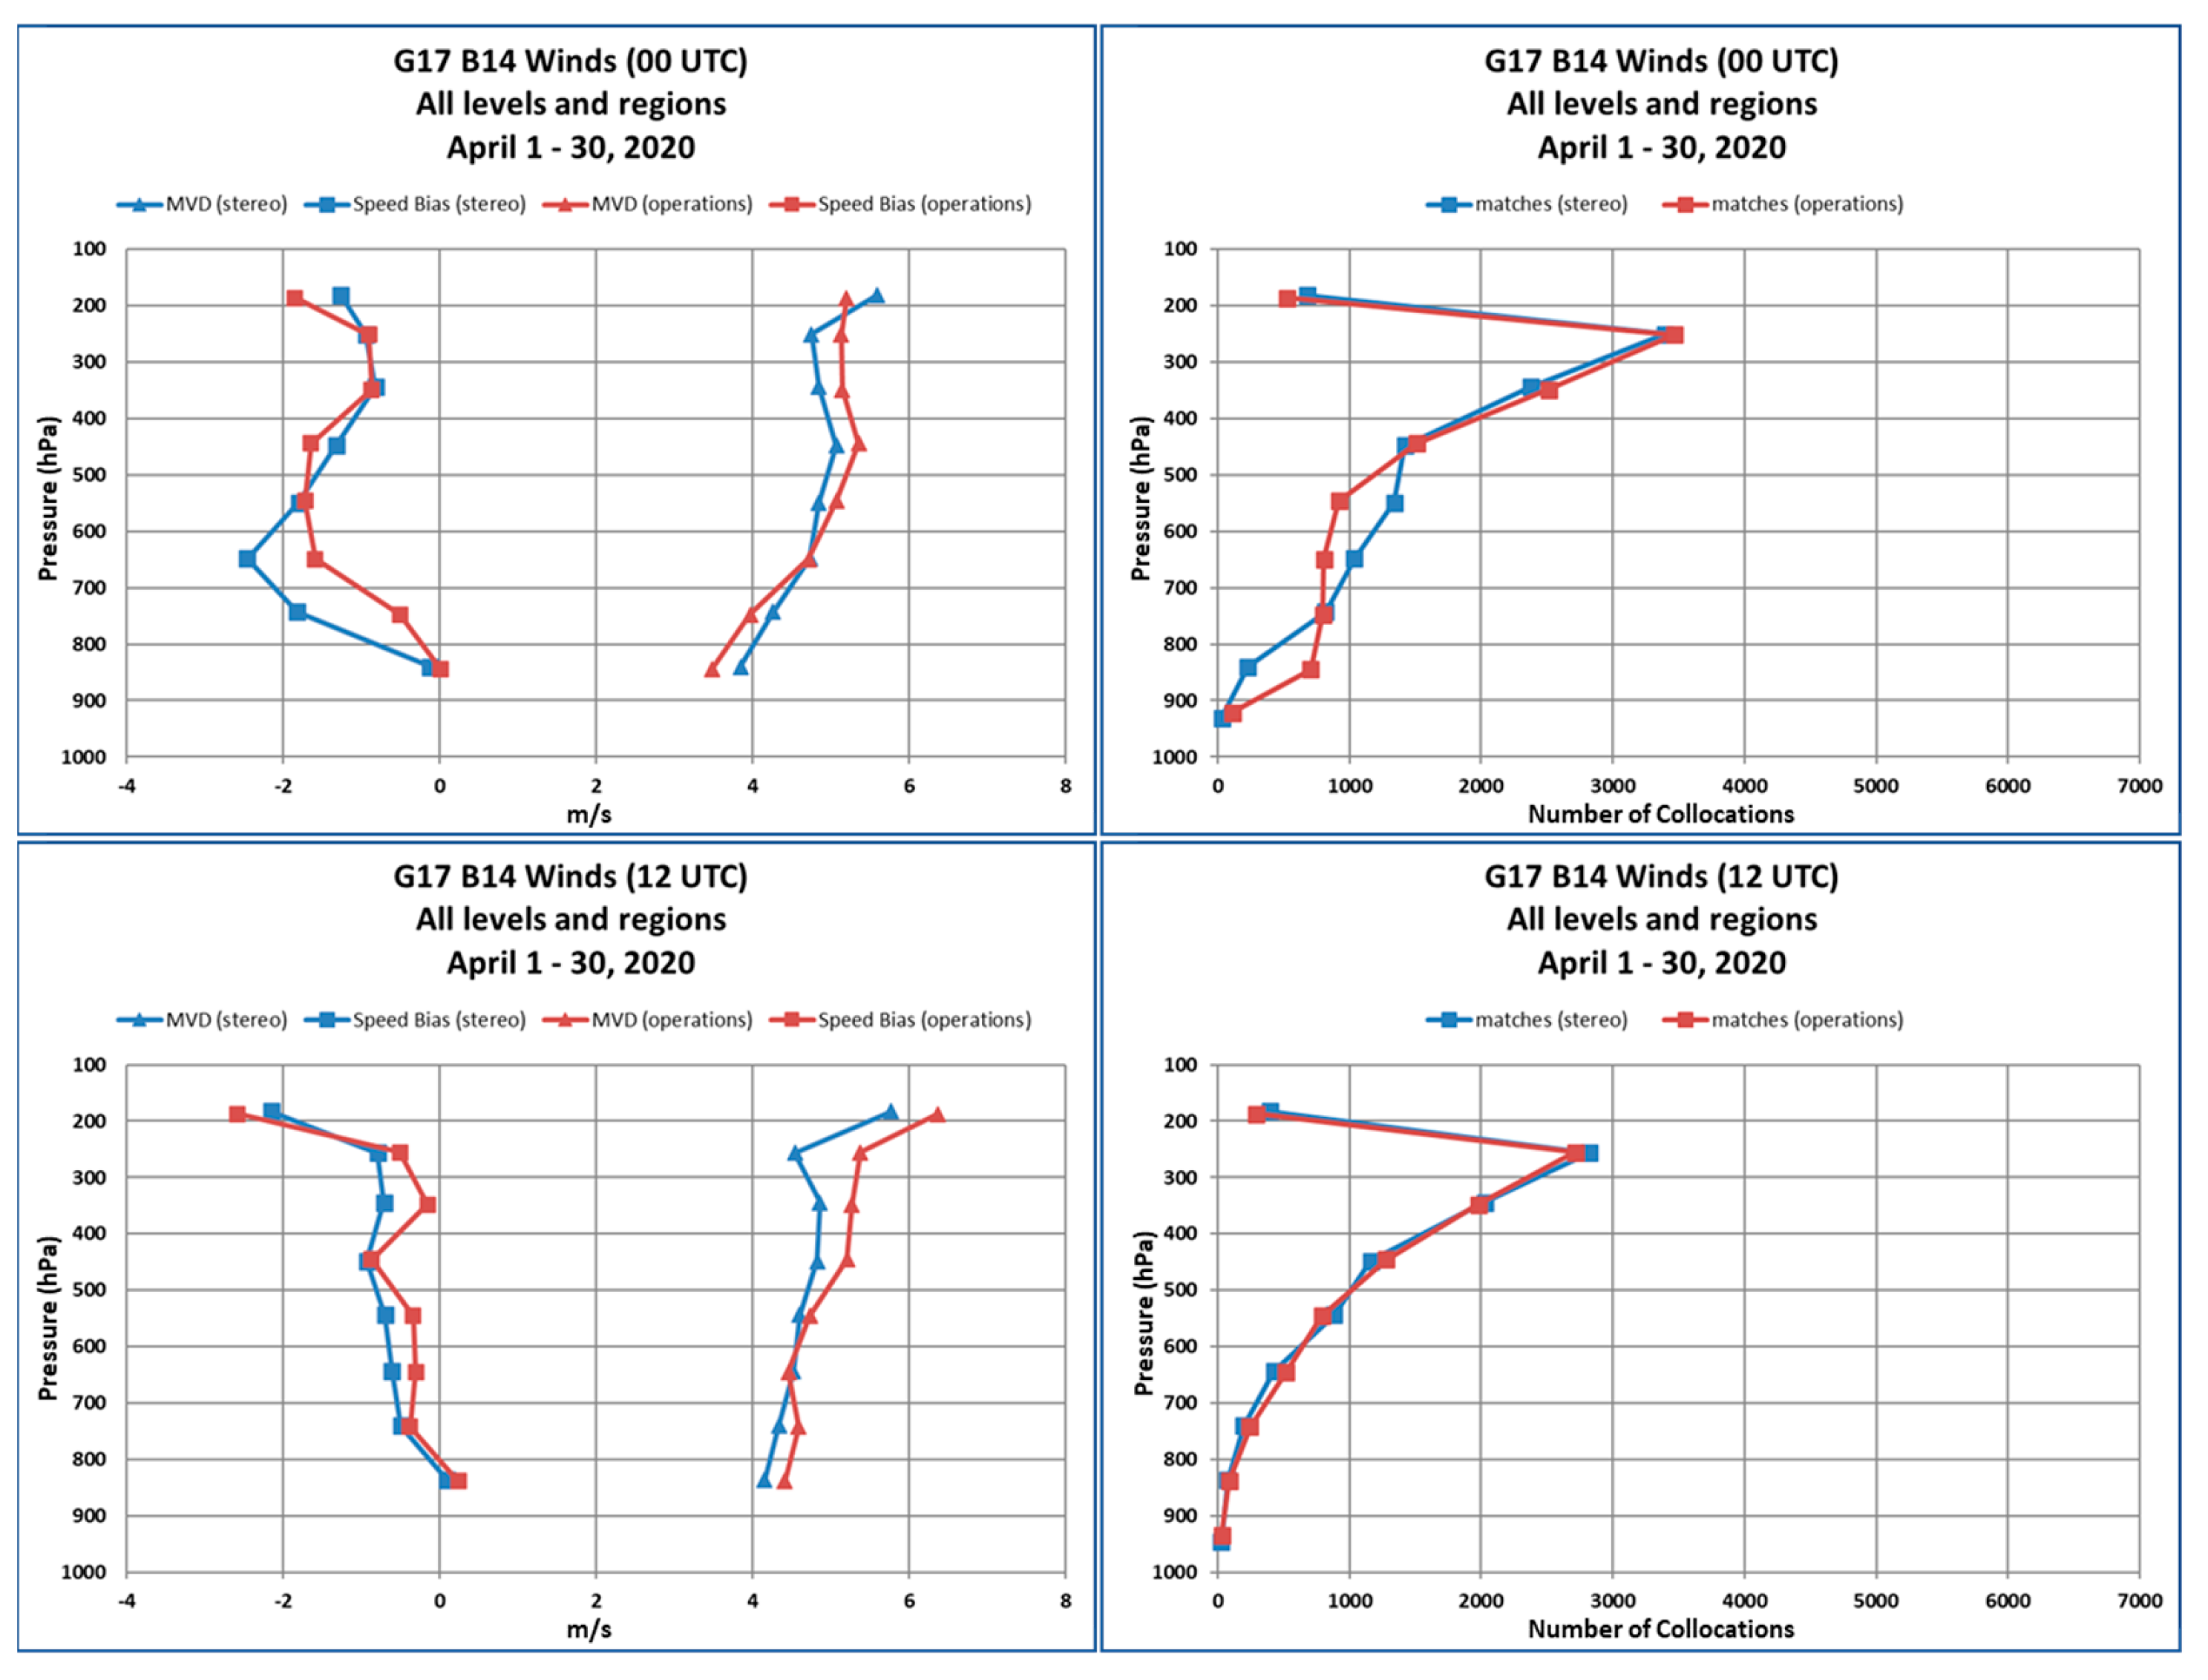
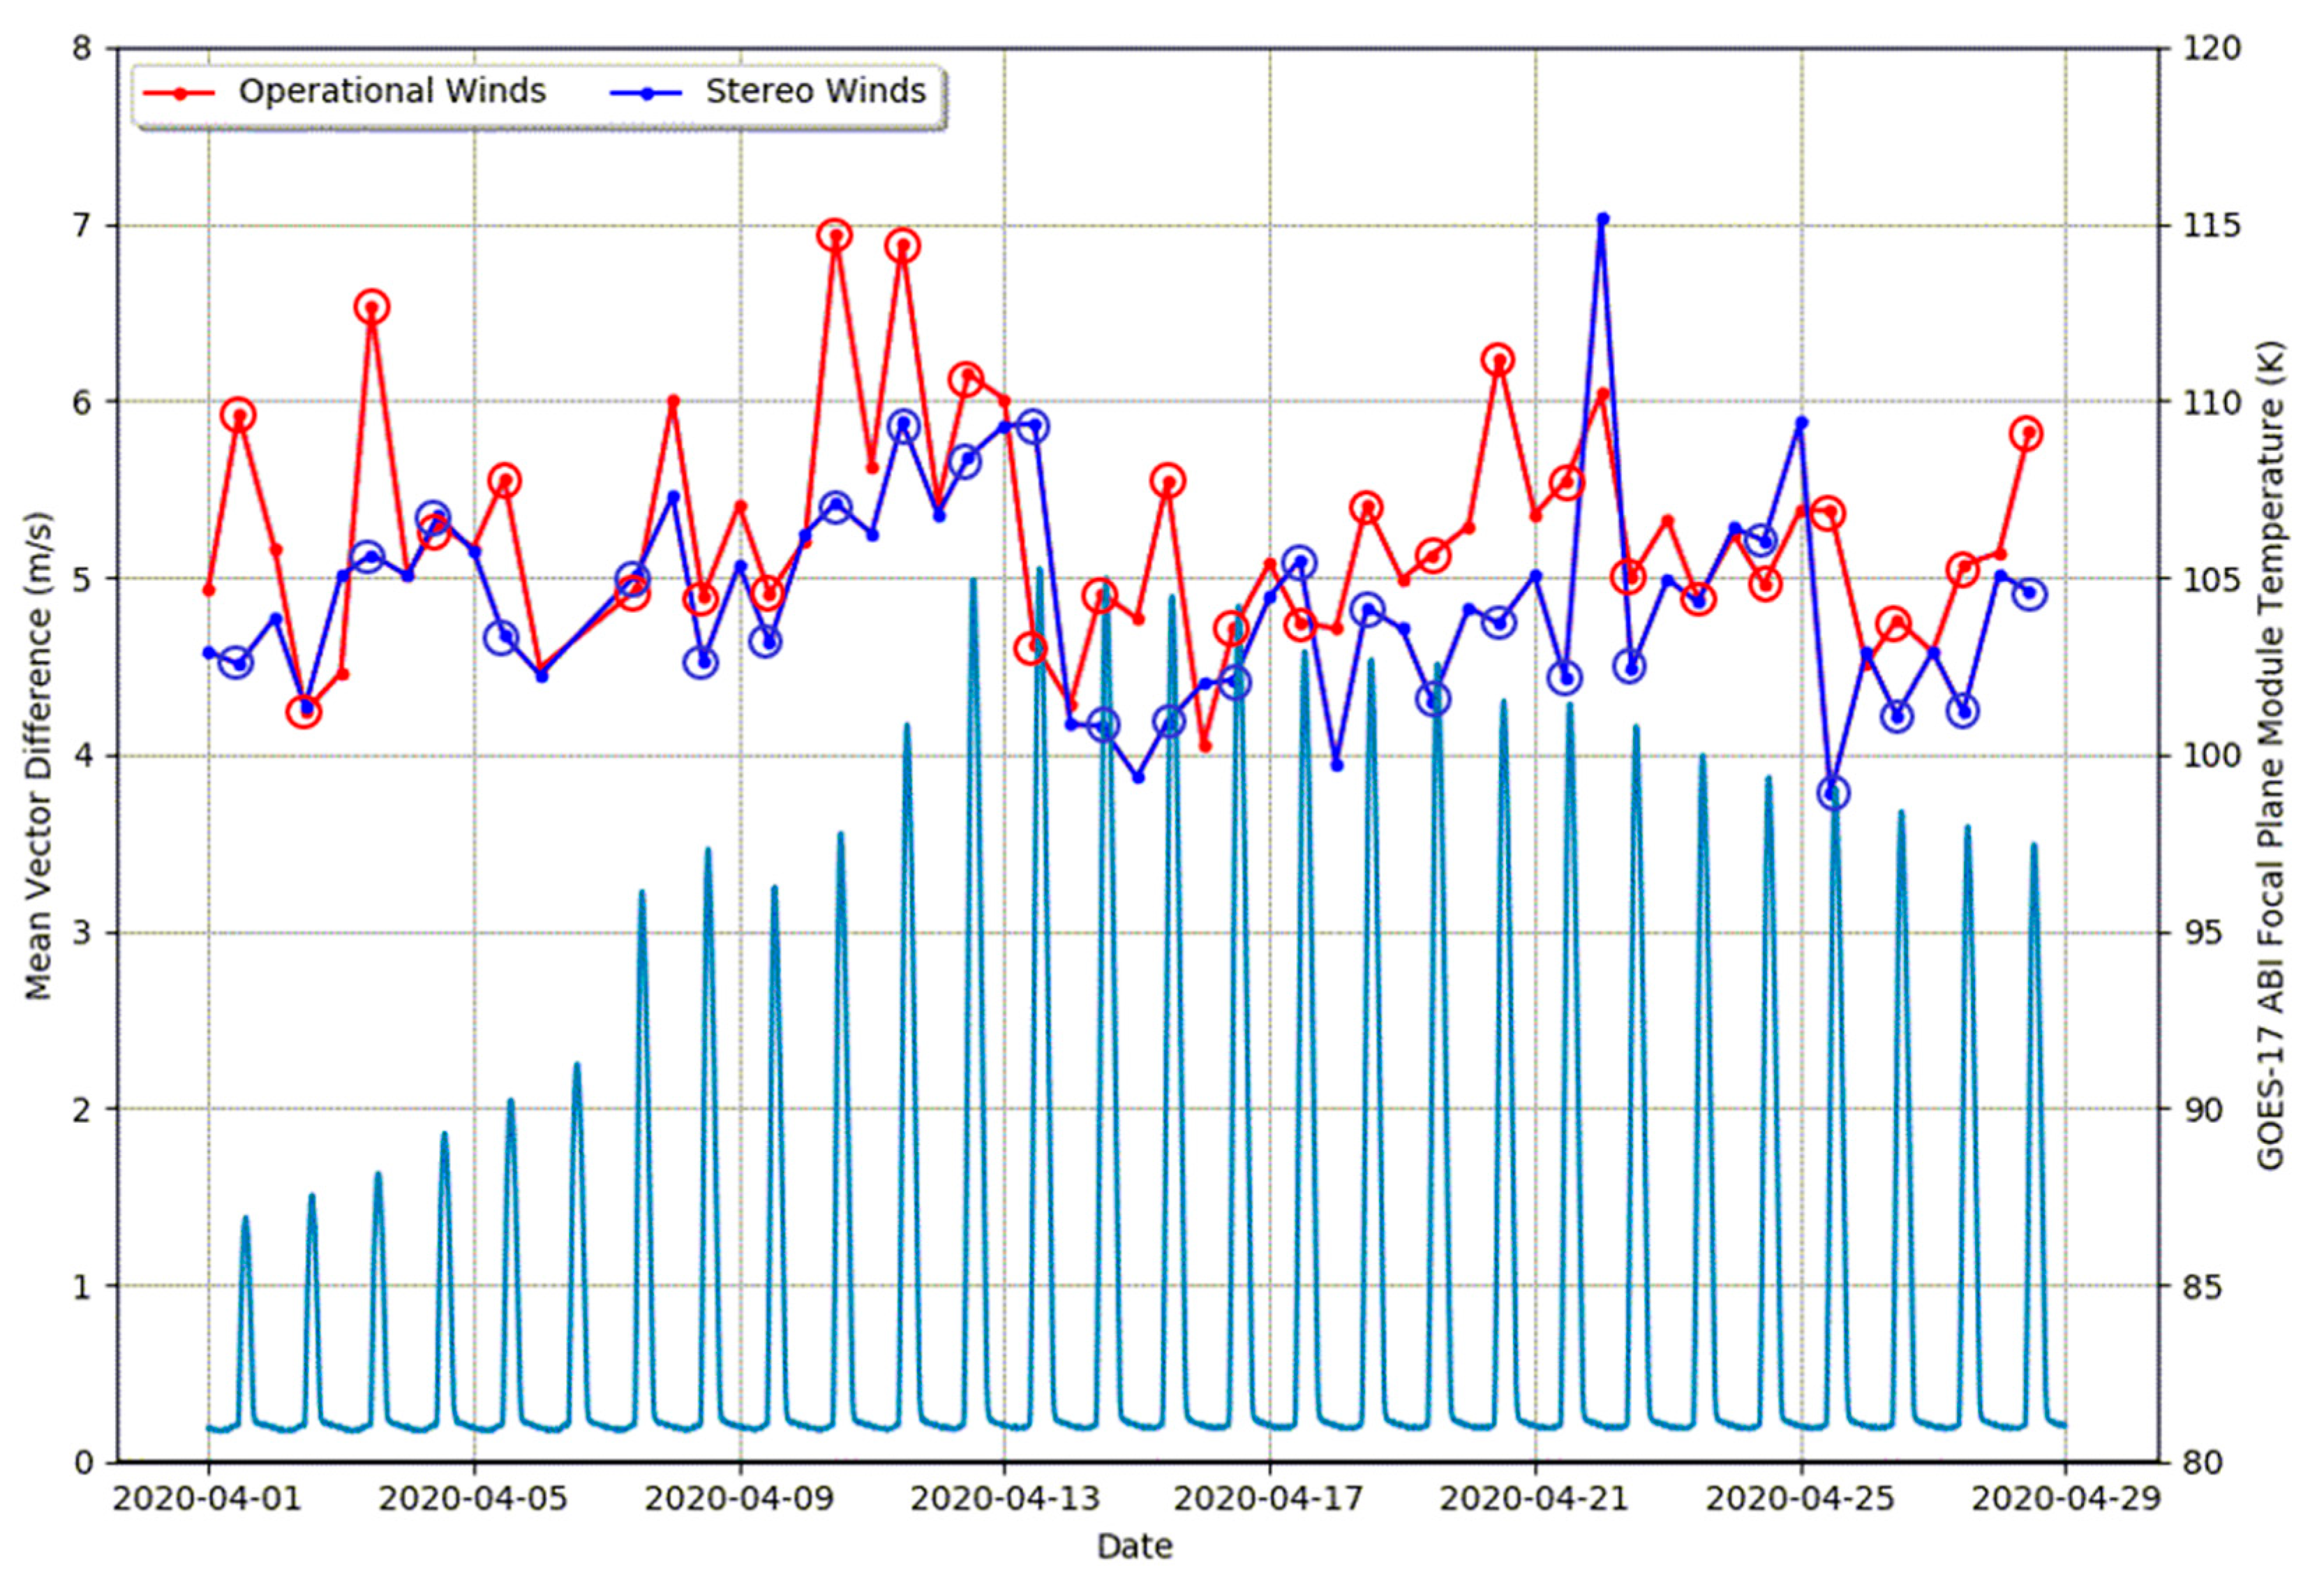
The overall comparison statistics in Table 3 did not reveal the whole story about the error characteristics of the satellite winds. To further understand the error characteristics, we generated Figure 9 that illustrates vertical profiles of MVD (triangles) and speed bias (satellite wind minus rawinsonde wind as squares) comparison metrics for the GOES-17/16 stereo winds (blue) and NOAA operational winds (red) at 00 and 12 Z for 1–30 April 2020. The comparison metrics were computed over 100 hPa layers. The corresponding sample size vertical distributions are shown in the right-hand panels. Most of the collocations were found at the upper levels of the atmosphere with a peak around 250 hPa with decreasing numbers of collocations at lower levels. Inspection of the MVD vertical profiles indicates the stereo winds were of higher quality than the operational winds throughout the troposphere. At upper levels of the atmosphere, which had the highest population of measured winds, the stereo winds exhibited higher quality than the operational winds more clearly. Their improvement was pronounced at 12 Z when the operational cloud height algorithm was challenged by the loss of ABI water vapor and CO2 band imagery due to the GOES-17 ABI loop heat pipe (LHP) issue. At these levels of the atmosphere, thin cirrus clouds dominated the sample and presented the largest challenge to the operational infrared-based cloud height retrieval algorithm [6,36]. For these cloud types, the stereo approach generated very accurate cloud heights, which clearly benefited the quality of the upper-level stereo winds. To illustrate this point more clearly, Figure 10 shows a time series of 0 Z and 12 Z MVD comparison statistics for upper level operational and stereo winds for the month of April 2020. Additionally plotted is a time series of the GOES-17 ABI focal plane module (FPM) temperatures that indicates peak heating around 12 Z. Note how the stereo winds MVD time series usually fell below the corresponding operational winds MVD time series for every day in April 2020. More importantly, note the larger separation between the two MVD time series at 11 Z when the ABI FPM temperatures were quickly warming. This is significant since it not only quantified that the quality of the stereo winds was significantly better than the operational winds at this specific time, but allowed us to make the reasonable assumption that this improvement in quality can be expected for stereo winds generated during the remaining 7 hours of the daily ABI FPM warming cycle.
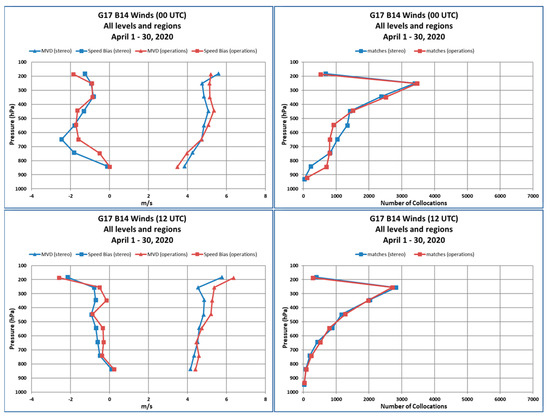
Figure 9.
Vertical profiles of the mean vector difference (MVD; triangles) and speed bias (satellite wind minus rawinsonde wind as squares) for GOES-17/16 stereo winds (blue) and NOAA operational winds (red) at 00 and 12 Z for 1–30 April 2020 are shown in the left-hand panels. The corresponding number of collocations is shown in the right-hand panels.
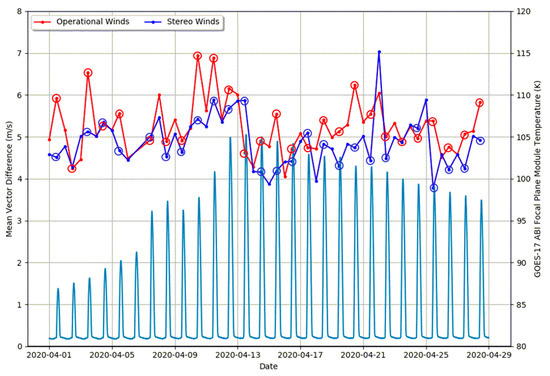
Figure 10.
Time series of the mean vector difference for upper level (100–400 hPa) stereo winds (blue) and NOAA operational winds (red) along with the time series of the GOES-17 ABI focal plane module (FPM) temperatures (light blue) for 1–30 April 2020. Open circles indicate comparisons at 11 Z.
Inspection of the speed bias vertical profiles in Figure 9 shows that the stereo winds had an overall slightly larger slow speed bias relative to the operational winds likely for the reasons described earlier. The exception to this is in the 500–800 hPa layer at 0 Z where the magnitude of the speed bias (satellite wind minus rawinsonde wind) was significantly larger for the stereo winds. A comparison of the vertical distribution of counts at 0 Z (bottom middle panel) suggests some of the low-level winds might be assigned incorrectly to mid-levels by the stereo method for reasons we did not yet understand, but planned to investigate in the future.
3.2. Statistics of Stereo Height and Winds
The stereo method can be applied to both cloud and water vapor features.
3.2.1. Cloud Features
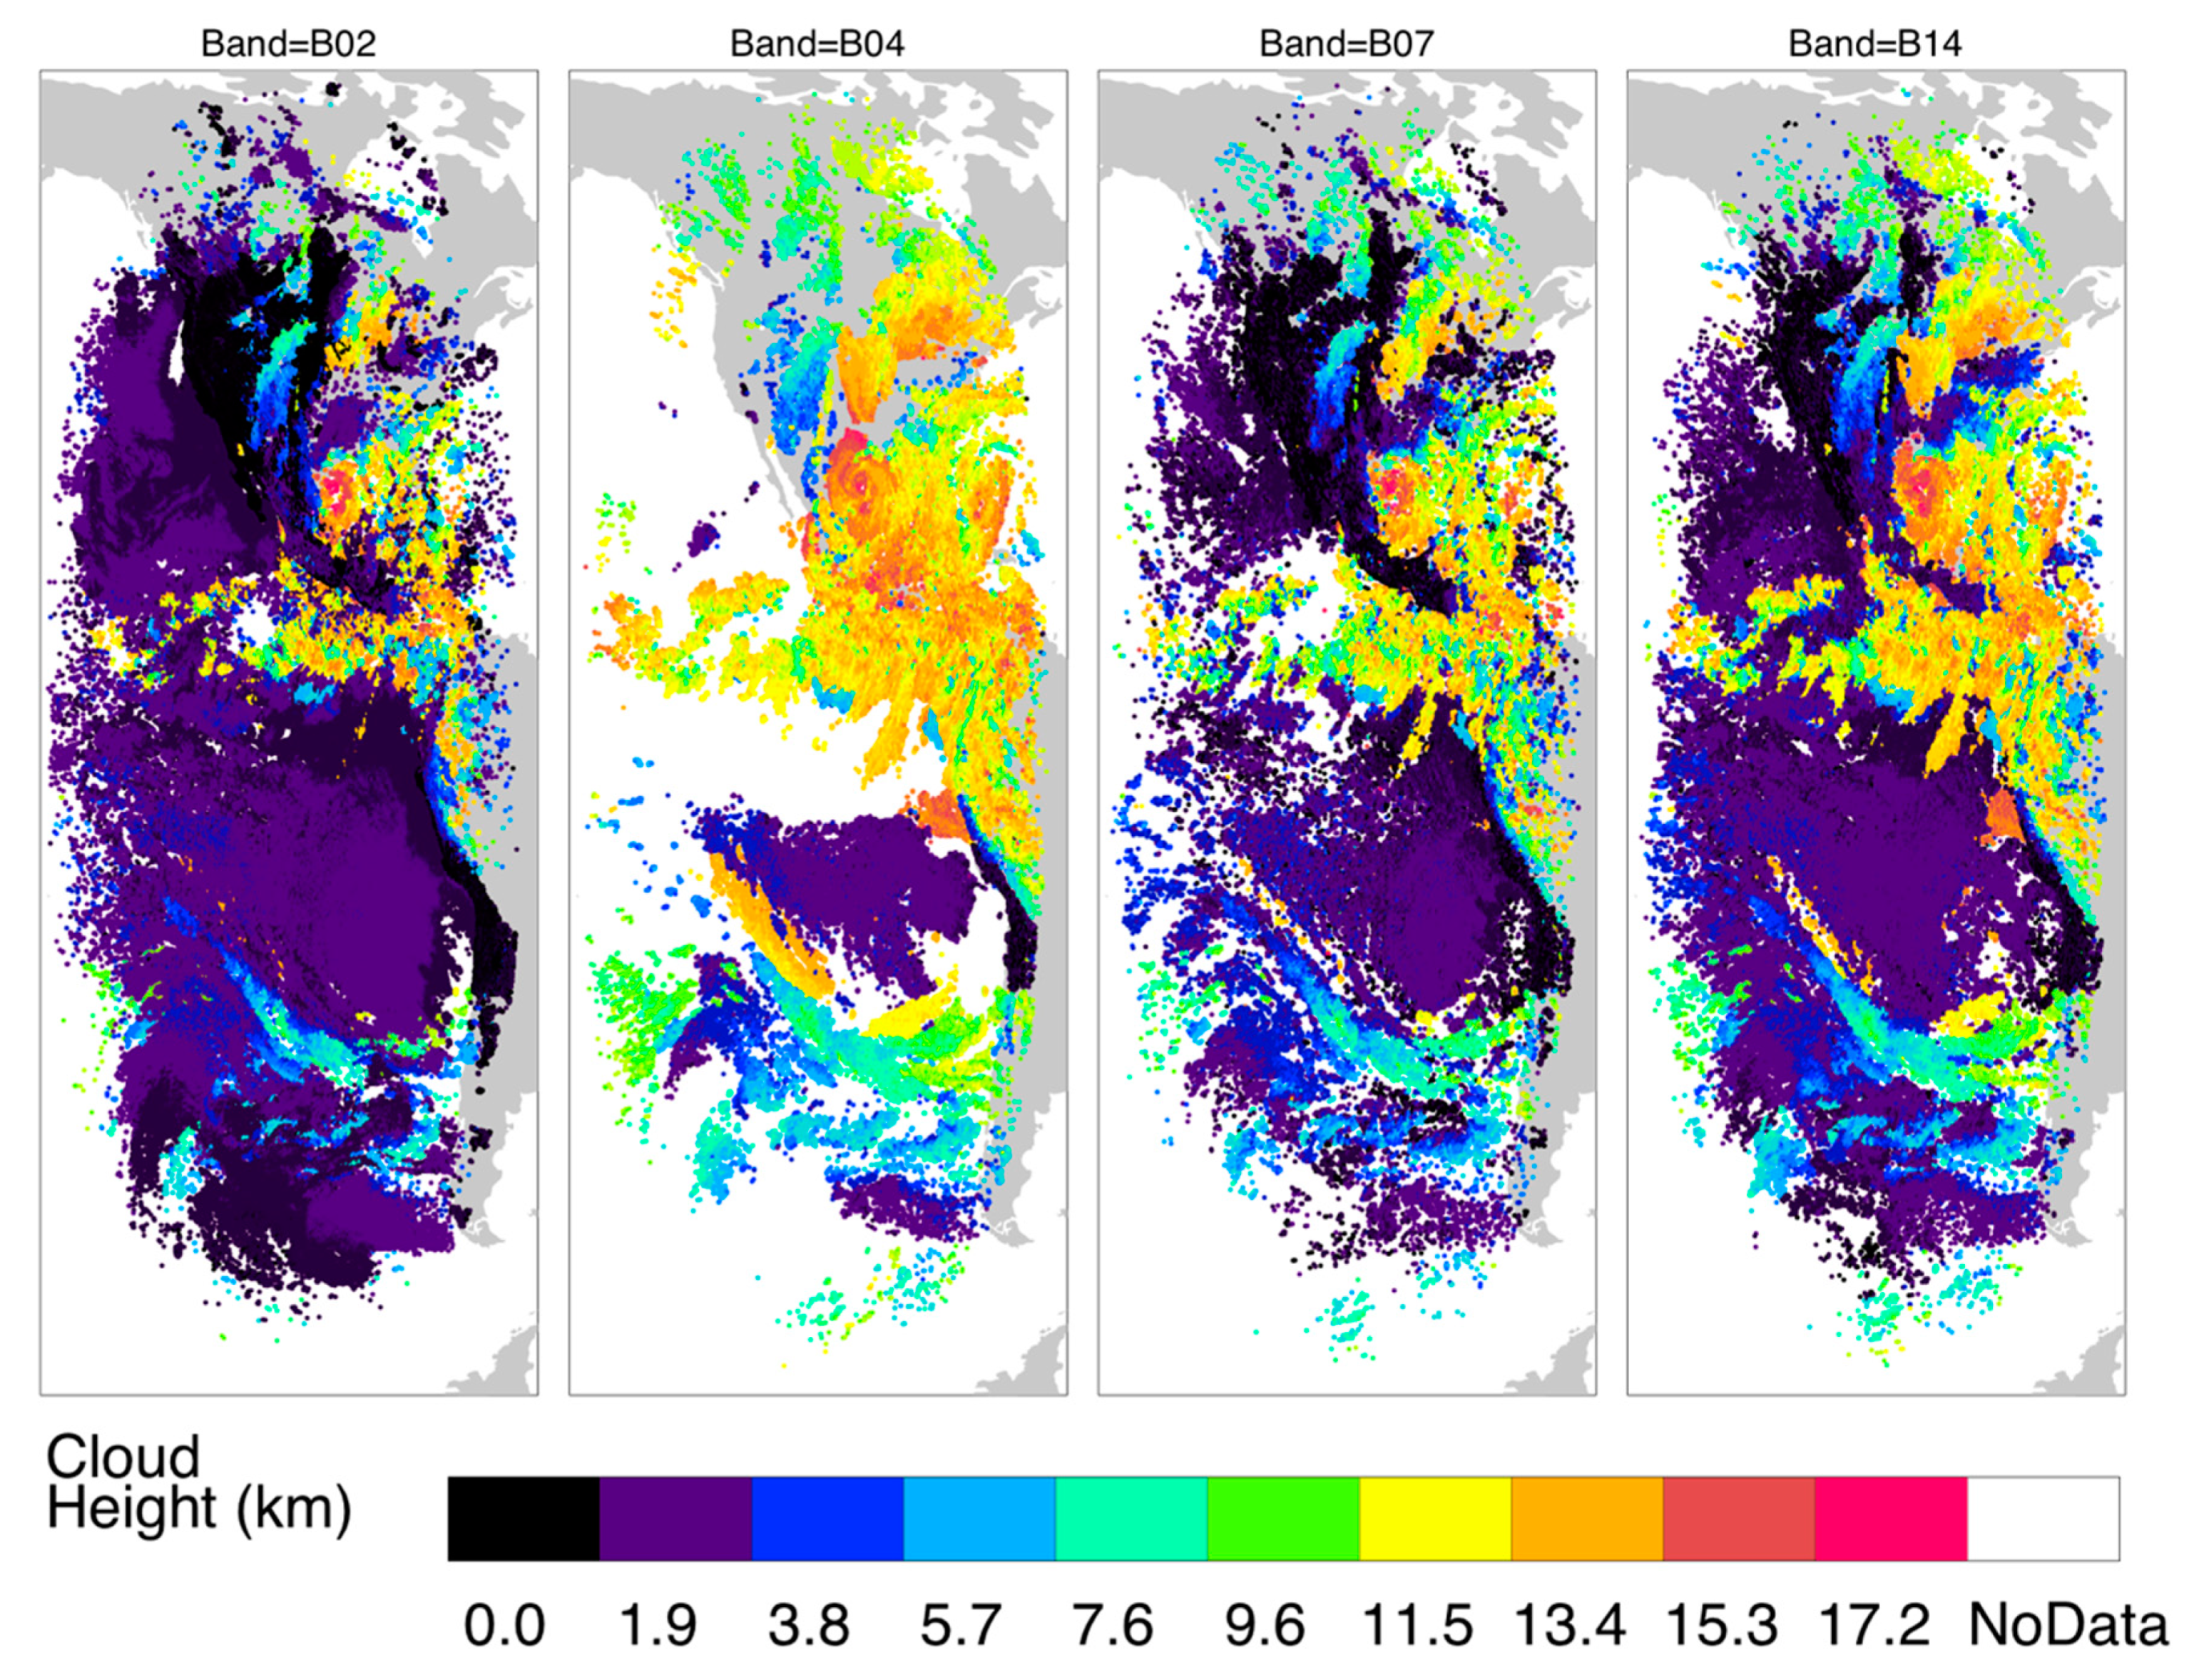
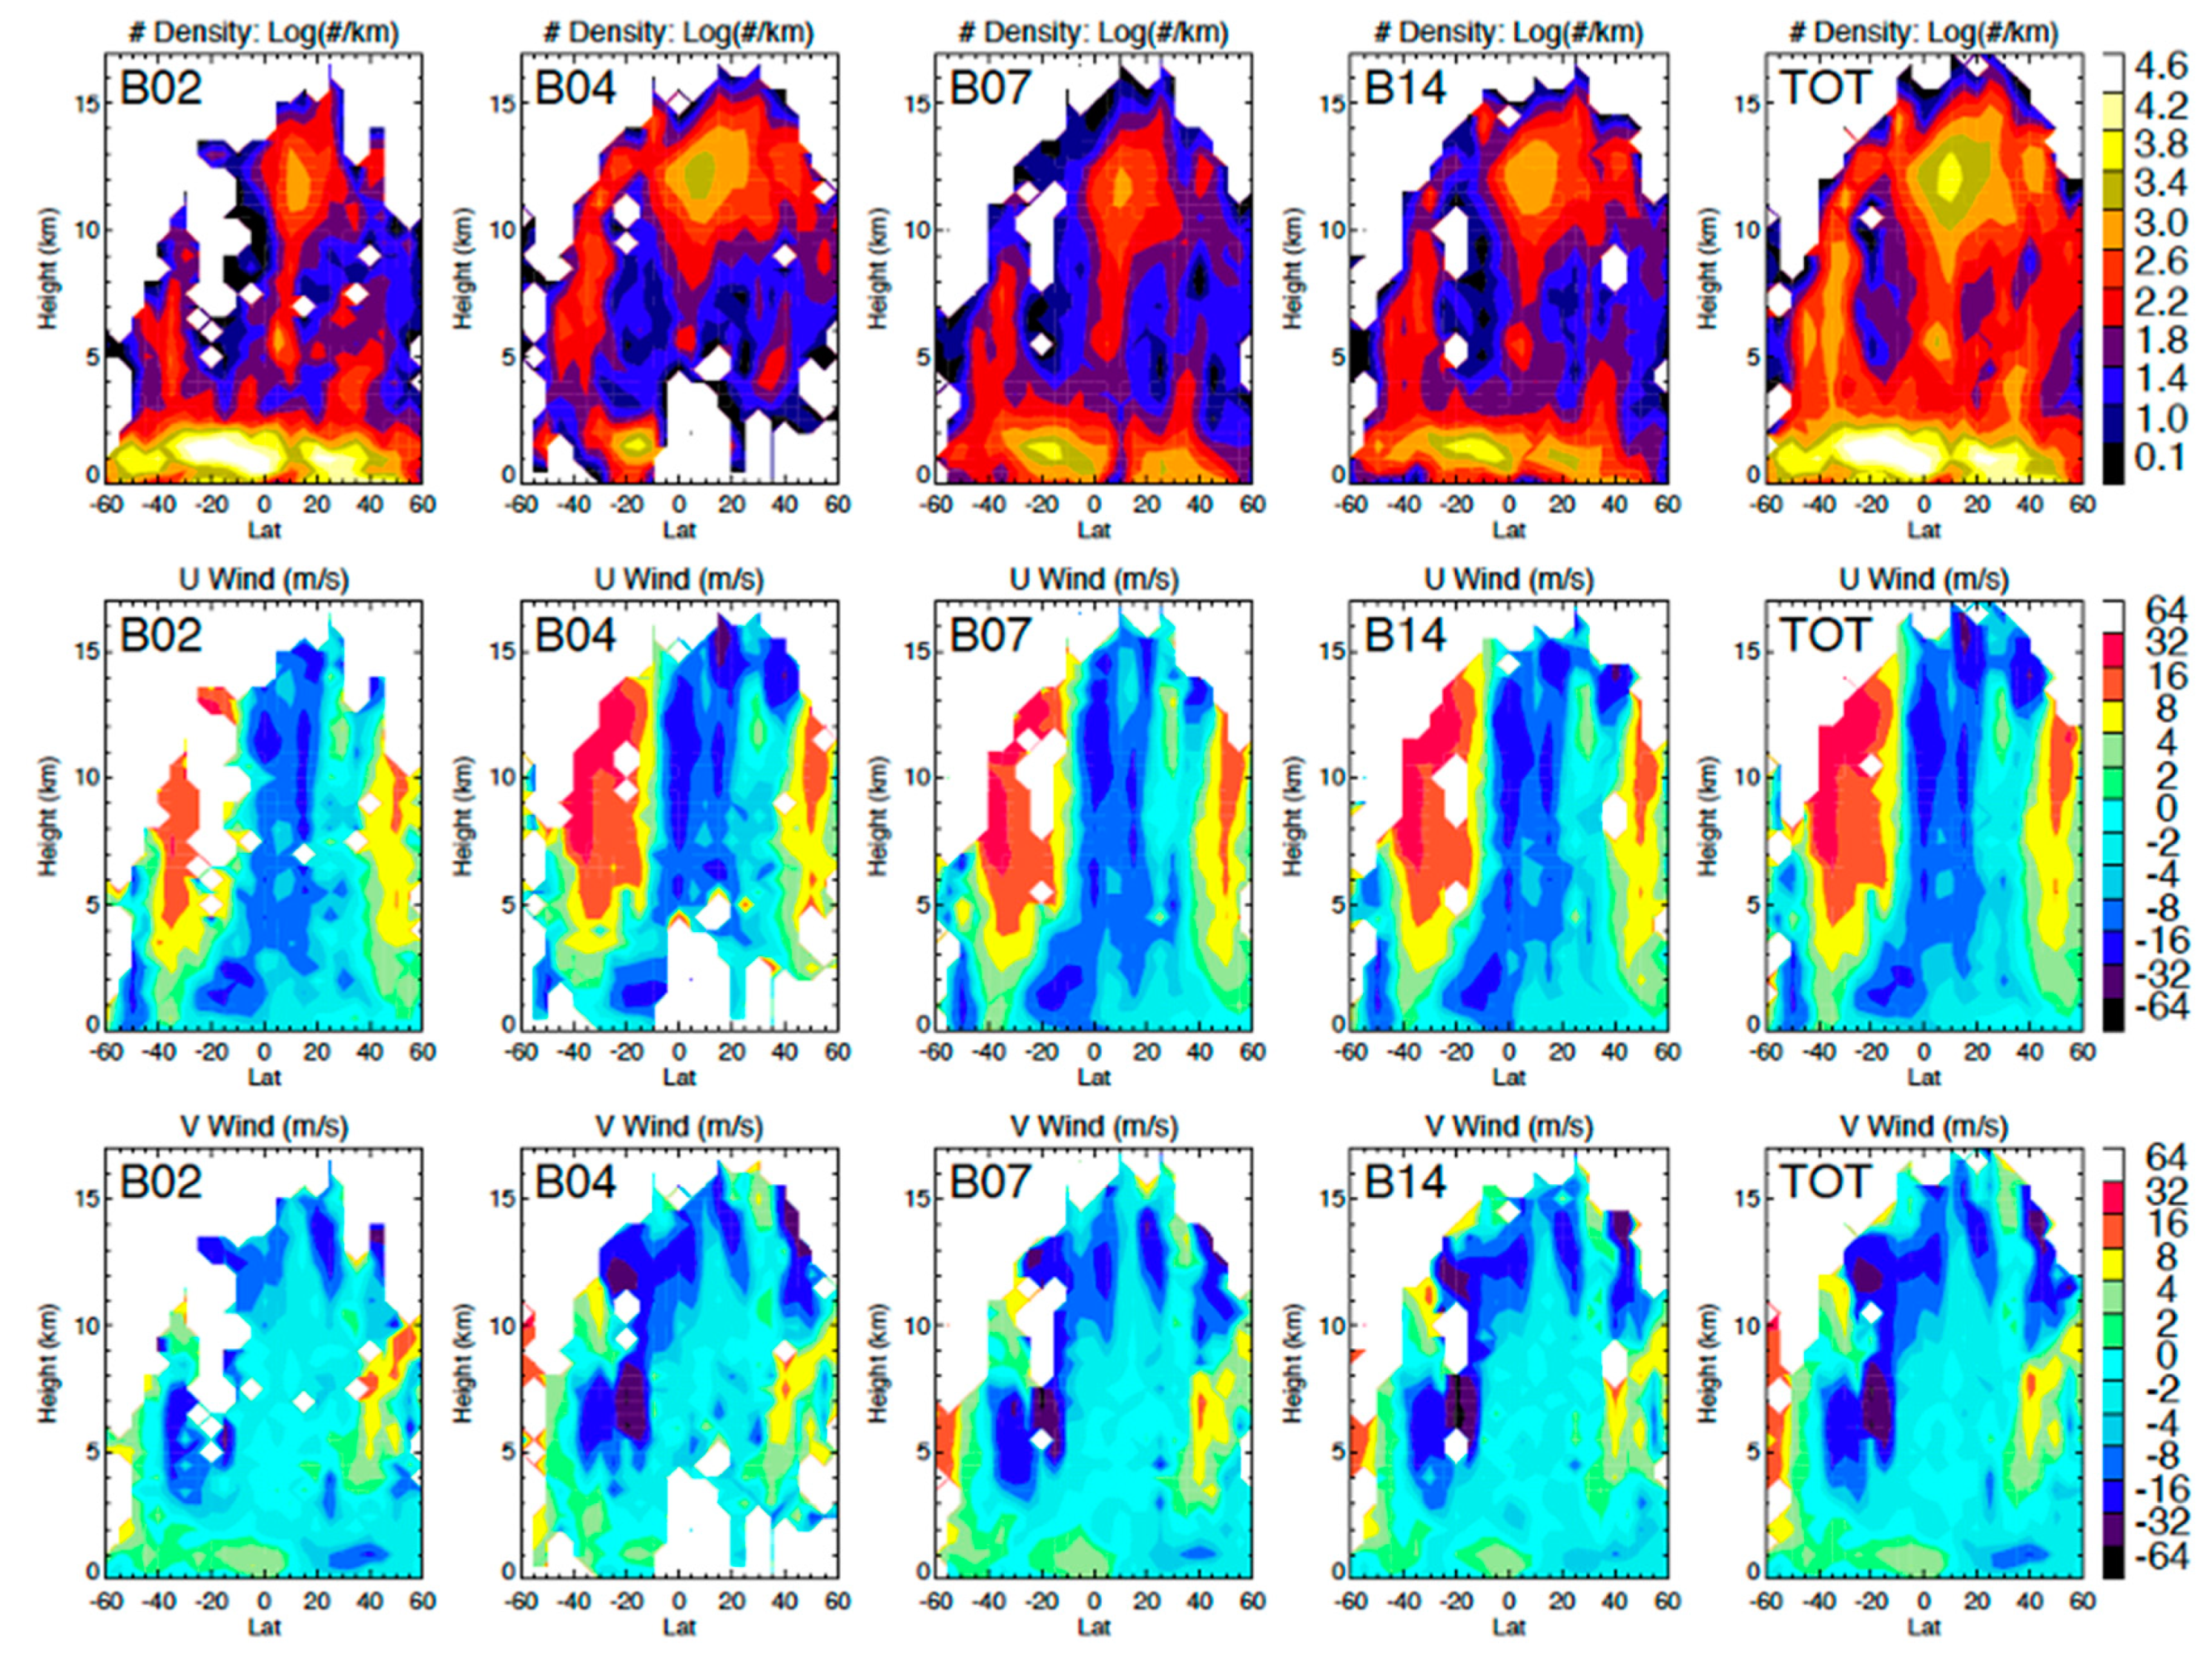
Each ABI spectral channel may feature different cloud layers due to their different sensitivities to cloud reflectivity, emission, and scattering. Four spectral channels (two reflective and two emissive) were used to illustrate the distribution differences of stereo-height retrievals (Figure 11 and Figure 12) from the NASA code. The red-band visible channel (B02) retrieved stereo heights at all levels with most measurements at low levels, because cirrus clouds had poorer contrast in the presence of low-level clouds. On the other hand, the reflective short-wave IR (SWIR) ‘cirrus band’ (B04) was sensitive mostly to daytime high-level clouds due to the strong water vapor absorption in this band. Unless the upper troposphere was very dry, low-level clouds were ‘invisible’ or featureless in B04. The vertical distributions of stereo-height retrievals from these two bands reflected their differences in sensitivity. As seen Figure 11, most of the oceanic PBL clouds in B02 retrievals were not present in B04, while a significant number of high clouds were reported by B04 at high latitudes and over landmasses. Cirrus anvil outflows in the tropics and above the mid-latitude jet stream overwhelm the B04 retrievals in comparison with B02. In the southeastern Pacific where the downwelling branch of Hadley circulation produced a dry upper troposphere, both B02 and B04 retrievals yielded a large amount of low-level clouds over the marine PBL. Compared with Band 4, B02 had the advantage of observing smaller spatial cloud structures and could track these features at a lower altitude more readily in a broken cloudy scene because of its finer resolution.
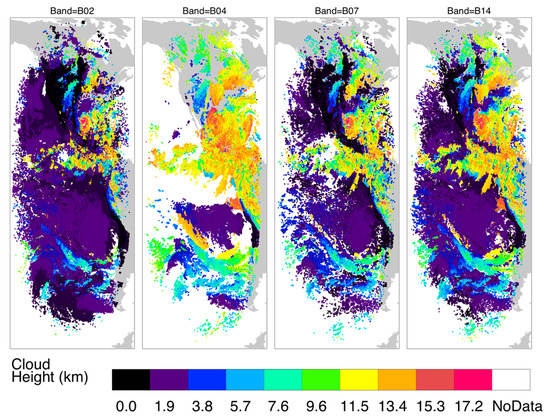
Figure 11.
Spatial distribution of FD–FD cloud height retrievals from four GOES-16 and -17 spectral bands on 25 July 2020, 17:20 Z when Hurricane Hanna is evident in the Gulf of Mexico. A 12 pixel × 12 pixel template size and 6 pixel × 6 pixel sampling size are used in the retrieval configuration. A total of 103,744, 97,030, 110,505, and 146,571 good retrievals are produced for Bands 2, 4, 7, and 14, respectively, whereas B02 has a 4× better resolution than the other bands. Cloud heights greater than 17.2 km are assigned to this maximum value. No cloud masking is applied to stereo height retrievals.
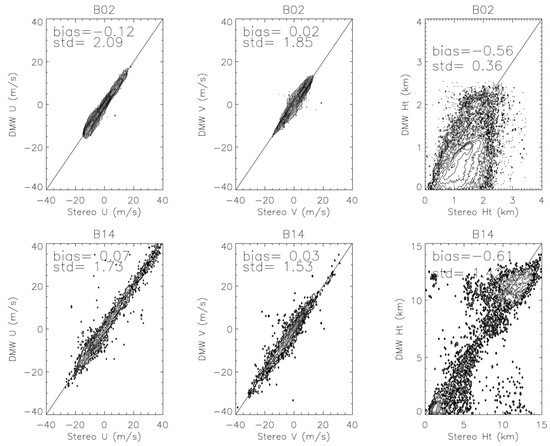
Figure 12.
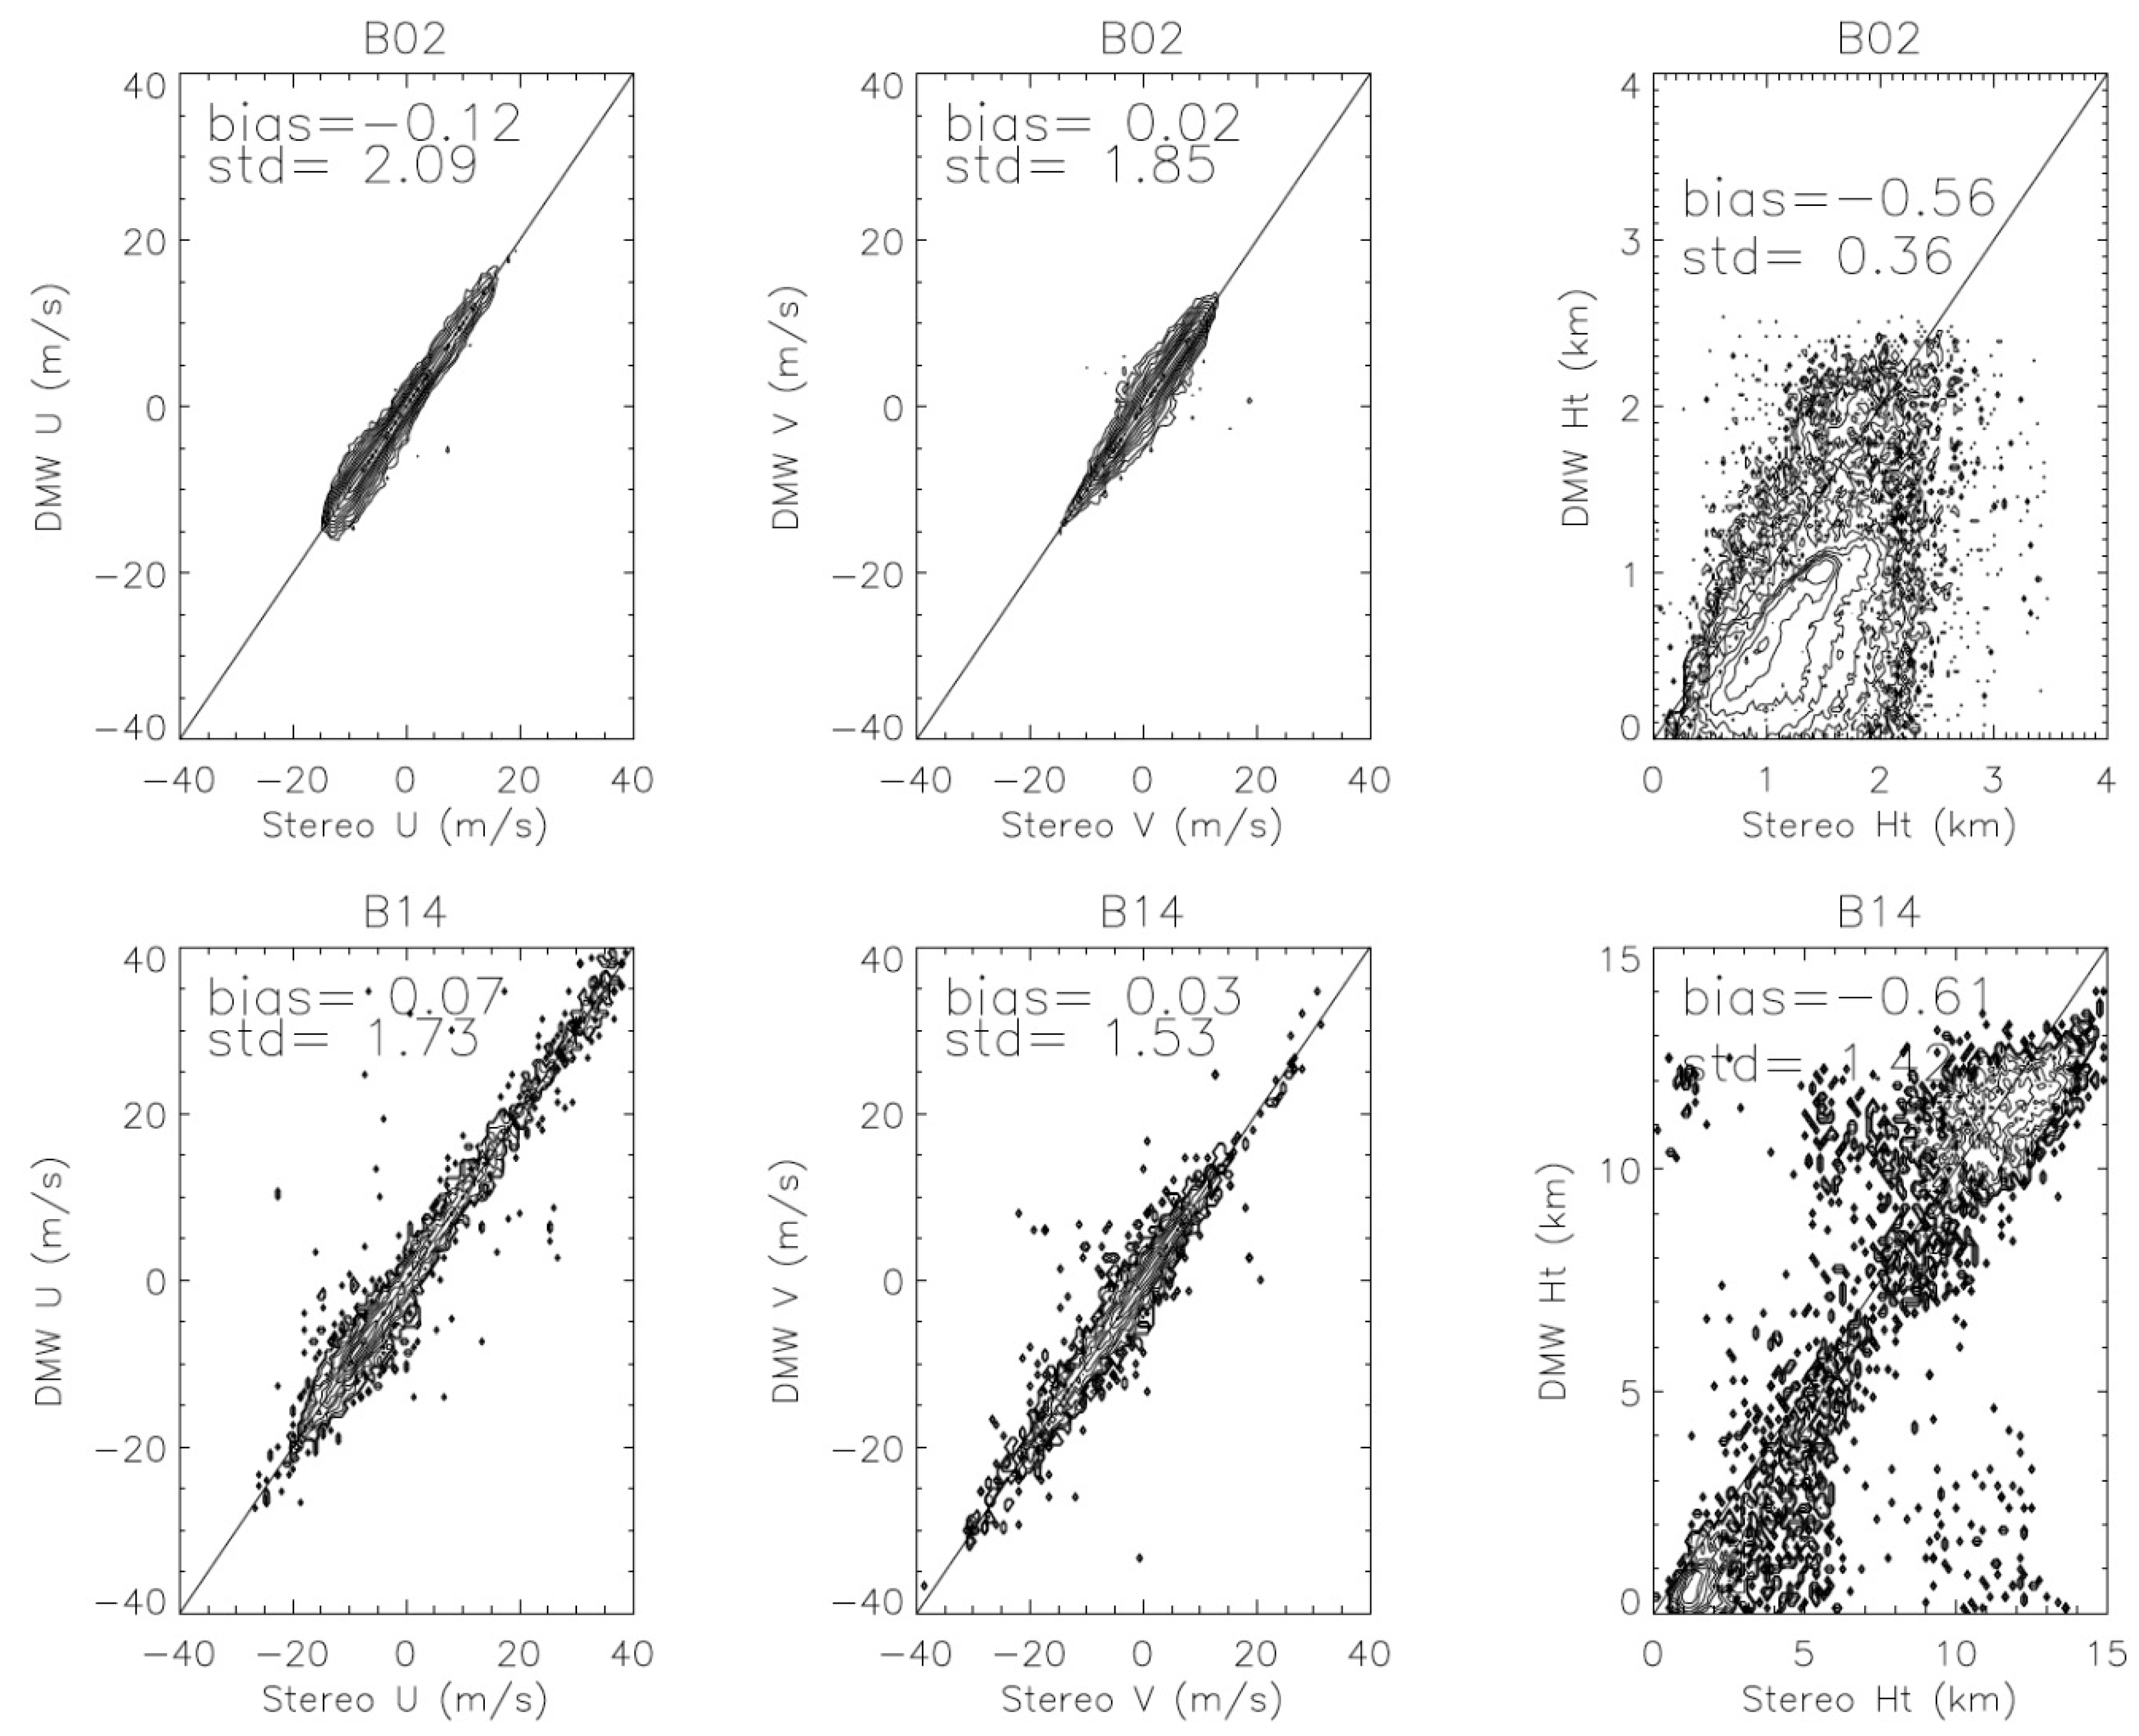
Comparisons of GOES-16/GOES-17 stereo winds/heights with GOES-16 derived motion wind (DMW) winds/heights for Bands 2 (top panel) and 14 (bottom panel) for u, v, and height measurements from the same frame in Figure 11. A 2 D histogram of number density is shown for each variable with logarithmic contour levels (, n = 1, 2, etc.). The number of stereo-wind retrievals is roughly twice of the DMW samples in the same region. To obtain the collocated measurements in the stereo-wind and DMW data, a 0.2° × 0.2° longitude-latitude box is centered around each DMW measurement and the median value of the stereo-wind observations in the box is used to compare with the DMW observation.
The stereo-wind retrievals from GOES-16/17 are generally consistent with the operational AMV product, namely the NOAA Level-2 derived motion winds (DMWs), whereas significant differences are found between the stereo height and the IR height assigned to a DMW. As shown in Figure 12 for B02 and B14, both u and v winds exhibited a small bias between stereo winds and DMWs. There is a significant standard deviation in the u and v wind differences, 2.1 and 1.9 m/s for B02 and 1.7 and 1.5 m/s for B14, which is expected for the stereo and DMW measurements as their sampling resolution, template size, and solution to the observed disparities are different. In collocating the stereo-wind and DMW measurements, we used only the median value of stereo winds inside the 0.2° × 0.2° longitude-latitude box centered at the DMW site, to compare with DMW. This pairing method is likely impacted by mesoscale variabilities, which can contribute to the standard deviation of wind differences. Due to the higher spatial resolution with B02 stereo winds, the contribution from mesoscale variabilities was expected to be larger than B14.
Large differences between the stereo and IR heights revealed the value of using the stereoscopic technique for height assignment (Figure 12). For the B02 comparison, the DMW observations did not report any measurements at heights > 3 km, because of difficulties in height assignment with the IR method for higher clouds. Even for the low-level DMWs, which were mostly from PBL clouds, the height differences show a relatively large bias (−0.56 km) and a standard deviation of 0.36 km, with the DMW height being lower than the stereo height. For the B14 comparison, the DMW heights covered the entire troposphere, showing a generally low bias (−0.61 km) and a standard deviation of 1.42 km against the stereo height. The DMW heights in both lower- and upper-tropospheric cloud clusters seemed to show the low bias. In addition, there were a significant fraction of measurements in the mid-to-upper troposphere where the DMW height was higher than the stereo height. These were likely the broken cloud cases where the IR method assigned the height with a cold pixel, whereas the cloud pattern was determined by the features at a lower altitude. There were no DMW products from the B04 and B07 channels.
The mid-wave IR (MWIR) B07 and long-wave IR (LWIR) B14 channels show good sensitivity to both high and low-level clouds, but their sensitivity to cirrus was significantly better than B02. The different balance between high and low clouds was evident in the maps (Figure 11) and zonal mean height statistics (Figure 13). Despite the same pixel resolution, B14 generally produced more stereo-height retrievals than B07, which was consistent with the results found in the MODIS-GOES 3D-wind study [11]. However, B07 may have an advantage in future missions because its shorter wavelength enables sharp imaging with smaller aperture optics. As demonstrated with B02, images with a higher pixel resolution helped to detect and track more cloud features for AMVs. In addition to the high- and low-level clouds, a distinct cloud type could be retrieved from the stereoscopic technique, which are tropical congestus clouds in the mid-troposphere (Figure 13). As summarized in a comparative study of different cloud remote sensing techniques [38], congestus clouds are often smeared out with the IR-based height assignment, as opposed to stereoscopic and lidar techniques. The ability of detecting congestus clouds has an important implication for understanding atmospheric instability and convection development.
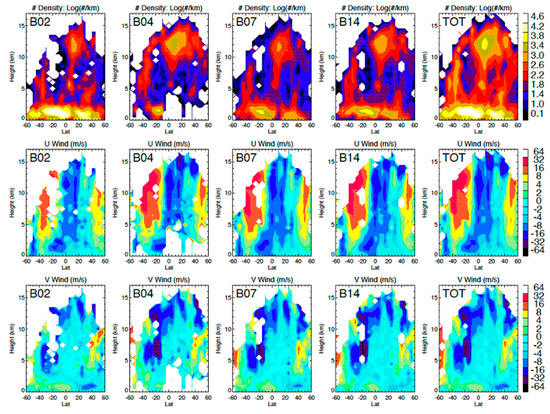
Figure 13.
Zonal mean distributions of cloud height and u- and v-wind retrievals (as in Figure 11) for the four spectral bands as a function of latitude and altitude. The TOT is the averaged zonal mean of the results from four spectral bands for the entire domain of FD–FD retrievals.
The combined sampling from the four spectral bands can fill the altitude gaps of AMV measurements. As revealed in Figure 13, B02 had a wide coverage of low-level winds while Bands 4, 7, and 14 helped to fill the mid- and upper-tropospheric winds. For global data assimilation (DA) systems, this improved vertical sampling would increase the impacts of AMV measurements in the mid-troposphere. With a better height assignment for low-level clouds, as suggested in observing system experiment (OSE) studies [39,40], more AMVs in PBL would reduce the global moisture energy error in the DA systems. In the East Pacific and America sector, the zonal mean AMVs revealed two eastward upper-tropospheric jets at mid-to-high latitudes and a weak westward flow in the tropics. These zonal means were biased towards a cloudy atmosphere, showing that the jet in the Southern Hemisphere (SH), 40 m/s in the zonal wind, was stronger than one in the Northern Hemisphere (NH). The meridional winds within the jets appeared to have a reversal at 8 km in the SH and 9 km in the NH, with a poleward flow below and an equatorward flow above that altitude. In the tropics the intertropical convergence zone (ITCZ) is characterized by several converging and diverging latitude bands in the upper troposphere, and a converging band at 10° N in the PBL. For all these features, the 3D-wind algorithm demonstrated the vertical resolution needed to study the dynamics and their structural evolution with time.
3.2.2. Water Vapor Features
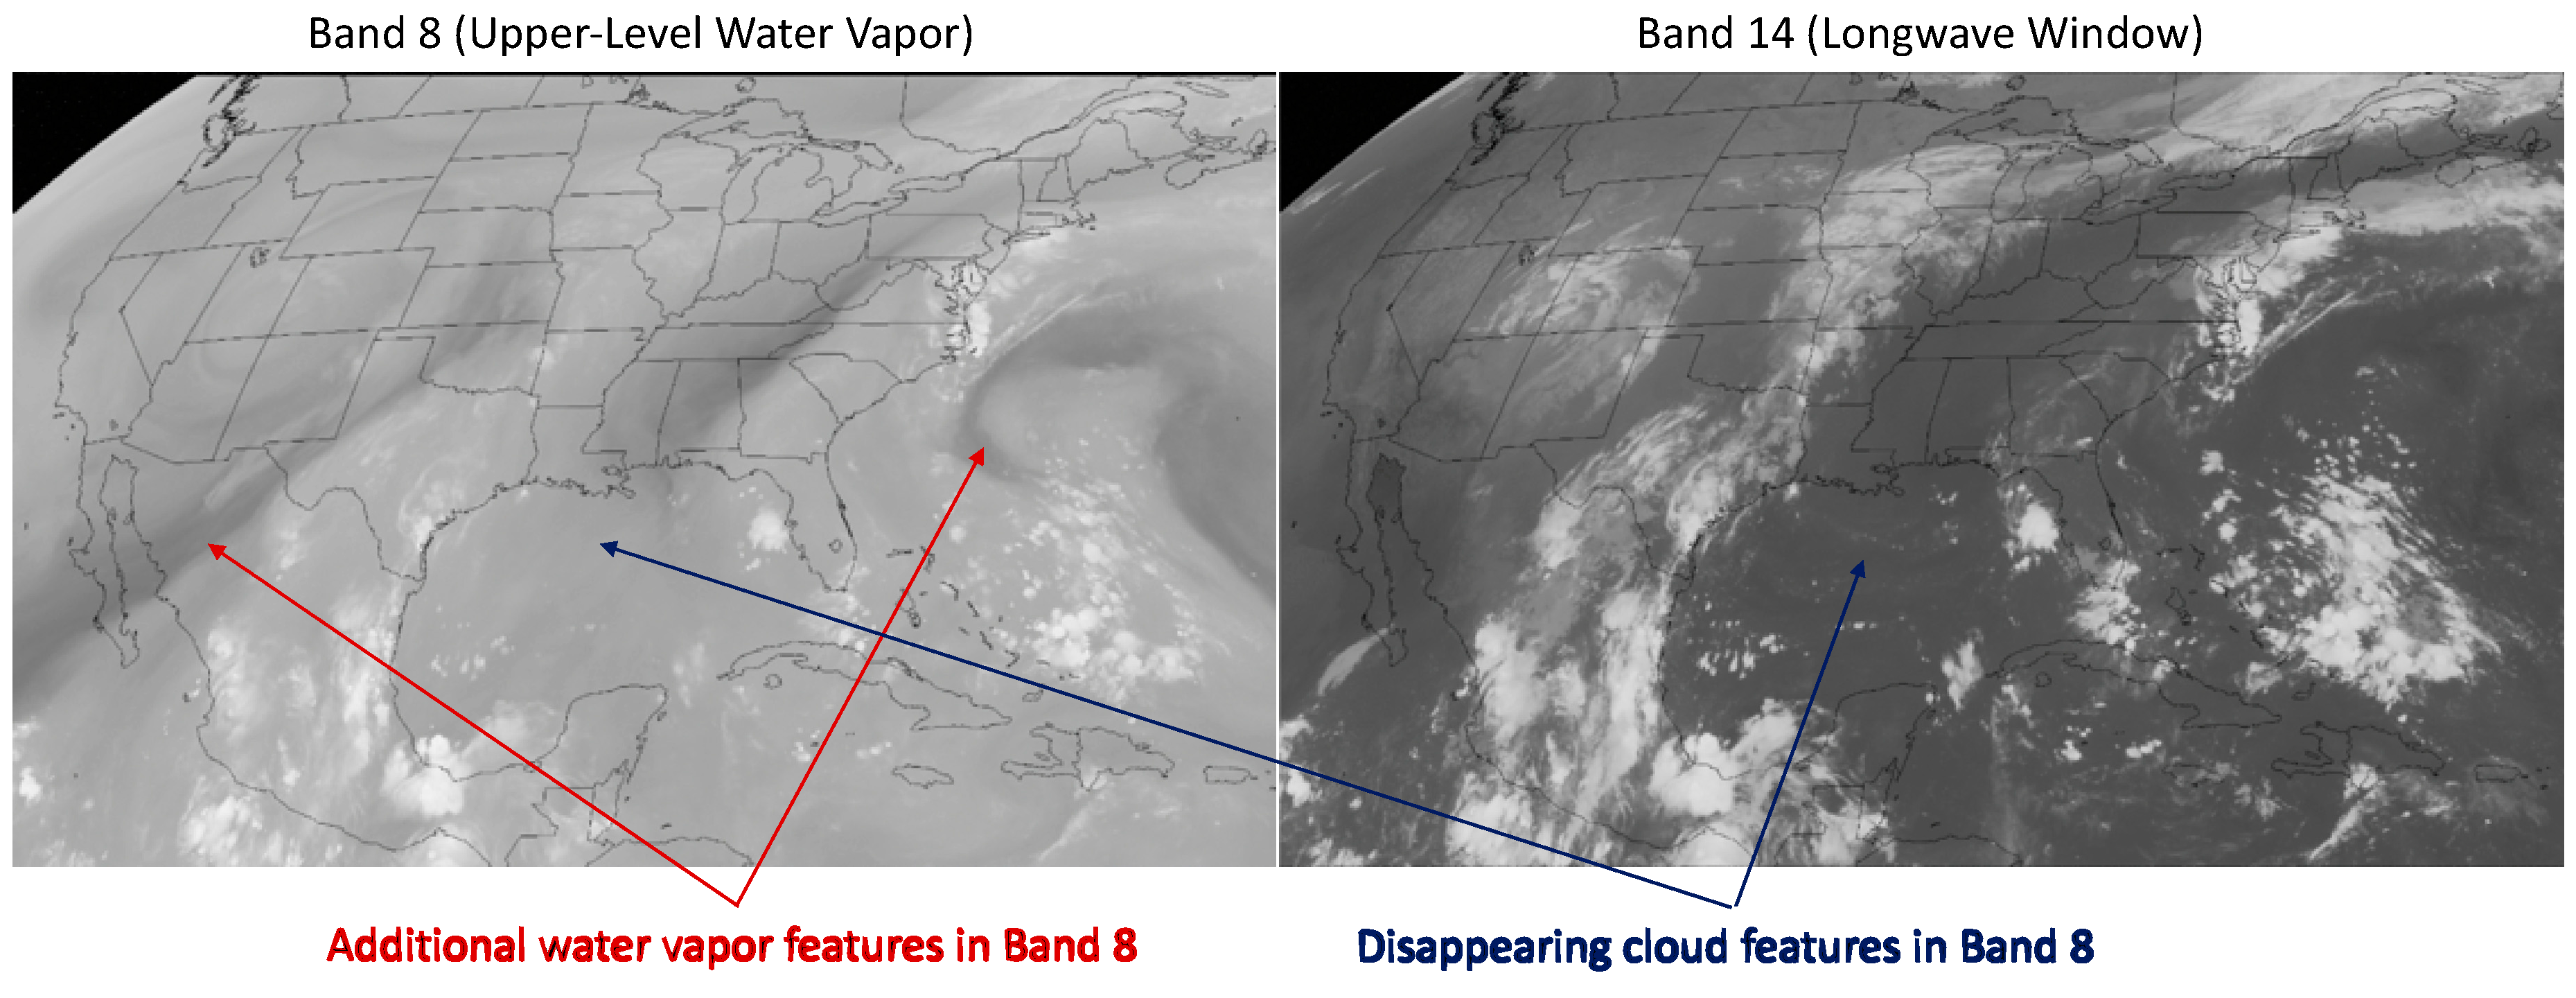
The water vapor (WV) emissions at thermal IR wavelengths (Bands 8–10) produce brightness temperature gradients that can be tracked for AMV detection [41]. One of the advantages of using WV features is that they help to extend AMV measurements into cloud-free regions. WV features tend to have a larger spatiotemporal correlation length than cloud features in IR or VIS images. Some of the trackable WV features are shown in Figure 14 for B08, which has a radiative-transfer weighting function favoring the upper troposphere. Due to strong WV emission and absorption, low-level cloud features seen by an IR window channel (e.g., B14) were mostly absent in B08. A disadvantage with WV tracking is that there can be cases where winds flow in the direction parallel to the WV gradient [42] and then derived AMVs would not accurately represent winds.
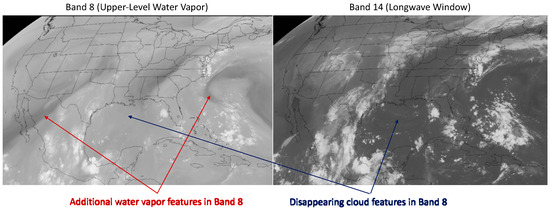
Figure 14.
Water vapor (WV) and cloud features as seen B08 and B14 from 10 September 2020 at 12 Z (CONUS image credit: Space Science and Engineering Center at the University of Wisconsin).
Compared to an IR window channel (e.g., B14), the WV channels from Bands 8 (upper-level), 9 (mid-level), and 10 (lower-level) produced significantly more AMVs in the upper troposphere (Figure 15). As shown in Figure 14, a WV channel could also detect upper-tropospheric cloud features, and therefore the increased number of AMVs was a result of more trackable atmospheric features (clouds and WV gradients) in the upper troposphere from Bands 8–10. Although Band 10 was designed to have a WV weighting function favoring the lower troposphere, the stereo-wind results only show a moderate increase in the AMVs there, most of which were found at the latitudes with a relatively drier upper troposphere.
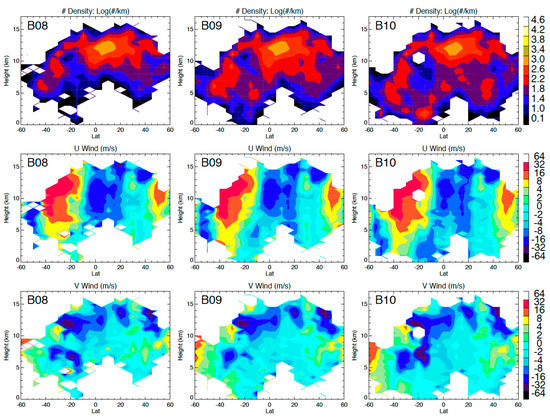
Figure 15.
As in Figure 13 but for WV Bands 8–10. A template size of 24 × 24 was used for these stereo-wind retrievals.
To further quantify the relative importance of WV features to the total number of AMVs from the IR channels, we compared the AMV yield percentage of B08 (WV + clouds) with B14 (clouds only) for different template sizes (Table 4). Since WV features are characterized by a larger (meso-to-synoptic) spatial scale, we speculated that the yield percentage would increase with the template size used in the stereo-wind pattern matching. Since B08 AMVs contain both cloud and WV features, we used the ratio of the number of B08 AMVs over B14 as an indicator of the WV contribution to the total AMVs. Table 4 compares this ratio for four template sizes from 12 pixels × 12 pixels to 96 pixels × 96 pixels in two height ranges (>2 km and >5 km). For both height ranges, the ratio shows a consistent increase with template size, confirming the increased contribution of WV AMVs as larger features were tracked in the mid-to-upper troposphere. The analysis shows that additional 60% of AMVs come from WV features at heights > 2 km and 90% at heights > 5 km, if the 48 × 48 template size was used.

Table 4.
Yield comparisons of stereo-wind retrievals in the mid- and upper-troposphere.
3.3. Applications
The GEO–GEO stereo-wind technique now enables new science investigations of the atmospheric processes that require full diurnal sampling at the mesoscale and accurate knowledge of height variations. As shown in this section, fast processes such as deep convective clouds and fire plumes can benefit particularly from the 10-min GEO–GEO refresh with the IR channels, to study the lifecycle of tropical cyclones and wildfire development/transport. In addition, the accurate (300 m) stereo-wind height retrievals have a great potential for tracking and characterizing planetary boundary layer clouds and their structural evolution. In the following we will illustrate these science applications with the stereo-wind retrievals for Tropical Storm Imelda (2019), Hurricane Hanna (2020), California Creak Fire (2020), and marine stratus/stratocumulus in the Southeastern Pacific.
3.3.1. Deep Convection from Tropical Cyclones
GEO–GEO stereo imaging has the advantage of tracking deep convective systems continuously and 24 hours per day in the TIR channels. To illustrate the evolution of the deep convective dynamics, we applied the stereo GEO–GEO algorithm to Tropical Storm Imelda (2019) and Hurricane Hanna (2020) on consecutive days during a period just before their respective landfalls. B07 and B14 from CONUS-FD pairs were used for the stereo height and AMV retrievals with a 10-min refresh rate. We included B07 in this comparison, because the MWIR channel has the potential for improved pixel resolution in future GEO missions. Although the GOES-R ABI has the same pixel resolution for B07 and B14, the diffraction limit for B07 was 3× better than B14 for the same optical aperture.
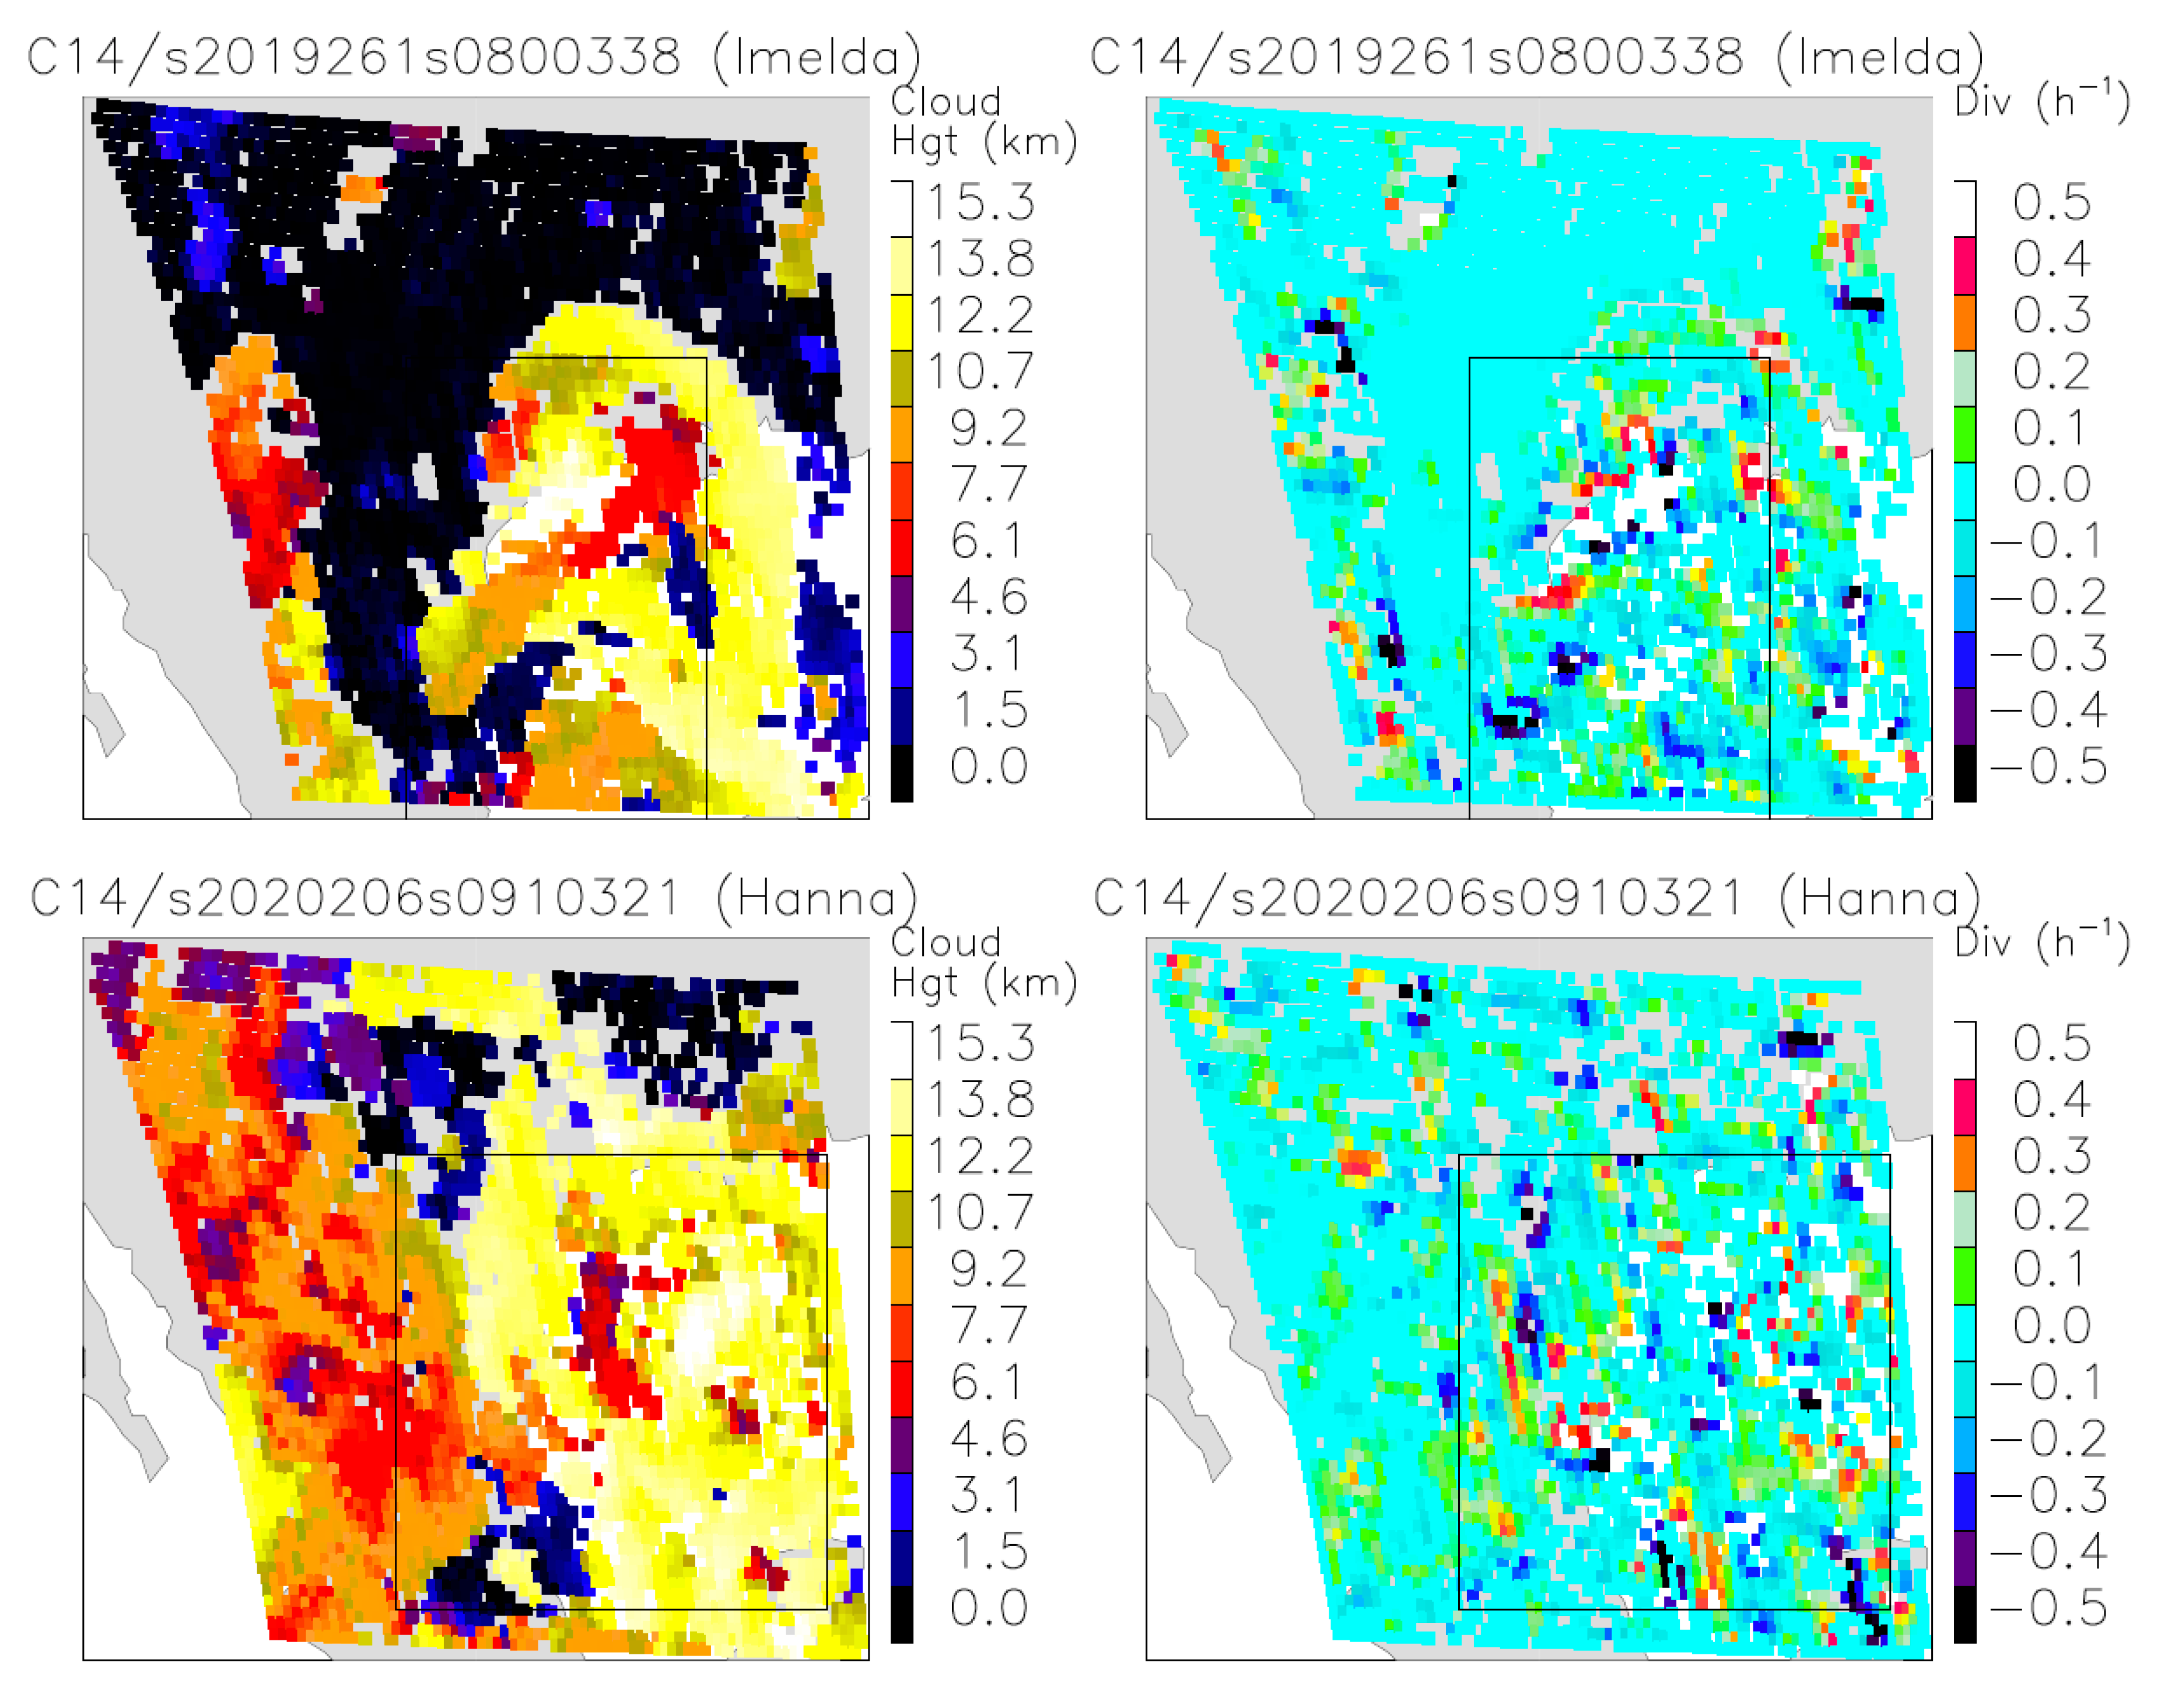
To process the large GOES-16/17 data set, we developed scripts to parallelize and run the stereo-winds research algorithm seamlessly on NASA’s supercomputer Discover. Figure 16 shows the regions of interest where the stereo-wind high-cloud fraction and divergence retrievals for Imelda and Hanna were mapped at the time shortly before landfall. The embedded box indicates the area where the area−average time series were computed. The high-cloud fraction and cloud-top divergence were derived from the stereo-wind 10-min retrievals, whereas the precipitation was extracted from the global precipitation measurement (GPM) half-hourly integrated multisatellite retrievals for GPM (IMERG) data using NASA’s Giovanni search tool.
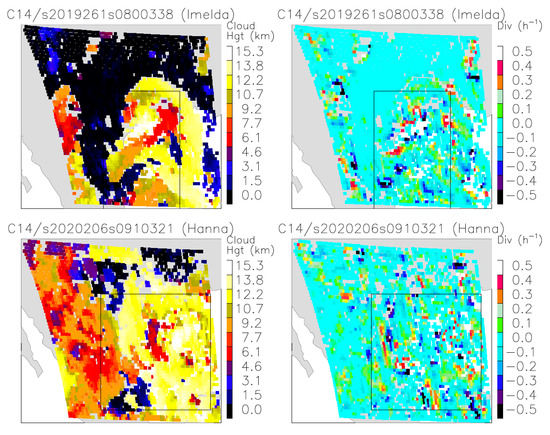
Figure 16.
A snapshot of Tropical Storm Imelda (2019) and Hurricane Hanna (2020) cloud height (left panels) and cloud top (>10 km) divergence (right panels) retrieved from B14. The stereo-wind retrievals are made from the CONUS-FD pairing with 10-min sampling. The box in each case indicates the region of interest for comparison with the domain-average precipitation data. For Imelda, the box area is (110° W–98° W, 32° N–38° N) and for Hanna it is (110° W–100° W, 30° N–35° N).
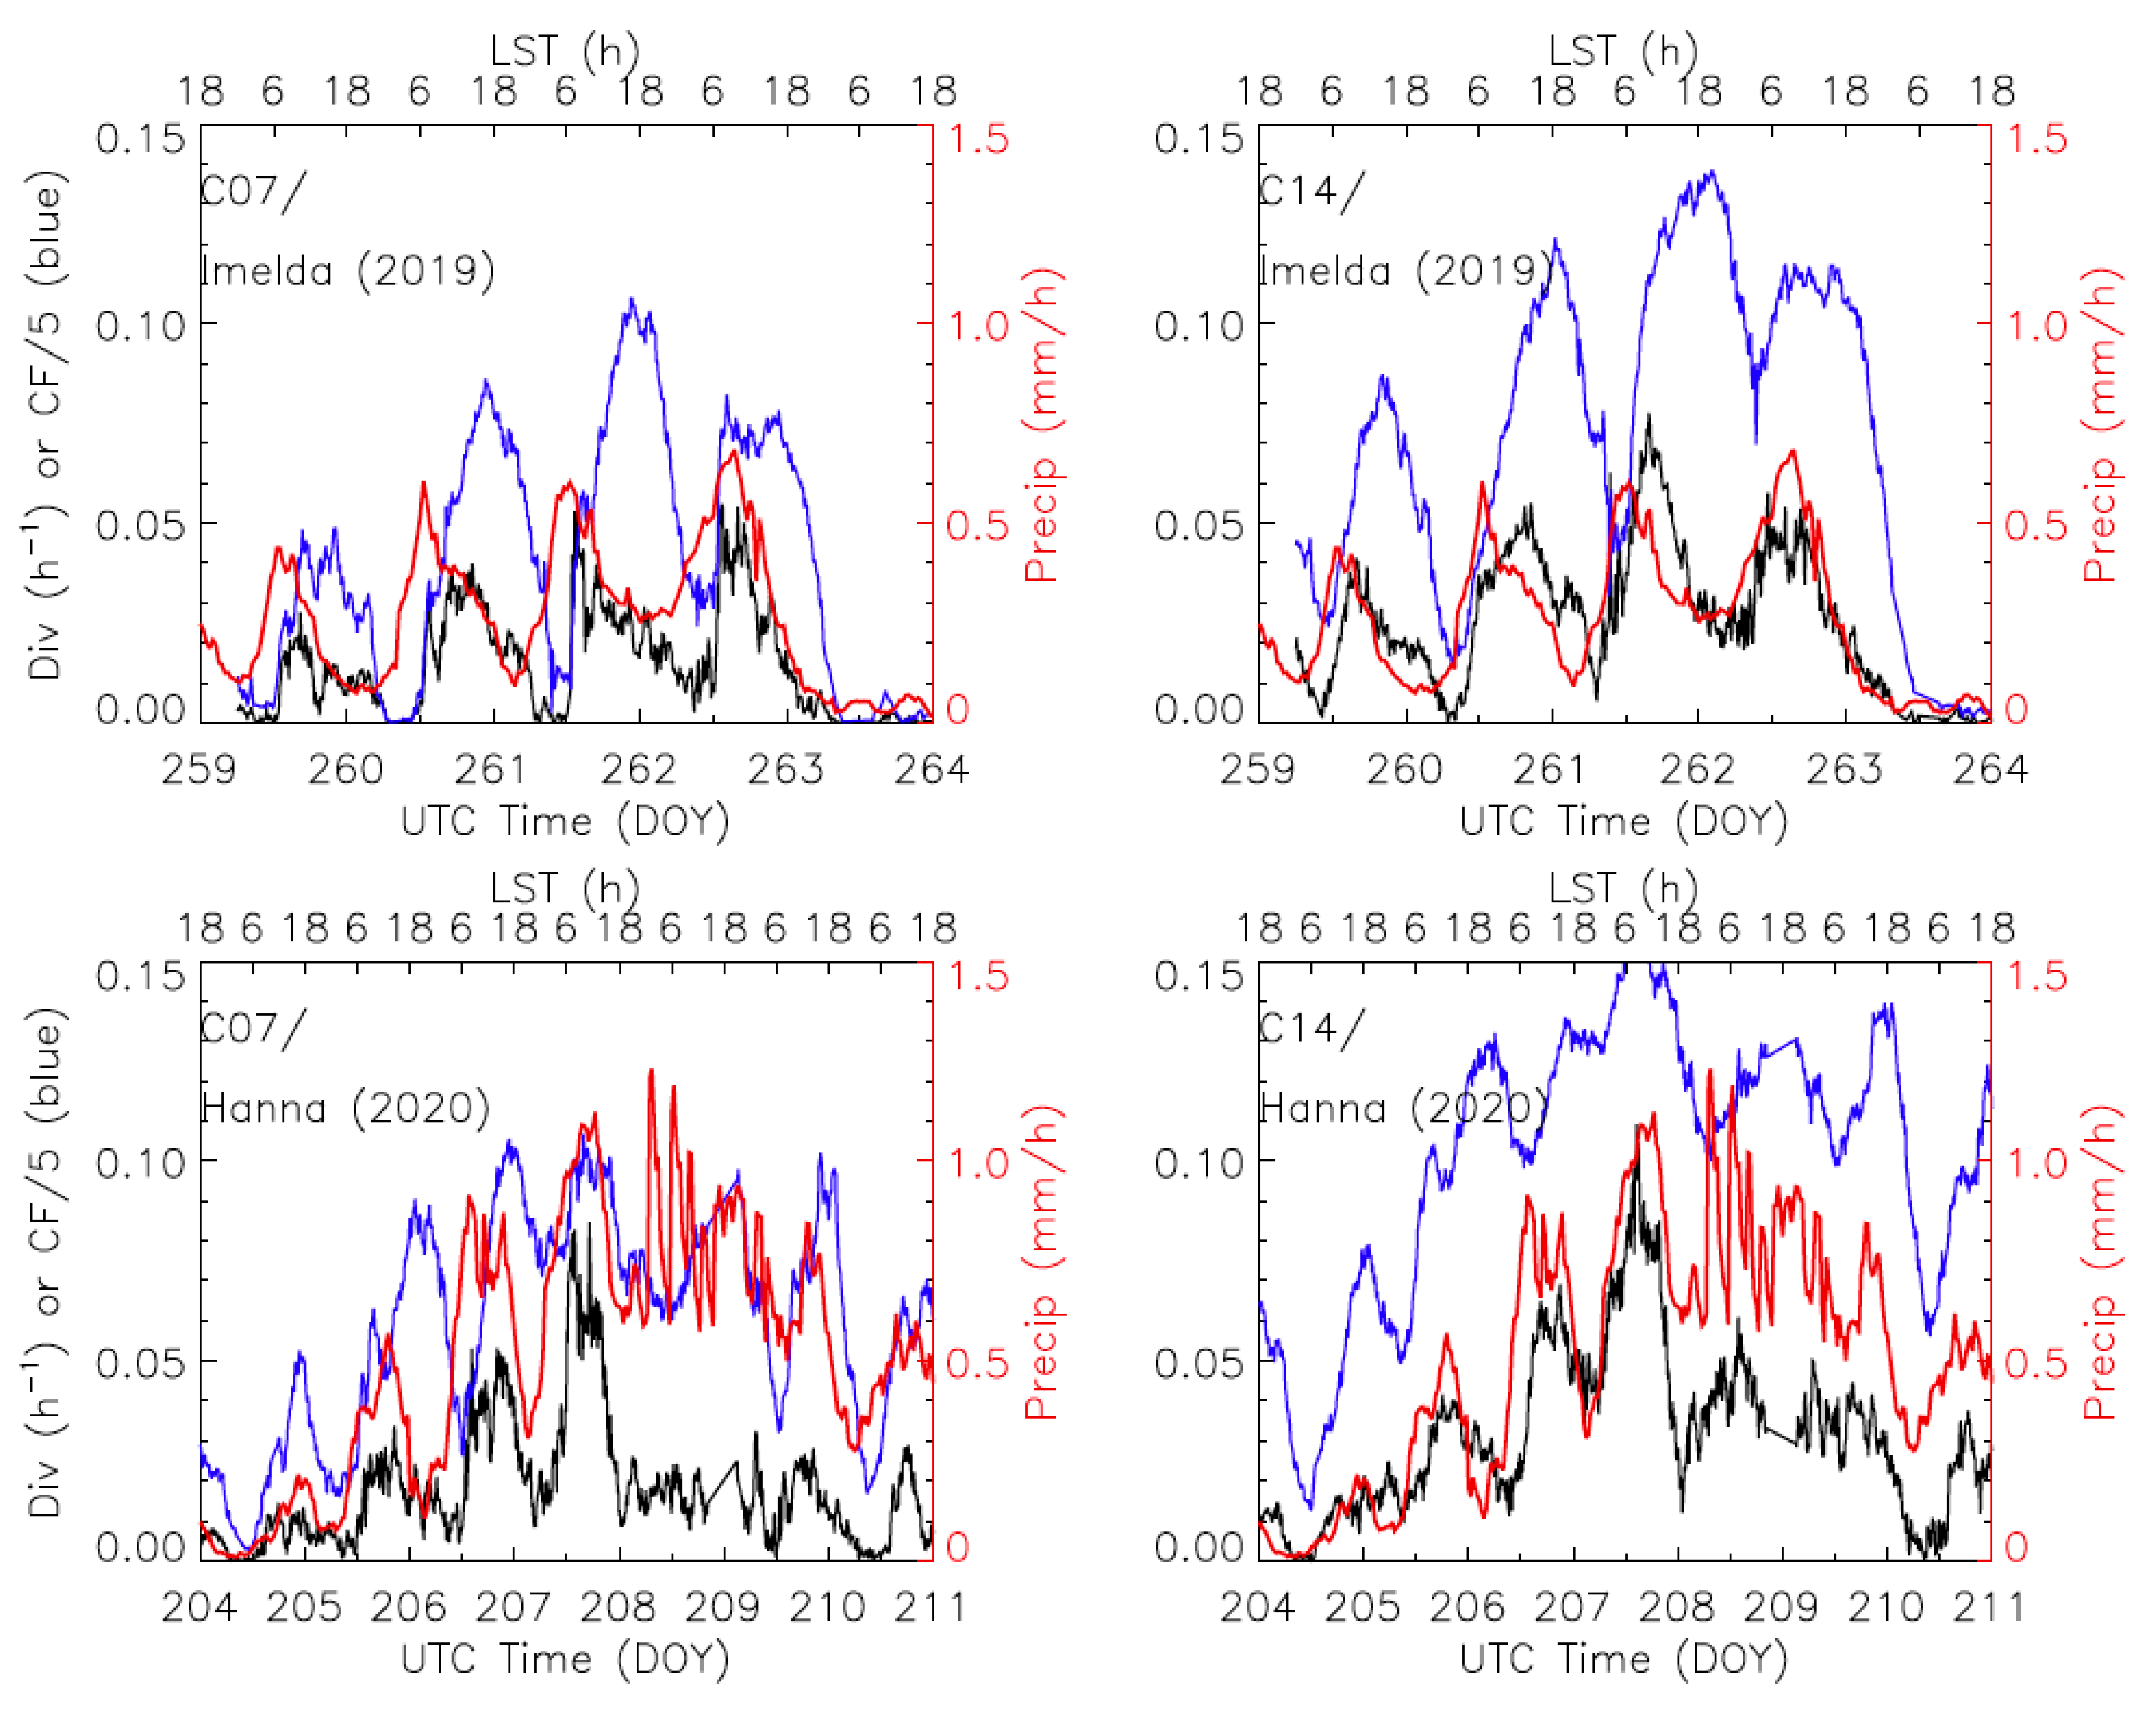
Figure 17 shows a strong diurnal variation in the area-averaged high-cloud fraction, divergence, and precipitation during the cyclone’s intensified period. Imelda had a short lifetime after its formation in the Gulf of Mexico on 14 September (Day 257). It rapidly developed into a tropical storm before reaching the east coast of Texas on 17 September (Day 260). Imelda weakened substantially after landfall, but it brought large amounts of flooding rain to Texas and Louisiana. As seen in Figure 17, the diurnal cycle of the stereo-wind divergence lags the precipitation cycle by 6 hours, followed by the high-cloud fraction. While the divergence and high-cloud fraction rose nearly simultaneously at the beginning of a diurnal cycle, the peak of cloud fraction was significantly lagging behind the divergence peak, which was expected as the increase in high-cloud fraction was initiated by the divergence in a convective system.
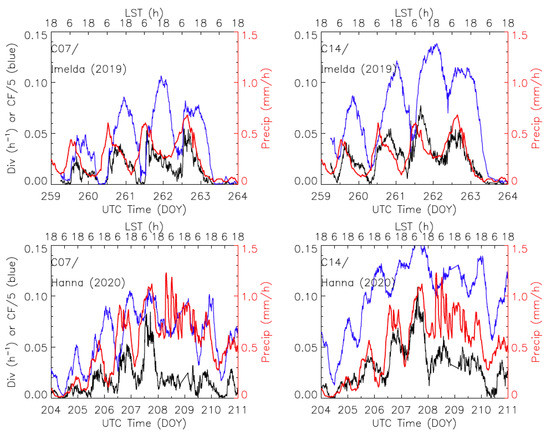
Figure 17.
Time series of area-averaged cloud top divergence (black), precipitation (red) and high-cloud fraction (blue) for Imelda (2019) and Hanna (2020). The area-averaged divergences and high-cloud fraction from B07 (left) and B14 (right) are obtained from the measurements with cloud top heights > 10 km in the box area (as indicated in Figure 16). The cloud fraction is divided by 5 to plot on the divergence scale. The divergence value is normalized by the total number of observations available in the domain, to reflect an area mean of divergence strength (LST = local solar time).
The diurnal cycles of cyclone rainfall and deep convection over tropical oceans were strongly correlated, showing a maximum in the early morning [43,44]. A study with the 10-year hurricane database from GOES IR imagery shows that the diurnal variation of mature cyclones was driven by the convective pulses near the inner core, which starts in the late afternoon and early evening hours and grows into intense deep convective cells in the early morning [45]. These convective pulses, while growing in intensity, moved away from the core at night and extended 100s of kilometers by the early morning. In the previous study with the high-resolution stereo-wind retrievals, we were able to identify mesoscale divergence flows at the top of Hurricane Michael (2018) [11]. For the peak time of cyclone precipitation, there are significant differences in the diurnal variations between the precipitations in ocean and land environments [46]. The cyclone precipitation over land tends to peak twice: one in early morning and the other in the late afternoon. In the study period shown in Figure 17, both Imelda and Hanna were mostly in an open ocean environment, but the observed lag between the divergence and precipitation warrants further investigation and validation.
The comparison for Hurricane Hanna (2020) in Figure 17 is perhaps a case that requires more validation on the precipitation and divergence measurements. Hanna, also a short-lived hurricane, was formed in the central portion of the Gulf of Mexico on 23 July (Day 205). It strengthened to a Cat-1 hurricane and made landfall in Texas on 25 July (Day 207), before dissipating rapidly over Mexico on 27 July (Day 209). Like Imelda, the similar diurnal variations and lags were observed for Hanna in the area-averaged time series for precipitation, divergence and high-cloud fraction. However, on Day 208 the divergences from B07 and B14 exhibited some significant differences, while the precipitation shows strong oscillations with a large mean. These large oscillations were not evident in either divergence or high-cloud fraction measurements, suggesting a potential issue with the IMERG data. Furthermore, both the divergence and cloud fraction indicate a reduction in the storm intensity, whereas the precipitation data still implies high storm strength. Other than Day 208, comparisons during the rest of the period revealed the consistent lagged correlations among precipitation, divergence, and high-cloud fraction, as found for the Imelda case.
3.3.2. Planetary Boundary Layer (PBL)
As a shallow (<2 km) layer between the surface and the free atmosphere, the PBL has been a challenge for remote sensing from space, because it requires a good vertical resolution to distinguish the layer from the surface and a horizontal resolution better than the mesoscale to resolve its spatial variability. The separation between PBL, surface, and the mid- and upper tropospheric clouds are difficult with radiometric data due to the largely varying lapse rate in atmospheric temperature profiles [47,48,49]. Here the stereoscopic technique provides a new look to the problem without relying on radiometric calibration and lapse rate assumptions. More importantly, the GEO–GEO stereo imaging can track PBL top variations every 10 min, which is critical for studying PBL cloud lifecycle and transition between different cloud regimes.
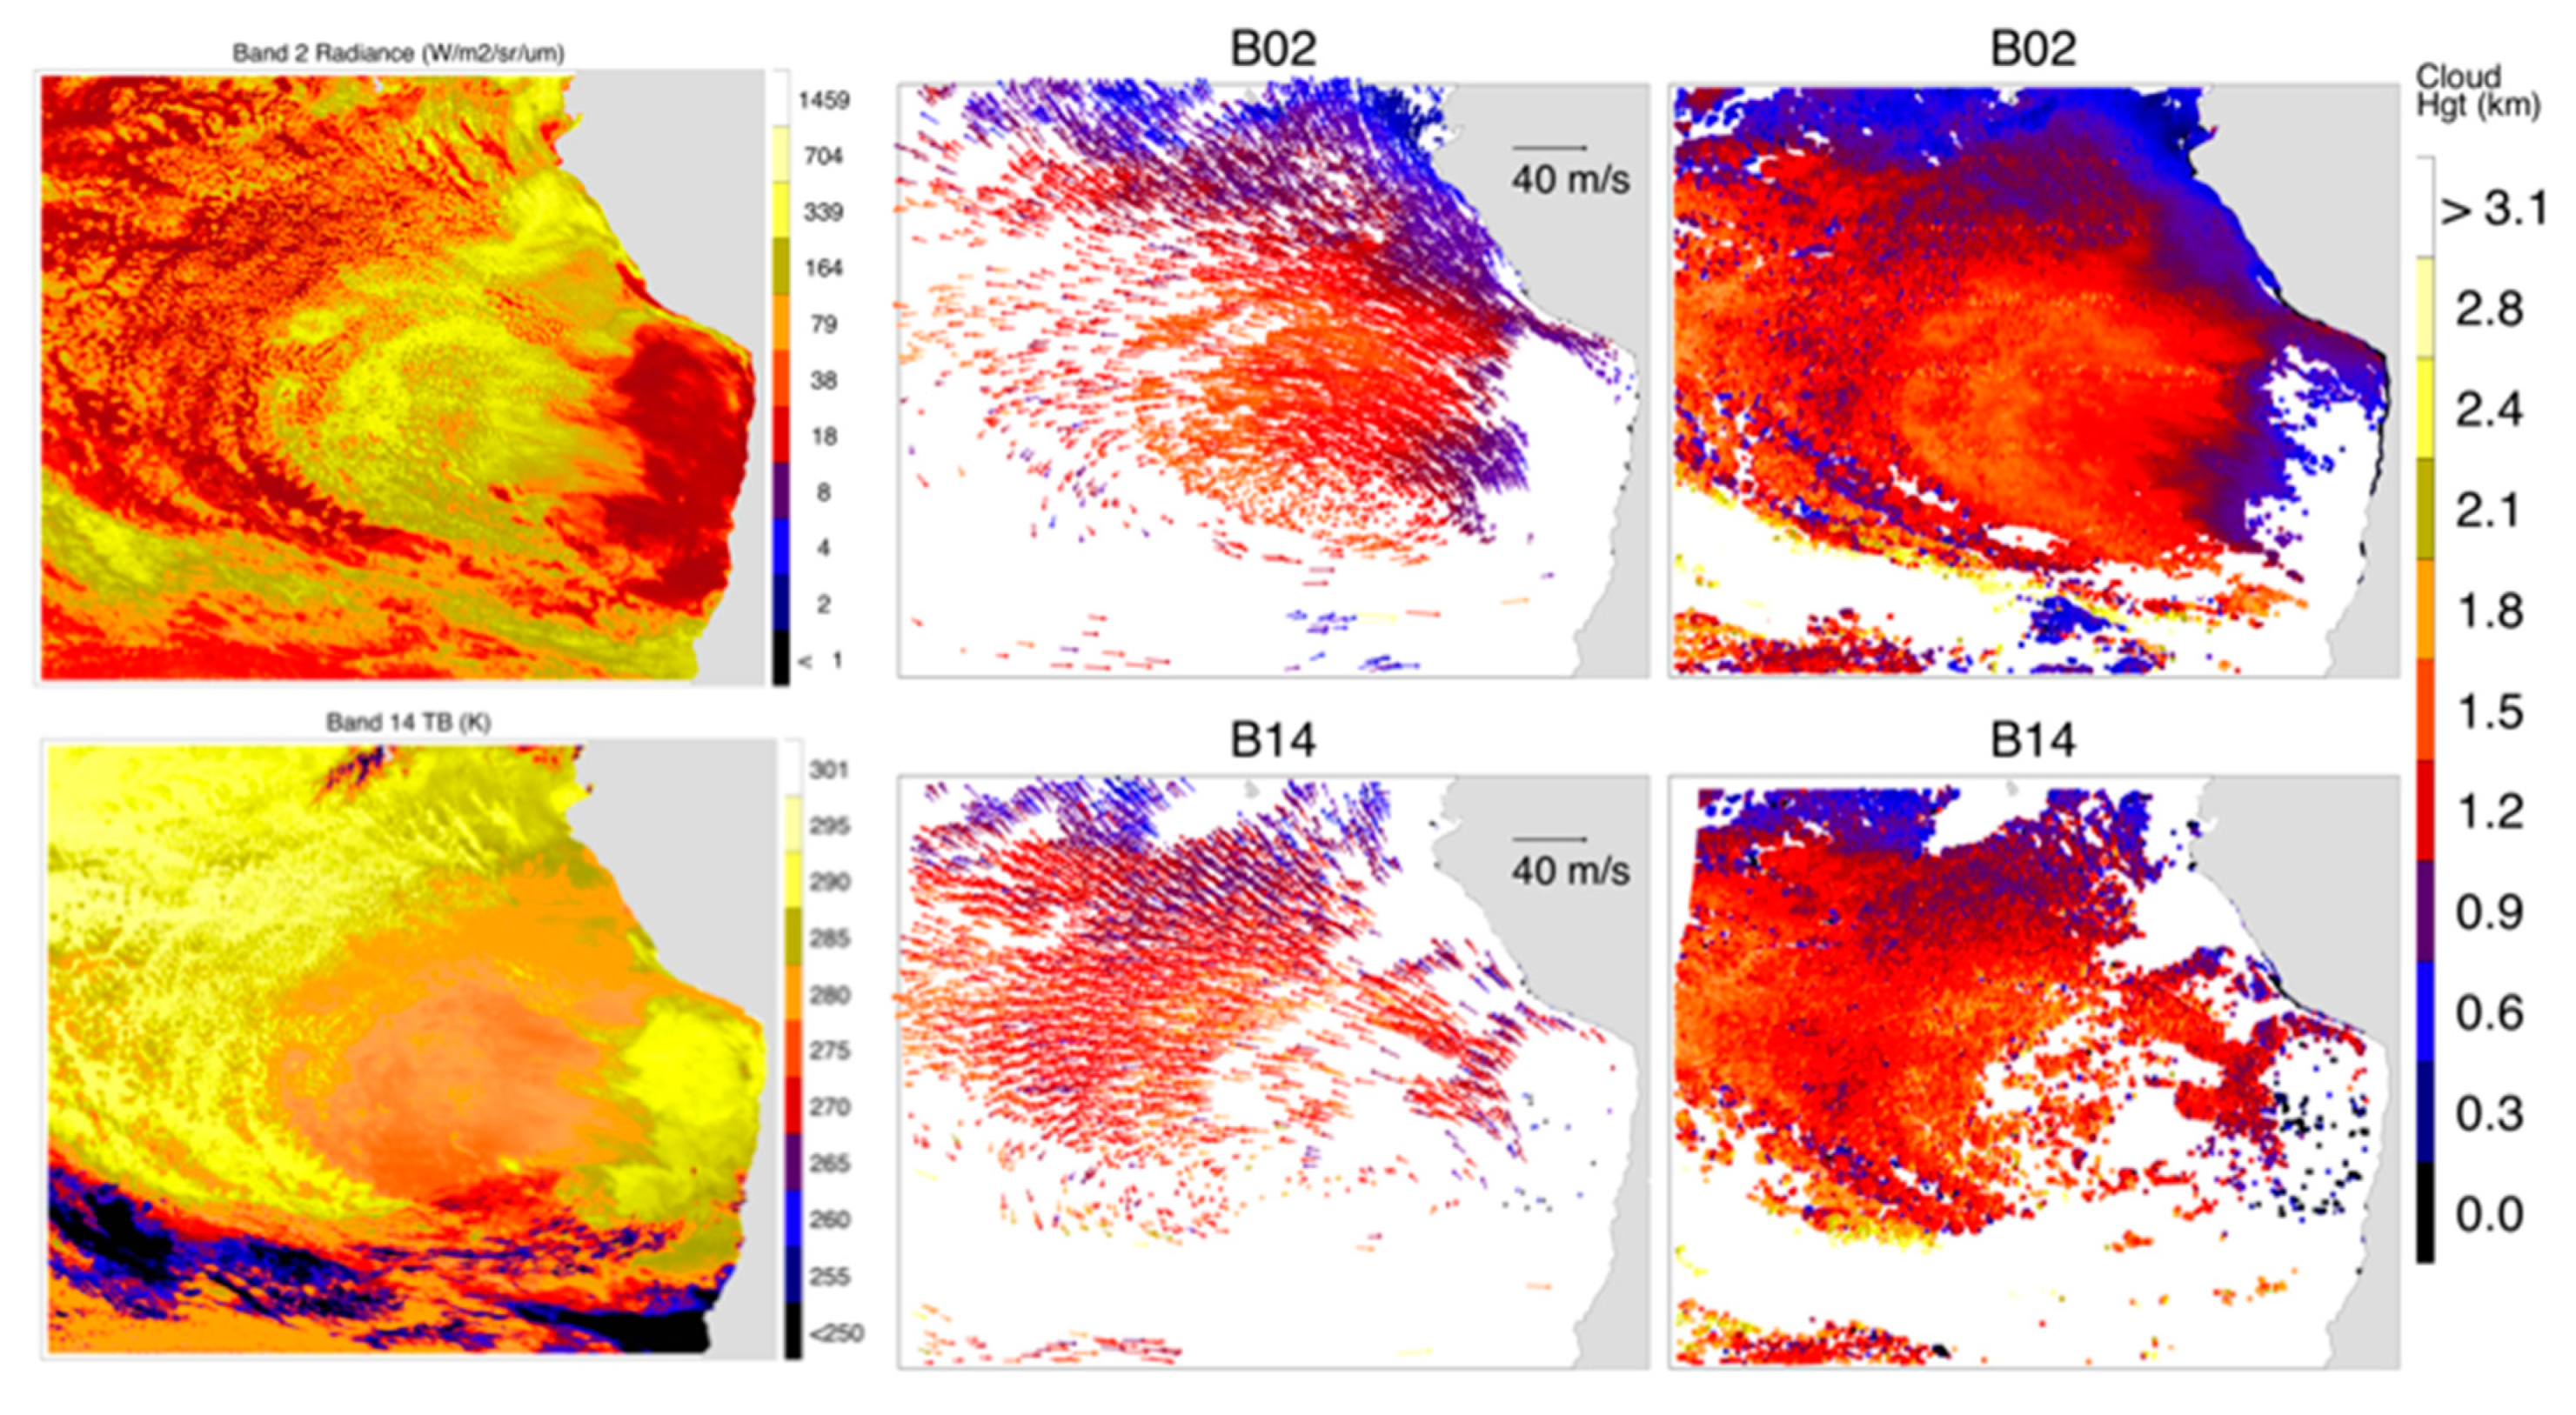
Cloudy PBLs in the Southeastern Pacific (SEP) provide a good test case for GOES-16 and -17 stereo winds, which are expected to resolve the top of the stratocumulus-topped boundary layer (STBL) with a relatively good vertical (300 m) and horizontal (6 km) resolution in B02. The SEP region is often covered by widespread low-lying stratus clouds that are radiatively important for the Earth’s climate system because their enhanced albedo can effectively reflect solar radiation and reduce the energy absorbed on Earth [50]. Figure 18 shows GOES-17 B02 radiances for a typical STBL region. Reflectivity and therefore radiance variations span about 3 orders of magnitude due to the presence of broken stratocumulus clouds [51]. Stratocumuli are convective clouds and their vertical development is constrained by the PBL structure [48] and they provide good patterns for stereo tracking. As the STBL deepens above 1 km, its top starts to decouple from the well-mixed PBL with the surface moisture supply [52], transitioning from overcast stratocumulus (closed cells), to open cells, to trade cumulus clouds.
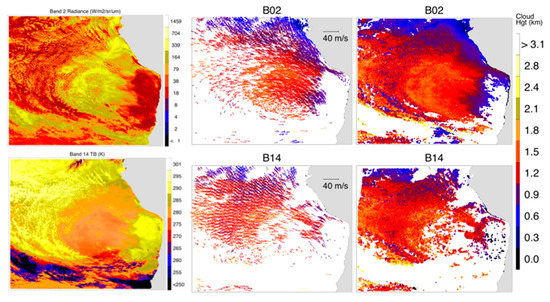
Figure 18.
The stereo-wind retrievals using a template size of 12 pixels × 12 pixels from GOES-16 and -17 B02 (top) and B14 (bottom) in the Southeastern Pacific (SEP; 110° W–70° W,0–40° S) on 25 July 2020, 17:20 Z. For each band, the radiance map, along with AMV and stereo Cloud Top Height (CTH) retrievals are shown. The B02 radiances are in W/m2/sr/μm and B14 in brightness temperature (K). The AMV vectors are color-coded by CTH with sampling resolution indicated in the title of each panel. For illustration purposes, the AMV vectors are thinned by a factor of 64 for B02 and 8 for B14 in the plots.
The rising PBL top and transition from stratocumulus to trade cumulus clouds were evident in an example of 3D-Wind stereo height retrievals (Figure 18). On 25 July 2020 (17:20 Z) there was a counterclockwise cyclonic circulation in the region that advected the PBL air northeastward from the Peruvian coast (cold SST) to the tropics (warm SST). The PBL dynamics and top height are perhaps better illustrated by the 3D-Wind B02 (visible) than B14 (IR) outputs in which a finer (template size 12 km × 12 km and sampling size 6 km × 6 km) horizontal resolution was employed for retrieving the B02 AMV and Cloud Top Heights (CTHs). The clear-sky region near the coast had no AMV and CTH retrievals from the stereo-winds method. However, once clouds start to form with a feature distinguishable from featureless ocean surfaces, stereo-winds method can retrieve a shallow layer that appeared to be 300 m above the surface. These CTHs rose to 1.5–2 km along the wind direction with a nearly uniform coverage before the clouds broke down to open cells. The observed STBL in the SEP represents the classical transition from stratocumulus to trade cumulus clouds, which further verified the 300 m vertical resolution of the 3D-Wind’s GEO–GEO technique.
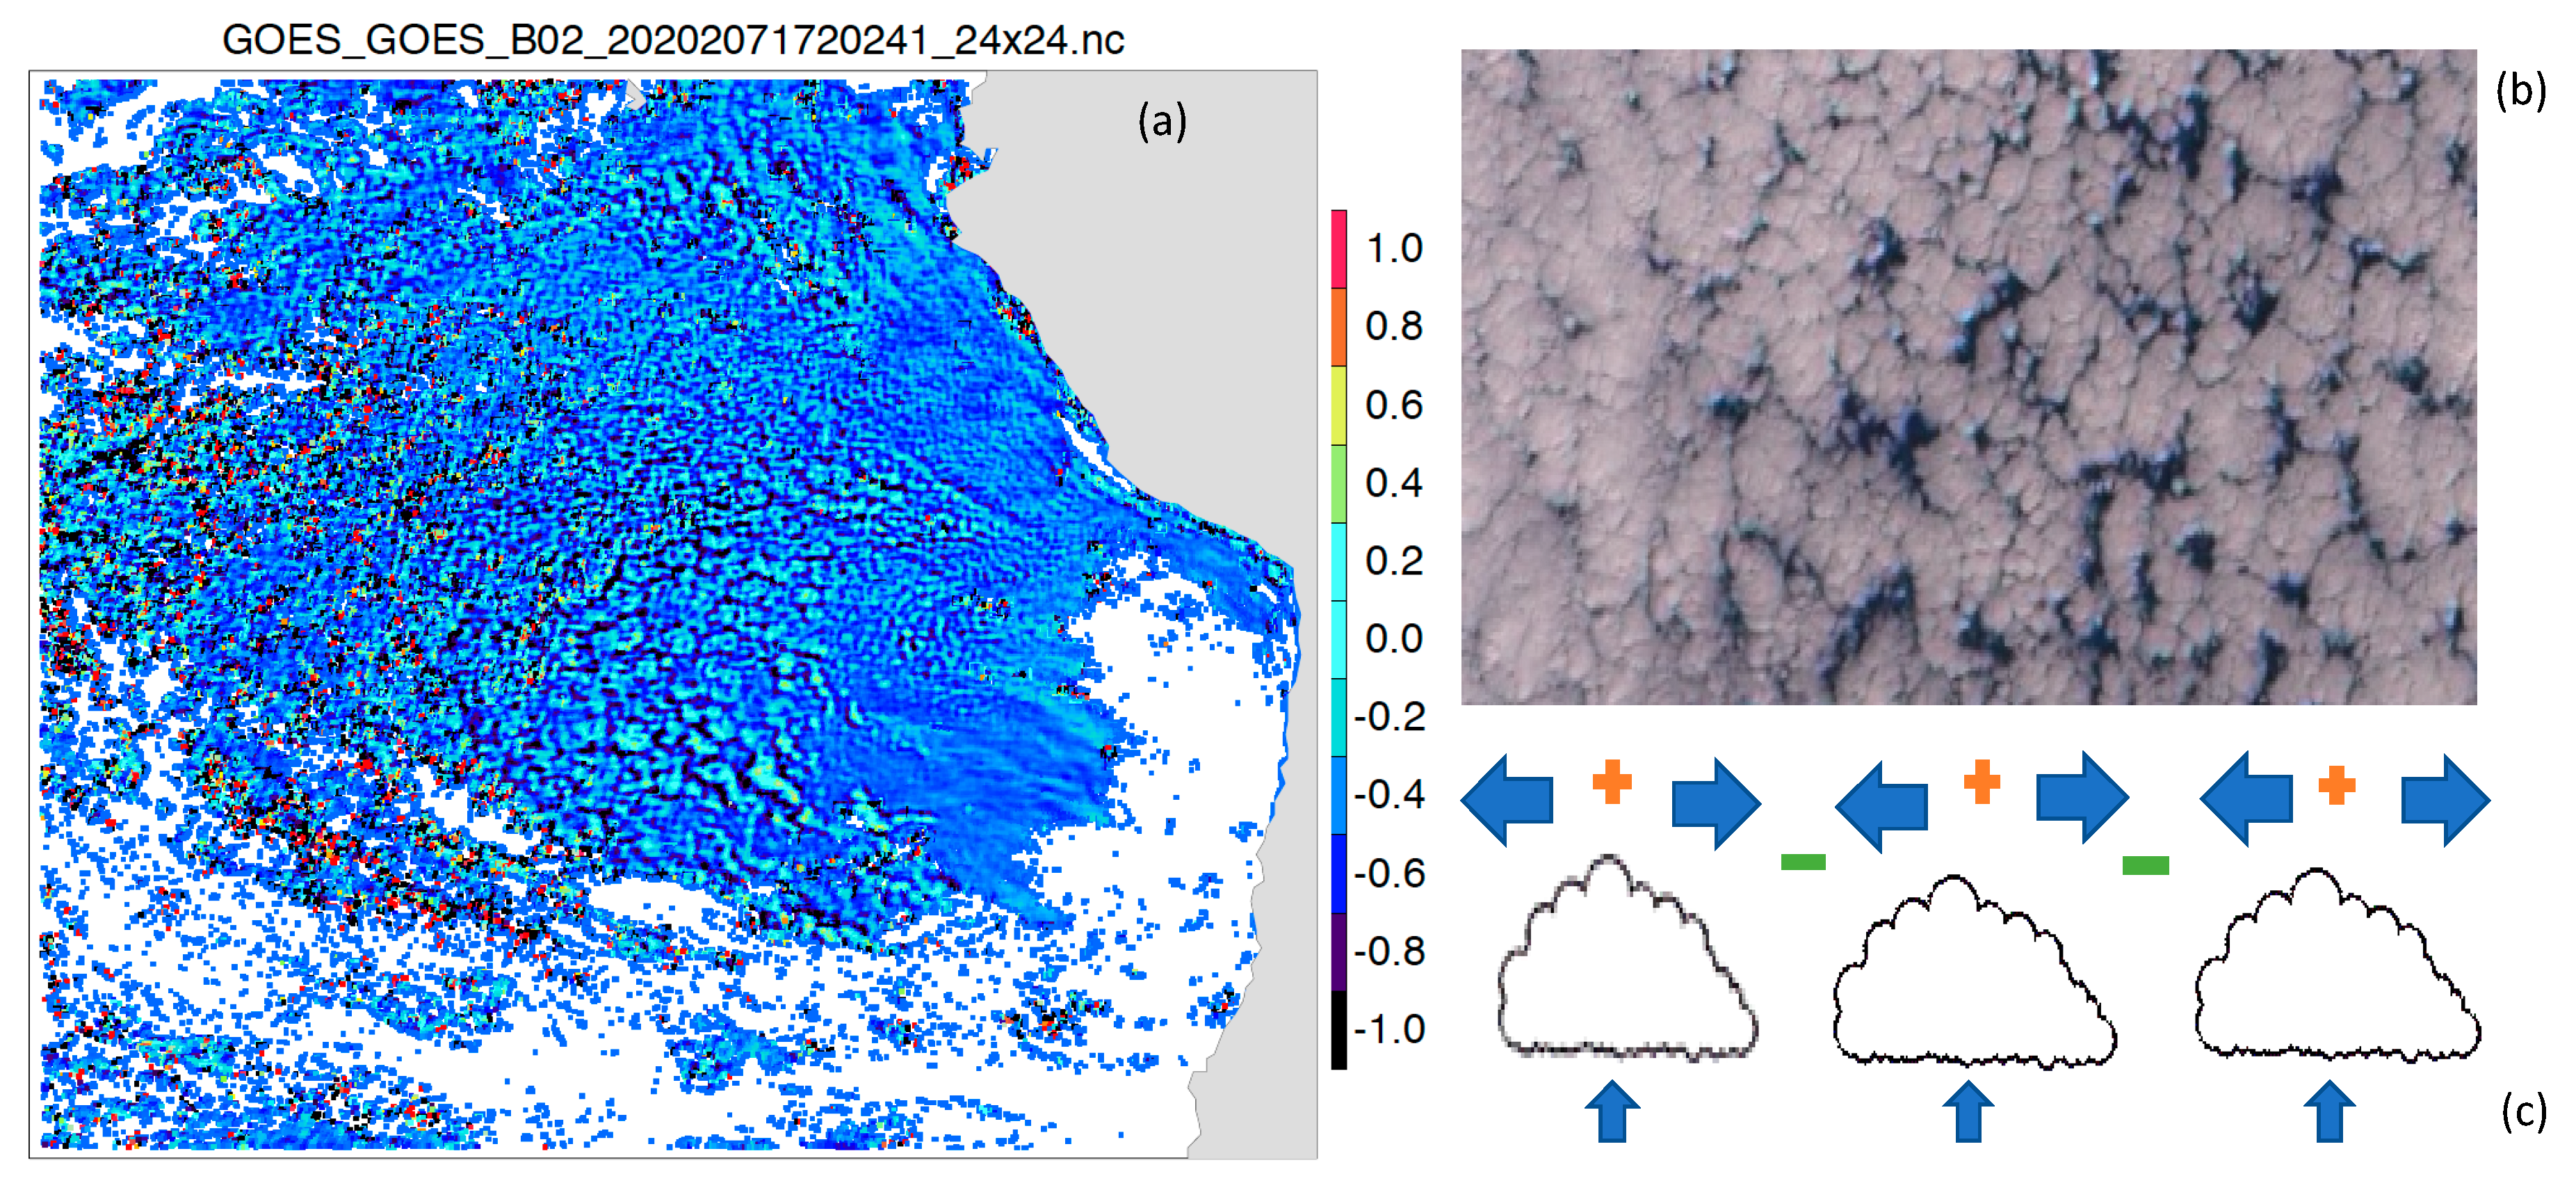
One of the most valuable PBL properties that the stereo-winds method could provide was mesoscale divergence (Figure 19). Due to its high-resolution AMV retrievals and layer assignments, it became feasible with the GEO–GEO stereo-wind technique to derive the stratocumulus divergence and convergence at the mesoscale using neighboring wind measurements at the same height. A similar technique was proposed to derive mesoscale divergence and vertical motions using dropsonde wind profiles in a 100 km domain [53]. As revealed in the divergence map from stereo winds (Figure 19) the observed mesoscale divergence/convergence was small for clouds with CTH < 1.2 km but becomes oscillatory with increasing amplitudes for CTH > 1.2 km. This is the critical height level for the PBL top decoupling. The divergence/convergence oscillations at the mesoscale are a result of cloud self-organization from small scales to a larger scale through thermodynamic processes [54] and often manifest themselves in a rosette-like form [55]. Since stratocumulus clouds break down through self-organization and precipitation processes, the mesoscale divergence/convergence is considered as an important indicator of the cloud evolution from closed to open cell transition [56]. The stereo-winds maps show a consistent picture as expected for closed-to-open-cell transition in terms of PBL top variations and divergence increases. The new data set from GEO–GEO stereo imaging, especially with 10-min sampling, will provide great insights and a better understanding of STBL structures, dynamics, and their evolution with different environments.
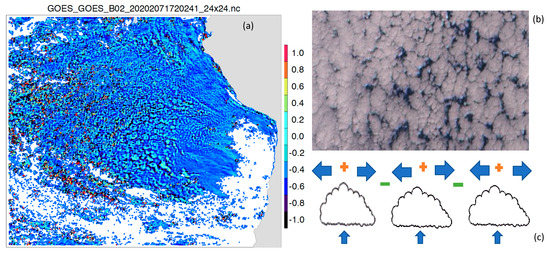
Figure 19.
(a) The mesoscale divergence derived from stereo-wind AMV retrievals using a template size of 24 pixels × 24 pixels. Only divergence values at CTH < 3 km are shown. The divergence is calculated from the AMVs in a 36 km × 36 km domain but sampled at the 12 km × 12 km grid. An image of closed and open cells of stratocumulus clouds is shown in (b). The divergence and convergence associated with cloud cells are illustrated in (c).
3.3.3. Fire Plumes
The 2020 wildfire season (August-to-November) on the U.S. West Coast is one of the worst in the modern history and the largest to date for California. As of mid-September, five of the top 20 largest wildfires in California history occurred in 2020. Although the fire season is still underway, the California Department of Forestry and Fire Protection reports this year’s wildfires through 23 September 2020 have consumed 3.6 million acres as compared to less than 43,500 acres for the same period in 2019 [57]. In early September, an intense heatwave broke temperature records in several locations in California, including 49 °C in Los Angeles on 6 September. The hot–dry–windy index (HDW), which is used to determine and manage wildfire risks from adverse atmospheric and surface conditions [58], reached a peak on September 8, while several major wildfires broke out in California, Oregon, and Washington.
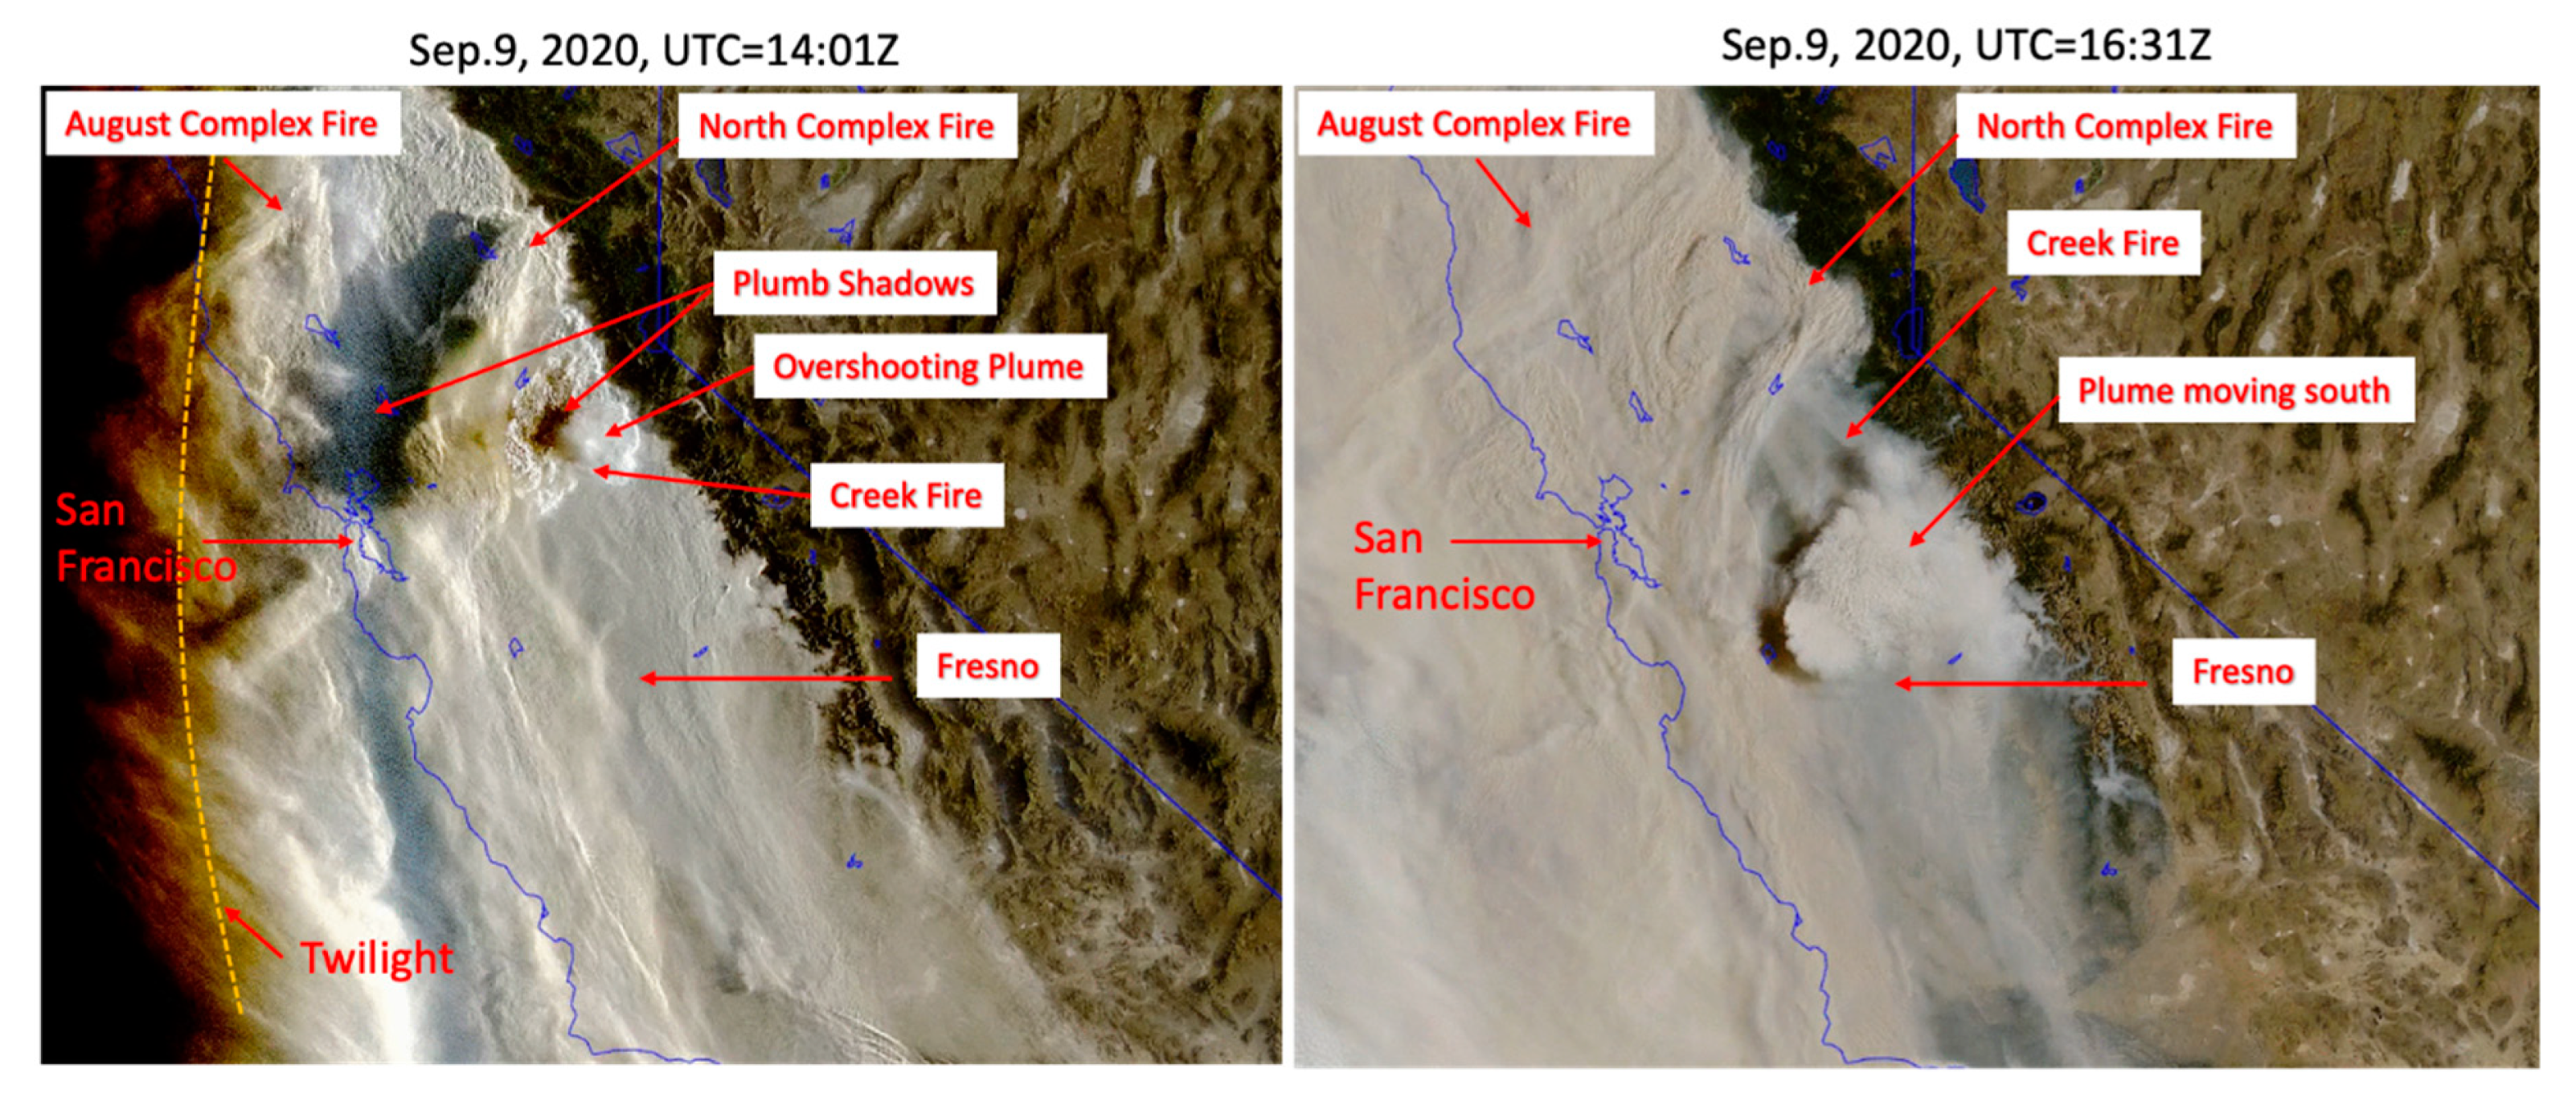
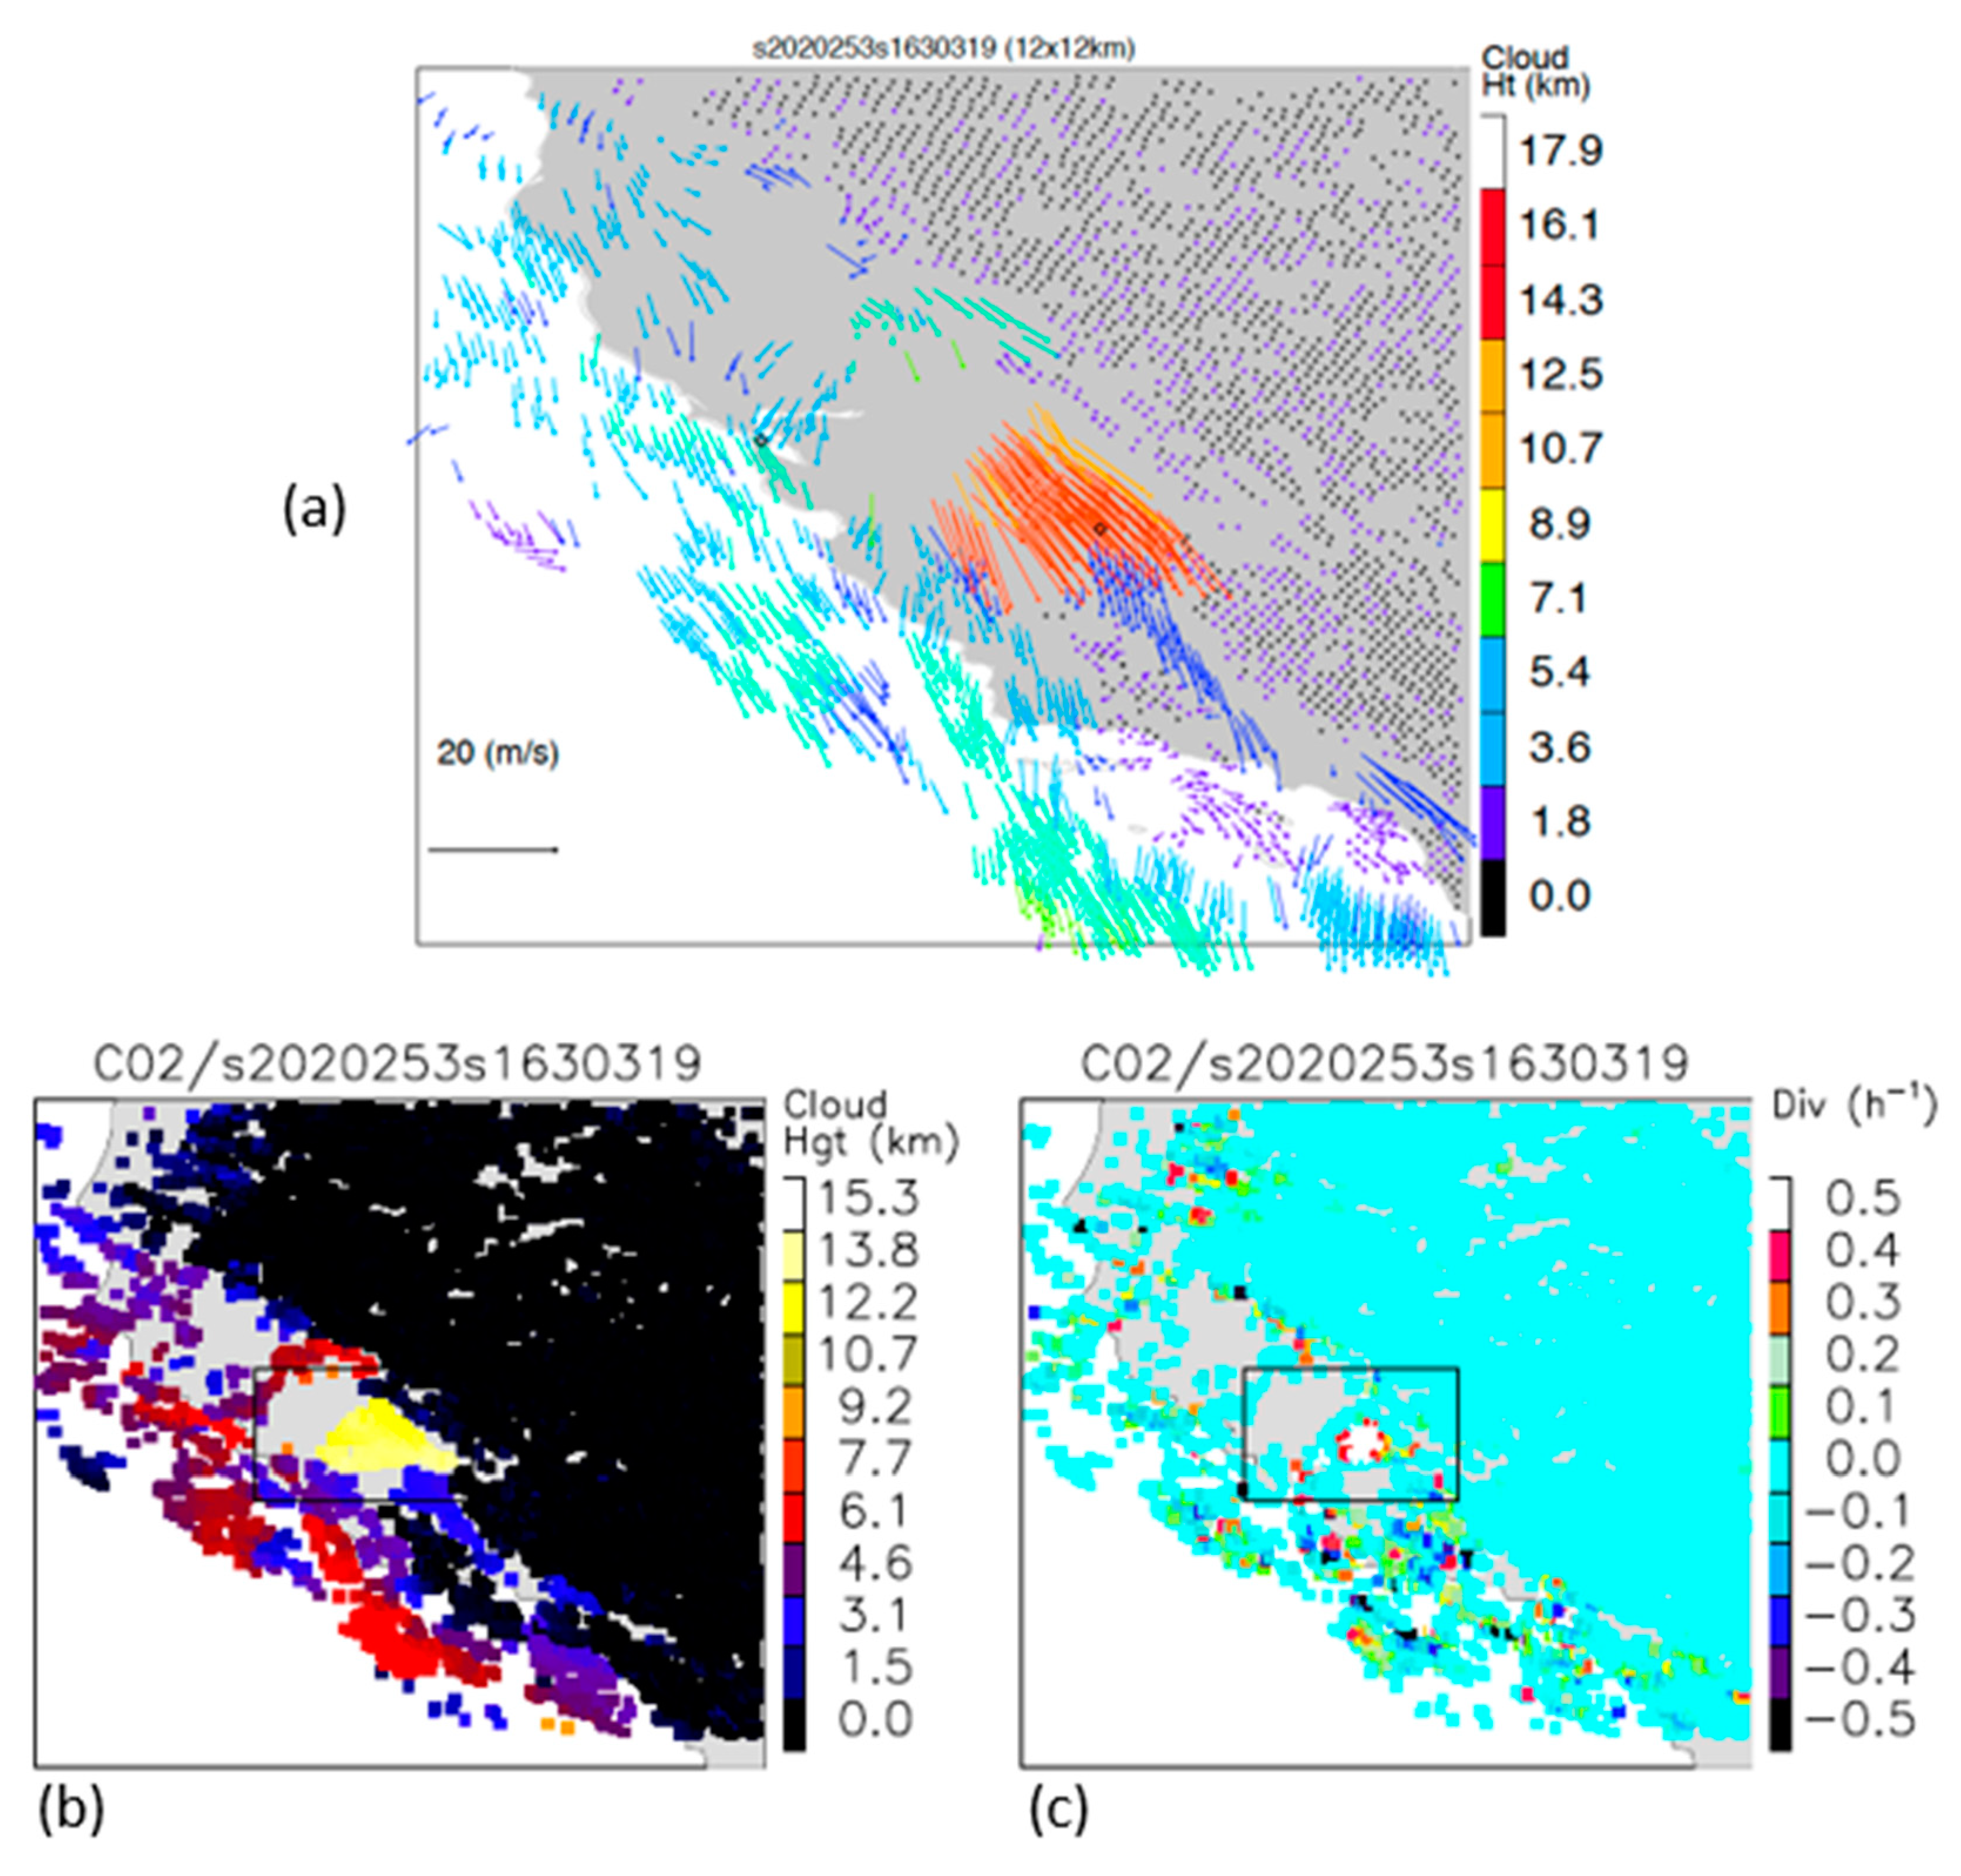
Intense wildfires not only destroy property and habitat, but they also impact public health in a much wider area with plumes shooting above the atmospheric PBL and spreading over radii of hundreds to thousands of kilometers. The GOES-17 images in Figure 20 captured an explosive pyrocumulonimbus (pyroCb) cloud from Californian Creek Fire on September 9. The stereo-wind retrievals show that the plume heights reached more than 14 km above the terrain with a wind speed of 15–20 m/s (Figure 21). The fire plume quickly spread into a large area within two hours and moved to the south. By 12 September, the upper-tropospheric fire plumes generated from the West Coast had been advected thousands of kilometers into the Pacific, the East Coast, and the Atlantic.
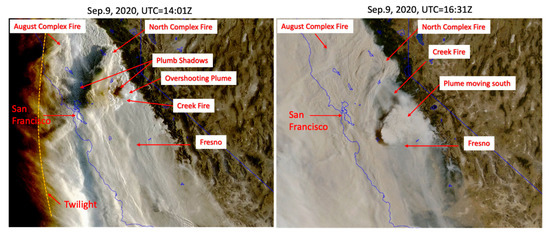
Figure 20.
PyroCb generated from Creek Fire on 9 September 2020 when three major wildfires were burning in Northern California with very poor air quality and visibility in the region. The fire plumes overshot the level of neutral buoyancy and created a visible deep convective core. The plume core’s shadows on the plume deck are evident in the early morning hour. The overshooting smoke plumes allow a widespread impact of these wildfires over 1000s of kilometers (image credit: Space Science and Engineering Center at the University of Wisconsin).
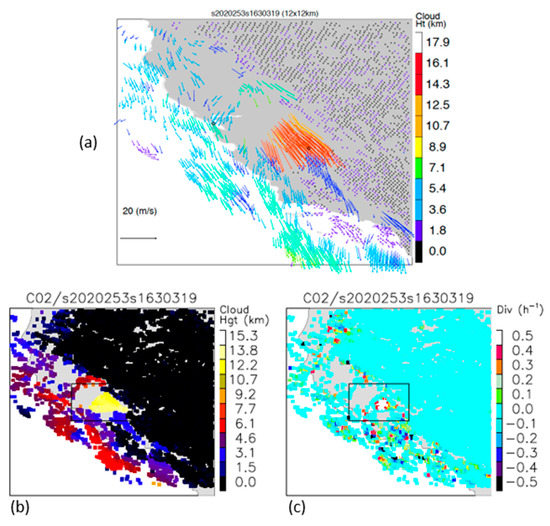
Figure 21.
The B02 stereo-wind retrievals from 16:30 Z on September 9 for (a) wind velocity, (b) plume height above terrain, and (c) divergence. The embedded box indicates the area used to monitor the area-mean time series of these variables. In the operational products, the B02 DMWs do not have measurements at heights > 3 km, and the B14 DMWs have no retrievals from GOES-16 nor -17 for this pyroCb.
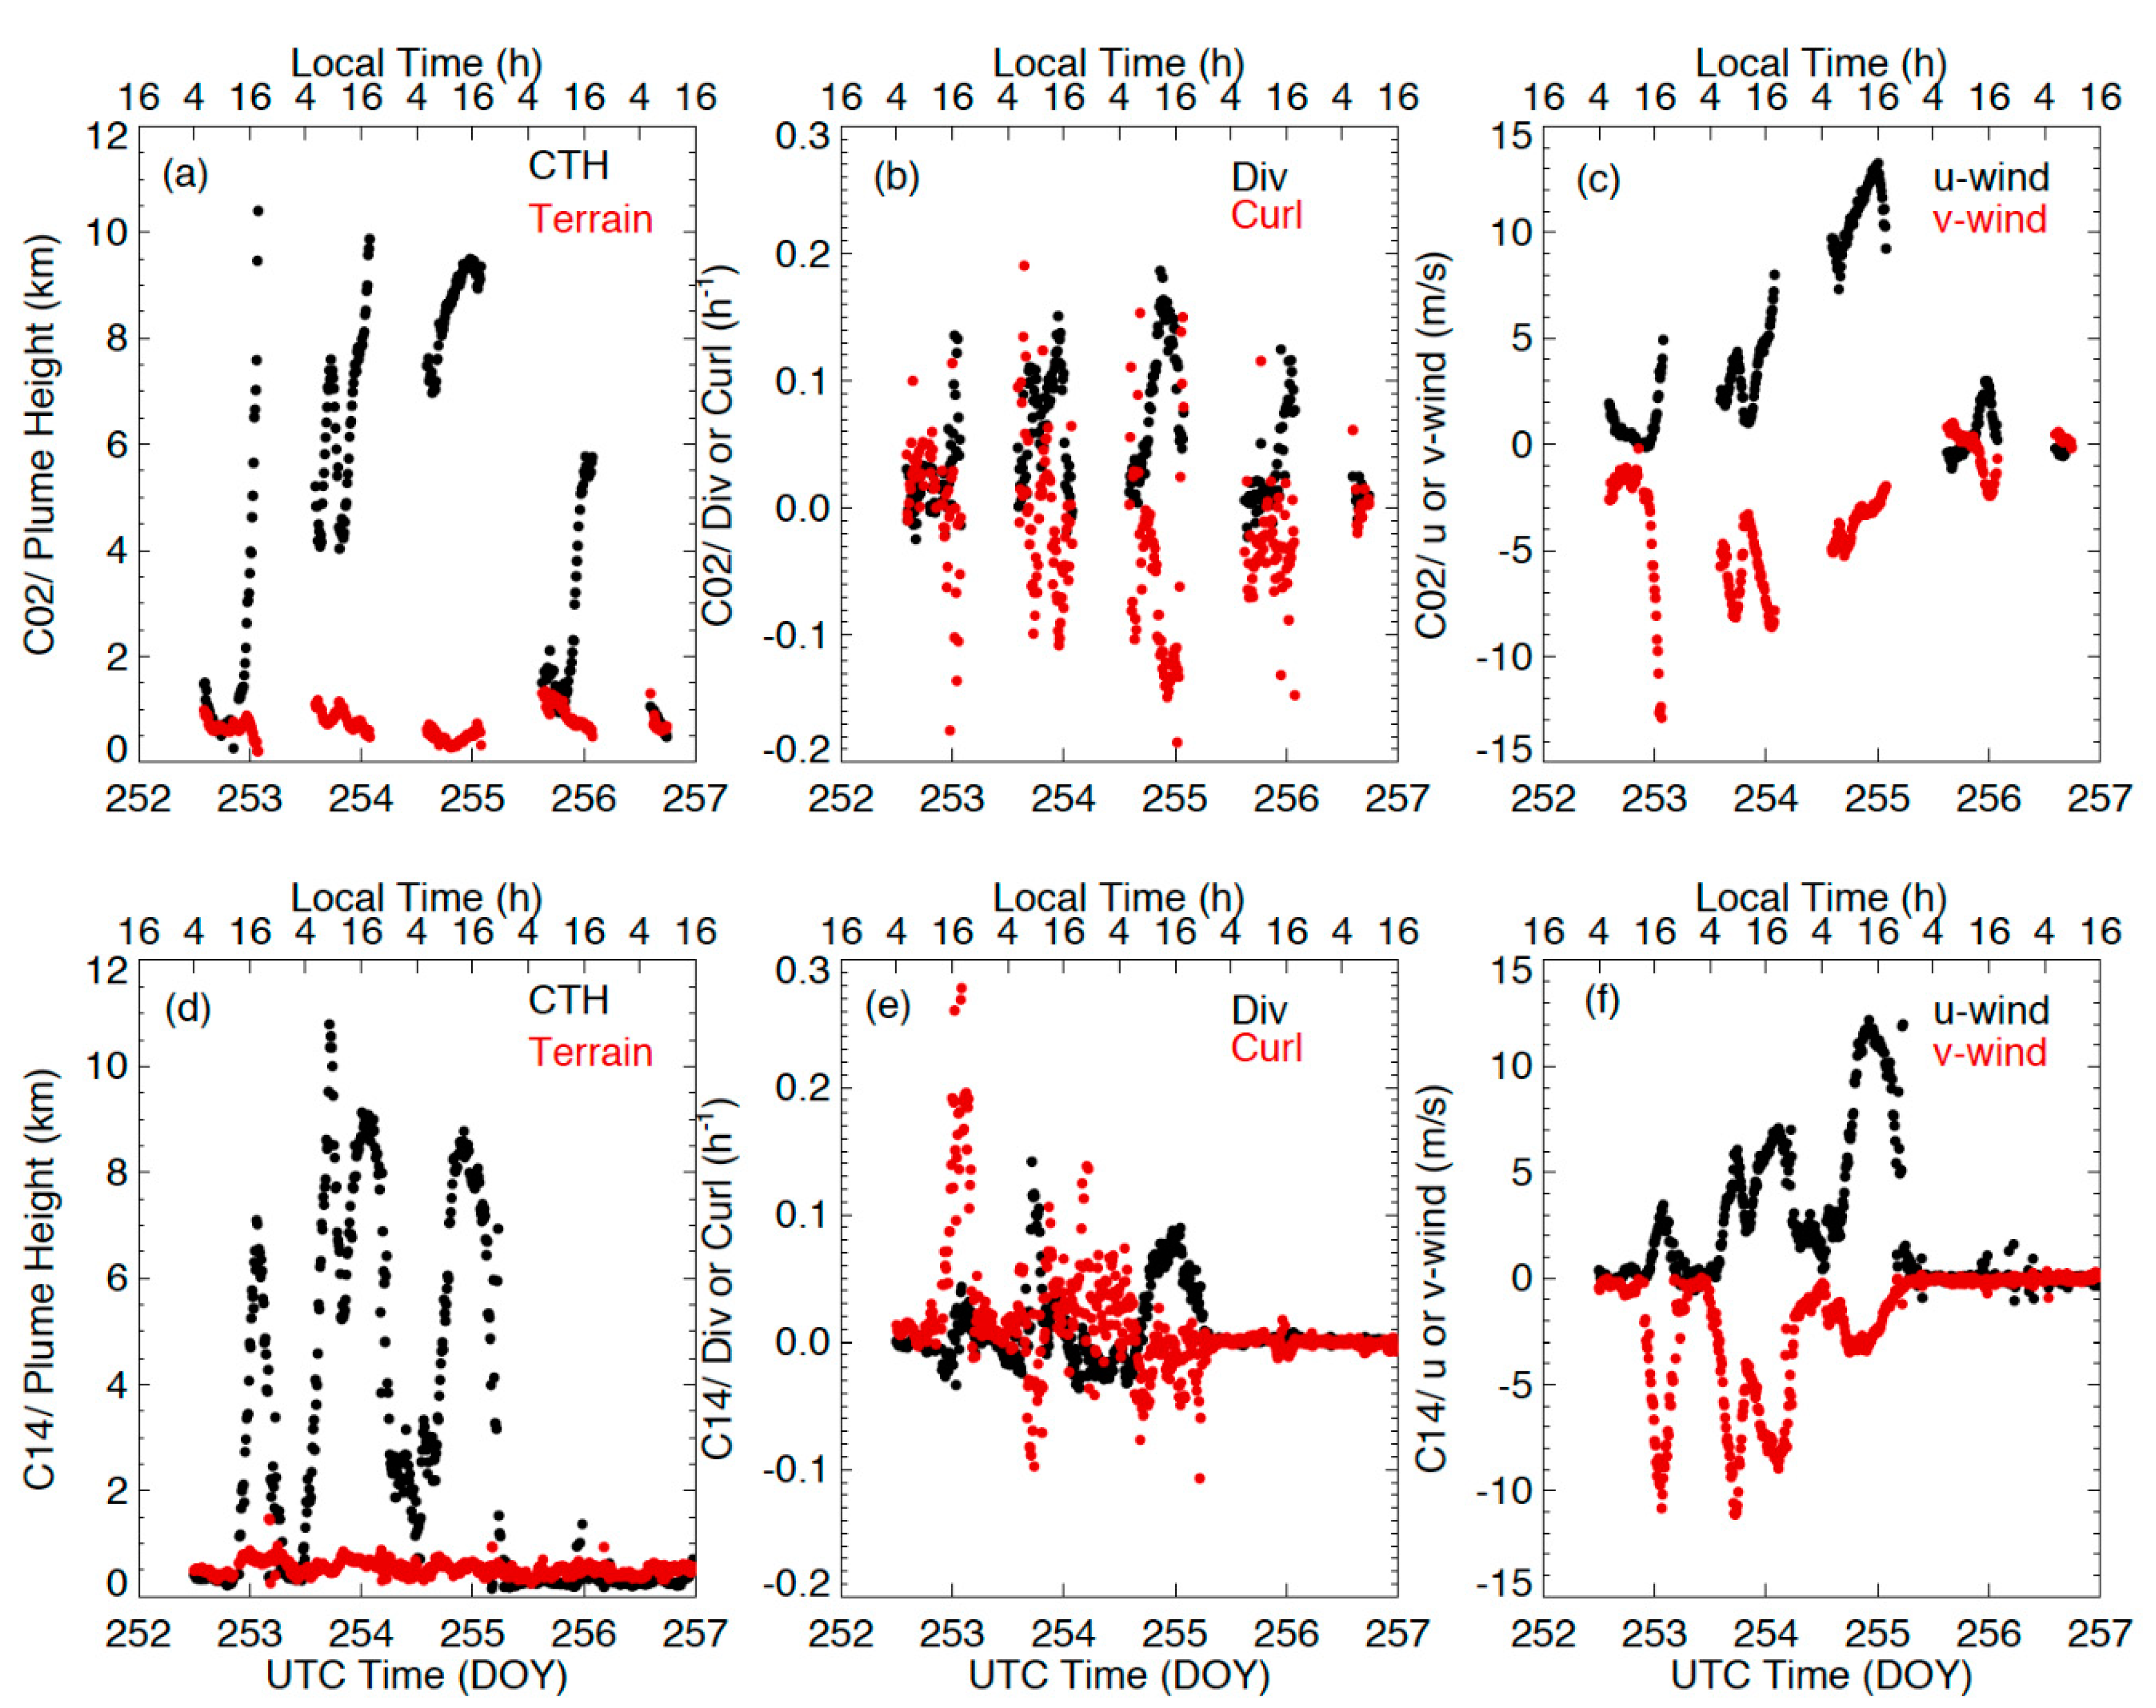
Fire pyroCbs are rare events and require LEO sensors to observe at the right place at the right time [59]. The rapid refresh with the stereo-wind technique from GOES-16 and -17 not only facilitates capturing more pyroCb events but also tracking their development and structural evolution. Figure 22 shows the time evolution of the plumes from Creek Fire. The area-mean divergence and curl indicate pulse forcings at 15:20 Z and 19:00 Z, followed by a steady increase in area-mean plume height and wind changes (direction and speed) on that day. The intensive fire forcing at 15:20 Z generated an explosive pyroCb with the area-mean plume height peaking above 10 km in a 30-min period. As the plume height increased, the associated curl decreased (divergence increases slightly), and the plume wind speed increased with direction. Due to the intense and variable heating from wildfires, the fire–atmosphere interaction has been a challenging research topic [60]. The sudden change in the upper-tropospheric wind velocity, coincident with the forcing increase, suggests that a fire behavior change could impact dynamics through fire–atmosphere coupling processes.
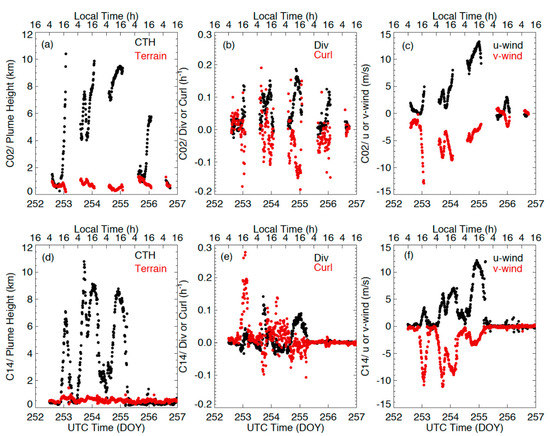
Figure 22.
Time series of area-mean (a) plume height (CTH) above terrain, (b) divergence (black) and curl (red), and (c) u-(black) and v-wind (red) variations during 8–12 September (DOY 252–256). Area-averaged terrain heights (red) are also included in (a) and vary slightly with time because it is averaged only for the site locations where an acceptable quality stereo height is reported. Panels (d–f) report the same information but for Band 14.
Plume heights and winds exhibited a strong diurnal cycle in the Creek Fire development (Figure 22). Early studies with GOES fire radiative power (FRP) observations showed that the FRP and burned area tend to peak shortly after the local time noon (13:00) in the west CONUS [61]. Depending on fuel consumption and smoke emission rates, accurate characterization of plume diurnal variations plays an important role in estimating biomass burning emissions for air quality prediction. The time series from the stereo-wind retrievals show that the plume height and wind speed from Creek Fire peak at 16:00 local time over the three intensive burning days (DOY 252–254), approximately 3 hours after the FRP peak. This lag is expected in a sense that the upper-level plume buildup would follow the increase in fire intensity. The pulse at 15:20 Z on September 9 reflects an additional forcing from the pyroCb on the top of the anticipated smoke fire diurnal cycle.
4. Discussion
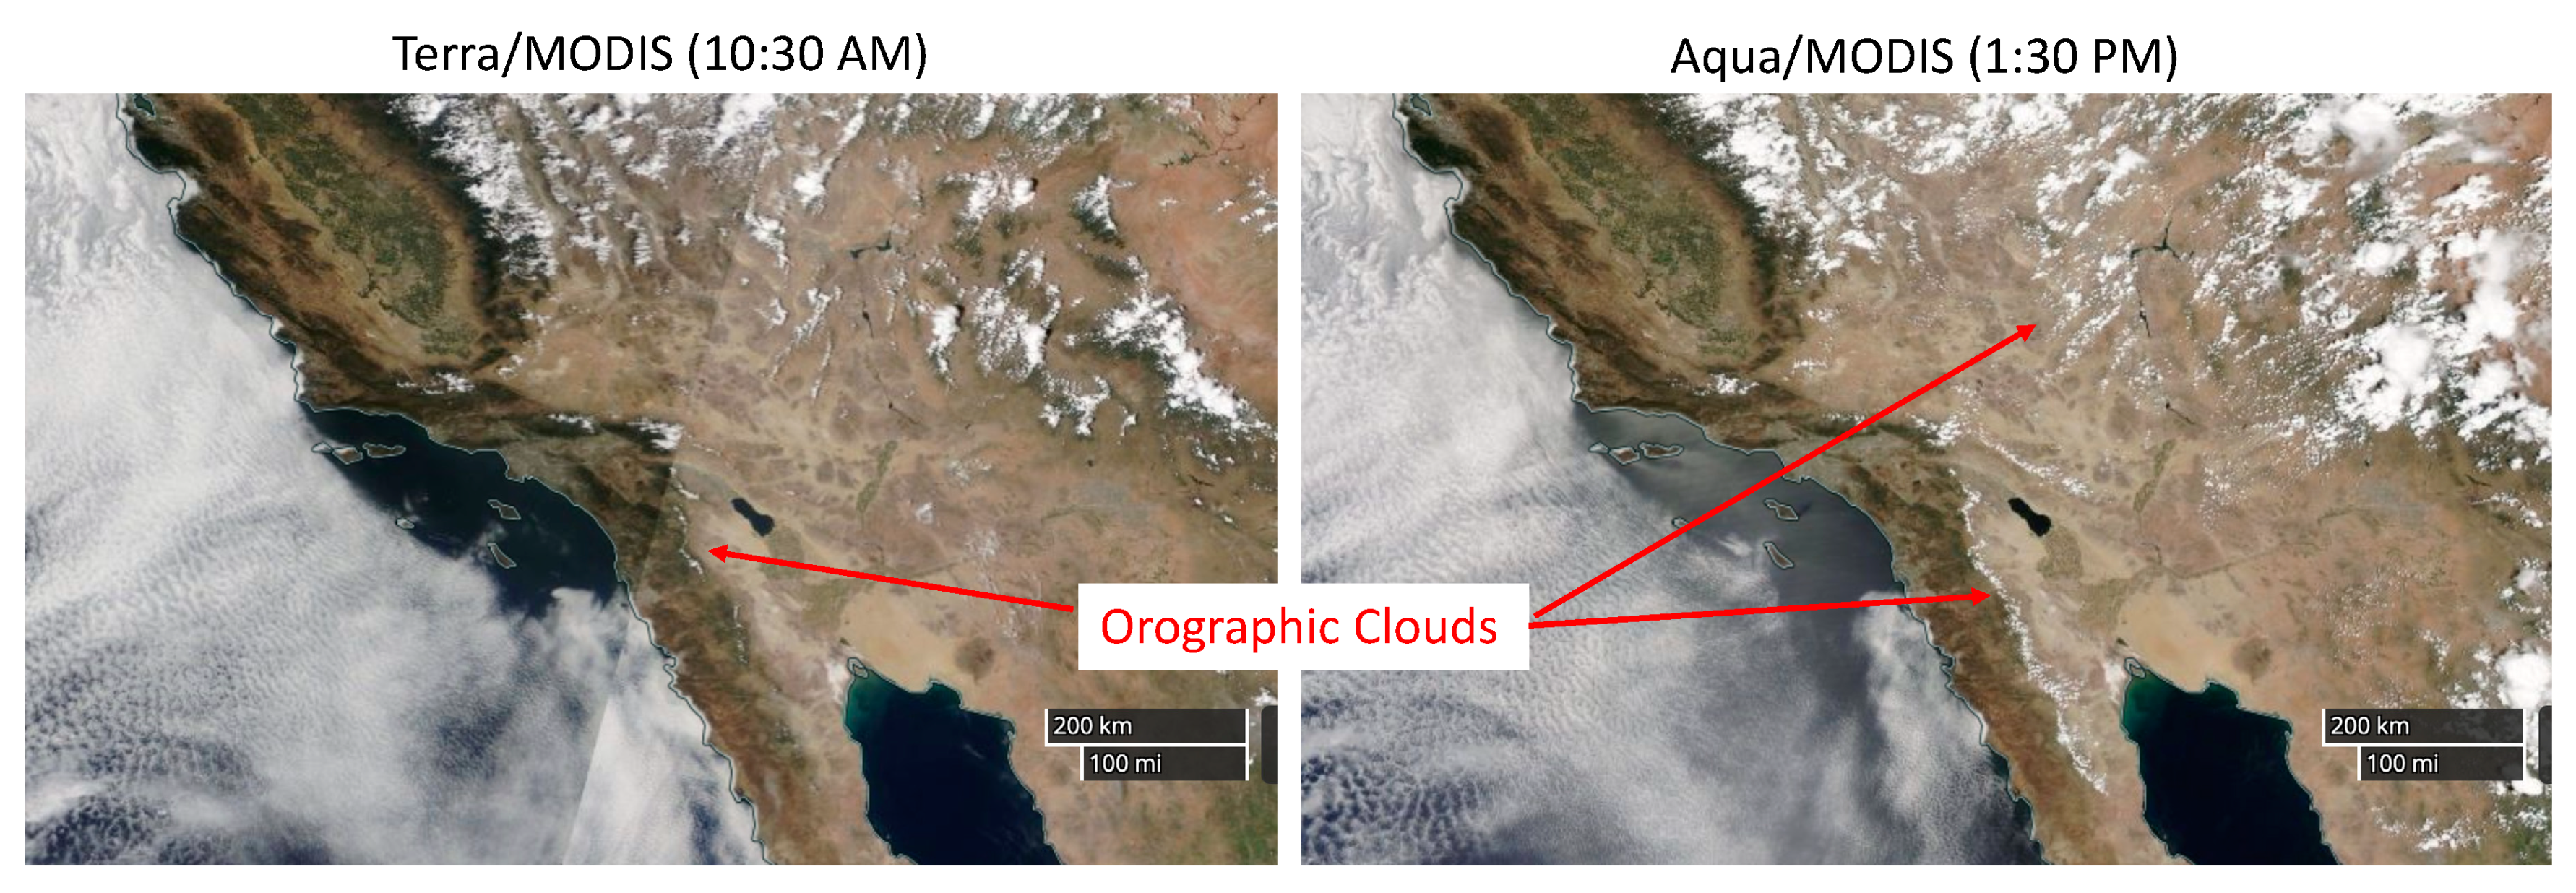
In Section 3, we presented results validating the stereo-winds method and demonstrated several application areas where the stereo-wind height assignments will likely be beneficial. Here, we discussed the error characteristics of stereo winds and quantified their sensitivities to INR (geometric) errors, errors in satellite ephemeris, and errors in time assignments. We then discussed the problems of tracking of orographic clouds and comparing satellite winds to rawinsonde observations with prospects for positive NWP impacts.
4.1. Error Analysis
Retrieval accuracy was affected by the quality of the INR, accuracy of knowledge of satellite position vectors, and the accuracy of times assigned to matched site locations. These sensitivities were analyzed below.
4.1.1. INR Errors
Accurate retrieval of wind height using stereo methods from two GEO spacecraft was possible because of accurate INR. The sensitivities of the retrievals to INR errors was most easily understood in the simplest case where we considered a point on the equator at a longitude bisecting the nominal position of each satellite as shown in Figure 23.
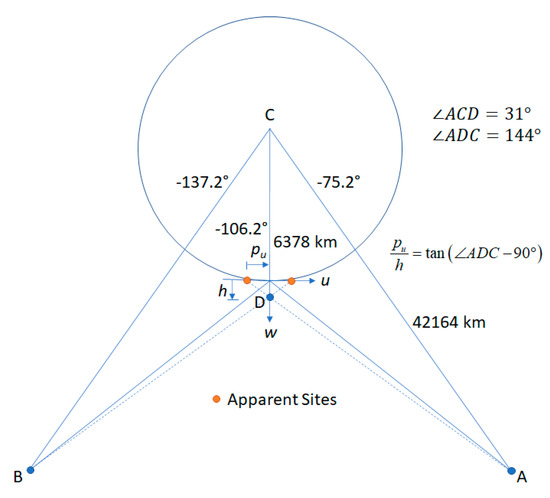
Figure 23.
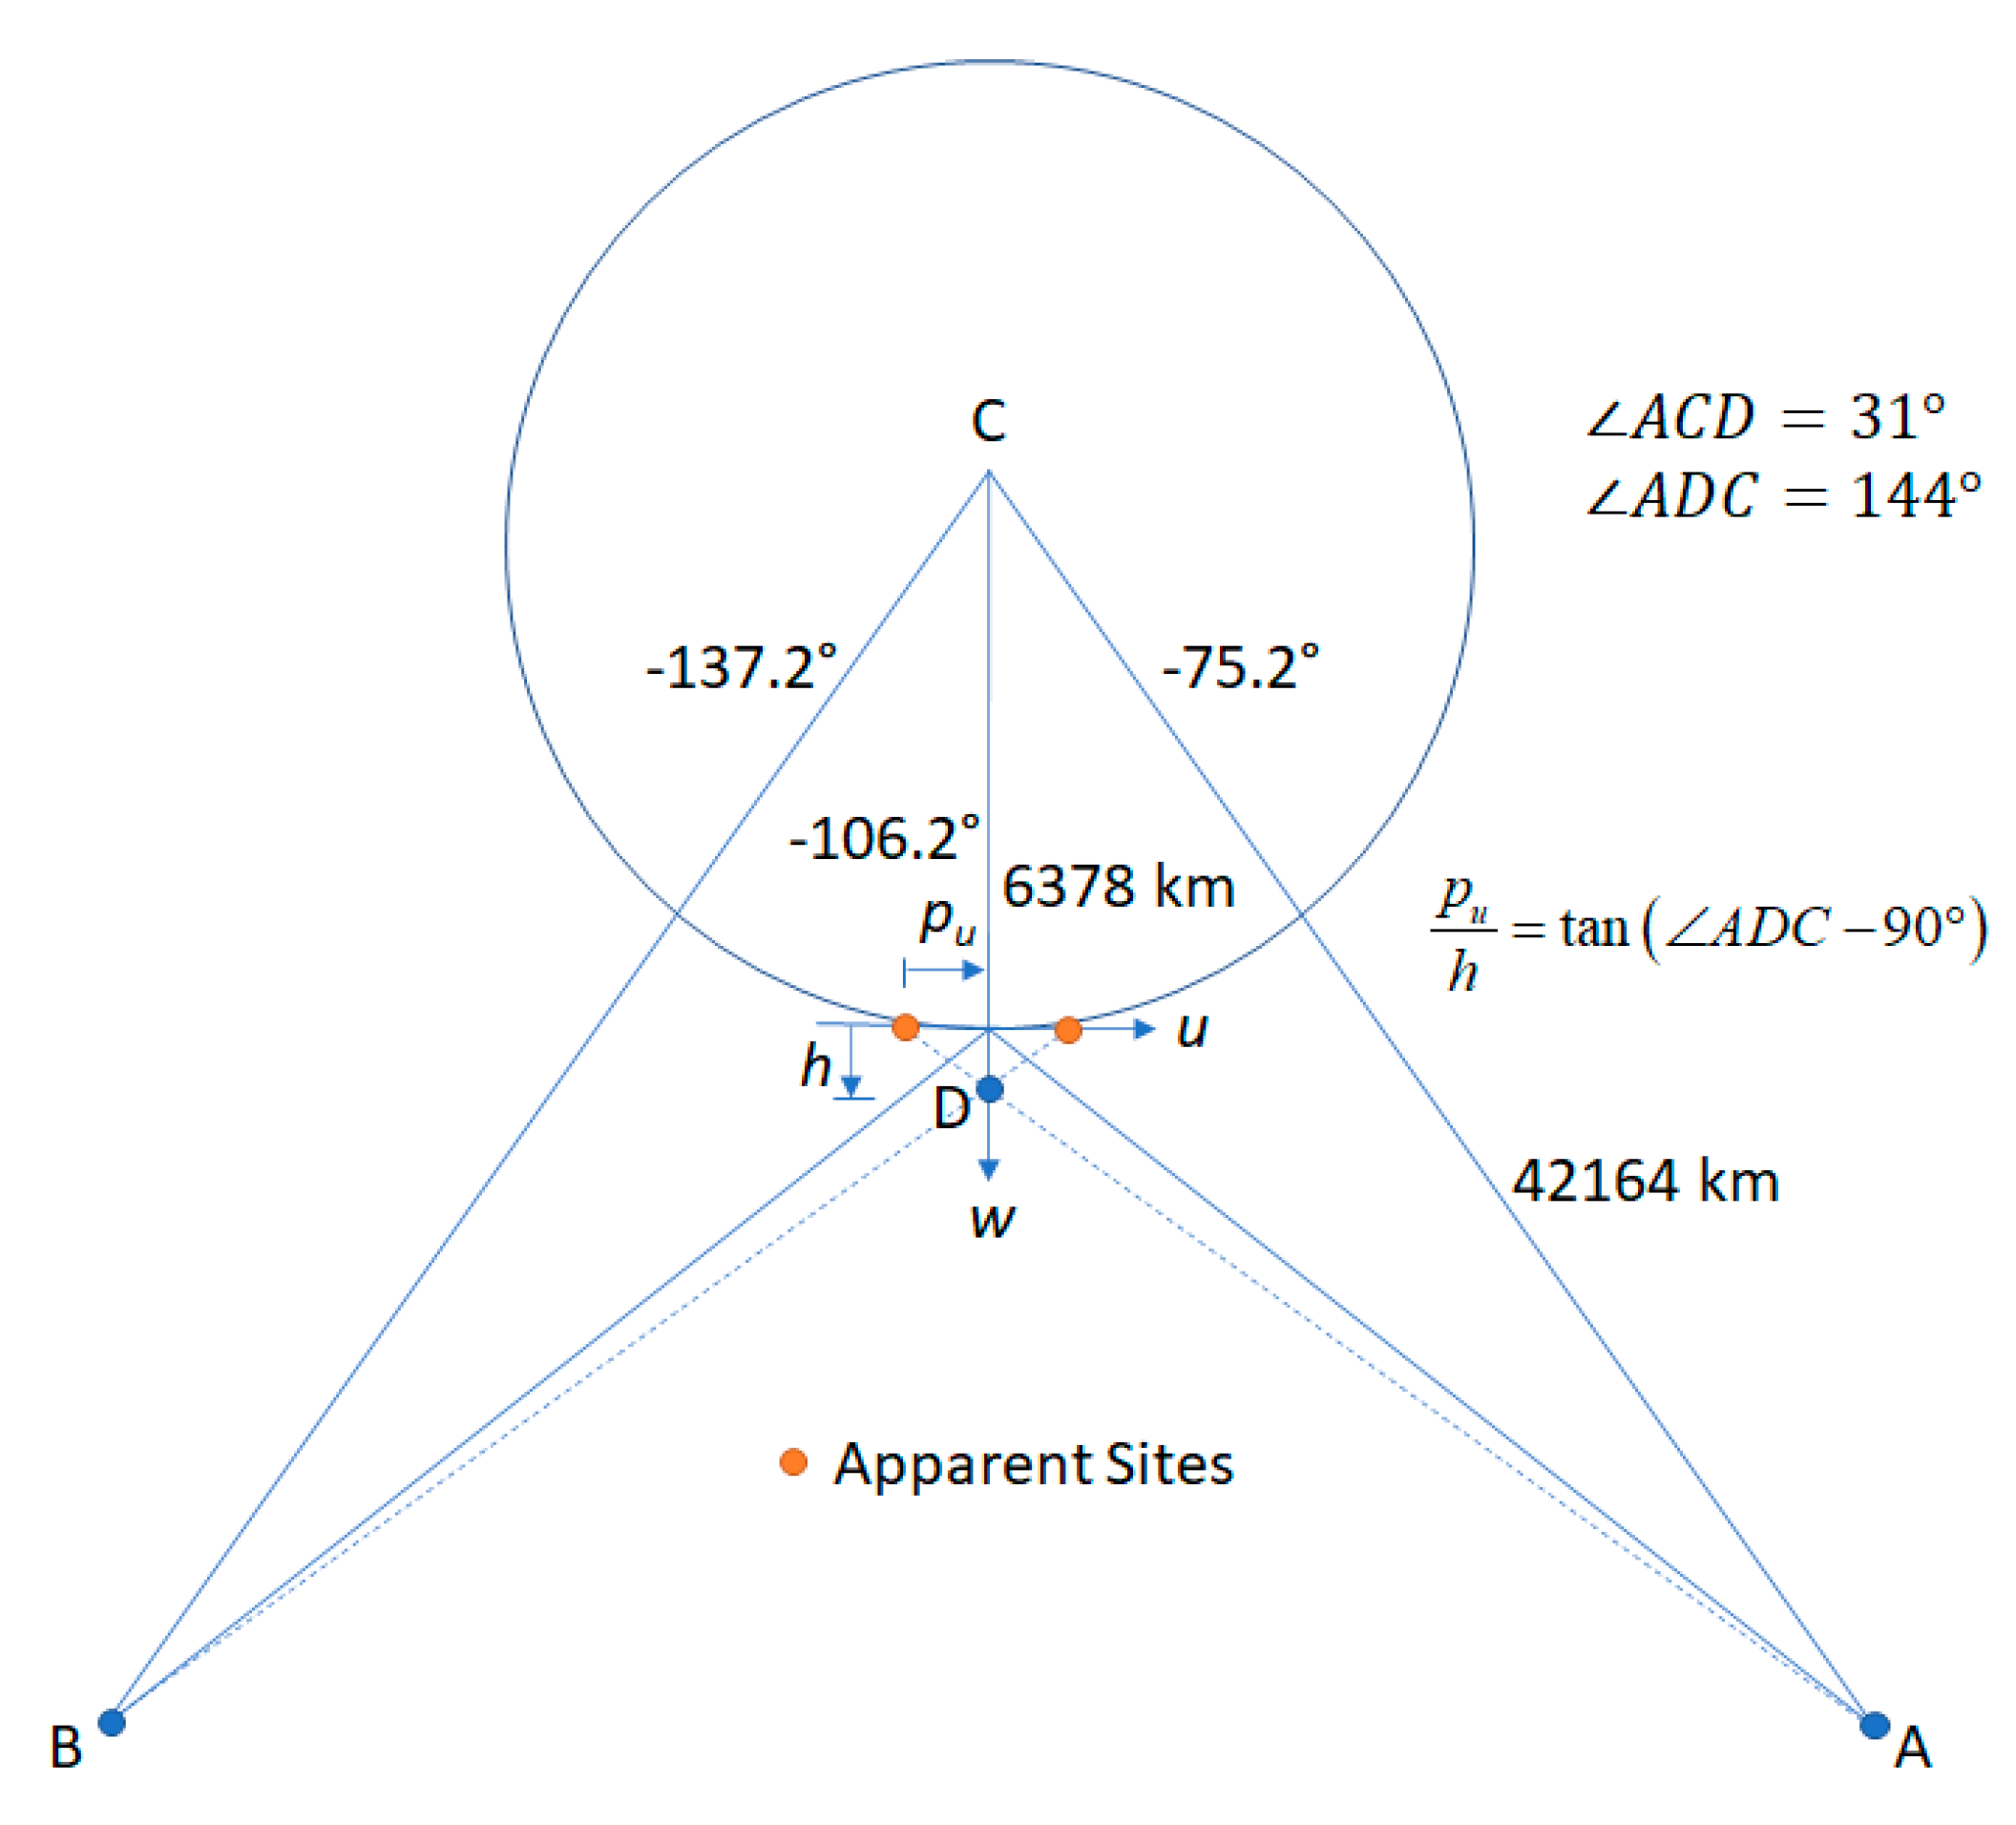
The geometry of stereo-winds retrieval with two GOES spacecraft is represented (not to scale) at a site bisecting the two satellites on the equator. The angle is half the longitude separation between the spacecraft and is found by the law of cosines. In the limit as , the ratio of the parallax to the height approaches .
For the above geometry, each column in Table 5 shows the error in the retrieved state variable, in m or m/s, that is realized from a +1 km displacement in the assigned site for the tracer in each of the five input scenes individually. A triplet of CONUS scenes from GOES-16 and a pair of consecutive FD scenes from GOES-17 were assumed with the first and last members of the triplet (A±) being simultaneous with the FD pair (B±). Table 5 also presents the objective function value () after the state solution.

Table 5.
Sensitivities of individual states are shown to +1 km displacements applied individually to each of the five input scenes at the midpoint between GOES-16 and -17 on the equator.
The five state rows by ten displacement columns above form a matrix that gives the response of the retrieval process in the linear approximation to small displacements in units of each state component per kilometer of displacement. The following linear combinations of displacements provide interpretations () as pure motion or pure parallax:
- km, has with only nonzero state = 3.33 m/s,
- km, has with only nonzero state = 3.33 m/s,
- km, has only = 500 m and h = 685 m being nonzero.
The above conforms with expectations, as the ratio of the parallax correction to height 500:686 matches the tangent calculation in Figure 23 and a 1 km displacement over 5 min is a velocity of 3.33 m/s. Although does not combine linearly, it can be calculated for each combination above and was found to be zero in these cases, meaning that their representation as states is exact in terms of the model. It is also the case that for displacements of A0 in either direction as indicated by the A0 column in Table 5. This is simply a reflection of the fact that the disparities were measured with respect to the A0 scene and therefore this case is equivalent to displacing all the other scenes in the opposite direction. The response of the retrieval process is to adjust the site location to compensate and leave the height and wind velocity states unaffected.
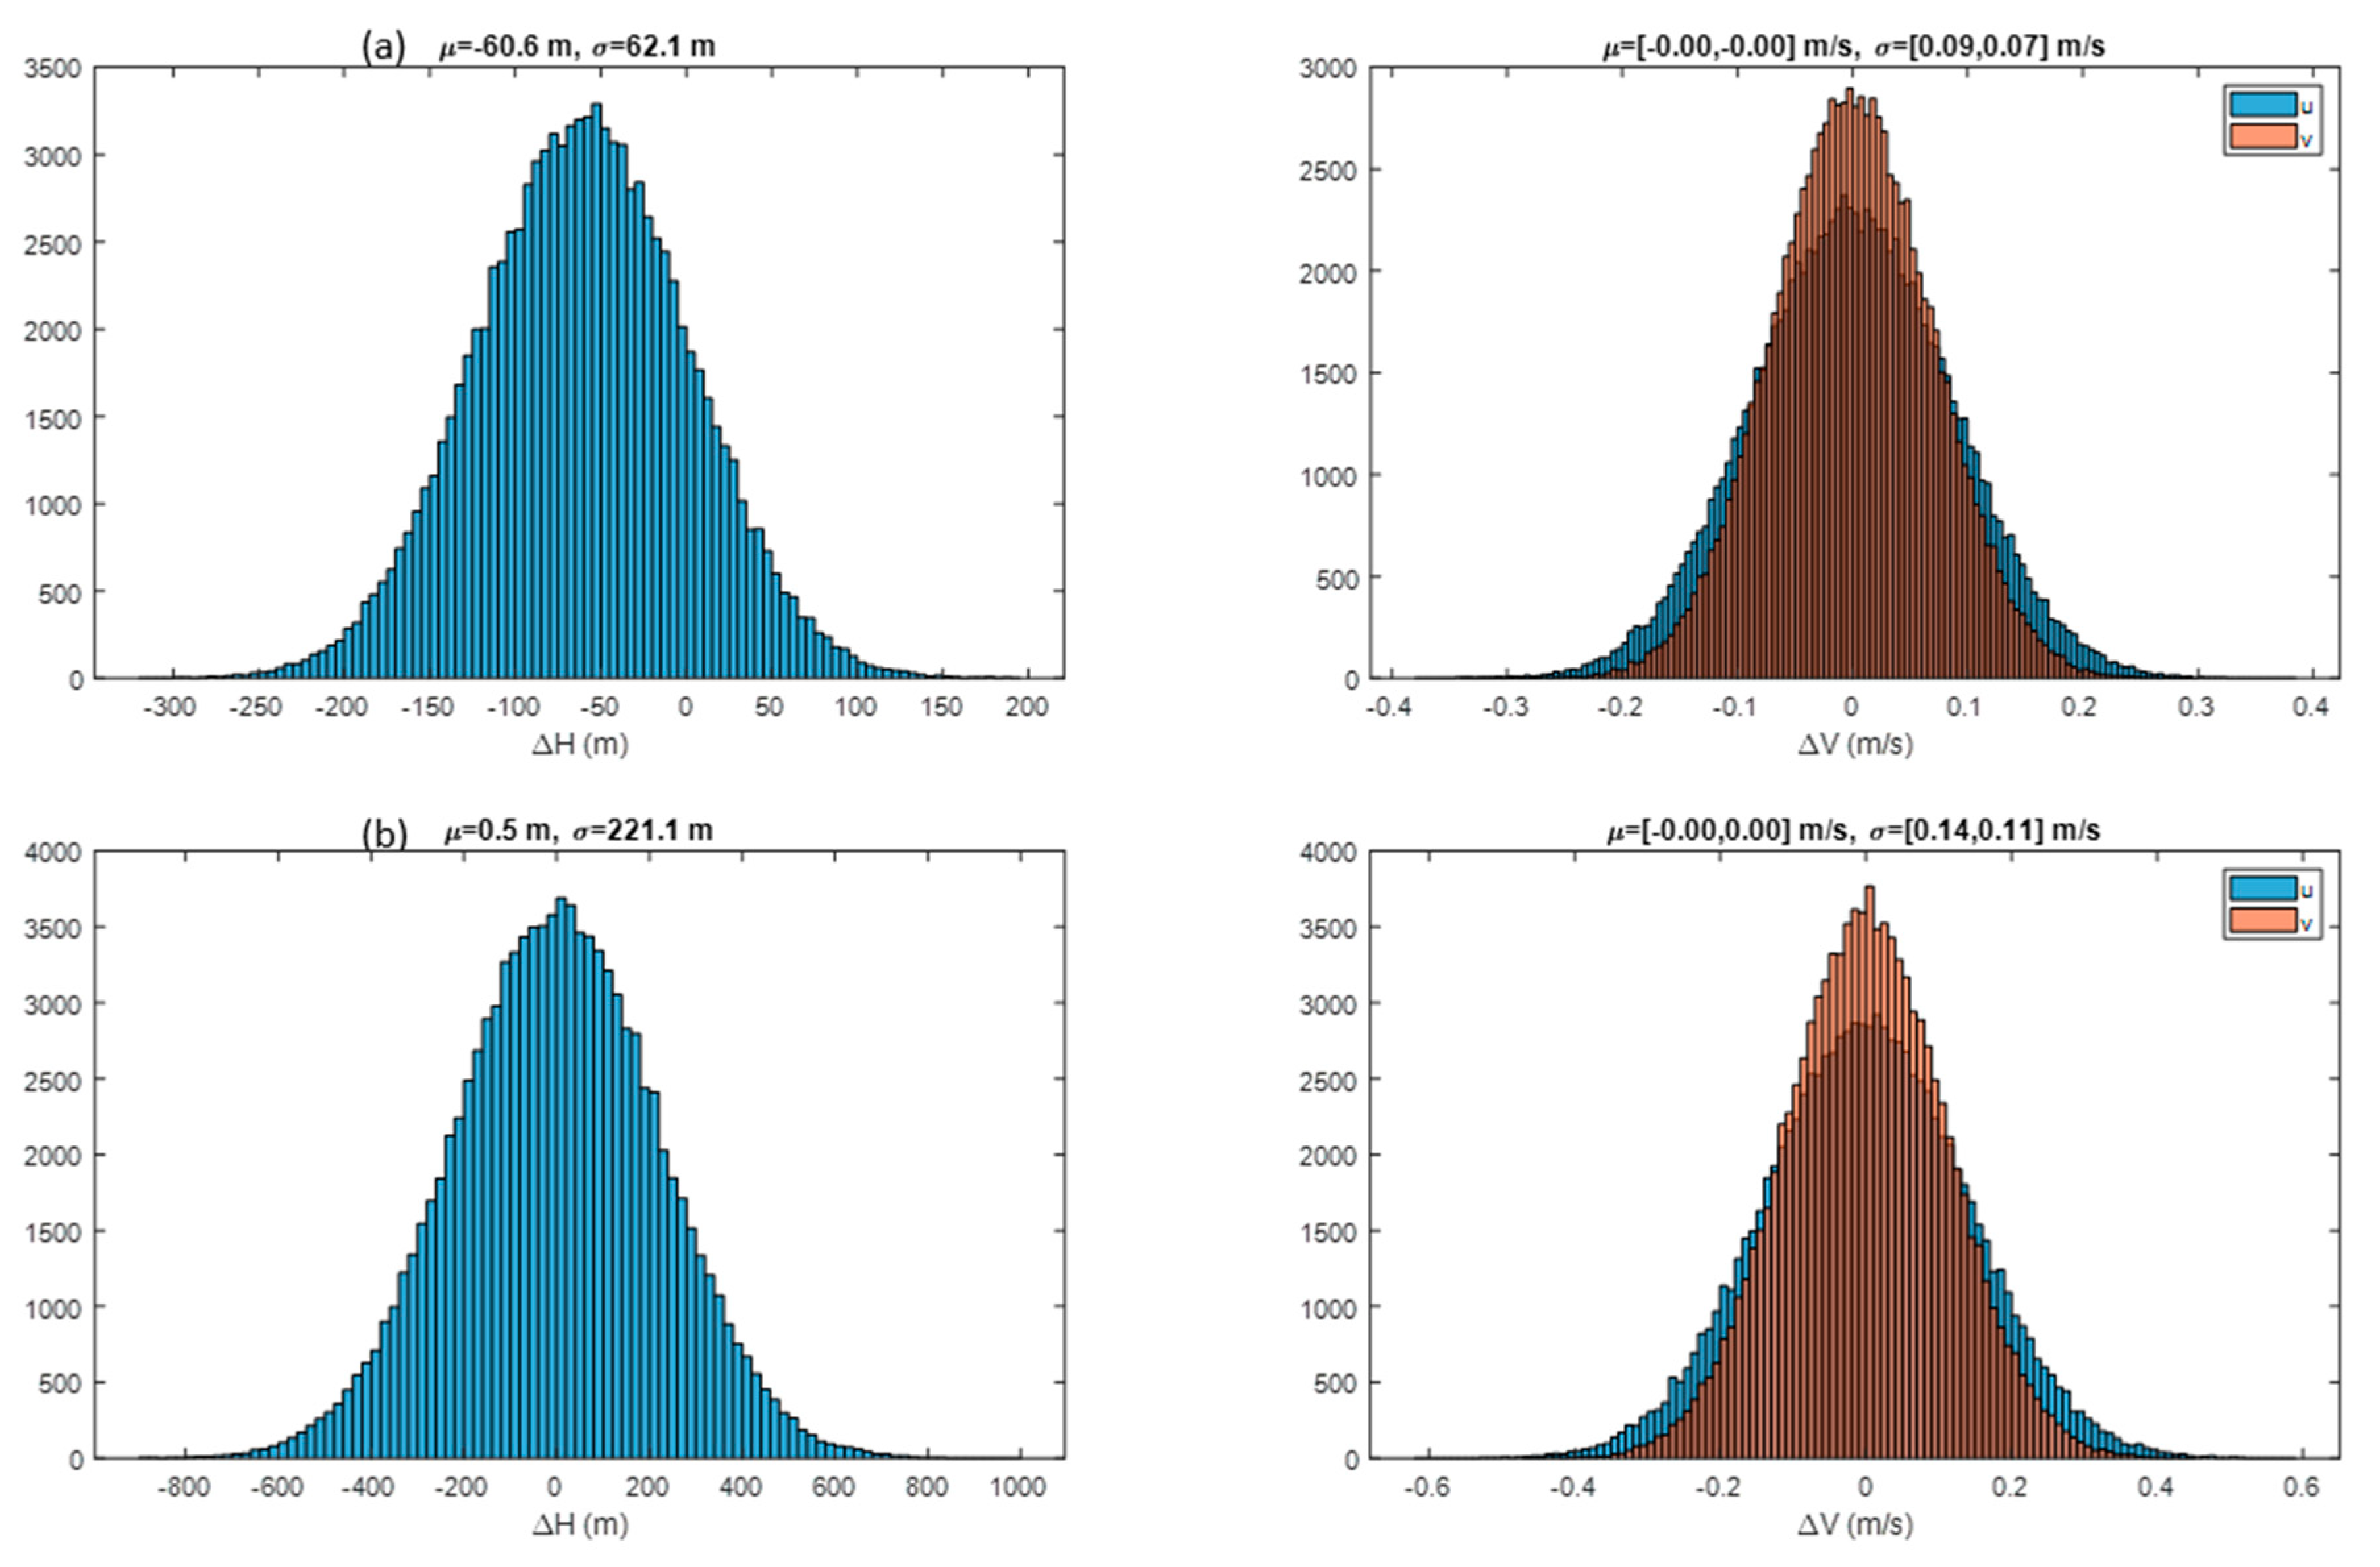
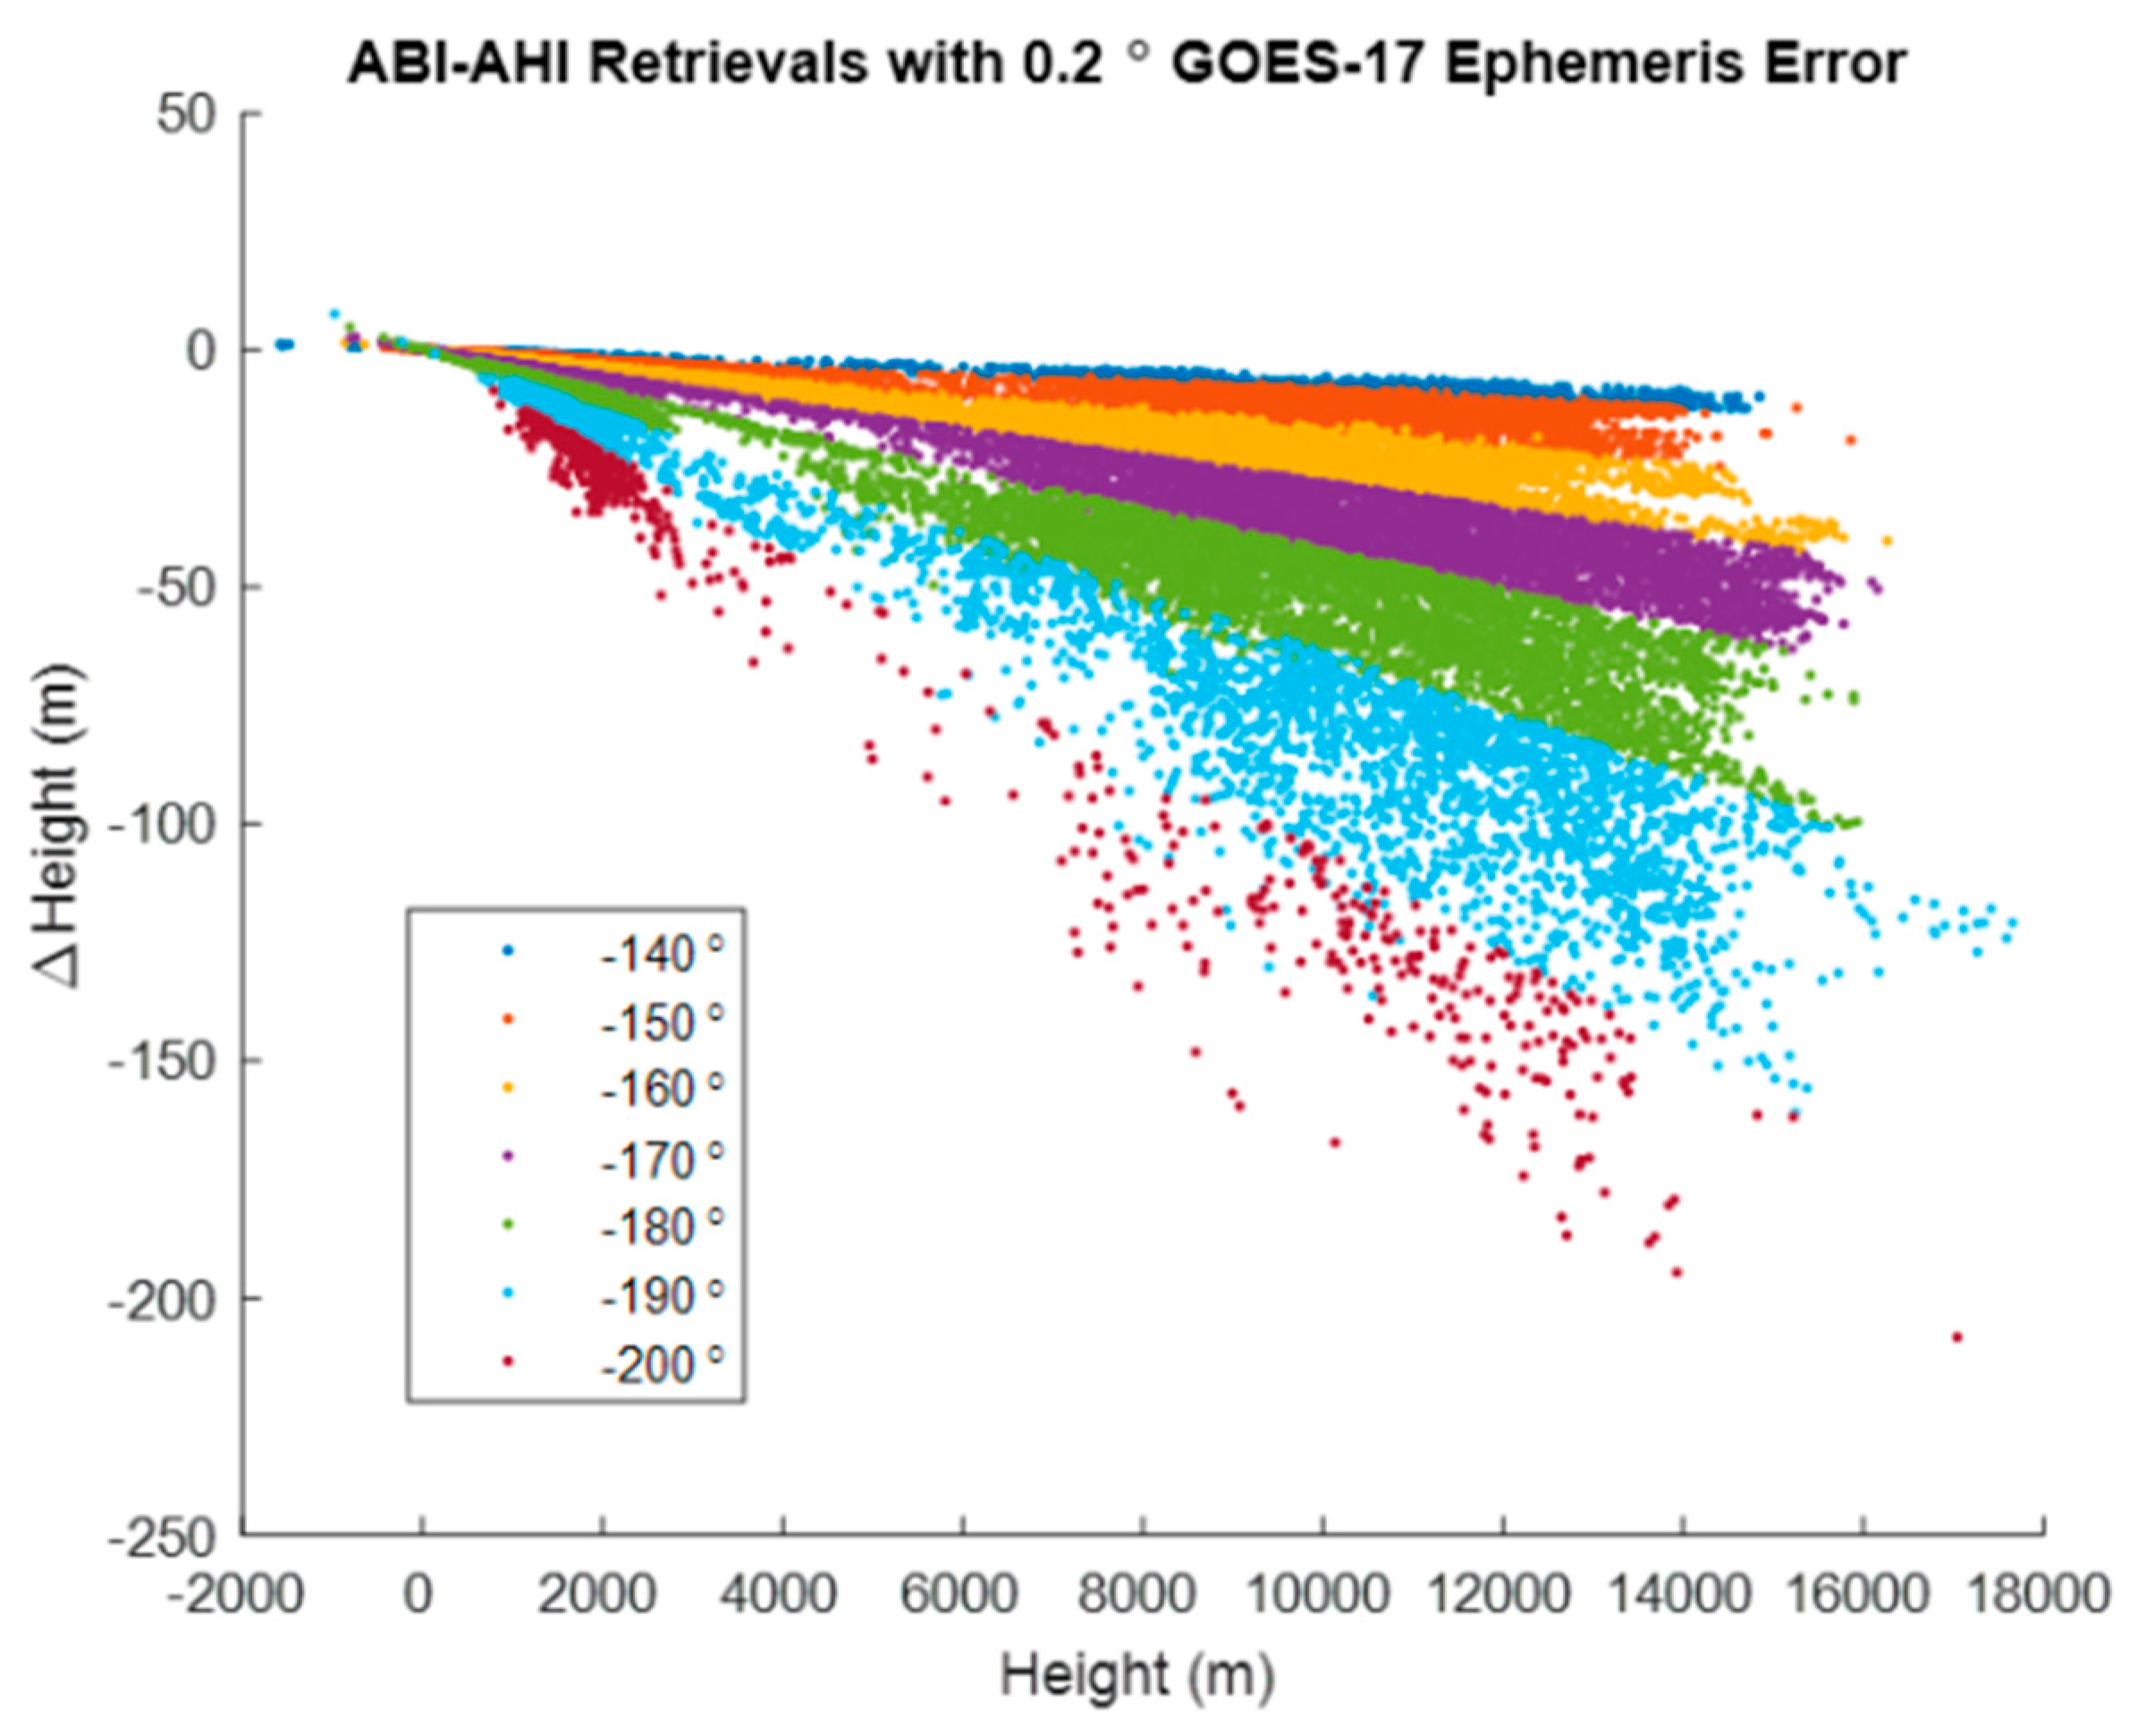
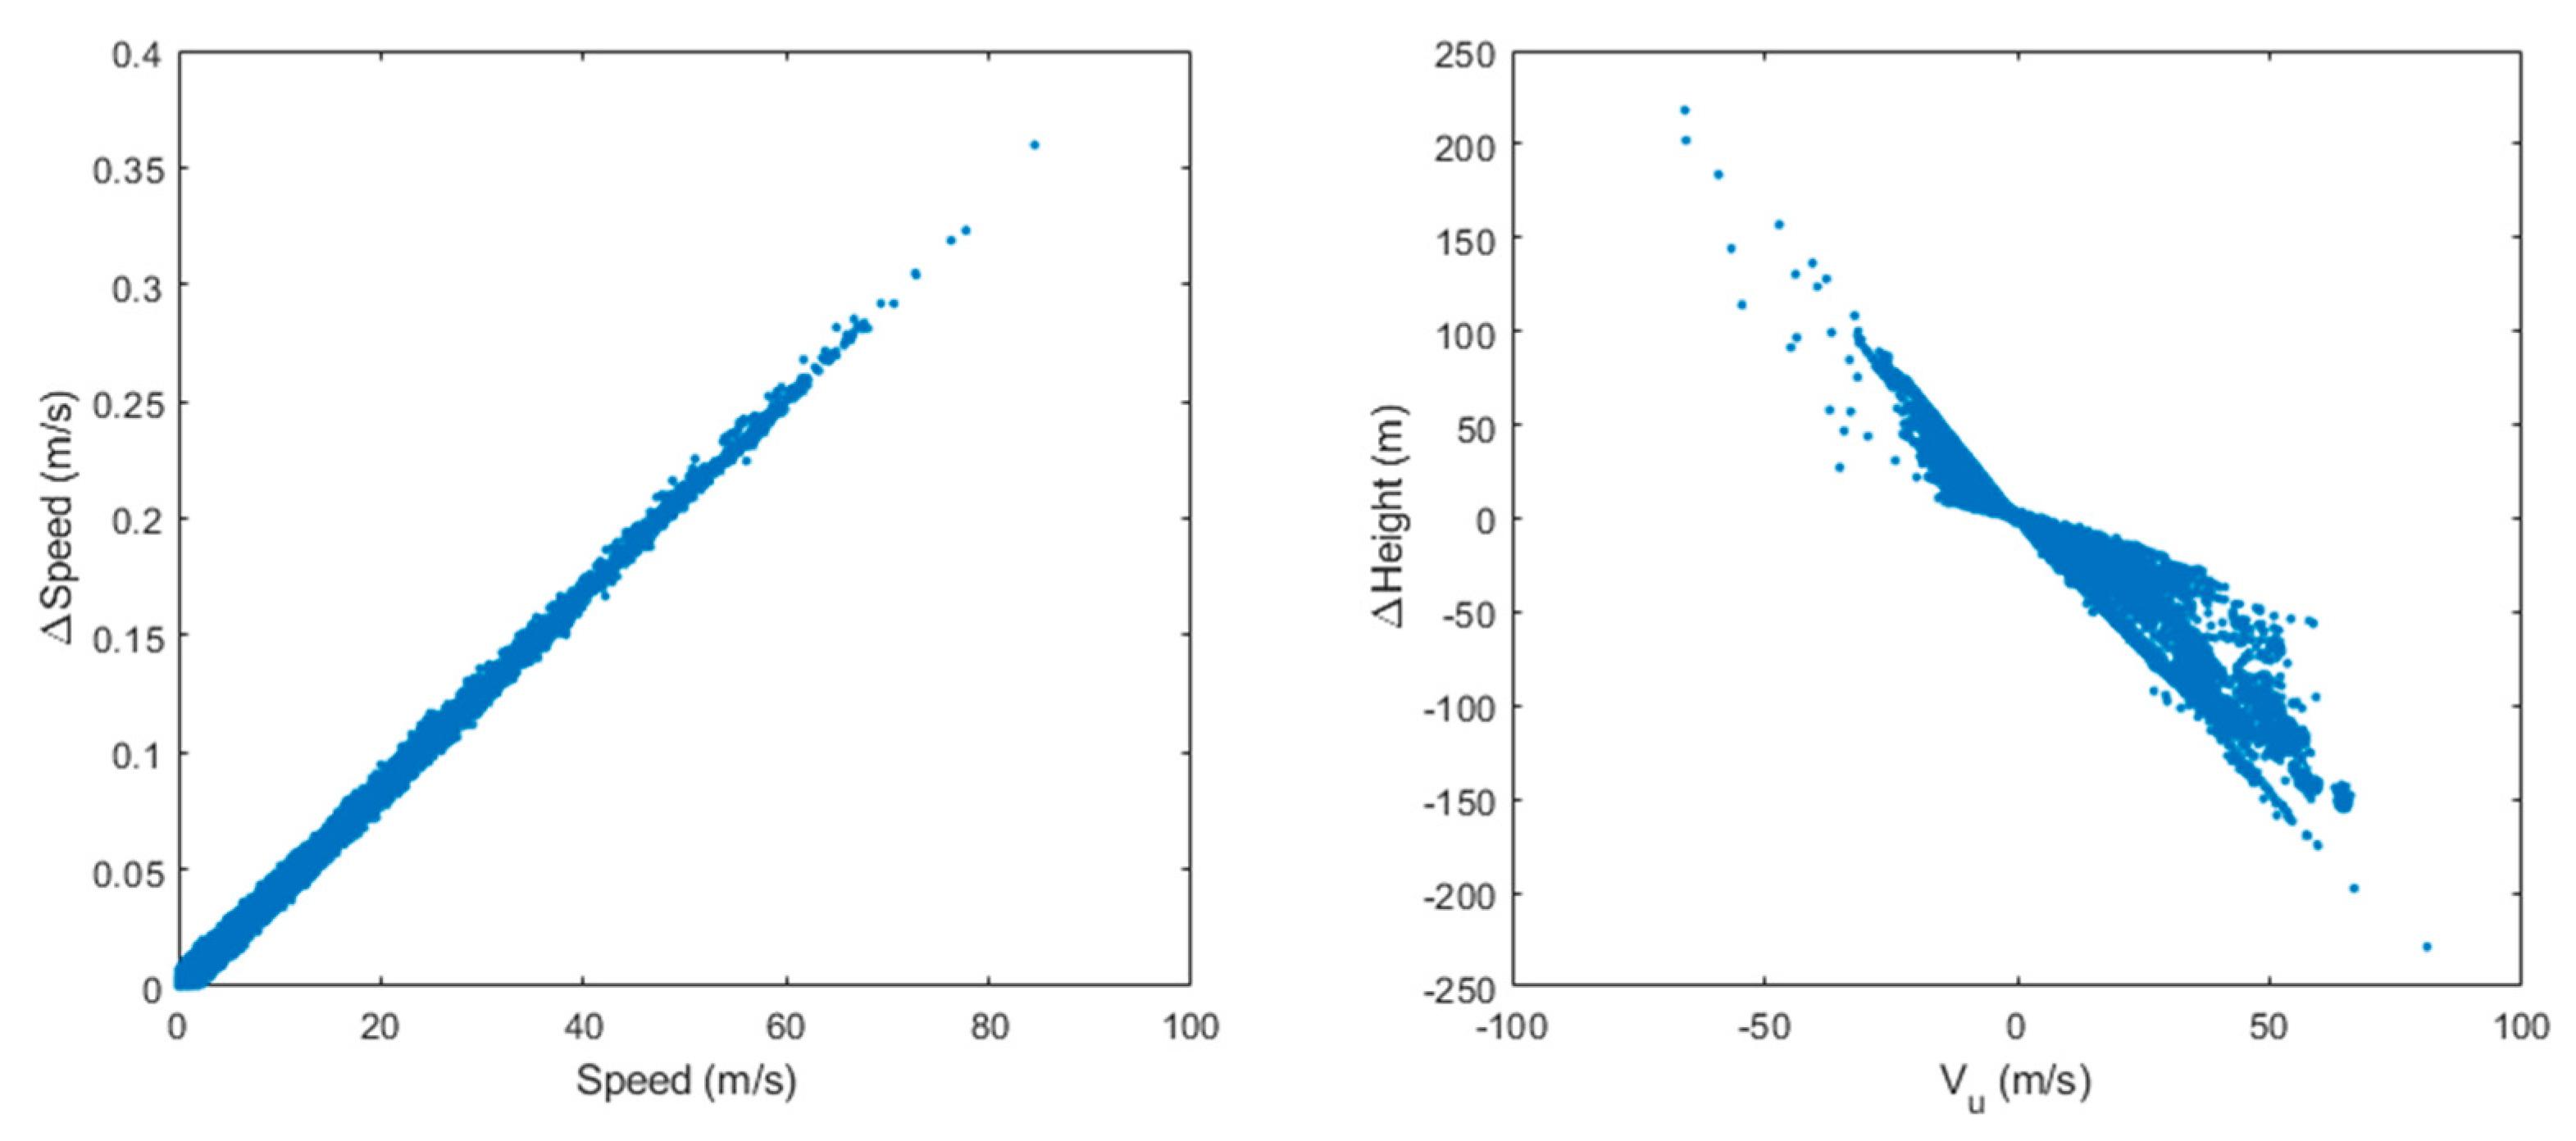
In addition to the 5-state retrievals, the retrieval process also produced a 5 × 5 covariance matrix to represent the uncertainties (and their correlations) in the retrieved states. Assuming that the 1 km displacements for A± and B± were instead independent normally distributed random numbers with means zero and standard deviations equal to 1 km along both axes, the covariance matrix was found to be nearly diagonal in the geometry of Figure 23 and the square root of its diagonal elements were the one-sigma standard errors (or uncertainties): m, m, and m/s. We validated these theoretically calculated uncertainties using a Monte Carlo simulation with 105 trails representing random errors in measured u- and v-displacements with respect to A0 and running the retrieval model to find: m, m, m, m/s, and m/s. Hence, if we can represent the statistics of the disparity measurements in terms of their uncertainties, we can have an estimate of the uncertainties of retrieved states. This is particularly useful in the LEO–GEO geometry, even if real disparities are likely to have more complicated statistics, with biases and correlations, to diagnose when stereo winds fail because the lines of sight from the two satellites are nearly parallel. The covariance matrix possesses a divergent eigenvalue in such cases. This pathology does not occur in the GEO–GEO geometry except when the longitude separation of the satellites approaches zero when retrievals fail essentially everywhere. The retrieved-state uncertainties are modeled well by the covariance matrix when the weights in Equation (2), for each disparity , represent the inverse of the squared uncertainty of the disparities. We generally assume that these uncertainties are on the order of one-half pixel. Regardless of the realism of this assumption, the covariance matrix remains useful for diagnosing singular geometries.
The relevant INR metrics for the GOES-R system are navigation (NAV) error and frame-to-frame registration (FFR) error, interpreted as angles in the fixed grid. NAV error represents the offset between the ABI imagery and a reference map or nearly perfectly GEO–registered imagery from another source. FFR represents the stability of NAV between consecutive frames. The GOES-R specification was 28 μrad for NAV, 21 μrad for FFR (resolution < 2 km), and 28 μrad for FFR (resolution = 2 km). Each number represents the absolute value of the mean error plus three times the standard error. The measured performance on the orbit is considerably better [62]. Our INR error model parameters provide a simple description of the INR errors that envelope the demonstrated on-orbit performance of both satellites. For ABI B02, there can be a small negative bias of about 2 μrad in NAV in the EW direction, and an about 5 μrad (3σ) random NAV error in both axes. The B02 FFR errors are unbiased and have about 5 μrad (3σ) random error in both axes. Typical NAV performance for the 2 km IR channels (e.g., B07) was measured at 16 μrad (3σ) in both axes and FFR at about 8 μrad (3σ) in both axes. We represent these INR errors in a Monte Carlo analysis by modeling the navigation errors for the A and B sequences such that the error statistics of individual scenes matched the NAV parameters and the statistics of the differences between successive scenes matched the FFR parameters. The conversion between distance on the ground and fixed-grid angle at the SSP was 1 km equal to 28 μrad and increasing away from the SSP. In the geometry of Figure 23, a 28 μrad angular displacement was elongated in the u-direction by but not in the v-directions (i.e., ) and was the same for both satellites. We applied these factors to derive the site location errors from the INR errors for our Monte Carlo analysis.
Figure 24 shows the retrieval error statistics from the Monte Carlo simulation with 105 trials and using the INR performance parameters for the 0.5 km ABI B02 and the 2 km ABI B07 channel. The bias has been represented only in the A satellite to avoid cancellation. It introduces a small bias in the height retrievals. The error statistics shown were smaller than those observed from the ground-point retrievals (Figure 7 and Figure 8), but there are other error sources that should be included that are very challenging to analyze. Mapping error would represent any geometric error introduced in the process of remapping the B± scenes into the fixed grid of satellite A. It could include topographic, shading, or shadowing effects. With a moving target, the mapping error may be uncorrelated between B± but be correlated for a stationary feature. There is also matching error that would represent the uncertainty in locating the matching place of templates from A0 in A± and B±. Matching error may depend on the template sizes, feature contrast, and shape.
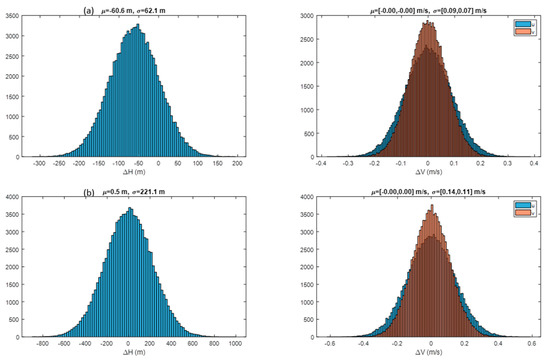
Figure 24.
Monte Carlo simulation results show the retrieval error statistics with demonstrated on-orbit GOES-R image navigation and registration (INR) performance for (a) ABI B02 and (b) ABI B07. Mean and standard errors are listed in order of the [u, v]-directions.
FFR errors can be observed in the disparity measurements of ground points. Figure 25 shows the measured disparities between A± and A0 within the class of ground points. The restriction to the A satellite removes parallax and remapping from consideration and the restriction to ground points assures that the measurements are being made on stationary objects. Here, we could observe a sudden jump in the FFR at swath boundaries. The jump is the signature of another INR error type called the swath-to-swath registration (SSR) error. In this example, the SSR error is 0.1 B02 pixels in the worst case. The FFR variation shown within a swath is typically <0.1 pixels from the mean. These results also confirmed our ability to track objects with subpixel resolution and to be sensitive to motion on the order of 0.1 pixels or better.
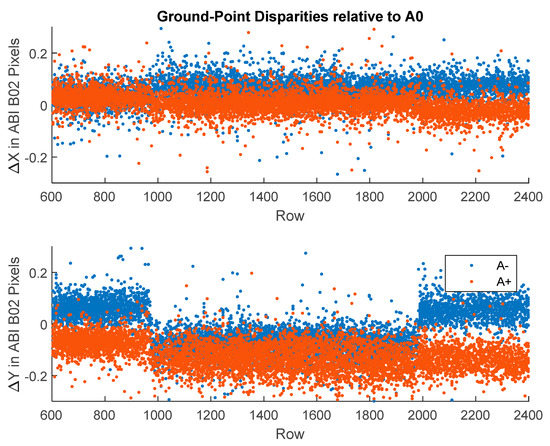
Figure 25.
Observed FFR error as a function of CONUS scene row number shows a jump in swath-to-swath registration (SSR) at swath boundaries. The A0 scene is a B02 CONUS image from GOES-16 at 2020/207 17:16. The upper panel shows the FFR in the East-West direction and the lower panel shows the North-South direction.
Himawari INR errors have been characterized as part of an effort to post-process the Himawari Standard Data (HSD) Level-1 product for land applications [63]. This characterization shows biases in NAV with mean values that can vary systematically with the hour of the day up to at least July 2019. Similar results have been published by [64]. We used the HSD products in our work but can apply an a priori compensation for the AHI navigation based on such a characterization when available. Uncompensated biases can be as large as one 0.5 km pixel. Figure 26 shows the height bias from an EW NAV bias equal to one 0.5 km pixel applied to the AHI imagery. The retrieved height bias scales in proportion with the EW NAV bias. A NS NAV bias had almost no effect.
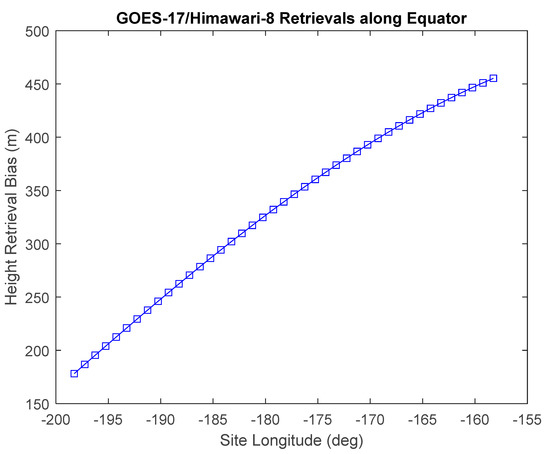
Figure 26.
Retrieved height bias grows with the distance from the Himawari-8 SSP along with the elongation of AHI pixels on the ellipsoid. The height bias will grow in proportion with the EW NAV bias, which is a single 0.5 km pixel in this case.
Clearly, it is advantageous that large INR errors should be compensated when they can be compensated. The overlap in coverage between GOES-17 and Himawari-8 is almost all over water, so height biases for ground points are not easily accessed. However, landmarks over Australia and Asia, which are outside of the overlap, could be used to identify NAV biases in individual AHI scenes or a priori models used.
4.1.2. Ephemeris Errors
The ephemerides of the A and B satellites are used in the retrieval algorithm. Ephemeris errors mostly affect the height retrievals. Here, we considered the case where an error is introduced in the GOES-17 ephemeris and the Himawari-8 ephemeris is left as is. Specifically, GOES-17 is assumed to be positioned at 137.0° W rather than 137.2° W for the purposes of exercising the retrieval algorithm, while leaving the definition of the GOES-17 fixed-grid reference longitude as 137.0° W. This changes the calculated baseline between the satellites. Figure 27 shows retrieved height differences for collocated retrievals in the two cases plotted versus retrieved height in site longitude bands. The height errors were in proportion to the height with a slope that grows as the site moved away from the GOES-17 SSP and toward Himawari-8. The slope of a regression in each longitude band would be proportional to the ephemeris error. Since a real ephemeris error will be much smaller than 0.2°, the induced retrieval errors should be much less than 100 m.
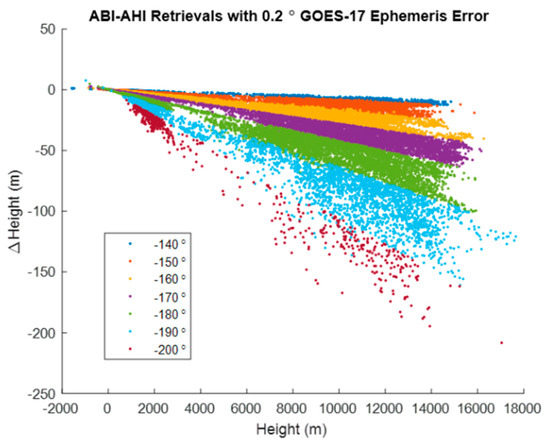
Figure 27.
Retrieved height differences are proportional to the wind height with a constant of proportionality that varies with the site longitude. The errors become more significant as the site moves away from GOES-17 and toward Himawari-8.
4.1.3. Time Assignment Errors
Time assignments for the matches of each template against each scene affect both the wind speed and its height assignment. Considering GOES-16 and -17, we introduced a +10 s time bias for all sites in the B+ scene and examined the errors introduced in the retrievals by comparing them against the retrievals without errors. Figure 28 shows that the time bias affects the retrieved wind speed in proportion to the speed. The height assignments are also affected, but in a slightly more complicated way related to the wind component parallel to the baseline between the satellites (i.e., approximately the u-component of wind velocity). This is expected since the retrieved wind velocity is derived from the perceived horizontal motion divided by lapsed time and the horizontal position is corrected for non-simultaneity using the time tags in the retrieval model that would in turn affect the parallax for a simultaneous observation.
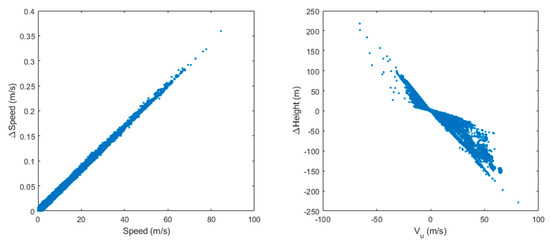
Figure 28.
Retrieved wind speeds and heights are affected by the presence of a +10 s time assignment error in the B+ scene roughly in proportion to the speed. The graphs plot the differences between retrievals with and without the time bias applied to the B+ scene. The left panel shows the speed error versus wind speed and the right panel shows the height error versus the u-component of wind.
The impact of a time-tag error would be roughly linear with its magnitude and errors on the order of 30 s could happen when a site is misassigned to a scan swath. Was this to occur over a background of moving clouds, there would be an apparent discontinuity in the retrieval fields as the swath boundary is crossed.
Swath boundaries pose challenges for satellite wind products in general. Templates or search areas can include pixels from neighboring swaths. If they contain a fast-moving feature that is being tracked, then the feature may have a dislocation on the swath boundary. This could affect both the match and the time tag. Filtering of the post-retrieval residuals, as described in Section 2.2, can flag such cases in many cases, allowing them to be marked with a nonzero DQF (=1 for inconsistent).
4.1.4. Stereo Sensitivity versus Coverage
In general, there is a tradeoff between the breadth of stereo coverage and the sensitivity that is governed by the separation in longitude between the two satellites. This is illustrated in Figure 29 where separation in longitude is parametrically varied from the geometry of Figure 23. A larger separation means less geographic coverage but a larger differential change in height per unit disparity measured either as kilometers projected on the ellipsoid () or pixels between an image pair (, with 1 km pixels implied). The overlaps in Figure 1 offer reasonably wide stereo coverage with good sensitivity. As the separation angle becomes smaller, finer subpixel shifts must be measured to achieve the same resolution in height.
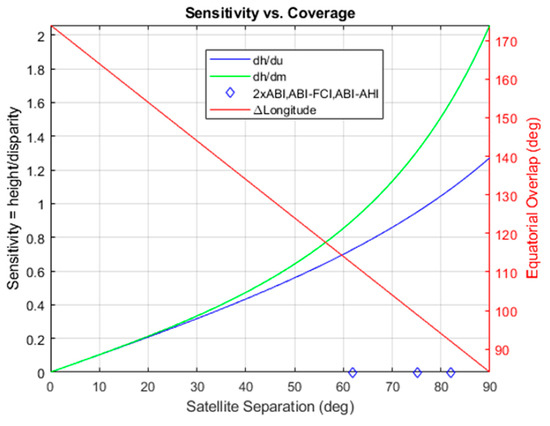
Figure 29.
Sensitivity versus coverage is shown as a function of the difference in longitude between the satellites. The coverage is measured between the horizons of the respective satellites along the equator (but may exceed practical limits on the usable imagery). Sensitivities are calculated for the midpoint of the coverage area along the equator.
4.2. Orographic Cloud Effects
Caution is required to use the AMVs derived from orographic clouds. Although the stereo-wind heights associated with the orographic clouds may be accurate, the AMVs from orographic clouds may not reflect the true air flow over the top of mountains. Orographic clouds are forced by the topography and appear as standing-wave clouds with a height close to the terrain. Typically, they are anchored along the mountain ridges or around inhomogeneous terrains. As a result, the AMVs from orographic clouds are close to zero, manifesting themselves as a slow bias in wind speed if they are not identified.
We can evaluate the effects of near-surface orographic clouds, possibly for the first time over a continental scale, because of the highly accurate stereo-wind height and AMV retrievals offered by stereo methods. Comparing the stereo retrievals with operational DMWs, we found much fewer measurements over landmasses in the operational DMWs. As shown in Figure 30, orographic clouds tend to develop in the afternoon hours over the Southwest U.S. after heating of the land surface creates conditions favorable for their formation. In other words, a strong diurnal cycle is expected for orographic cloud effects. To quantify the orographic cloud effect, we compared the terrain height with the stereo-wind B02 height retrievals that have a low (<1 m/s) wind speed for all daytime hours. As more orographic clouds appear in a region, the area-mean height bias against terrain will increase. Such an effect is seen in Figure 31 where the height bias over the Southwest U.S. increased with local time over the course of daytime orographic cloud development.
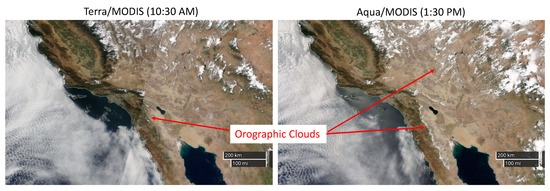
Figure 30.
Orographic cloud development seen by MODIS between morning and afternoon on 26 July 2019 over California, Arizona, and Mexico.
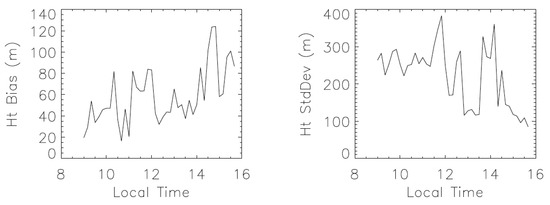
Figure 31.
Local time dependence of the terrain height bias (left) and its standard deviation (right) in the Southwest U.S. (111° W–105° W, 32° N–38° N) from the 3D-wind Band 2 retrievals for 26 July 2019.
Over a larger domain (e.g., the U.S. and Central America), orographic clouds manifest themselves as a high bias in the stereo-wind terrain height (Figure 32), with “terrain height” defined as the height with wind speed < 1 m/s; therefore, it reports the tops of orographic clouds if they are present. In Figure 32, we found that orographic clouds can reach as high as 1.5 km over the mountains in Mexico or Central America, which is much higher than those over the Rocky Mountains. Orographic uplift is one of the major cloud formation mechanics, among convectional lifting, convergence/frontal lifting and the radiative cooling processes. Atmospheric moisture convergence at the ridge–valley scale help to trigger valley convection and produce orographic clouds and subsequent precipitation [65]. Frequent, persistent orographic cloud cover is critical for tropical montane cloud forests [66]. A more reliable detection of orographic clouds and their variability with the stereo-wind algorithm can better characterize spatial patterns of cloud immersion over cloud-forest areas.
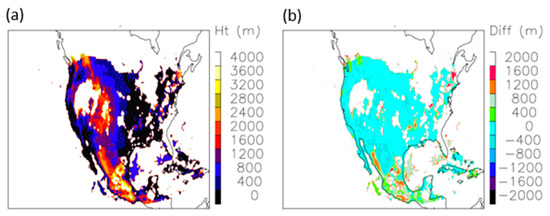
Figure 32.
(a) Terrain height with stereo retrievals from the B02 CONUS-FD stereo; and (b) stereo height above terrain for wind speed < 1 m/s, which indicate the retrieval bias from the true terrain height. The stereo heights with wind speed < 1 m/s are averaged to a 0.5° × 0.5° longitude–latitude grid from all daytime hours on 26 July 2019.
4.3. Rawinsonde Comparisons and NWP Implications
Satellite-derived winds are routinely evaluated against spatially and temporally collocated rawinsonde observations to assess their quality [7,8,28,35,67,68]. While this is the general practice, it is important to understand that the differences in the winds obtained from these observing systems come from a combination of observing system measurement errors, representativeness errors, and atmospheric spatial/temporal variability (e.g., wind shear and vertical moisture distribution). Wind representativeness errors are the result of differences in what these two observing system’s measurements represent. Radiosonde wind measurements are essentially point or line samples along a slant path through the atmosphere, whereas satellite winds are representative of motion that is over an atmospheric volume. As a result, the range of typical error variances between satellite winds and rawinsondes winds range from 1.5 to 7.5 m/s [69].
While the ground-point statistics cited in Table 2 and the theoretical arguments in Section 4.1 indicate that the velocity retrieval errors should be much smaller than Cordoba [69], we should keep in mind that ground points differ from cloud targets in many respects, including a static morphology, opaqueness, non-acceleration, zero velocity shear, and (except in mountains) confined to a thin layer or surface. Therefore, we would expect ground-point statistics to exaggerate the accuracy of the retrievals in terms of their representing physical winds. Supposing that representativeness errors are larger than the underlying accuracy indicated by the ground points and theoretical considerations, it would not be surprising that even significant improvements in satellite wind measurements will have a small numerical impact on the MVD metric. Yet, such improvements may have significant impact on NWP. One of the largest sources of errors for satellite winds is the height assignment [4,70,71]. Velden and Bedka [72] have estimated that height assignment is the dominant factor in satellite wind uncertainty and contributes up to 70% of the total error. A reliable estimate of the magnitude of the height-assignment error is critical for NWP data assimilation and must be accounted for [73]. Numerous studies have also been done to investigate the interpretation and impact of interpreting satellite winds as a layer-average wind [68,72,74,75]. The stereo method enables the retrieval of very accurate cloud heights, and therefore, very accurate satellite wind height assignments; and therefore, we expected potential for the stereo winds to contribute to improving the skill of NWP forecasts.
5. Conclusions
The stereo-winds method jointly solves for AMVs and their heights in the atmosphere using feature tracking to measure disparities between a reference scene and its multitemporal repetitions and at least one view from a different vantage point. An important feature of our approach is that it does not require synchronization between observing systems, only the ability to assign times to pixels. In previous works [10,11], the stereo-winds method was developed for LEO–GEO combinations. Its application to GEO–GEO combinations is fully developed in the present work. Our collaboration developed two codes and applied them to combinations including GOES-16, -17, and Himawari-8.
AMV height assignment is an important problem considering that typical wind speeds increase significantly with increasing height (decreasing pressure level). Operational satellite wind products rely on AMV height assignments that use IR methods regardless of whether features are being tracked in an IR or VIS channel. Such methods rely on differential absorption from cloud-top to space or modeled temperature versus height (pressure) profiles [1,2,3,4,5,6,7,8]. The latter can be susceptible to error, particularly in the presence of inversions or stratospheric folding. Stereo methods offer a direct method of height assignment that can be used as an alternative or complementary method where there is overlapping GEO–GEO or LEO–GEO coverage. Stereo methods can be applied to any pairing of similar spectral channels. We exhibited several application areas where stereo methods provide insight into atmospheric processes, including deep convection in tropical cyclones, processes in the PBL, and the dynamics of wildfire smoke plumes. Ultimately, we expected its greatest impact to be in the field of numerical weather prediction. In future work, we anticipated continuing the development of prototype products and testing their impact on forecast skill as part of a path towards operationalizing stereo winds at NOAA. A stereo capability will be particularly useful when working with GOES-17, which shares overlaps with both GOES-16 and Himawari-8. The GOES-17 LHP anomaly [15,16] causes IR channels used for operational height assignments to become nonfunctional at certain times of the day near the equinoxes, which impacts the coverage and quality of AMVs. Stereo methods provide a means to make accurate AMV height assignments under these conditions to mitigate the impact of the anomaly.
Stereo methods are effective due to the improved INR performance (i.e., geometric accuracy and stability) offered by systems such as GOES-R and will work well with other systems in the GEO ring offering similar performance. We analyzed the sensitivity of stereo-wind retrievals in the presence of INR and other errors to demonstrate that expected retrieval errors are in a family with the observed retrieval errors from our validations against fixed ground targets.
The improved quality of the stereo winds was due to their improved height assignments. Our validations against rawinsonde observations generally demonstrated improved performance from stereo winds, which is an indication that stereo winds have good potential for improving forecasting skill. The addition of the stereo winds to the suite of NOAA’s operational winds can be expected to increase the utilization of NOAA’s satellite winds at NOAA and international partner operational NWP forecast systems with the potential for measurable improvements in the accuracy of global and regional weather forecasts.
We intend in future work to extend our validation of stereo winds to include comparisons with Aeolus, additional rawinsonde datasets, and collocated aircraft winds. We also plan to engage with NWP centers to stimulate interest in conducting an OSE.
Supplementary Materials
The following are available online at https://www.mdpi.com/2072-4292/12/22/3779/s1, ABI time-model LUTs.
Author Contributions
Conceptualization, J.L.C., D.L.W. and J.D.; Data curation, M.D.F. and W.B.; Formal analysis, J.L.C.; Funding acquisition, D.L.W. and J.D.; Investigation, J.L.C., D.L.W. and J.D.; Methodology, J.L.C., D.L.W., J.D. and W.B.; Project administration, D.L.W. and J.D.; Resources, D.L.W. and J.D.; Software, J.L.C., M.D.F., W.B. and H.M.; Supervision, D.L.W. and J.D.; Validation, J.L.C., D.L.W., J.D. and W.B.; Visualization, J.L.C. and W.B.; Writing—original draft, J.L.C., D.L.W., J.D. and W.B.; Writing—review and editing, J.L.C., D.L.W., J.D., M.D.F., W.B. and H.M. All authors have read and agreed to the published version of the manuscript.
Funding
Carr Astronautics received support from NASA Goddard Space Flight Center under the NNG17HP01C contract through Support for Atmospheres, Modeling, and Data Assimilation (SAMDA). Carr Astronautics and IMSG received support form NOAA/STAR and the GOES-R Program. Mariel D. Friberg’s research was supported by the NASA Postdoctoral Program at the NASA Goddard Space Flight Center and administered by Universities Space Research Association. Resources supporting this work were provided by the NASA High-End Computing (HEC) Program (NASA program manager: Tsengdar Lee) through the NASA Center for Climate Simulation (NCCS) at Goddard Space Flight Center. Additional supports were provided by Terra/MISR (NASA program manager: Hal Maring), Decadal Survey Incubation Study Teams: Planetary Boundary Layer (NASA program manager: Gail Skofronick-Jackson). The APC was funded by NASA.
Acknowledgments
Special thanks to Stacey Williamson at Carr Astronautics who assisted with the manuscript.
Conflicts of Interest
The authors declare no conflict of interest.
Appendix A
The ABI Level-1 product was constructed so that 0.5 km pixels nest within 1 km pixels that in turn nest within 2 km pixels. The swath transition line (STL) separated pixels that were resampled from detector samples belonging to one ABI swath from those resampled from the next swath of detector samples. Pixels were never resampled from a mix of two swaths. The STL was always drawn on the boundary of a 2 km pixel and was the same for all spectral bands. There were 22 swaths in an ABI FD and 21 STLs separating them. The STL governs the choice of which candidate pixel was selected for the Level-1 product in the overlap between swaths; therefore, knowledge of the STL is required to ascertain which pixels belong to which swaths to model pixel times. The STL is not visible to users of the ABI Level-1 product, so it must be modeled. This can be done well, but not perfectly.
Figure A1 shows the STL from a test conducted for a patch to the data operations (DO) software in the GOES-R Core Ground System where the ABI Level-1 product was constructed. The Level-1 product was created and distributed in “release regions” shown as magenta blocks and released one by one in the GOES Rebroadcast (GRB) data stream. The GRB data stream was recovered at a second location where the blocks were assembled into a rectangular canvas to populate the Level-1 netCDF product files. Individual swaths were commanded to begin and end at the same fixed grid addresses every FD and small adjustments were made onboard so as to efficiently cover the scene using swaths that had only a small overlap between them. The centerline of this overlap nominally bisected the midpoint between consecutive scan trajectories (green lines). This would be a good guess for the STL; however, the STL algorithm actually placed the STL (red and blue points) slightly above the overlap midline in this test. The behavior of the STL can be complicated as the scan moves off the Earth; however, we only cared about the STL for Earth pixels. The STLs that are interior to the Earth are represented as blue points. Their behavior was such that the STL was nominally about a dozen 2 km pixels to the north of the overlap bisection line but could fluctuate up or down along the width of the swath. Figure A2 provides a histogram of the bias in the STL relative to the overlap bisection line observed over the FD. One can more practically assume that the STL is always drawn with the same bias (12 IR pixels north) since the fluctuations from the nominal cannot be predicted. The bias value was approximately half the height of the tallest overlap across all the spectral bands. It is possible that the bias value could depend on the DO release, but the STL could not deviate too far from the overlap midline. The behaviors of the STLs for the CONUS and MESO scenes were similar in this test.
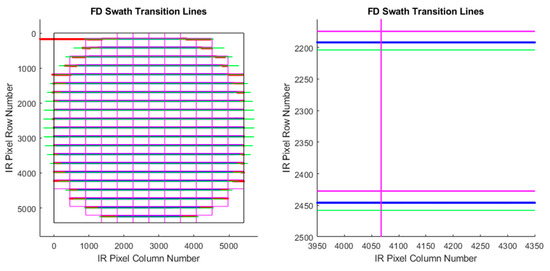
Figure A1.
The swath transition line (STL) interior to the Earth is represented by blue dots and the overlap bisections are drawn in green. The complete FD is shown to the left with a zoom to the right.
Figure A1.
The swath transition line (STL) interior to the Earth is represented by blue dots and the overlap bisections are drawn in green. The complete FD is shown to the left with a zoom to the right.
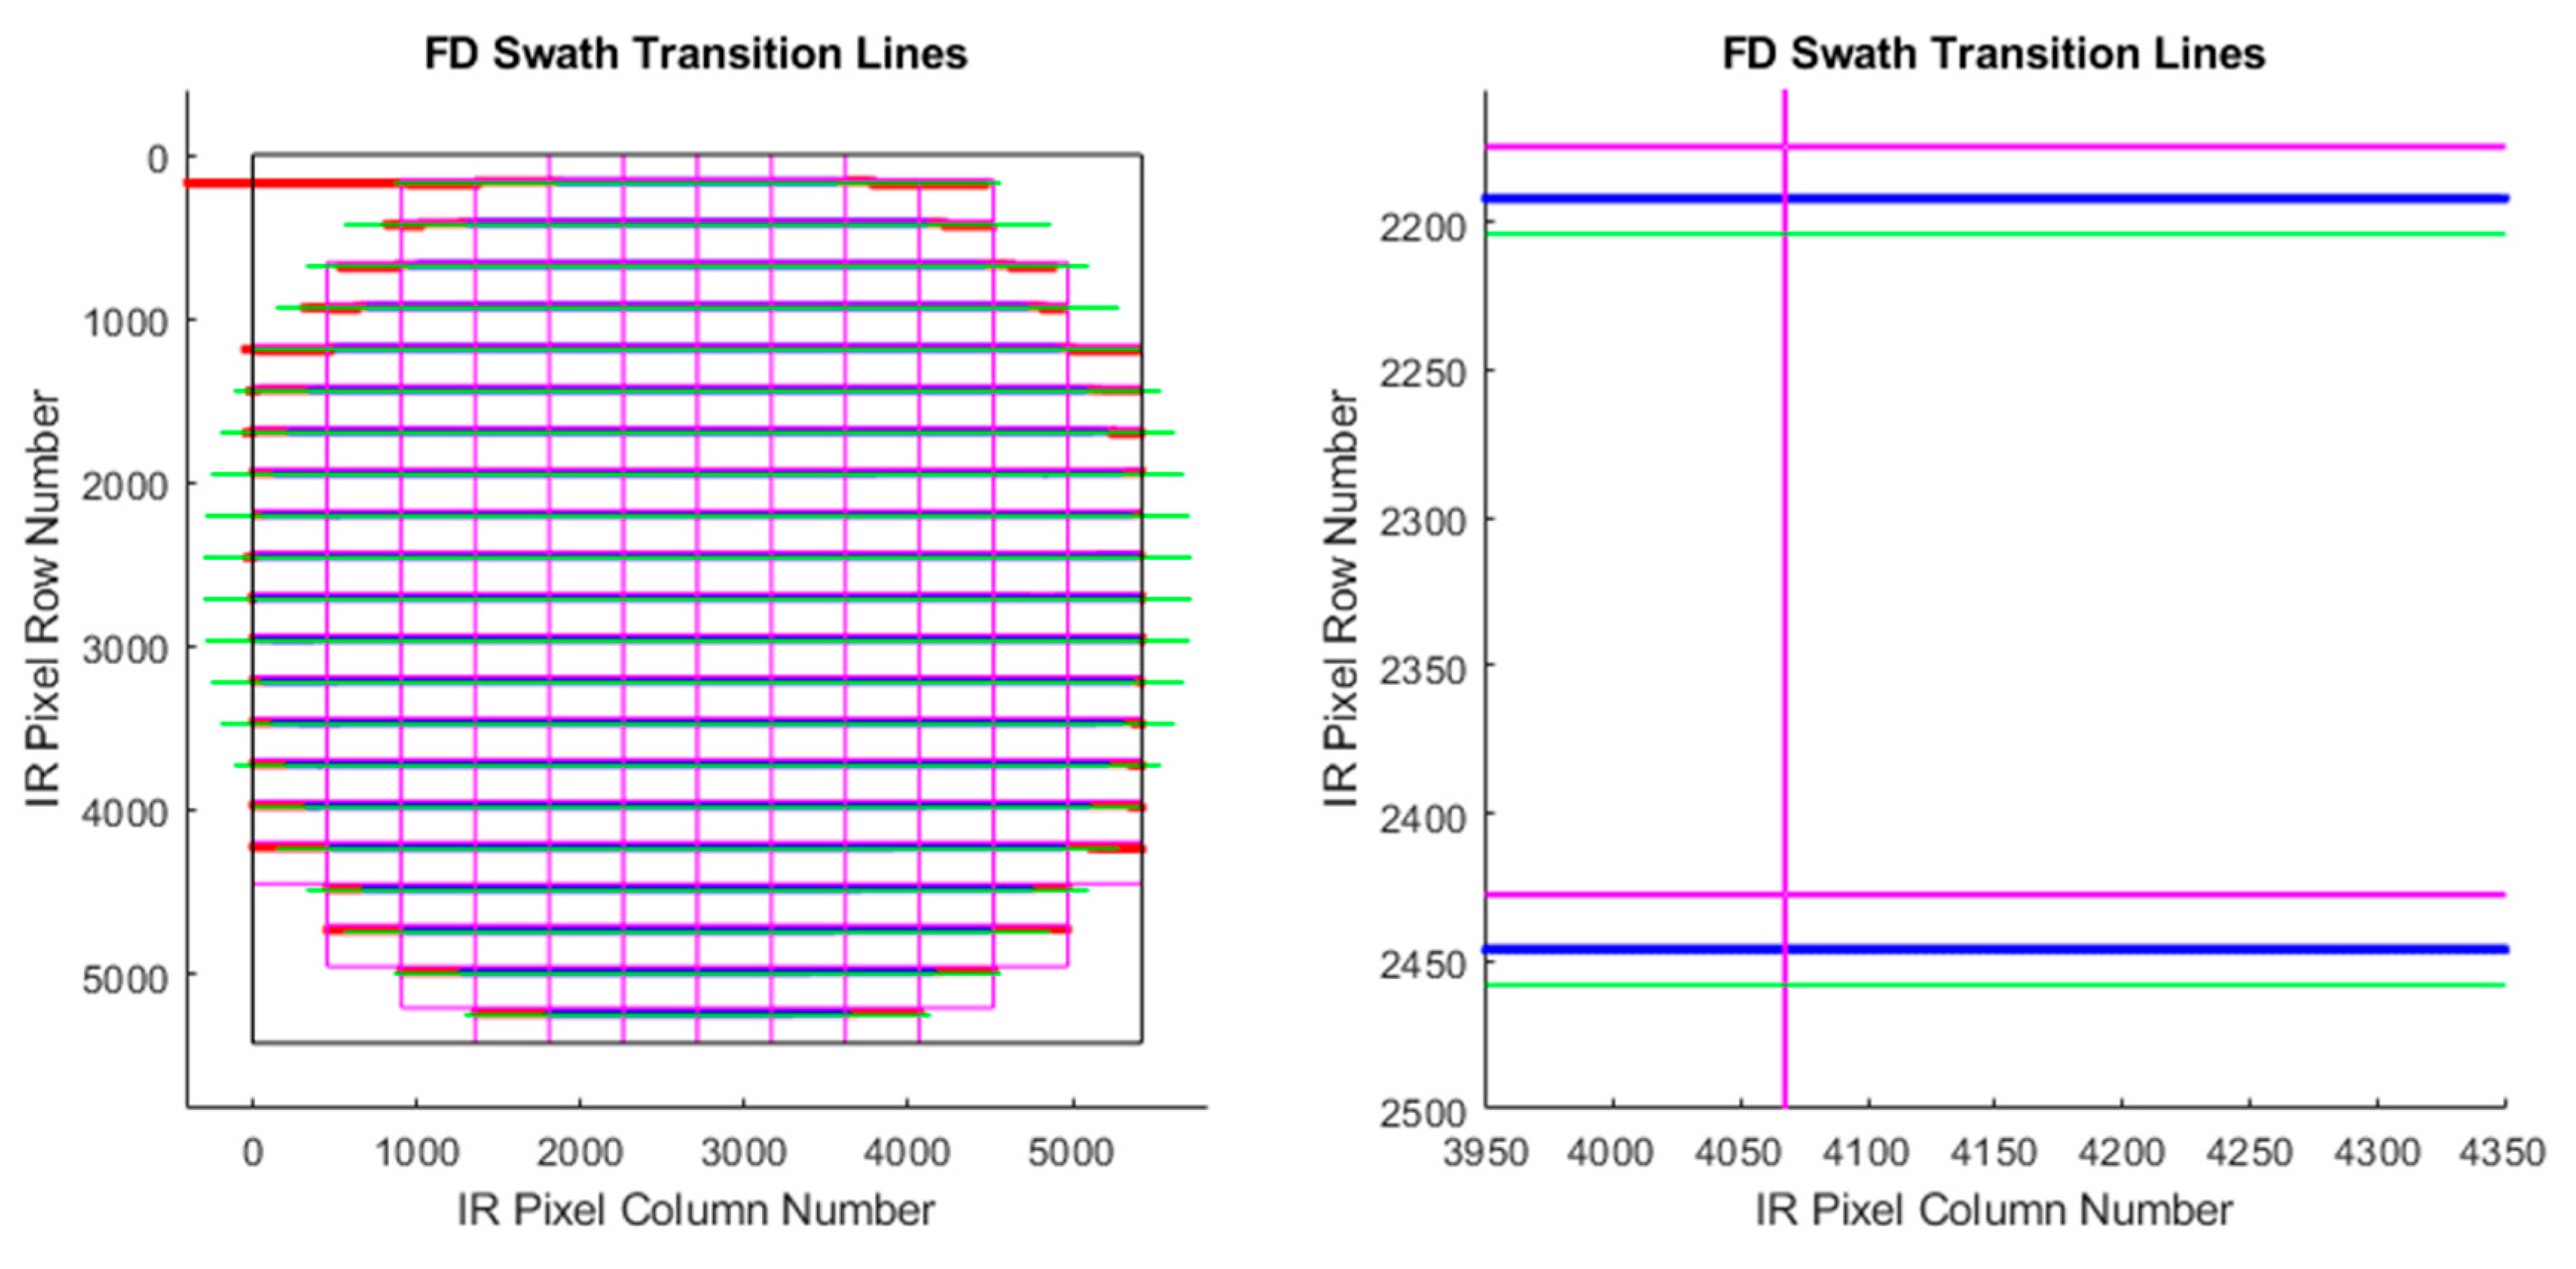
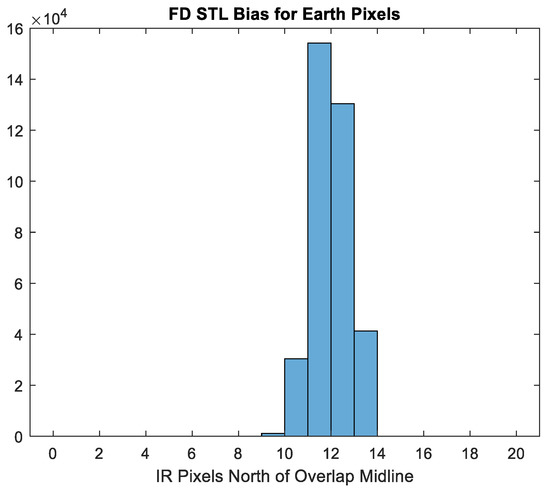
Figure A2.
Histogram of the bias of the STL with respect to the overlap bisection line for a FD has a median value of 11 and a mean of 11.5 2 km IR pixels.
Figure A2.
Histogram of the bias of the STL with respect to the overlap bisection line for a FD has a median value of 11 and a mean of 11.5 2 km IR pixels.
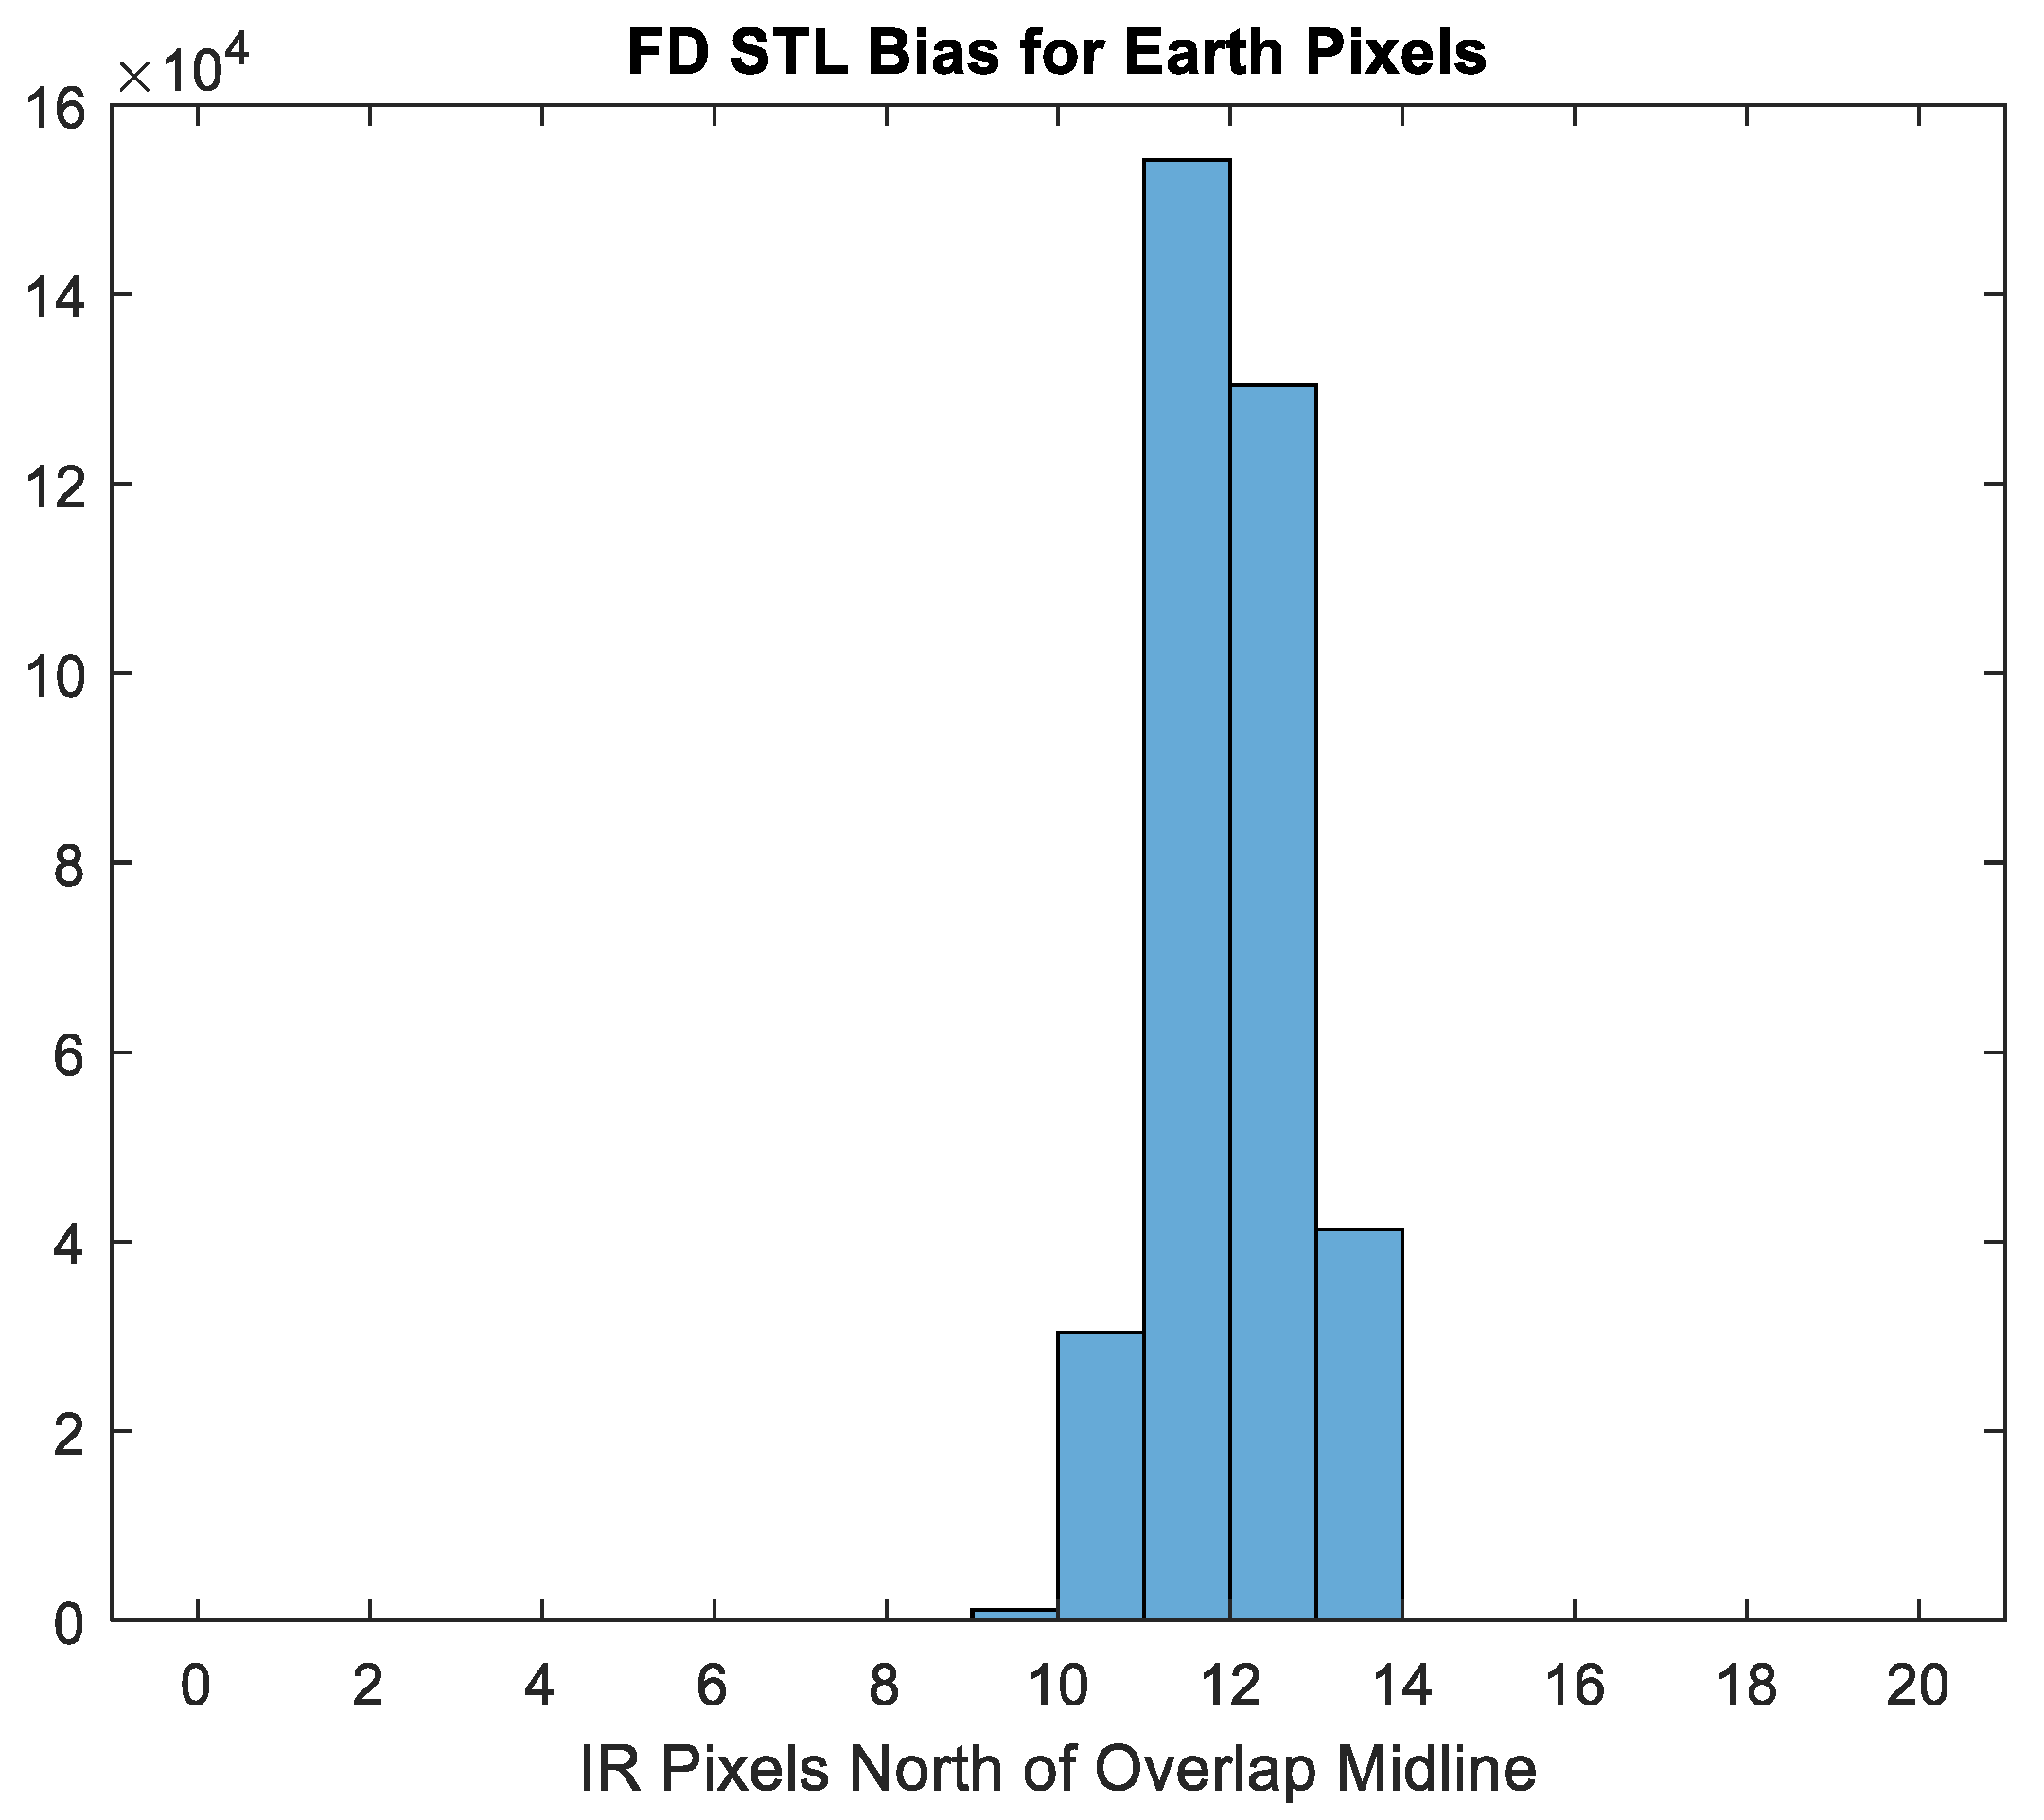
The LUTS were constructed for each timeline from the output of a tool called MISTiC that was used to construct new timelines. We read a MISTiC html output file to gather the swath start and stop times and assigned the center time for each swath accordingly. The scan rate of 1.4°/s was used to calculate the variation in time as the scan progressed from west to east. STLs are drawn with constant bias from the overlap bisection lines and the LUT times were offset so that the first pixel in the first release region had a time stamp equal to zero. Product times of all channels denote the time of the first Band 2 detector sample used to construct the Band 2 scene; therefore, the product time was a good approximation to add to the LUT times to get an absolute time stamp for all pixels within a Band 2 scene. However, the detectors for each ABI channel were offset along the scan from each other, so a small adjustment can be made for each spectral channel using Table A1 below. The value in Table A1 for a spectral band minus that of Band 2 should be added to the pixel times as a small final adjustment.

Table A1.
Time offsets of the ABI spectral bands relative to the optical center.
Table A1.
Time offsets of the ABI spectral bands relative to the optical center.
| Band | 1 | 2 | 3 | 4 | 5 | 6 | 7 | 8 |
| seconds | 0.179 | −0.055 | 0.402 | 0.642 | −0.359 | −0.642 | 0.535 | 0.267 |
| Band | 9 | 10 | 11 | 12 | 13 | 14 | 15 | 16 |
| seconds | 0.000 | −0.267 | −0.535 | −0.542 | 0.551 | 0.319 | −0.256 | 0.579 |
Generally, pixel times should be very accurate (1 s) when we properly assigned them to their swaths. However, the fluctuations in the STL from its nominal bias were unpredictable. When a pixel swath was misassigned then the timing error would be 30 s for ABI Modes 3 and 6 and somewhat less for Mode 4.
The LUTs were stored in netCDF files named after the MISTiC html file from which they were created. There was a time model variable for each scene in the timeline. In the case of a timeline with multiple repetitions of a CONUS, there will be a separate variable for each repetition. This allows for there to be differences in the relative relationship between CONUS swaths between scene repetitions, which happen in some timeline definitions. The user must know the timeline in use and the phasing of in the timeline definition with respect to the top of the hour to relate a CONUS product file with its repetition in the timeline. Generally, it can be assumed that the top of the hour starts a timeline. There were multiple MESO scenes within all timelines (excerpt for Mode 4, which has none); however, in all timeline definitions so far, the second MESO swath always followed the first with the same cadence. Hence, no distinction between MESO repetitions was made in the time model. However, note that some timelines had irregularities in the MESO product times between repetitions. These were fully visible with the product time encoded in the file.
References
- Menzel, W.P.; Smith, W.L.; Stewart, T.R. Improved Cloud Motion Wind Vector and Altitude Assignment Using VAS. J. Clim. Appl. Meteorol. 1983, 22, 377–384. [Google Scholar] [CrossRef]
- Szejwach, G. Determination of Semi-Transparent Cirrus Cloud Temperature from Infrared Radiances: Application to METEOSAT. J. Appl. Meteorol. 1982, 21, 384–393. [Google Scholar] [CrossRef]
- Schmetz, J.; Holmlund, K.; Hoffman, J.; Strauss, B.; Mason, B.; Gaertner, V.; Koch, A.; Van De Berg, L. Operational Cloud-Motion Winds from Meteosat Infrared Images. J. Appl. Meteorol. 1993, 32, 1206–1225. [Google Scholar] [CrossRef]
- Nieman, S.J.; Schmetz, J.; Menzel, W.P. A Comparison of Several Techniques to Assign Heights to Cloud Tracers. J. Appl. Meteorol. 1993, 32, 1559–1568. [Google Scholar] [CrossRef]
- Frey, R.A.; Baum, B.A.; Menzel, W.P.; Ackerman, S.A.; Moeller, C.C.; Spinhirne, J.D. A comparison of cloud top heights computed from airborne lidar and MAS radiance data using CO2 slicing. J. Geophys. Res. Atmos. 1999, 104, 24547–24555. [Google Scholar] [CrossRef]
- Heidinger, A.K.; Pavolonis, M.J. Gazing at Cirrus Clouds for 25 Years through a Split Window. Part I: Methodology. J. Appl. Meteorol. Clim. 2009, 48, 1100–1116. [Google Scholar] [CrossRef]
- Borde, R.; Doutriaux-Boucher, M.; Dew, G.; Carranza, M. A Direct Link between Feature Tracking and Height Assignment of Operational EUMETSAT Atmospheric Motion Vectors. J. Atmos. Ocean. Technol. 2014, 31, 33–46. [Google Scholar] [CrossRef]
- Bresky, W.; Daniels, J.; Bailey, A.A.; Wanzong, S.T. New Methods toward Minimizing the Slow Speed Bias Associated with Atmospheric Motion Vectors. J. Appl. Meteorol. Clim. 2012, 51, 2137–2151. [Google Scholar] [CrossRef]
- Hasler, A.F. Stereographic Observations from Geosynchronous Satellites: An Important New Tool for the Atmospheric Sciences. Bull. Am. Meteorol. Soc. 1981, 62, 194–212. [Google Scholar] [CrossRef]
- Carr, J.L.; Wu, D.L.; Kelly, M.A.; Gong, J. MISR-GOES 3D Winds: Implications for Future LEO-GEO and LEO-LEO Winds. Remote Sens. 2018, 10, 1885. [Google Scholar] [CrossRef]
- Carr, J.L.; Wu, D.L.; Wolfe, R.; Madani, H.; Lin, G.; Tan, B. Joint 3D-Wind Retrievals with Stereoscopic Views from MODIS and GOES. Remote Sens. 2019, 11, 2100. [Google Scholar] [CrossRef]
- Lee, J.; Shin, D.-B.; Chung, C.-Y.; Kim, J. A Cloud Top-Height Retrieval Algorithm Using Simultaneous Observations from the Himawari-8 and FY-2E Satellites. Remote Sens. 2020, 12, 1953. [Google Scholar] [CrossRef]
- Dehnavi, S.; Maghsoudi, Y.; Zakšek, K.; Zoej, M.V.; Seckmeyer, G.; Skripachev, V. Cloud Detection Based on High Resolution Stereo Pairs of the Geostationary Meteosat Images. Remote Sens. 2020, 12, 371. [Google Scholar] [CrossRef]
- Merucci, L.; Zakšek, K.; Carboni, E.; Corradini, S. Stereoscopic Estimation of Volcanic Ash Cloud-Top Height from Two Geostationary Satellites. Remote Sens. 2016, 8, 206. [Google Scholar] [CrossRef]
- Lindsey, D.T.; Griffin, V.; Schrab, K.; Sulliva, P. The GOES-17 Advanced Baseline Imager Anomaly Mission Recovery. In Proceedings of the Joint AMS EUMETSAT Satellite Conference, Boston, MA, USA, 28 September–4 October 2019. [Google Scholar]
- NOAA-NESDIS. GOES-17 Loop Heat Pipe Fact Sheet. 2018. Available online: https://www.nesdis.noaa.gov/sites/default/files/asset/document/NESDIS_factsheet_loopheatpipe.pdf (accessed on 22 September 2020).
- Schmit, T.J.; Gunshor, M.M.; Menzel, W.P.; Gurka, J.J.; Li, J.; Bachmeier, A.S. Introducing the next-generation advanced baseline imager on GOES-R. Bull. Am. Meteorol. Soc. 2005, 86, 1079–1096. [Google Scholar] [CrossRef]
- Schmit, T.J.; Griffith, P.; Gunshor, M.M.; Daniels, J.; Goodman, S.J.; Lebair, W.J. A Closer Look at the ABI on the GOES-R Series. Bull. Am. Meteorol. Soc. 2017, 98, 681–698. [Google Scholar] [CrossRef]
- Bessho, K.; Date, K.; Hayashi, M.; Ikeda, A.; Imai, T.; Inoue, H.; Kumagai, Y.; Miyakawa, T.; Murata, H.; Ohno, T.; et al. An Introduction to Himawari-8/9—Japan’s New-Generation Geostationary Meteorological Satellites. J. Meteorol. Soc. Jpn. 2016, 94, 151–183. [Google Scholar] [CrossRef]
- GOES R SERIES PRODUCT DEFINITION AND USERS’ GUIDE (PUG). 2018. Available online: https://www.goes-r.gov/users/docs/PUG-main-vol1.pdf (accessed on 22 September 2020).
- Coordination Group for Meteorological Satellites (CGMS). LRIT/HRIT Global Specification. 1999. Available online: https://www.cgms-info.org/documents/pdf_cgms_03.pdf (accessed on 22 September 2020).
- Durand, Y.; Hallibert, P.; Wilson, M.; Lekouara, M.; Grabarnik, S.; Aminou, D.; Blythe, P.; Napierala, B.; Canaud, J.-L.; Pigouche, O.; et al. The flexible combined imager onboard MTG: From design to calibration. In Proceedings of the Sensors, Systems, and Next-Generation Satellites XIX, Toulouse, France, 13 October 2015. [Google Scholar] [CrossRef]
- Borde, R.; Carranza, M.; Hautecoeur, O.; Barbieux, K.S. Winds of Change for Future Operational AMV at EUMETSAT. Remote Sens. 2019, 11, 2111. [Google Scholar] [CrossRef]
- Ken, A.; King, T.S.; Wolf, W. Software Requirements for Supporting Research-to-Operations at NOAA and Their Implementation in the New SAPF 2.0. In Proceedings of the Joint AMS EUMETSAT Satellite Conference, Boston, MA, USA, 28 September–4 October 2019. [Google Scholar]
- Carr, J.L. Georegistration of meteorological images. In Image Registration for Remote Sensing; Le Moigne, J., Netanyahu, N.S., Eastman, R.D., Eds.; Cambridge University Press: Cambridge, UK, 2011; pp. 339–354. [Google Scholar]
- Himawari-8/9 Himawari Standard Data User’s Guide. 2015. Available online: https://www.data.jma.go.jp/mscweb/en/himawari89/space_segment/hsd_sample/HS_D_users_guide_en_v12.pdf (accessed on 22 September 2020).
- Schmetz, J.; Borde, R.; Holmlund, K.; König, M. Upper tropospheric divergence in tropical convective systems from Meteosat-8. Geophys. Res. Lett. 2005, 32. [Google Scholar] [CrossRef]
- Velden, C.; Daniels, J.; Stettner, D.; Santek, D.; Key, J.; Dunion, J.; Holmlund, K.; Dengel, G.; Bresky, W.; Menzel, P. Recent Innovations in Deriving Tropospheric Winds from Meteorological Satellites. Bull. Am. Meteorol. Soc. 2005, 86, 205–224. [Google Scholar] [CrossRef]
- Moroney, C.; Horváth, Á.; Davies, R. Use of stereo-matching to coregister multiangle data from MISR. IEEE Trans. Geosci. Remote Sens. 2002, 40, 1541–1546. [Google Scholar] [CrossRef]
- Lonitz, K.; Horváth, Á. Comparison of MISR and Meteosat-9 cloud-motion vectors. J. Geophys. Res. Space Phys. 2011, 116. [Google Scholar] [CrossRef]
- Menzel, W.P. Report from the working group on verification statistics. In Proceedings of the Third International Winds Workshop, Ascona, Switzerland, 10–12 June 1996. [Google Scholar]
- PrepBUFR Processing at NCEP. 2018. Available online: https://www.emc.ncep.noaa.gov/mmb/data_processing/prepbufr.doc/document.htm (accessed on 9 November 2020).
- Reale, T.; Sun, B.; Tilley, F.H.; Pettey, M. The NOAA Products Validation System (NPROVS). J. Atmos. Ocean. Technol. 2012, 29, 629–645. [Google Scholar] [CrossRef]
- Ingleby, B.; Pauley, P.; Kats, A.; Ator, J.; Keyser, D.; Doerenbecher, A.; Fucile, E.; Hasegawa, J.; Toyoda, E.; Kleinert, T.; et al. Progress toward High-Resolution, Real-Time Radiosonde Reports. Bull. Am. Meteorol. Soc. 2016, 97, 2149–2161. [Google Scholar] [CrossRef]
- Nieman, S.J.; Menzel, W.P.; Hayden, C.M.; Gray, D.; Wanzong, S.T.; Velden, C.S.; Daniels, J. Fully Automated Cloud-Drift Winds in NESDIS Operations. Bull. Am. Meteorol. Soc. 1997, 78, 1121–1133. [Google Scholar] [CrossRef]
- Heidinger, A.K. NOAA Enterprise Algorithm Theoretical Basis Document for Cloud Height, Version 3.0. 2015. Available online: https://www.star.nesdis.noaa.gov/jpss/documents/ATBD/ATBD_EPS_Cloud_ACHA_v3.0.pdf (accessed on 22 September 2020).
- Heidinger, A.K.; Pavolonis, M.J.; Holz, R.E.; Baum, B.A.; Berthier, S. Using CALIPSO to explore the sensitivity to cirrus height in the infrared observations from NPOESS/VIIRS and GOES-R/ABI. J. Geophys. Res. Space Phys. 2010, 115. [Google Scholar] [CrossRef]
- Wu, D.L.; Ackerman, S.A.; Davies, R.; Diner, D.J.; Garay, M.J.; Kahn, B.H.; Maddux, B.C.; Moroney, C.M.; Stephens, G.L.; Veefkind, J.P.; et al. Vertical distributions and relationships of cloud occurrence frequency as observed by MISR, AIRS, MODIS, OMI, CALIPSO, and CloudSat. Geophys. Res. Lett. 2009, 36. [Google Scholar] [CrossRef]
- Baker, N.L.; Pauley, P.M.; Langland, R.H.; Mueller, K.; Wu, D. An Assessment of the Impact of the Assimilation of NASA TERRA MISR Atmospheric Motion Vectors on the NRL Global Atmospheric Prediction System. Available online: https://ams.confex.com/ams/94Annual/webprogram/Paper231106.html (accessed on 22 September 2020).
- Mueller, K.J.; Liu, J.; Mccarty, W.; Gelaro, R. An Adjoint-Based Forecast Impact from Assimilating MISR Winds into the GEOS-5 Data Assimilation and Forecasting System. Mon. Weather. Rev. 2017, 145, 4937–4947. [Google Scholar] [CrossRef]
- Velden, C.S.; Hayden, C.M.; Nieman, S.J.; Menzel, W.P.; Wanzong, S.; Goerss, J.S. Upper-Tropospheric Winds Derived from Geostationary Satellite Water Vapor Observations. Bull. Am. Meteorol. Soc. 1997, 78, 173–195. [Google Scholar] [CrossRef]
- Posselt, D.J.; Wu, L.; Mueller, K.; Huang, L.; Irion, F.W.; Brown, S.; Su, H.; Santek, D.; Velden, C.S. Quantitative Assessment of State-Dependent Atmospheric Motion Vector Uncertainties. J. Appl. Meteorol. Clim. 2019, 58, 2479–2495. [Google Scholar] [CrossRef]
- Nesbitt, S.; Zipser, E.J. The Diurnal Cycle of Rainfall and Convective Intensity according to Three Years of TRMM Measurements. J. Clim. 2003, 16, 1456–1475. [Google Scholar] [CrossRef]
- Bowman, K.P.; Collier, J.C.; North, G.R.; Wu, Q.; Ha, E.; Hardin, J.W. Diurnal cycle of tropical precipitation in Tropical Rainfall Measuring Mission (TRMM) satellite and ocean buoy rain gauge data. J. Geophys. Res. Space Phys. 2005, 110. [Google Scholar] [CrossRef]
- Dunion, J.P.; Thorncroft, C.D.; Velden, C.S. The Tropical Cyclone Diurnal Cycle of Mature Hurricanes. Mon. Weather. Rev. 2014, 142, 3900–3919. [Google Scholar] [CrossRef]
- Jiang, H.; Liu, C.; Zipser, E.J. A TRMM-Based Tropical Cyclone Cloud and Precipitation Feature Database. J. Appl. Meteorol. Clim. 2011, 50, 1255–1274. [Google Scholar] [CrossRef]
- Wylie, D.P.; Santek, D.; Starr, D.O. Cloud-Top Heights fromGOES-8andGOES-9Stereoscopic Imagery. J. Appl. Meteorol. 1998, 37, 405–413. [Google Scholar] [CrossRef]
- Wood, R.; Bretherton, C.S. Boundary Layer Depth, Entrainment, and Decoupling in the Cloud-Capped Subtropical and Tropical Marine Boundary Layer. J. Clim. 2004, 17, 3576–3588. [Google Scholar] [CrossRef]
- Wu, D.; Hu, Y.; McCormick, M.P.; Xu, K.-M.; Liu, Z.; Smith, B.; Omar, A.H.; Chang, F.-L. Deriving Marine-Boundary-Layer Lapse Rate from Collocated CALIPSO, MODIS, and AMSR-E Data to Study Global Low-Cloud Height Statistics. IEEE Geosci. Remote Sens. Lett. 2008, 5, 649–652. [Google Scholar] [CrossRef]
- Klein, S.A.; Hartmann, D.L. The Seasonal Cycle of Low Stratiform Clouds. J. Clim. 1993, 6, 1587–1606. [Google Scholar] [CrossRef]
- Coakley, J.A. Reflectivities of uniform and broken layered clouds. Tellus B Chem. Phys. Meteorol. 1991, 43, 420–433. [Google Scholar] [CrossRef]
- Bretherton, C.S.; Wyant, M.C. Moisture Transport, Lower-Tropospheric Stability, and Decoupling of Cloud-Topped Boundary Layers. J. Atmos. Sci. 1997, 54, 148–167. [Google Scholar] [CrossRef]
- Bony, S.; Stevens, B. Measuring Area-Averaged Vertical Motions with Dropsondes. J. Atmos. Sci. 2019, 76, 767–783. [Google Scholar] [CrossRef]
- Savic-Jovcic, V.; Stevens, B. The Structure and Mesoscale Organization of Precipitating Stratocumulus. J. Atmos. Sci. 2008, 65, 1587–1605. [Google Scholar] [CrossRef]
- Garay, M.J.; Davies, R.; Averill, C.; Westphal, J.A. ACTINOFORM CLOUDS: Overlooked Examples of Cloud Self-Organization at the Mesoscale. Bull. Am. Meteorol. Soc. 2004, 85, 1585–1594. [Google Scholar] [CrossRef]
- Feingold, G.; Koren, I.; Wang, H.; Xue, H.; Brewer, W.A. Precipitation-generated oscillations in open cellular cloud fields. Nature 2010, 466, 849–852. [Google Scholar] [CrossRef] [PubMed]
- Cal Fire, Daily Wildfire Update; Stats and Events. 2020; Available online: https://www.fire.ca.gov/daily-wildfire-report/ and https://www.fire.ca.gov/stats-events/; (accessed on 23 September 2020).
- Srock, A.F.; Charney, J.J.; Potter, B.E.; Goodrick, S.L. The Hot-Dry-Windy Index: A New Fire Weather Index. Atmosphere 2018, 9, 279. [Google Scholar] [CrossRef]
- Fromm, M.; Lindsey, D.T.; Servranckx, R.; Yue, G.; Trickl, T.; Sica, R.; Doucet, P.; Godin-Beekmann, S. The Untold Story of Pyrocumulonimbus. Bull. Am. Meteorol. Soc. 2010, 91, 1193–1210. [Google Scholar] [CrossRef]
- Clements, C.B.; Lareau, N.P.; Seto, D.; Contezac, J.; Davis, B.; Teske, C.; Zajkowski, T.J.; Hudak, A.T.; Bright, B.C.; Dickinson, M.; et al. Fire weather conditions and fire–atmosphere interactions observed during low-intensity prescribed fires—RxCADRE 2012. Int. J. Wildland Fire 2016, 25, 90. [Google Scholar] [CrossRef]
- Zhang, X.; Kondragunta, S. Temporal and spatial variability in biomass burned areas across the USA derived from the GOES fire product. Remote Sens. Environ. 2008, 112, 2886–2897. [Google Scholar] [CrossRef]
- Tan, B.; Dellomo, J.J.; Folley, C.N.; Grycewicz, T.J.; Houchin, S.; Isaacson, P.J.; Johnson, P.D.; Porter, B.C.; Reth, A.D.; Thiyanaratnam, P.; et al. GOES-R series image navigation and registration performance assessment tool set. J. Appl. Remote Sens. 2020, 14, 032405. [Google Scholar] [CrossRef]
- Yamamoto, Y.; Ichii, K.; Higuchi, A.; Takenaka, H. Geolocation Accuracy Assessment of Himawari-8/AHI Imagery for Application to Terrestrial Monitoring. Remote Sens. 2020, 12, 1372. [Google Scholar] [CrossRef]
- Wang, W.; Li, S.; Hashimoto, H.; Takenaka, H.; Higuchi, A.; Kalluri, S.; Nemani, R. An Introduction to the Geostationary-NASA Earth Exchange (GeoNEX) Products: 1. Top-of-Atmosphere Reflectance and Brightness Temperature. Remote Sens. 2020, 12, 1267. [Google Scholar] [CrossRef]
- Bhushan, S.; Barros, A.P. A Numerical Study to Investigate the Relationship between Moisture Convergence Patterns and Orography in Central Mexico. J. Hydrometeorol. 2007, 8, 1264–1284. [Google Scholar] [CrossRef]
- Nair, U.S.; Asefi, S.; Welch, R.M.; Ray, D.K.; Lawton, R.O.; Manoharan, V.S.; Mulligan, M.; Sever, T.L.; Irwin, D.; Pounds, J.A. Biogeography of Tropical Montane Cloud Forests. Part II: Mapping of Orographic Cloud Immersion. J. Appl. Meteorol. Clim. 2008, 47, 2183–2197. [Google Scholar] [CrossRef]
- Bormann, N.; Thépaut, J.-N. Impact of MODIS Polar Winds in ECMWF’s 4DVAR Data Assimilation System. Mon. Weather Rev. 2004, 132, 929–940. [Google Scholar] [CrossRef]
- Bedka, K.M.; Velden, C.S.; Petersen, R.A.; Feltz, W.F.; Mecikalski, J.R. Comparisons of Satellite-Derived Atmospheric Motion Vectors, Rawinsondes, and NOAA Wind Profiler Observations. J. Appl. Meteorol. Clim. 2009, 48, 1542–1561. [Google Scholar] [CrossRef]
- Cordoba, M.; Dance, S.L.; Kelly, G.A.; Nichols, N.K.; Waller, J.A. Diagnosing atmospheric motion vector observation errors for an operational high-resolution data assimilation system. Q. J. R. Meteorol. Soc. 2016, 143, 333–341. [Google Scholar] [CrossRef]
- Jung, J.; Marshall, J.; Le Daniels, J.; Riishojgaard, L.P. Investigating height assignment type errors in the NCEP global forecasting system. In Proceedings of the 10th International Wind Workshop, Tokyo, Japan, 22–26 February 2010; International Working Winds Group, Session 3: Paper 4. Available online: http://www.eumetsat.int/website/home/News/ConferencesandEvents/PreviousEvents/DAT_2042632.html (accessed on 25 September 2020).
- Salonen, K.; Cotton, J.; Bormann, N.; Forsythe, M. Forsythe, 2015: Characterizing AMV Height-Assignment Error by Comparing Best-Fit Pressure Statistics from the Met Office and ECMWF Data Assimilation Systems. J. Appl. Meteor. Climatol. 2015, 54, 225–242. [Google Scholar] [CrossRef]
- Velden, C.S.; Bedka, K.M. Identifying the Uncertainty in Determining Satellite-Derived Atmospheric Motion Vector Height Attribution. J. Appl. Meteorol. Clim. 2009, 48, 450–463. [Google Scholar] [CrossRef]
- Forsythe, M.; Saunders, R. AMV errors: A new approach in NWP. In Proceedings of the 9th EUMETSAT International Winds Workshop, Darmstadt, Germany, 14–18 April 2008; Available online: https://www.semanticscholar.org/paper/AMV-errors%3A-a-new-approach-in-NWP-Forsythe-Saunders/d17415a68fbdddcc6b6c46b2ee779ce8beb3712c?p2df (accessed on 25 September 2020).
- Weissmann, M.; Folger, K.; Lange, H. Height Correction of Atmospheric Motion Vectors Using Airborne Lidar Observations. J. Appl. Meteorol. Clim. 2013, 52, 1868–1877. [Google Scholar] [CrossRef]
- Hernandez-Carrascal, A.; Bormann, N. Atmospheric Motion Vectors from Model Simulations. Part II: Interpretation as Spatial and Vertical Averages of Wind and Role of Clouds. J. Appl. Meteorol. Clim. 2014, 53, 65–82. [Google Scholar] [CrossRef][Green Version]
Publisher’s Note: MDPI stays neutral with regard to jurisdictional claims in published maps and institutional affiliations. |
© 2020 by the authors. Licensee MDPI, Basel, Switzerland. This article is an open access article distributed under the terms and conditions of the Creative Commons Attribution (CC BY) license (http://creativecommons.org/licenses/by/4.0/).

