Evaluation of SMAP Level 2, 3, and 4 Soil Moisture Datasets over the Great Lakes Region

Department of Chemical and Physical Sciences, University of Toronto Mississauga, ON L5L 1C6, Canada
Remote Sens. 2020, 12(22), 3785; https://doi.org/10.3390/rs12223785
Submission received: 9 October 2020
/
Revised: 11 November 2020
/
Accepted: 16 November 2020
/
Published: 18 November 2020
Abstract
:Satellite sensor systems for soil moisture measurements have been continuously evolving. The Soil Moisture Active Passive (SMAP) mission represents one of the latest advances in this regard. Thus far, much of our knowledge of the accuracy of SMAP soil moisture over the Great Lakes region of North America has originated from evaluation studies using in situ data from the U.S. Department of Agriculture (USDA) Natural Resources Conservation Service Soil Climate Analysis Network and/or the U.S. Climate Reference Network, which provide only several in situ sensor stations for this region. As such, these results typically underrepresent the accuracy of SMAP soil moisture in this region, which is characterized by a relatively large soil moisture variability and is one of the least studied regions. In this work, SMAP Level 2‒4 soil moisture products: SMAP/Sentinel-1 L2 Radiometer/Radar Soil Moisture (SPL2SMAP_S), SMAP Enhanced L3 Radiometer Soil Moisture (SPL3SMP_E), and SMAP L4 Surface and Root-Zone Soil Moisture Analysis Update (SPL4SMAU) are evaluated over the southern portion of the Great Lakes region using in situ measurements from Michigan State University’s Enviro-weather Automated Weather Station Network. The unbiased root-mean-square error (ubRMSE) values for both SPL4SMAU surface and root zone soil moisture estimates are below 0.04 m3 m−3 at the 36-km scale, with an average ubRMSE of 0.045 m3 m−3 (0.037 m3 m−3) for the surface (root-zone) soil moisture against the sparse network. The ubRMSE values for SPL3SMP_E a.m. (i.e., descending overpasses) soil moisture retrievals are close to or below 0.04 m3 m−3 at the 36-km scale, with an average ubRMSE of ~0.06 m3 m−3 against the sparse network. The average ubRMSE values are ~0.05‒0.06 m3 m−3 for high-resolution SPL2SMAP_S soil moisture retrievals against the sparse network, with the skill of the baseline algorithm-based soil moisture retrievals exceeding that of the optional algorithm-based counterparts. Clearly, the skill of SPL4SMAU surface soil moisture exceeds that of the SPL3SMP_E and SPL2SMAP_S soil moisture retrievals.

1. Introduction
Soil moisture, as a key state variable linking the land surface and the atmosphere, plays a crucial role in the Earth’s energy and water budgets. Earth observation, especially satellite microwave remote sensing, is able to provide large-scale spatially distributed near-surface soil moisture estimates (e.g., [1,2,3,4,5,6,7,8]). Accordingly, the assessment of satellite soil moisture data has been an important topic (e.g., [9,10,11,12,13,14,15,16,17,18,19,20,21,22,23,24,25]) because it can provide critical guidance for the application of satellite soil moisture in hydrological and meteorological studies and for algorithm development for generating satellite soil moisture products.
The Soil Moisture Active Passive (SMAP) mission [8,26], launched in January 2015, represents one of the latest advances in this regard. The SMAP carries an L-band radiometer and an L-band high-resolution radar to estimate near-surface soil moisture and freeze‒thaw state, although the radar failed in July 2015. The SMAP data products are being delivered at four different levels (https://smap.jpl.nasa.gov/data, last accessed: March 2020). Except for the raw and/or calibrated instrument measurements (e.g., radiometer brightness temperature and radar backscatter data) as provided in the Level 1 products, the SMAP-derived soil moisture estimates are delivered through its Level 2, 3, and 4 products.
The Level 2 (L2) products provide instantaneous soil moisture retrievals derived from SMAP’s half orbits. Chan et al. [20] evaluated the first generation of SMAP Level 2 radiometer passive soil moisture product (L2_SM_P), which contained multiple sets of soil moisture retrievals based upon different retrieval algorithms. For the most accurate L2_SM_P soil moisture set (based on the V-pol Single Channel Algorithm) collected over the first seven months of the SMAP mission, the average unbiased root-mean-square error (ubRMSE) was less than 0.04 m3 m−3 against the 36-km core validation pixels, and was below 0.05 m3 m−3 against the sparse networks (i.e., only one in situ site within a satellite product grid cell). The average correlation coefficient R between L2_SM_P soil moisture and reference data from the core validation sites (sparse networks) could reach as high as 0.8 (0.65). Using the data from the first 11 months of the SMAP mission, Colliander et al. [23] further confirmed that the L2_SM_P 36-km soil moisture product met its performance requirement (i.e., ubRMSE ≤ 0.04 m3 m−3). Colliander et al. [23] also indicated that the SMAP Level 2 radar active soil moisture product (L2_SM_A) and the merged radar/radiometer soil moisture product (L2_SM_AP), which were available only for a limited period of ~2.5 months prior to the SMAP’s radar malfunction (7 July 2015), generally met their accuracy expectations (i.e., ubRMSE ≤ 0.06 m3 m−3 for L2_SM_A and ubRMSE ≤ 0.04 m3 m−3 for L2_SM_AP). During the SMAP postradar stage, the Level 2 soil moisture product, based upon combined SMAP radiometer and Sentinel-1 radar measurements (SPL2SMAP_S), has become a substitute for L2_SM_AP. The SPL2SMAP_S product provides instantaneous estimates of high-resolution (3 and 1 km) surface soil moisture by disaggregating SMAP radiometer measurements using the Copernicus Sentinel-1 C-band radar (1A and 1B) backscatter data [27]. The averaged ubRMSE values for the SPL2SMAP_S 3-km soil moisture retrievals were about 0.05 m3 m−3 (0.036 m3 m−3) against the 3-km (9-km) core validation sites [27]. The averaged ubRMSE values against sparse soil moisture networks were about 0.050 m3 m−3 for both the SPL2SMAP_S 3- and 1-km soil moisture retrievals [27].
The SMAP Level 3 (L3) products provide global daily composites of the half orbit-based Level 2 instantaneous fields. The widely used SMAP L3 soil moisture datasets are the 36-km radiometer product (L3_SM_P) and the 9-km enhanced radiometer product (L3_SM_P_E). Cui et al. [24] suggested that the L3_SM_P (version 4) a.m. soil moisture (i.e., from descending orbits) showed a clear spatial variation in performance, with an ubRMSE of 0.027 m3 m−3 against one U.S. network and an ubRMSE of 0.044 m3 m−3 against one Spanish network, while the 9-km L3_SM_P_E (version 1) a.m. soil moisture presented similar ubRMSE values (~0.04 m3 m−3) at both of the two target locations. The ubRMSE values for SMAP a.m. soil moisture retrievals from L3_SM_P (version 3) and L3_SM_P_E (version 1) were ~0.05‒0.06 m3 m−3 at the ~100-km scale over the Tibetan Plateau [22,25].
The SMAP Level 4 (L4) products are derived from the assimilation of SMAP radiometer brightness temperature measurements in a land surface model [28]. The L4 products [28,29] can provide soil moisture instantaneous analysis update fields (the SPL4SMAU product) or 3-h time-averaged estimates (the SPL4SMGP product) for both the surface (0‒5 cm) and root zone (0‒100 cm) layers at 3-h intervals at Earth-fixed, global cylindrical 9-km Equal-Area Scalable Earth (EASE) Grid. The SPL4SMAU surface and root-zone soil moisture estimates have been demonstrated to meet the accuracy requirement of ubRMSE ≤ 0.04 m3 m−3 at the 9- and 36-km scales [28]. The average ubRMSE values against the sparse soil moisture networks (over the CONUS and within central Australia) exceeded 0.049 and 0.040 m3 m−3 for the SPL4SMAU surface and root-zone soil moisture datasets, respectively [28].
Although SMAP soil moisture products have been evaluated at multiple scales and over different countries/continents since they became available, many of the validation studies were conducted for arid/semi-arid or cold regions, where the temporal variability of soil moisture was typically low, favoring the occurrence of small ubRMSE. As such, the previous validation results may not sufficiently capture the performance of SMAP in areas dominated by a relatively large soil moisture variability. The present study was intended to address this concern. The Great Lakes region of North America, due to the effects of extreme humid continental climate conditions, is typically characterized by substantial seasonal variability of soil moisture. In the present study, the SMAP soil moisture products were evaluated over the U.S. state of Michigan, a key portion of the Great Lakes region, using in situ data collected by Michigan State University’s Enviro-weather Automated Weather Station Network. This study differed from many of previous SMAP validation studies in the following aspects. (i) The validation was conducted for a typical humid region, which was under-represented previously. (ii) Three levels (Levels 2, 3, and 4) of SMAP soil moisture products (SPL2SMAP_S, SPL3SMP_E, and SPL4SMAU) were evaluated and compared using the same set of in situ data, which was typically absent in previous validation studies. (iii) Nearly five years of SMAP data (April 2015‒December 2019) were used, providing a larger sample size for the examination of soil moisture variability. This paper is organized as follows. In Section 2, the datasets and evaluation methods are described. Section 3 presents the assessment results for the SMAP soil moisture products. A discussion is provided in Section 4. The conclusions are made in Section 5.
2. Methods and Data
2.1. SMAP Soil Moisture Products
SMAP soil moisture products have been continuously evolving. We evaluated three sets of SMAP soil moisture products: SMAP L4 Global 3-h 9-km EASE-Grid Surface and Root-Zone Soil Moisture Analysis Update (SPL4SMAU), version 4 [29]; SMAP Enhanced L3 Radiometer Global Daily 9-km EASE-Grid Soil Moisture (SPL3SMP_E), version 3 [30]; and SMAP/Sentinel-1 L2 Radiometer/Radar 30-Second Scene 3-km EASE-Grid Soil Moisture (SPL2SMAP_S), version 2 [31]. These represent the latest techniques for SMAP Level 4, 3, and 2 soil moisture estimation at the time of analysis for this study. The three products are briefly described as follows.
The SPL4SMAU product was derived from the EnKF assimilation of SMAP L-band brightness temperature data in the Catchment land surface model [28,29]. The product (version 4) provides instantaneous soil moisture fields for both the surface (0‒5 cm) and root-zone (0‒100 cm) layers at 3-h intervals over an Earth-fixed, global cylindrical 9-km Equal-Area Scalable Earth Grid, version 2.0 (EASE-Grid 2.0). In this study, we evaluated the soil moisture analysis update fields with the SPL4SMAU product [29].
The SPL3SMP_E product is an enhanced Level 3 radiometer passive soil moisture product, which provides daily composite estimates of surface soil moisture (~0‒5 cm) retrieved from the SMAP a.m. (i.e., from 6:00 a.m. descending half orbits) and p.m. (i.e., from 6:00 p.m. ascending half orbits) brightness temperature data sets, respectively [30]. The SPL3SMP_E product (version 3) also has the 9-km resolution (EASE-Grid 2.0). The average temporal resolution is 1‒3 days for the SPL3SMP_E half orbit (i.e., either a.m. or p.m.) fields.
The SPL2SMAP_S product provides instantaneous estimates of high-resolution (3 and 1 km) surface soil moisture (~0‒5 cm) by disaggregating the SMAP L-band radiometer measurements using the Copernicus Sentinel-1 C-band radar (1A and 1B) backscatter data [27,31]. In the SPL2SMAP_S baseline algorithm, the SMAP 9-km radiometer brightness temperature data (derived from the native 36-km radiometer footprint using Backus‒Gilbert interpolation) are disaggregated onto 3- and 1-km grid cells based upon the Sentinel-1 1-km radar backscatter spatial variations within the 9-km radiometer grid cell. The disaggregated brightness temperatures at 3 and 1 km are then used to retrieve the surface soil moisture fields based upon the single-channel algorithm and high-resolution ancillary information. The SPL2SMAP_S 3- and 1-km soil moisture fields are currently provided in two datasets: the a.m. set that is derived from a merging of the Sentinel-1 data and the nearest SMAP a.m. (i.e., from 6:00 a.m. descending half orbits) radiometer data in time, and the a.p.m. set that is based upon the combination of Sentinel-1 and the closest SMAP a.m. or p.m. (i.e., from 6 p.m. ascending half orbits) radiometer data in time. The nominal temporal resolution is 12 days for either the a.m. or a.p.m. fields in SPL2SMAP_S. The SPL2SMAP_S product also contains the optional algorithm-based (referred to as Option 1) 3- and 1-km soil moisture fields, which were produced by directly disaggregating the SMAP enhanced L2 9-km radiometer passive soil moisture retrievals using the Sentinel-1 radar backscatter cross section data. This work presents the validation results for both the baseline algorithm-derived soil moisture fields and the Option 1-based retrievals for comparative purposes.
Quality control is an integral part of generating SMAP products. In the delivered SPL4SMAU product, analysis update fields are not provided if the SMAP brightness temperature observations are rejected or not available for assimilation. Therefore, no further filtering step was needed for this product in the present study. In the delivered SPL3SMP_E and SPL2SMAP_S products, the soil moisture retrievals that were substantially contaminated by adverse conditions (open water, radio-frequency interference, snow/ice cover, frozen surface, urban, dense vegetation, etc.) were already rejected. We further excluded SPL3SMP_E and SPL2SMAP_S retrievals that are not recommended, utilizing the retrieval quality flag information provided in the products.
2.2. Study Domain and in Situ Soil Moisture Data
In this work, SMAP soil moisture products were evaluated over the U.S. state of Michigan, a key portion of the Great Lakes Basin, using in situ soil moisture measurements from Michigan State University’s Enviro-weather Automated Weather Station Network (MAWN). Figure 1 shows the study domain and location of MAWN stations. MAWN is currently comprised of 100 stations (https://mawn.geo.msu.edu/, last access: March 2020).
In this study, 87 stations (marked with red dots in Figure 1) were used for validating the SMAP products. At these stations, the hourly soil moisture measurements at two soil depth increments (0‒30 and 30‒60 cm) were provided (the two soil depth profiles have been replaced with soil depths of 5, 10, 20, and 50 cm for 11 out of the 87 sites since late 2019; the measurements at the new soil depths were not used for the validation in this work). In the time series of in situ data, spikes or temporal inhomogeneities that were not attributed to the physical processes of the water cycle (e.g., precipitation, infiltration, and evapotranspiration), if present, were removed. For example, a spike that did not correspond to a rainfall event would be removed from the surface soil moisture time series. In situ observations were also rejected when the soil was frozen or snow-covered. The remaining 13 MAWN stations (blue dots in Figure 1), which have a very short record of in situ measurements (typically from late 2019 onwards), were not used for the validation in the present work. There were three 36-km reference pixels (black squares in Figure 1) available in the study domain. Pixels 1 and 3 are located near the lakes, while Pixel 2 is an inland reference pixel.
2.3. Performance Metrics
The evaluation was mainly conducted at point-scale since the MAWN network typically provides only one station within a SMAP product grid cell (9, 3, or 1 km), i.e., sparse network measurements, although 36-km reference pixels are also available (the three black boxes in Figure 1), which can be used to validate the 9-km SMAP products (SPL4SMAU and SPL3SMP_E). In this study, the performance metrics used include the ubRMSE [32], correlation coefficient (R), and anomaly R [33]. The metrics are defined as follows:
where E [•] is the expectation operator. θretrvl and θinsitu are the time sequences of SMAP soil moisture and in situ values, respectively. σretrvl and σinsitu are the standard deviations of θretrvl and θinsitu, respectively. θ’retrvl and θ’insitu are the anomaly time sequences of SMAP soil moisture and in situ observations, respectively. The soil moisture anomalies were defined as departures of raw soil moisture values from the monthly climatology. σ’retrvl and σ’insitu are the standard deviations of θ’retrvl and θ’insitu, respectively.
The performance metrics for the SPL4SMAU surface soil moisture, SPL3SMP_E, and SPL2SMAP_S soil moisture retrievals were computed using the MAWN in situ measurements taken in the top 30-cm soil layer. The SPL4SMAU root-zone soil moisture skill was derived using the arithmetic mean of in situ measurements in the 0–30 and 30‒60 cm soil layers. It is acknowledged that the sensor depths for in situ measurements do not perfectly match the soil depths for the SMAP soil moisture products. However, using the limited in situ soil moisture data measured at the depths of 5, 10, and 20 (or 30) cm in the study area, we demonstrate that the soil depth discrepancy between the SMAP and in situ soil moisture data has only a marginal impact on the validation in this study. The relevant discussion is provided in Section 4.
3. Results
3.1. Assessment of SPL4SMAU Surface and Root Zone Soil Moisture
We first present the SPL4SMAU soil moisture validation results for the three 36-km reference pixels (as indicated in Figure 1). Within each 36-km pixel, the SPL4SMAU soil moisture estimates are aggregated (i.e., averaging of the 9-km grid cells) against the spatial average of the in situ sensor measurements. Figure 2 shows the SPL4SMAU and in situ soil moisture time series (hourly steps) for the 36-km reference pixels. All the three reference pixels are generally characterized by dry soils in summer/early autumn and saturated soils in late winter and spring. The dry period was consistent with strong incoming solar radiation (insolation) and clear skies, leading to strong evaporation. The soil moisture stayed near the field capacity in November to April because evaporation was very weak during this period (due to weak net radiative forcings at the surface). In addition, the winter evapotranspiration was also very limited because most vegetation was dormant. The SPL4SMAU estimates clearly captured the temporal variability of soil moisture in both the surface and root-zone layers at the three reference pixels (Figure 2).
Figure 3 provides the verification scores for the SPL4SMAU soil moisture at the three individual 36-km reference pixels. The metrics are calculated based upon the 3-h soil moisture time series for 31 March 2015 to 31 December 2019. All of the ubRMSE values at the three reference pixels are below 0.04 m3 m−3 for the SPL4SMAU surface soil moisture (Figure 3a) and below 0.03 m3 m−3 for the root-zone soil moisture (Figure 3d). There was a strong temporal correlation between the SPL4SMAU soil moisture and in situ measurements over the three individual pixels, with all of the correlation coefficients R higher than 0.5 for the raw time series (Figure 3b,e) and higher than 0.6 for the anomaly time series (Figure 3c,f).
Next, we present the sparse network (i.e., only one in situ station located within the satellite product grid cell) validation results for SPL4SMAU. Figure 4 illustrates the ubRMSE values for the SPL4SMAU soil moisture at the individual reference sites. The metrics were calculated based upon the 3-h soil moisture time series for 31 March 2015 to 31 December 2019.
The metrics were not computed when the valid 3-h data points were less than 6000 (about two years) at a site. The ubRMSE values ranged from 0.02 to 0.06 m3 m−3 for both the surface and root-zone soil layers, although the error values were obviously lower for the root zone soil moisture (because the overall temporal variability was less substantial in root zone soil moisture). At most of the validation sites, both the SPL4SMAU surface and root-zone soil moisture estimates typically presented an ubRMSE of 0.04 m3 m−3 or less, i.e., meeting the product accuracy requirement. There was no clear ubRMSE contrast between the inland sites and coastal sites, which differs from the validation of the SMAP non-assimilation products (Section 3.2). The anomaly R values, as shown in Figure 5, typically ranged from 0.4 to 0.7 over most of the validation sites, with generally similar spatial patterns across the validation network for the surface and root-zone soil moisture estimates. Again, there was no evident contrast in anomaly R between the inland areas and coastal areas.
Figure 6 shows the average metrics for the SPL4SMAU soil moisture against the sparse network sites.
The averaged ubRMSE value for the root-zone soil moisture (0.037 m3 m−3) was statistically significantly lower than that (0.045 m3 m−3) of the surface soil moisture (Figure 6a). Again, this was related to the lower temporal variability of the root-zone soil moisture. In contrast, there was no statistically significant difference between the surface and root-zone soil moisture estimates in terms of the R skill and the anomaly R skill. The average R values were close to 0.50 for both the raw and anomaly time series of SPL4SMAU soil moisture (Figure 6b,c). Overall, the validation results at the 36-km scale (Figure 3) were better than those against the sparse network (Figure 6). This is not surprising since the sparse network sites have larger uncertainties associated with spatial representativeness.
3.2. Assessment of SPL3SMP_E Soil Moisture
Again, we first present the SPL3SMP_E soil moisture validation results at the 36-km reference pixels. Due to the impact of open-water surfaces, the SPL3SMP_E soil moisture retrievals were not available at the 36-km reference Pixel 1. Figure 7 shows the SPL3SMP_E and in situ soil moisture time series for the 36-km reference Pixel 2 and Pixel 3.
The in situ daily composites using only the hourly data at 6 a.m. LST and using only the hourly data at 6 p.m. LST were constructed and compared to the SPL3SMP_E a.m. and p.m. soil moisture retrievals, respectively. The corresponding verification scores are provided in Figure 8.
Both the SPL3SMP_E a.m. and p.m. estimates generally captured the temporal variability of surface soil moisture (Figure 7). The ubRMSE values for the SPL3SMP_E a.m. soil moisture measurements at the two reference pixels were close to or below 0.04 m3 m−3 (Figure 8a). Their p.m. equivalents had larger ubRMSE (Figure 8d). The correlations between the SPL3SMP_E a.m. estimates and in situ measurements time series were relatively high at both of the 36-km reference pixels, with R greater than 0.7 for the raw time series (Figure 8b) and greater than 0.65 for the anomaly time series (Figure 8c). The SPL3SMP_E p.m. soil moisture time series also showed high correlations with the in situ data (Figure 8e,f), except that the R and anomaly R values were significantly lower than their a.m. counterparts at reference Pixel 3. Clearly, the SPL3SMP_E a.m. retrievals were more representative than the p.m. retrievals of the soil moisture variability, which is expected since the a.m. (nighttime) retrievals are less subject to errors in land surface temperature estimation than the p.m. (daytime) retrievals. The surface temperature was used to estimate the surface or soil emissivity, which is the ratio between the brightness temperature (measured by satellites) and the surface physical temperature [4,7]. The soil water content was subsequently retrieved from the soil emissivity [4,7]. The SPL3SMP_E soil moisture performed better at the inland reference Pixel 2 than at the coastal reference Pixel 3, which reflects the adverse impact of open water and vegetation cover (vegetation cover is typically dense in coastal areas) on satellite soil moisture estimation.
Figure 9 illustrates the ubRMSE values for the SPL3SMP_E soil moisture against the sparse network sites.
The metrics were computed using the daily soil moisture estimates (i.e., the in situ daily composites using only the 6 a.m. LST hourly data, using only the 6 p.m. LST hourly data, and using the data at both 6 a.m. and 6 p.m. LST are compared to the SPL3SMP_E a.m., p.m., and a.p.m. soil moisture retrievals, respectively) for 31 March 2015 to 31 December 2019 if at least 300 data points were valid at a site. Relative to SPL4SMAU (87 sites), the number of validation sites was reduced to 67 for SPL3SMP_E since the SPL3SMP_E soil moisture retrievals are not valid at some coastal reference sites due to the impact of open-water surfaces. The ubRMSE values typically ranged from 0.04 to 0.07 m3 m−3 for the a.m. retrievals, with generally larger error values for the p.m. retrievals. There was a clear ubRMSE contrast between the inland sites and coastal sites. The inland locations typically had lower ubRMSE. The anomaly R values, as shown in Figure 10, ranged from 0.4 to 0.7 for most of the sparse network sites, with a generally similar spatial pattern across the network for the a.m. and p.m. soil moisture retrievals. The inland stations typically had higher anomaly R skill.
The average verification metrics for the SPL3SMP_E soil moisture retrievals are shown in Figure 11.
The average ubRMSE values were 0.057, 0.063, and 0.058 m3 m−3 for the a.m., p.m., and a.p.m. (i.e., the blended a.m. and p.m.) soil moisture retrievals, respectively (Figure 11a). The SPL3SMP_E a.m. retrievals had R values close to 0.5 for both the raw and anomaly time series (Figure 11b). The p.m. and a.p.m. soil moisture time series exhibited lower R and anomaly R skill than the time series of a.m. retrievals. This again reflects the land surface temperature effects in the satellite soil moisture retrieval algorithms.
Next, we compared the performance of SMAP Level 3 and 4 products. To this end, the SPL4SMAU daily composite surface soil moisture estimates were constructed using the 3-h data. SPL4SMAU daily composites of only the nearest 3-h data at 6 a.m. LST, of only the nearest 3-h data at 6 p.m. LST, or of the data at both 6 a.m. and 6 p.m. LST, were constructed. The verification metrics for the three sets of SPL4SMAU daily composite surface soil moisture estimates (which were calculated using the corresponding in situ daily composites) were then compared to those for the SPL3SMP_E a.m., p.m., and a.p.m. soil moisture retrievals.
Figure 12 provides the ubRMSE and anomaly R differences between the SPL3SMP_E a.m. soil moisture and SPL4SMAU surface soil moisture (daily composite of only the nearest 3-h data at 6 a.m. LST) across the individual validation stations.
The metrics were computed using the daily composite time series over only the days and sites for which the SPL3SMP_E a.m. soil moisture, SPL4SMAU surface soil moisture, and in situ measurements were all available. The ubRMSE values for SPL3SMP_E a.m. soil moisture were typically larger than those for SPL4SMAU surface soil moisture (Figure 12a). This demonstrates the improvement of the SMAP assimilation product (SPL4SMAU) over the satellite-only product (SPL3SMP_E). The data assimilation technologies can integrate satellite soil moisture and land surface/hydrologic modeling (via quantifying uncertainties in modeling and satellite measurements) to produce an optimal estimation superior to either source of information alone (satellite or modeling). The improvements (i.e., reduction in ubRMSE by SPL4SMAU) are typically more significant within the coastal areas than within the inland areas. The anomaly R values for the SPL3SMP_E a.m. soil moisture are typically lower (higher) than those for SPL4SMAU surface soil moisture at the coastal (inland) sites (Figure 12b). This indicates that the improved anomaly R skill provided by the SMAP assimilation product (SPL4SMAU), relative to the satellite-only soil moisture, occurred mainly in the areas where the skill of the satellite-only product is relatively low (e.g., the coastal areas, Figure 10). This is expected because there is an inverse relationship between the satellite retrieval skill and the improvement of the assimilation product skill over the satellite retrieval skill [34,35].
Figure 13 provides a comparison of SPL3SMP_E soil moisture retrievals and SPL4SMAU surface soil moisture estimates in terms of the average metrics.
For each comparison pair, the metrics (ubRMSE and anomaly R) were computed using the daily composite time series over only the days and sites for which both of the paired SMAP soil moisture estimates and the in situ measurements are all available. The average metrics of the SPL4SMAU surface soil moisture were not sensitive to the applying of a space‒time mask based on the availability of SPL3SMP_E retrievals. Clearly, the skill of the SPL4SMAU surface soil moisture exceeded (statistically significantly) that of the SPL3SMP_E retrievals. The average ubRMSE (anomaly R) values were around 0.042 m3 m−3 (0.54) for the SPL4SMAU surface soil moisture. For all three groups of SPL3SMP_E retrievals, the average ubRMSE values were all above 0.055 m3 m−3, while the average anomaly R values were all below 0.50.
3.3. Assessment of the SPL2SMAP_S 3- and 1-km Soil Moisture Retrievals
The SPL2SMAP_S soil moisture product was evaluated over different regions with in situ data at multiple scales [27]. The average ubRMSE values for the SPL2SMAP_S 3-km soil moisture retrievals (baseline algorithm-derived) were about 0.05 m3 m−3 against the 3-km core validation pixels and about 0.036 m3 m−3 against the 9-km core validation sites [27]. The average ubRMSE values against the sparse soil moisture networks were about 0.050 m3 m−3 for both the SPL2SMAP_S 3- and 1-km soil moisture retrievals [27]. Except for the baseline algorithm-derived high-resolution soil moisture retrievals, the SPL2SMAP_S product also contained the optional algorithm-based (referred to as Option 1) 3- and 1-km soil moisture fields. In this section, we present the validation results for both the baseline algorithm-derived soil moisture fields and the Option 1-based retrievals for a comparative purpose.
The 3- or 9-km core reference pixels (as shown in [27]) were not available in the study domain for this work, so we only conducted the validation of SPL2SMAP_S using the sparse network sites. Figure 14 illustrates the ubRMSE values for the SPL2SMAP_S 3- and 1-km a.m. soil moisture estimates (baseline algorithm-derived) at the sparse network sites.
The metrics were calculated based upon the daily composites of SPL2SMAP_S instantaneous soil moisture estimates for the period from 1 April 2015 to 31 December 2019 if at least 30 data points (the revisit intervals of SPL2SMAP_S soil moisture generally exceed 11 days) were valid. Relative to the Level 3 and 4 products, the number of available reference stations for SPL2SMAP_S was further reduced (45 validation sites for the 3-km retrievals, and 43 for the 1-km retrievals). This is not surprising because the Sentinel-1 radar (C-band) measurements are susceptible to dense vegetation cover in the coastal areas. Accordingly, the SPL2SMAP_S retrievals are often not valid for the validation sites near the lakes. In addition, the high-resolution retrievals, especially 1-km retrievals, are typically not valid over urban sites. In Figure 14, the ubRMSE values typically ranged from 0.03 to 0.08 m3 m−3 for the SPL2SMAP_S 3- and 1-km a.m. retrievals. In terms of the spatial pattern, the ubRMSE values are typically larger in the southeastern part of Michigan due to the impact of increased urban areas (most of the major cities in Michigan are in this region).
Figure 15 shows the average metrics (ubRMSE and R) for eight sets of SPL2SMAP_S soil moisture retrievals.
The anomaly R was not estimated for SPL2SMAP_S because it was not possible to reliably estimate the SPL2SMAP_S monthly climatology (very few data points were available per month). The averaged ubRMSE values for the SPL2SMAP_S 3- and 1-km a.m. soil moisture retrievals (baseline algorithm-derived) were about 0.05 m3 m−3, which is similar to the sparse network assessment results presented in [27]. The averaged R values for the SPL2SMAP_S 3- and 1-km a.m. soil moisture retrievals (baseline algorithm-derived) were about 0.56‒0.60, which was again in good agreement with the sparse network assessment results in [27]. The soil moisture skill of the baseline algorithm-derived retrievals typically exceeds that of their Option 1-based counterparts, reflecting that the SPL2SMAP_S baseline algorithm is superior to the optional algorithm. No matter which retrieval algorithm (the baseline algorithm or Option 1) was used, the a.m. soil moisture retrievals were always better than the a.p.m. soil moisture retrievals in terms of the soil moisture skill. Additionally, the soil moisture skill was generally higher for the 3-km soil moisture retrievals than for their 1-km equivalents.
Next, we compared the performance of SMAP Level 2 and 3 products. Figure 16 provides the soil moisture daily composite time series comparison between SPL3SMP_E 9-km a.m., SPL2SMAP_S 3- and 1-km a.m., and in situ data at two individual stations.
All the soil moisture retrieval products captured the temporal variability of in situ soil moisture very well. However, the higher-resolution SPL2SMAP_S retrievals (3 and 1 km) did not represent an improvement over the 9-km SPL3SMP_E retrievals at the two stations.
Figure 17 compares the average verification metrics for the SPL3SMP_E and SPL2SMAP_S a.m. retrievals.
Again, there was no clear improvement over the 9-km SPL3SMP_E retrievals from the higher-resolution SPL2SMAP_S retrievals. On the contrary, the surface soil moisture skill (in terms of ubRMSE and R) of the SPL3SMP_E 9-km retrievals was slightly higher (but not statistically significant) than that of the SPL2SMAP_S 3-km retrievals and exceeded (by a statistically significant margin) that of the SPL2SMAP_S 1-km retrievals. A possible explanation is that the Sentinel-1 C-band radar measurements, which are used to downscale the coarse-scale SMAP radiometer data, may contain relatively large uncertainties due to the relatively dense vegetation cover in the Great Lakes region. Therefore, the resulting SPL2SMAP_S retrievals were not improved relative to the SMAP radiometer products (SPL3SMP_E) in this region. The results indicate a demand for the development of the SMAP soil moisture retrieval algorithms for improving the high-resolution SMAP soil moisture skill in regions with modest to dense vegetation.
4. Discussion
In this study, due to the limitation on available reference data sources, the SMAP surface (0‒5 cm) soil moisture was validated using the in situ measurements for the 0‒30 cm soil profile. We estimated the impact of the soil depth discrepancy between the in situ data and SMAP surface soil moisture on the evaluation using the in situ soil moisture measured at depths of 5, 10, and 20 (or 30) cm for a limited number of stations within or around the study area. The two stations from the USDA Natural Resources Conservation Soil Climate Analysis Network (SCAN) and the four stations from the AmeriFlux Network, as shown in Figure 1 and listed in Table A1 in Appendix A, were used for this purpose. The in situ sensors were available at depths of 5, 10, and 20 (or 30) cm at the six sites (Table A1), which allowed for the validation of the SMAP surface soil moisture against both the in situ data at the 5 cm depth and in the 0‒30 cm profile. Figure A1 compares the time sequences of the in situ soil moisture data at the 5 cm depth and in the 0‒30 cm profile (derived from the average of the measurements at the depths of 10 cm and 20 or 30 cm), along with the SPL4SMAU surface soil moisture at the six sites. The in situ soil moisture measurements at the 5 cm depth and from the 0‒30 cm profile are in very good agreement in terms of the variability and phase, except for the possible mean biases that have no impact on the metrics of ubRMSE, R, and anomaly R. Figure A2 presents the verification scores for the SPL4SMAU surface soil moisture based on the in situ measurements at the 5 cm depth and within the 0‒30 cm soil profile, respectively, for 31 March 2015–31 December 2019. The ubRMSE differences between the two sets of validation results were all less than 0.004 m3 m−3 (Figure A2a). The differences typically did not exceed 0.1 for the R (Figure A2b) and anomaly R (Figure A2c). This may indicate that the overall impact of the depth discrepancy between the in situ data and SMAP surface soil moisture was marginal on the validation in our study area.
The validation of SMAP soil moisture products has been an active research topic since they became available in 2015. However, humid regions have been one of the least studied domains in this regard. In this work, multiple SMAP soil moisture products were evaluated over a typical humid region, the southern portion of the Great Lakes basin. The evaluation results could provide important insights on the application of the SMAP products in hydrological and meteorological studies, especially in humid regions. The primary novelties of this work include: (i) the three levels of SMAP soil moisture products (SPL2SMAP_S, SPL3SMP_E, and SPL4SMAU) were evaluated and compared using the same set of in situ data, which was typically absent in previous validation studies; and (ii) nearly five years of SMAP data (April 2015‒December 2019) were used, making the evaluation results more representative of the soil moisture variability. In many previous validation studies, the study periods were typically shorter than three years, which limited the robust assessment of the soil moisture skill (e.g., the absence of the anomaly R results).
Here, we compared the assessment results of SMAP soil moisture presented in this study to those from other validation studies. Based on the sparse soil moisture networks across the world (~375 stations), the average ubRMSE was 0.05 m3 m−3 (0.052 m3 m−3) for the SPL2SMAP_S 3-km (1-km) a.m. soil moisture retrievals, while the average R was about 0.59 (0.55) for the SPL2SMAP_S 3-km (1-km) a.m. soil moisture data [27]. The results are very similar to those obtained in the present study (Figure 15), although we also demonstrate that the SPL2SMAP_S baseline algorithm is superior to the optional algorithm.
The assessment of the SPL3SMP_E soil moisture presented in the present work is also comparable to other studies. Cui et al. [24] suggested that the SPL3SMP_E a.m. soil moisture retrievals (version 1) presented an ubRMSE value of ~0.04 m3 m−3 at two 9-km reference pixels (one within CONUS and the other within the semiarid zone of the Duero Basin, Spain) with R greater than 0.8. The ubRMSE values for the SPL3SMP_E a.m. soil moisture retrievals (version 1) were about 0.05‒0.06 m3 m−3 at the ~100-km scale (in a cold semiarid or semihumid environment) over the Tibetan Plateau [22,25]. In the present work, the ubRMSE values for the SPL3SMP_E a.m. soil moisture (version 3) at the two 36-km reference pixels were close to or below 0.04 m3 m−3, with R greater than 0.7 (Figure 8).
The performance of SPL4SMAU soil moisture at the 36-km scale presented here is generally consistent with the results of Reichle et al. [28], who presented a validation of SPL4SMAU soil moisture at the 36-km reference pixels across the world (17 pixels for the surface soil moisture and seven for the root zone soil moisture). In their study, the ubRMSE values at the 36-km scale ranged from 0.027 to 0.048 m3 m−3 for the surface soil moisture and from 0.020 to 0.033 m3 m−3 for the root-zone soil moisture, while the R values at the 36-km scale were between 0.45 and 0.93 for the surface soil moisture and between 0.56 and 0.95 for the root-zone soil moisture. In the present study, the ubRMSE values at the three 36-km reference pixels were all below 0.04 m3 m−3 (0.03 m3 m−3) for the SPL4SMAU surface (root-zone) soil moisture, with all of the correlation coefficients R higher than 0.5 (Figure 3). The average ubRMSE values for the SPL4SMAU surface (root-zone) soil moisture datasets (against the sparse soil moisture networks over CONUS and within the central Australia) were 0.049 m3m-3 (0.040 m3m-3) in mountainous or densely vegetated areas and even larger in regions having low or modest vegetation and/or topography [28]. The average ubRMSE values from the study were slightly larger than those obtained using the MAWN sparse network (Figure 6). For both the SPL4SMAU surface and root-zone soil moisture, the average R values (against the sparse soil moisture networks over CONUS and within Australia’s Murrumbidgee Catchment, with a climate ranging from semiarid to humid) were close to 0.65 [28], which is higher than the average R values (~0.48‒0.5) observed here, although only two years of data (1 April 2015–31 March 2017) were used in [28]. Overall, the validation results presented here and those from other validation studies provide a consistent explanation for the performance of the three levels of SMAP products at different spatial scales.
5. Conclusions
In this work, SMAP Level 2–4 soil moisture products (SPL2SMAP_S, SPL3SMP_E, and SPL4SMAU) have been evaluated over the southern portion of the Great Lakes region using in situ measurements from Michigan State University’s Enviro-weather Automated Weather Station Network. The main conclusions of this study are as follows.
- (1)
- The ubRMSE values for both SPL4SMAU surface and root zone soil moisture estimates are below 0.04 m3 m−3 at the 36-km scale. The R (anomaly R) values are generally higher than 0.5 (0.6) at the 36-km scale. The ubRMSE for SPL4SMAU soil moisture typically ranged from 0.02 to 0.06 m3 m−3 against the sparse network, with an average of 0.045 m3 m−3 (0.037 m3 m−3) for the SPL4SMAU surface (root-zone) soil moisture. The average R values are close to 0.5 for both the raw and anomaly time series of SPL4SMAU soil moisture against the sparse network.
- (2)
- The ubRMSE values for SPL3SMP_E a.m. soil moisture retrievals are close to 0.04 m3 m−3 or lower at the 36-km scale, with the R and anomaly R values exceeding 0.65. The SPL3SMP_E a.m. soil moisture has an average ubRMSE of ~0.06 m3 m−3 against the sparse network, with both the average R and average anomaly R close to 0.5. The SPL3SMP_E p.m. and a.p.m. soil moisture retrievals were slightly less accurate than their a.m. equivalents.
- (3)
- The average ubRMSE (R) values were ~0.05‒0.06 m3 m−3 (~0.6) for high-resolution (3 and 1 km) SPL2SMAP_S soil moisture retrievals against the sparse network, with the skill of the baseline algorithm-based soil moisture retrievals exceeding that of the optional algorithm-based counterparts.
- (4)
- The skill of SPL4SMAU surface soil moisture exceeds that of SPL3SMP_E and SPL2SMAP_S soil moisture retrievals. The SPL2SMAP_S 3- and 1-km soil moisture products did not present a significant improvement over the SPL3SMP_E 9-km product.
The accuracy of SMAP soil moisture in humid areas was typically previously underrepresented. The validation results presented here can advance our understanding of the ability of the SMAP soil moisture products to represent regional soil moisture variability across different climate conditions. The results can also provide insights into the development of the SMAP soil moisture retrieval algorithms, especially for improving the high-resolution SMAP soil moisture skill in humid or densely vegetated regions. Water security and the sustainability of water resources is one of the most urgent challenges facing the world today. To address this concern, we must be able to accurately and rapidly monitor and predict how the physical processes governing the water cycle vary over space and time. The validation results can provide crucial guidance on how to use different SMAP soil moisture products to advance our understanding of the water cycle and how it is changing in response to climate change. Additionally, by quantifying the uncertainties in SMAP soil moisture products, this study can also provide evidence-based support for remotely-sensed soil moisture assimilation work.
Funding
This research received no external funding.
Acknowledgments
Thanks go to the NASA National Snow and Ice Data Center Distributed Active Archive Center for the SMAP soil moisture products, and to Michigan State University and the Enviroweather project for the MAWN in situ soil moisture data used in this study.
Conflicts of Interest
The author declares no conflict of interest.
Appendix A

Table A1.
Reference stations for addressing the impact of the depth discrepancy between the SMAP and in situ surface soil moisture data.
Table A1.
Reference stations for addressing the impact of the depth discrepancy between the SMAP and in situ surface soil moisture data.
| Reference Site No. | Network | Station ID | Latitude (°) | Longitude (°) | In Situ Sensor Depths (cm) |
|---|---|---|---|---|---|
| 1 | SCAN | 2003 | 45.47 | ‒88.58 | 5, 10, 20 |
| 2 | SCAN | 2073 | 41.80 | ‒81.08 | 5, 10, 20 |
| 3 | AmeriFlux | CA-TP1 | 42.66 | ‒80.56 | 5, 10, 30 |
| 4 | AmeriFlux | CA-TP4 | 42.71 | ‒80.36 | 5, 10, 30 |
| 5 | AmeriFlux | US-UMB | 45.56 | ‒84.71 | 5, 10, 30 |
| 6 | AmeriFlux | US-WCr | 45.81 | ‒90.08 | 5, 10, 30 |
Figure A1.
Time sequences of the in situ soil moisture data at the 5 cm depth (blue line) and in the 0‒30 cm profile (black line; derived from the average of the measurements at the depths of 10 cm and 20 or 30 cm), along with the SPL4SMAU surface soil moisture (red dots) at the six sites: (a) 2003; (b) 2073; (c) CA-TP1; (d) CA-TP4; (e) US-UMB; and (f) US-WCr, as listed in Table A1.
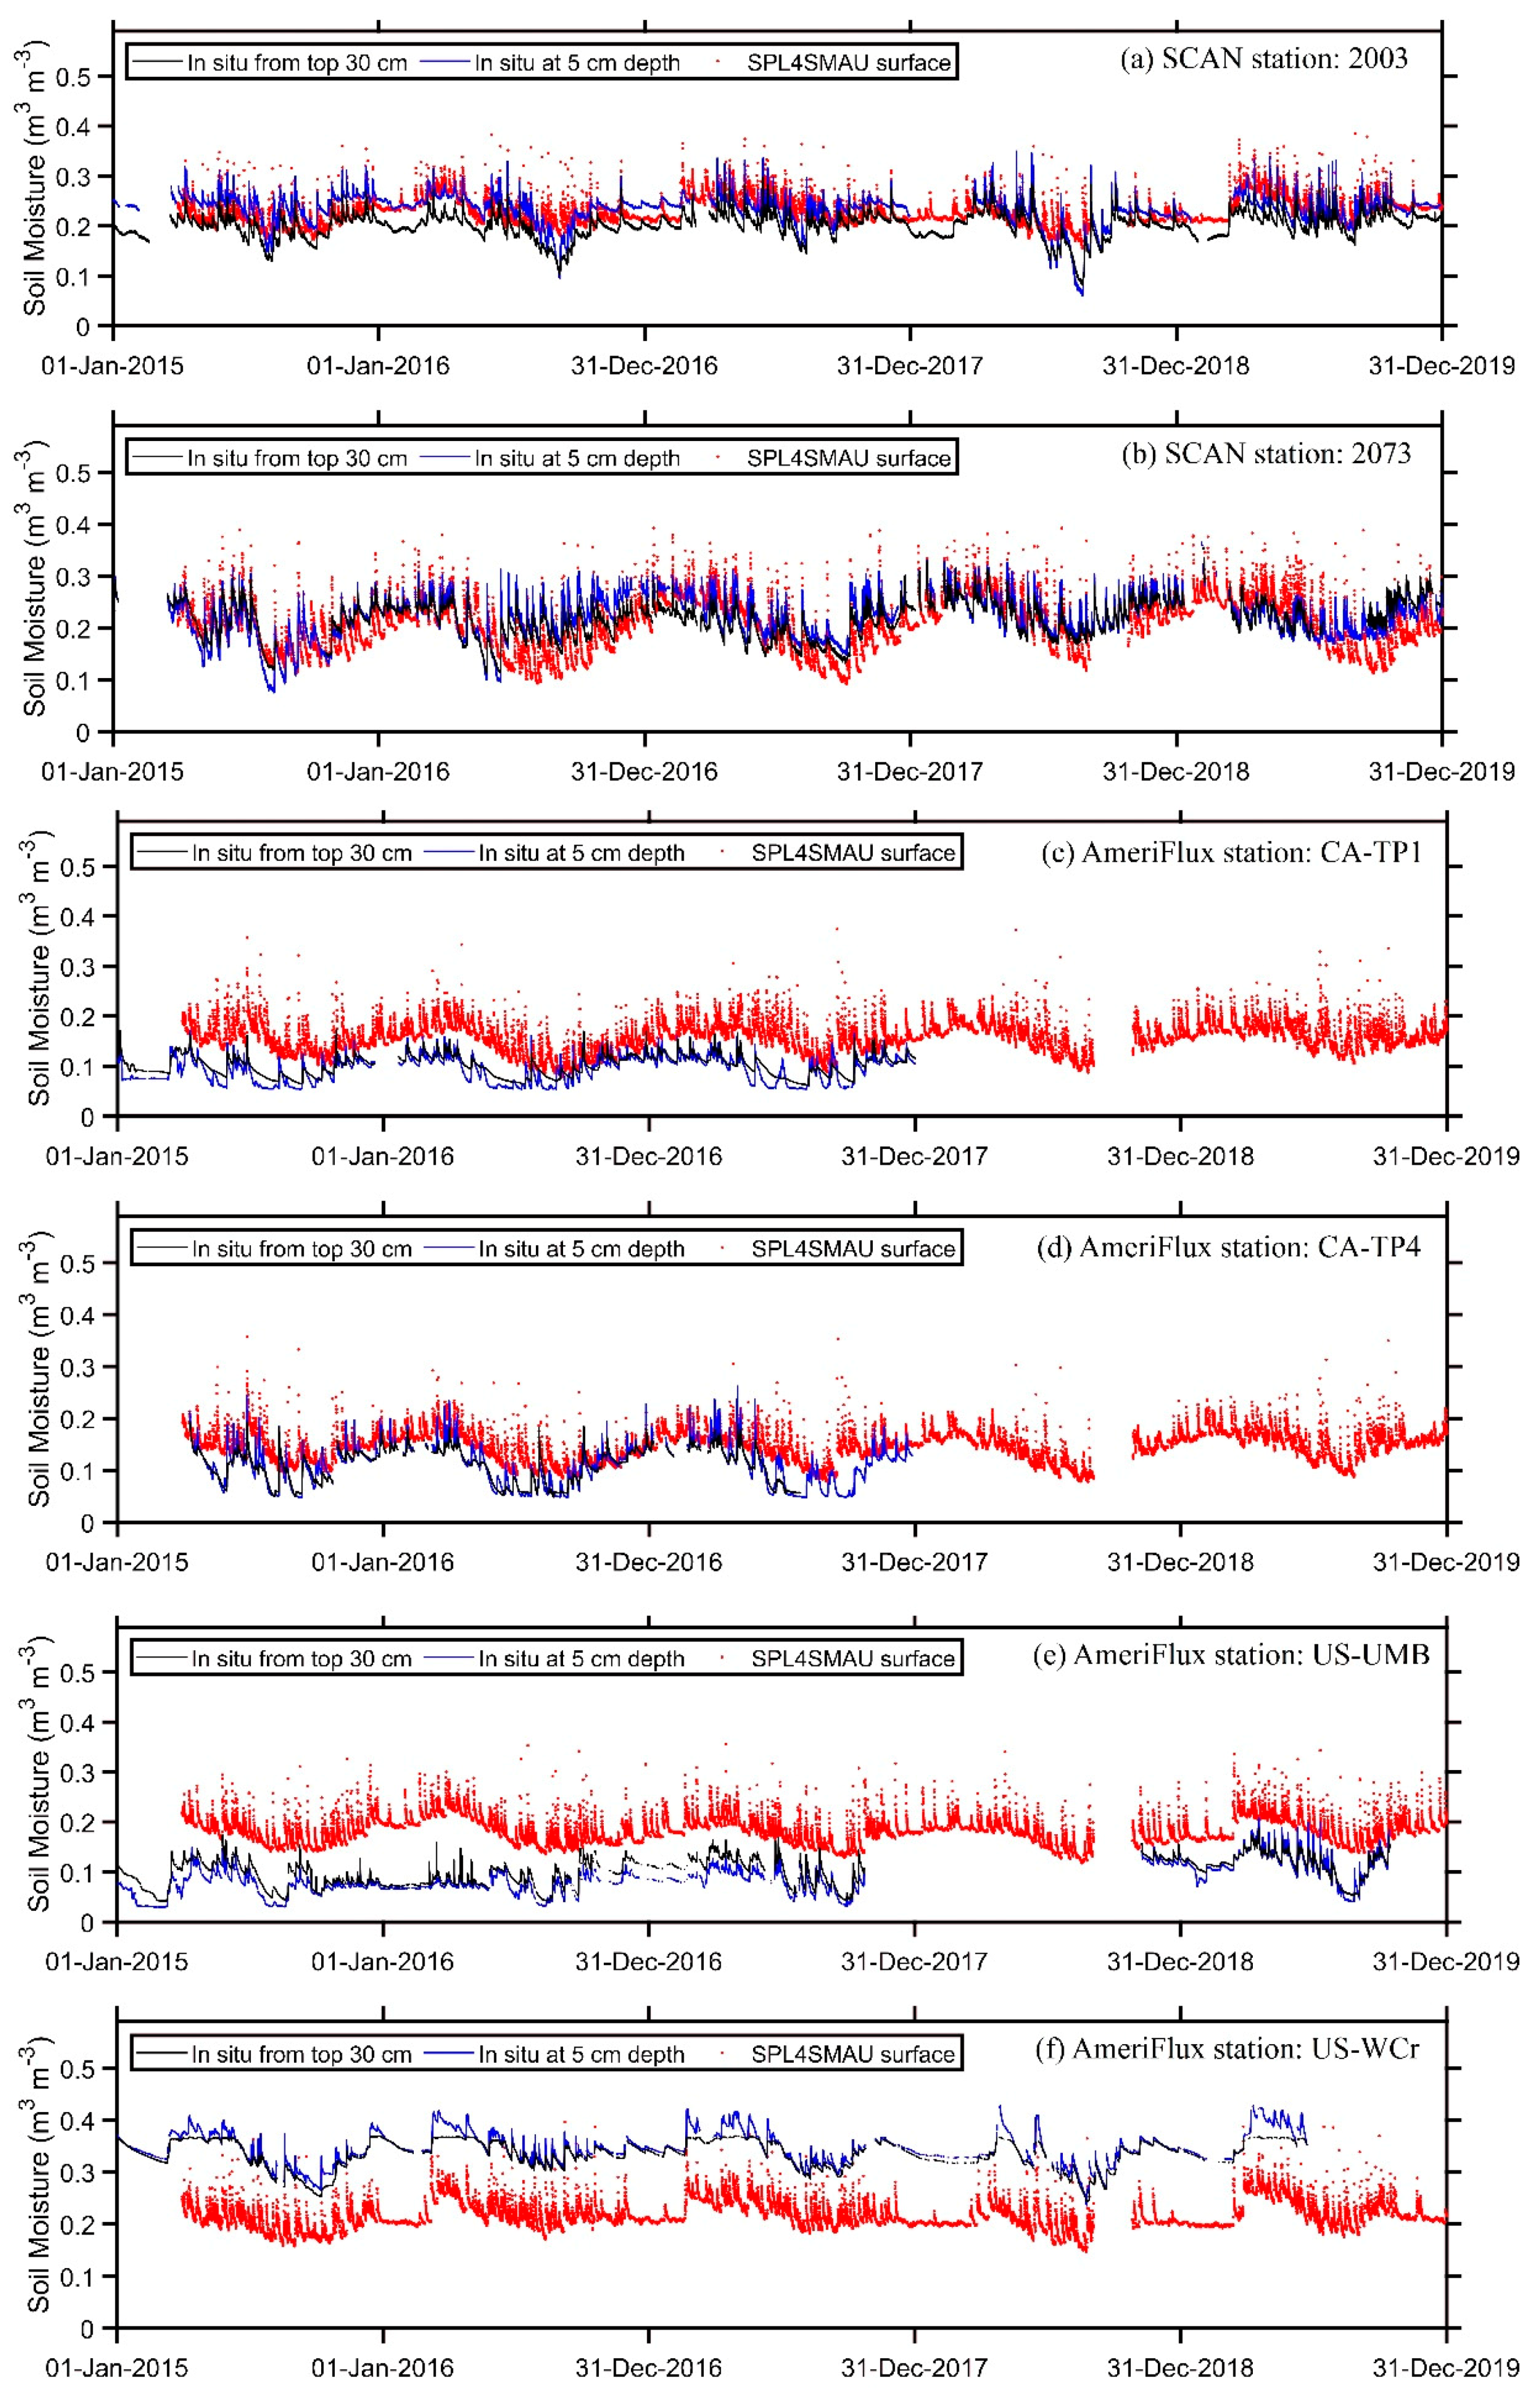
Figure A2.
The verification scores ((a) ubRMSE; (b) R; and (c) anomaly R) for the SPL4SMAU surface soil moisture against the in situ measurements at the 5 cm depth (black dots) and within the 0‒30 cm soil profile (red dots) at the six sites, as listed in Table A1.
Figure A2.
The verification scores ((a) ubRMSE; (b) R; and (c) anomaly R) for the SPL4SMAU surface soil moisture against the in situ measurements at the 5 cm depth (black dots) and within the 0‒30 cm soil profile (red dots) at the six sites, as listed in Table A1.

References
- Jackson, T.J. Soil moisture estimation using special satellite microwave/imager satellite data over a grassland region. Water Resour. Res. 1997, 33, 1475–1484. [Google Scholar] [CrossRef]
- Kerr, Y.; Waldteufel, P.; Wigneron, J.-P.; Martinuzzi, J.; Font, J.; Berger, M. Soil moisture retrieval from space: The Soil Moisture and Ocean Salinity (SMOS) mission. IEEE Trans. Geosci. Remote Sens. 2001, 39, 1729–1735. [Google Scholar] [CrossRef]
- Kerr, Y.H.; Waldteufel, P.; Richaume, P.; Wigneron, J.P.; Ferrazzoli, P.; Mahmoodi, A.; Al Bitar, A.; Cabot, F.; Gruhier, C.; Juglea, S.E.; et al. The SMOS Soil Moisture Retrieval Algorithm. IEEE Trans. Geosci. Remote Sens. 2012, 50, 1384–1403. [Google Scholar] [CrossRef]
- Njoku, E.; Jackson, T.J.; Lakshmi, V.; Chan, T.; Nghiem, S. Soil moisture retrieval from AMSR-E. IEEE Trans. Geosci. Remote Sens. 2003, 41, 215–229. [Google Scholar] [CrossRef]
- Bindlish, R.; Jackson, T.; Wood, E.F.; Gao, H.; Starks, P.; Bosch, D.; Lakshmi, V. Soil moisture estimates from TRMM Microwave Imager observations over the Southern United States. Remote Sens. Environ. 2003, 85, 507–515. [Google Scholar] [CrossRef]
- Bartalis, Z.; Wagner, W.; Naeimi, V.; Hasenauer, S.; Scipal, K.; Bonekamp, H.; Figa, J.; Anderson, C. Initial soil moisture retrievals from the METOP-A Advanced Scatterometer (ASCAT). Geophys. Res. Lett. 2007, 34. [Google Scholar] [CrossRef] [Green Version]
- Owe, M.; De Jeu, R.; Holmes, T. Multisensor historical climatology of satellite-derived global land surface moisture. J. Geophys. Res. Space Phys. 2008, 113, 01002. [Google Scholar] [CrossRef]
- Entekhabi, D.; Njoku, E.G.; O’Neill, P.E.; Kellogg, K.H.; Crow, W.T.; Edelstein, W.N.; Entin, J.K.; Goodman, S.D.; Jackson, T.J.; Johnson, J.; et al. The Soil Moisture Active Passive (SMAP) Mission. Proc. IEEE 2010, 98, 704–716. [Google Scholar] [CrossRef]
- Wagner, W.; Naeimi, V.; Scipal, K.; De Jeu, R.; Martínez-Fernández, J. Soil moisture from operational meteorological satellites. Hydrogeol. J. 2006, 15, 121–131. [Google Scholar] [CrossRef]
- Crow, W.T.; Zhan, X. Continental-Scale Evaluation of Remotely Sensed Soil Moisture Products. IEEE Geosci. Remote Sens. Lett. 2007, 4, 451–455. [Google Scholar] [CrossRef] [Green Version]
- Albergel, C.; Rüdiger, C.; Carrer, D.; Calvet, J.-C.; Fritz, N.; Naeimi, V.; Bartalis, Z.; Hasenauer, S. An evaluation of ASCAT surface soil moisture products with in-situ observations in Southwestern France. Hydrol. Earth Syst. Sci. 2009, 13, 115–124. [Google Scholar] [CrossRef] [Green Version]
- Draper, C.S.; Walker, J.P.; Steinle, P.J.; De Jeu, R.A.; Holmes, T.R.H. An evaluation of AMSR–E derived soil moisture over Australia. Remote Sens. Environ. 2009, 113, 703–710. [Google Scholar] [CrossRef]
- Champagne, C.; Berg, A.; Belanger, J.; McNairn, H.; De Jeu, R. Evaluation of soil moisture derived from passive microwave remote sensing over agricultural sites in Canada using ground-based soil moisture monitoring networks. Int. J. Remote Sens. 2010, 31, 3669–3690. [Google Scholar] [CrossRef]
- Jackson, T.J.; Cosh, M.H.; Bindlish, R.; Starks, P.J.; Bosch, D.D.; Seyfried, M.; Goodrich, D.; Moran, M.S.; Du, J. Validation of Advanced Microwave Scanning Radiometer Soil Moisture Products. IEEE Trans. Geosci. Remote Sens. 2010, 48, 4256–4272. [Google Scholar] [CrossRef]
- Brocca, L.; Hasenauer, S.; Lacava, T.; Melone, F.; Moramarco, T.; E Wagner, W.; Dorigo, W.; Matgen, P.; Martínez-Fernández, J.; Llorens, P.; et al. Soil moisture estimation through ASCAT and AMSR-E sensors: An intercomparison and validation study across Europe. Remote Sens. Environ. 2011, 115, 3390–3408. [Google Scholar] [CrossRef]
- Al Bitar, A.; Leroux, D.J.; Kerr, Y.H.; Merlin, O.; Richaume, P.; Sahoo, A.; Wood, E.F. Evaluation of SMOS Soil Moisture Products Over Continental U.S. Using the SCAN/SNOTEL Network. IEEE Trans. Geosci. Remote Sens. 2012, 50, 1572–1586. [Google Scholar] [CrossRef] [Green Version]
- Calvet, J.-C.; De Rosnay, P.; Gruhier, C.; Muñoz-Sabater, J.; Hasenauer, S.; Isaksen, L.; Kerr, Y.H.; Wagner, W. Evaluation of remotely sensed and modelled soil moisture products using global ground-based in situ observations. Remote Sens. Environ. 2012, 118, 215–226. [Google Scholar] [CrossRef]
- Jackson, T.J.; Bindlish, R.; Cosh, M.H.; Zhao, T.; Starks, P.J.; Bosch, D.D.; Seyfried, M.; Moran, M.S.; Goodrich, D.; Kerr, Y.H.; et al. Validation of Soil Moisture and Ocean Salinity (SMOS) Soil Moisture Over Watershed Networks in the U.S. IEEE Trans. Geosci. Remote Sens. 2012, 50, 1530–1543. [Google Scholar] [CrossRef] [Green Version]
- Gherboudj, I.; Magagi, R.; Goita, K.; Berg, A.; Toth, B.; Walker, A. Validation of SMOS Data Over Agricultural and Boreal Forest Areas in Canada. IEEE Trans. Geosci. Remote Sens. 2012, 50, 1623–1635. [Google Scholar] [CrossRef]
- Chan, S.K.; Bindlish, R.; O’Neill, P.E.; Njoku, E.; Jackson, T.; Colliander, A.; Chen, F.; Burgin, M.; Dunbar, S.; Piepmeier, J.; et al. Assessment of the SMAP Passive Soil Moisture Product. IEEE Trans. Geosci. Remote Sens. 2016, 54, 4994–5007. [Google Scholar] [CrossRef]
- Wu, Q.; Liu, H.; Wang, L.; Deng, C. Evaluation of AMSR2 soil moisture products over the contiguous United States using in situ data from the International Soil Moisture Network. Int. J. Appl. Earth Obs. Geoinf. 2016, 45, 187–199. [Google Scholar] [CrossRef]
- Chen, Y.; Yang, K.; Qin, J.; Cui, Q.; Lu, H.; La, Z.; Han, M.; Tang, W. Evaluation of SMAP, SMOS, and AMSR2 soil moisture retrievals against observations from two networks on the Tibetan Plateau. J. Geophys. Res. Atmos. 2017, 122, 5780–5792. [Google Scholar] [CrossRef]
- Colliander, A.; Jackson, T.J.; Bindlish, R.; Chan, S.; Das, N.; Kim, S.B.; Cosh, M.H.; Dunbar, R.S.; Dang, L.; Pashaian, L.; et al. Validation of SMAP surface soil moisture products with core validation sites. Remote Sens. Environ. 2017, 191, 215–231. [Google Scholar] [CrossRef]
- Cui, C.; Xu, J.; Zeng, J.-Y.; Chen, K.-S.; Bai, X.; Lu, H.; Chen, Q.; Zhao, T. Soil Moisture Mapping from Satellites: An Intercomparison of SMAP, SMOS, FY3B, AMSR2, and ESA CCI over Two Dense Network Regions at Different Spatial Scales. Remote Sens. 2017, 10, 33. [Google Scholar] [CrossRef] [Green Version]
- Li, C.; Lu, H.; Yang, K.; Han, M.; Wright, J.S.; Chen, Y.; Yu, L.; Xu, S.; Huang, X.; Gong, W.; et al. The Evaluation of SMAP Enhanced Soil Moisture Products Using High-Resolution Model Simulations and In-Situ Observations on the Tibetan Plateau. Remote Sens. 2018, 10, 535. [Google Scholar] [CrossRef] [Green Version]
- Piepmeier, J.R.; Focardi, P.; Horgan, K.A.; Knuble, J.; Ehsan, N.; Lucey, J.; Brambora, C.; Brown, P.R.; Hoffman, P.J.; French, R.T.; et al. SMAP L-Band Microwave Radiometer: Instrument Design and First Year on Orbit. IEEE Trans. Geosci. Remote Sens. 2017, 55, 1954–1966. [Google Scholar] [CrossRef] [Green Version]
- Das, N.N.; Entekhabi, D.; Dunbar, R.S.; Chaubell, M.J.; Colliander, A.; Yueh, S.; Jagdhuber, T.; Chen, F.; Crow, W.T.; O’Neill, P.E.; et al. The SMAP and Copernicus Sentinel 1A/B microwave active-passive high resolution surface soil moisture product. Remote Sens. Environ. 2019, 233, 111380. [Google Scholar] [CrossRef]
- Reichle, R.H.; De Lannoy, G.J.M.; Liu, Q.; Ardizzone, J.V.; Colliander, A.; Conaty, A.; Crow, W.; Jackson, T.J.; Jones, L.A.; Kimball, J.S.; et al. Assessment of the SMAP Level-4 Surface and Root-Zone Soil Moisture Product Using In Situ Measurements. J. Hydrometeorol. 2017, 18, 2621–2645. [Google Scholar] [CrossRef]
- Reichle, R.; De Lannoy, G.; Koster, R.D.; Crow, W.T.; Kimball, J.S.; Liu, Q. SMAP L4 Global 3-hourly 9 km EASE-Grid Surface and Root Zone Soil Moisture Analysis Update Boulder, CO, USA. NASA National Snow and Ice Data Center Distributed Active Archive Center. J. Hydrometeor. 2018, 17, 3217–3237. [Google Scholar] [CrossRef]
- O’Neill, P.E.; Chan, S.; Njoku, E.G.; Jackson, T.; Bindlish, R. SMAP Enhanced L3 Radiometer Global Daily 9 km EASE-Grid Soil Moisture, Version 3; NASA National Snow and Ice Data Center Distributed Active Archive Center: Boulder, CO, USA, 2019. [CrossRef]
- Das, N.; Entekhabi, D.; Dunbar, S.; Kim, S.; Yueh, S.; Colliander, A.; O’Neill, P.E.; Jackson, T.; Jagdhuber, T.; Chen, F.; et al. SMAP/Sentinel-1 L2 Radiometer/Radar 30-Second Scene 3 km EASE-Grid Soil Moisture, Version 2; NASA National Snow and Ice Data Center Distributed Active Archive Center: Boulder, CO, USA, 2018. [CrossRef]
- Entekhabi, D.; Reichle, R.H.; Koster, R.D.; Crow, W.T. Performance Metrics for Soil Moisture Retrievals and Application Requirements. J. Hydrometeorol. 2010, 11, 832–840. [Google Scholar] [CrossRef]
- Reichle, R.H.; Koster, R.D.; Liu, P.; Mahanama, S.P.P.; Njoku, E.G.; Owe, M. Comparison and assimilation of global soil moisture retrievals from the Advanced Microwave Scanning Radiometer for the Earth Observing System (AMSR-E) and the Scanning Multichannel Microwave Radiometer (SMMR). J. Geophys. Res. Space Phys. 2007, 112. [Google Scholar] [CrossRef]
- Xu, X.; Tolson, B.A.; Li, J.; Staebler, R.M.; Seglenieks, F.; Haghnegahdar, A.; Davison, B. Assimilation of SMOS soil moisture over the Great Lakes basin. Remote Sens. Environ. 2015, 169, 163–175. [Google Scholar] [CrossRef]
- Xu, X.; Tolson, B.A.; Li, J.; Davison, B. Comparison of X-Band and L-Band Soil Moisture Retrievals for Land Data Assimilation. IEEE J. Sel. Top. Appl. Earth Obs. Remote Sens. 2017, 10, 3850–3860. [Google Scholar] [CrossRef]
Figure 1.
The Great Lakes basin and location of the Michigan Automated Weather Station Network (MAWN) stations (red and blue dots) providing in situ soil moisture observations. The MAWN stations marked with red dots are used for the SMAP validation. The black square boxes indicate the three 36-km reference pixels, and the black dots denote the centers of SMAP 9-km EASE-Grid 2.0 cells. Additionally, the two stations (purple triangles) from the USDA Natural Resources Conservation Soil Climate Analysis Network (SCAN), the four sites (purple squares) from the AmeriFlux Network, and the location of the major cities (crosses) in the study area are shown here.

Figure 2.
Comparison of SPL4SMAU (red dots) and in situ measurements (blue line) for surface soil moisture (a,c,e) and root zone soil moisture (b,d,f) at the three 36-km reference pixels, respectively.
Figure 2.
Comparison of SPL4SMAU (red dots) and in situ measurements (blue line) for surface soil moisture (a,c,e) and root zone soil moisture (b,d,f) at the three 36-km reference pixels, respectively.
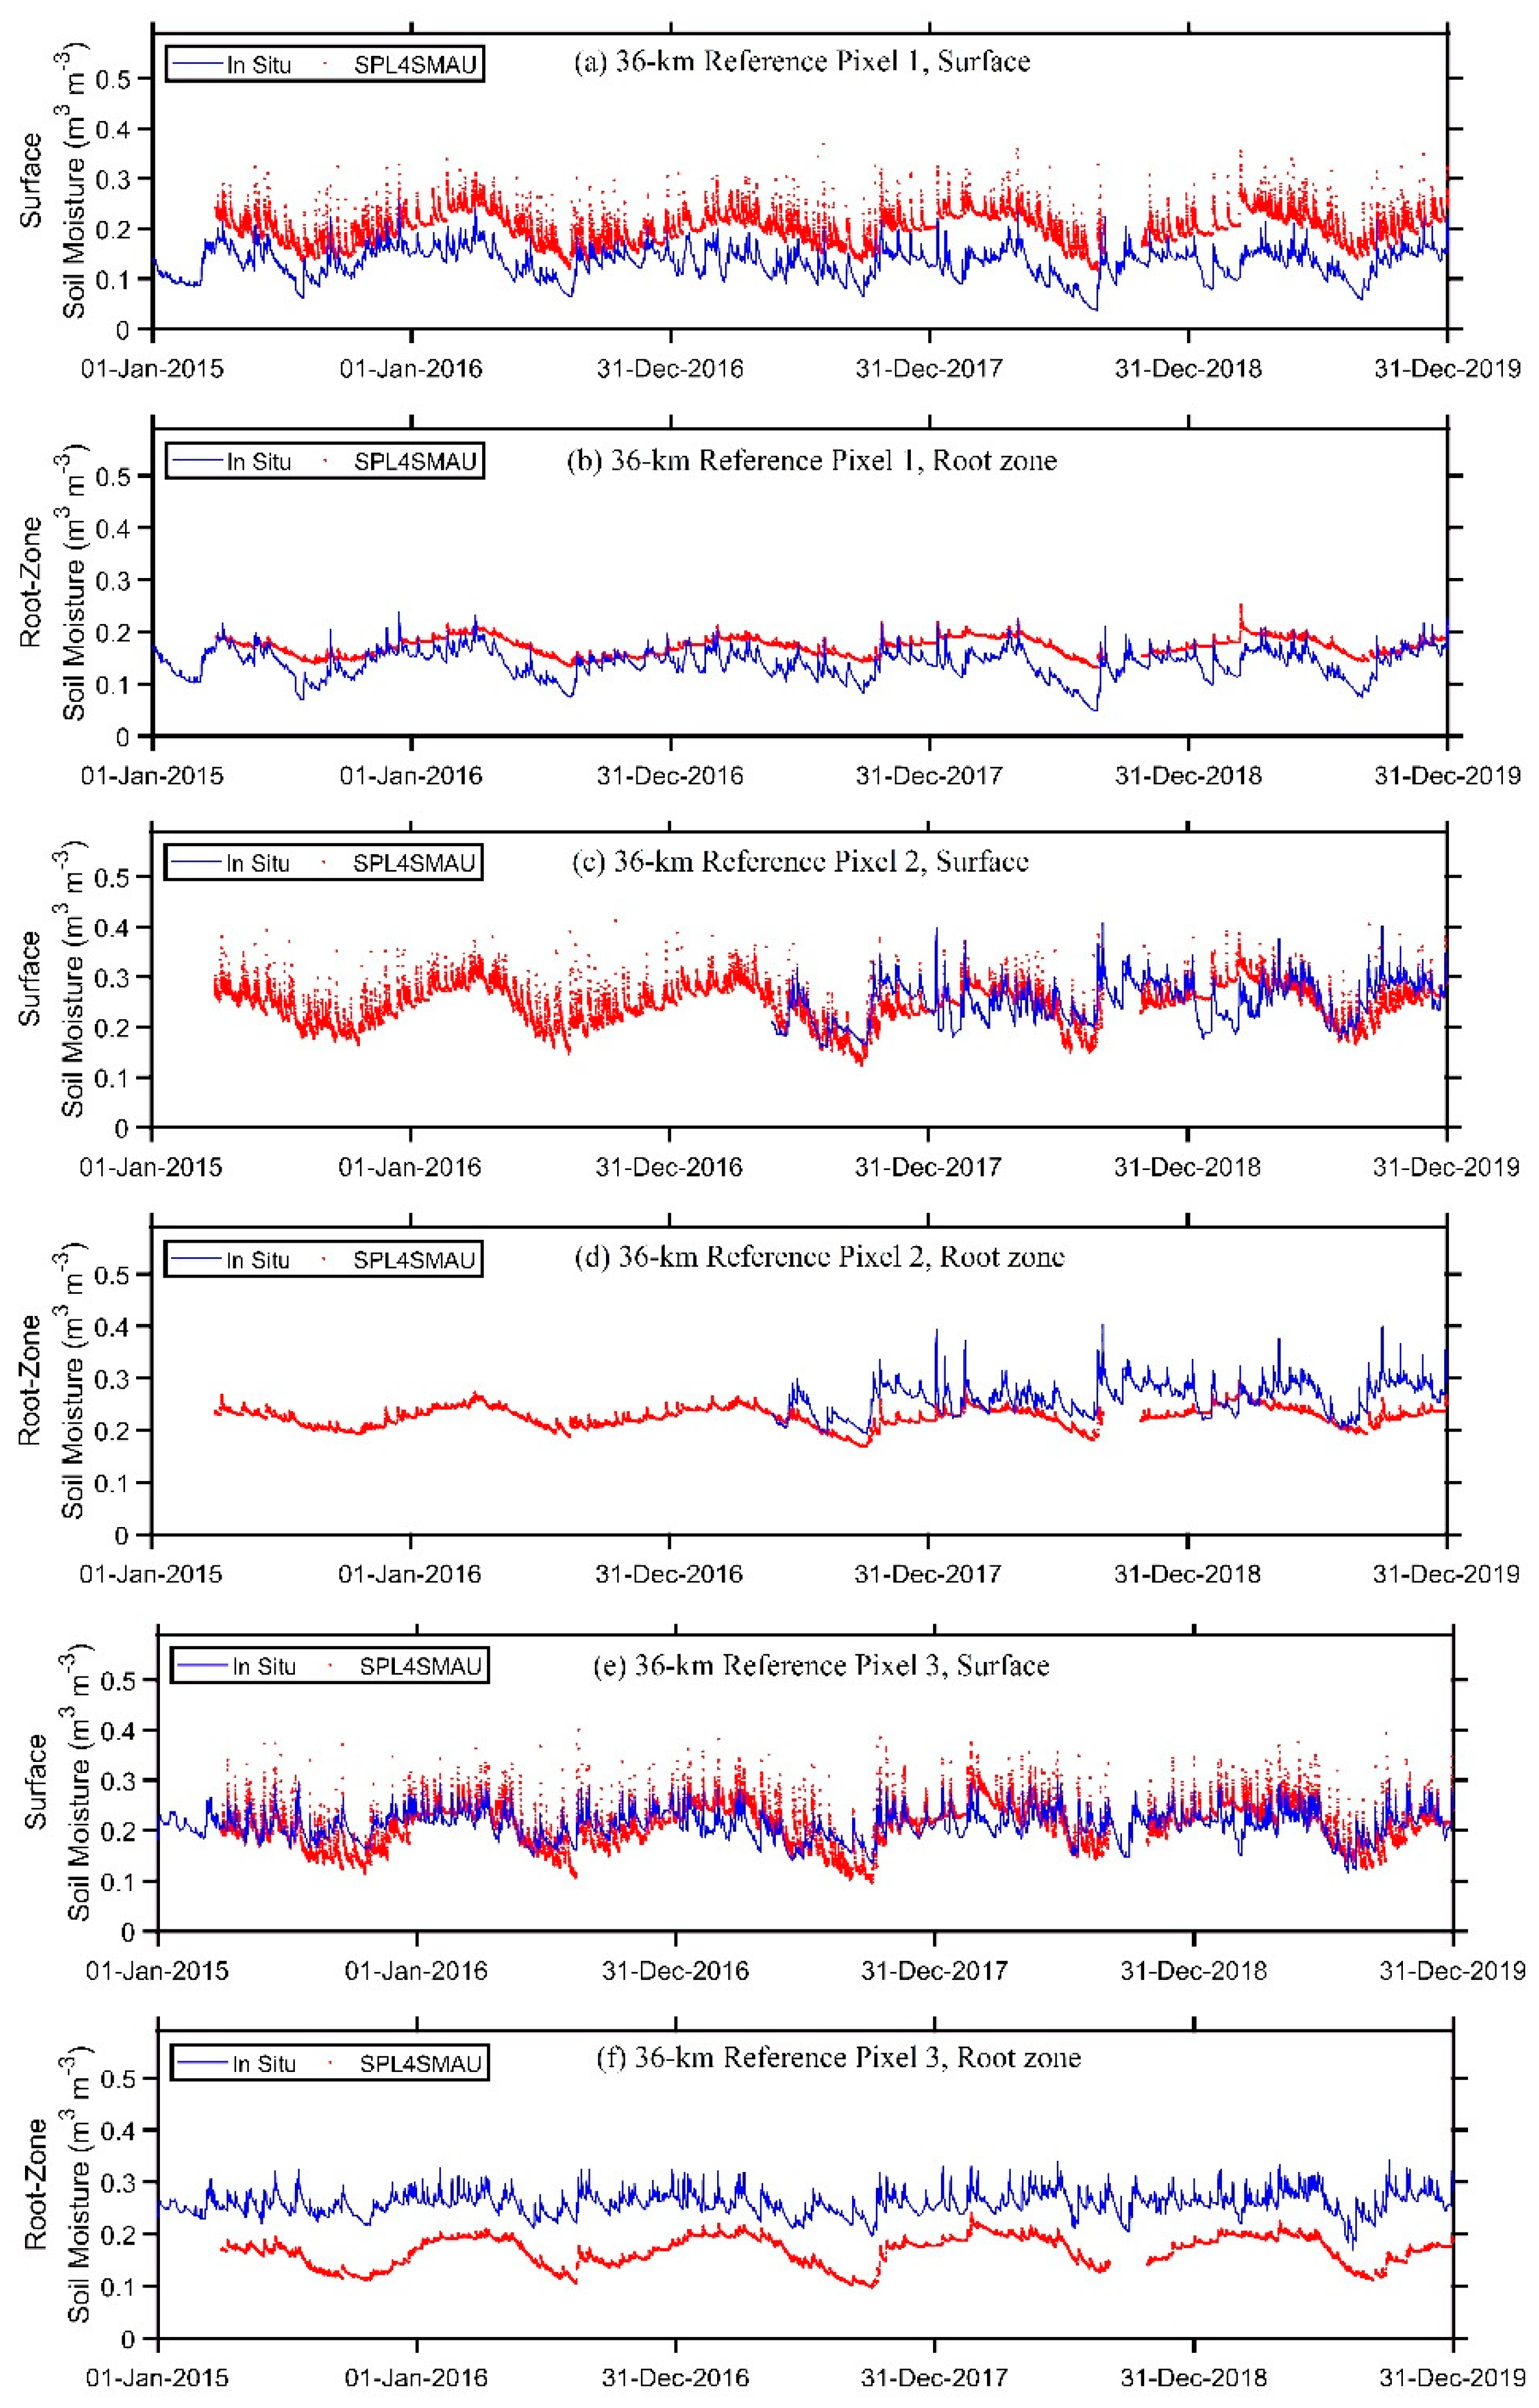
Figure 3.
Verification scores (ubRMSE (a,d), R (b,e), and anomaly R (c,f)) for the SPL4SMAU (top row) surface and (bottom row) root zone soil moisture estimates at the three individual 36-km reference pixels: (black) Pixel 1, (red) Pixel 2, and (blue) Pixel 3. Error bars (enlarged by a factor of 10 for clarity) indicate the 95% confidence intervals.
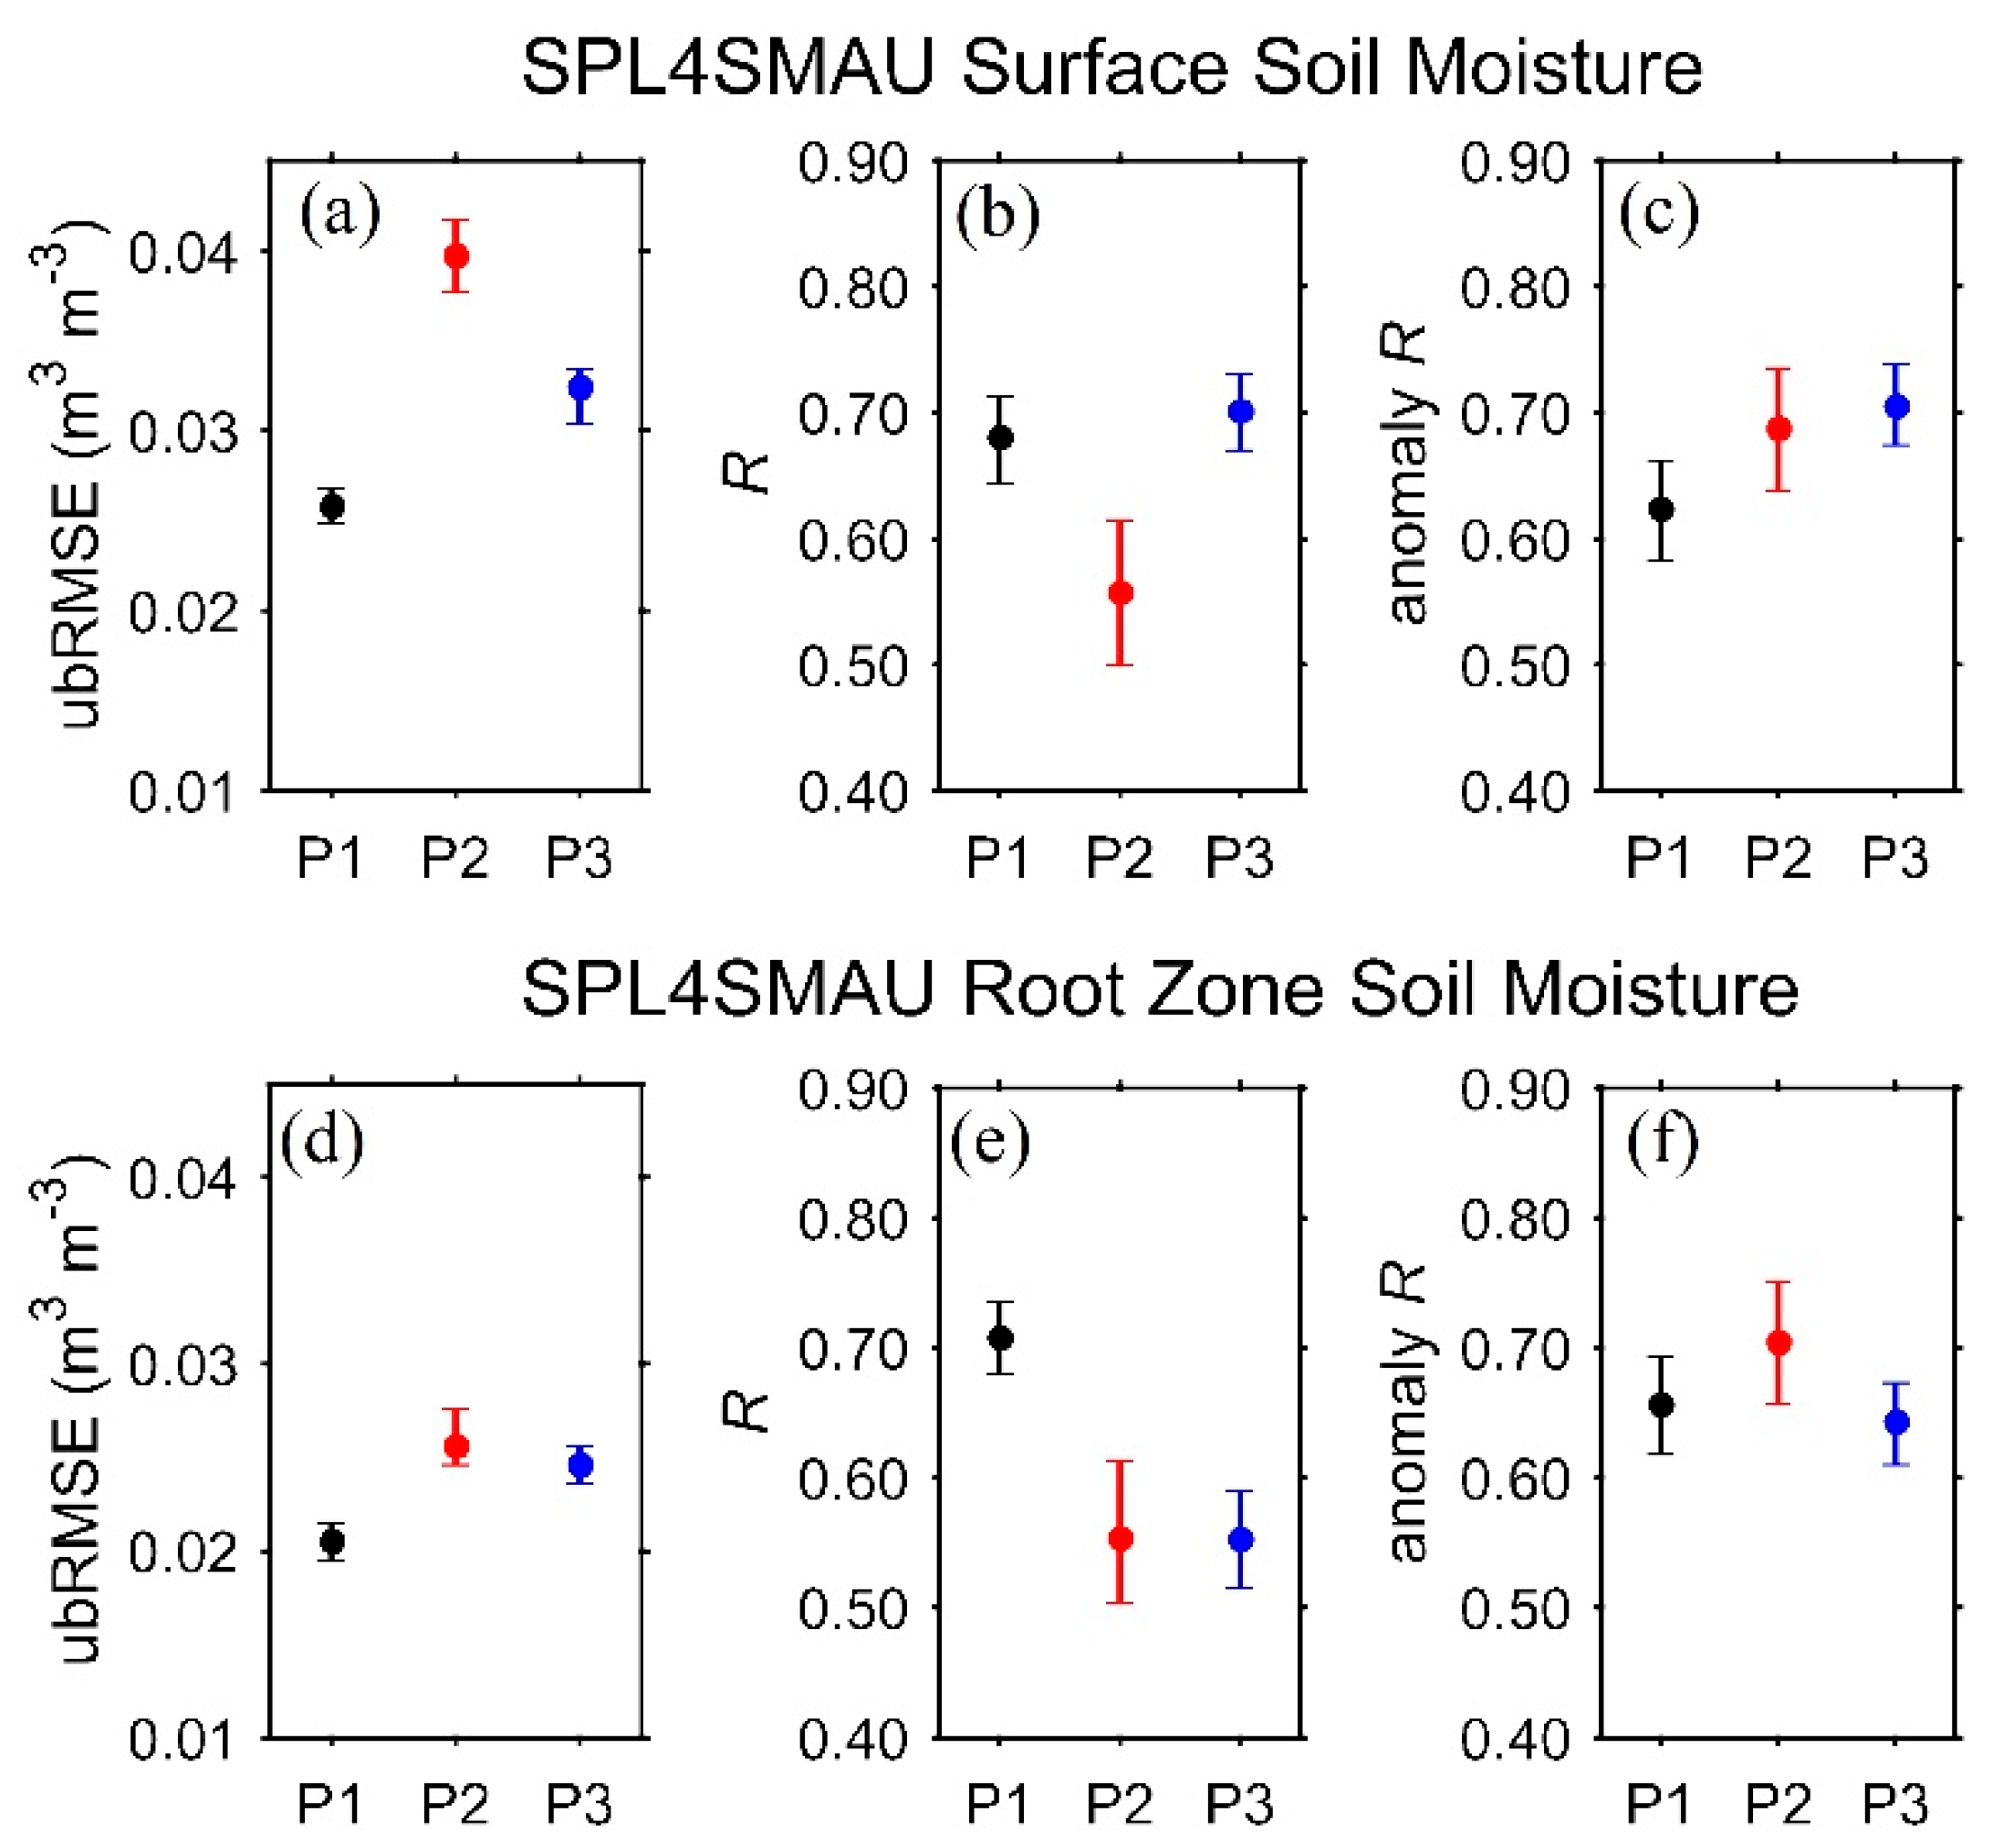
Figure 4.
The ubRMSE at the individual validation stations (87 in total) for the SPL4SMAU: (a) surface soil moisture; and (b) root-zone soil moisture.
Figure 4.
The ubRMSE at the individual validation stations (87 in total) for the SPL4SMAU: (a) surface soil moisture; and (b) root-zone soil moisture.
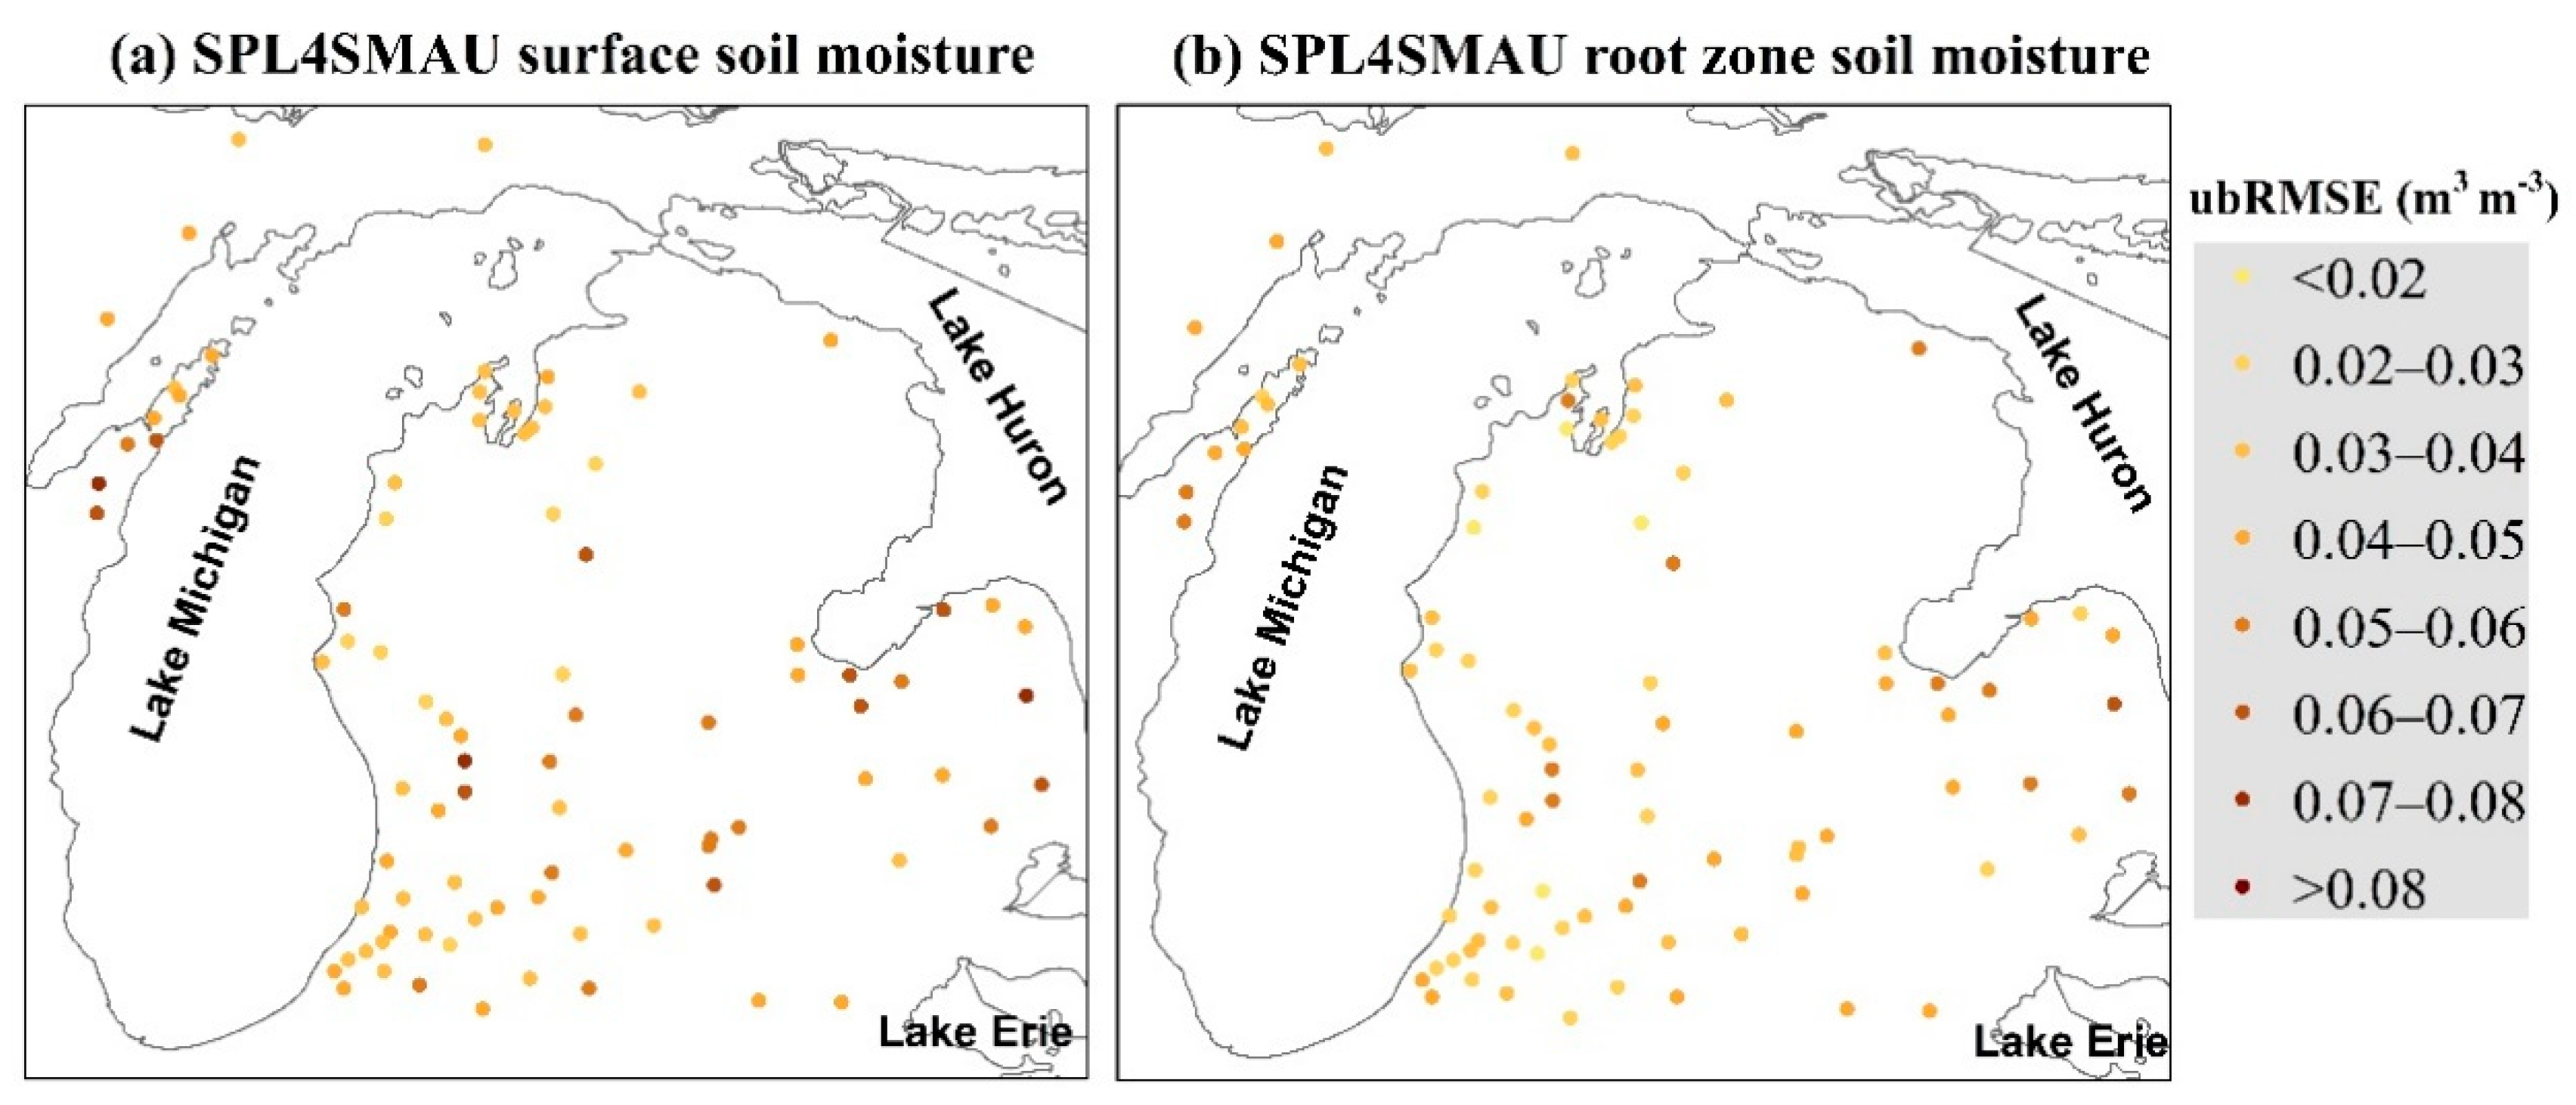
Figure 5.
The same as Figure 4, but for the anomaly R.
Figure 5.
The same as Figure 4, but for the anomaly R.
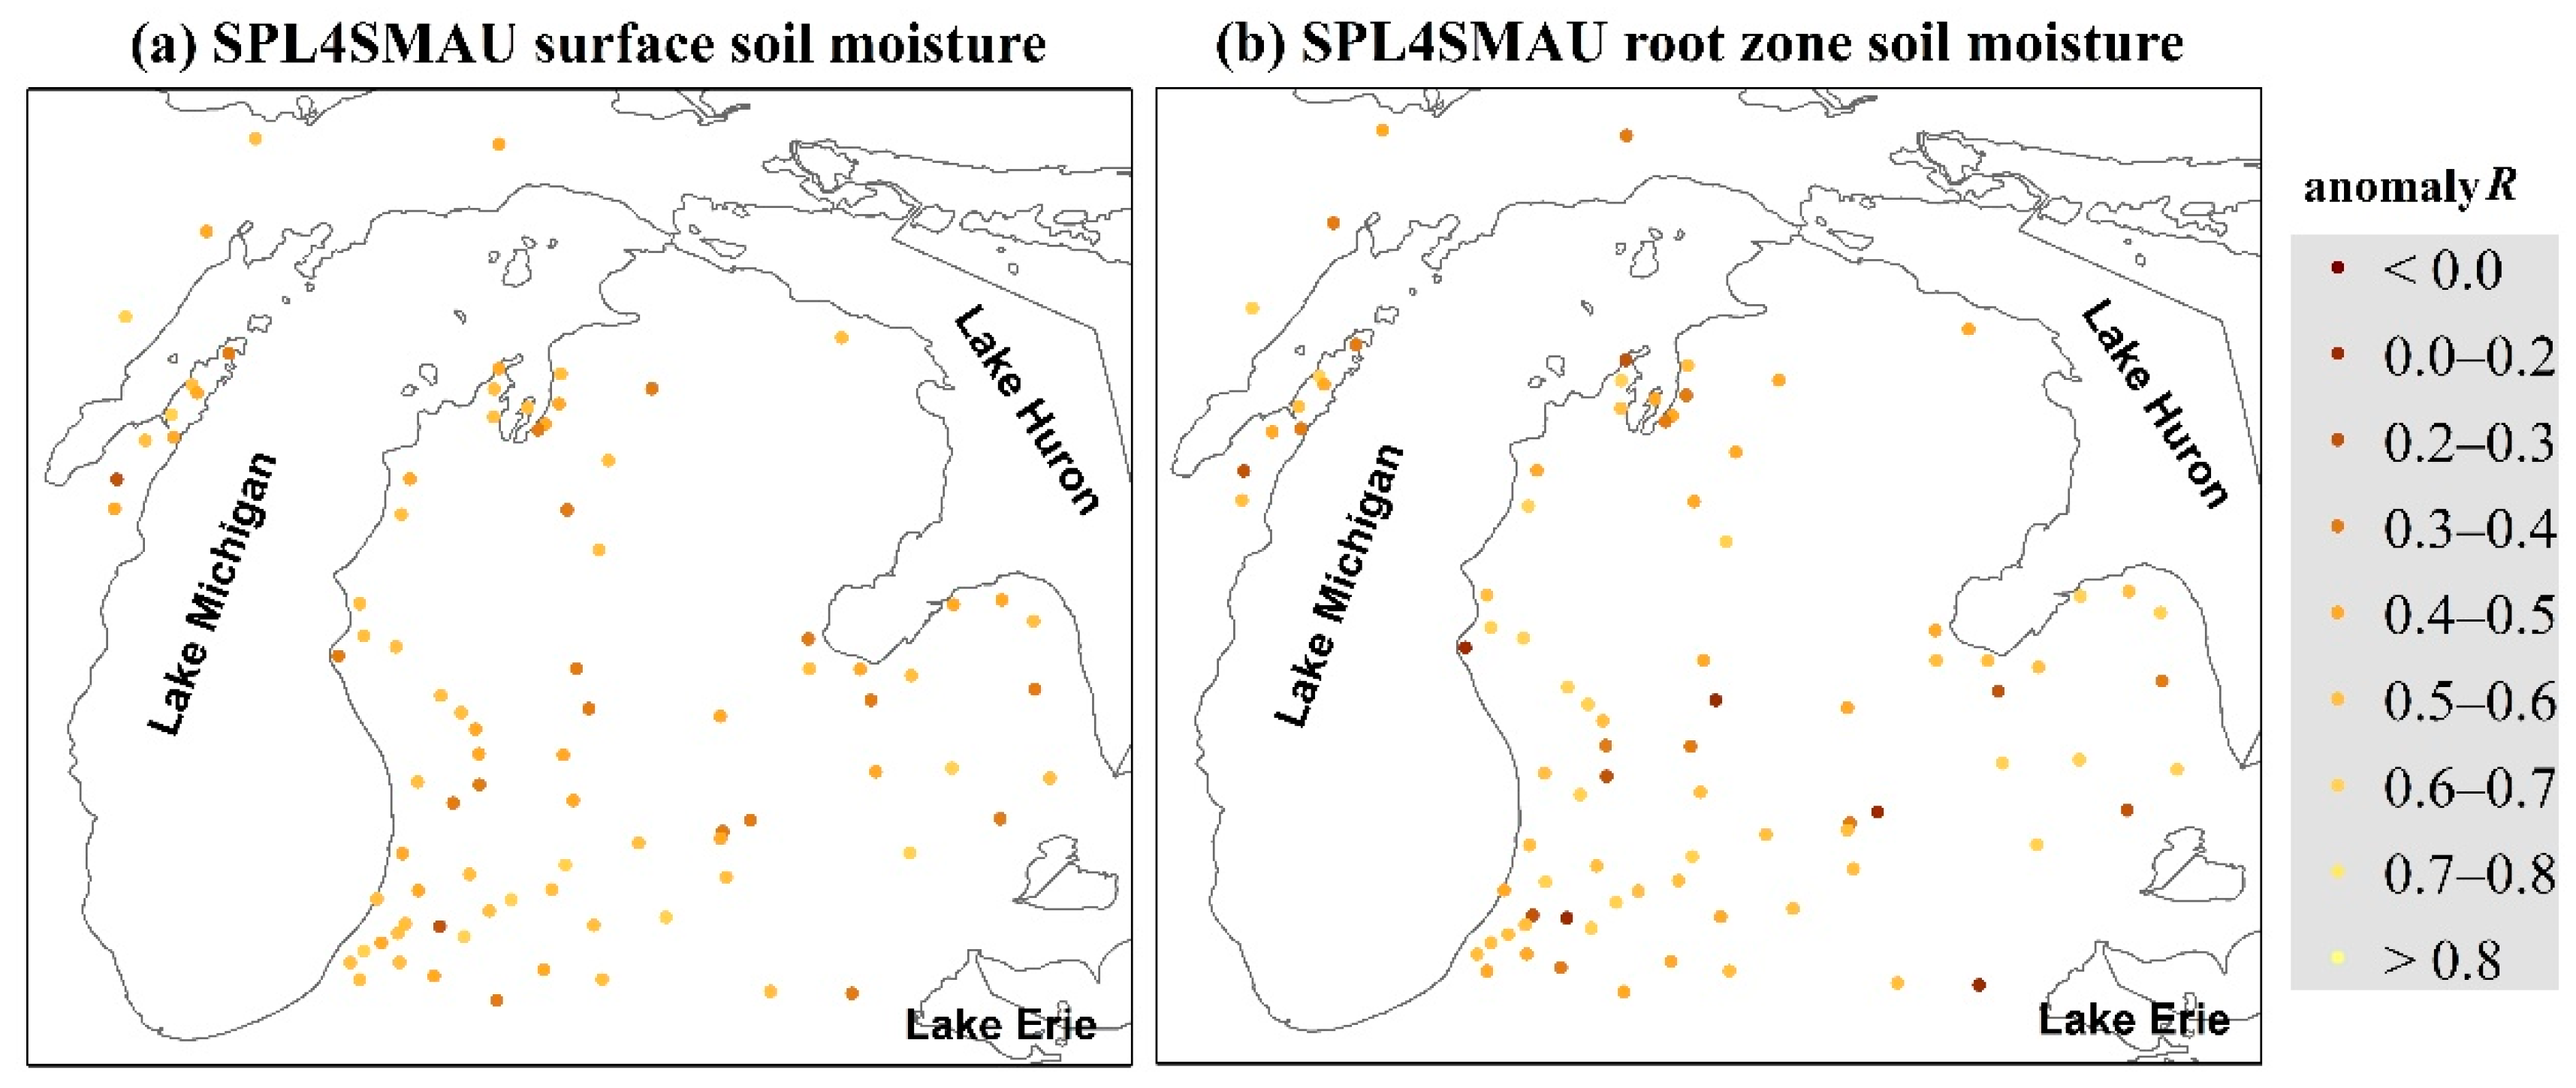
Figure 6.
The averaged (across 87 validation sites) metrics ((a) ubRMSE; (b) R; and (c)) anomaly R for the SPL4SMAU surface (black) and root zone (red) soil moisture estimates against the sparse network. Error bars denote 95% confidence intervals.
Figure 6.
The averaged (across 87 validation sites) metrics ((a) ubRMSE; (b) R; and (c)) anomaly R for the SPL4SMAU surface (black) and root zone (red) soil moisture estimates against the sparse network. Error bars denote 95% confidence intervals.
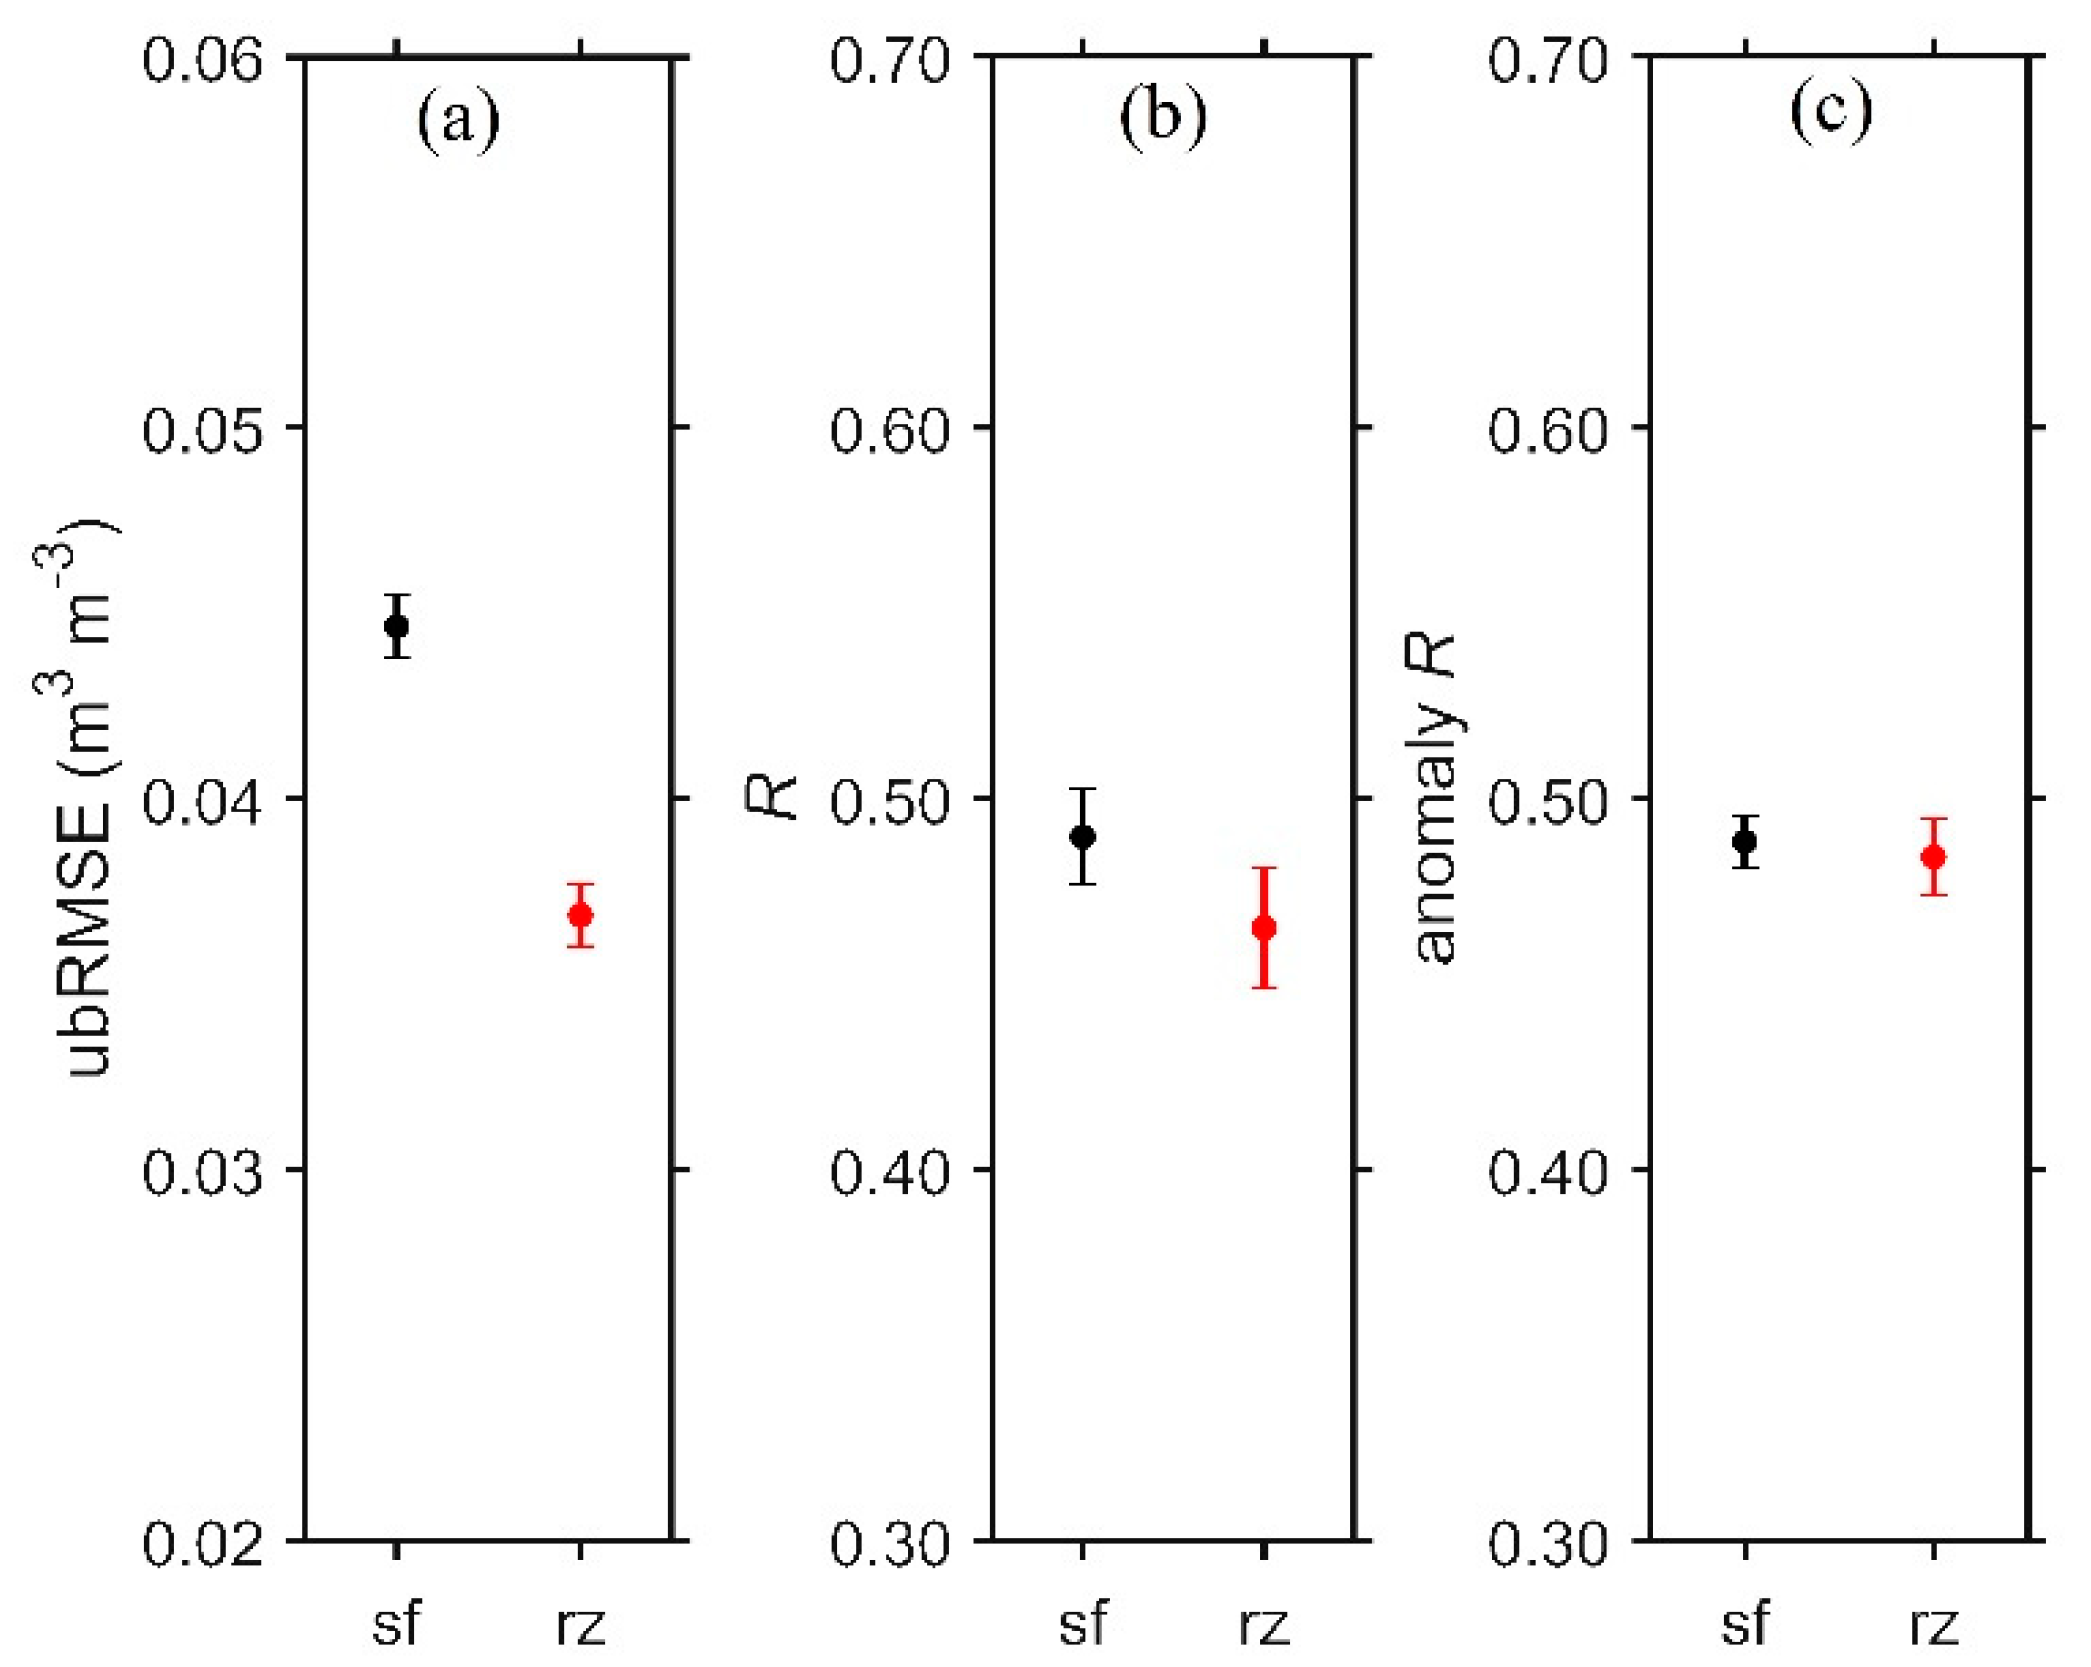
Figure 7.
Comparison between the SPL3SMP_E a.m. soil moisture (red dots) and in situ measurements (blue line; daily composite of surface soil moisture hourly data at 6 a.m. LST) at the36-km reference: (a) Pixel 2; and (c) Pixel 3. Comparison between the SPL3SMP_E p.m. soil moisture (red dots) and in situ measurements (blue line; daily composite of surface soil moisture hourly data at 6 p.m. LST) at the 36-km reference: (b) Pixel 2; and (d)Pixel 3.
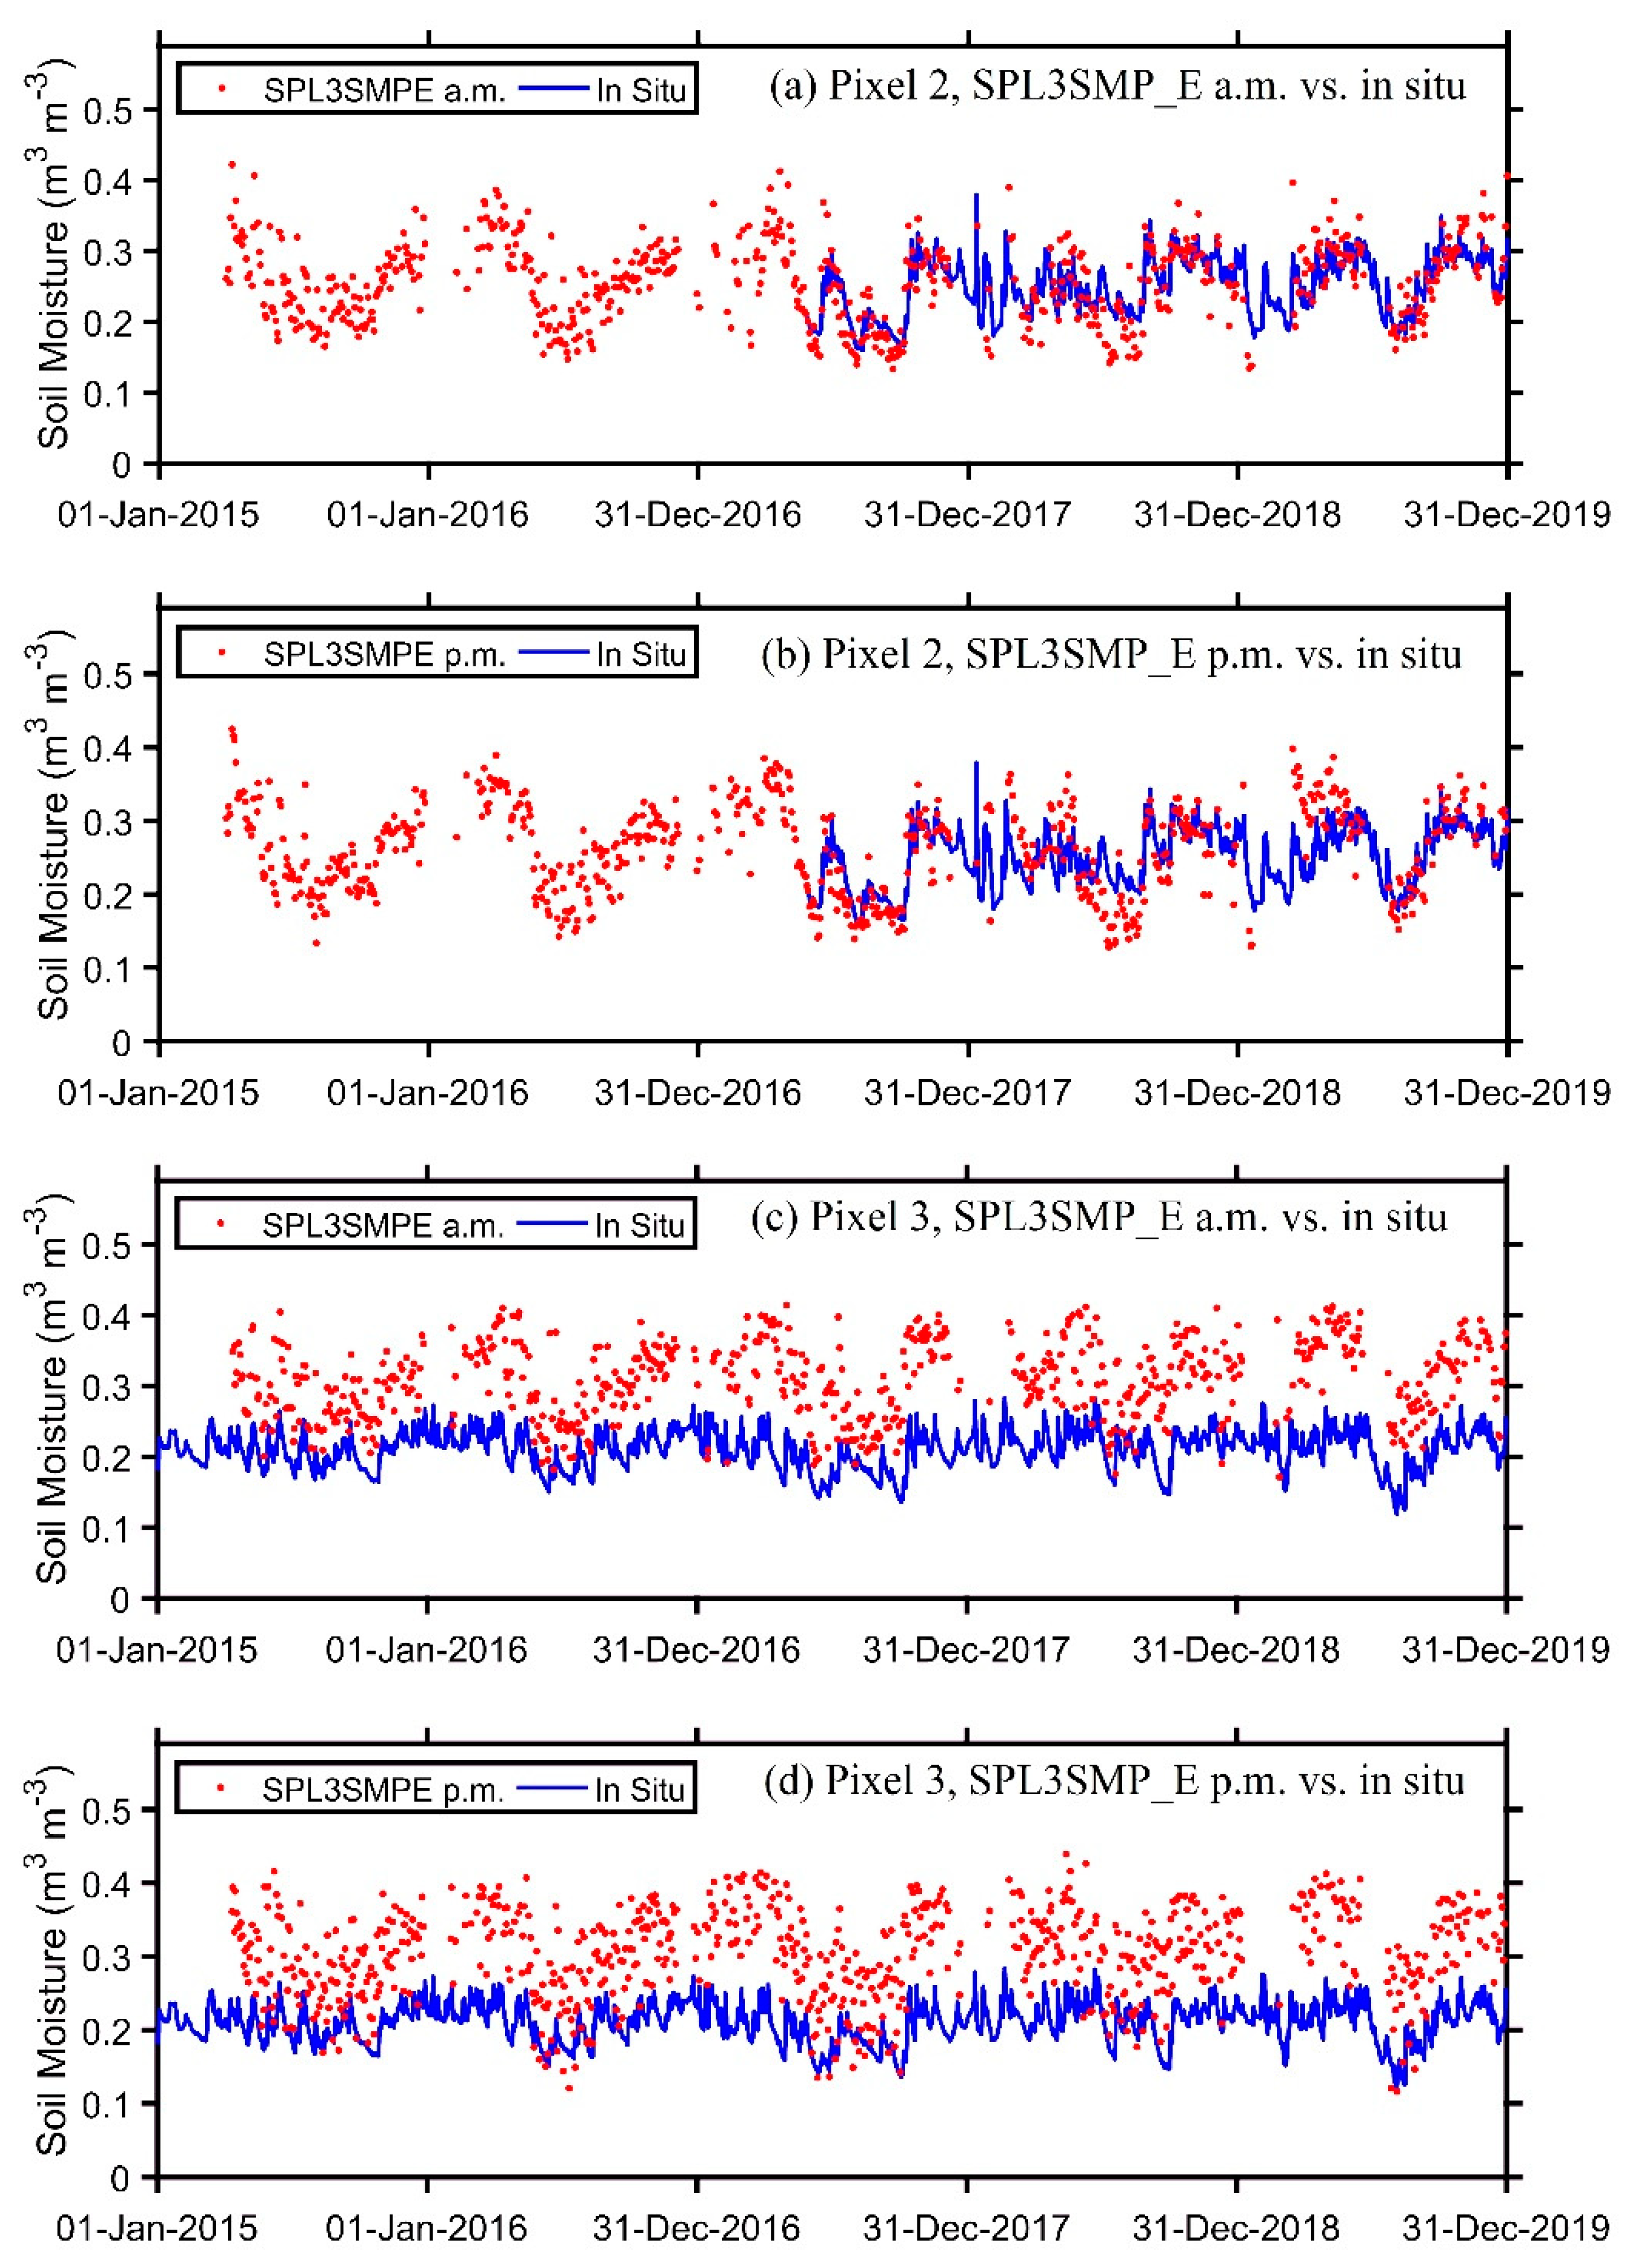
Figure 8.
Verification scores (ubRMSE (a,d); R (b,e); and anomaly R (c,f)) at the two individual 36-km reference pixels: Pixel 2 (black) and Pixel 3 (red) for the SPL3SMP_E (top) a.m. and (bottom) p.m. soil moisture retrievals. Error bars indicate the 95% confidence intervals.
Figure 8.
Verification scores (ubRMSE (a,d); R (b,e); and anomaly R (c,f)) at the two individual 36-km reference pixels: Pixel 2 (black) and Pixel 3 (red) for the SPL3SMP_E (top) a.m. and (bottom) p.m. soil moisture retrievals. Error bars indicate the 95% confidence intervals.
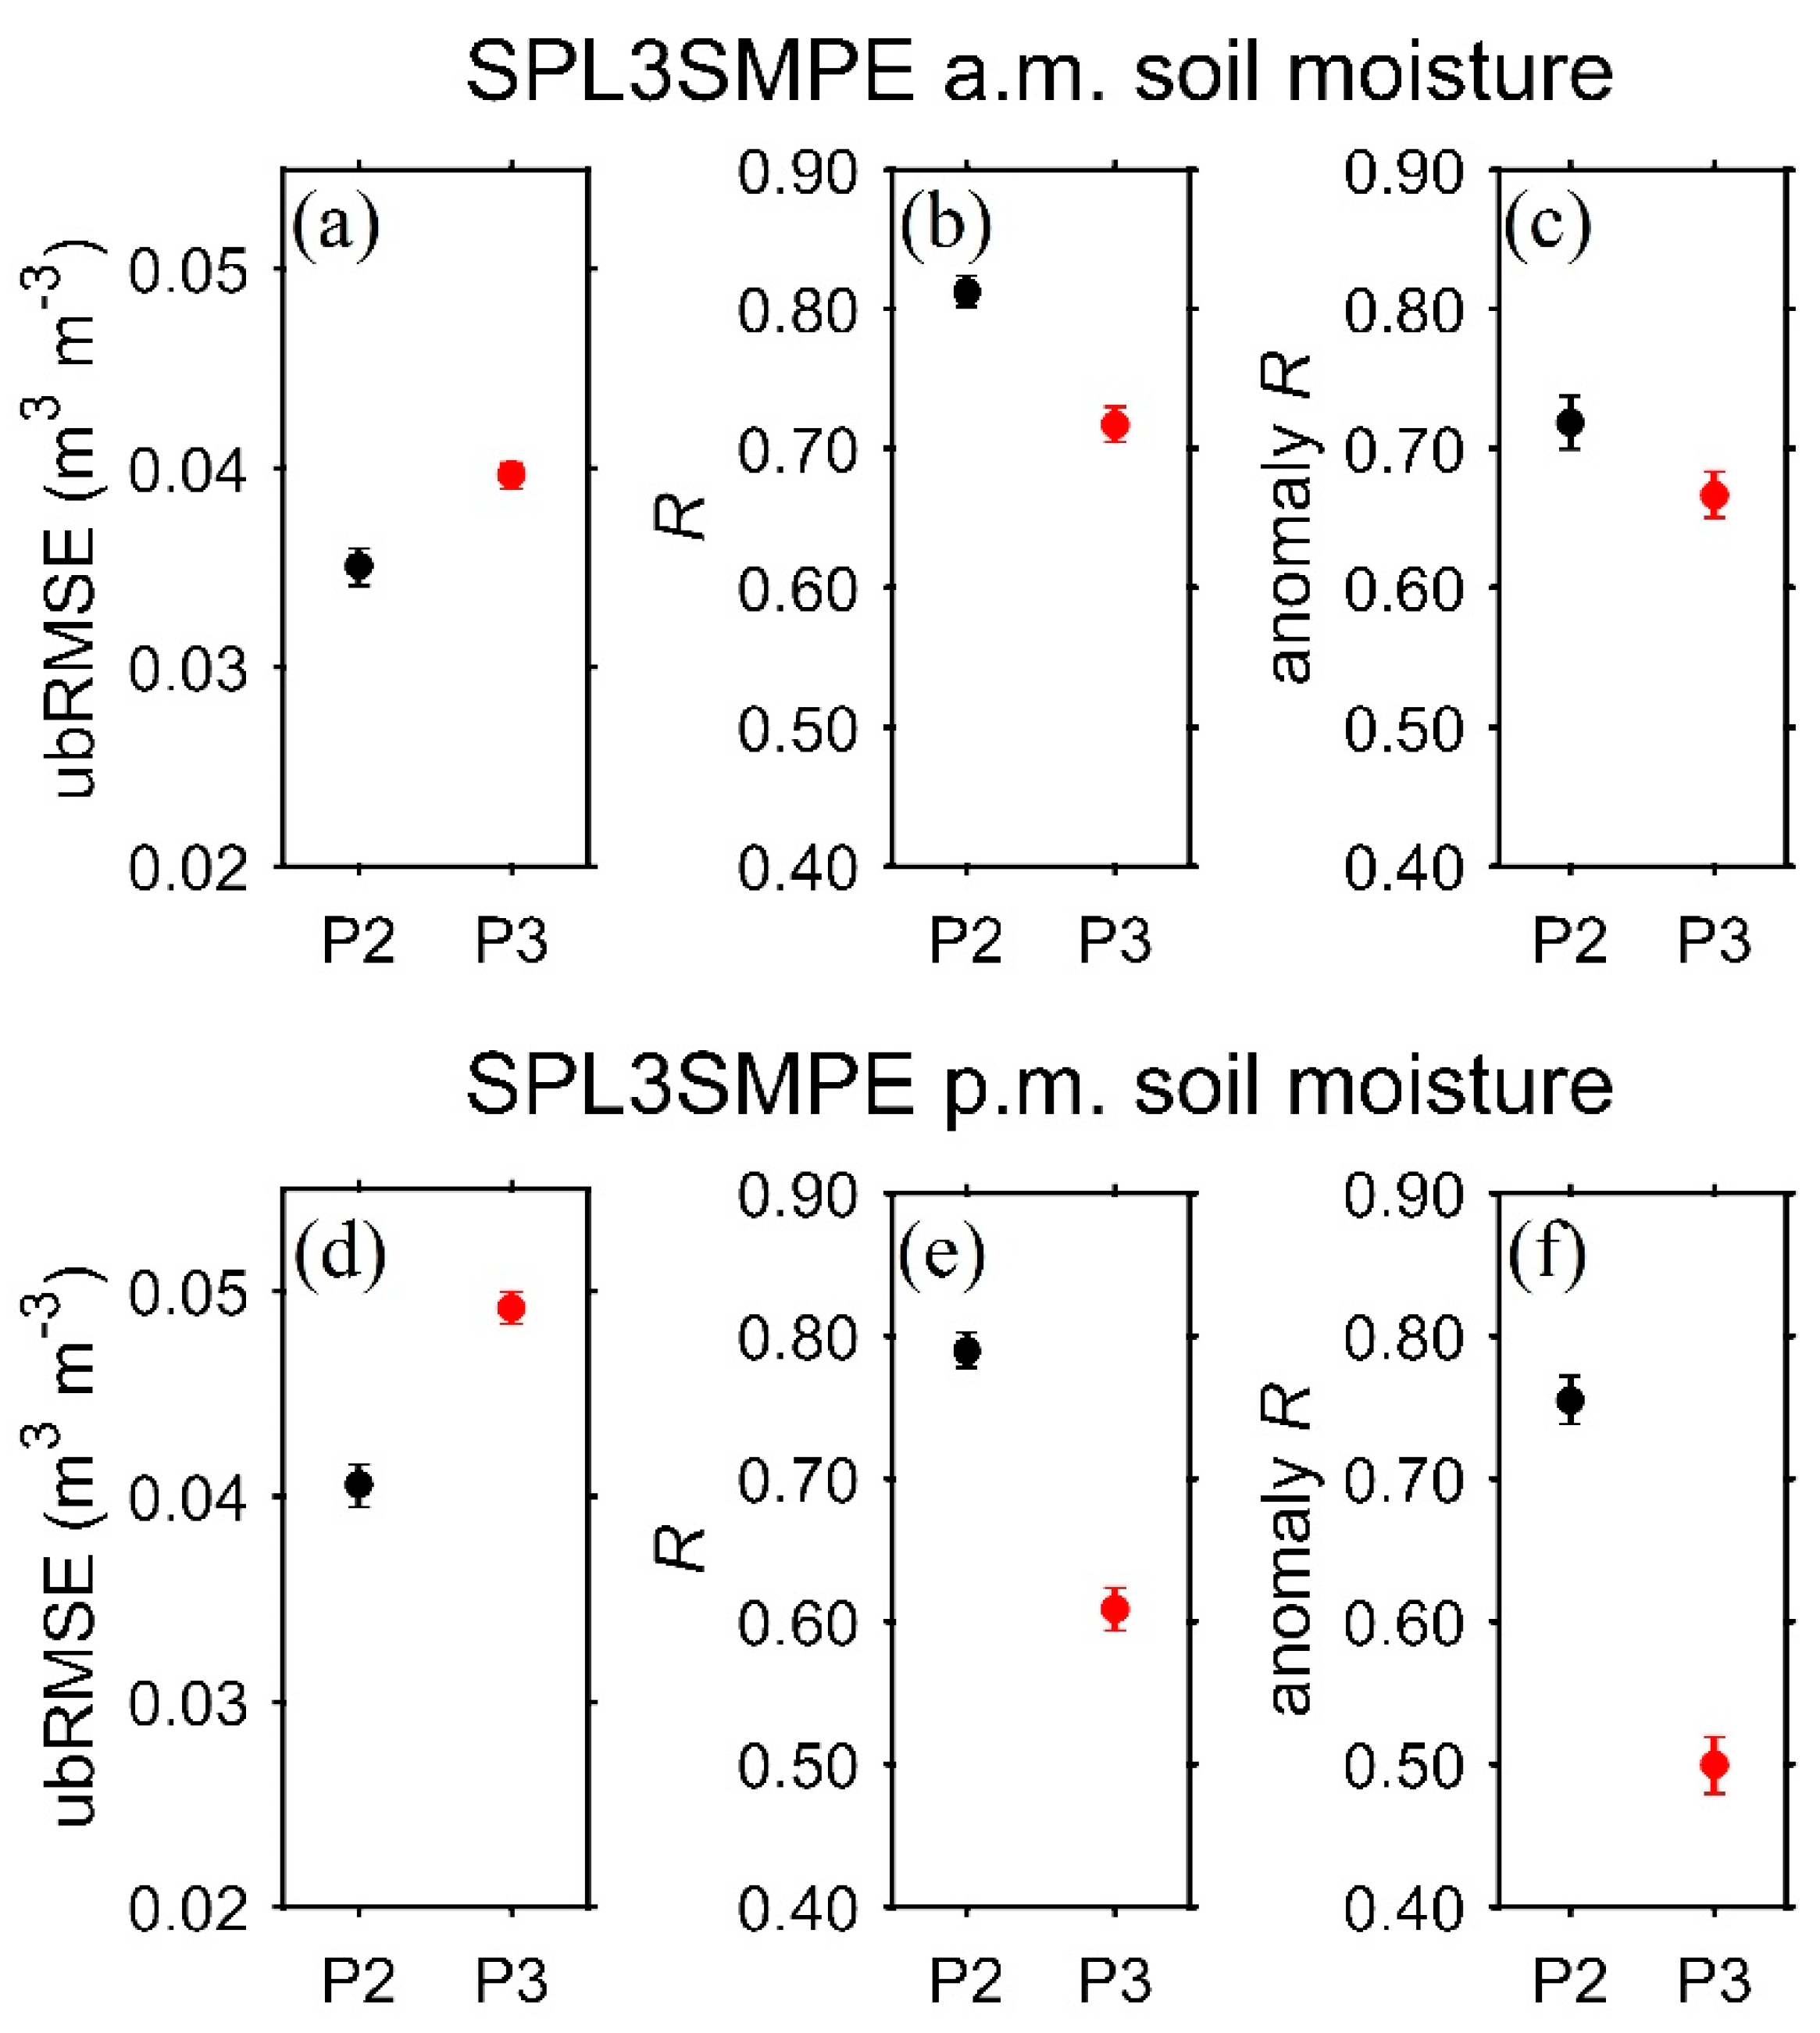
Figure 9.
The ubRMSE at the individual validation stations (67 in total) for the SPL3SMP_E (a) a.m. and (b) p.m. soil moisture retrievals.
Figure 9.
The ubRMSE at the individual validation stations (67 in total) for the SPL3SMP_E (a) a.m. and (b) p.m. soil moisture retrievals.

Figure 10.
The same as Figure 9, but for the anomaly R.
Figure 10.
The same as Figure 9, but for the anomaly R.
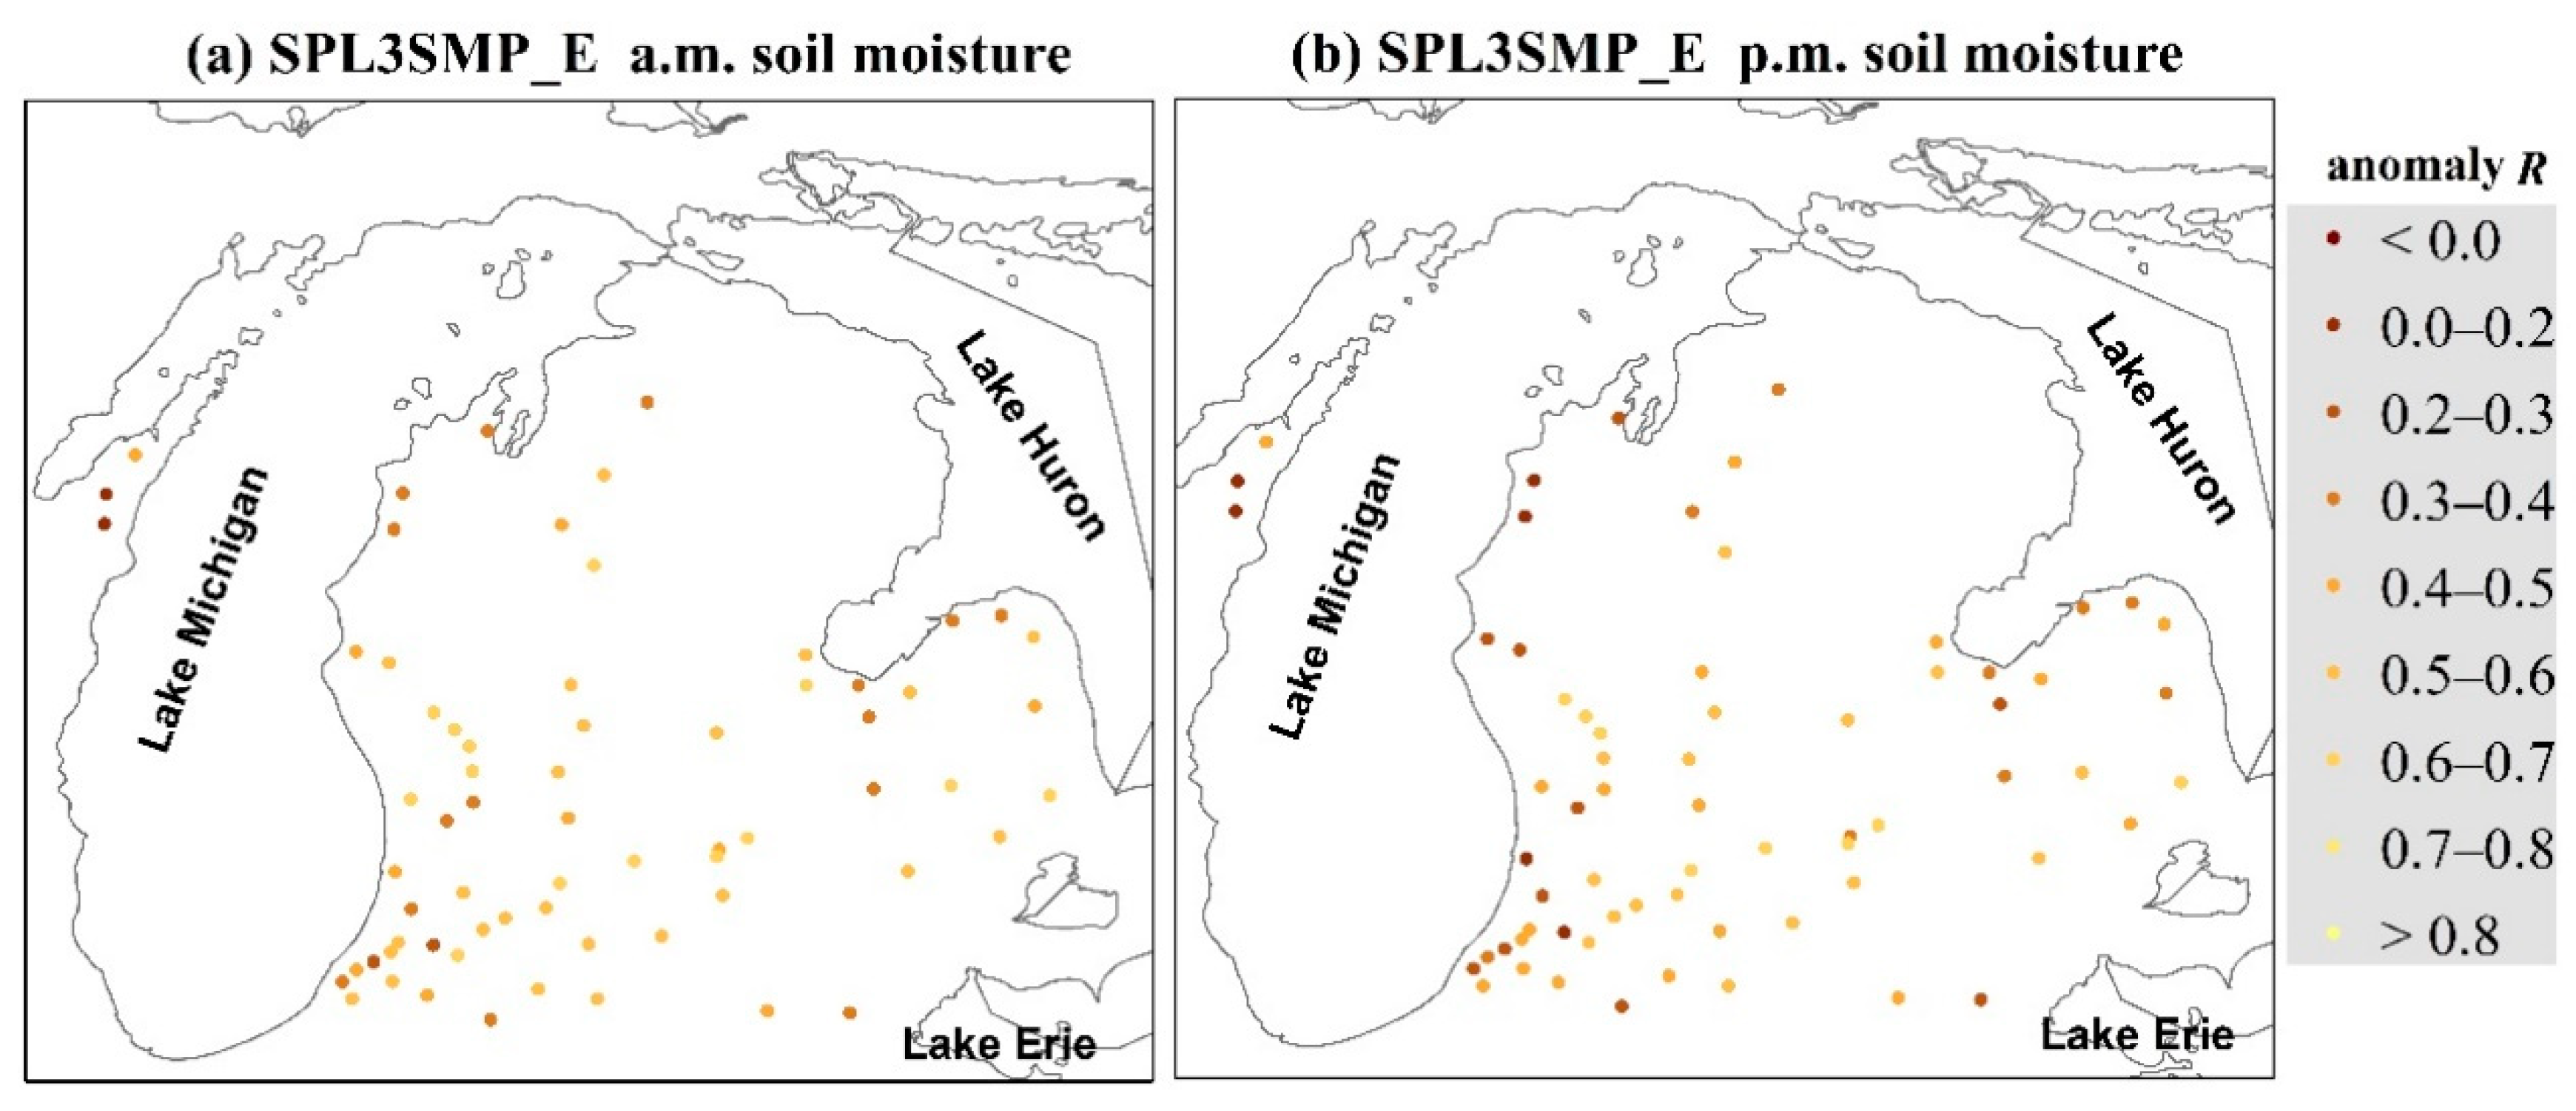
Figure 11.
The averaged (across 67 validation sites) metrics ((a) ubRMSE; (b) R; and (c) anomaly R) for the SPL3SMP_E a.m. (black), p.m. (red), and a.p.m. (blue) soil moisture retrievals. Error bars denote 95% confidence intervals.
Figure 11.
The averaged (across 67 validation sites) metrics ((a) ubRMSE; (b) R; and (c) anomaly R) for the SPL3SMP_E a.m. (black), p.m. (red), and a.p.m. (blue) soil moisture retrievals. Error bars denote 95% confidence intervals.

Figure 12.
The ubRMSE difference (a) and the anomaly R difference (b) between the SPL3SMP_E a.m. soil moisture and SPL4SMAU surface soil moisture (daily composite of only the nearest 3-h data at 6 a.m. LST) at the individual validation stations (67 in total). The metrics are computed using the daily composite time series over only the days and sites for which the SPL3SMP_E a.m., SPL4SMAU surface, and in situ data are all available.
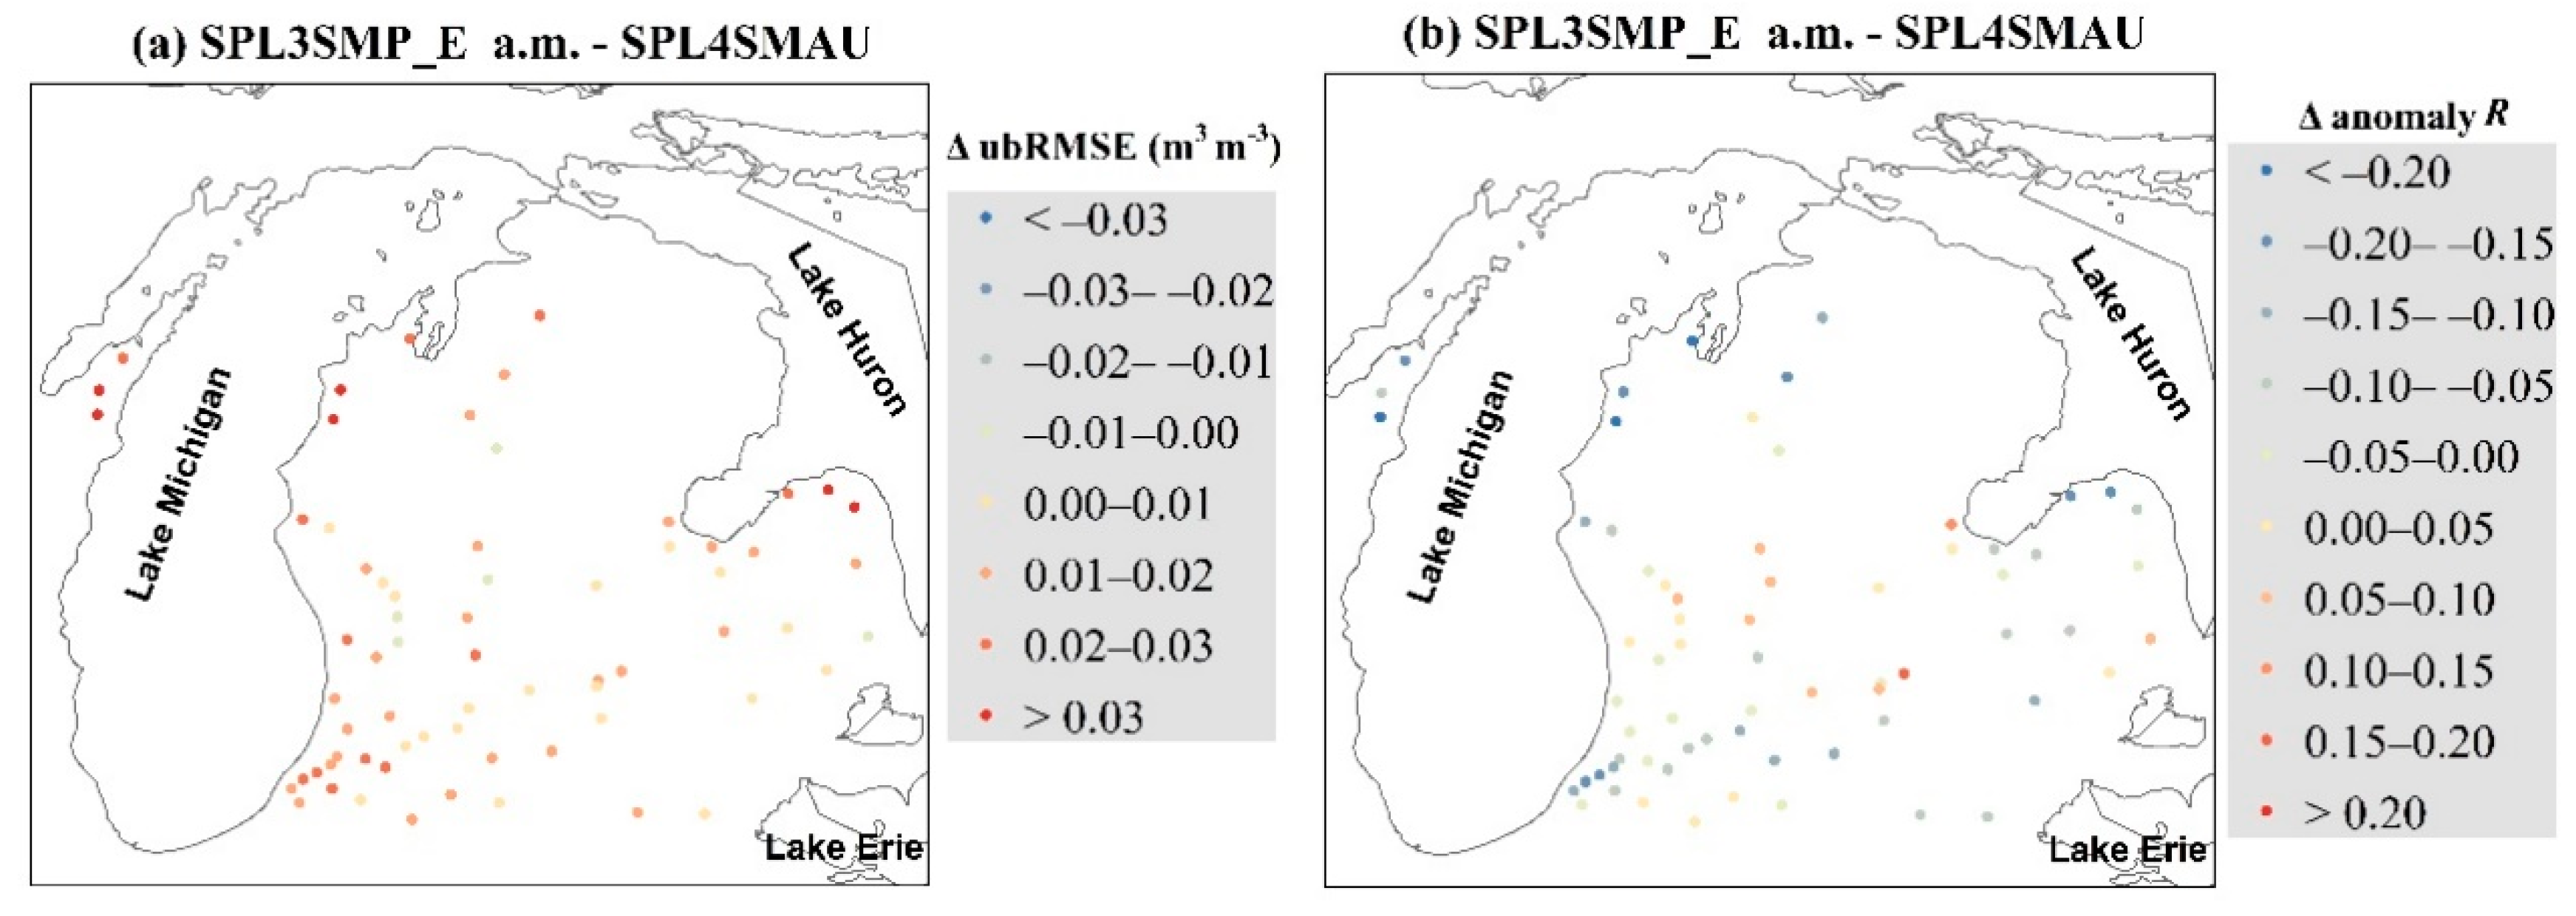
Figure 13.
The averaged (across 67 common validation sites) metrics comparison ((a) ubRMSE; and (b) anomaly R) for three pairs of SMAP soil moisture estimates: the SPL3SMP_E a.m. (magenta) vs. SPL4SMAU surface daily composite of only the nearest 3-h data at 6 a.m. LST (black); the SPL3SMP_E p.m. (magenta) vs. SPL4SMAU surface daily composite of only the nearest 3-h data at 6 p.m. LST (black); and the SPL3SMP_E blended a.m. and p.m. soil moisture retrievals (blue) vs. SPL4SMAU surface soil moisture daily composite of the data at 6 a.m. and 6 p.m. LST (black). Error bars denote 95% confidence intervals.
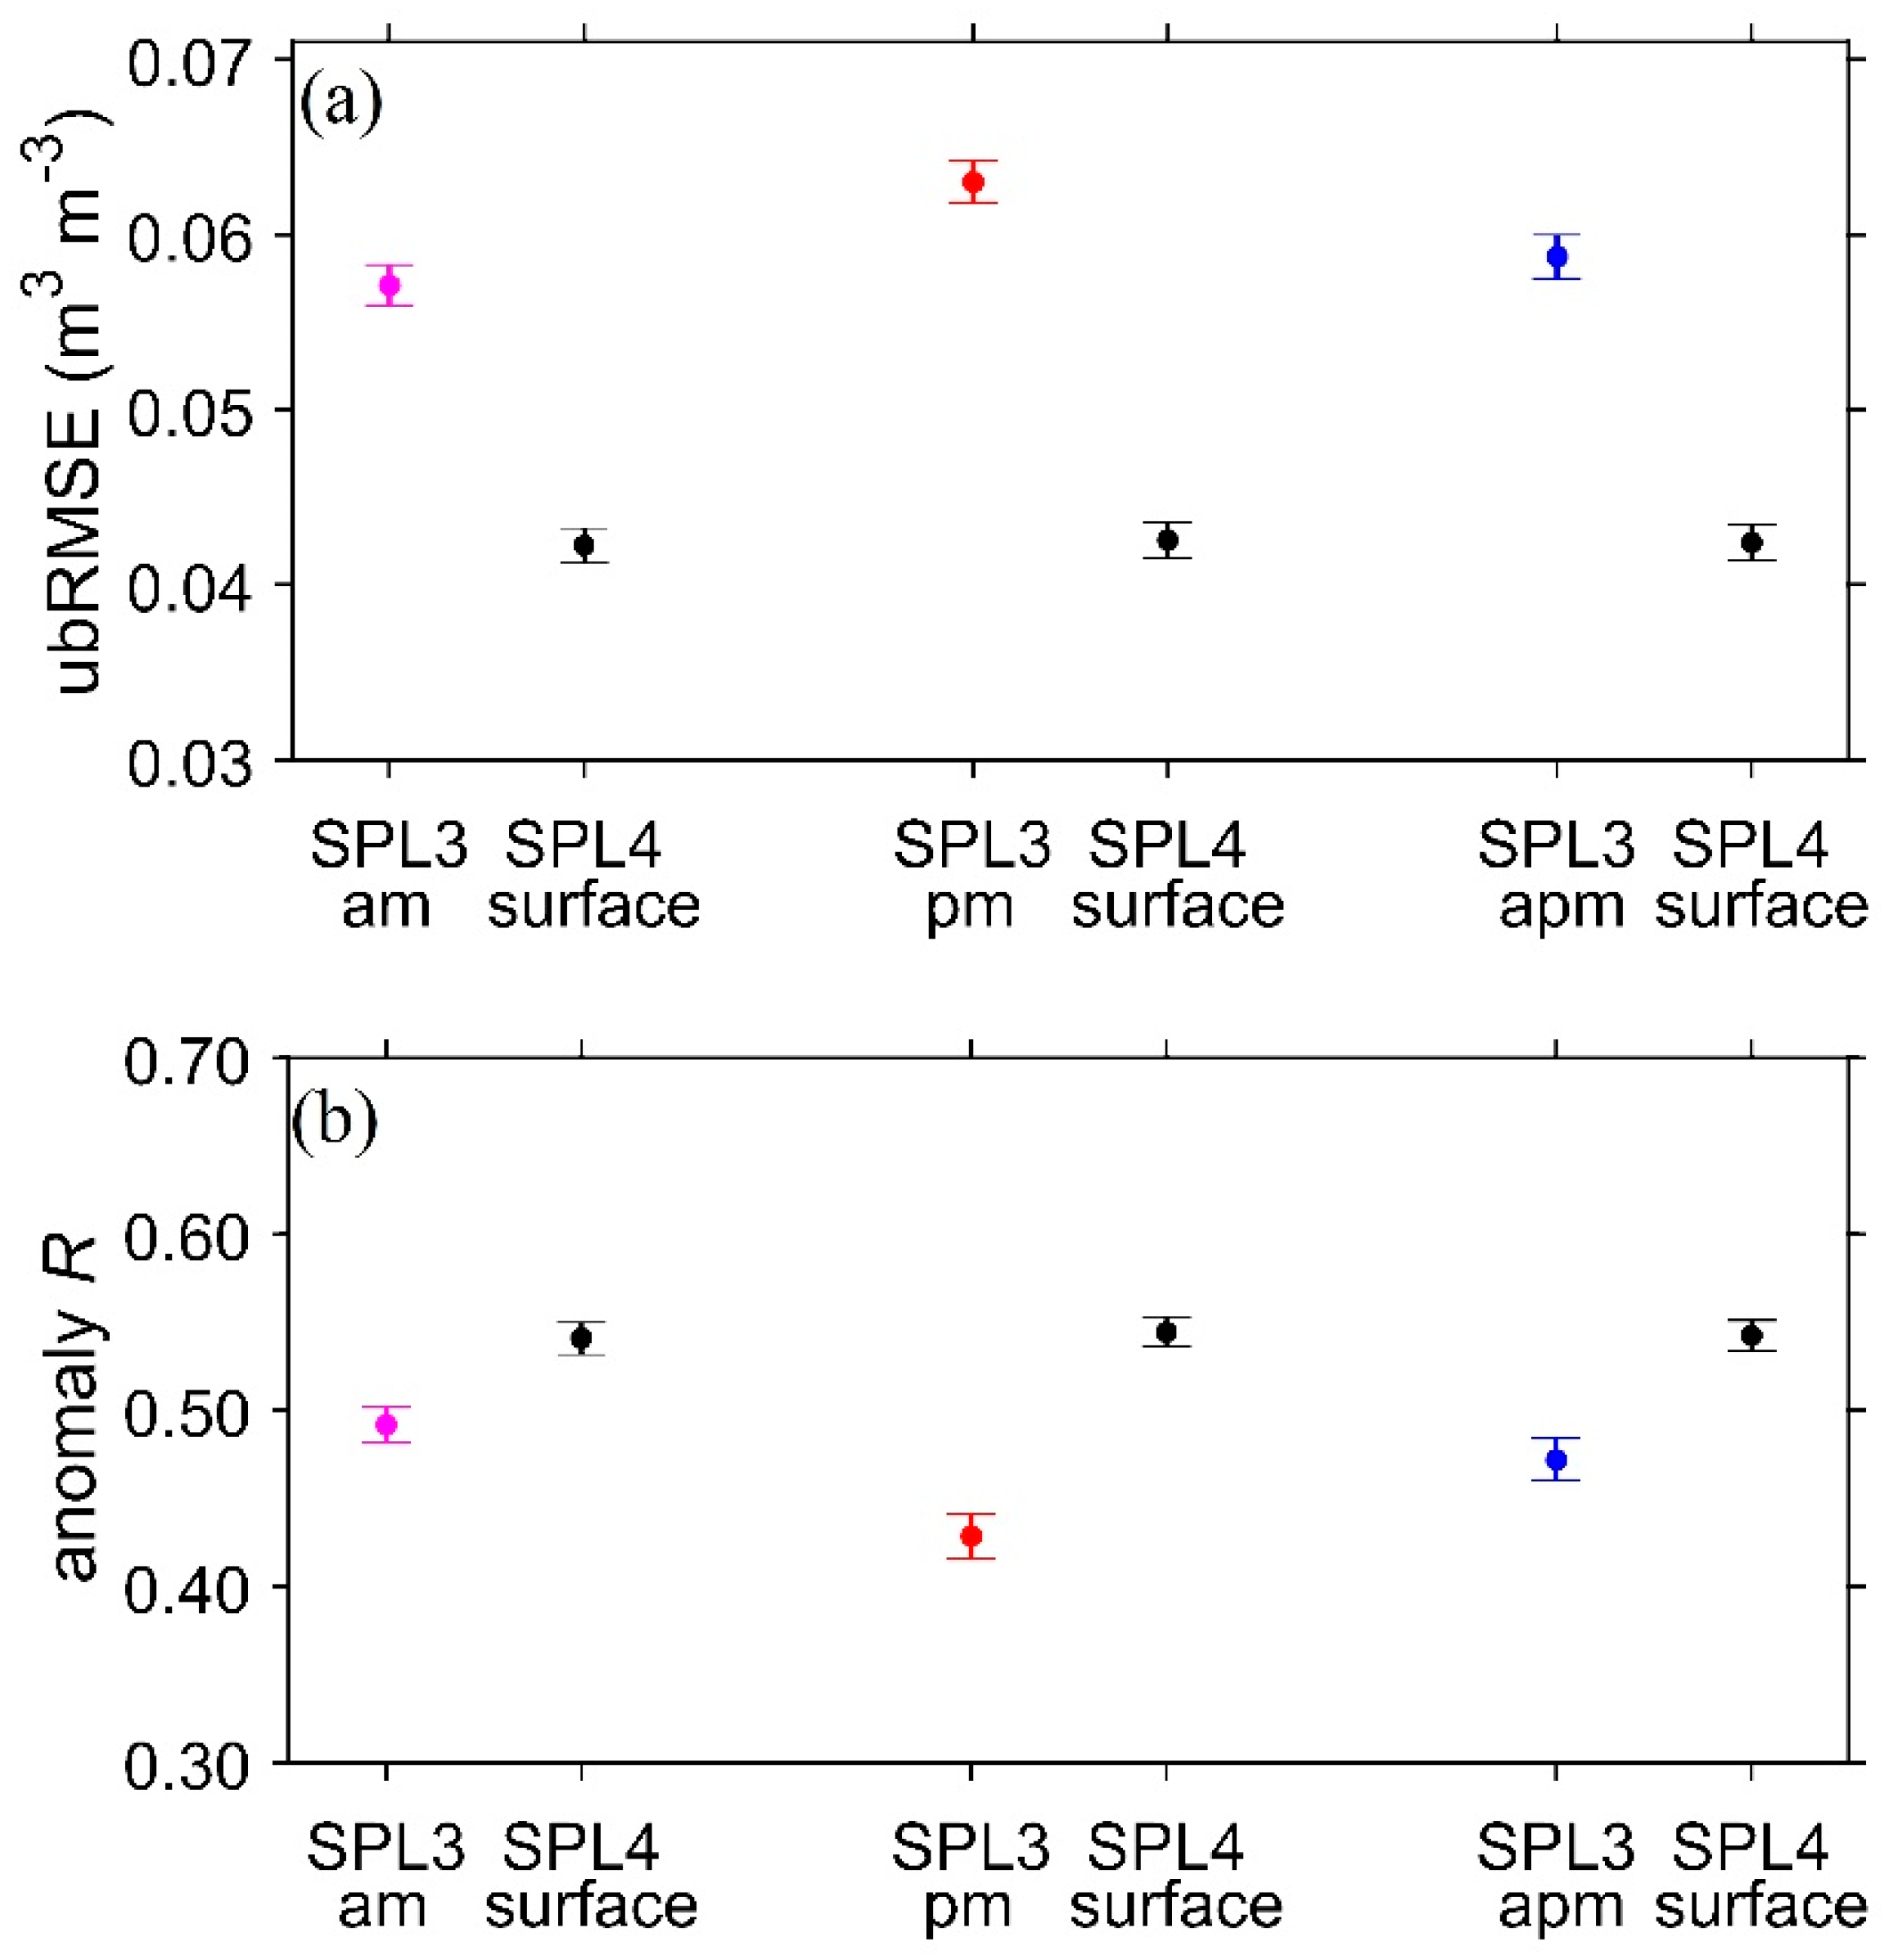
Figure 14.
(a) The ubRMSE values at the individual validation stations (45 in total) for the SPL2SMAP_S baseline algorithm-derived 3-km a.m. soil moisture. (b) The ubRMSE values at the individual validation stations (43 in total) for the SPL2SMAP_S baseline algorithm-derived 1-km a.m. soil moisture. Location of the major cities (crosses) in the study area are also shown.
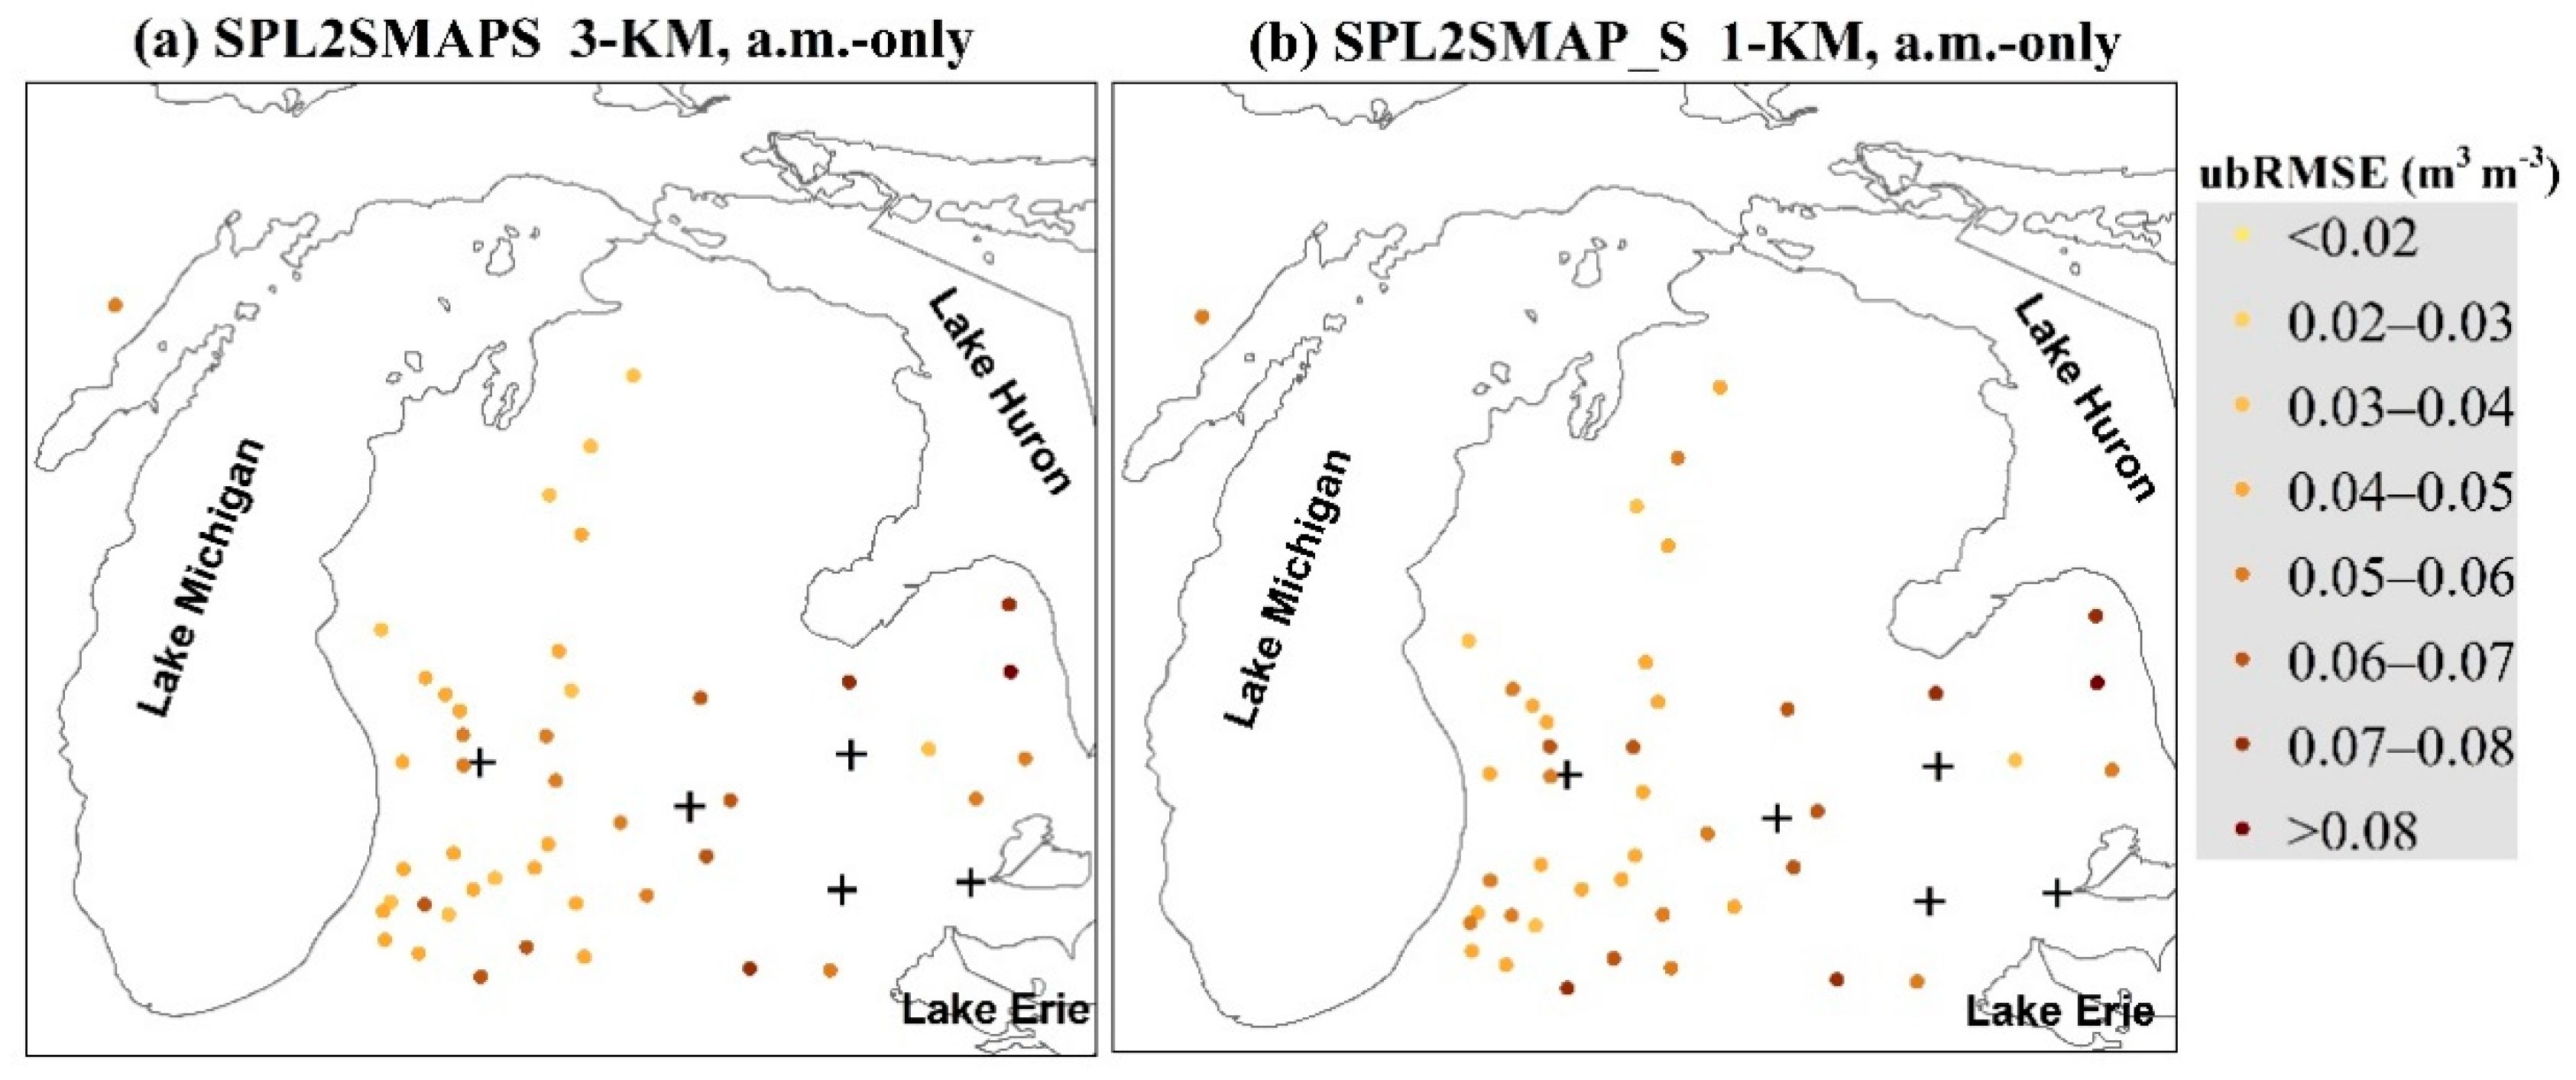
Figure 15.
The average ubRMSE (a) for the four sets of SPL2SMAP_S 3-km soil moisture retrievals: the baseline algorithm-derived a.m. (black), the Option 1-based a.m. (red), the baseline algorithm-derived a.p.m. (blue), and the Option 1-based a.p.m. (magenta), respectively. (b) As in (a), but for the averaged R values. (c,d) As in (a,b), respectively, but for the four sets of SPL2SMAP_S 1-km soil moisture retrievals. Error bars denote 95% confidence intervals.
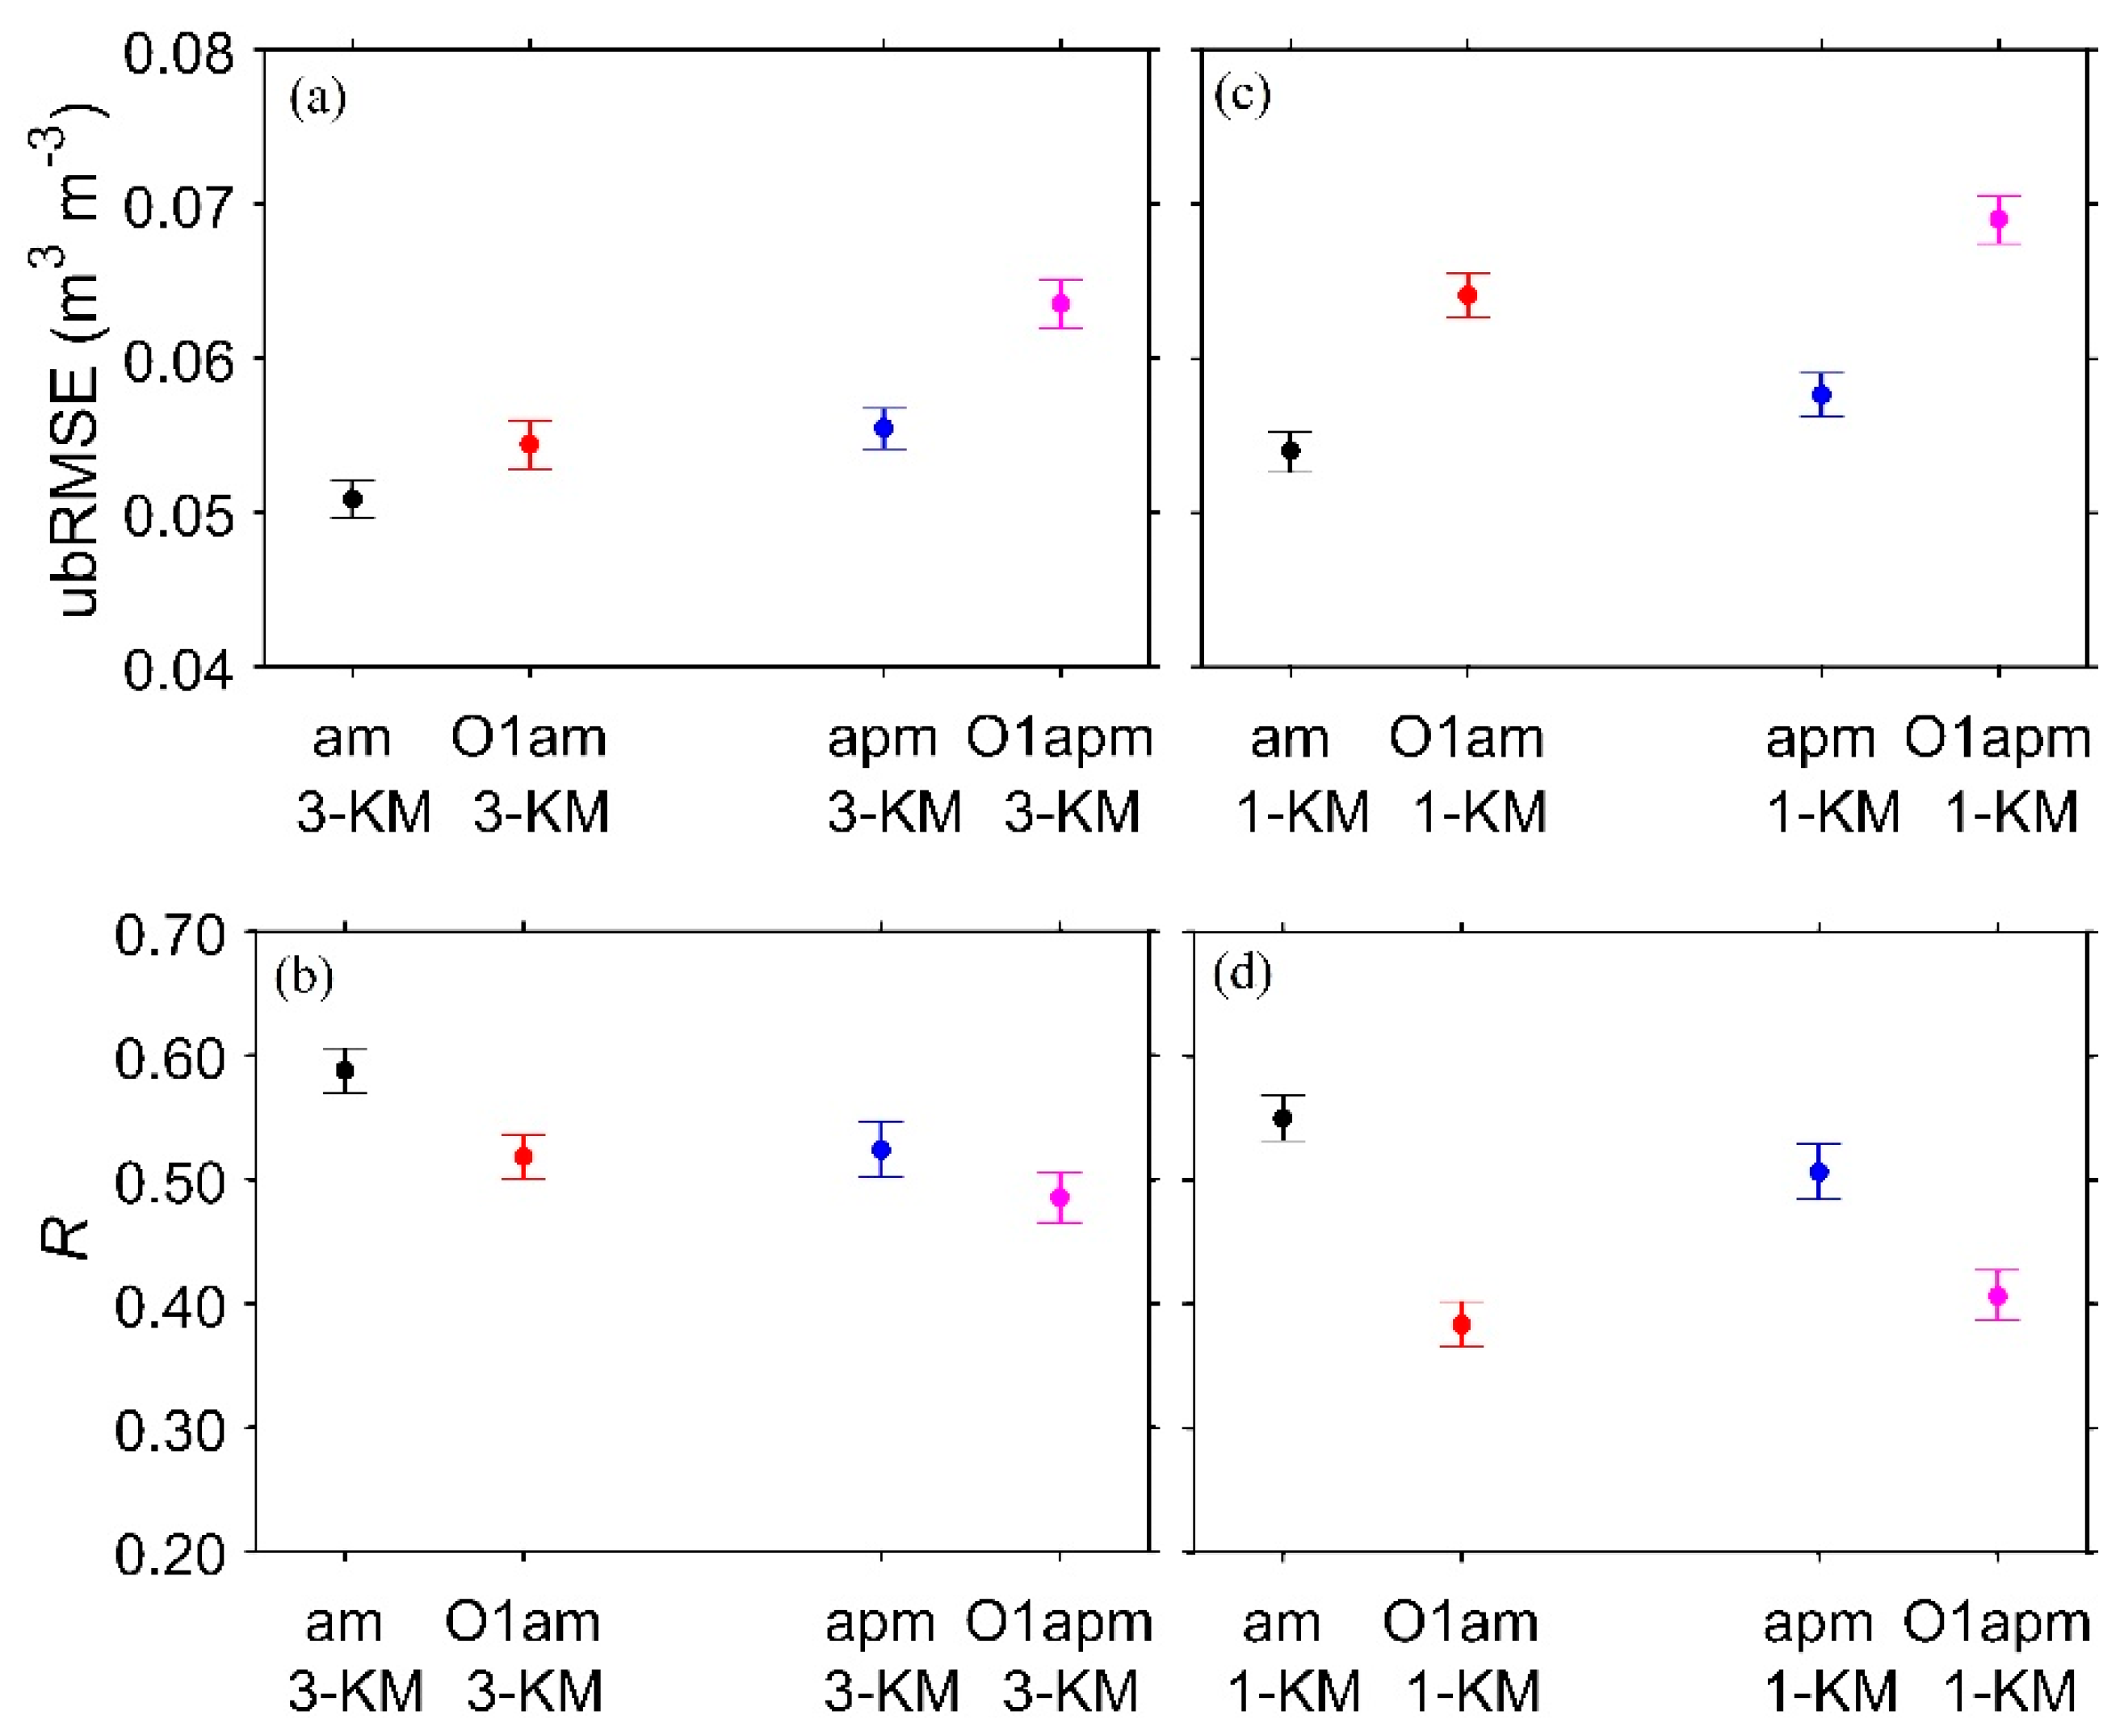
Figure 16.
(a) Daily soil moisture time series comparison of (red dots) the SPL3SMP_E 9-km a.m., (blue plus) SPL2SMAP_S 3-km a.m., and (black line) in situ measurements (daily composite of the 6 a.m. LST data) at a single station located at 42.56°N, ‒85.30°E. (b) As in (a), except that the SPL2SMAP_S 3-km a.m. is replaced with (blue crosses) the SPL2SMAPS 1-km a.m. (c,d) As in (a,b), respectively, but for the soil moisture time series comparison at a different site (43.25°N, ‒85.77°E.).

Figure 17.
The averaged metrics (across 42 common validation sites) comparison ((a) ubRMSE; and (b) R) between the SPL3SMP_E 9-km a.m. soil moisture (black), SPL2SMAP_S 3-km a.m. soil moisture (red), and SPL2SMAP_S 1-km a.m. soil moisture (blue). The metrics are computed using the daily composite time series over only the days and sites for which the three sets of soil moisture estimates, as well as in situ measurements, are all available. Error bars denote 95% confidence intervals.

Publisher’s Note: MDPI stays neutral with regard to jurisdictional claims in published maps and institutional affiliations. |
© 2020 by the author. Licensee MDPI, Basel, Switzerland. This article is an open access article distributed under the terms and conditions of the Creative Commons Attribution (CC BY) license (http://creativecommons.org/licenses/by/4.0/).
Share and Cite
MDPI and ACS Style
Xu, X. Evaluation of SMAP Level 2, 3, and 4 Soil Moisture Datasets over the Great Lakes Region. Remote Sens. 2020, 12, 3785. https://doi.org/10.3390/rs12223785
AMA Style
Xu X. Evaluation of SMAP Level 2, 3, and 4 Soil Moisture Datasets over the Great Lakes Region. Remote Sensing. 2020; 12(22):3785. https://doi.org/10.3390/rs12223785
Chicago/Turabian StyleXu, Xiaoyong. 2020. "Evaluation of SMAP Level 2, 3, and 4 Soil Moisture Datasets over the Great Lakes Region" Remote Sensing 12, no. 22: 3785. https://doi.org/10.3390/rs12223785
Note that from the first issue of 2016, this journal uses article numbers instead of page numbers. See further details here.