Article

Fusion of High- and Medium-Resolution Optical Remote Sensing Imagery and GlobeLand30 Products for the Automated Detection of Intra-Urban Surface Water

1
China Center for Resources Satellite Data and Application, Beijing 100094, China
2
State Key Laboratory of Resources and Environmental Information System, Institute of Geographic Sciences and Natural Resources Research, Chinese Academy of Sciences, Beijing 100101, China
3
University of Chinese Academy of Sciences, Beijing 100049, China
4
Jiangsu Centre for Collaborative Innovation in Geographical Information Resource Development and Application, Nanjing 210023, China
*
Author to whom correspondence should be addressed.
Remote Sens. 2020, 12(24), 4037; https://doi.org/10.3390/rs12244037
Submission received: 7 November 2020 / Revised: 6 December 2020 / Accepted: 8 December 2020 / Published: 9 December 2020
(This article belongs to the Special Issue Understanding Urban Systems Using Remote Sensing)

Abstract

:
Intra-urban surface water (IUSW) is an indispensable resource for urban living. Accurately acquiring and updating the distributions of IUSW resources is significant for human settlement environments and urban ecosystem services. High-resolution optical remote sensing data are used widely in the detailed monitoring of IUSW because of their characteristics of high resolution, large width, and high frequency. The lack of spectral information in high-resolution remote sensing data, however, has led to the IUSW misclassification problem, which is difficult to fully solve by relying only on spatial features. In addition, with an increasing abundance of water products, it is equally important to explore methods for using water products to further enhance the automatic acquisition of IUSW. In this study, we developed an automated urban surface-water area extraction method (AUSWAEM) to obtain accurate IUSW by fusing GaoFen-1 (GF-1) images, Landsat-8 Operational Land Imager (OLI) images, and GlobeLand30 products. First, we derived morphological large-area/small-area water indices to increase the salience of IUSW features. Then, we applied an adaptive segmentation model based on the GlobeLand30 product to obtain the initial results of IUSW. Finally, we constructed a decision-level fusion model based on expert knowledge to eliminate the problem of misclassification resulting from insufficient information from high-resolution remote sensing spectra and obtained the final IUSW results. We used a three-case study in China (i.e., Tianjin, Shanghai, and Guangzhou) to validate this method based on remotely sensed images, such as those from GF-1 and Landsat-8 OLI. We performed a comparative analysis of the results from the proposed method and the results from the normalized differential water index, with average kappa coefficients of 0.91 and 0.55, respectively, which indicated that the AUSWAEM improved the average kappa coefficient by 0.36 and obtained accurate spatial patterns of IUSW. Furthermore, the AUSWAEM displayed more stable and robust performance under different environmental conditions. Therefore, the AUSWAEM is a promising technique for extracting IUSW with more accurate and automated detection performance.

Graphical Abstract

1. Introduction

As the global urbanization process generally accelerates, urban landscape patterns are changing more and more frequently, which has an important impact on the life, environment, and development of different regions of the world [1]. Among them, intra-urban surface water, closely related to human habitation and ecosystem services, as an important indicator of urban landscape patterns, plays an important role in urban water resource management [2,3], urban greening construction [4,5], urban heat island effect regulation [6], and urban flood disaster prevention [7]. Therefore, the rapid and accurate acquisition of intra-urban surface water (IUSW) area information is crucial for the sustainable urban development.
With the development and application of remote sensing satellites, remote sensing technology has become an important way to monitor urban surface water [8]. A variety of remote sensing sensors were applied for water surface area extraction, such as synthetic aperture radar [9], LIDAR [10], and medium- and high-spatial-resolution optical satellite images [11,12]. Among them, high spatial resolution optical satellite images are characterized by high spatial resolution, a broad width, a short replay period, and easy access, and thus they have the ability to finely express urban surface water and identify small water bodies (such as small canals or artificial ponds) [13]. Therefore, high-resolution remote sensing images have become the main data source for IUSW monitoring [14,15,16].
Many previous studies have proposed a variety of optical image extraction methods for water bodies, which can be summarized into five basic methods as follows: (1) single-band threshold segmentation [17,18], (2) multiband spectral water indices [19,20,21,22], (3) supervised or unsupervised classification methods [23,24], (4) the linear un-mixing method [25,26], and (5) a combination of these methods [27]. Among these approaches, the combination of multiband spectral water indices and threshold segmentation is the most popular method because it is easy to use and saves time [28,29].
As far as multiband spectral water indices are concerned, a series of water indices, such as the normalized difference water index (NDWI) [19], modified normalized difference water index (MNDWI) [20], automatic water extraction index (AWEI) [21], water index 2015 (WI2015) [30], and multi-band water index (MBWI) [31] have been developed and play an important role in water monitoring. However, the commonly used high-resolution remote sensing data lack mid-infrared bands, which has limited the number of applicable water body indices, leading to commission problems because of insufficient spectral information. Although many studies have made use of the rich spatial features in high-resolution remote sensing images, such as geometry, morphology, texture, contextual features, to compensate for the lack of high-resolution remote sensing spectral features and to improve the overall accuracy [32,33]. However, due to the complexity and diversity of urban scenes, as well as the differences between cities, it is difficult to fully solve the commission problem caused by insufficient spectral information by relying only on the spatial information provided by high-resolution remote sensing. In addition, the morphological diversity of urban surface water exhibits large spatial variability in high-resolution images, and although current studies have developed multi-scale and multi-morphological spatial features [34,35], the determination of parameters in the features limits the expression of different types of IUSW, which affects the accuracy of IUSW extraction. Therefore, further fusion into spectral information in high-resolution remote sensing images and construction of spatial features based on different types of IUSWs become the key to improve the extraction accuracy of IUSWs.
In terms of threshold segmentation, the use of a priori information products as samples to participate in the threshold segmentation model can achieve the automatic extraction of target information [36,37,38]. Water body information products are derived primarily from low- and medium-resolution land cover information products, such as GlobeLand30, FROM-GLC, and GSWED, which are now playing an important role in the study of automatic extraction and updating of water body information by medium-resolution remote sensing [39,40]. The scale difference between water body information products and high-resolution remote sensing images, however, reduces their reliability as sample information, thus affecting the accuracy of automatic IUSW extraction.
On the basis of summarizing and analyzing the existing IUSW literatures [10,32,33,41,42], this paper suggests that there are still three issues that need to be further addressed, and the comprehensive solution through the three issues is reflected in the contribution of this paper:
  • A technique is proposed to fuse the abundant water indices in the spectral dimension into high-resolution remote sensing images in order to solve the commission problem caused by insufficient spectral information to extract IUSW from high spatial resolution images.
  • According to the morphological differences of IUSWs, IUSWs are classified into two types of IUSWs, and corresponding spatial features are constructed for both types of IUSWs, thus alleviating the problem that one spatial feature cannot fully represent different morphological types of IUSWs and enhancing the saliency of IUSW features.
  • Optimized samples from available water products are automatically obtained and used in the IUSW automatic extraction method, thus reducing the uncertainty of a priori information products, and enabling the automatic detection of IUSW with high accuracy.
To this end, this study introduced an automatic surface-water area extraction method (AUSWAEM) for IUSW using a combination of GaoFen-1, Landsat-8 OLI, and GlobeLand30 data. Three main aspects were included: (1) the development of a morphological large/small area water index (MLWI/MSWI), (2) the construction of an adaptive threshold segmentation method based on the GlobeLand30 product, and (3) a decision-level fusion model based on expert knowledge. This manuscript is structured as follows. Section 2 describes the study area (Tianjin, Shanghai, and Guangzhou, China) and the multisource data collection. Section 3 details the AUSWAEM model framework proposed to obtain the IUSW. In Section 4, the proposed method is implemented in the study area, and the results are analyzed and discussed. Finally, the results of this study are discussed and summarized in Section 5 and Section 6, respectively.

2. Study Area and Datasets

The study areas included three coastal mega-cities in China: Tianjin, Shanghai, and Guangzhou (Figure 1). China is undergoing rapid urbanization, especially in coastal cities, where more rapid economic development has led to dramatic changes in urban landscape patterns and more frequent changes in urban water bodies [43]. At the same time, these areas feature a wide spatial distribution, morphological diversity, and richness of surface waters that are representative. In addition, their visual noise is more informative as a result of complex and diverse land cover types, such as shadows and exposed land, which makes the study area somewhat challenging. Therefore, we focused on extracting water information from the three study areas to validate the feasibility of the present research methodology.
In this study, we selected three GF-1 images and Landsat-8 OLI images featuring different environments, such as lakes, rivers, reservoirs, and ponds, in China to verify the feasibility of the AUSWAEM. The GF-1 satellite was equipped with two 60-km wide high-spatial-resolution sensor cameras (GF-1/PMS1 and GF-1/PMS2). The data collected by the GF-1/PMS camera consisted of a panchromatic band with a spatial resolution of 2 m and four multispectral bands (blue, green, red, and near-red bands) with a spatial resolution of 8 m [44]. We acquired the three Landsat-8 OLI L1T products in the study areas from the U.S. Geological Survey (USGS) website (https://glovis.usgs.gov/app). The data details of the three image scenes are listed in Table 1, and the GF-1 images, as well as the corresponding ground truth references for the study areas, are described in Figure 1.
We manually delineated the ground truth maps based on careful visual interpretation of the GF-1 data and a field campaign in the study area. In addition, the initial samples of the urban surface-water area were provided by the water body types of the GlobeLand30 (2010) product data, which has a water body type accuracy of 80% [45,46,47]. The GlobeLand30 dataset was produced by the National Basic Geographic Information of China using Landsat multispectral data and pixel object knowledge techniques and downloaded from the GLOBELAND30 website (http://www.globallandcover.com/GLC30Download/index.aspx).

3. Methods

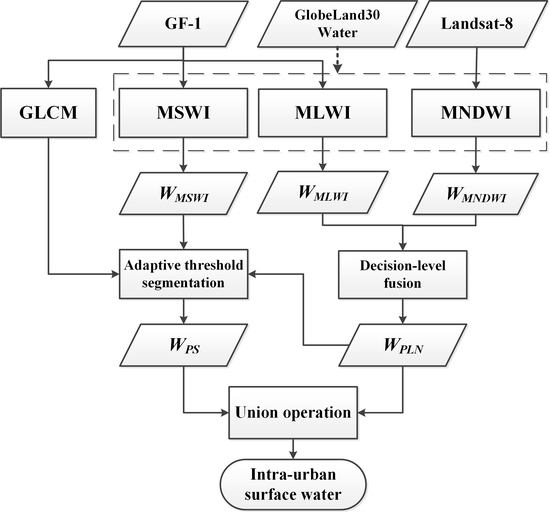
The automated detection of IUSW extraction methodology of AUSWAEM was established (Figure 2). First, the GF-1 and Landsat-8 images were preprocessed to generate a 2 m GF-1 primary image product and a 15 m Landsat-8 primary image product, respectively. See Section 3.1 for a detailed description. Second, the MLWI and MSWI were constructed from the GF-1 primary data product, and the MNDWI index was calculated from the Landsat-8 OLI primary data product. Then, based on the adaptive segmentation model of the GlobeLand30 product, the constructed MLWI, MSWI, and MNDWI water indices were threshold segmented separately to obtain the corresponding initial IUSW results. Finally, the decision-level fusion model was used to fuse the initial IUSW results to obtain the final IUSW results.

3.1. Preprocessing of GF-1 and Landsat-8 Images

The GF-1 images and Landsat-8 OLI data were preprocessed with ortho-rectification and fusion to improve the spatial accuracy and spatial resolution using ENVI 5.0 commercial software. In this study, the GF-1 images were ortho-rectification based on a rational polynomial coefficient (RPC) model (utilizing the RPC file in the system) and were fused using the Gram–Schmidt spectral sharpening method [48,49]. Thus, the GF-1 data primary product with 2 m spatial resolution was obtained.
On the basis of the polynomial model [50], the Landsat-8 OLI data were geometrically corrected using collected ground control points from GF-1 images with an average root-mean-square error of <0.4 pixels. To obtain a surface reflectance dataset from the Landsat-8 OLI data, we employed the fast line-of-sight atmospheric analysis of the spectral hypercube atmospheric correction algorithm [49]. On this basis, to obtain the 15 m Landsat-8 fusion data, the Landsat-8 multispectral data (30 m × 30 m pixel size) was fused with the Landsat-8 panchromatic data (15 m × 15 m pixel size) using the Gram–Schmidt spectral sharpening method [51].

3.2. Multiple Water Index Feature Extraction

3.2.1. MLWI/MSWI Extraction from GF-1 Imagery

Because of the morphological diversity of urban water in high-spatial-resolution remotely sensed images, it is difficult to represent the diversity of water bodies in built-up areas through a single water index. Therefore, in this study, we divided urban water bodies into two categories, namely, large-area water bodies (with water surface widths >10 m) and small-area water bodies (with water surface widths <10 m). We then proposed the MLWI/MSWI to describe the spectral–spatial properties of water using an extended morphological profile method based on the NDWI, which was characterized by a combination of the water body index and morphological information, thereby improving the recognition accuracy of different forms of water bodies in urban scenes. We used the NDWI to enhance water body information and suppress other types of information in remote sensing imagery [52]. To efficiently suppress the omission and correct inaccurate boundaries of water areas, however, we applied the extended morphology profiles (EMPs), which provided the shape and size information of all water elements present in high-resolution images, to enhance the traditional NDWI spectral features [53].
The MLWI and MSWI calculations were based on the NDWI index extracted from GF-1 images, to enhance the difference between water and non-water bodies in the spectral features. Then, based on the NDWI index feature information, we performed reconstruction and white top-hat operations using multiscale structural elements, to achieve further increases in the difference between global water body information and background values, as well as to enhance small water body profile information. On this basis, we performed averaging calculations to obtain the integrated expression results of the multiscale MCR and WTH feature sequences. Finally, we performed subtraction and addition calculations on the combined expression results to highlight the information of large and small water bodies. The calculation steps of the MLWI and MSWI were as follows: (1) calculation of NDWI: the NDWI image was generated using the green and near-infrared (NIR) bands using Equation (1); (2) morphology closing-by-reconstruction (MCR) and white top-hat (WTH) were employed using Equations (2) and (3), respectively; (3) the EMPs of the extended MCR and WTH were defined as expressed in Equations (4) and (5), respectively; (4) the mean of the EMPs was calculated as expressed in Equations (6) and (7); and (5) the MLWI and MSWI were calculated as expressed in Equations (8) and (9), respectively.
N D W I = ρ G r e e n ρ N I R ρ G r e e n + ρ N I R ,
where ρ G r e e n is a green band, such as GF-1 band 2, and ρ N I R is a near-infrared band, such as GF-1 band 4.
M C R ( r ) = ϕ N D W I r e ( r ) ,
W T H ( r ) = N D W I γ N D W I ( r ) ,
where ϕ N D W I r e ( r ) and γ N D W I ( r ) represent the closing-by-reconstruction and the opening of the NDWI image, respectively, and r indicates the radius of a circular structural element (SE).
E M P s M C R ( i , r Δ s ) = M C R ( i ) ( r Δ s ) ,
E M P s W T H ( i , r Δ s ) = W T H ( i ) ( r Δ s ) ,
where i indicates the number of MCR, and WTH is the interval of a circular SE.
E M P s M C R m e a n = i E M P s N D W I ( i , r Δ s ) i ,
E M P s W T H m e a n = i E M P s W T H ( i , r Δ s ) i ,
where E M P s M C R m e a n and E M P s W T H m e a n are defined as the means of the EMP profiles, since water exhibits large NDWI values at different multiscales.
M L W I = E M P s M C R m e a n E M P s W T H m e a n ,
M S W I = E M P s M C R m e a n + E M P s W T H m e a n ,
where MLWI and MSWI are defined as the addition and subtraction of the E M P s M C R m e a n and E M P s W T H m e a n , because they respectively increase the difference between a large-area water body and the background and between a small-area water body and the background. Consequently, large-area and small-area water bodies correspond to large MLWI and MSWI feature values.
Because of the diversity of water structures in the images, a single linear SE is difficult to fully describe. Therefore, in this study, we used a circular SE, which has a good shape presentation for all the elements in an image. The scale parameters i min , i max , and Δ i were set to 1, 21, and 1, respectively, based on the 2-m spatial resolution of the images. The parameters of i were determined by calculating the average diameters of various types of water bodies in the image. It was difficult, however, to select a suitable value of for complex urban scenes, due to the diversity of the water structures present in the images. We obtained the parameters used in this study by measuring and counting the water body information of the images in the study area and obtaining i through trial and error. Thus, the parameters of the determined MLWI/MSWI were relatively stable. The MLWI in Figure 3c enhanced the characteristics of large-area water bodies, while the MSWI in Figure 3d more effectively detected small-area water bodies.

3.2.2. MNDWI Extraction from Landsat-8 Imagery

To effectively solve the problem of mixing caused by the insufficient spectral information of GF-1 images, this study utilized MNDWI extraction based on Landsat-8 data to assist IUSW interpretation. In medium-resolution remote sensing images, the MNDWI can more effectively enhance the water features in regions with large amounts of built-up areas than the NDWI [20]. This is because water bodies have greater positive values of the MNDWI than NDWI because the image bands generally have stronger absorbability in the short-wave infrared (SWIR) band than in the near-infrared (NIR) band [21]. In addition, soil, vegetation, and built-up areas have smaller negative values because they reflect more SWIR light than green light [12]. Based on this finding, the MNDWI was proposed using Landsat-8 data and is defined as follows:
M N D W I = ρ G r e e n ρ S W I R ρ G r e e n + ρ S W I R ,
where ρ g r e e n is a green band, such as OLI band 3, and ρ S W I R is a middle infrared band, such as OLI band 6.

3.3. IUSW Automatic Extraction Based on Adaptive Threshold Segmentation by the GlobeLand30 Product

In this section, we proposed an adaptive threshold segmentation method based on the water body type of the GlobeLand30 product, which mainly includes (1) the sample optimization using k-means clustering from the water body types of GlobeLand30 products and (2) the adaptive segmentation of water body index features based on the optimized samples. The method performed automatic segmentation of MLWI, MSWI, and MNDWI water body indices respectively and obtains the corresponding initial IUSW results. This process is shown in Figure 4.

3.3.1. Sample Optimization Using k-Means Clustering from the Water Body Types of GlobeLand30 Products

Due to the differences in precision, scale, and timeliness between the GlobeLand30 product and the multiple water index, it is difficult to apply the water type in the GlobeLand30 product directly as a sample. Therefore, sample optimization of the water types in the GlobeLand30 product is needed to eliminate the noise mixed with the water types in the GlobeLand30 product and to obtain relatively pure water samples. The k-means is widely used because of its simple principle, effectiveness, excellent clustering effect, easy interpretation, and the fact that the parameter to be tuned is only the number of cluster types [54]. Thus, we applied the k-means clustering algorithm to further refine the initial water samples of the GlobeLand30 product according to the distances of the samples and cluster centers in the multiwater indices feature space. Based on the concise algorithm principle of k-means, each water body sample S was defined as follows [55]:
S = i = 1 k t C i D N F t μ i 2 2 , k = 1 ,
where k is the number of cluster types; C i represents the water and non-water classes from the GlobeLand30 product; t is the class in C i ; D N F represents the pixel values of the water index; F represents the water indices (i.e., MSWI, MLWI, and MNDWI); and μ i = 1 | C i | t C i D N F t is a vector of the average pixel values in the water body and non-water-body types. The k clusters were agglomerated into two classes: water and non-water.
Table 2 shows the statistical results of water and non-water bodies after clustering the water types of Globeland30 products using the k-means algorithm according to the MNDWI, MLWI and MSWI indices, respectively. The results show that the noise can be well removed from the water types of the GlobeLand30 product, and a relatively pure water sample S can be obtained, even though some outliers are present; however, overall, it does not affect the use as an IUSW segmentation sample.

3.3.2. Adaptive Segmentation Method for Multiple Water Index Based on Optimized Samples

We obtained the corresponding initial IUSW results by automatically segmenting the MNDWI, MLWI, and MSWI indices by the threshold interval, which was determined by the mean and variance calculated from the water sample S (see Section 3.3.1), as shown in Equation (12). Table 3 shows the automatically calculated threshold results based on the water sample S.
W F = { D N F I | D N F I ( M e a n F S S t d e v F S ) } ,
Specifically, the calculation method of M e a n F S is as follows:
M e a n F S = 1 n i = 0 n D N F S ,
Specifically, the calculation method of S t d e v F S is as follows:
S t d e v F S = i = 0 n 1 n [ D N F S M e a n F S ] 2 ,
where M e a n F S and S t d e v F S are the mean and standard deviation of the water body sample S, respectively; n is the number of water body sample S; F represents the water indices (i.e., MSWI, MLWI, and MNDWI); and W F is the initial urban surface-water result corresponding to the water body indices F, namely, W M S W I , W M L W I , and W M N D W I .

3.4. IUSW Automatic Optimization Based on Decision-Level Fusion Model

In this study, we used a decision-level information fusion model based on expert knowledge to fuse the initial IUSW extraction results to solve the noise problem generated by relying only on high-resolution remote sensing data sources and to achieve the goal of improving the accuracy of the automatic IUSW extraction results. The final IUSW results were composed of two parts: the optimized large-area water body and the optimized small-area water body. We obtained the optimized large-area water body by fusing the initial results of the large-area water body with the initial results based on the MDNWI features using an object-level area ratio index, primarily to eliminate the noise problem caused by insufficient spectral information (e.g., bare ground-type information). We obtained the optimized small-area water body by dividing the interval range of the texture homogeneity features of the optimized large-area water body and the intersecting objects of the small-area water body initial results, and then optimizing the small-area initial water body to achieve eliminate the noise from building shadows.
The steps of the decision-level fusion model based on expert knowledge were as follows: (1) use area ratios on the initial results of water bodies W M L W I and W M N D W I for information fusion calculations, thereby eliminating the noise information in the large-area initial results and obtaining the optimized large-area water body results W P L N ; (2) obtain sample W S through the intersection operation of the optimized water body results W P L N and W M S W I ; (3) calculate the textural homogeneity characteristics of the small-area water body objects, and obtain the maximum and minimum values of the texture homogeneity features of sample W S ; (4) based on the threshold interval of sample W S , use the texture homogeneity features to segment the small-area water body object W M S W I and obtain the optimized small-area water result W P S ; and (5) perform the merge operation on the optimization results W P L N and W P S to obtain the final W I U S W result. The workflow is illustrated in Figure 5.
W P L N = { W M L W I ( O ) , 0 , A W M L W I ( O ) A W M N D W I ( O ) A W M L W I ( O ) × 100 % > T 1 o t h e r s ,
where W P L N is the optimized large-area water body result; W M L W I ( O ) and W M N D W I ( O ) are the initial results of the large-area water body obtained based on the MLWI and MNDWI, respectively; O is the water body object; A is the area of the water body object O; and T 1 is the threshold parameter. The threshold value of 0.4 was determined experimentally.
W P S = { W M S W I | G L C M W M S W I ( O ) ( G L C M W S min ( O ) , G L C M W S max ( O ) ) } ,
Specifically, G L C M W S max ( O ) and G L C M W S min ( O ) were calculated as follows:
G L C M W S max ( O ) = max { G L C M W S ( O ) } ,
G L C M W S min ( O ) = min { G L C M W S ( O ) } ,
Specifically, W S was calculated as follows:
W S = W P L N W M S W I ,
Specifically, GLCM was calculated as follows:
G L C M = i = 0 N 1 j = 0 N 1 1 1 + ( i j ) 2 g N D W I ( i , j ) ,
where W P S is the optimized small-area water body result; G L C M W S max ( O ) and G L C M W S min ( O ) are the maximum and minimum values of the texture homogeneity of water sample W S , respectively; W S is the water sample; W P L N is the optimized large-area water body result; W M S W I is the initial small-area water body result; GLCM is the grayscale co-presentation matrix; N is the number of grayscale levels; NDWI is the normalized water index of the GF-1 image; O is the water object; and i and j are pixel coordinates. A window size of 7 × 7 pixels is appropriate for classifying remotely sensed imagery in urban areas, and the tested resolutions ranged from 2.5 m × 2.5 m to 10 m × 10 m [56]. Therefore, we set the window size to 7 × 7 pixels in each of the three study regions.
W I U S W = W P L N W P S ,
where W I U S W is the final urban inland surface-water result; and W P L N and W P S are the optimized large-area and small-area water body results, respectively.

3.5. Classification Accuracy Assessment

In this study, we used the ground truth maps to verify the vector results of water extracted from the three study areas in Tianjin, Shanghai, and Guangzhou. We manually delineated the ground truth maps in the study areas based on careful visual interpretation and a field campaign. We used the kappa coefficient (Kappa), producer’s accuracy (PA), and user’s accuracy (UA) to evaluate the water extraction accuracy using the ground truth maps [57].
K a p p a = T × ( T P + T N ) T × T ,
P A = T P T P + F N ,
U A = T P T P + F P ,
= ( T P + F P ) × ( T P + F N ) + ( F N + T N ) × ( F P + T N ) ,
where TP, FN, FP, and TN represent the areas of correct extraction, undetected water bodies, incorrect extraction, and non-water bodies that were correctly rejected, respectively; and T is the total area of the study area.

4. Results

4.1. Comparison of Spatial Distribution Mapping Results of IUSW from the NDWI-Based Method and the AUSWAEM for a Three-Case Study in China

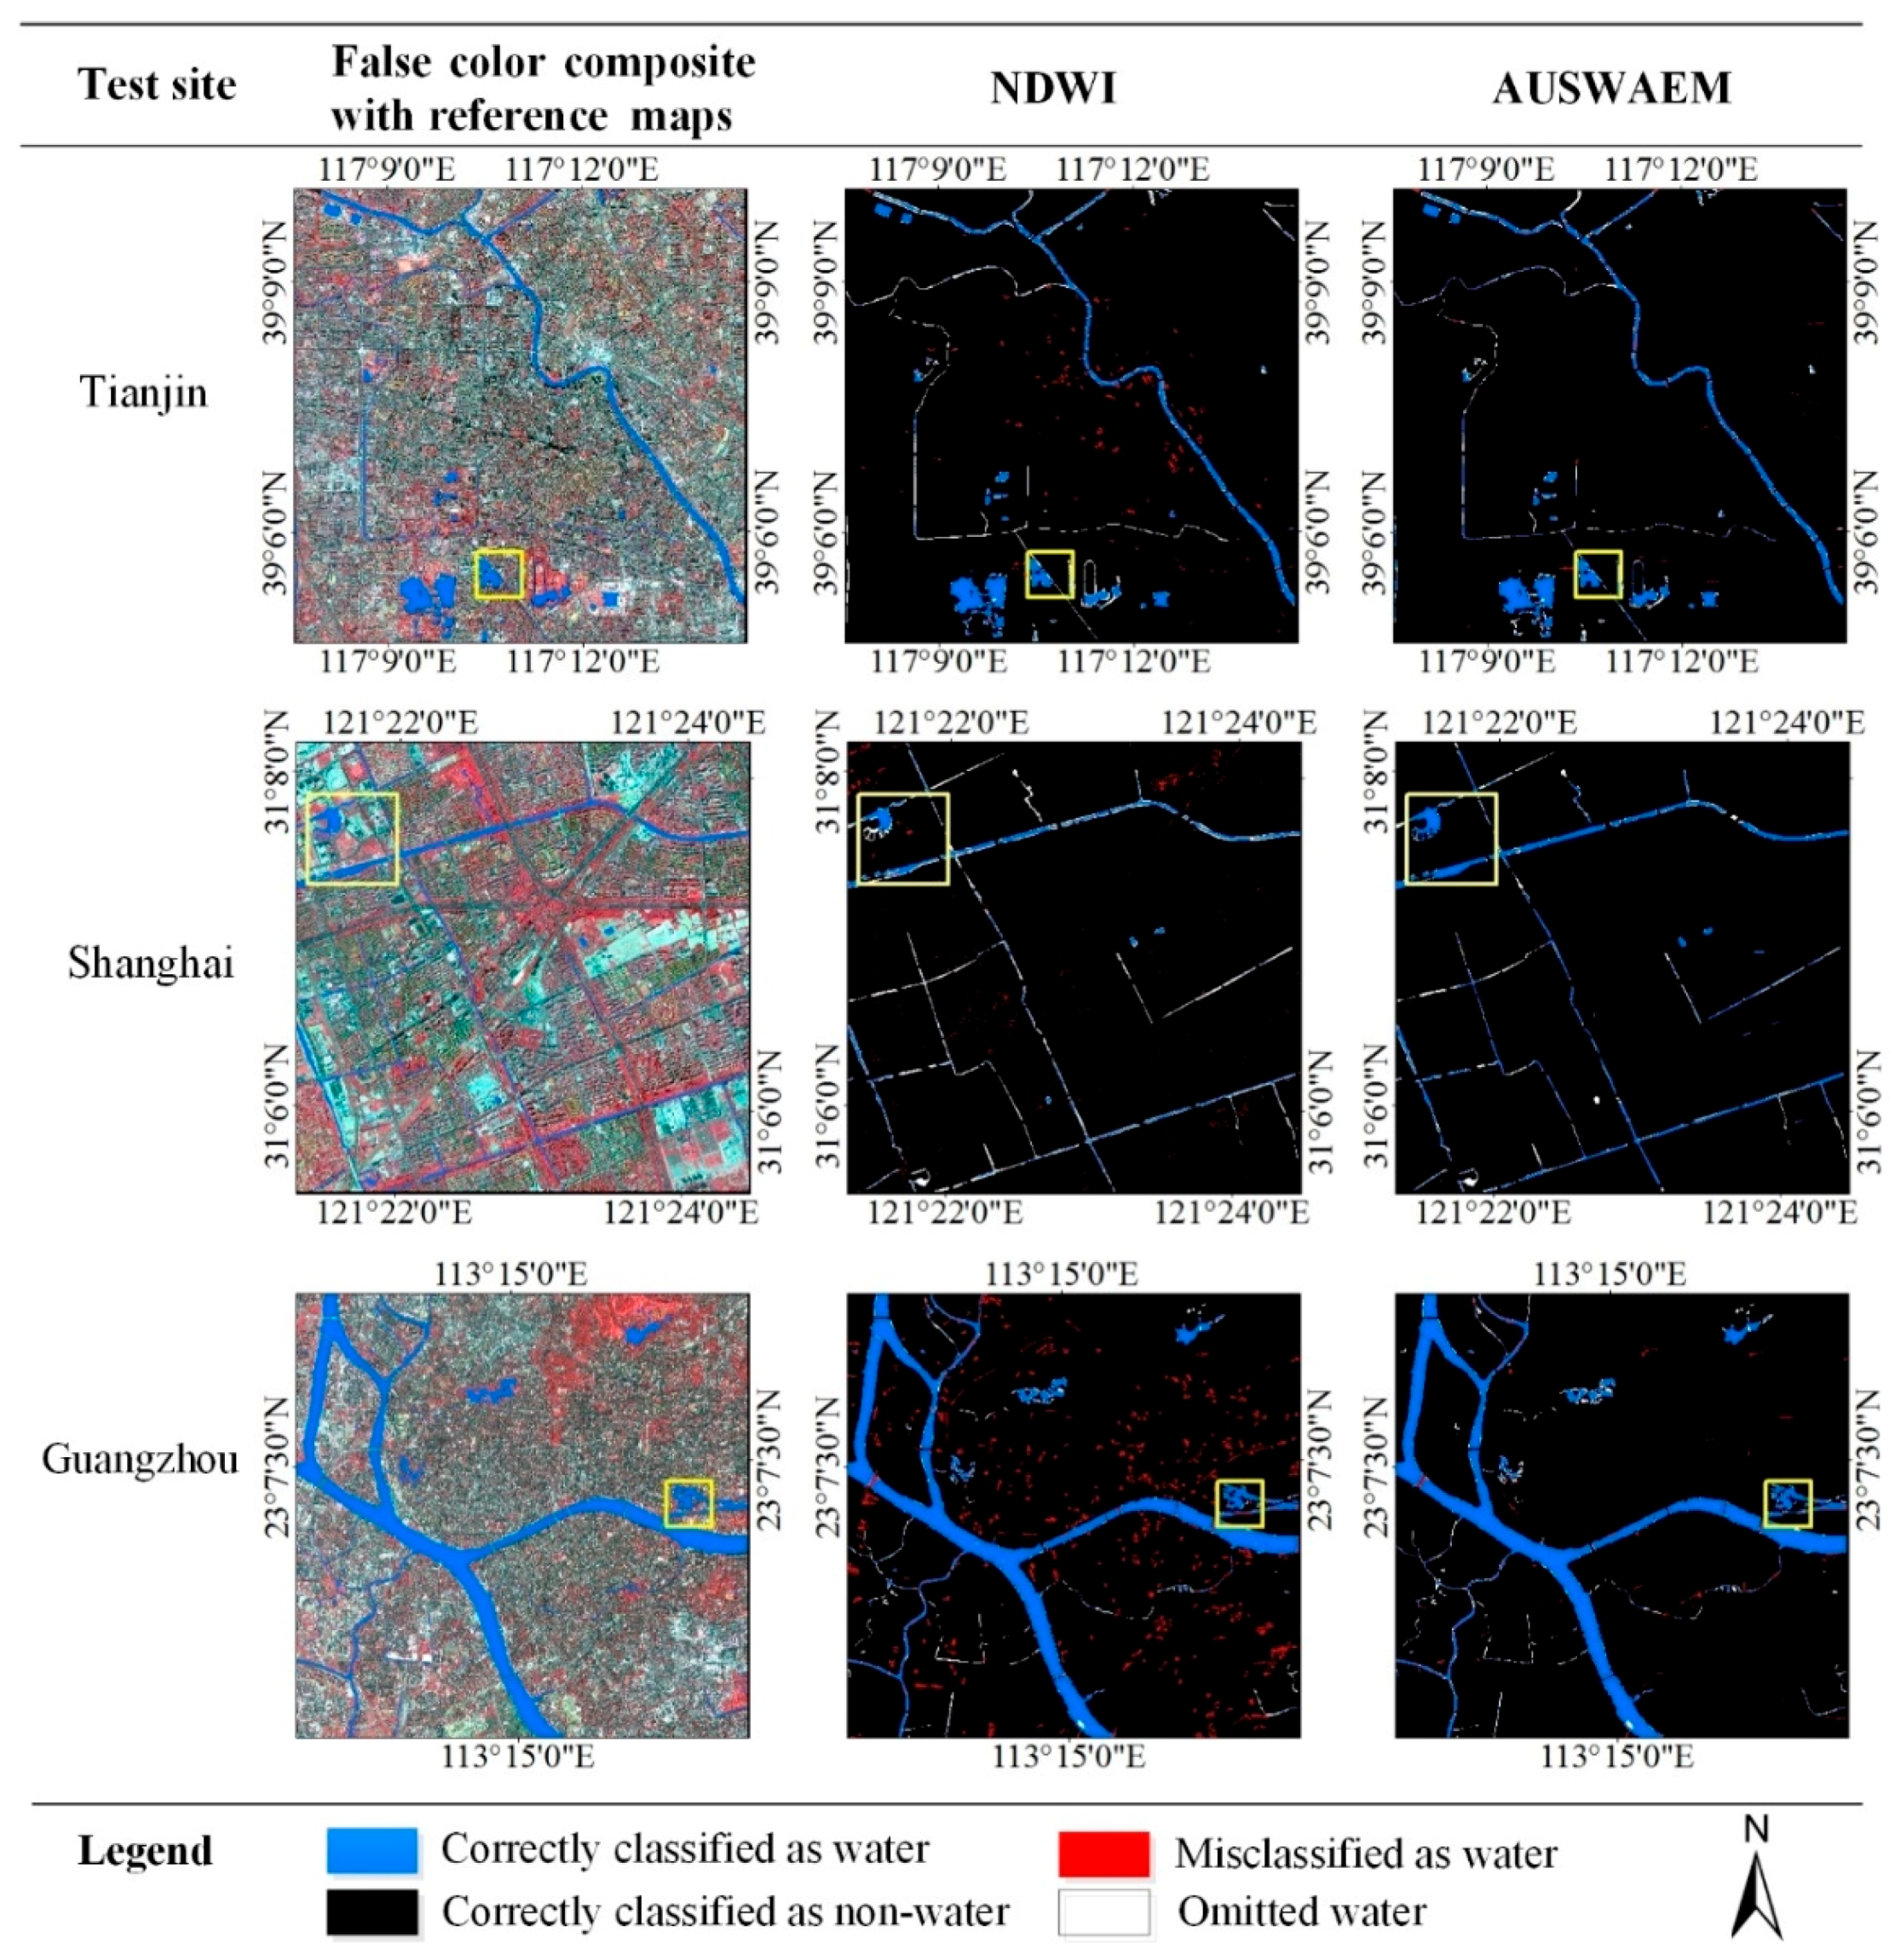
In this study, we used the water body extraction method based on the NDWI as a comparative experiment. To ensure the best results of the water body extraction based on the NDWI, we determined the threshold by trial and error, resulting in thresholds of 0.3, 0.4, and 0.3 in Tianjin, Shanghai, and Guangzhou, respectively. Figure 6 shows the water extraction results using the NDWI-based method and the AUSWAEM. The spatial distributions of the intra-urban surface water extracted by the NDWI-based method and the AUSWAEM were verified by the ground truth data, with the red commission regions and the white omission regions shown in Figure 6. Visual inspection of this figure indicates that the AUSWAEM successfully extracted most of the urban water areas with complete shapes, whereas the extracted results obtained using the NDWI-based method were incomplete. The AUSWAEM had fewer commission and omission errors in each study area, and there were only minor omission errors at the boundaries of the small-area water bodies (e.g., small rivers). The NDWI-based method, however, had clear errors of commission and omission.
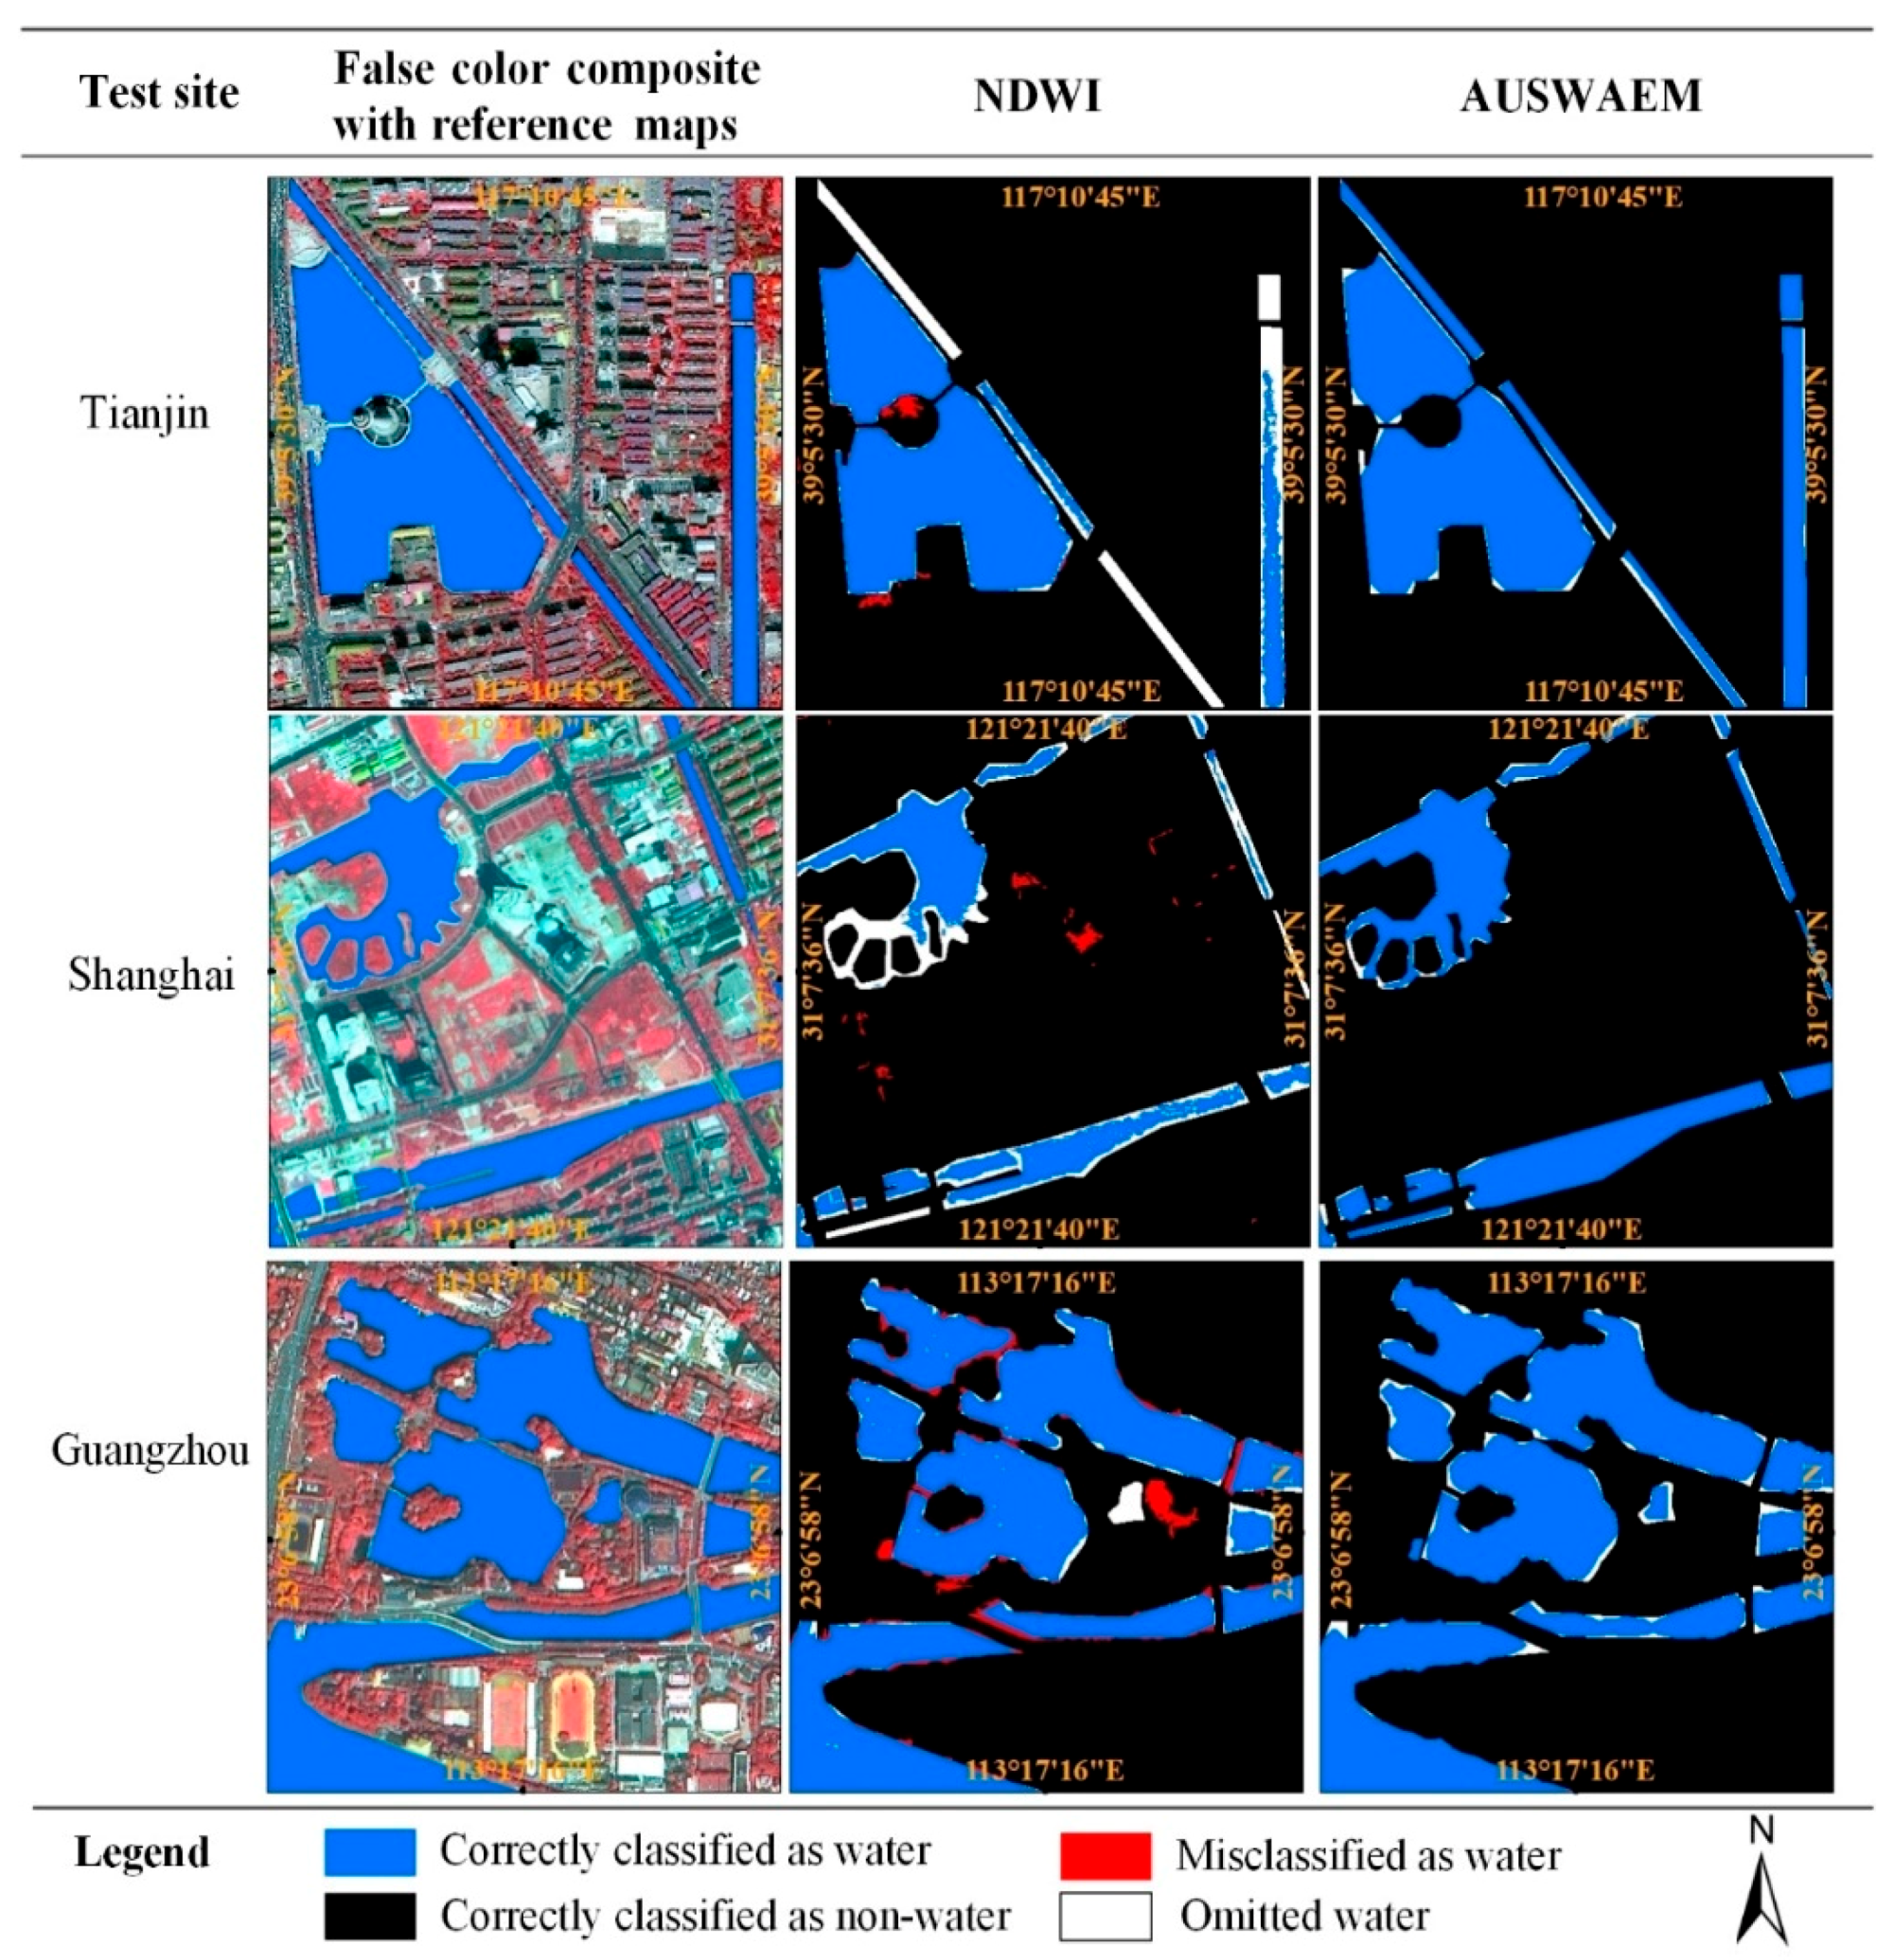
Additionally, to facilitate observation and analysis, we selected 1-km2 areas from the images of the study area, which appear as square yellow frames. The classification results are presented in Figure 7. This figure shows that the water bodies extracted using the AUSWAEM, including large rivers, small rivers, and reservoirs, were continuous and consistent with the validation data. The main reason for the omission errors at the boundaries of small rivers stemmed from the mixed pixels in the water and non-water boundary areas, which resulted in subtle differences between the AUSWAEM extraction results and the ground truth data.

4.2. Accuracy Assessment Results of IUSW between the NDWI-Based Method and the AUSWAEM for a Three-Case Study in China

We used the accuracy evaluation indicators, including the kappa coefficient (Kappa), producer’s accuracy (PA), and user’s accuracy (UA), to quantitatively evaluate the accuracy of the water area extraction results using ground truth maps. Table 4 lists the results of the accuracy assessment of the AUSWAEM and NDWI-based method in the Tianjin, Shanghai, and Guangzhou study areas.
The accuracy assessment results presented in Table 4 indicate that the average Kappa of the urban water results extracted using the AUSWAEM in the three study areas reached 0.91, which was 0.36 higher than that of the urban water extracted using the NDWI-based method. This result indicated that the AUSWAEM performed well in the extraction of urban water bodies, which is an outcome that could not be achieved by the NDWI-based method. In the three study areas, the accuracy of the AUSWAEM in the extraction of urban water bodies had an average UA value of 96.5% and an average PA value >92%, which were higher than the corresponding values of 38.4% and 14.6% achieved by the NDWI-based method. These results revealed that the AUSWAEM maintained lower commission and omission errors (i.e., <8%) compared with the NDWI-based method.

4.3. Analysis of the Importance of MLWI/MSWI Features

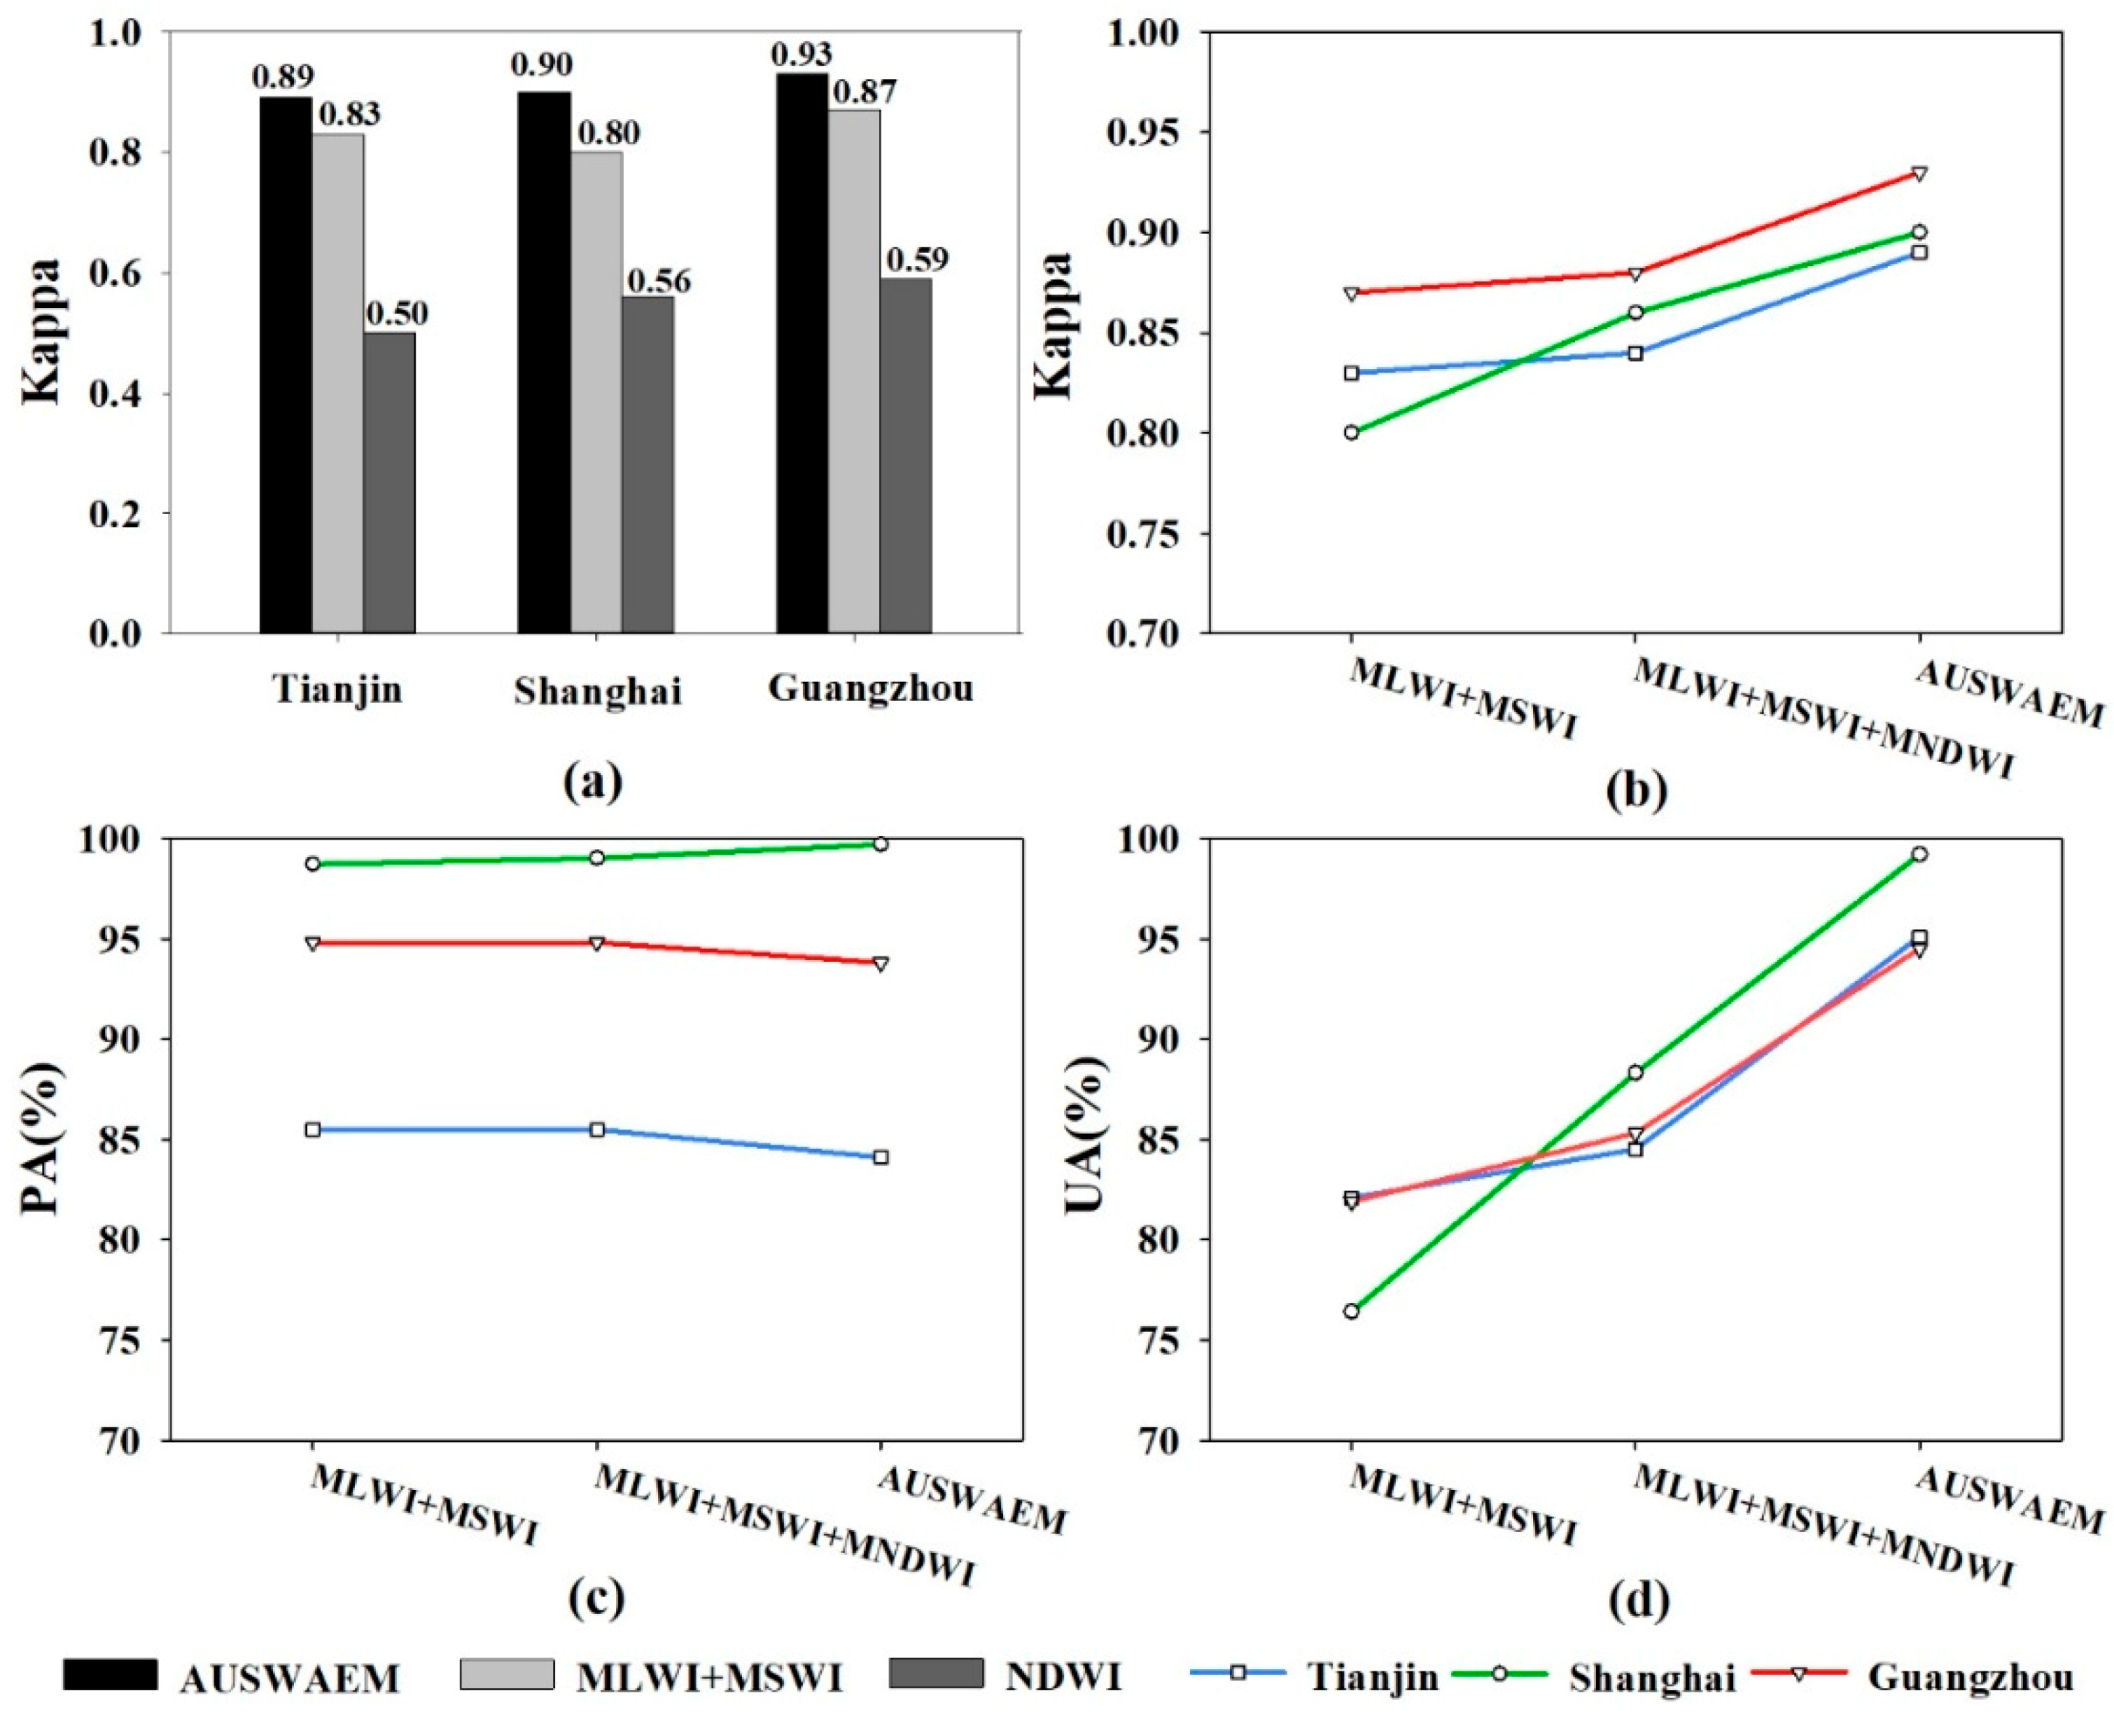
To verify the advantages of the MLWI/MSWI features, we used Kappa to compare the water body extraction results from the MLWI/MSWI-based method and the NDWI-based method. Furthermore, to assess the importance of MLWI/MSWI features in the AUSWAEM, we employed Kappa, PA, and PU to quantitatively evaluate the accuracy curve for each step of the AUSWAEM during the water extraction process. Figure 8a shows a comparison of the water body extraction accuracy between the MLWI/MSWI-based and NDWI-based algorithms in Tianjin, Shanghai, and Guangzhou. Figure 8b–d, respectively, present the accuracy curves of Kappa, PA, and UA for each step of the AUSWAEM during the water extraction process in the study areas.
The accuracy assessment results presented in Figure 8a reveal that the Kappa of the urban water area extraction results based on the MLWI/MSWI features of the three study areas were >0.8, which was 0.28 higher than the NDWI-based method and 0.08 lower than the final result from the AUSWAEM model. These results indicated that the MLWI/MSWI features were superior to the NDWI in urban water area extraction performance. Figure 8c shows that the water area extraction results based on the MLWI/MSWI features were basically consistent with the PA values for post-processing (1%) in the study area of Shanghai, whereas they decreased slightly by 1.4% and 1.0% in the study areas of Tianjin and Guangzhou, respectively. Compared with the final water area extraction results, the omission rates were stable at a relatively low level, indicating that the MLWI/MSWI-based water extraction performed well. In Figure 8b,c, the post-processing method used in this study reduced the PA (i.e., the omission rates were increased), although the reduction was only 1%, which had no effect on the overall accuracy. In contrast, Figure 8d indicates that the UA improved in the three study areas after the MNDWI-based post-processing and decision-level fusion method. Among them, the study areas of Tianjin and Guangzhou increased slightly, by 2.4% and 3.4%, respectively, whereas the Shanghai study area increased significantly, by 10.9%. Compared with the research areas in Tianjin and Guangzhou, the accuracy of the UA in Shanghai was significantly improved because Shanghai is particularly affected by the shadows of high-rise buildings, and decision-level fusion based on MNDWI features can better solve this type of noise. In addition, as can be seen in Figure 8b,d, based on the post-processing of objects in the three study areas, the average Kappa and the average UA improved by 0.05 and 9.5%, respectively. This result indicated that object-based post-processing had a significant effect on eliminating small-area shadows from low-rise buildings.

4.4. Validation and Analysis of Models and Threshold Sensitivity

In order to verify the stability of the model and the determined parameters of the method, the statistical analysis of the kappa coefficients of the model and the automatic segmentation threshold parameters in the model were performed using standard deviations (Std), respectively, in this study. As shown in Table 5, the proposed AUSWAEM has the highest average kappa coefficient of 0.91 and the lowest standard deviation of 0.02 in the three study areas. The results show that AUSWAEM has excellent IUSW detection capability in various urban scenarios.
Table 6 presents the threshold parameters for all water body indices in the three study areas. The MSWI has the lowest Std of 0.01, which indicates the stability of MSWI in extracting IUSW detail information under different urban scenarios. Secondly, the Std of MNDWI is 0.03, which is lower than that of NDVI (0.05), indicating that MNDWI is more stable than NDVI in extracting IUSW spectral information under different urban scenarios. Finally, the Std of MLWI is the highest 0.1 among all threshold parameters, which is due to the threshold parameter of 0.13 in Shanghai, which is significantly lower than the segmentation threshold parameter of the other two study regions. The significant decrease in the threshold parameter in Shanghai is due to the presence of a large number of confusing types, such as bare land types and bright building types, in the Shanghai study area. This is also the main reason why the accuracy of IUSW extraction is lower than the other two study areas when using only MLWI + MSWI. However, in the AUSWAEM model, the Shanghai study area has the highest accuracy improvement of 0.1, which indicates that the fusion of medium-resolution spectral information can effectively solve the commission problem caused by insufficient spectral information, thus improving the applicability in different urban scenes. Therefore, from the above analysis, it can be concluded that the proposed AUSWAEM method has a well performance to detect IUSWs in different urban scenarios. In addition, the adaptive threshold determination method can automatically determine more reasonable threshold parameters according to the characteristics of different urban scenes.

5. Discussion

The IUSW results were consistent with the results from the ground truth data, which we delineated manually based on careful visual interpretation and a field campaign. Therefore, the results of the proposed method in this study were reliable. Compared with the results of other studies using high spatial resolution remote sensing images for urban surface water mapping [34,57,58], the overall accuracy of IUSW in this study is higher (0.5–1.0% higher), indicating the validity of the AUSWAEM method proposed in this study. It is also shown that the fusion of medium-resolution spectral information on the basis of high-resolution remote sensing images can effectively improve the accuracy of IUSW detection compared to relying only on high-resolution remote sensing images for IUSW detection. Thus, the fusion of the spectral information of the medium resolution remote sensing image can play a role in improving the accuracy of IUSW detection by high resolution remote sensing. In addition, compared with other methods for IUSW extraction, the proposed AUSWAEM method requires fewer parameters to be determined and has better robustness and applicability, which reflects the good performance of this method.
The main reasons for the reduction in accuracy are twofold: First, slender shadows from some of the larger buildings, such as factories and shopping malls, are easy to confuse with small rivers. Shadows of some larger buildings can be difficult to distinguish from small rivers because such shadows are characterized by a slender shape and a strong homogeneity of texture. This is similar to the characteristics of small rivers, which makes it difficult to distinguish to two features using a water index, texture homogeneity, and shape characteristics. Because of vast differences in the structures of large buildings, the shapes of their shadows vary significantly, making it challenging to determine rules. In addition, although this can lead to a certain degree of misclassification, it did not exert a large impact on the overall accuracy because the occupied area proportion of large buildings was <2% in the study areas. Therefore, to generalize this method, this study did not address this issue further. Second, even with high-resolution images, the problem of mixed pixels between water and non-water objects still exists. Therefore, compared with ground truth maps, the water bodies extracted by this study had some omissions at their boundaries, leading to a decrease in the PA. This problem can be addressed in subsequent research.
The primary advantage of the proposed method was that it did not require the selection of samples, thus saving the cost of manual marking. Additionally, the problem of threshold selection was partially solved, which reduced the time-consuming selection of thresholds and the uncertainty of segmentation. The disadvantage, however, was that some of the thresholds (e.g., texture homogeneity and shape features) still had to be manually determined. In this study, the threshold was selected by trial and error and compared in three study areas, making the parameters of the two thresholds relatively stable. However, the appropriate thresholds still need to be manually adjusted for more types of urban scenes. In follow-up studies on the AUSWAEM, we will focus on the issue of threshold selection in the model. Although the adaptive threshold segmentation based on the GlobeLand30 product in this study could avoid the time-consuming nature of threshold selection to some extent, it requires further investigation. Subsequently, an active learning method from multisource reference data and adaptive mining of global-local relationship information will be attempted to solve the threshold optimization problem. Then, in future applications, the AUSWAEM model will be applied to high-precision automated IUSW dynamic monitoring to explore the dynamic development pattern of surface water resources in each city on a large regional scale, so as to provide detailed information and technical support for the cooperative use and development of water resources in urban agglomerations on a regional scale.

6. Conclusions

In this study, we proposed a novel intra-urban surface-water extraction method, which integrated the advantages of high- and medium-resolution remotely sensed products to accurately and automatically delineate IUSW. To address the issue of extracting different water spatial forms, we proposed the MLWI/MSWI, in combination with the NDWI. In addition, we designed a decision-level information fusion model to successfully suppress noise from different types of building shadows. We conducted a test of the remotely sensed products of GF-1 and Landsat-8 OLI images covering a three-case study in China to validate the extraction accuracy and performance of the proposed method. The results indicated that the AUSWAEM method performed well, with an average Kappa of 0.91 and an average total commission and omission error of 5.7%. The MLWI/MSWI in the AUSWAEM detected different level water forms, including water body boundaries and small rivers, and was more efficient than the NDWI-based method in terms of visual inspection. Meanwhile, the combined post-processing method in the AUSWAEM was also effective in the suppression of noise from different types of shadows. The AUSWAEM was an effective water area extraction method, which demonstrated that this algorithm could maintain high precision, stability, and robustness in urban areas.

Author Contributions

Z.L. and X.Y. conceived and designed the experiments; Z.L., performed the experiments; Z.L. and X.Y. analyzed the data; Z.L. and X.Y. wrote the paper. All authors have read and agreed to the published version of the manuscript.

Funding

This research was funded by the National Science Foundation of China (Grant Nos. 41421001 and 41671436); the National Key Research and Development Program of China, Grant No. 2016YFB0501404; the Innovation Project of Laboratory of Resources and Environmental Information System (Grant No. O88RAA01YA).

Conflicts of Interest

The authors declare no conflict of interest.

References

  1. Sun, L.; Chen, J.; Li, Q.; Huang, D. Dramatic uneven urbanization of large cities throughout the world in recent decades. Nat. Commun. 2020, 11, 1–9. [Google Scholar] [CrossRef]
  2. Su, Y.; Gao, W.; Guan, D.; Zuo, T. Achieving Urban Water Security: A Review of Water Management Approach from Technology Perspective. Water Resour. Manag. 2020, 34, 4163–4179. [Google Scholar] [CrossRef]
  3. Herndon, K.; Muench, R.E.; Cherrington, E.A.; Griffin, R.E. An Assessment of Surface Water Detection Methods for Water Resource Management in the Nigerien Sahel. Sensors 2020, 20, 431. [Google Scholar] [CrossRef] [Green Version]
  4. Wang, A.; Chan, E.H. The impact of power-geometry in participatory planning on urban greening. Urban For. Urban Green. 2020, 48, 126571. [Google Scholar] [CrossRef]
  5. Geneletti, D.; La Rosa, D.; Spyra, M.; Cortinovis, C. A review of approaches and challenges for sustainable planning in urban peripheries. Landsc. Urban Plan. 2017, 165, 231–243. [Google Scholar] [CrossRef]
  6. Liu, Y.; Li, Q.; Yang, L.; Mu, K.; Zhang, M.; Liu, J. Urban heat island effects of various urban morphologies under regional climate conditions. Sci. Total Environ. 2020, 743, 140589. [Google Scholar] [CrossRef] [PubMed]
  7. Hettiarachchi, S.; Wasko, C.; Sharma, A. Increase in flood risk resulting from climate change in a developed urban watershed—The role of storm temporal patterns. Hydrol. Earth Syst. Sci. 2018, 22, 2041–2056. [Google Scholar] [CrossRef] [Green Version]
  8. Hall, J.; Hossain, A.A. Mapping Urbanization and Evaluating Its Possible Impacts on Stream Water Quality in Chattanooga, Tennessee, Using GIS and Remote Sensing. Sustainability 2020, 12, 1980. [Google Scholar] [CrossRef] [Green Version]
  9. Liao, H.-Y.; Wen, T.-H. Extracting urban water bodies from high-resolution radar images: Measuring the urban surface morphology to control for radar’s double-bounce effect. Int. J. Appl. Earth Obs. Geoinf. 2020, 85, 102003. [Google Scholar] [CrossRef]
  10. Irwin, K.; Beaulne, D.; Braun, A.; Fotopoulos, G. Fusion of SAR, Optical Imagery and Airborne LiDAR for Surface Water Detection. Remote Sens. 2017, 9, 890. [Google Scholar] [CrossRef] [Green Version]
  11. Chen, Y.; Fan, R.; Yang, X.; Wang, J.; Latif, A. Extraction of Urban Water Bodies from High-Resolution Remote-Sensing Imagery Using Deep Learning. Water 2018, 10, 585. [Google Scholar] [CrossRef] [Green Version]
  12. Xie, H.; Luo, X.; Xu, X.; Pan, H.; Tong, X. Evaluation of Landsat 8 OLI imagery for unsupervised inland water extraction. Int. J. Remote Sens. 2016, 37, 1826–1844. [Google Scholar] [CrossRef]
  13. Huang, X.; Xie, C.; Fang, X.; Zhang, L. Combining Pixel- and Object-Based Machine Learning for Identification of Water-Body Types From Urban High-Resolution Remote-Sensing Imagery. IEEE J. Sel. Top. Appl. Earth Obs. Remote Sens. 2015, 8, 2097–2110. [Google Scholar] [CrossRef]
  14. Song, S.; Liu, J.; Liu, Y.; Feng, G.; Han, H.; Yao, Y.; Du, M. Intelligent Object Recognition of Urban Water Bodies Based on Deep Learning for Multi-Source and Multi-Temporal High Spatial Resolution Remote Sensing Imagery. Sensors 2020, 20, 397. [Google Scholar] [CrossRef] [PubMed] [Green Version]
  15. Wang, Y.; Li, Z.; Zeng, C.; Xia, G.-S.; Shen, H. An Urban Water Extraction Method Combining Deep Learning and Google Earth Engine. IEEE J. Sel. Top. Appl. Earth Obs. Remote Sens. 2020, 13, 769–782. [Google Scholar] [CrossRef]
  16. Guo, H.; He, G.; Jiang, W.; Yin, R.; Yan, L.; Leng, W. A Multi-Scale Water Extraction Convolutional Neural Network (MWEN) Method for GaoFen-1 Remote Sensing Images. ISPRS Int. J. Geo-Inf. 2020, 9, 189. [Google Scholar] [CrossRef] [Green Version]
  17. Bryant, R.G.; Rainey, M. Investigation of flood inundation on playas within the Zone of Chotts, using a time-series of AVHRR. Remote Sens. Environ. 2002, 82, 360–375. [Google Scholar] [CrossRef]
  18. Jain, S.K.; Lohani, A.K.; Singh, R.D.; Chaudhary, A.; Thakural, L.N. Glacial lakes and glacial lake outburst flood in a Himalayan basin using remote sensing and GIS. Nat. Hazards 2012, 62, 887–899. [Google Scholar] [CrossRef]
  19. McFeeters, S.K. The use of the Normalized Difference Water Index (NDWI) in the delineation of open water features. Int. J. Remote Sens. 1996, 17, 1425–1432. [Google Scholar] [CrossRef]
  20. Xu, H. Modification of normalised difference water index (NDWI) to enhance open water features in remotely sensed imagery. Int. J. Remote Sens. 2006, 27, 3025–3033. [Google Scholar] [CrossRef]
  21. Feyisa, G.L.; Meilby, H.; Fensholt, R.; Proud, S.R. Automated Water Extraction Index: A new technique for surface water mapping using Landsat imagery. Remote Sens. Environ. 2014, 140, 23–35. [Google Scholar] [CrossRef]
  22. Yang, X.; Qin, Q.; Grussenmeyer, P.; Koehl, M. Urban surface water body detection with suppressed built-up noise based on water indices from Sentinel-2 MSI imagery. Remote Sens. Environ. 2018, 219, 259–270. [Google Scholar] [CrossRef]
  23. Isikdogan, F.; Bovik, A.C.; Passalacqua, P. Surface Water Mapping by Deep Learning. IEEE J. Sel. Top. Appl. Earth Obs. Remote Sens. 2017, 10, 4909–4918. [Google Scholar] [CrossRef]
  24. Sun, X.; Li, L.; Zhang, B.; Chen, D.; Gao, L. Soft urban water cover extraction using mixed training samples and Support Vector Machines. Int. J. Remote Sens. 2015, 36, 3331–3344. [Google Scholar] [CrossRef]
  25. Xie, H.; Luo, X.; Xu, X.; Pan, H.; Tong, X. Automated Subpixel Surface Water Mapping from Heterogeneous Urban Environments Using Landsat 8 OLI Imagery. Remote Sens. 2016, 8, 584. [Google Scholar] [CrossRef] [Green Version]
  26. Sun, W.; Du, B.; Xiong, S. Quantifying Sub-Pixel Surface Water Coverage in Urban Environments Using Low-Albedo Fraction from Landsat Imagery. Remote Sens. 2017, 9, 428. [Google Scholar] [CrossRef] [Green Version]
  27. Klein, I.; Gessner, U.; Dietz, A.; Kuenzer, C. Global WaterPack—A 250 m resolution dataset revealing the daily dynamics of global inland water bodies. Remote Sens. Environ. 2017, 198, 345–362. [Google Scholar] [CrossRef]
  28. Pan, F.; Xi, X.; Wang, C. A Comparative Study of Water Indices and Image Classification Algorithms for Mapping Inland Surface Water Bodies Using Landsat Imagery. Remote Sens. 2020, 12, 1611. [Google Scholar] [CrossRef]
  29. Zhang, G.; Zheng, G.; Gao, Y.; Xiang, Y.; Lei, Y.; Li, J. Automated water classification in the Tibetan plateau using Chinese GF-1 WFV data. Photogram. Eng. Remote Sens. 2017, 83, 509–519. [Google Scholar] [CrossRef]
  30. Fisher, A.; Flood, N.; Danaher, T. Comparing Landsat water index methods for automated water classification in eastern Australia. Remote Sens. Environ. 2016, 175, 167–182. [Google Scholar] [CrossRef]
  31. Wang, X.; Xie, S.; Zhang, X.; Chen, C.; Guo, H.; Du, J.; Duan, Z. A robust Multi-Band Water Index (MBWI) for automated extraction of surface water from Landsat 8 OLI imagery. Int. J. Appl. Earth Obs. Geoinf. 2018, 68, 73–91. [Google Scholar] [CrossRef]
  32. Chen, F.; Chen, X.; Van De Voorde, T.; Roberts, D.; Jiang, H.; Xu, W. Open water detection in urban environments using high spatial resolution remote sensing imagery. Remote Sens. Environ. 2020, 242, 111706. [Google Scholar] [CrossRef]
  33. Wu, W.; Li, Q.; Zhang, Y.; Du, X.; Wang, H. Two-Step Urban Water Index (TSUWI): A New Technique for High-Resolution Mapping of Urban Surface Water. Remote Sens. 2018, 10, 1704. [Google Scholar] [CrossRef] [Green Version]
  34. Xie, C.; Huang, X.; Zeng, W.; Fang, X. A novel water index for urban high-resolution eight-band WorldView-2 imagery. Int. J. Digit. Earth 2016, 9, 925–941. [Google Scholar] [CrossRef]
  35. Shen, Y.; Chen, J.; Xiao, L.; Pan, D. Optimizing multiscale segmentation with local spectral heterogeneity measure for high resolution remote sensing images. ISPRS J. Photogramm. Remote Sens. 2019, 157, 13–25. [Google Scholar] [CrossRef]
  36. Wang, L.; Yan, J.; Mu, L.; Huang, L. Knowledge discovery from remote sensing images: A review. Wiley Interdiscip. Rev. Data Min. Knowl. Discov. 2020, 10. [Google Scholar] [CrossRef]
  37. Li, K.; Chen, Y. A Genetic Algorithm-Based Urban Cluster Automatic Threshold Method by Combining VIIRS DNB, NDVI, and NDBI to Monitor Urbanization. Remote Sens. 2018, 10, 277. [Google Scholar] [CrossRef] [Green Version]
  38. Hadavand, A.; Saadatseresht, M.; Homayouni, S. Segmentation parameter selection for object-based land-cover mapping from ultra high resolution spectral and elevation data. Int. J. Remote Sens. 2017, 38, 3586–3607. [Google Scholar] [CrossRef]
  39. Han, Q.; Niu, Z. Construction of the Long-Term Global Surface Water Extent Dataset Based on Water-NDVI Spatio-Temporal Parameter Sets. Remote Sens. 2020, 12, 2675. [Google Scholar] [CrossRef]
  40. Chen, J.; Cao, X.; Peng, S.; Ren, H. Analysis and Applications of GlobeLand30: A Review. ISPRS Int. J. Geo-Inf. 2017, 6, 230. [Google Scholar] [CrossRef] [Green Version]
  41. Bijeesh, T.V.; Narasimhamurthy, K.N. Surface water detection and delineation using remote sensing images: A review of methods and algorithms. Sustain. Water Resour. Manag. 2020, 6, 1–23. [Google Scholar] [CrossRef]
  42. Huang, C.; Chen, Y.; Zhang, S.; Wu, J. Detecting, Extracting, and Monitoring Surface Water From Space Using Optical Sensors: A Review. Rev. Geophys. 2018, 56, 333–360. [Google Scholar] [CrossRef]
  43. Li, Z.; Zhou, C.; Yang, X.; Chen, X.; Meng, F.; Lü, C.; Pan, T.; Qi, W. Urban landscape extraction and analysis in the mega-city of China’s coastal regions using high-resolution satellite imagery: A case of Shanghai, China. Int. J. Appl. Earth Obs. Geoinf. 2018, 72, 140–150. [Google Scholar] [CrossRef]
  44. Gao, H.; Gu, X.; Yu, T.; Liu, L.; Sun, Y.; Xie, Y.; Liu, Q. Validation of the Calibration Coefficient of the GaoFen-1 PMS Sensor Using the Landsat 8 OLI. Remote Sens. 2016, 8, 132. [Google Scholar] [CrossRef] [Green Version]
  45. Arsanjani, J.J.; Fritz, S.; Tayyebi, A. Assessing the suitability of GlobeLand30 for mapping land cover in Germany. Int. J. Digit. Earth 2016, 9, 1–19. [Google Scholar] [CrossRef] [Green Version]
  46. Huang, X.; Li, Q.; Liu, H.; Li, J. Assessing and Improving the Accuracy of GlobeLand30 Data for Urban Area Delineation by Combining Multisource Remote Sensing Data. IEEE Geosci. Remote Sens. Lett. 2016, 13, 1860–1864. [Google Scholar] [CrossRef]
  47. Yang, Y.; Xiao, P.; Feng, X.; Li, H. Accuracy assessment of seven global land cover datasets over China. ISPRS J. Photogramm. Remote Sens. 2017, 125, 156–173. [Google Scholar] [CrossRef]
  48. Huang, W.; Zhang, G.; Tang, X.; Li, D. Compensation for Distortion of Basic Satellite Images Based on Rational Function Model. IEEE J. Sel. Top. Appl. Earth Obs. Remote Sens. 2016, 9, 5767–5775. [Google Scholar] [CrossRef]
  49. Li, H.; Jing, L.; Tang, Y. Assessment of Pansharpening Methods Applied to WorldView-2 Imagery Fusion. Sensors 2017, 17, 89. [Google Scholar] [CrossRef]
  50. Li, S.S.; Peng, M.; Wu, C.S.; Feng, X.X.; Wu, Y.W. Optimal selection of GCPs from Global Land Survey 2005 for precision geometric correction of Landsat-8 imagery. Eur. J. Remote Sens. 2015, 48, 303–318. [Google Scholar] [CrossRef]
  51. Nazeer, M.; Nichol, J.; Yung, Y.-K. Evaluation of atmospheric correction models and Landsat surface reflectance product in an urban coastal environment. Int. J. Remote Sens. 2014, 35, 6271–6291. [Google Scholar] [CrossRef]
  52. Yang, X.; Zhao, S.; Qin, X.; Zhao, N.; Liang, L. Mapping of Urban Surface Water Bodies from Sentinel-2 MSI Imagery at 10 m Resolution via NDWI-Based Image Sharpening. Remote Sens. 2017, 9, 596. [Google Scholar] [CrossRef] [Green Version]
  53. Huang, X.; Han, X.; Zhang, L.; Gong, J.; Liao, W.; Benediktsson, J.A. Generalized Differential Morphological Profiles for Remote Sensing Image Classification. IEEE J. Sel. Top. Appl. Earth Obs. Remote Sens. 2016, 9, 1736–1751. [Google Scholar] [CrossRef] [Green Version]
  54. Lv, Z.Y.; Liu, T.; Shi, C.; Benediktsson, J.A.; Du, H. Novel Land Cover Change Detection Method Based on k-Means Clustering and Adaptive Majority Voting Using Bitemporal Remote Sensing Images. IEEE Access 2019, 7, 34425–34437. [Google Scholar] [CrossRef]
  55. Bhola, R.; Krishna, N.H.; Ramesh, K.; Senthilnath, J.; Anand, G. Detection of the power lines in UAV remote sensed images using spectral-spatial methods. J. Environ. Manag. 2018, 206, 1233–1242. [Google Scholar] [CrossRef]
  56. Puissant, A.; Hirsch, J.; Weber, C. The utility of texture analysis to improve per-pixel classification for high to very high spatial resolution imagery. Int. J. Remote Sens. 2005, 26, 733–745. [Google Scholar] [CrossRef]
  57. Yang, X.; Chen, L. Evaluation of automated urban surface water extraction from Sentinel-2A imagery using different water indices. J. Appl. Remote Sens. 2017, 11, 026016. [Google Scholar] [CrossRef]
  58. Yao, F.; Wang, C.; Dong, D.; Luo, J.; Shen, Z.; Yang, K. High-Resolution Mapping of Urban Surface Water Using ZY-3 Multi-Spectral Imagery. Remote Sens. 2015, 7, 12336–12355. [Google Scholar] [CrossRef] [Green Version]
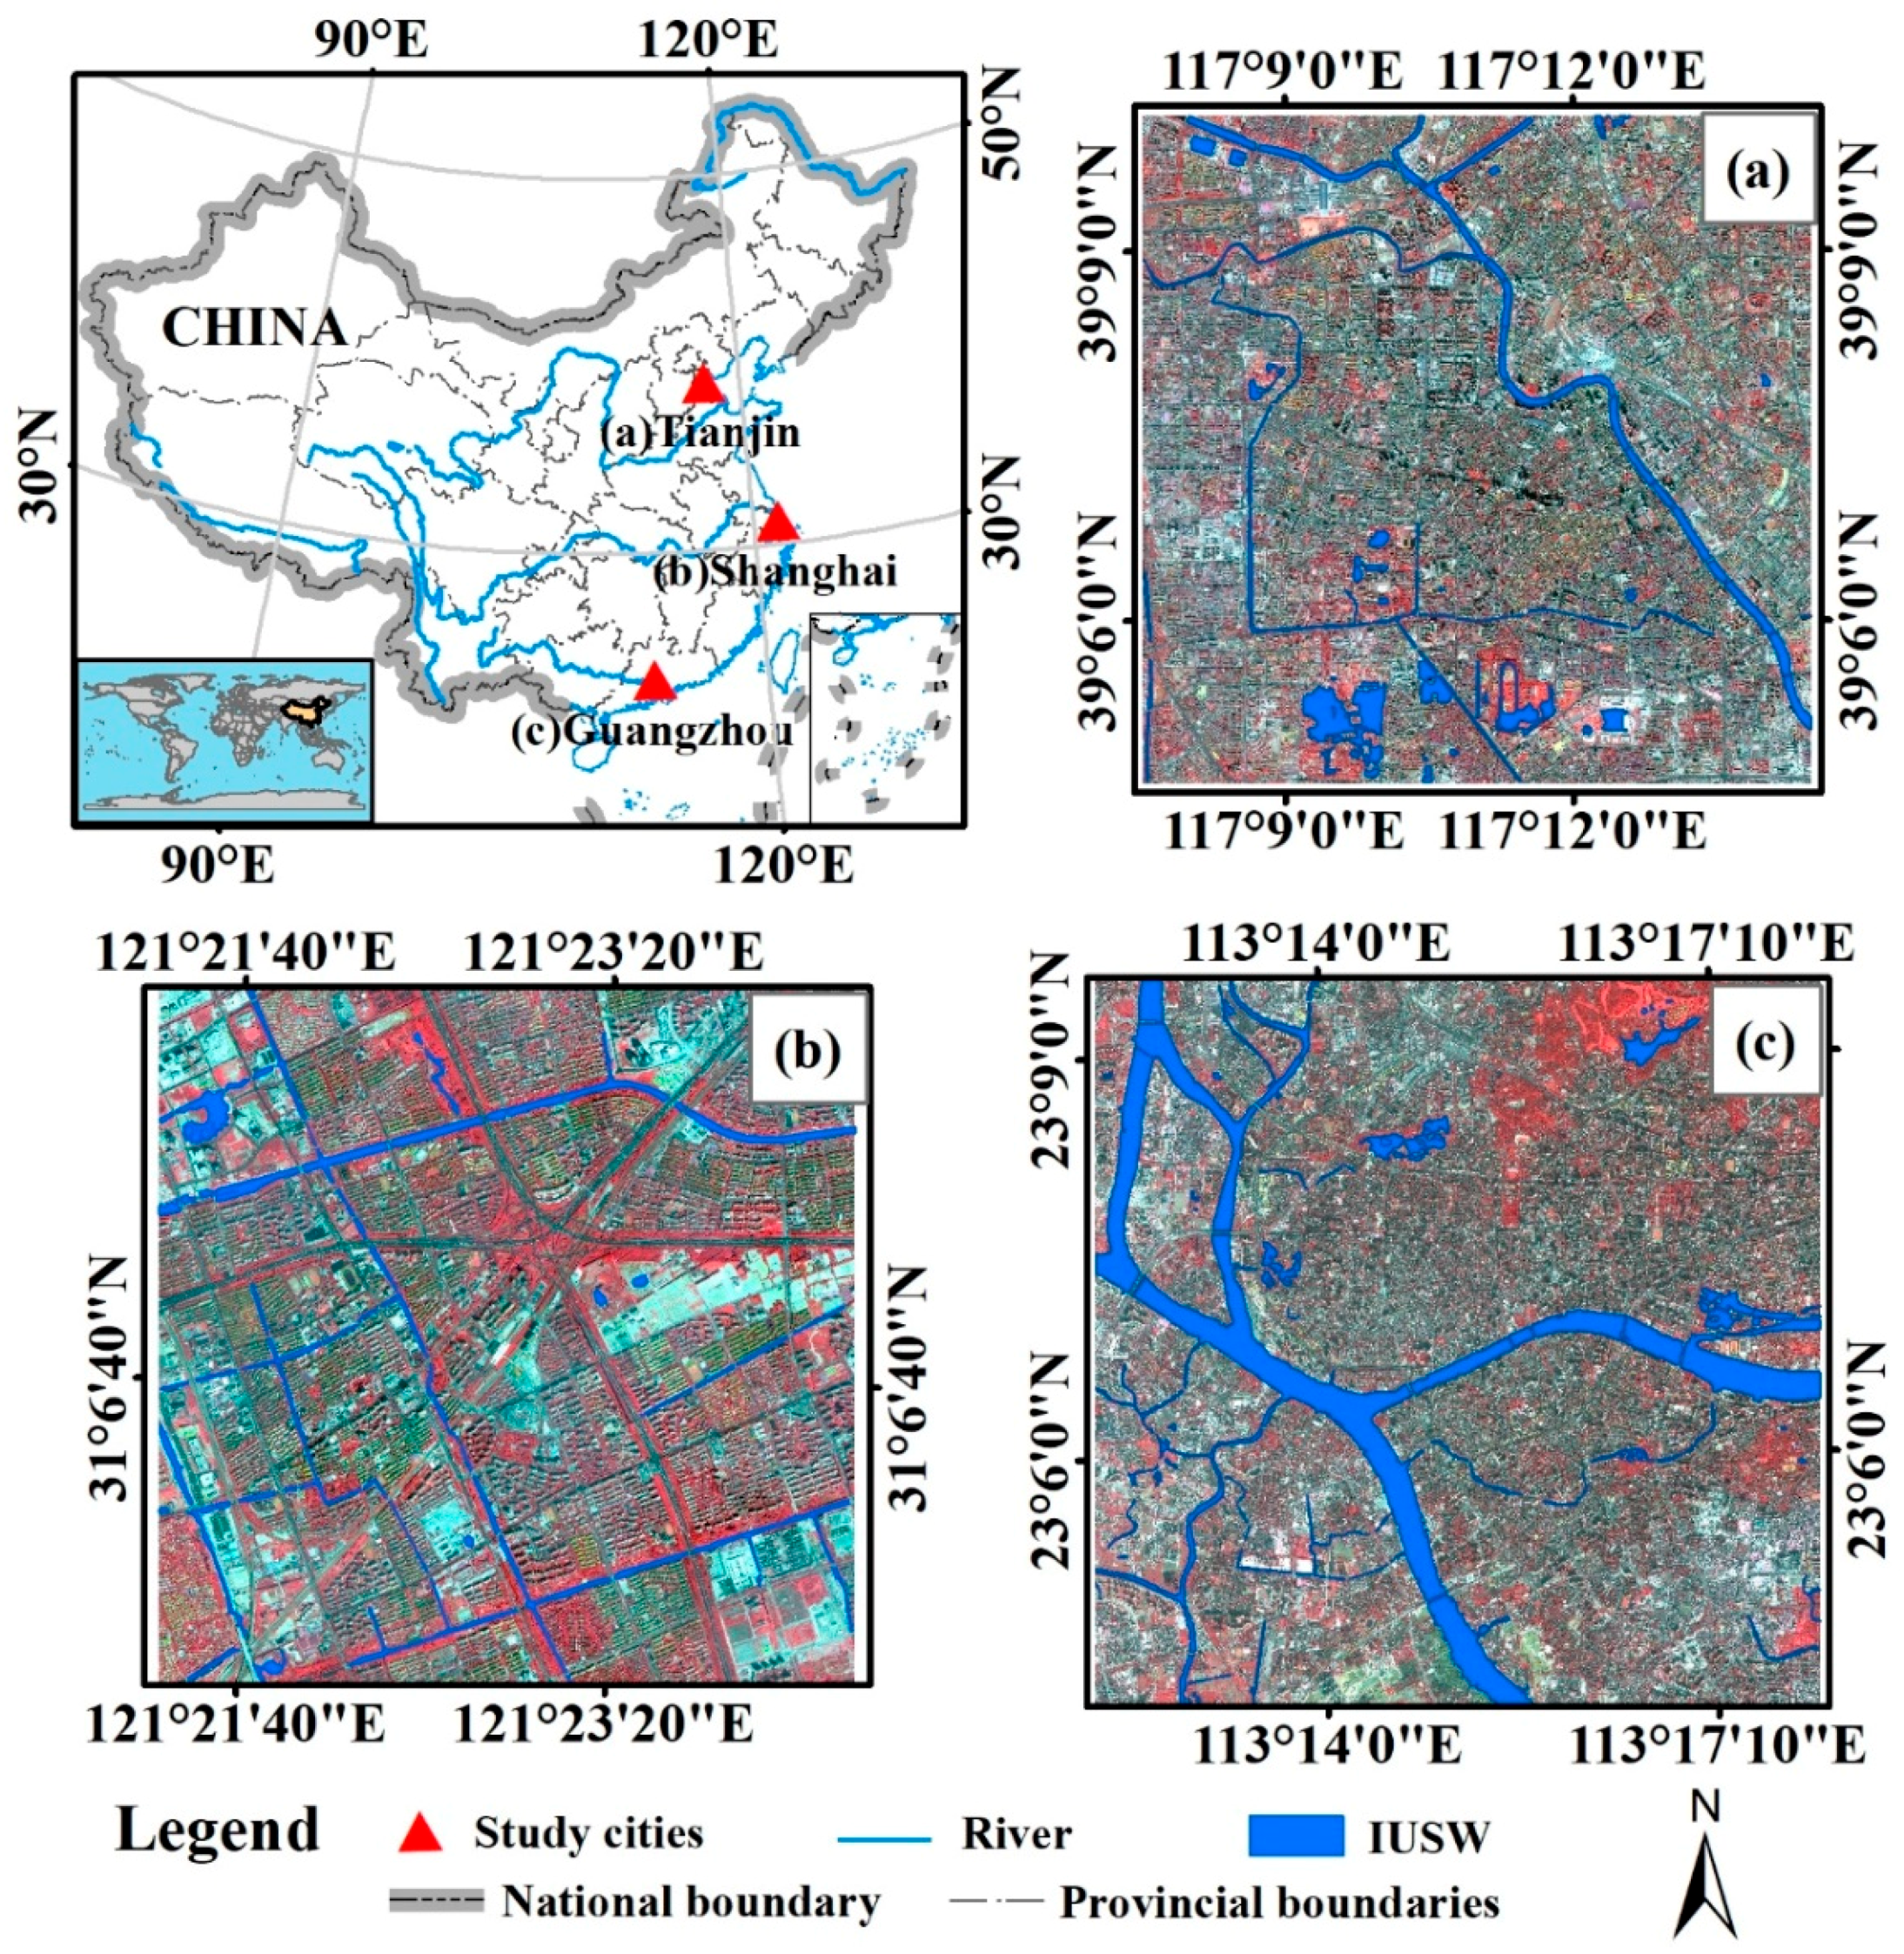
Figure 1. The study areas consisted of the urban areas of (a) Tianjin, (b) Shanghai, and (c) Guangzhou, China. The GaoFen-1 imagery is shown with a false-color composite of the near-infrared, red, and green bands of the raw image data overlaid with the ground truth maps covering the study areas.
Remotesensing 12 04037 g001
Figure 2. Workflow of the integrated urban surface-water area mapping method based on the GaoFen-1 and Landsat-8 OLI imagery. Note: MLWI, MSWI, and MNDWI represent the morphology large-area water index, the morphology small-area water index, and the modified normalized difference water index, respectively. W M L W I , W M S W I , and W M N D W I are thematic maps of the water bodies generated from the MLWI, MSWI, and MNDWI, respectively. GLCM represents the gray-level co-occurrence matrix.
Remotesensing 12 04037 g002
Figure 3. Example showing the extraction results of MLWI and MSWI feature images: (a) Example of GF-1 imagery overlaid with the ground truth map located in a section of the Guangzhou study area on February 20, 2016; (b) NDWI feature image; (c,d) MLWI and MSWI feature images extracted from (b) to enhance the difference between large-area water bodies and small-area water bodies and non-water areas, respectively. Note: The dashed yellow rectangular frames represent typical areas where objects with large areas and small areas of water were enhanced.
Remotesensing 12 04037 g003
Figure 4. Graphic example of the adaptive threshold segmentation method based on GlobeLand30.
Remotesensing 12 04037 g004
Figure 5. The Intra-urban surface water (IUSW) results were obtained by optimizing the initial results of the water body using decision-level fusion post-processing and object-level texture post-processing methods.
Remotesensing 12 04037 g005
Figure 6. Comparison of water extraction results between the NDWI-based method and the automatic surface-water area extraction method (AUSWAEM) for the three study areas. Note: the yellow square frames represent 1-km2 areas.
Remotesensing 12 04037 g006
Figure 7. Comparison of the water extraction results between the NDWI-based method and the AUSWAEM algorithms in local areas (the small areas in the yellow square frames from the image in Figure 6).
Remotesensing 12 04037 g007
Figure 8. Quantitative comparison and analysis of the accuracy of the results when multiple features were gradually introduced: (a) Kappa coefficient of the water extraction results of the MLWI/MSWI and NDWI in different experimental areas; (b) The kappa coefficient, (c) producer’s accuracy (PA), and (d) user’s accuracy (UA) were obtained by applying the different feature sets in the AUSWAEM to the three study areas of Tianjin, Shanghai, and Guangzhou.
Remotesensing 12 04037 g008
Table 1. Description of the GaoFen-1 and Landsat-8 OLI images used in this study.
Study AreaSensorsLocation 1 (°)/
Path-Row
Acquisition DataSpatial
Resolution 2 (m)
Area (km2)
TianjinGF1-PMS39.1N/117.2E2016-4-92/8100
OLI123/332016-5-415/30
ShanghaiGF1-PMS31.0N/121.1E2016-9-32/825
OLI118/382016-6-215/30
GuangzhouGF1-PMS23.2N/113.2E2016-2-202/8100
OLI122/442016-12-715/30
1 Central longitude/latitude for GF1-PMS. 2 Spatial resolutions of panchromatic and multispectral images, respectively.
Table 2. The statistical results of water and non-water after clustering the water types of Globeland30 products using the k-means algorithm according to the MNDWI, MLWI, and MSWI indices, respectively.
Study AreaWater IndexWaterNon-Water
MaxMinMeanStdevMaxMinMeanStdev
TianjinMNDWI0.120.010.070.030.01−0.17−0.050.04
MLWI0.410.260.340.040.26−0.010.170.05
MSWI1.730.280.360.050.280.020.210.05
ShanghaiMNDWI0.210.060.130.040.06−0.21−0.010.05
MLWI0.340.070.200.070.07−0.19−0.050.07
MSWI1.080.200.410.090.20−0.16−0.010.10
GuangzhouMNDWI0.170.080.140.020.08−0.200.010.05
MLWI0.430.280.380.020.28−0.040.180.06
MSWI1.600.070.370.081.39−0.020.230.07
Table 3. The automatically calculated threshold results based on the water sample S.
Study AreaMNDWIMLWIMSWI
Tianjin0.040.300.31
Shanghai0.090.130.32
Guangzhou0.120.360.29
Table 4. Accuracy of the water area extraction results from the AUSWAEM and NDWI method.
Study AreaMethodKappaPA (%)UA (%)
TianjinAUSWAEM0.8984.195.1
NDWI0.5077.640.4
ShanghaiAUSWAEM0.9099.799.2
NDWI0.5649.868.2
GuangzhouAUSWAEM0.9393.894.5
NDWI0.5995.448.2
Table 5. Sensitivity analysis of all IUSW extraction models.
ModelKappa CoefficientKappa AverageModel Sensitivity
TianjinShanghaiGuangzhouStudy AreasStd
MLWI + MSWI0.830.80.870.830.03
AUSWAEM0.890.90.930.910.02
NDVI0.500.560.590.550.04
Table 6. Sensitivity analysis of threshold parameters of all water index.
Water IndexThreshold ParametersThreshold Sensitivity
TianjinShanghaiGuangzhouStd
MNDWI0.040.090.120.03
MLWI0.300.130.360.10
MSWI0.310.320.290.01
NDVI0.300.400.30.05
Publisher’s Note: MDPI stays neutral with regard to jurisdictional claims in published maps and institutional affiliations.