Article

Dynamic Channel Selection of Microwave Temperature Sounding Channels under Cloudy Conditions

1
Key Laboratory of Meteorological Disaster of Ministry of Education (KLME)/Joint International Research Laboratory of Climate and Environment Change (ILCEC)/Collaborative Innovation Center on Forecast and Evaluation of Meteorological Disasters (CIC-FEMD), Nanjing University of Information Science & Technology, Nanjing 210044, China
2
Key Laboratory of Radiometric Calibration and Validation for Environmental Satellites (LRCVES/CMA), National Satellite Meteorological Center, China Meteorological Administration (NSMC/CMA), Beijing 100081, China
*
Authors to whom correspondence should be addressed.
Remote Sens. 2020, 12(3), 403; https://doi.org/10.3390/rs12030403
Submission received: 10 December 2019 / Revised: 17 January 2020 / Accepted: 22 January 2020 / Published: 27 January 2020
(This article belongs to the Section Atmospheric Remote Sensing)

Abstract

:
To make better use of microwave radiance observations for data assimilation, removal of radiances contaminated by hydrometeor particles is one of the most important steps. Generally, all observations below the middle troposphere are eliminated before the analysis when precipitation is present. However, the altitude of the cloud top varies; when the weighting function peak height of a channel is higher than the altitude of the cloud top, observations are not affected by the absorption or scattering of cloud particles. Thus, the radiative transfer calculation can be performed under a clear sky scenario. In this paper, a dynamic channel selection (DCS) method was developed to determine the radiance observations unaffected by clouds under cloudy conditions in assimilation. First, the sensitivity of cloud liquid water (CLW) profiles to radiance from the microwave temperature sounding frequencies was analyzed. It was found that the impact of CLW on transmittance can be neglected where the cloud top height is below the weighting function peak height. Second, three lookup tables were devised through analysis of the impact of cloud fraction and cloud top height on radiance, which is the basis of the DCS method. The unified cloud top height of the Microwave Temperature Sounder (MWTS)-2 fields of view (FOVs) can be calculated by remapping the cloud mask and cloud top height data from the Medium Resolution Spectral Imager-2 (MERSI-2). Observations from various channels may be removed or retained based on real-time dynamic unified cloud top height data. Twelve-hour and long-term time-series brightness temperature simulation experiments both showed that an increase in the amount of observations used for data assimilation of more than 300% can be achieved by application of DCS, but this had no effect on the amount of error. Through DCS, areas of strong precipitation can be accurately identified and removed, and more observations above cloud top height can be included in the data assimilation. The application of DCS to data assimilation will greatly improve the data utilization rate, and therefore allow for more accurate characterization of upper atmospheric circulation.

Graphical Abstract

1. Introduction

Satellite radiance data have been applied to numerical weather prediction (NWP) since the 1990s, greatly improving forecast accuracy [1,2,3]. To date, satellite data, especially microwave sounding data, have been the main source of observational data [4,5,6,7,8] used in NWP models, and account for approximately 90% of the observations used in the European Centre for Medium-Range Weather Forecasts (ECMWF) assimilation system. Compared with infrared sounders, microwave sounders can penetrate non-precipitating clouds and provide additional vertical atmospheric temperature and humidity information [9].
Observations in the oxygen absorption band at 50–60 GHz in the microwave spectrum are often used to retrieve temperature profiles. There are 12 channels at 50–60 GHz in the Advanced Microwave Sounder Unit -A (AMSU-A), which identifies vertical temperature distributions from the surface to 3 hPa. The radiance information from the AMSU-A is one of the most important data sources added to the global NWP system in recent years [10,11,12], even after data from hyperspectral infrared sounders have been added [13]. Similar channels are found in both the Advanced Technology Microwave Sounder (ATMS) and the Microwave Temperature Sounder (MWTS)−2, which have comparable observation accuracy [14]. Observations from all three of these sounders have a positive impact on the forecast accuracy of numerical models through data assimilation [15,16,17].
Unlike conventional observations, the relationship between model variables and satellite observation data is non-linear, as it must be converted using a radiative transfer model. Radiative Transfer for TIROS Operational Vertical Sounder TOVS (RTTOV), one of several fast radiative transfer models, can calculate brightness temperature with a standard deviation (STDV) of less than 0.02 K for satellite microwave temperature sounding channels and less than 0.05 K for satellite microwave water vapor sounding channels when compared with a line-by-line model [18]. However, due to the strong scattering effects of precipitation clouds and ice particles, large discrepancies between simulations and observations occur in non-linear scattering simulations using fast radiative transfer models, which seriously affects the accuracy of the assimilation analysis [19,20]. RTTOV [21] and the Community Radiative Transfer Model (CRTM) have the ability to simulate precipitation and ice particle scattering, allowing radiance data in the presence of precipitation to be assimilated directly. However, due to a lack of accurate cloud parameter information from first guess as input for scattering models, direct assimilation of radiance data is still difficult for areas of precipitation.
To make better use of microwave radiance observations for data assimilation, the removal of data contaminated by hydrometeor particles is important. The most common cloud detection method allows for the detection of precipitation based on the deviation between observation and simulation brightness temperature (O-B) of satellite channels [22]. A scattering index [linear regression model of channel 15 and channels 1–3 of AMSU-A, used by the Advanced TIROS Operational Vertical Sounder (ATOVS) and Advanced Very High Resolution Radiometer (AVHRR) Pre-processing Package (AAPP)] has also been employed by English et al. [23]. If the scattering index exceeds a certain threshold, precipitation is assumed to be occurring at that pixel. The O-B in channel 4 of AMSU-A was used as the threshold for detecting precipitation by Gérard et al. [24]. Various channels of AMSU-A and AMSU-B were used to obtain the scattering index developed by Bennartz et al. [25]. The pixels are considered to be “precipitation-contaminated” when the cloud liquid water (CLW) path exceeds the threshold and cirrus clouds are identified by the 183 GHz channel [26]. Total precipitable water (TPW) indexes were calculated over ocean and land based on the observed and simulated radiance of channels 1 and 2 of the Microwave Humidity Sounder (MWHS) by Zou et al. [27]. MWHS data in the same field of view (FOV) are rejected if the TPW index is greater than 1. Qin et al. [28] improved this method. They used observations from two MWHS channels and two AMSU-A channels to retrieve cloud liquid water path and cloud ice water path data over the ocean, respectively, and derived a new land index by using the mean and STDV of radiance for all five MWHS channels. Observations considered to be contaminated by precipitation, i.e., exceeding the threshold over land, were removed.
Due to a lack of channels at 21.8 GHz, 31.4 GHz and 89.0 GHz on the MWTS, a new precipitation detection method based on Visible and Infrared Radiometer (VIRR) cloud mask pixels from the MWTS-1 onboard the Fengyun-3A (FY-3A) satellite was used by Li et al. [29]. The cloud mask from VIRR is matched to the MWTS-1 FOV data to calculate the cloud fraction. Through a number of tests, a reasonable threshold can be derived for precipitation detection, as an alternative to a conventional precipitation detection. This method has also been applied to data from the Fengyun-3C/D (FY-3C/D) MWTS-2 in the Global and Regional Assimilation and PrEdiction System (GRAPES) of the China Meteorological Administration (CMA) [16]. Similarly, the high-resolution cloud products of the Moderate Resolution Imaging Spectroradiometer (MODIS) and Visible Infrared Imager Radiometer Suite (VIIRS) were used for precipitation detection of AMSU-A and ATMS, respectively, by Han et al. [30].
For microwave temperature sounding channels, radiance can be affected not only by scattering of large raindrops and ice particles, but also by absorption of small cloud water particles [31]. Hydrometeor variables are not control variables in most operational Centers. [32]. A lack of hydrometeor control variables may result in incorrect weighting in the analysis between the background and observation [33]. Generally, all the channels selected in assimilation are eliminated when precipitation is found in clear-sky assimilation. However, clouds show dynamic forms and the altitude of the cloud top varies. When the weighting function peak height of a channel is higher than the altitude of the cloud top, observations are not affected by the absorption or scattering of cloud particles and the radiative transfer calculation can be performed under a clear sky scenario. The existence of a non-precipitation cloud without calculation of the absorption of CLW may affect the results of brightness temperature simulations. If more of the observations above precipitation not affected by clouds could be assimilated, the analysis may be improved. Therefore, it is necessary to determine whether the water content affects radiative transfer and how the cloud top height affects the simulation.
To solve the aforementioned problem, a dynamic channel selection (DCS) method was developed in this study, for use with microwave temperature sounding channels under cloudy conditions, by considering various cloud top heights and cloud fractions. Due to the poor vertical resolution of the MWTS-2, it cannot accurately calculate the altitude of the cloud top, so an estimation is instead achieved using an imager onboard the same platform. In this study, the sensitivity of CLW to the microwave sounding channel (from 50–60 GHz) in a fast radiative transfer model was analyzed. The deviation between clear radiance and total radiance for a given pixel was calculated taking both the cloud fraction and the cloud top height into consideration. Then, three lookup tables were derived based on the deviations, and real-time cloud fraction and cloud top altitude values were used to select the appropriate microwave sounding channels under cloudy conditions. The MWTS-2 onboard FY-3D was used as the research object in this study. The cloud mask and cloud top height data of Medium Resolution Spectral Imager-2 (MERSI-2) onboard FY-3D were remapped to the MWTS-2 FOVs to allow implementation of the DCS method.
A radiative transfer equation considering cloud water absorption and the sensitivity of CLW to the microwave temperature channel is discussed in Section 2. The method for DCS and cloud parameter remap is described in Section 3. Details and specifications of the satellites, data and experimental design are provided in Section 4. The results are provided in Section 5. Section 6 provides a discussion and conclusion.

2. Theory

2.1. Radiative Transfer Equation Considering Cloud Liquid Water

A fast radiative transfer model is required to simulate brightness temperature efficiently and accurately for NWP. When a non-precipitating cloud exists at a given pressure level, the upwelling radiance at the top of the atmosphere L i , to channel i , neglecting particle scattering effects, can be written as follows [34]:
L i = ( 1 N ) L i C l r + N L i C l d ,
where L i C l r and L i C l d are the clear radiance and cloudy radiance, respectively, and N is the fractional cloud cover. If N is set to zero for clear sky, the second term on the right side of Equation (1) is zero, and L i can be written as below:
L i = L i C l r = ε i s u r τ i s u r B ( T s ) i + P s u r P t o p B ( T ) i τ p d p + ( 1 ε i s u r ) τ i s u r 2 P s u r P t o p B ( T ) i τ 2 τ p d p ,
where ε s is the surface emissivity, B ( T ) is the Plank function, τ i s u r is surface-to-space transmittance, T s is surface temperature, P t o p is the pressure at the top model layer, P s u r is the surface pressure, and τ is transmittance from model layers to space. τ i , j can be converted to optical depth σ i , j at model layer j :
τ i , j = exp ( σ i , j ) ,
The equation for linear expansion of optical depth follows:
σ i , j = σ i , j 1 + k = 1 M a i , j , k X j , k ,
where X j , k are the predictors, a i , j , k are the transmittance coefficients, M is the number of absorbing gases, and k is the k th of these.
Only mixed gases and water vapor are mandatory input coefficients for calculating transmittance under clear sky conditions in RTTOV. However, in the presence of non-precipitation clouds, it is necessary to take account of the effects of CLW. The optical depth of CLW is written as follows [35]:
σ c l w , j = j = m w c l d t o p n l e v s 4.5 · f 2 · X j , clw Z b * ( 2 + Z a * ) 2 + Z b * 2 ,
where X j , clw are the CLW predictors associated with the satellite zenith angle, f is the central frequency of the channel, n l e v s is the number of model layers and m w c l d t o p is the top layer of cloud in the CLW profile; this is set to 322 hPa because it is believed that a scattering effect of ice particles occurs above 322 hPa. Z a * and Z b * are denoted as below:
Z a * = D 3 f 2 · ( D 3 D 4 f 2 + D 1 2 + D 4 D 5 f 2 + D 2 2 ) ,
Z b * = f · [ D 1 · ( D 3 D 4 ) f 2 + D 1 2 + D 2 · ( D 4 D 5 ) f 2 + D 2 2 ] ,
where D x   ( x = 1 , 2 , 3 , 4 ) are the experience factors.

2.2. Sensitivity of CLW Profiles to Radiance

The 50–60 GHz satellite channels at oxygen band absorption were used to obtain the air temperature profile. Radiance data from the channels at 52.8, 53.6, 54.4, 54.94, 55.5 and 57.29 GHz were analyzed, and the weighting function peak heights of these channels were between the surface and 90 hPa (Figure 1).
The Jacobians of brightness temperature to perturbations in atmospheric parameters were calculated. Jacobians are fundamental for radiance assimilation and can be derived as follows for CLW [36]:
J ( CLW ) = | B T 1 c l w 1 B T 2 c l w 1 B T 1 c l w 2 B T 2 c l w 2 B T m c l w 1 B T m c l w 2 B T 1 c l w j B T 2 c l w j B T m c l w j | ,
where m is the number of channels.
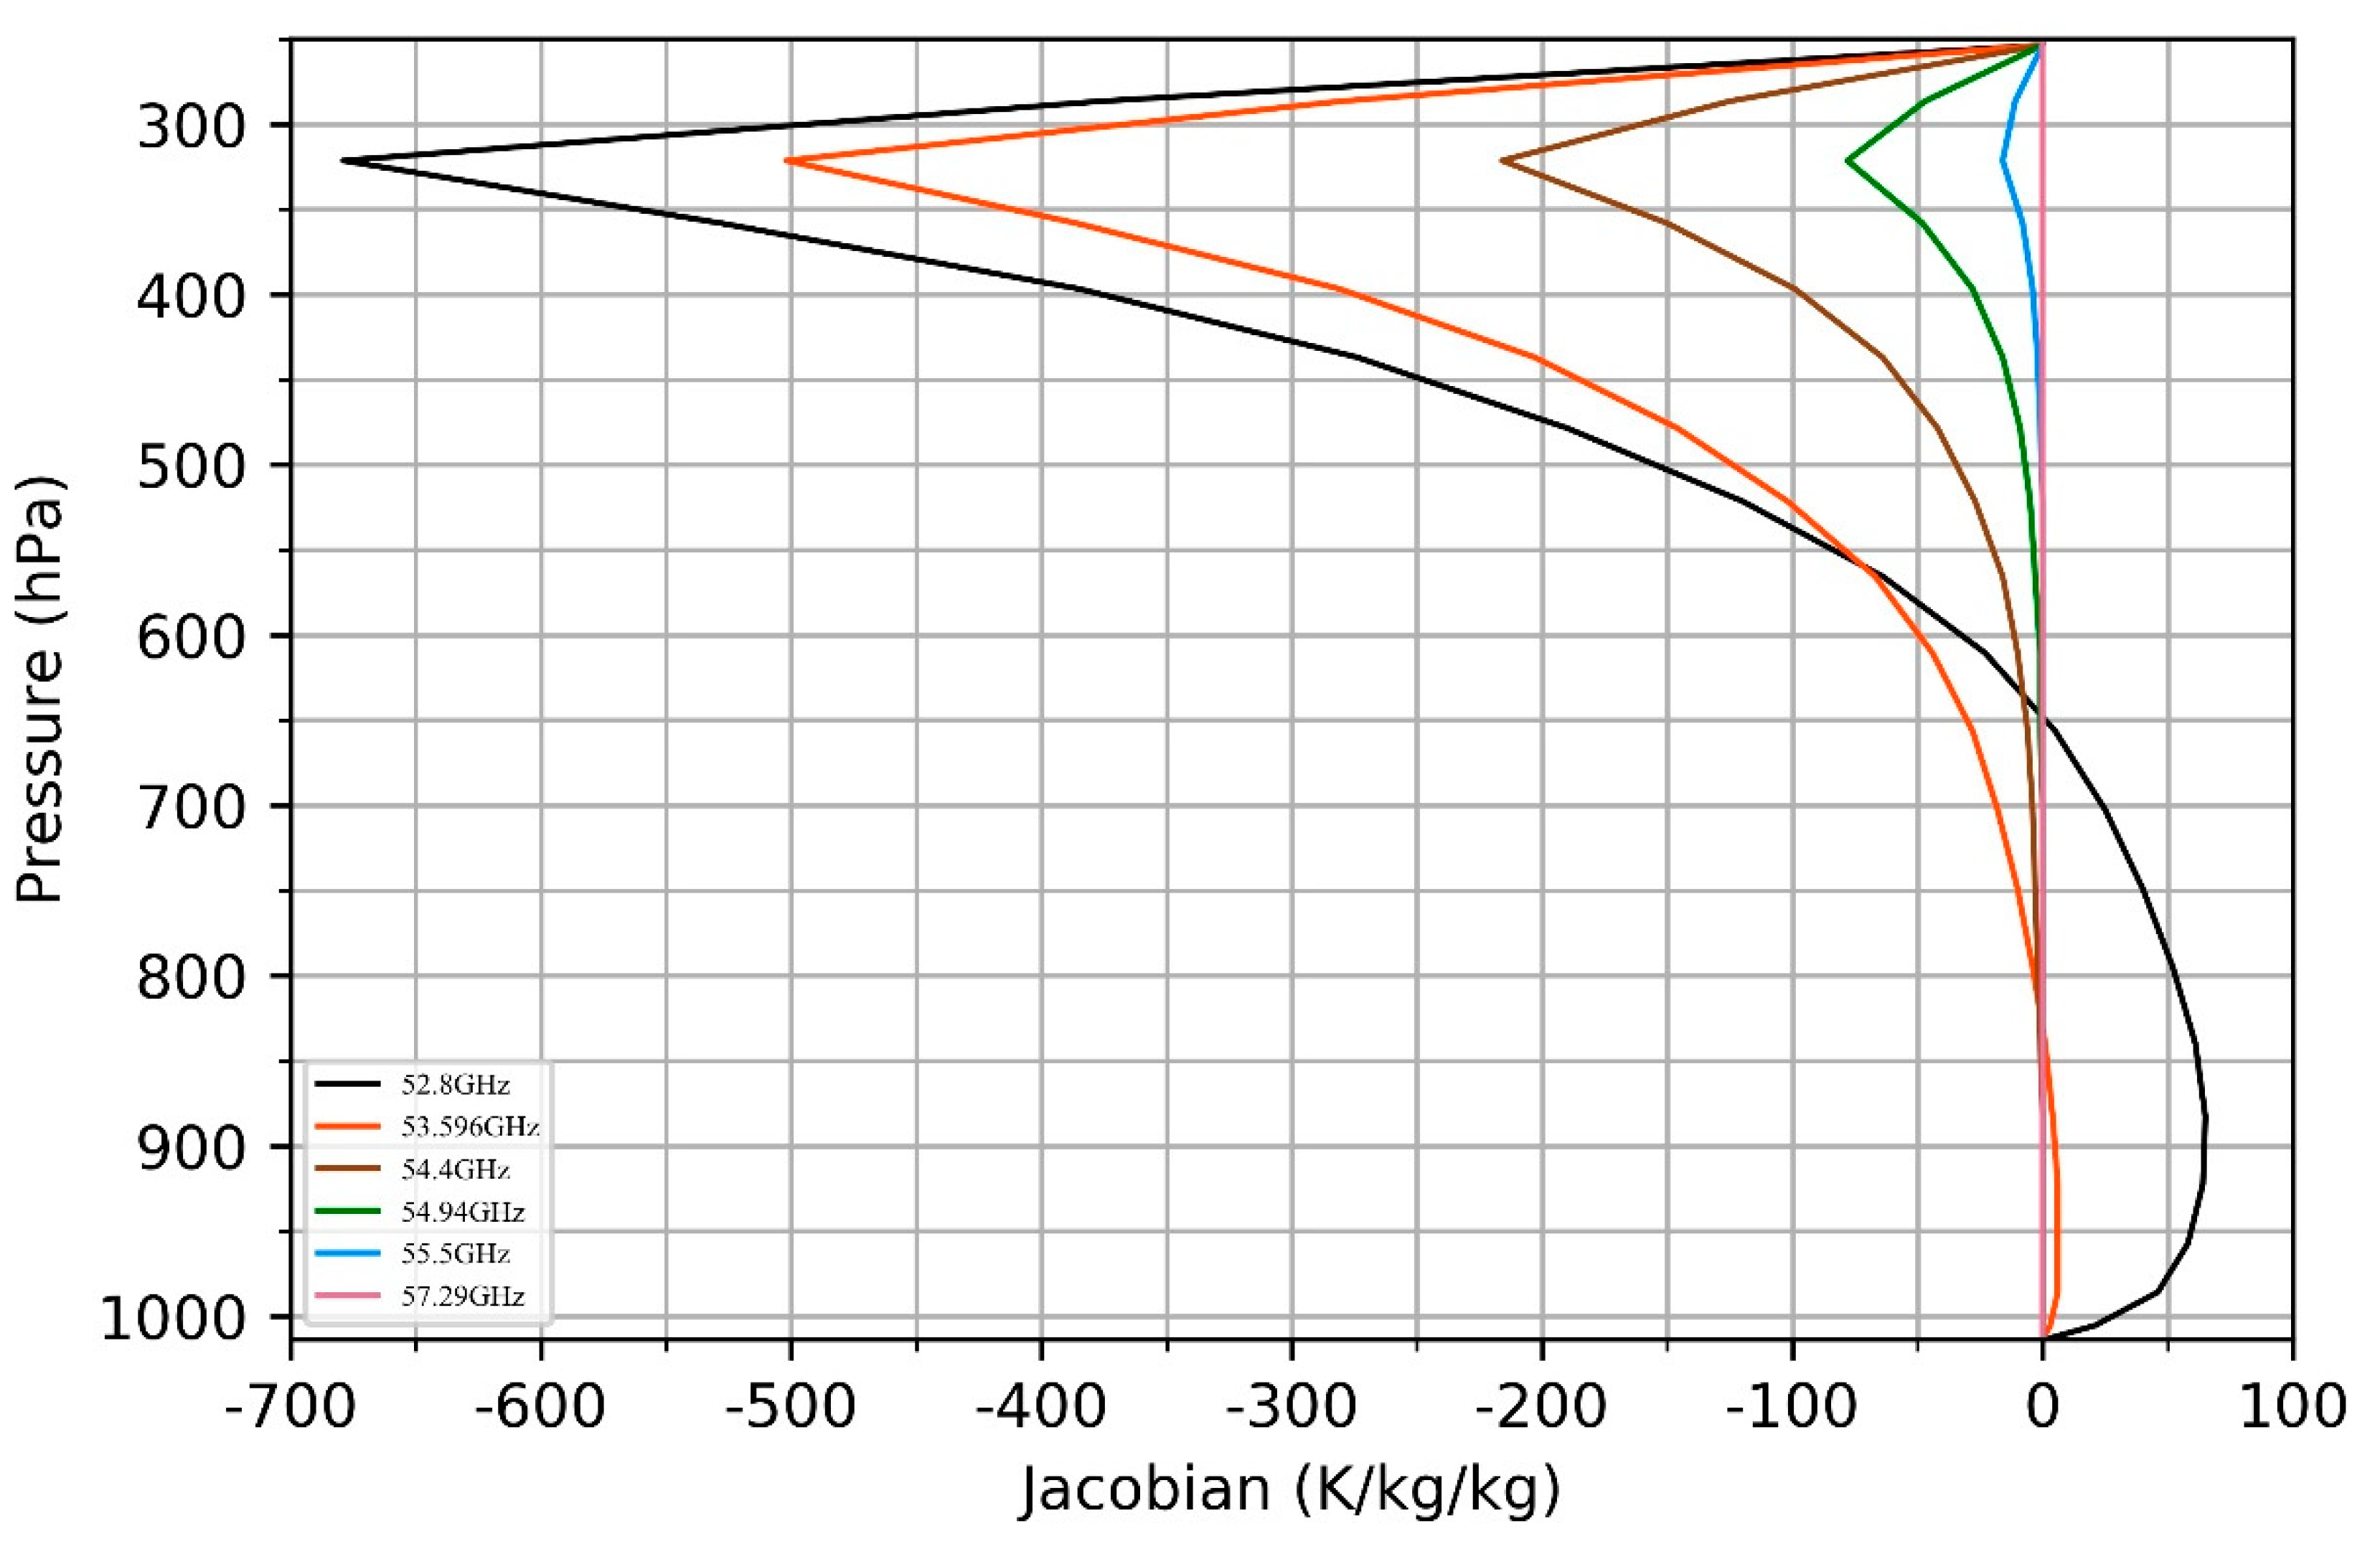
The CLW Jacobians were calculated using Equation (8) for the selected channels and are shown in Figure 2. Here, RTTOV v9 [37] is used. Note that the latest version (v12.3) has been enhanced in several ways, including more complete documentation and more options to compute the absorption [18]. The CLW input was set to 0.0001 kg/kg in the layers from 1,013 hPa to m w c l d t o p . The sensitivity of CLW profiles to radiance decreases with altitude, where greater CLW leads to a lower brightness temperature. This negative correlation becomes stronger with decreasing frequency. The maximum negative value occurs at 322 hPa, except for 57.29 GHz. This is because the absorption of CLW is calculated below this altitude. For the channels at 52.8 and 53.6 GHz, an increase in CLW results in an increase in brightness temperature below 650 and 800 hPa, respectively. In summary, higher cloud and lower frequency are associated with a greater impact of CLW on brightness temperature.
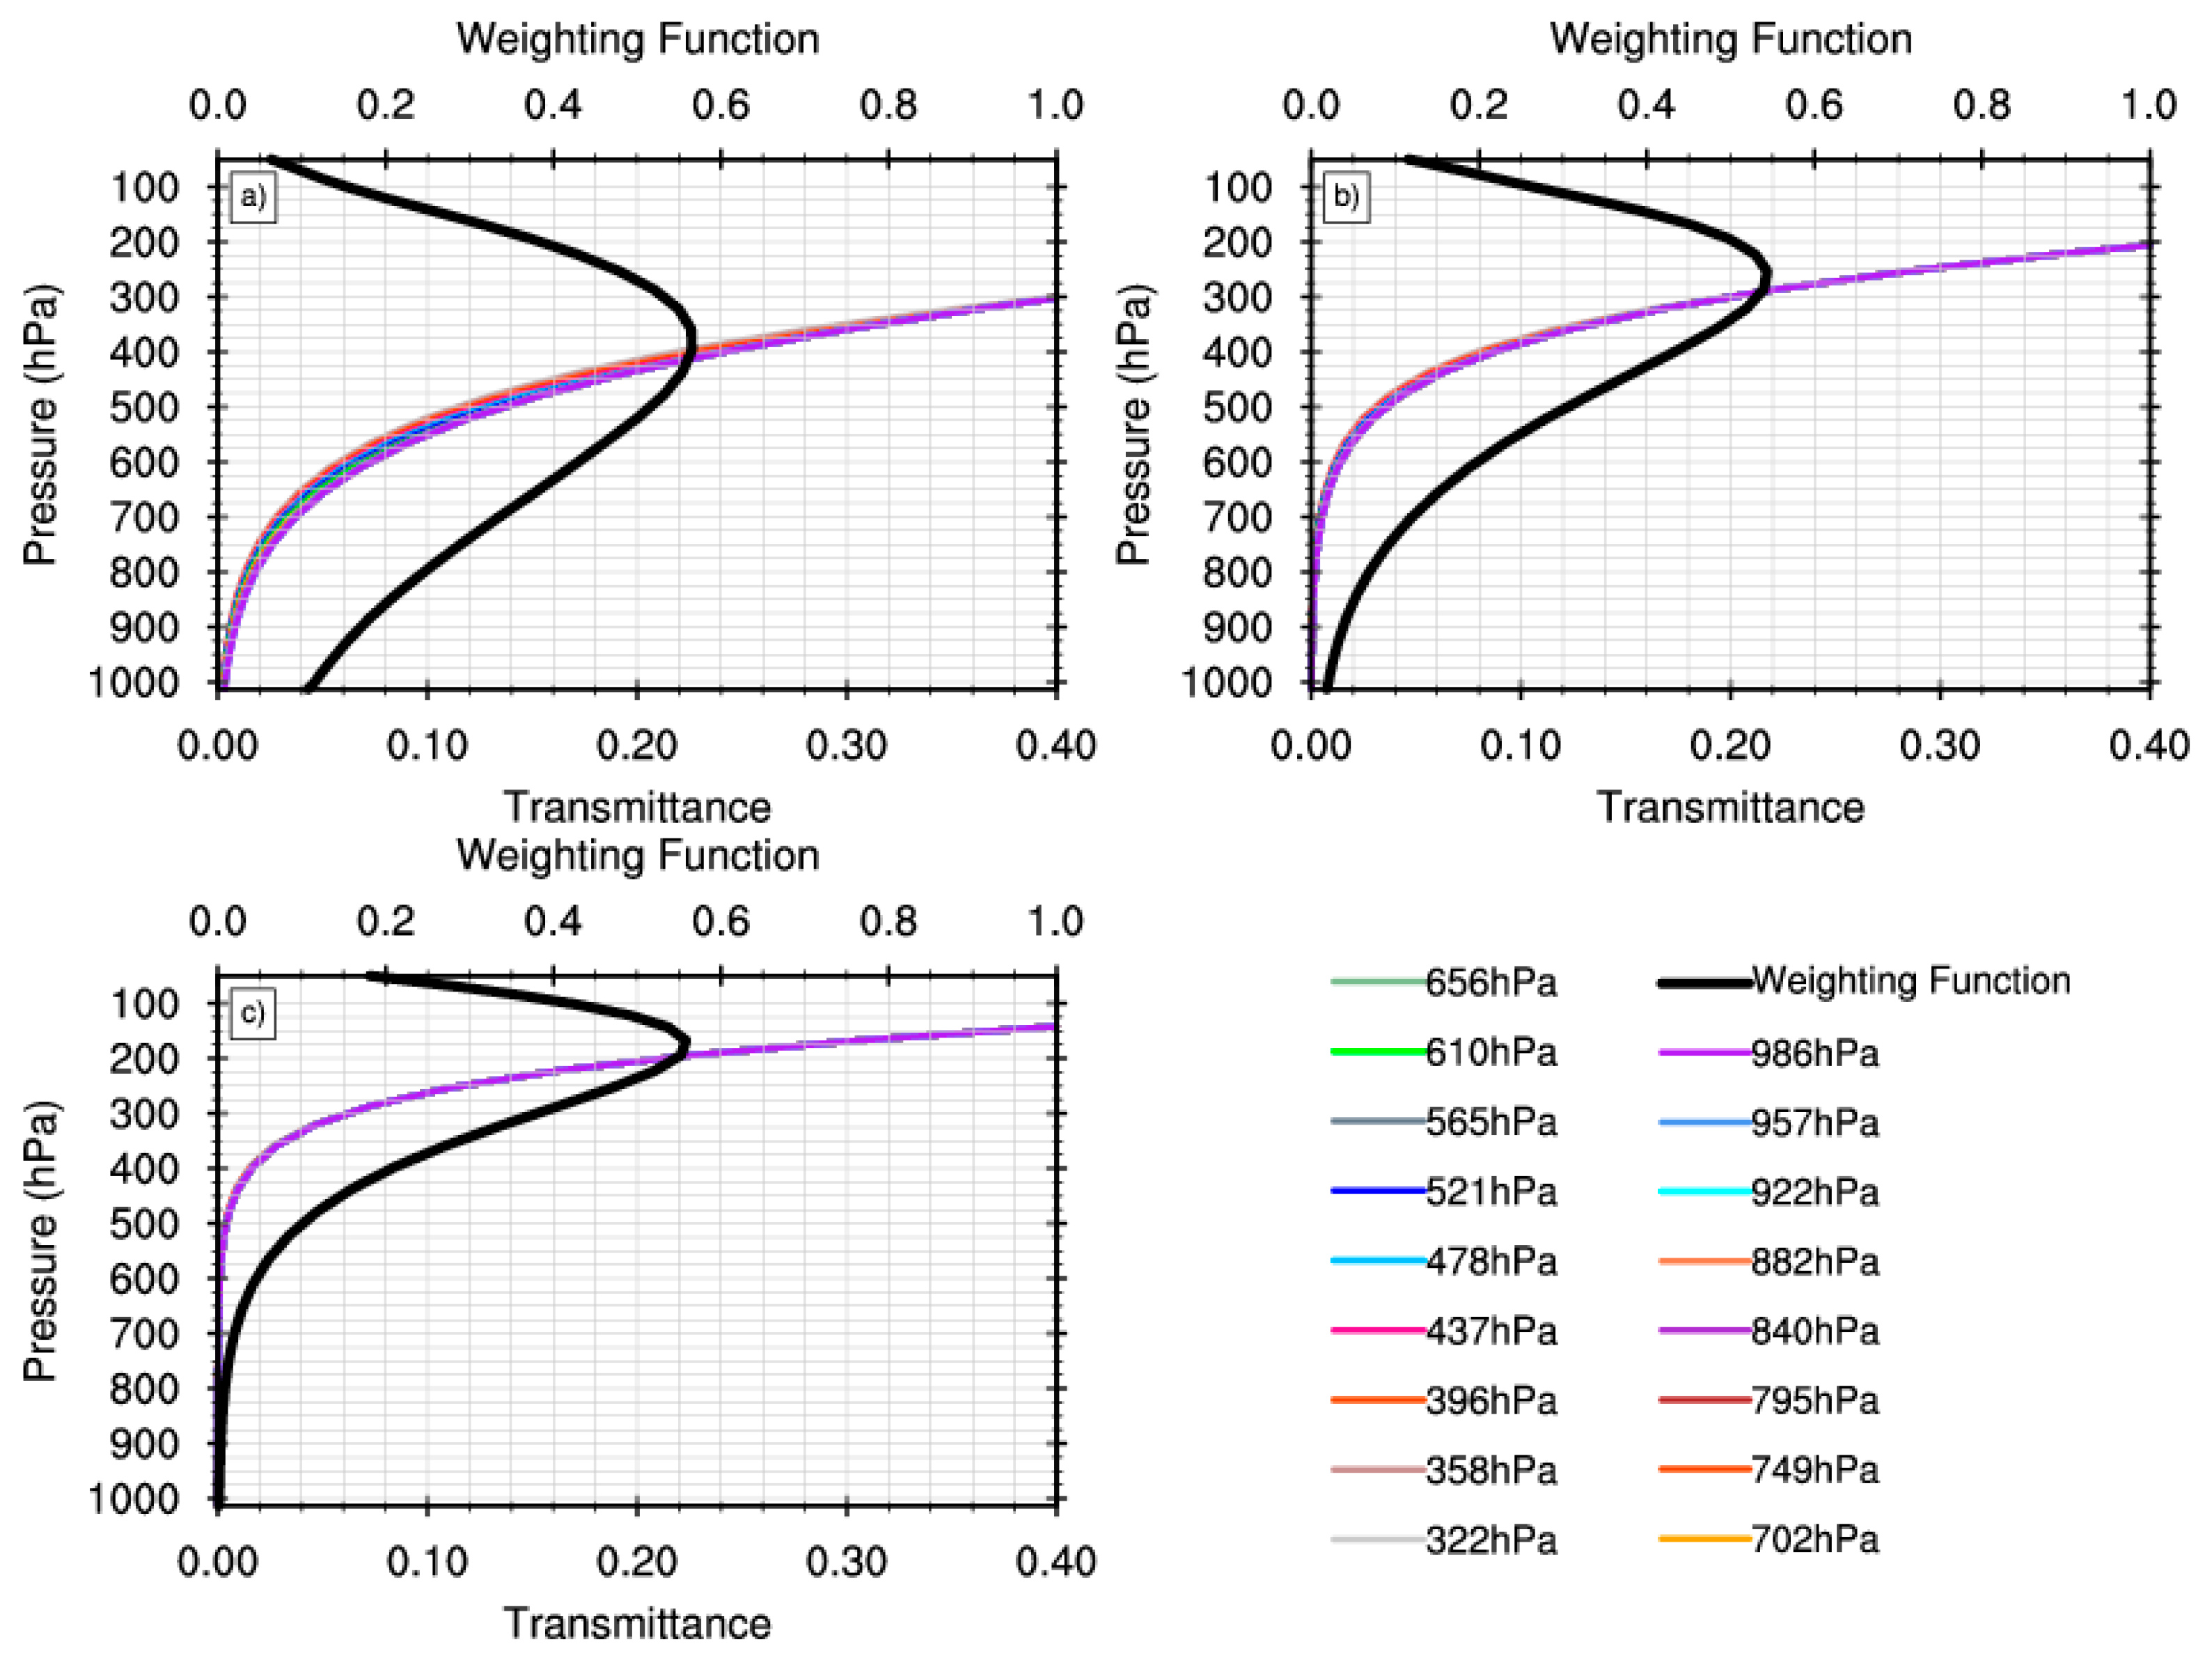
When further analyzing the frequencies affected by CLW, the 52.8, 53.6 and 57.29 GHz were not considered because their sensitivity to CLW is at two extremes (too sensitive or insensitive). Transmittances at the other three frequencies were calculated with different CLW profiles using Equations (3)–(5). The top of the CLW profiles varied from 322 to 986 hPa. It was found that for an “overcast pixel”, the influence of the height of CLW on transmittance decreased with an increase in the weighting function peak height. For the channel at 54.4 GHz, large variation in transmittance profiles was seen as the height of CLW changed. The maximum variation in transmittance was 0.025, at approximately 435 hPa, which is close to the peak height of the channel (400 hPa; Figure 3a). When the top of the CLW is much lower than the maximum weighting function of the channel, the transmittance variation is greatly reduced. For the channel at 54.94 GHz, the variation in transmittance becomes much smaller, and the maximum transmittance variation is 0.009 at approximately 390 hPa (Figure 3b). The largest change in transmittance was about 0.002, at 300 hPa, for the 55.5 GHz channel (Figure 3c). The maximum variation of these two channels is lower than the weighting function peak height (270 and 180 hPa, respectively). The greater the difference between the top of the CLW and the weighting function peak height, the lower the effect of CLW on the transmittance. This indicates that the impact of CLW on transmittance can be neglected for channels where the cloud top height is below the weighting function peak height.

3. Methodology

3.1. Dynamic Channel Selection

If a non-precipitating cloud has thickness and exists in many layers, Equation (1) can be re-written as follows:
L i = ( 1 N m a x ) L i c l r + N m a x L i c l d ,
where N m a x is the maximum cloud fraction from all layers and can be presented as below:
N m a x = M a x ( N j ) ,
Cloudy radiance L i c l d can be written as follows:
L i c l d = P s u r P b o t t o m c l d B ( T ) i τ p d p + P b o t t o m c l d P t o p c l d B ( T ) i τ p d p + P t o p c l d P t o p B ( T ) i τ p d p ,
where P b o t t o m c l d and P t o p c l d are the pressures at the top and bottom of a cloud, respectively. Assuming that the weighting function peak height is already higher than the cloud top height, the transmission below the cloud is small and the absorption in the cloud is strong, so the first and second terms on the right can be ignored and Equation (11) can be rewritten as below:
L i c l d = P t o p c l d P t o p B ( T ) i τ p d p ,
To assess the impact of cloud fraction and cloud top height on total radiance, the difference between total radiance (containing cloud) and clear sky radiance can be written as below:
d i f f = L i   L i c l r = [ ( 1 N m a x ) L i c l r + N m a x L i c l d ] L i c l r = N m a x ( L i c l d L i c l r ) ,
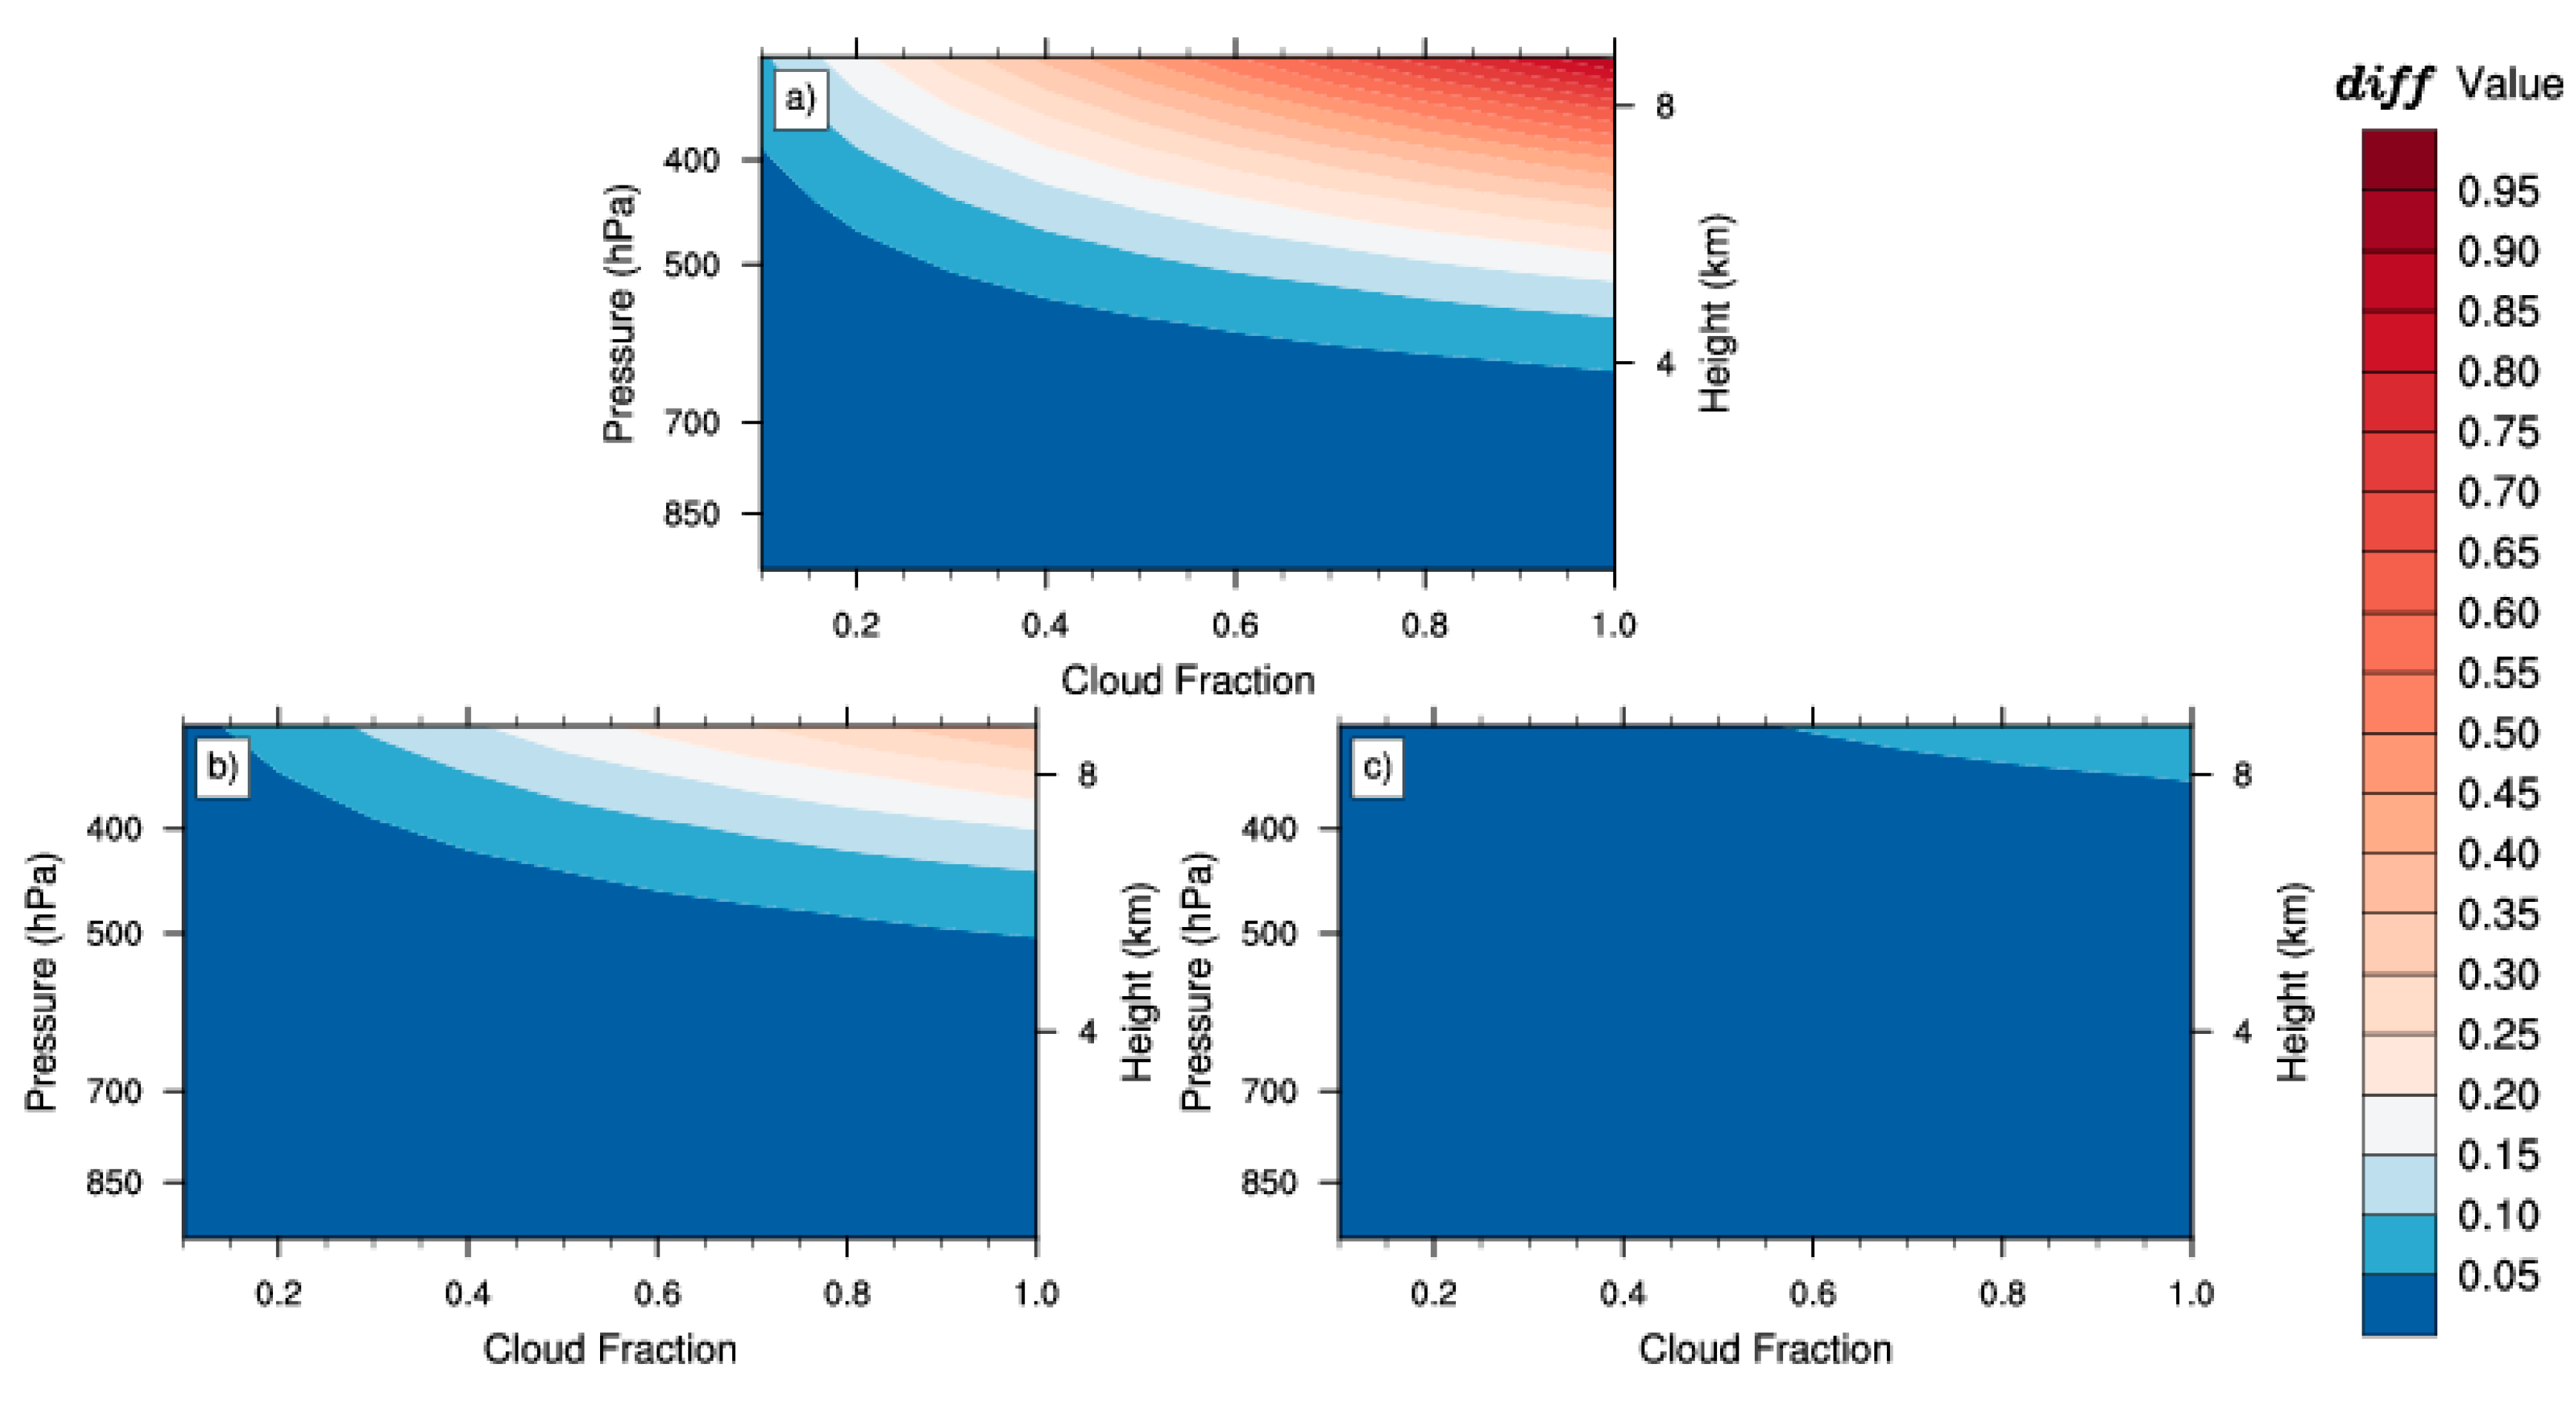
It can be seen that, for the channel at 54.4 GHz (with a weighting function peak height at approximately 400 hPa), changes of cloud fraction and cloud top height cause d i f f to vary from 0.05 to 0.7 (Figure 4). However, the variation in d i f f is reduced at higher frequencies. For the channel at 55.5 GHz (with a weighting function peak height at approximately 180 hPa), the simulated brightness temperature is almost unaffected by clouds and the d i f f is stable, varying by only 0.1. A certain d i f f value is selected as the threshold when assessing the impact on radiance of a specific cloud fraction and cloud top height. For the area above the threshold contour, a larger d i f f corresponds to a larger simulation error. A lookup table can be derived from the threshold. If the cloud parameters exceed the threshold, the observations from the channel should be rejected. In this study, the d i f f values were set as 0.05, 0.10 and 0.20 K, and three lookup tables were derived for each threshold.

3.2. Cloud Parameters in MWTS-2 FOVs

FY-3D MWTS-2 and MERSI-2 data were used from this point forward. MWTS-2 onboard FY-3D, which has a 50–60 GHz oxygen absorption band, can be used to obtain temperature profiles from the surface to 0.5 hPa. MWTS-2 is a cross-track instrument with a beam width of 2.2° for each FOV, and each scanline has 90 FOVs. The spatial resolution of the MWTS-2 is approximately 33 km, and the scanning period is 8/3 s. In contrast to AMSU-A and ATMS, MWTS-2 has a channel at 51.76 GHz, but no channels at 23.8, 31.4 or 89.0 GHz. As these three channels are the main channels used to retrieve the scattering index [38,39], their absence makes it difficult to detect cloud and precipitation using MWTS-2 data alone.
MERSI-2 is an imager with 6 visible channels, 10 visible/near infrared channels, 3 shortwave infrared channels and 6 medium/long infrared channels. The observation data from MERSI-2 are used to obtain a variety of cloud products, including a cloud mask, which can be used to determine whether a given MERSI-2 pixel is a "cloudy" or "clear sky" pixel, and cloud parameters, such as cloud top height and temperature.
According to the discussion above, the cloud parameters (i.e., cloud fraction and cloud top height) in each MWTS-2 FOV are required. Hence, the MERSI-2 cloud products should be remapped to MWTS-2 FOVs. The cloud products from MERSI-2 have high spatial resolution. The spatial resolutions of cloud mask and cloud top height are 1 and 5 km, respectively. The FOVs of MWTS-2 are much larger than those of the MERSI-2 cloud product, which results in a fractional rather than full cloud coverage in MWTS-2 FOVs. The cloud masks of MERSI-2 can be remapped to specific MWTS-2 FOVs [40], and the number of pixels can be determined for every MWTS-2 FOV. Hence, the cloud fraction of MWTS-2 FOVs can be defined as the ratio of the number of cloudy pixels to the total number of MERSI-2 pixels.
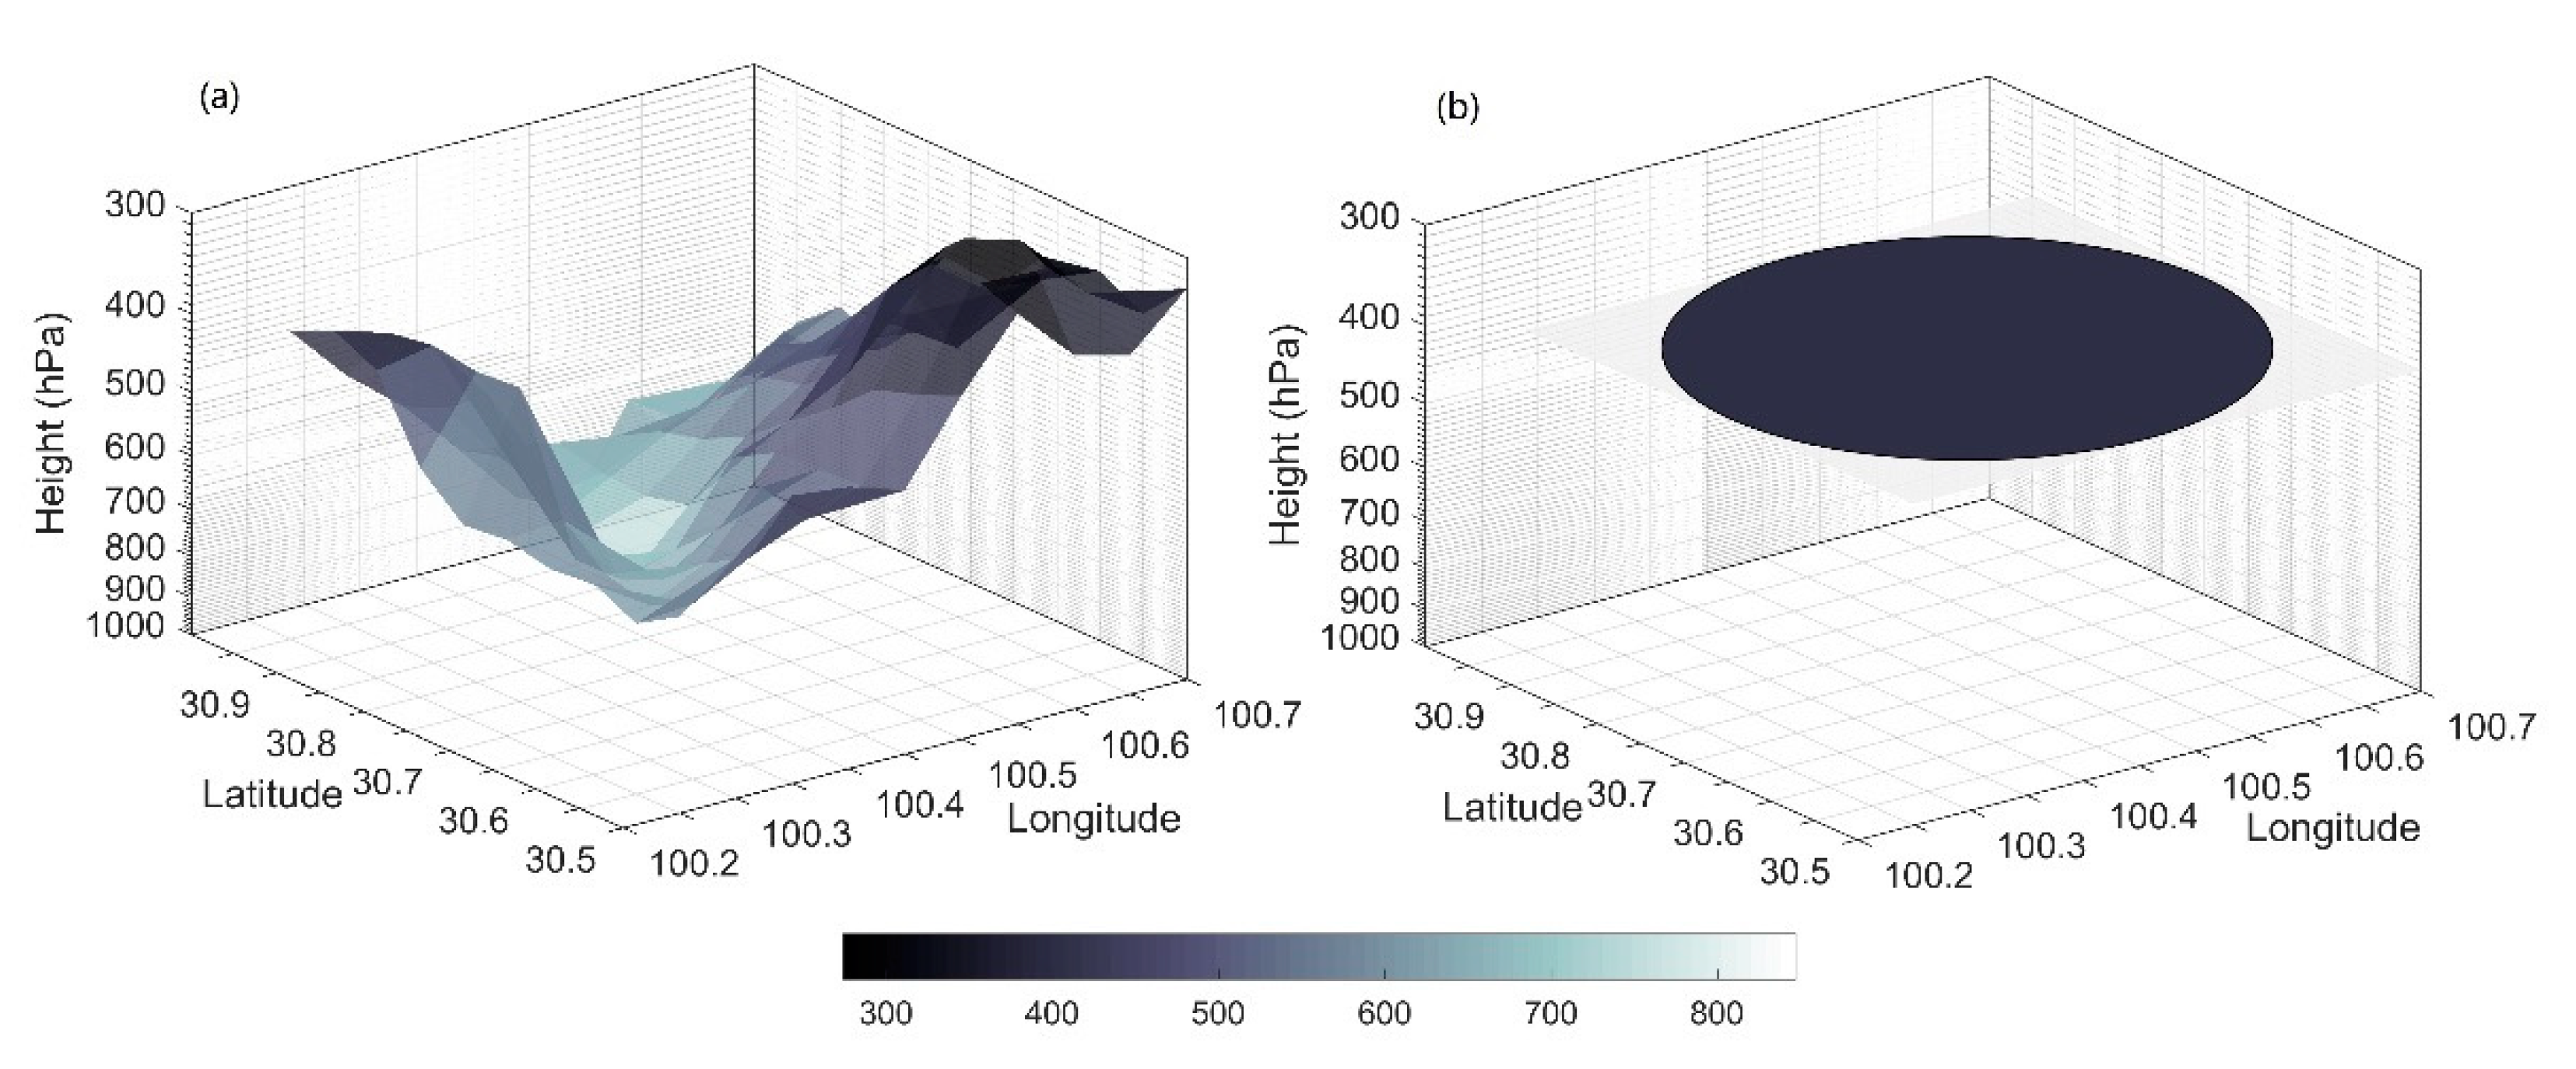
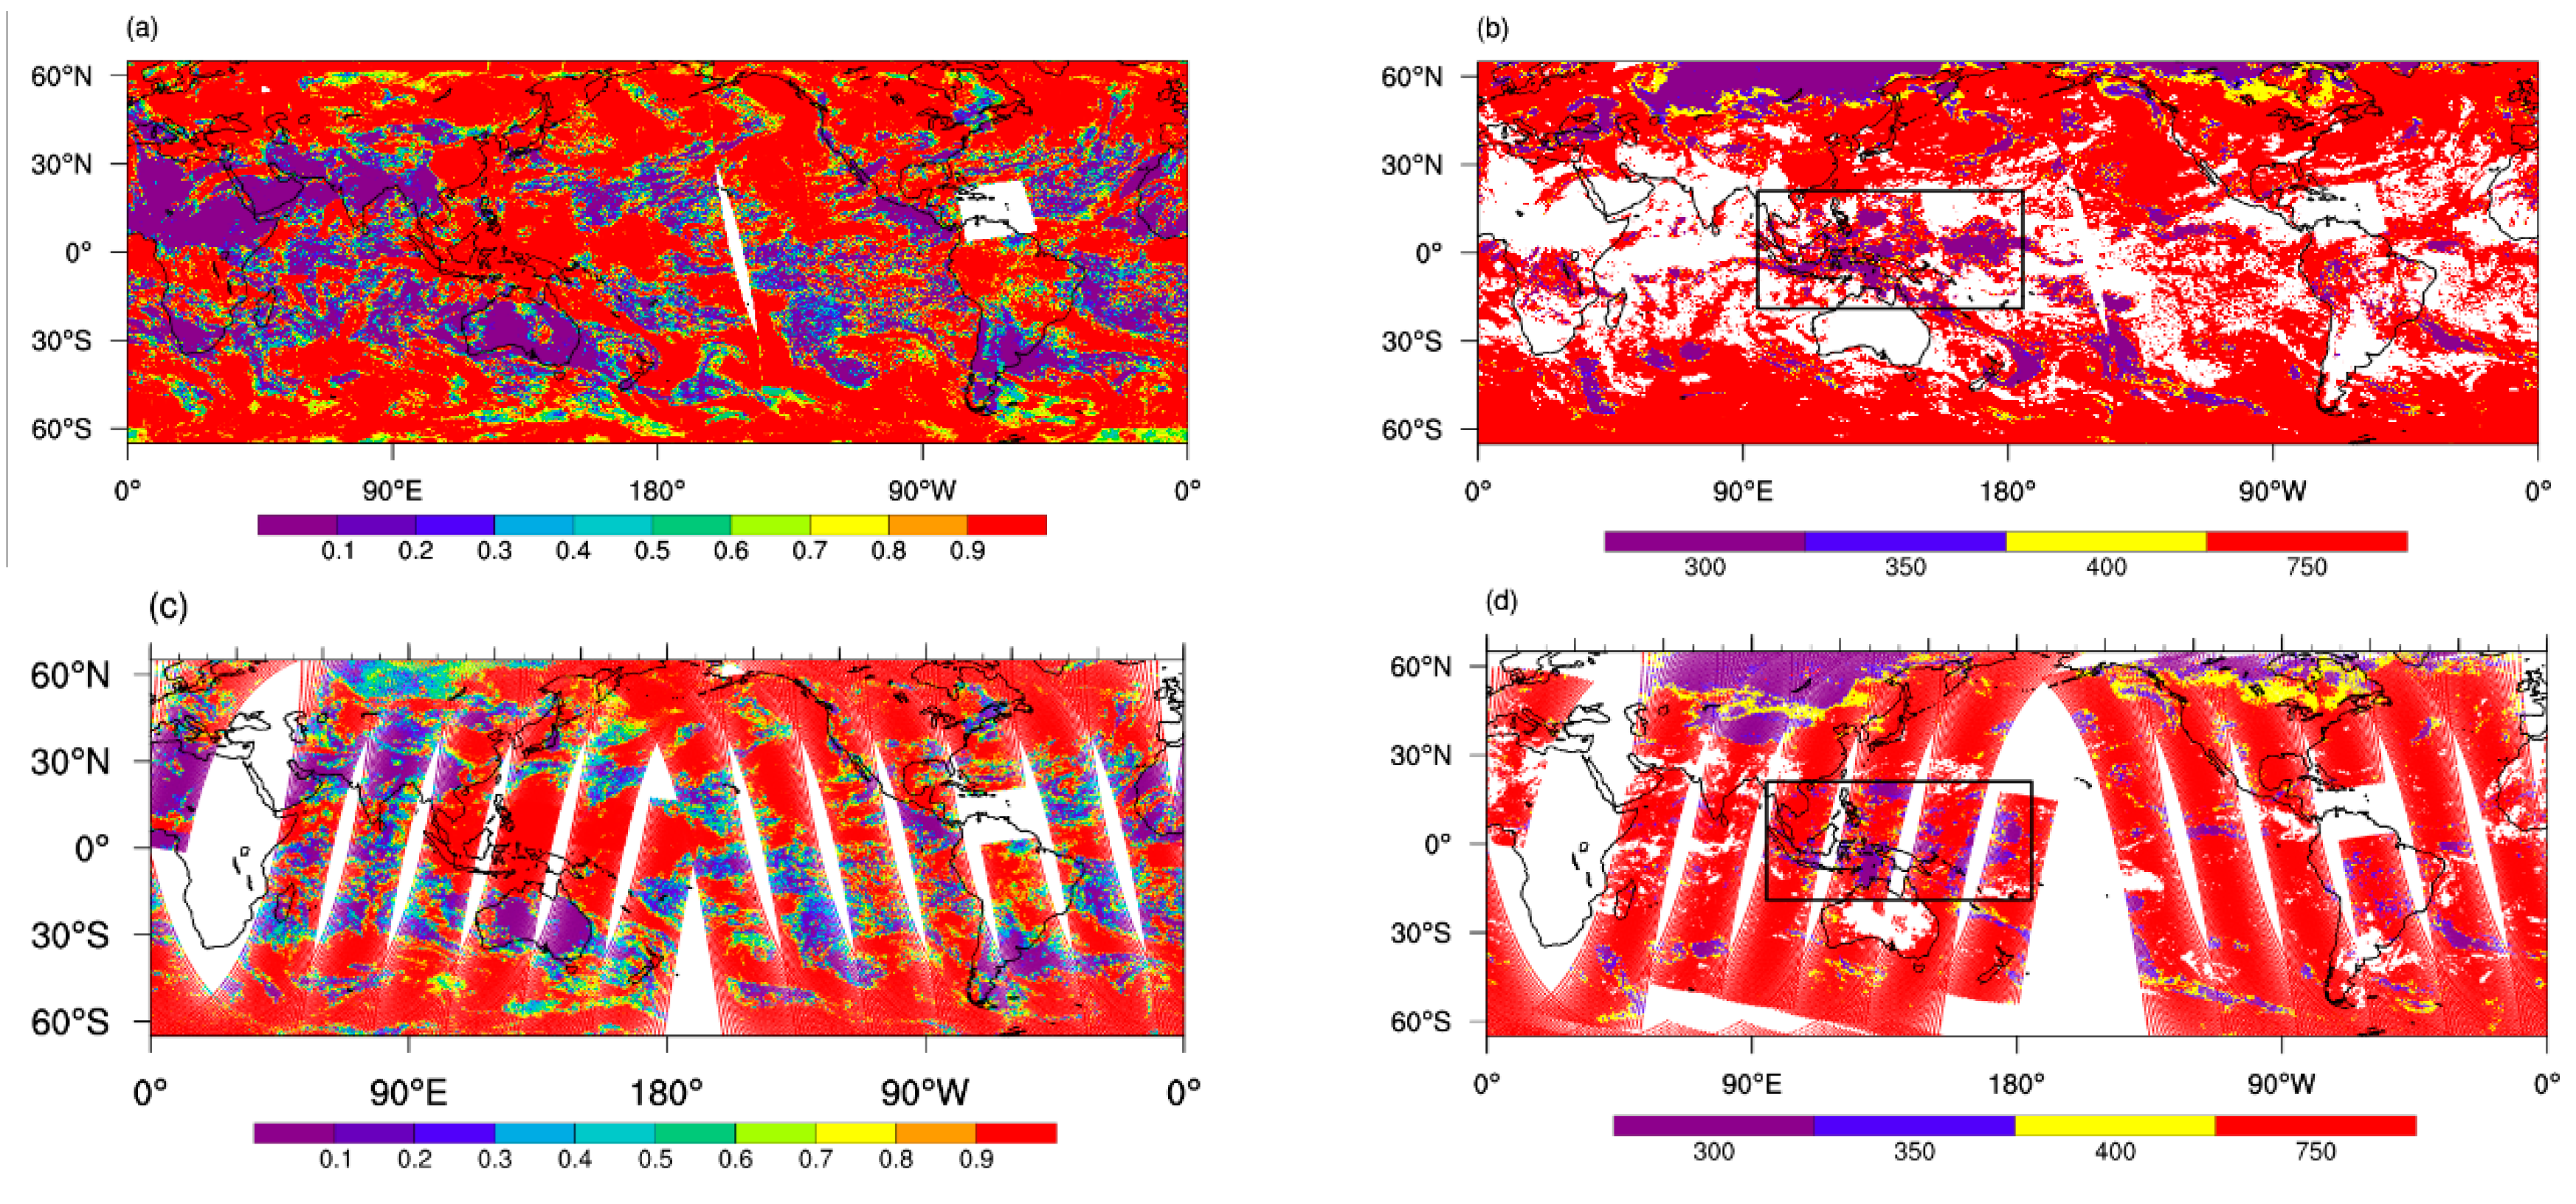
Because each MERSI-2 pixel differs in terms of cloud top height (Figure 5a), it is difficult to represent a large-size MWTS-2 FOV with a certain value. Thus a “unified” cloud top height is needed to measure the final impact of different cloud top heights. In this study, we present a method to obtain the unified cloud top pressure based on the number of cloudy pixels at different altitudes, and considering the impact of both the distribution of cloud fraction and the cloud top height. The unified cloud height, which can exert a major influence on radiation flux, can then be determined for MWTS-2 pixels (Figure 5b). After the remap, 300, 350, 400 and 750 hPa were selected as unified cloud top height values.
It is noteworthy that the MERSI-2 channels are mainly of visible and near infrared frequencies, which are less able to penetrate cloud than microwaves. Thus, the cloud area retrieved using MERSI-2 observation data would be much higher than that retrieved using microwave data. This guarantees that no cloud will be misrecognized.

4. Simulations of Brightness Temperature

4.1. Experimental Design

For this study, 0.25° × 0.25° NCEP Global Forecasting System (GFS) analysis fields are used to simulate the brightness temperature for channels 5 (54.4 GHz), 6 (54.94 GHz) and 7 (55.5 GHz) of MWTS-2 using RTTOV v11.3. The observations are thinned to 120 km grids to avoid interference caused by potential correlations between adjacent observations. The MWTS-2 observation data obtained from seven orbits, covering 12-hour, were used in the first step of the experiment. The observation data obtained between 0600 UTC on December 21, 2018, and 0600 UTC on December 28, 2018 were used in subsequent week-long experiments. The cloud mask and cloud top height data from MERSI-2 were remapped to the MWTS-2 FOV for the same time period using the method described in Section 3.2, and converted to L1c format by the National Satellite Meteorological Center (NSMC).
Four brightness temperature simulation experiments were carried out to assess the impact of O-B errors on DCS. In a control experiment (CRTL), all MWTS-2 observations of precipitation (cloud fraction > 0.76) were removed, as per the CMA method used by GRAPES. The other three experiments (DCS05, DCS10 and DCS20) used the three lookup tables described in Section 3.1.
The quality control procedures applied in this study were as follows: (1) gross error detection: observations with a brightness temperature lower than 50 K or higher than 550 K were removed; (2) outlier detection: O-Bs exceeding either 15 K or three times the STDV of observation error were removed; (3) surface type detection: mixed surface-type observations were removed due to the difficulty of determining surface emissivity; (4) scan position check: the data for the eight outermost FOVs, for all channels, were removed, because the limb observations have larger FOVs and higher atmospheric inhomogeneity which cannot be accurately simulated. All of these quality control processes were applied after systematic bias in the MWTS-2 data was corrected for using the variational bias correction (VarBC) module [41] of the Weather Research and Forecasting model data assimilation system (WRFDA).

4.2. Comparison of Cloud Parameters between MERSI-2 and MWTS-2

The cloud mask and cloud top height data obtained by MERSI-2 on December 25, 2018, are presented in Figure 6a,b. The cloud fraction and unified cloud top height data remapped to the MWTS-2 FOV data are presented in Figure 6c,d. The MWTS-2 spatial resolution of 33 km at nadir is not sufficient to reveal differences between broken cloud and clear areas; the high-resolution MERSI-2 cloud products are more accurate in identifying clouds. However, the distributions of these two types of cloud coverage data are similar, although the resolution differs. Hundreds of MERSI-2 pixels for cloud top height were remapped to the MWTS-2 FOV data; this resulted in some blurring with respect to cloud height, although the main cloud features can still be identified (black box in Figure 6b,d). It is worth noting that the purpose of our remap method was not to obtain accurate remapped cloud parameters, but instead to determine the effects of cloud top height on the simulation results.

5. Analysis of Experimental Results

5.1. The 12-hour Experiment

5.1.1. Impact of DCS on the Quantity of MWTS-2 Observations

The number of radiance observations of selected channels of the MWTS-2 are shown in Figure 7a at 0600 UTC, and in Figure 7b at 1200 UTC, on December 10, 2018; after applying the quality control measures, there were 88,948 and 89,796 observations, respectively. With greater weighting function peak heights, the number of observations that can be used in data assimilation increases. At 0600 UTC, the quantity of observations from channel 5 increases by a factor of approximately 2.6, from about 10,880 in CRTL to more than 27,000 after applying DCS; for channels 6 and 7, the respective numbers are about 13,000 and more than 32,000. For the experiments using the three lookup tables, no significant difference was found in the quantity of observations among the three channels: for channel 5, the quantity was largest for DCS05 (27,571), while for channel 6 it was largest for DCS10 (32,937), and for channel 7 it was again largest for DCS05 (34,923). Similar results were seen for the 1200 UTC data set.
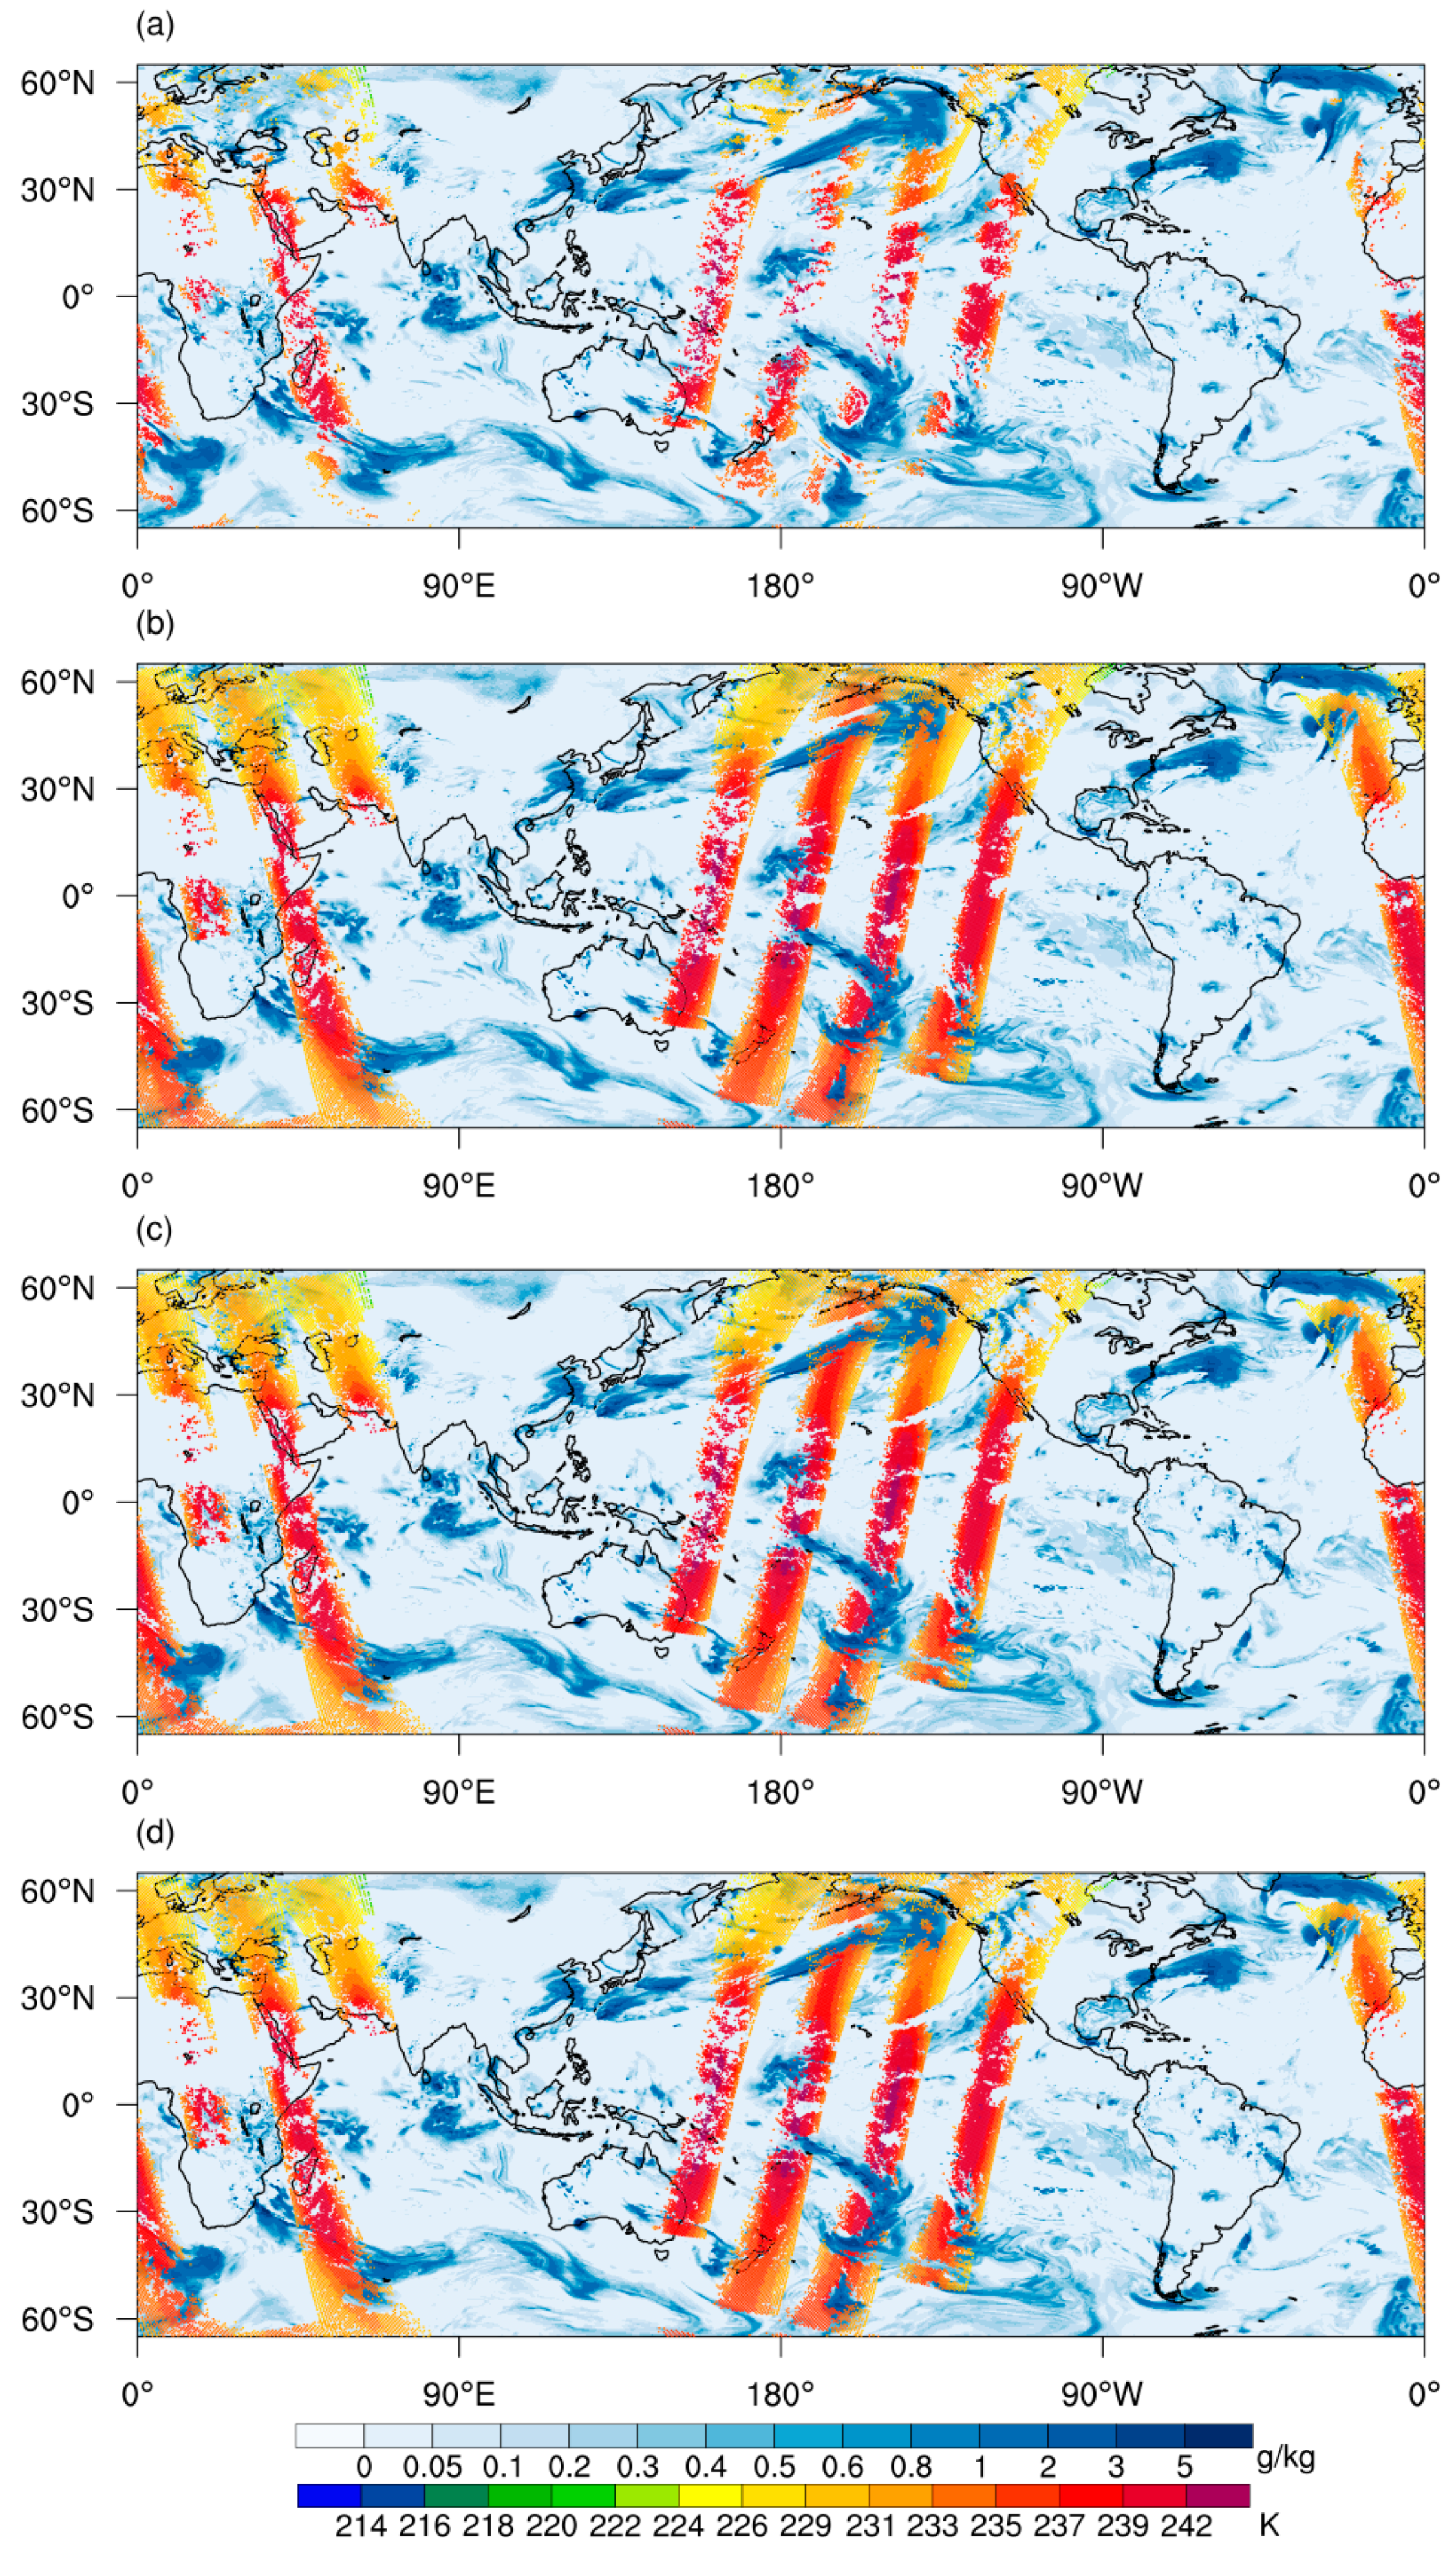
The brightness temperature distributions of the four experiments conducted at 1200 UTC on December 10, 2018 are shown in Figure 8. There were many more observations for the three experiments in which DCS was applied than in the CTRL experiment. For “conventional” precipitation detection (CTRL), MWTS-2 observations with a cloud mixing ratio greater than 1 g/kg were all removed; some of those with a cloud mixing ratio greater than 0.2 g/kg and less than 1 g/kg were also removed. In the DCS experiments, observations were retained not only in areas with a low cloud mixing ratio (<0.2 g/kg), but also in areas with a large cloud mixing ratio (>0.2 g/kg). Some outlier observations were retained where the cloud mixing ratio was larger than 1 g/kg. This is especially important when the cloud mixing ratio is large but the cloud top height has little effect on channel 5. As there was no significant difference among the three DCS experiments, only the results of DCS05 are compared to the observation data in the sections below.
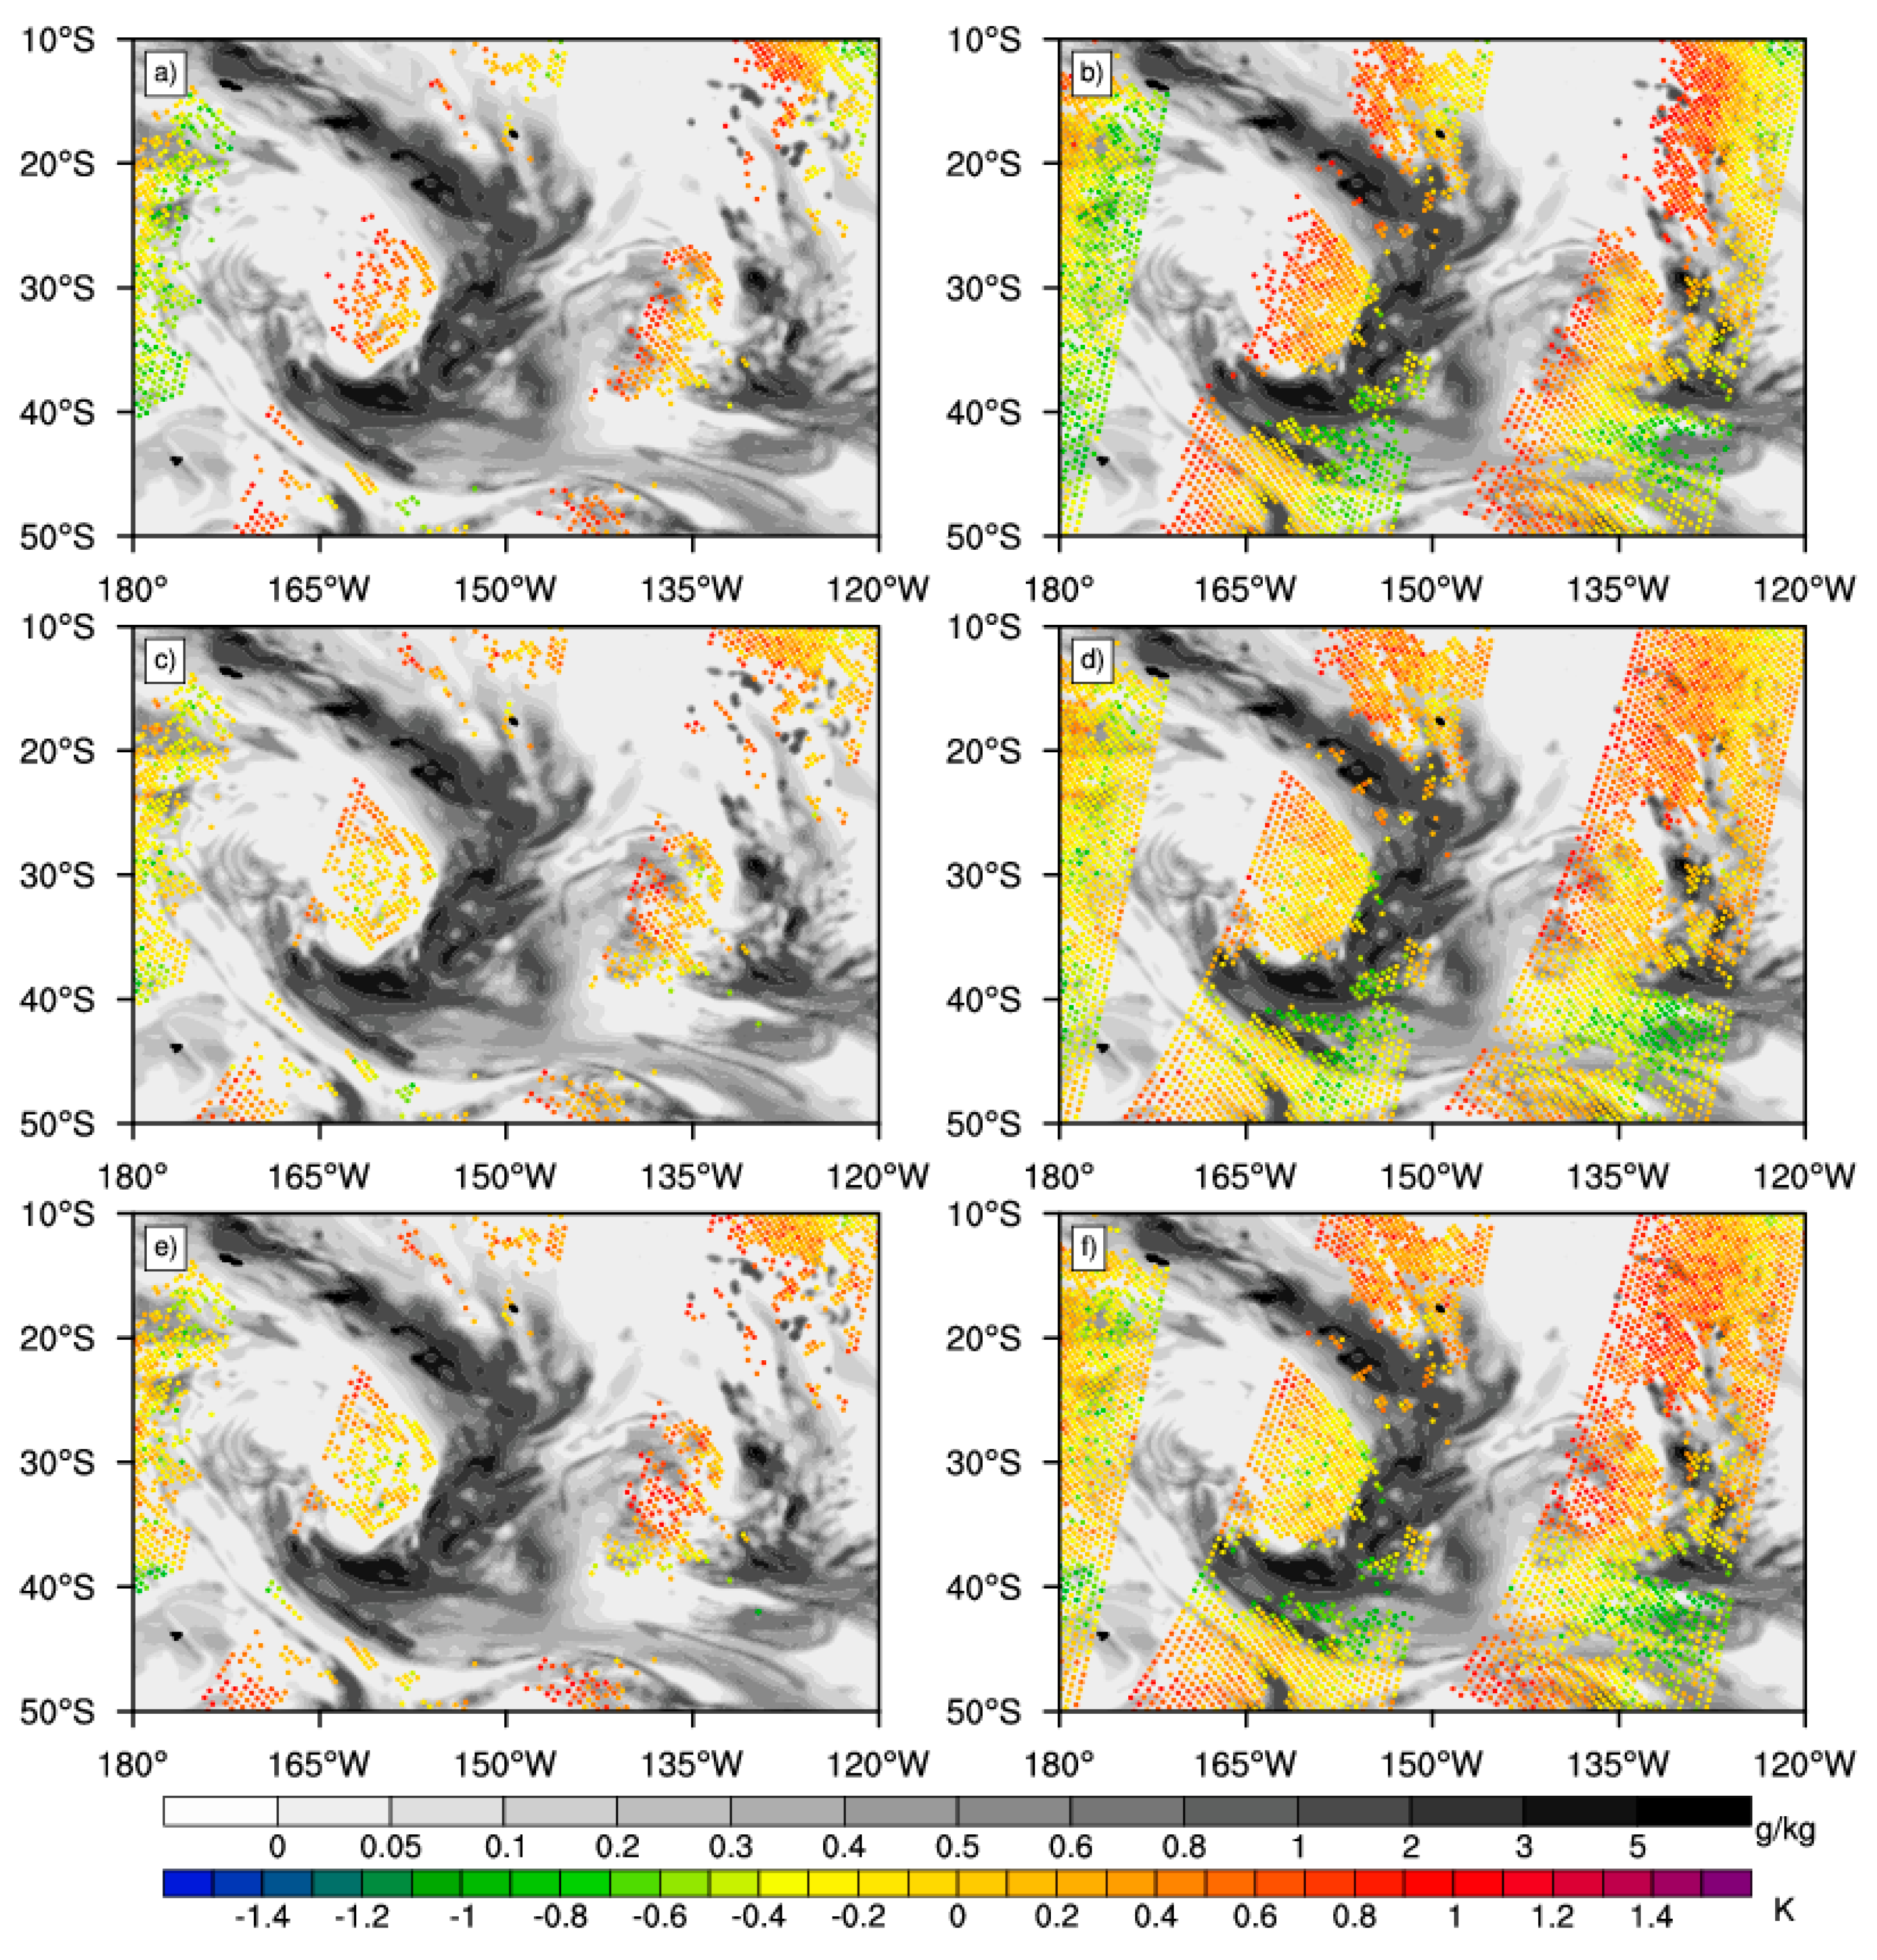
A detailed analysis was performed on the observation data retained by the three channels for CTRL experiment is shown in Figure 9a,c,e, and for DCS05 experiment is shown in Figure 9b,d,f. From 120°W to 180°W and 10°S to 50°S, a vortex cloud system was present in the same time period. The cloud mixing ratio served as the threshold for determining whether an observation was ‘good’ or ‘bad’. In CTRL, most of the observation data of all three channels were rejected. It can be seen that the remapped cloud parameters and “first guess” have good consistency with respect to the calculated cloud area. In DCS05, however, the cloud areas were identified more accurately. The unified cloud top height of the MWTS-2 FOVs can be calculated by remapping those data with MERSI-2 cloud top height data; observations from various channels can be removed or retained based on the real-time dynamic cloud top height data. In this way, not only can areas of strong precipitation be accurately identified and removed, but more observations above cloud top height can also be included in the data assimilation. Thus, in DCS05, more of the data affected by the vortex cloud system can be retained, and more data can be removed from regions with a large cloud mixing ratio. The results also showed that few observations were retained in areas having cloud mixing ratios larger than 0.6 g/kg for all three channels; also, the quantity of data varied among the channels for areas with smaller cloud mixing ratios. The O-B interval for the observations retained in the CTRL, for all three channels, was [−0.7 K, 0.8 K], versus [−0.8 K, 0.8 K] for DCS05. The reason for the negative impact on data quality is unclear and requires further study.

5.1.2. O-B Diagnosis

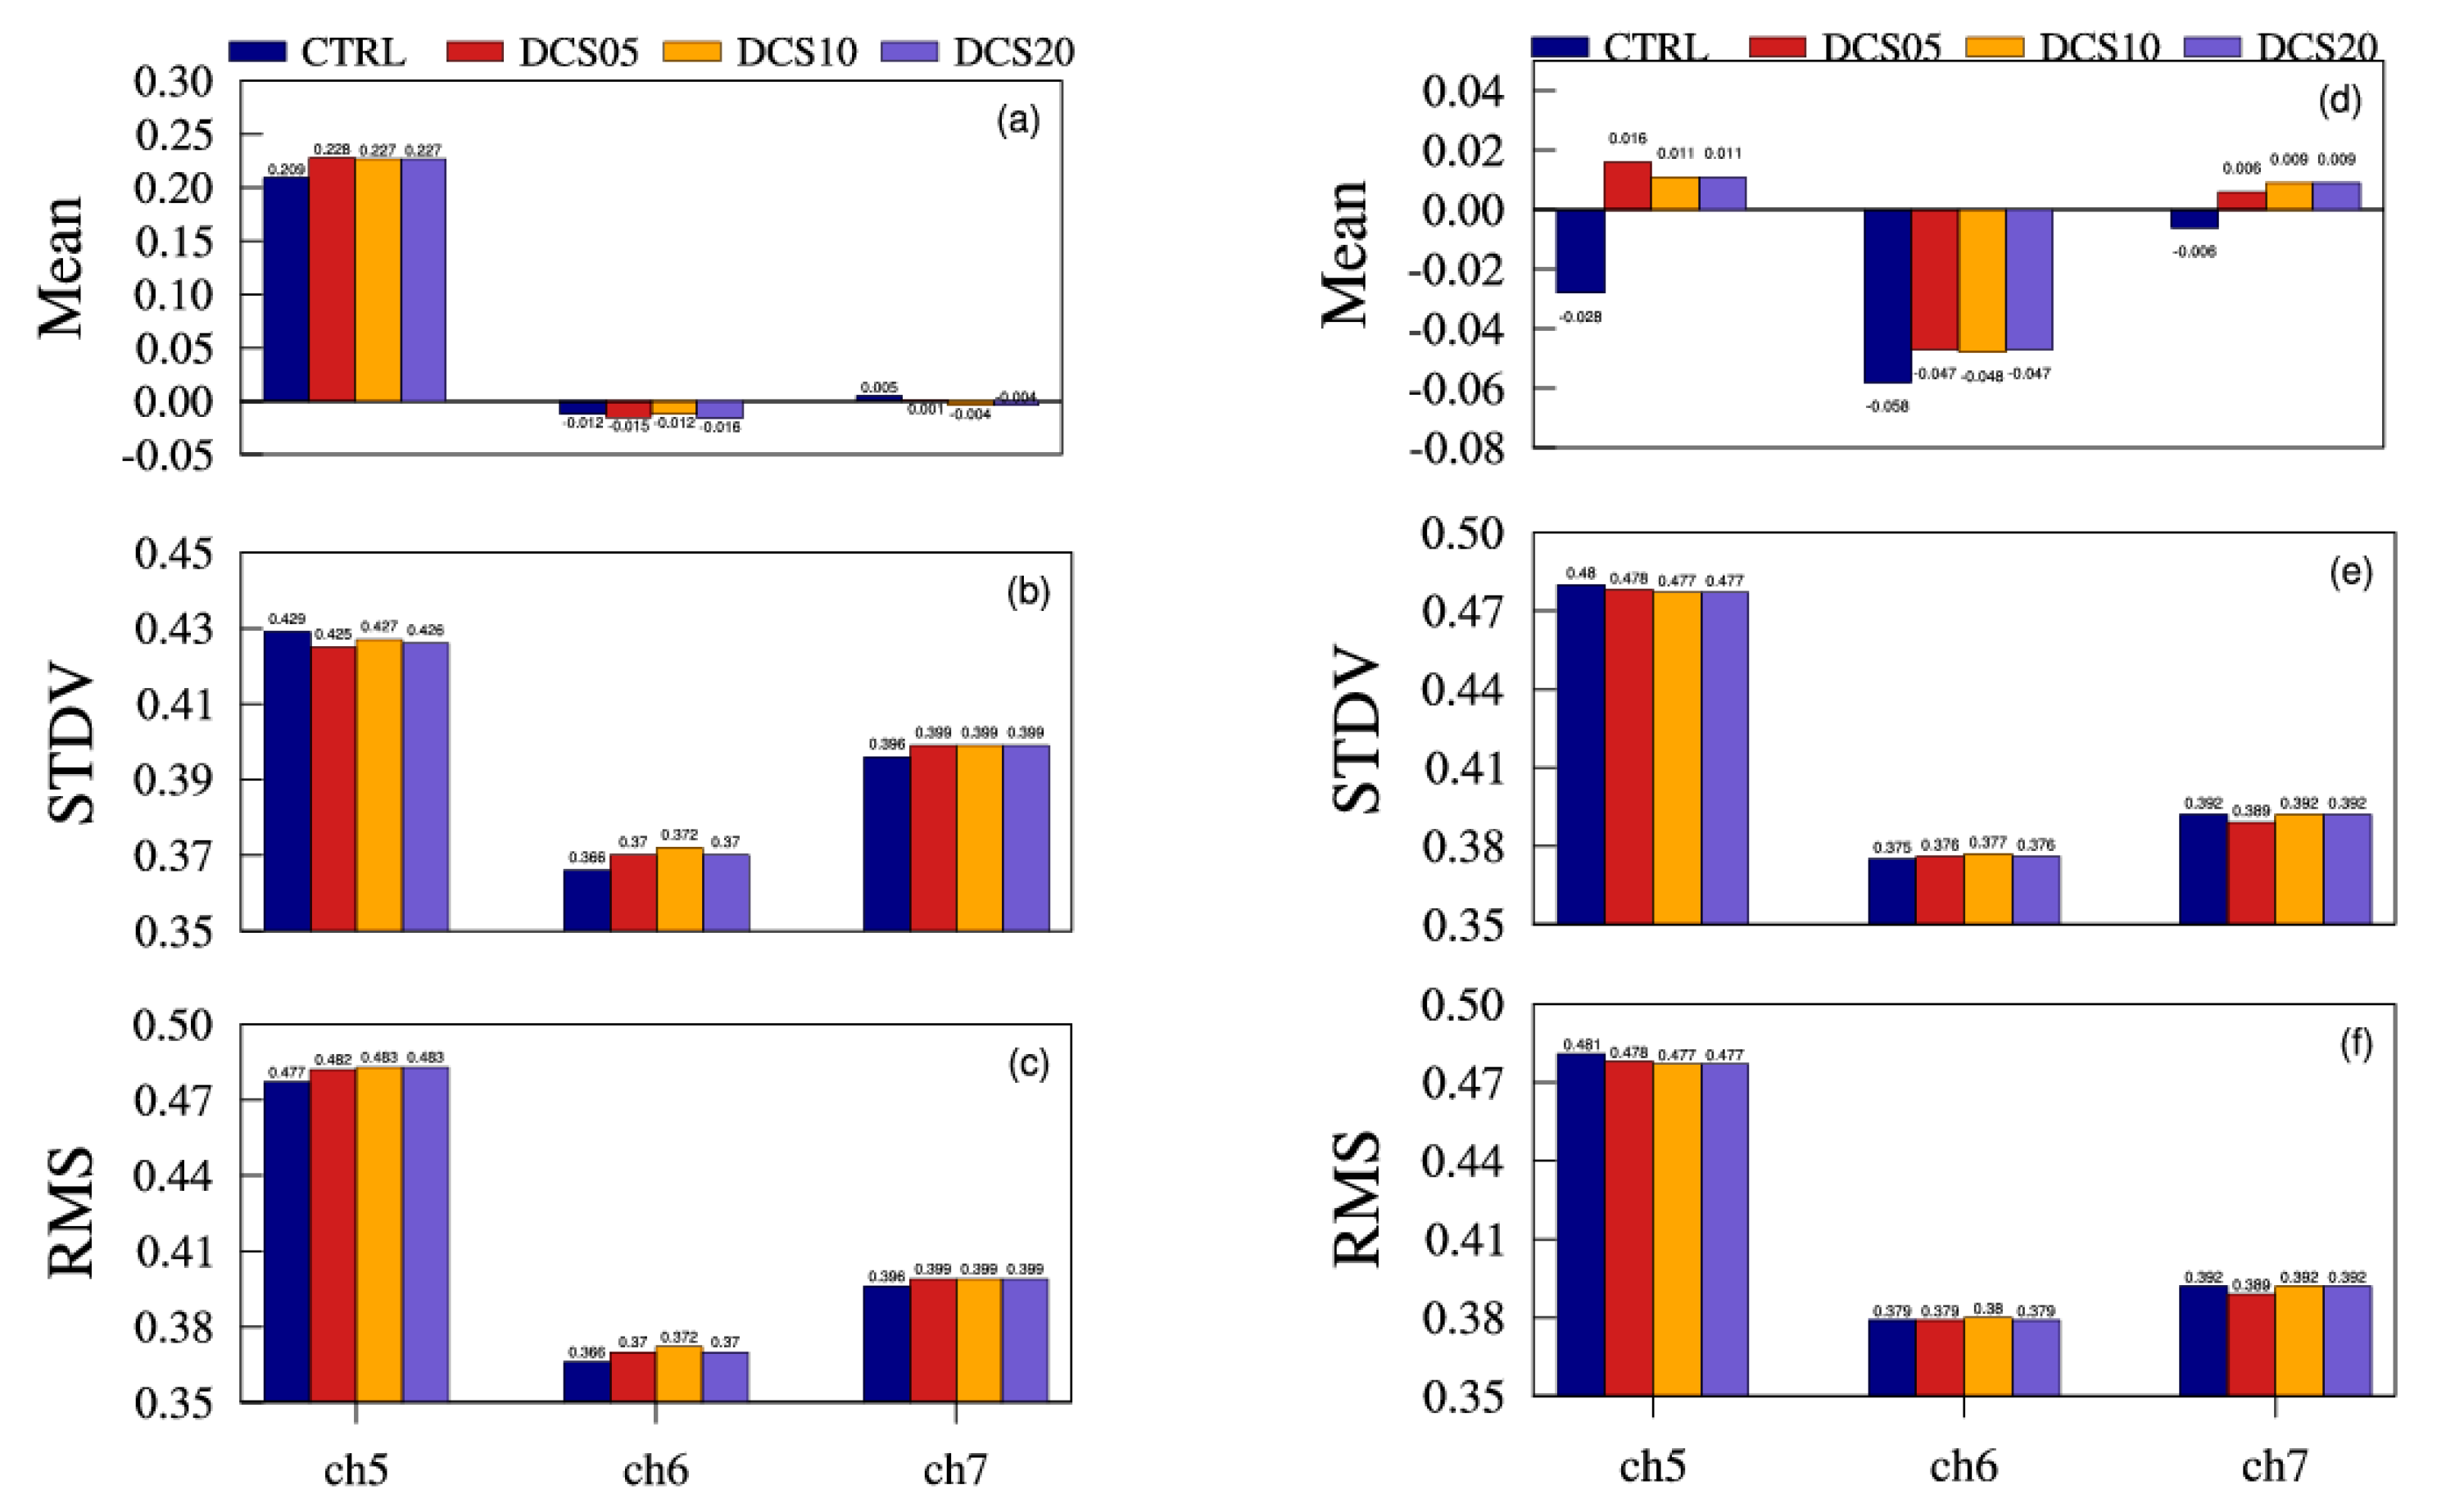
In this section, all O-Bs and their diagnosis were calculated after VarBC had been applied. An increase in the amount of observations used for data assimilation of more than 300% was achieved by application of DCS. The mean error, STDV and root mean square (RMS) of the O-B, for all three channels and all four experiments conducted at 0600 UTC (see Figure 10a–c) and 1200 UTC (Figure 10d–f) on December 10, 2018, were calculated. The mean errors in the three DCS experiments are slightly larger than that of the CTRL experiment, but the maximum mean error in the DCSs is only 0.019 K larger than in CTRL. The max STDV in CTRL is 0.004 K larger than in the DCSs at 0600 UTC. The maximum RMS in the DCSs is only 0.006 K larger than that in CTRL at 0600 UTC, and 0.001 K larger at 1200 UTC for all three channels. The largest variation for the three channels was well below 0.75 K, which was the outlier detection threshold (three times the STDV of observation error for MWTS-2 data). By applying DCS, the error of channels with smaller weighting function peak heights remains unchanged even with the use of additional observations.

5.2. The Long-term Time Series Experiments

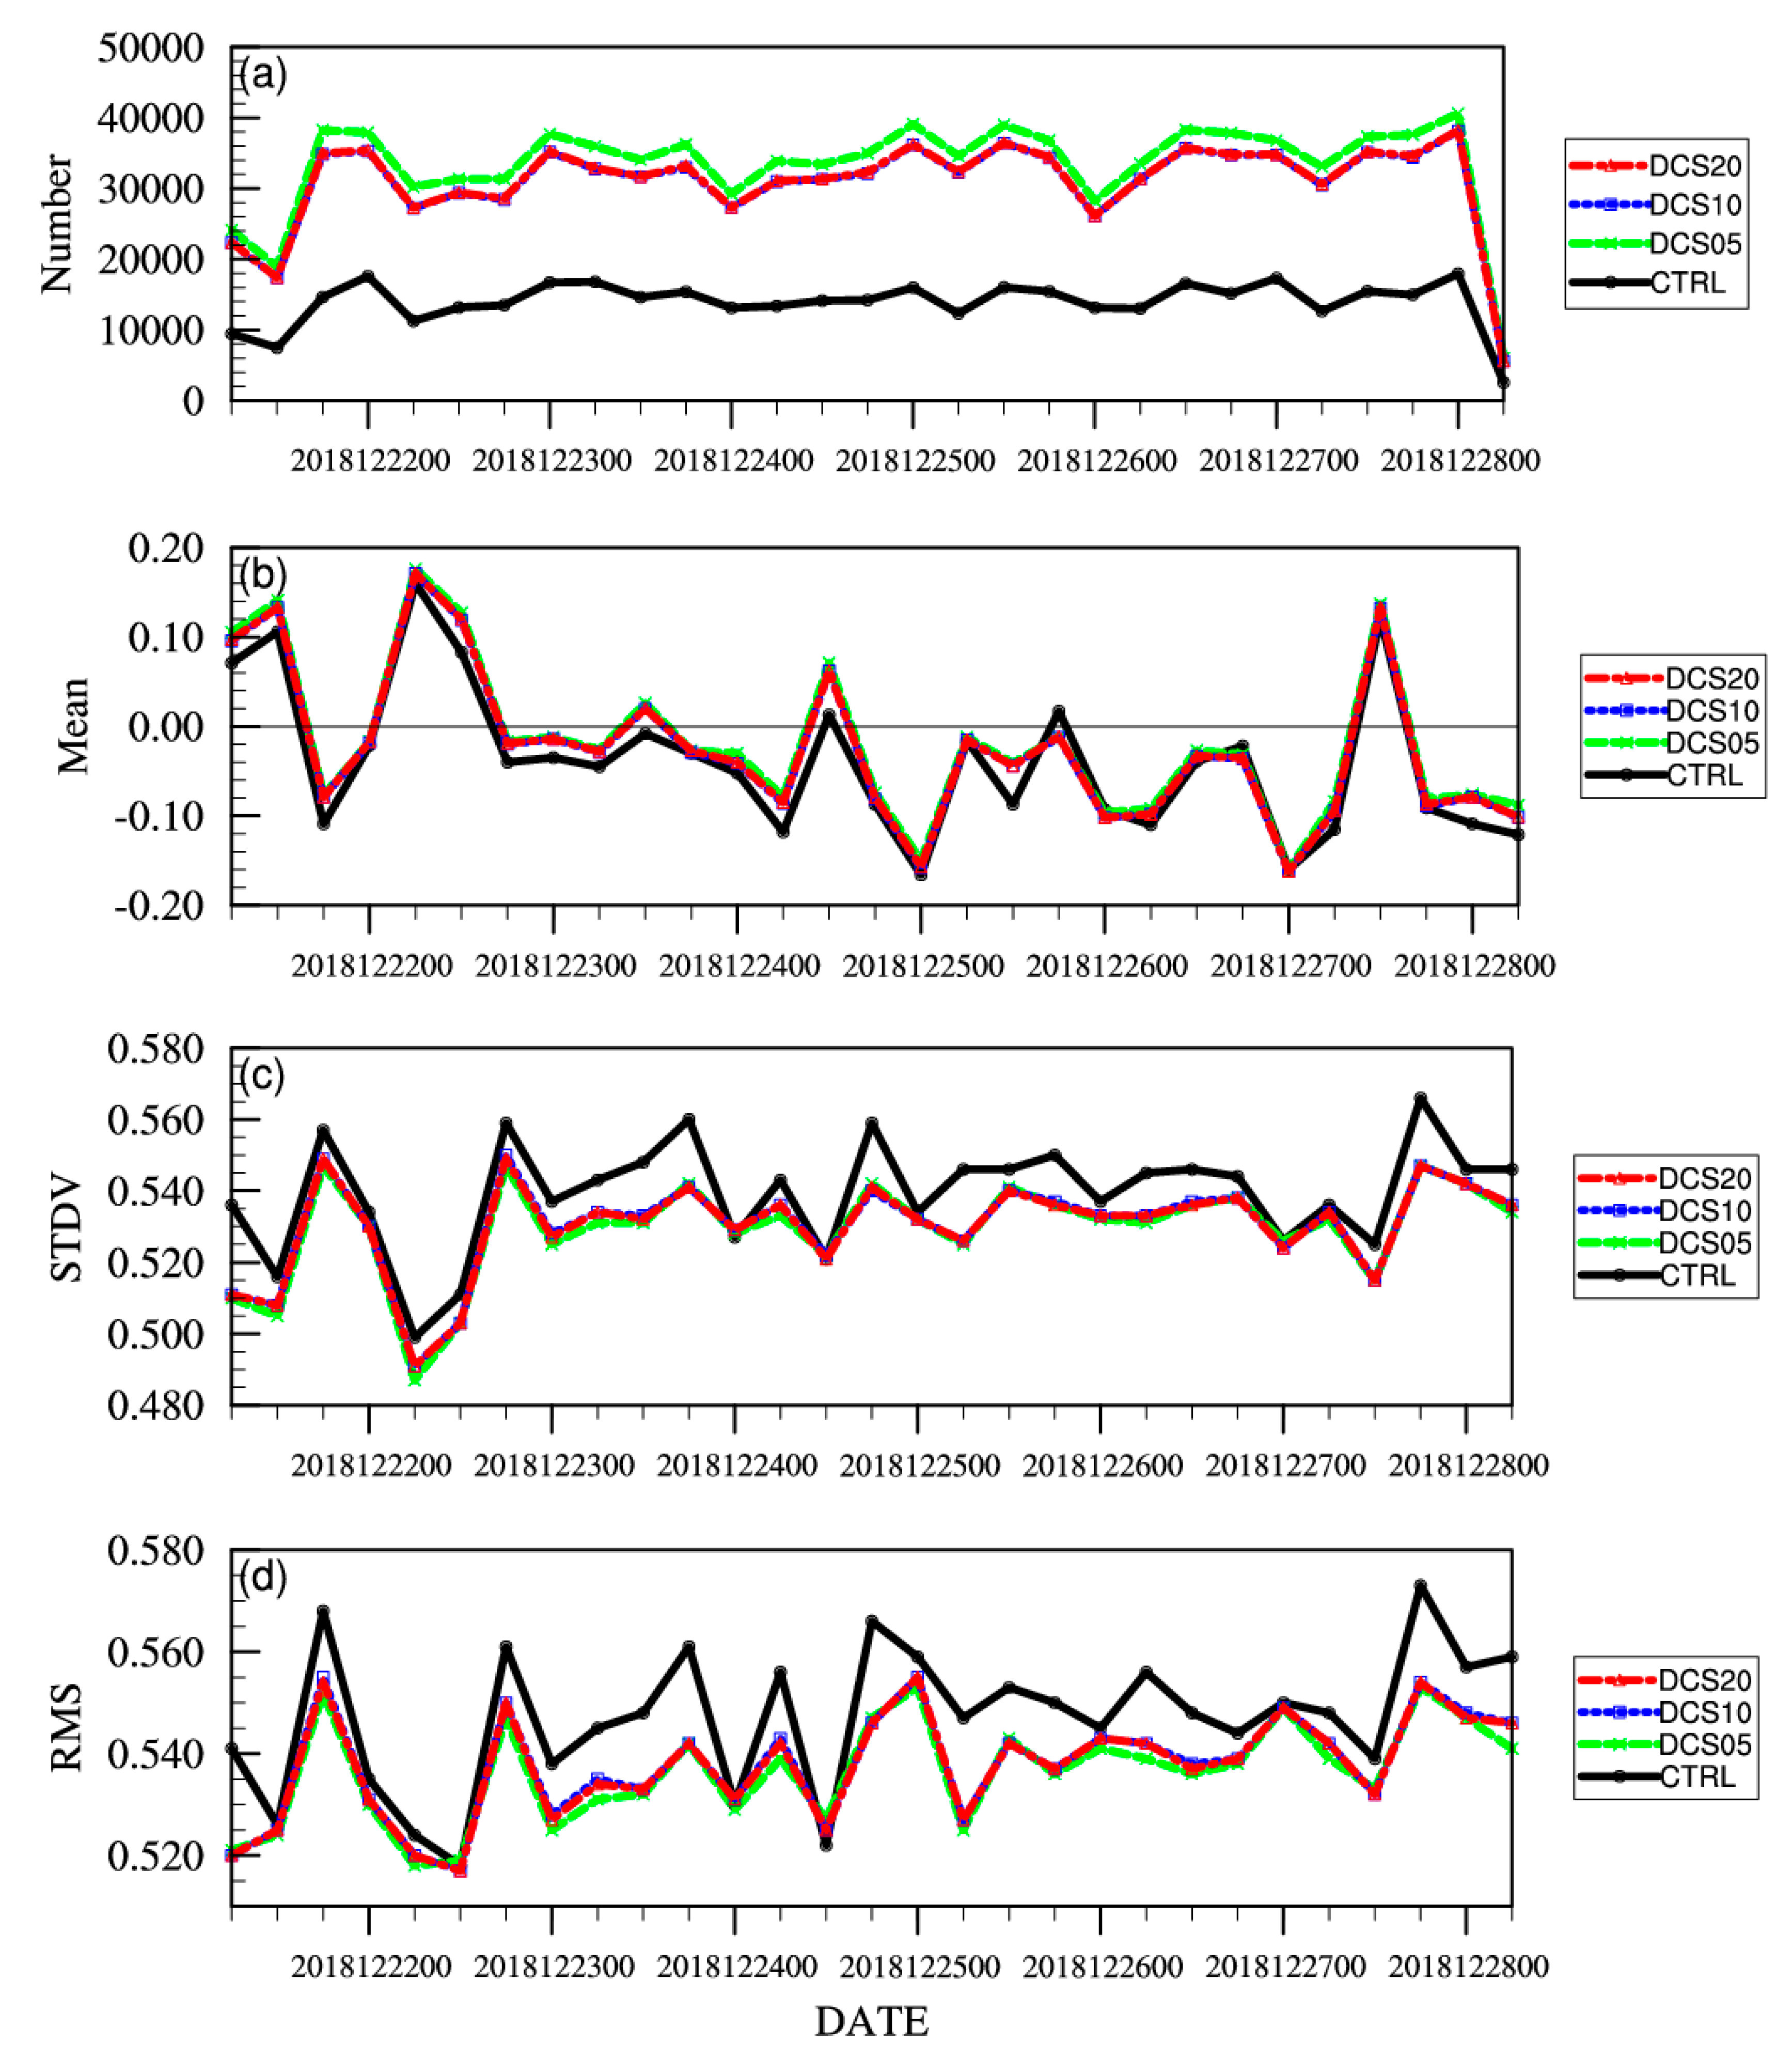
Further analysis of the MWTS-2 observations obtained over a 1 week period from 0600 UTC on December 21 to 0600 UTC on December 28, 2018, was performed. The quantity of the channel 5 data retained is shown in Figure 11a. Compared to the CTRL, there were considerably more data for all of the DCS experiments. The mean error, STDV and RMS of the long-term time series O-B are displayed in Figure 11b–d, and these are quite similar to those obtained at 0600 UTC December 10, 2018. For channel 5, the STDV and RMS, though slightly reduced, are of the same order of magnitude as those for the CTRL experiment. The variations in O-B mean error, STDV and RMS do not exceed 0.03 K, which is one order of magnitude smaller than the actual O-B mean error, STDV and RMS.
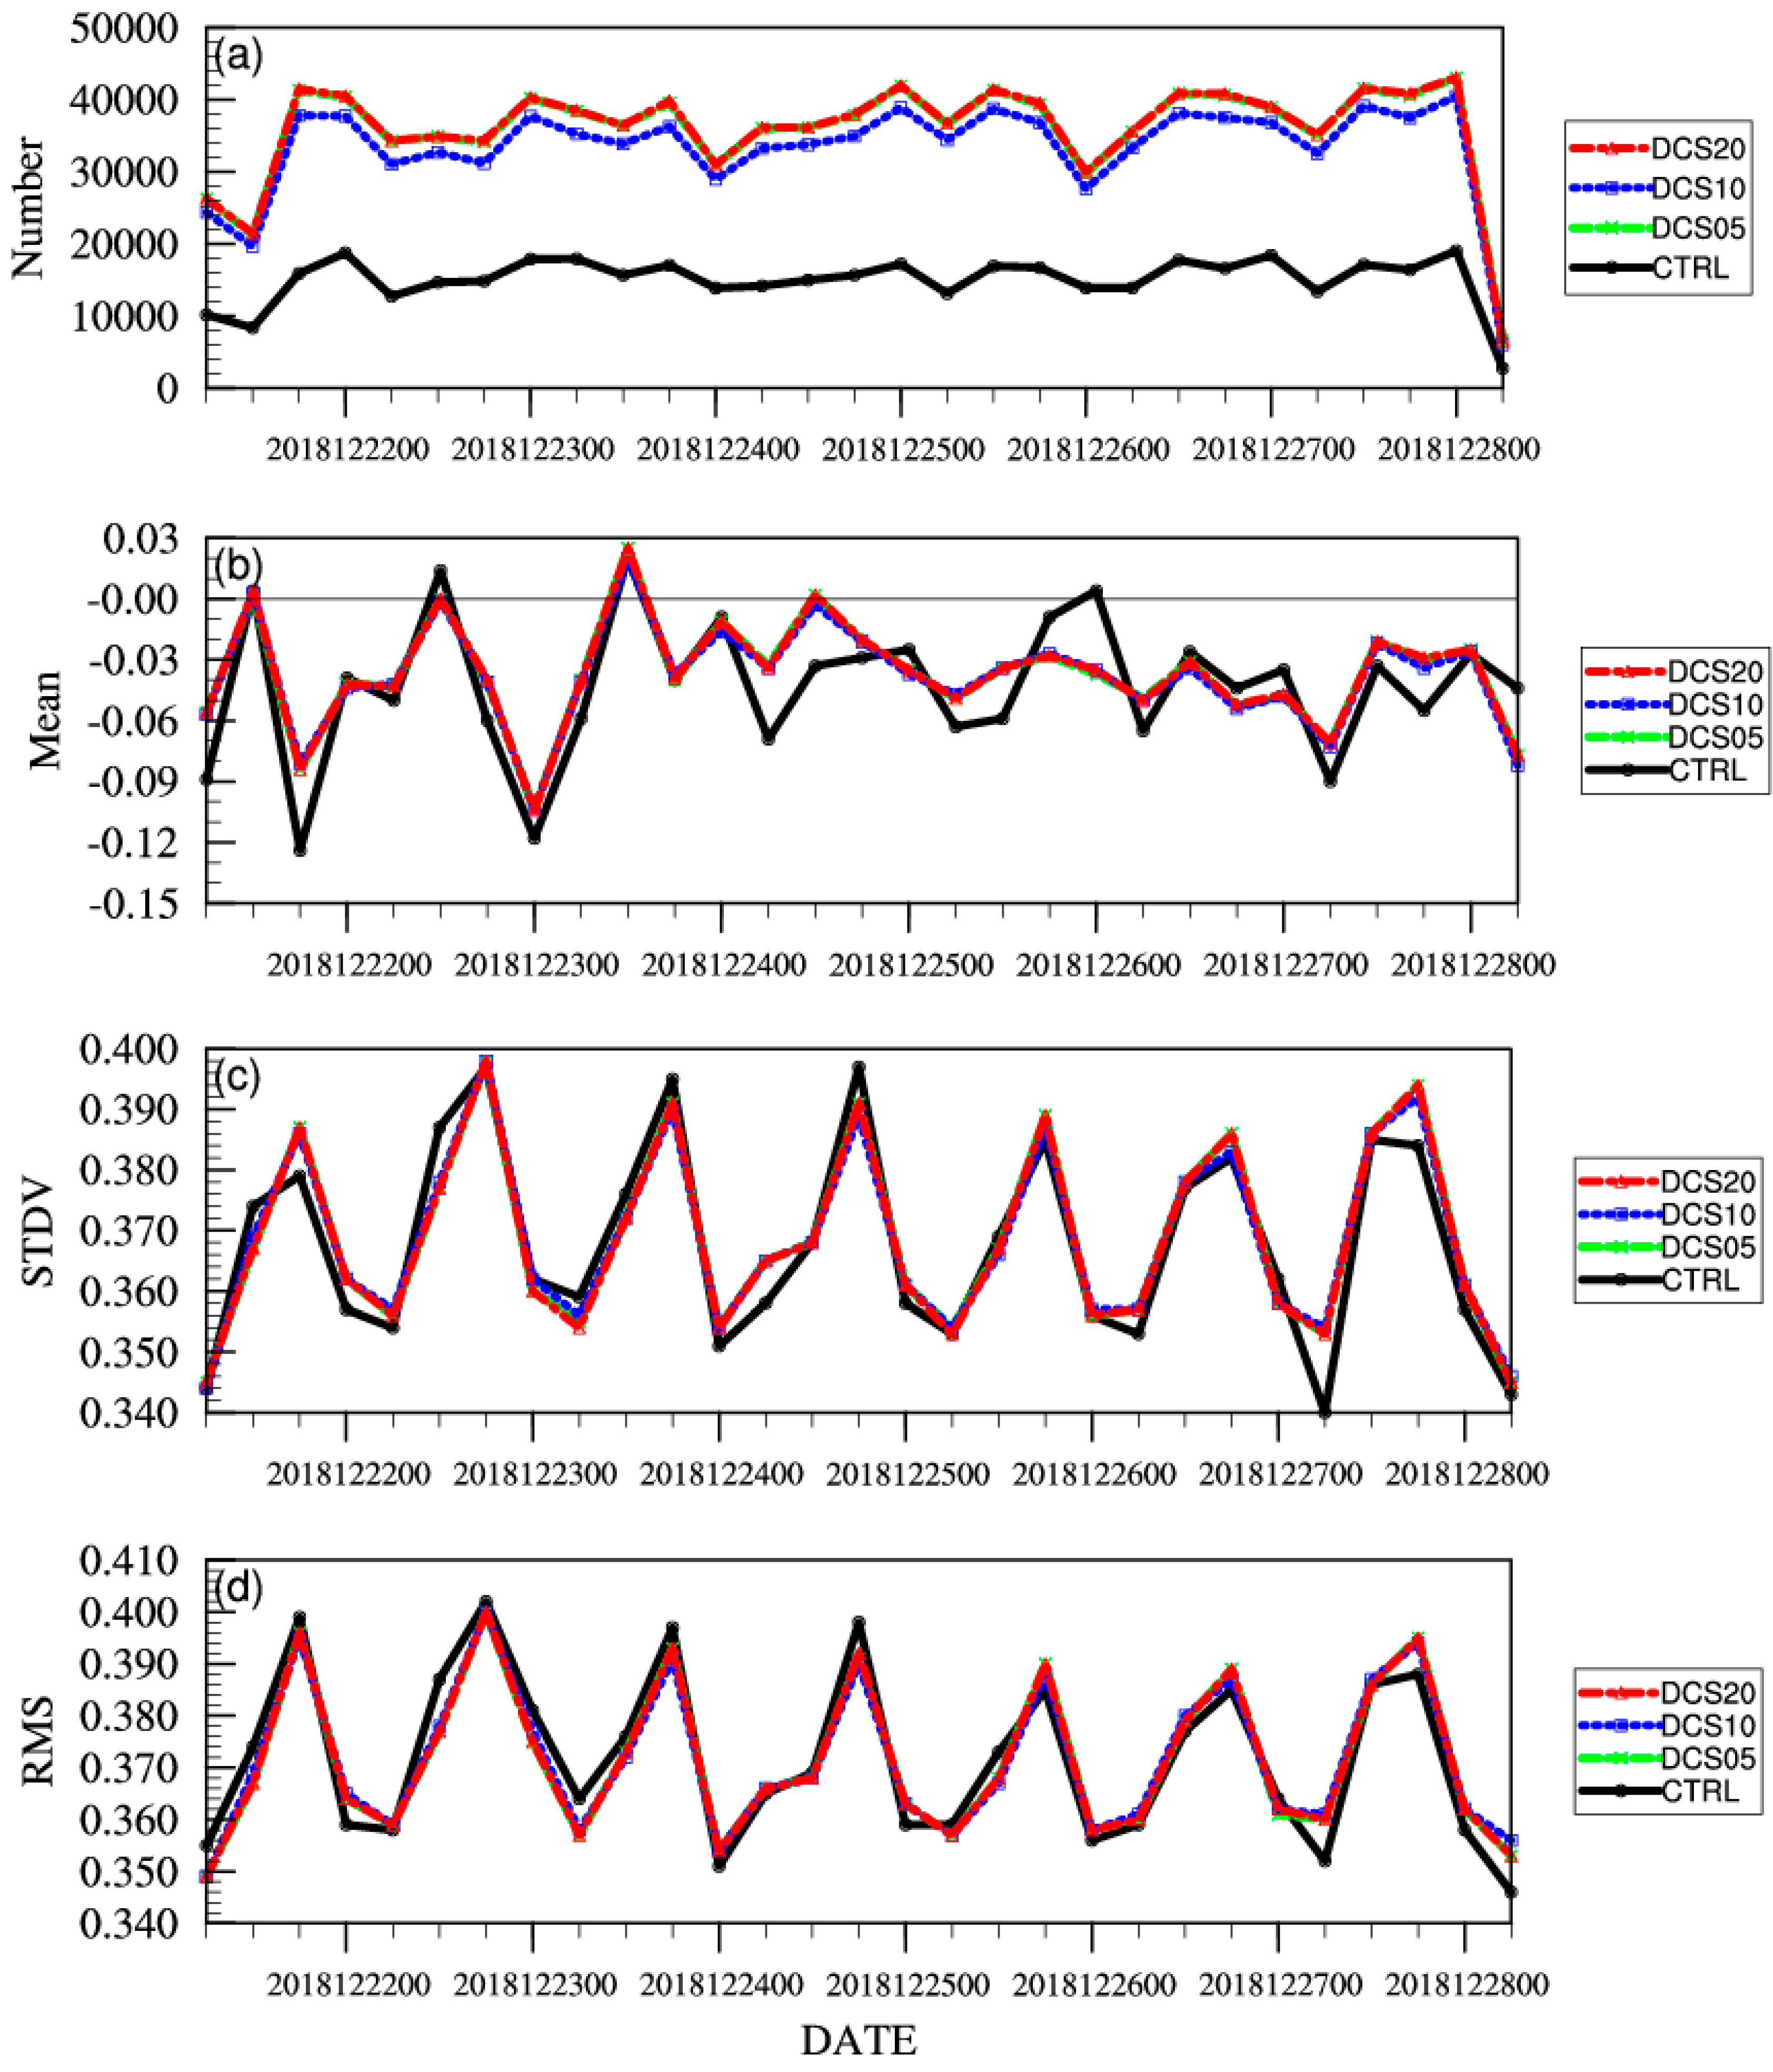
The results for channel 6 are shown in Figure 12. Many more observations were retained in all DCS experiments versus CTRL, and the retention of these observations did not have a significant effect on the STDV or RMS of O-B, similar to channel 5. The error for channel 6 was smaller than that for channel 5, which was in turn one order of magnitude smaller than the error of the actual O-B mean error, STDV and RMS. This also applies to channel 7 (data not shown). The error magnitudes of the DCS experiments for all three channels are the same as those of the CTRL experiment, meaning that DCS method is reasonable and feasible. For cases where the error was slightly increased, more work is needed to determine the ideal d i f f threshold.

6. Discussion

The above experimental results indicate the DCS method is reasonable. It can bring a larger number of observations into assimilation without changing the observation error. However, it should also be noted that the error for channel 5 decreased slightly, and that of channels 6 and 7 increased slightly, with application of DCS; this may have been related to the remapped cloud parameter threshold used, and the unified cloud height. The optimal threshold should be determined in further investigations.
Note that this paper focuses on MWTS-2 onboard FY-3D. But the DCS method is likely to be applicable to AMSU-A and ATMS as well, with cloud parameters from AVHRR and VIIRS, although we realize it is more crucial for MWTS-2 due to its lack of the lower frequency window channels with respect to AMSU-A and ATMS. Once verified, this would make the DCS method more general applicable.
The application of the data preprocessing method before the data assimilation introduced herein will greatly improve the data utilization rate of microwave temperature sounding channels, which may in turn allow for more accurate characterization of atmospheric temperature and circulation in the middle and upper troposphere. The utility of our method for NWP will be discussed in a subsequent paper.

7. Conclusions

Generally, all observations in a pixel below the middle troposphere are eliminated from the radiance assimilation analysis when precipitation is present. However, when the weighting function peak height of a channel is higher than the altitude of the cloud top, observations are not affected by the cloud particles and the radiative transfer calculation can be performed under a clear sky scenario. In this paper, we presented a dynamic channel selection method to determine the observations unaffected by clouds under cloudy conditions, with consideration both of cloud top height and cloud fraction values. The conclusions are as follows.
First, it was found that the CLW profiles were more affected by radiance at lower frequencies. A greater difference between the top of the CLW profile and the weighting function peak height was associated with lower effect of the CLW profile on transmittance. Hence, the variation of transmittance in a channel can be neglected when the unified cloud top height is below the weighting function peak.
Second, three lookup tables were devised through analysis of the impact of cloud fraction and cloud top height on radiance, which is the basis of the DCS method. FY-3D MWTS-2 and MERSI-2 data were used in this study. The cloud mask data of MERSI-2 were remapped to MWTS-2 FOVs to obtain the cloud fraction. The unified cloud top height was derived by remapping the cloud top height data from MERSI-2 and considering the impact of the distribution of cloud parameters. The cloud coverage was similar between MERSI-2 and MWTS-2, although the resolution differed. Hundreds of MERSI-2 pixels for cloud top height were remapped to the MWTS-2 FOV data, resulting in some blurring with respect to cloud height. However, the main cloud features could still be identified. The observations from various channels can be removed or retained based on the real-time dynamic remapped cloud parameters.
Finally, to evaluate the DCS method, brightness temperature simulation experiments were performed. Both 12-hour and long-term time-series experiments showed that a more than 300% increase in the number of observations used during data assimilation was achieved by application of DCS, and this had no effect on the magnitude of error. Through application of DCS, not only can areas of strong precipitation be accurately identified and removed, but more observations above cloud top height can also be used for data assimilation.

Author Contributions

Conceptualization, L.Q. and G.M.; Data curation, T.Y. and Y.G.; Formal analysis, L.Q.; Funding acquisition, Y.C. and G.M.; Methodology, L.Q. and G.M.; Resources, Y.C. and P.Z.; Supervision, P.Z.; Validation, L.Q., Y.C., T.Y., G.M. and Y.G.; Visualization, T.Y. and Y.G.; Writing—original draft, L.Q.; Writing—review & editing, Y.C. and G.M. All authors have read and agreed to the published version of the manuscript.

Funding

This work is jointly sponsored by the National Key Research and Development Program of China (2018YFC1506701), the National Natural Science Foundation of China (41675102), the Special Fund for Meteorological Scientific Research in Public Interest (GYHY201506002, GYHY201506022).

Acknowledgments

The authors thank the two anonymous reviewers for their constructive comments and useful suggestions that helped significantly improve the manuscript.

Conflicts of Interest

The authors declare no conflicts of interest.

References

  1. Andersson, E.; Pailleux, J.; Thépaut, J.N.; Eyre, J.R.; McNally, A.P.; Kelly, G.A.; Courtier, P. Use of cloud-cleared radiances in three/four-dimensional variational data assimilation. Quart. J. R. Meteorol. Soc. 1994, 120, 627–653. [Google Scholar] [CrossRef]
  2. Andersson, E.; Haseler, J.; Undén, P.; Courtier, P.; Kelly, G.; Vasiljevic, D.; Brankovic, C.; Cardinali, C.; Gaffard, C.; Hollingsworth, A.; et al. The ECMWF implementation of three-dimensional variational assimilation (3D-Var). III: Experimental results. Quart. J. R. Meteorol. Soc. 1998, 124, 1831–1860. [Google Scholar] [CrossRef]
  3. Derber, J.C.; Wu, W.S. The Use of TOVS Cloud-Cleared Radiances in the NCEP SSI Analysis System. Mon. Weather Rev. 1998, 126, 2287–2299. [Google Scholar] [CrossRef]
  4. Rabier, F. Overview of global data assimilation developments in numerical weather-prediction centres. Quart. J. R. Meteorol. Soc. 2005, 131, 3215–3233. [Google Scholar] [CrossRef]
  5. Garand, L.; Buehner, M.; Heilliette, S.; Macpherson, S.R.; Beaulne, A. Satellite radiance assimilation impact in new Canadian ensemble-variational syste. In Proceedings of the 2013 EUMETSAT Meteorological Satellite Conference, Vienna, Austria, 16–20 September 2013. EUMETSAT, Session 12, Paper 4. [Google Scholar]
  6. Joo, S.; Eyre, J.; Marriott, R. The impact of MetOp and other satellite data within the Met office global NWP system using an adjoint-based sensitivity method. Mon. Wea. Rev. 2013, 141, 3331–3342. [Google Scholar] [CrossRef]
  7. Cucurull, L.; Anthes, R.A.; Tsao, L.-L. Radio occultation observations as anchor observations in numerical weather prediction models and associated reduction of bias corrections in microwave and infrared satellite observations. J. Atmos. Oceanic Technol. 2013, 31, 20–32. [Google Scholar] [CrossRef]
  8. Lawrence, H.; Bormann, N.; Sandu, I.; Day, J.; Farnan, J.; Bauer, P. Use and impact of Arctic observations in the ECMWF Numerical Weather Prediction system. Quart. J. R. Meteorol. Soc. 2019, 145, 3432–3454. [Google Scholar] [CrossRef] [Green Version]
  9. Li, J.; Wang, P.; Han, H.; Li, J.; Zheng, J. On the assimilation of satellite sounder data in cloudy skies in numerical weather prediction models. J. Meteorol. Res. 2016, 30, 169–182. [Google Scholar] [CrossRef]
  10. English, S.J.; Renshaw, R.J.; Dibben, P.C.; Smith, A.J.; Payer, P.J.; Poulsen, C.; Saunders, F.W.; Eyre, J.R. A comparison of the impact of TOVS arid ATOVS satellite sounding data on the accuracy of numerical weather forecasts. Quart. J. R. Meteorol. Soc. 2000, 126, 2911–2931. [Google Scholar] [CrossRef]
  11. McNally, A.P.; Derber, J.C.; Wu, W.; Katz, B.B. The use of TOVS level-1b radiances in the NCEP SSI analysis system. Quart. J. R. Meteorol. Soc. 2000, 126, 689–724. [Google Scholar] [CrossRef]
  12. Xie, Y.; Fan, S.; Chen, M.; Shi, J.; Zhong, J.; Zhang, X. An Assessment of Satellite Radiance Data Assimilation in RMAPS. Remote Sens. 2019, 11, 54. [Google Scholar] [CrossRef] [Green Version]
  13. Cardinali, C.; Prates, F. Performance measurement with advanced diagnostic tools of all-sky microwave imager radiances in 4D-Var. Quart. J. R. Meteorol. Soc. 2011, 137, 2038–2046. [Google Scholar] [CrossRef]
  14. Li, J.; Qin, Z.; Liu, G. A new generation of Chinese FY-3C microwave sounding measurements and the initial assessments of its observations. Int. J. Remote Sens. 2016, 37, 4035–4058. [Google Scholar] [CrossRef]
  15. Bormann, N.; Fouilloux, A.; Bell, W. Evaluation and assimilation of ATMS data in the ECMWF system. J. Geophys. Res. Atmos. 2013, 118, 12,970–12,980. [Google Scholar] [CrossRef]
  16. Li, J.; Liu, G. Direct assimilation of Chinese FY-3C Microwave Temperature Sounder-2 radiances in the global GRAPES system. Atmos. Meas. Tech. 2016, 9, 3095–3113. [Google Scholar] [CrossRef] [Green Version]
  17. Liu, Z.; Craig, S.S.; Snyder, C.; Ha, S. Impact of Assimilating AMSU-A Radiances on Forecasts of 2008 Atlantic Tropical Cyclones Initialized with a Limited-Area Ensemble Kalman Filter. Mon. Weather Rev. 2012, 140, 4017–4034. [Google Scholar] [CrossRef] [Green Version]
  18. Saunders, R.; Hocking, J.; Turner, E.; Rayer, P.; Rundle, D.; Brunel, P.; Vidot, J.; Roquet, P.; Matricardi, M.; Geer, A.; et al. An update on the RTTOV fast radiative transfer model (currently at version 12). Geosci. Model Dev. 2018, 11, 2717–2737. [Google Scholar] [CrossRef] [Green Version]
  19. Weng, F.; Liu, Q. Satellite Data Assimilation in Numerical Weather Prediction Models. Part I: Forward Radiative Transfer and Jacobian Modeling in Cloudy Atmospheres. J. Atmos. Sci. 2003, 60, 2633–2646. [Google Scholar] [CrossRef]
  20. English, S.J. Issues in the assimilation of cloud and precipitation affected radiances and prospects for future instruments. In Proceedings of the ECMWF Seminar on Recent Development in the use of Satellite Observations in Numerical Weather Prediction, Reading, UK, 3–7 September 2007; ECMWF Publication. pp. 59–74. [Google Scholar]
  21. Bauer, P.; Moreau, E.; Chevallier, F.; O’Keeffe, U. Multiple-scattering microwave radiative transfer for data assimilation applications. Quart. J. R. Meteorol. Soc. 2006, 132, 1259–1281. [Google Scholar] [CrossRef] [Green Version]
  22. Liu, S.; Chu, Z.; Yin, Y.; Liu, R. Evaluation of MWHS-2 Using a Co-located Ground-Based Radar Network for Improved Model Assimilation. Remote Sens. 2019, 11, 2338. [Google Scholar] [CrossRef] [Green Version]
  23. English, S.J.; Renshaw, R.J.; Dibben, P.; Eyre, J.R. The AAPP module for identifying precipitation, ice cloud, liquid water and surface type on the AMSU-A grid. Proceeding of the 9th International TOVS Study Conference, Igls, Austria, 20–26 February 1997; pp. 119–130. [Google Scholar]
  24. Gérard, E.; Rabier, F.; Lacroix, D. Use of ATOVS raw radiances in the operational assimilation system at Météo-France. In Proceedings of the International TOVS Study Conference-XIII, SteAdele, QC, Canada, 29 October–4 November 2003; pp. 20–29. [Google Scholar]
  25. Bennartz, R.; Thoss, A.; Dybbroe, A.; Michelson, D.B. Precipitation analysis using the Advanced Microwave Sounding Unit in support of nowcasting applications. Meteorol. Appl. 2002, 9, 177–189. [Google Scholar] [CrossRef]
  26. Candy, B.; English, S.; Renshaw, R.; Macpherson, B. Use of AMSU data in the met office UK mesoscale model. In Proceedings of the International TOVS Study Conference-XIII, Sainte Adele, QC, Canada, 29 October–4 November 2003. [Google Scholar]
  27. Zou, X.; Qin, Z.; Weng, F. Improved Quantitative Precipitation Forecasts by MHS Radiance Data Assimilation with a Newly Added Cloud Detection Algorithm. Mon. Weather Rev. 2013, 141, 3203–3221. [Google Scholar] [CrossRef]
  28. Qin, Z.; Zou, X. Development and initial assessment of a new land index for microwave humidity sounder cloud detection. J. Meteorol. Res. 2016, 30, 12–37. [Google Scholar] [CrossRef]
  29. Li, J.; Zou, X. A Quality Control Procedure for FY-3A MWTS Measurements with Emphasis on Cloud Detection Using VIRR Cloud Fraction. J. Atmos. Ocean. Tech. 2013, 30, 1704–1715. [Google Scholar] [CrossRef] [Green Version]
  30. Han, H.; Li, J.; Goldberg, M.; Wang, P.; Li, J.; Li, Z.; Sohn, B.-J.; Li, J. Microwave Sounder Cloud Detection Using a Collocated High-Resolution Imager and Its Impact on Radiance Assimilation in Tropical Cyclone Forecasts. Mon. Weather Rev. 2015, 144, 3937–3959. [Google Scholar] [CrossRef]
  31. Muller, B.M.; Fuelberg, H.E.; Xiang, X. Simulations of the Effects of Water Vapor, Cloud Liquid Water, and Ice on AMSU Moisture Channel Brightness Temperatures. J. Appl. Meteorol. 1994, 33, 1133–1154. [Google Scholar] [CrossRef] [Green Version]
  32. Geer, A.J.; Lonitz, K.; Weston, P.; Kazumori, M.; Okamoto, K.; Zhu, Y.; Liu, E.H.; Collard, A.; Bell, W.; Migliorini, S. All-sky satellite data assimilation at operational weather forecasting centres. Quart. J. R. Meteorol. Soc. 2018, 144, 1191–1217. [Google Scholar] [CrossRef]
  33. Geer, A.; Ahlgrimm, M.; Bechtold, P.; Bonavita, M.; Bormann, N.; English, S.; Fielding, M.; Forbes, R.; Hogan, R.; Holm, E.; et al. Assimilating observations sensitive to cloud and precipitation. In ECMWF Technical Memorandum; European Centre for Medium-Range Weather Forecasts: Reading, UK, 2017. [Google Scholar]
  34. Saunders, R.; Matricardi, M.; Brunel, P. An improved fast radiative transfer model for assimilation of satellite radiance observations. Quart. J. R. Meteorol. Soc. 1999, 125, 1407–1425. [Google Scholar] [CrossRef]
  35. Liebe, J. MPM—An atmospheric millimeter-wave propagation model. Int. J. Infrared Milli. 1989, 10, 631–650. [Google Scholar] [CrossRef]
  36. Garand, L.; Turner, D.S.; Larocque, M.; Bates, J.; Boukabara, S.; Brunel, P.; Chevallier, F.; Deblonde, G.; Engelen, R.; Hollingshead, M.; et al. Radiance and Jacobian intercomparison of radiative transfer models applied to HIRS and AMSU channels. J. Geophys. Res. Atmos. 2001, 106, 24017–24031. [Google Scholar] [CrossRef] [Green Version]
  37. Saunders, R.; Matricardi, M.; Geer, A. RTTOV9.1 Users Guide; EUMETSAT NWP SAF: Exeter, UK, 2008. [Google Scholar]
  38. Weng, F.; Grody, N.C. Retrieval of cloud liquid water using the special sensor microwave imager (SSM/I). J. Geophys. Res. Atmos. 1994, 99, 25535–25551. [Google Scholar] [CrossRef]
  39. Klaes, D.; Schraidt, R. The European ATOVS and AVHRR processing package (AAPP). In Proceedings of the 10th International TOVS Study Conference, Boulder, CO, USA, 27 January –2 February 1999; pp. 288–294. [Google Scholar]
  40. Cao, G.; Qi, C.; Ma, G.; Zhang, F.; Wu, X. Mapping Cloud Mask of FY-3A VIRR to IRAS. Remote Sens. Tech. Appl. 2008, 23, 89–92. [Google Scholar]
  41. Auligne, T.; McNally, P.; Dee, P. Adaptive bias correction for satellite data in a numerical weather prediction system. Q. J. Roy. Meteorol. Soc. 2007, 133, 631–642. [Google Scholar] [CrossRef]
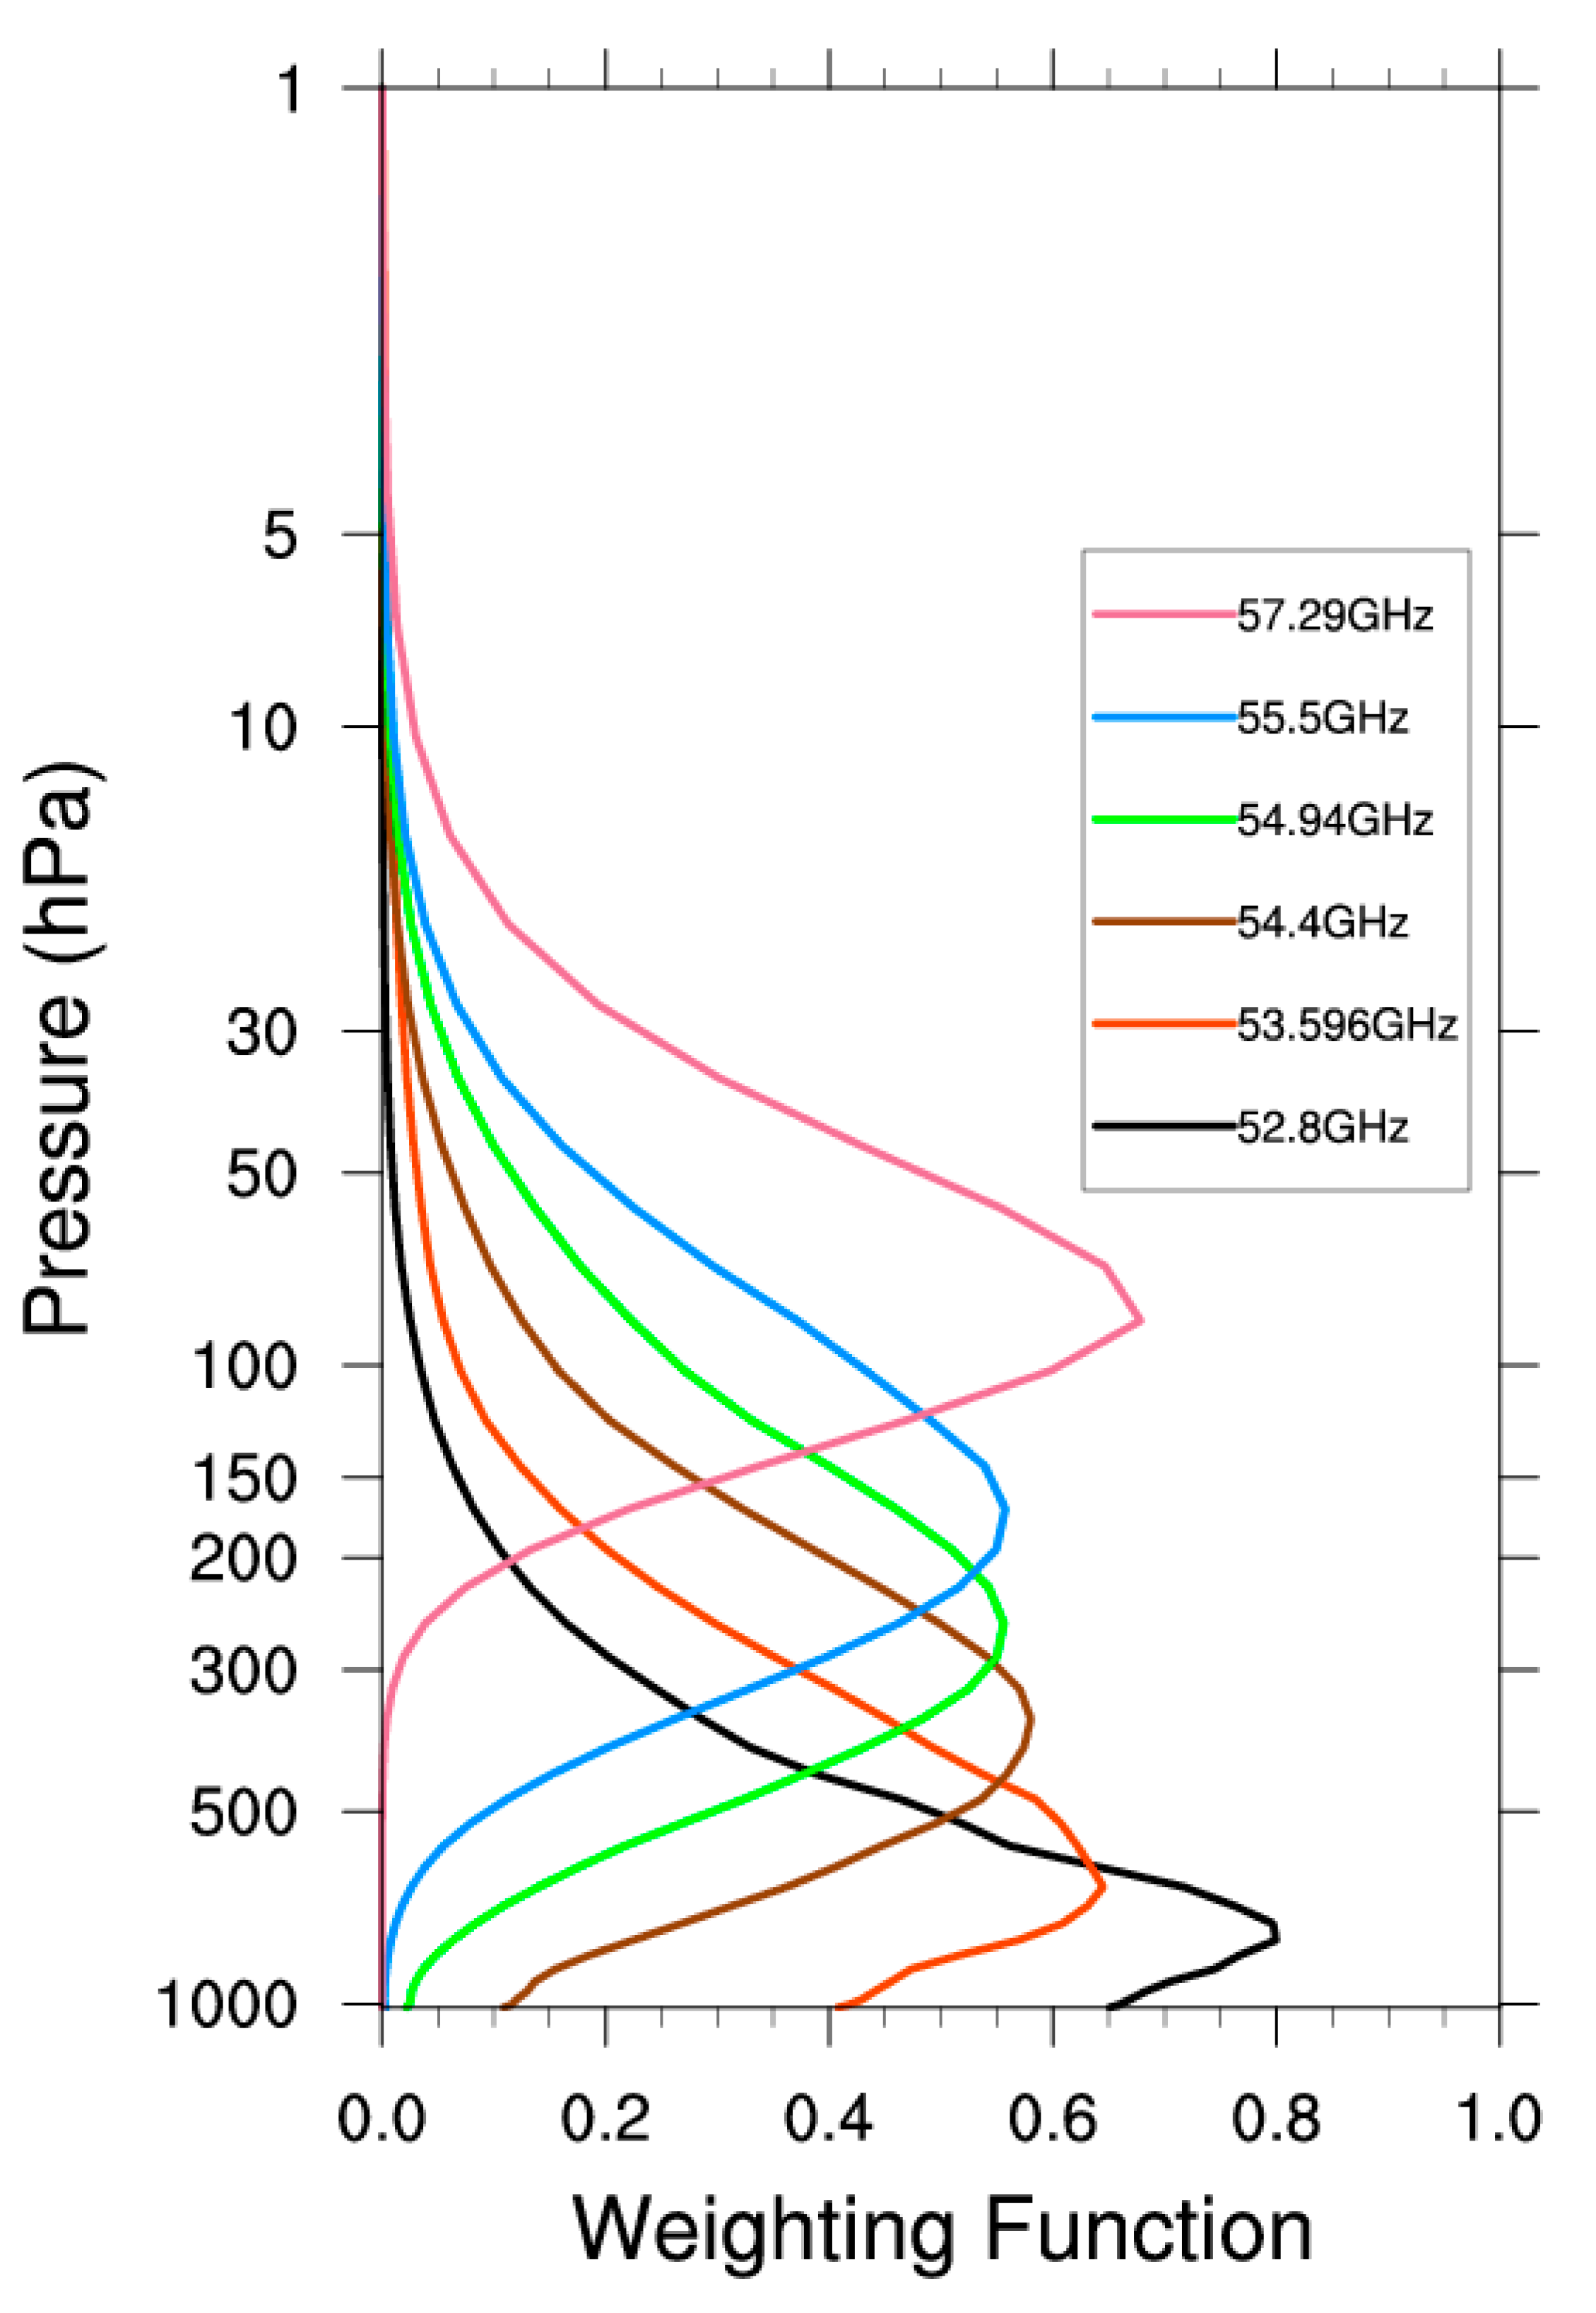
Figure 1. Weighting functions for six channels for remote sensing of the troposphere. Atmospheric profile data from Radiative Transfer for TIROS Operational Vertical Sounder TOVS (RTTOV) were used in the calculations.
Remotesensing 12 00403 g001
Figure 2. The cloud liquid water (CLW) Jacobians for the six channels shown in Figure 1. The CLW input was set to 0.0001 kg/kg in the layers from the surface to 322 hPa.
Remotesensing 12 00403 g002
Figure 3. Transmittance at (a) 54.4 GHz, (b) 54.94 GHz and (c) 55.5 GHz considering CLW absorption. The top varies among the CLW profiles from 322 to 986 hPa, and the bottom of the cloud is set to the surface. The transmittance of different channels changes as the height of CLW varies.
Remotesensing 12 00403 g003
Figure 4. Difference between cloudy and clear sky radiance with changes in the cloud fraction and cloud top height at (a) 54.4 GHz, (b) 54.94 GHz and (c) 55.5 GHz.
Remotesensing 12 00403 g004
Figure 5. Schematic diagram of unified cloud top height. (a) Real-time cloud height for Medium Resolution Spectral Imager-2 (MERSI-2) pixels before applying our “remap” method, and (b) the unified cloud top height for Microwave Temperature Sounder 2 (MWTS)-2 pixels after remap.
Remotesensing 12 00403 g005
Figure 6. Cloud parameter product from MERSI-2 (a–b) and the remapped cloud parameters on MWTS-2 fields of view (FOVs) (c–d). (a) and (c) show the cloud fraction, and (b) and (d) show the cloud top height. As discussed in Section 3.2, only four unified cloud top heights (300, 350, 400 and 750 hPa) can be used to evaluate the impacts of clouds.
Remotesensing 12 00403 g006
Figure 7. The quantity of observations of MWTS-2 channels 5–7 after applying dynamic channel selection (DCS), for four experiments conducted at (a) 0600 UTC and (b) 1200 UTC on December, 10 2018. The dark blue column is the quantity of CTRL observations without application of DCS and the other three columns are the quantities of observations with use of DCS.
Remotesensing 12 00403 g007
Figure 8. Spatial distribution of observations from channel 5 remaining at 1200 UTC on December 10, 2018, after application of DCS for the (a) CTRL, (b) DCS05, (c) DCS10, and (d) DCS20 experiments. The cloud mixing ratio obtained from the Global Forecasting System (GFS) analysis is depicted as a color-coded background that indicates the global distribution of cloud coverage.
Remotesensing 12 00403 g008
Figure 9. Spatial distribution of observations that passed the cloud detection threshold in the CTRL (a,c,e) and DCS05 (b,d,f) experiments based on the O-B of MWTS-2 channel 5 data (a,b), channel 6 data (c,d) and channel 7 data (e,f) at 1200 UTC on December 10, 2018. The monochrome background is the same as that used in Figure 8.
Remotesensing 12 00403 g009
Figure 10. Mean, standard deviation (STDV) and root mean square (RMS) of O-B for MWTS-2 channels 5–7 for all four experiments conducted at (ac) 0600 UTC and (df) 1200 UTC on December 10, 2018. The dark blue columns are the O-B errors for all three channels in CTRL; red columns correspond to DCS05, orange columns to DCS10 and purple columns to DCS20.
Remotesensing 12 00403 g010
Figure 11. (a) the number of observations, and (b) mean, (c) STDV and (d) RMS of the O-B for MWTS-2 channel 5 data obtained between 0600 UTC on December 21 and 0600 UTC on December 28, 2018.
Remotesensing 12 00403 g011
Figure 12. Same as Figure 11 but for MWTS-2 channel 6.
Remotesensing 12 00403 g012