Article

Grassland Wildfires in the Southern Great Plains: Monitoring Ecological Impacts and Recovery

1
Agronomy Department (Adjunct), Kansas State University, Manhattan, KS 66502, USA
2
USDA-ARS Grazinglands Research Laboratory, El Reno, OK 73036, USA
3
Department of Microbiology and Plant Biology, University of Oklahoma, Norman, OK 73019, USA
4
Department of Geography, Oklahoma State University, Stillwater, OK 74078, USA
5
Morris K. Udall and Stewart L. Udall Foundation, University of Arizona, Tucson, AZ 85701, USA
*
Author to whom correspondence should be addressed.
Remote Sens. 2020, 12(4), 619; https://doi.org/10.3390/rs12040619
Submission received: 3 January 2020 / Revised: 4 February 2020 / Accepted: 12 February 2020 / Published: 13 February 2020
(This article belongs to the Section Remote Sensing in Agriculture and Vegetation)

Abstract

:
Devastating wildfires in Texas, Oklahoma, and Kansas in 2016 and 2017 resulted in significant social, economic, and environmental losses, with the agricultural sector among those severely affected. Several satellite-based indices were evaluated as potential monitoring tools for post-wildfire ecological recovery and management of grasslands. All indices evaluated provided useful information and indicated rapid vegetation recovery from wildfire. The Leaf Water Stress Index (LSWI) and Gross Primary Productivity (GPP) showed a distinct response to the wildfire events, and differentiated between burned and unburned areas throughout the post-wildfire growing seasons better than the Normalized Difference Vegetative Index (NDVI) and Enhanced Vegetative Index (EVI). In particular, the LSWI may provide a useful tool for mapping the footprint of wildfire, with potential utility for organizations that provide post-fire recovery resources. The GPP, which estimates the biomass productivity of vegetation, can provide information to livestock operators to guide the re-stocking of cattle in the aftermath of wildfire. In sum, satellite-based proxies can provide timely information both to characterize a wildfire’s footprint and to guide post-fire grazing management in a manner that balances short term needs for forage with long-term productivity and ecological function.

Graphical Abstract

1. Introduction

The grasslands of the Great Plains support a large beef cattle industry that produces a significant portion of the US beef supply and is an important economic driver of the region. The grasslands are also critical for biodiversity, climate regulation, hydrologic function, and other ecosystem services [1,2]. The grassland ecosystems of the Great Plains evolved with wildfire and grazing by large ruminant animals, so research on the management of grasslands for beef cattle production has traditionally focused on management of the wildfire and grazing regimes.
While wildfire has always been a part of grassland ecosystems, Donovan et al. [3] found that large wildfires have increased in the grassland and savanna biomes of the Great Plains of North America from an average of 33.4 annually from 1985 to 1994 to 116.8 annually from 2005 to 2014. In the same timeframe, the area burned increased by 400% and the probability of large wildfire increased by 70%. Their analysis showed no change in the seasonality of wildfire in the Great Plains. Dennison et al. [4] similarly found that large wildfire numbers and area burned increased from 1984–2011 across the western US, including the Southern Plains region, and that increased wildfire was associated with enhanced drought severity. Wildfire risks are affected by complex interactions of meteorology, climatology, land use, and management. Projections of increased temperature, changes of seasonality in precipitation, and longer droughts indicate that the climatic drivers of wildfire risk may increase in the future [5,6]. Hoff et al. [7] described how the removal of wildfire following widespread settlement allowed the encroachment of woody plants dominated by Juniperus virginiana into the Cross Timbers region of central Oklahoma, increasing wildfire risk because of the flammable nature of J. virginiana. Wang et al. [8,9] mapped the rapid encroachment of J. virginiana into the grasslands of the Southern Great Plains in recent decades, which has significant implications for wildfire risks in the region. Additionally, Brunsell et al. [10] identified woody plant encroachment into grasslands and savannas as a global phenomenon. While prescribed fire is a common practice to limit J. virginiana encroachment in portions of the sub-humid Great Plains, the practice is not common in the semi-arid to arid regions.
The social, economic, and ecological costs of wildfire in forest systems has received considerable attention [4,11,12,13,14,15,16,17,18]. However, the serious challenges posed by large grassland wildfires to livestock-based agricultural operations have received less attention. Following a large grassland wildfire, there are urgent and long-term needs for assistance: to address the health issues of human population and livestock; restore utilities, fencing, shelter and other infrastructure lost to the fire; and provide feed to cattle and other livestock displaced from fire-impacted pastures [19]. There is also opportunity after the most urgent needs are addressed to engage communities in dialog about fire-preparedness [19].
Prescribed fire is a recommended management practice in the Great Plains grasslands, and much of the research on fire in the Great Plains grasslands deals with prescribed burning. In that case, spring regrowth following a prescribed fire provides high quality forage, but it is unknown whether vegetation regrowth is affected differently by hotter wildfires compared to prescribed fires. The purpose of this study was to assess the usefulness of several satellite-based indices, specifically the Normalized Difference Vegetative Index (NDVI), the Enhanced Vegetative Index (EVI) the Leaf Water Stress Index (LSWI), as well as the satellite-based Gross Primary Productivity (GPP), to monitor the post-wildfire recovery of vegetation in a Great Plains grassland environment. Specifically, this study provides a framework by which satellite-based indices can inform post-wildfire management decisions for agricultural operations on Great Plains grasslands. Three large wildfires—Anderson Creek, Starbuck, and Perryton—that affected Texas, Oklahoma, and Kansas in 2016 and 2017 were chosen for the study, due both to their size and their effect on livestock operations. This analysis was part of a broad, multi-institutional regional response to the 2016 and 2017 wildfire seasons, led by the U.S. Department of Agriculture and University of Oklahoma, to review the meteorological, climatological, and land use conditions associated with the wildfires, evaluate remote sensing tools to monitor post-wildfire recovery, and understand community needs in advance of and following wildfire occurrence.

2. Materials and Methods
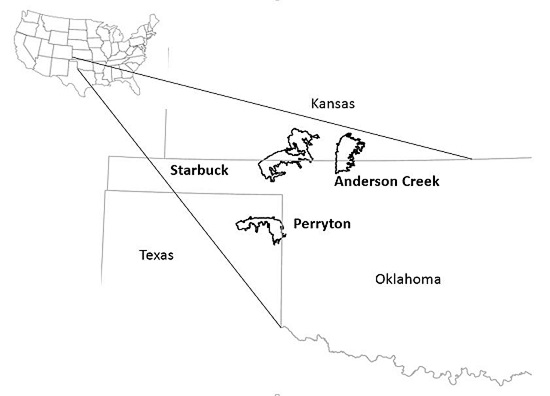
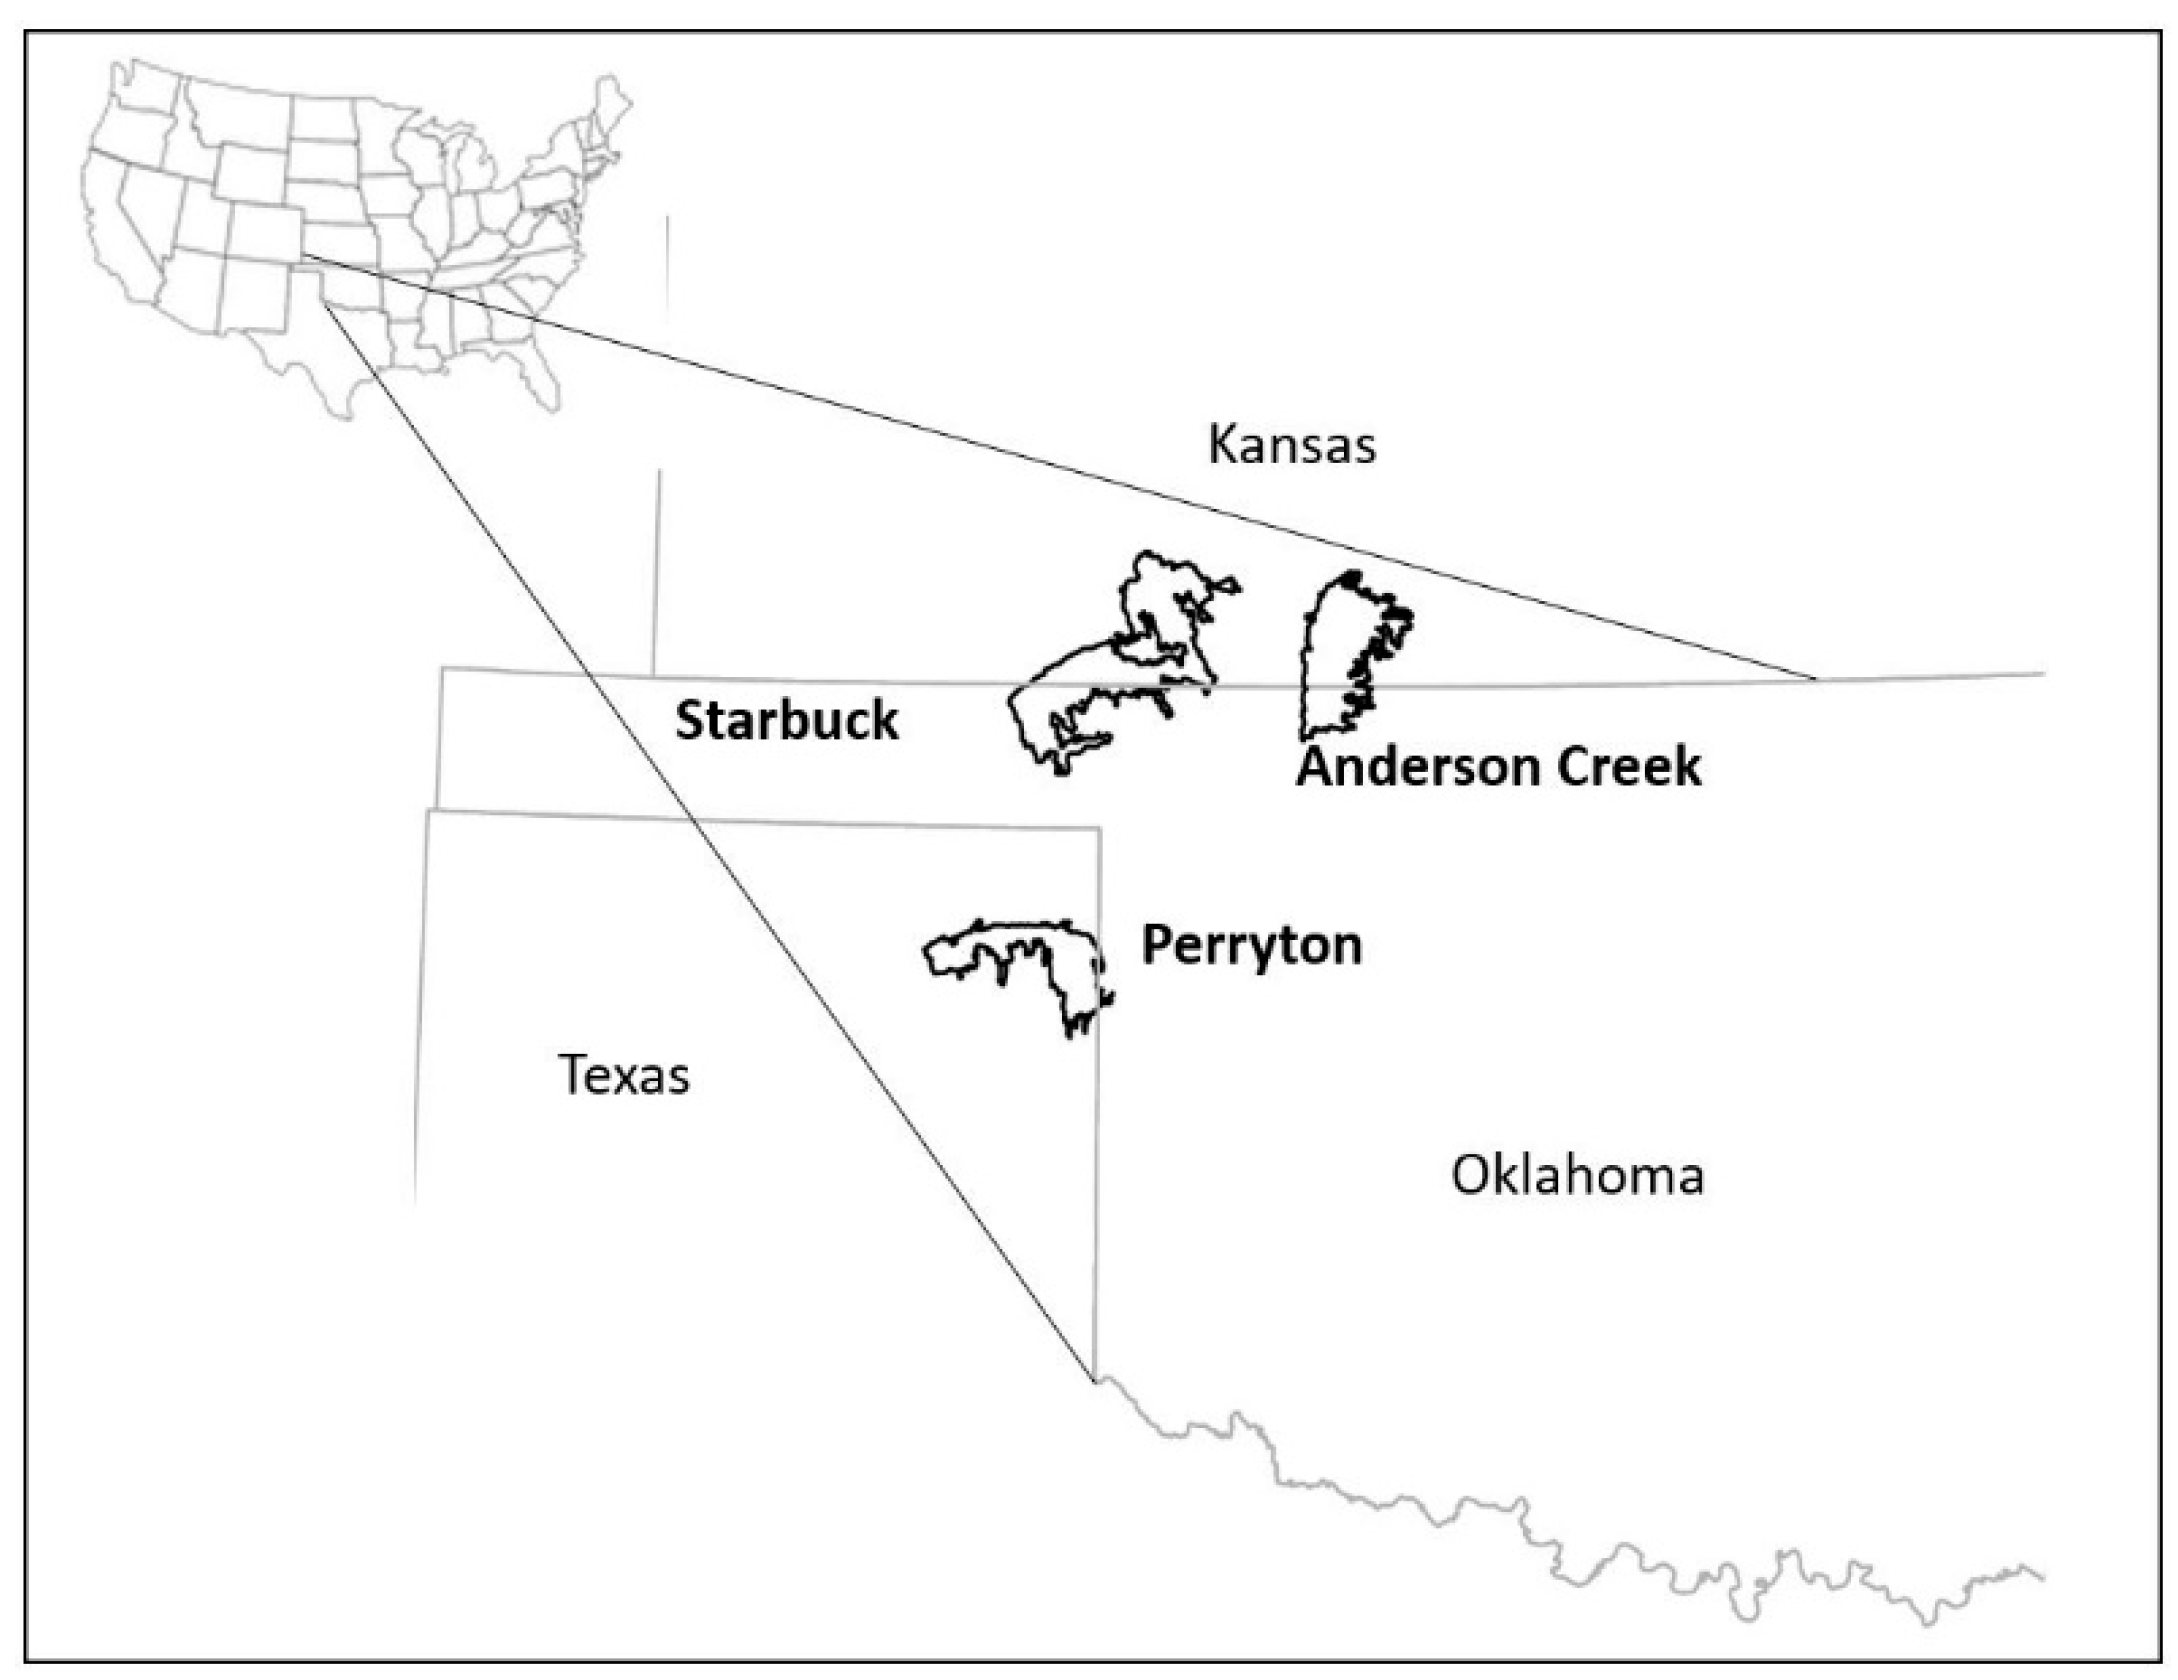
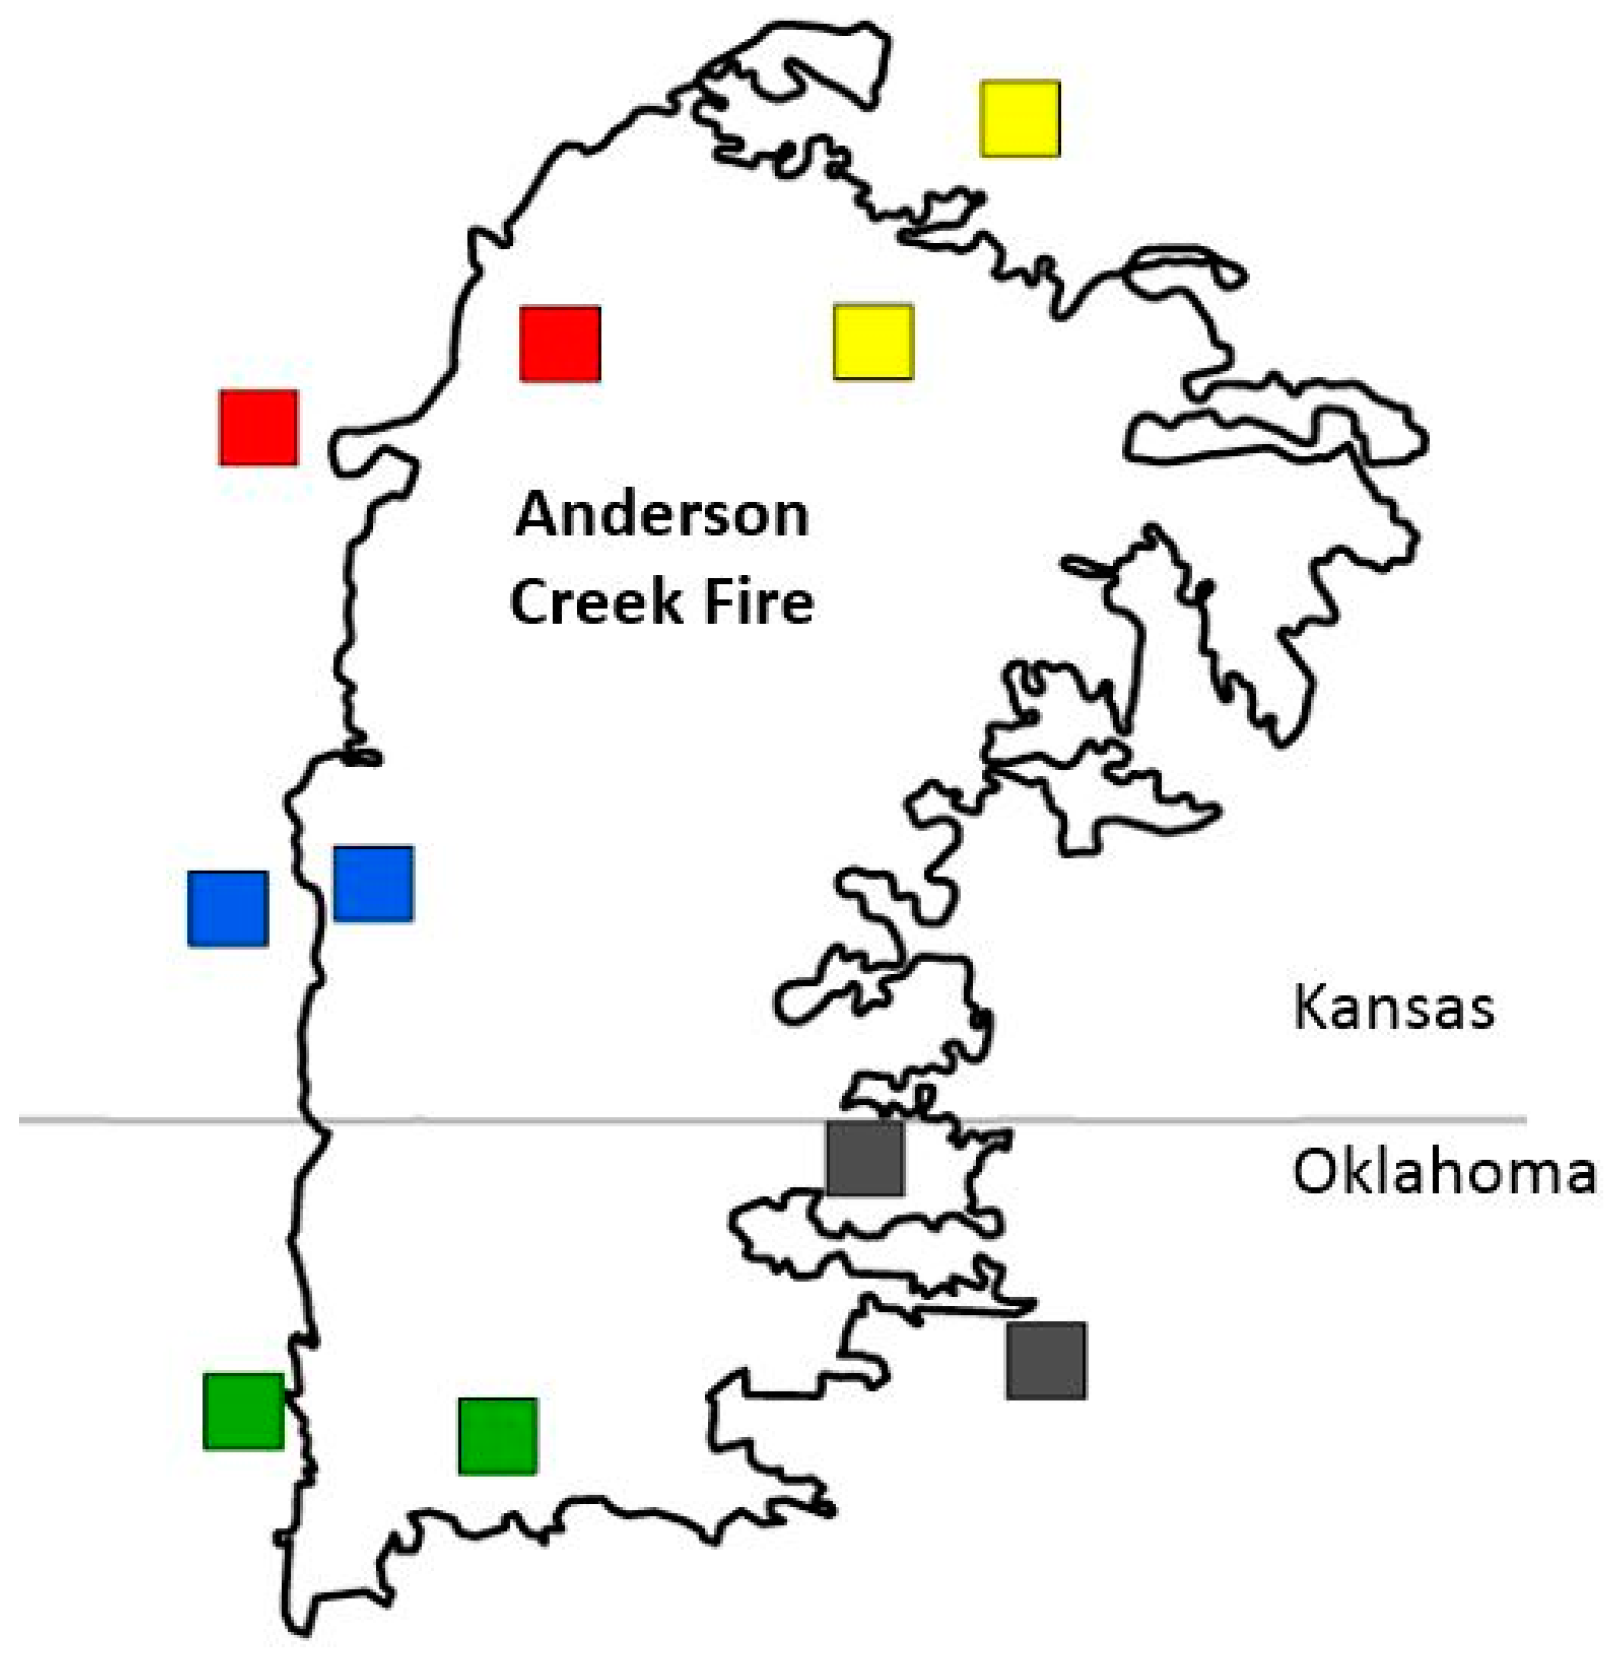
2.1. Study Area

The geographic focus of the assessment was wildfire-impacted areas of the Southern Great Plains in Kansas, Oklahoma and Texas. In particular, locations affected by the Anderson Creek (2016), Starbuck (2017) and Perryton (2017) wildfires were analyzed. These fires were selected based on the magnitude of the fires, their regional locations, and their multi-state footprints. The Anderson Creek started on 23 March 2016 in Oklahoma and burned 180,240 ha in Oklahoma and Kansas. The Starbuck fire started on 6 March 2017 in the Oklahoma panhandle and burned 246,570 ha in Oklahoma and Kansas. The Perryton fire started on 6 March 2017 in the Texas Panhandle and burned 145,358 ha in Texas and Oklahoma.

2.2. Delineating the Footprint of the Wildfires and Selecting Research Plots

The outlines of the fire-affected areas (Figure 1) were drawn using the Landsat-derived Normalized Burn Ratio-Thermal (NBRT) [20]. The open source geospatial analysis software QGIS 3.0 was utilized to clip the burned–unburned pairs from the raw imagery.
For each wildfire, five paired burned–unburned 3 × 3 km plots were selected to represent the diversity of the burned area (illustrated in Figure A1). Plot pairs were selected based on similarities in elevation, slope, soil type and land cover type (Table A1). Rainfall and temperature similarities were also considered when selecting the pairings (data not shown). Elevation and slope data (Table A1) were taken from the Shuttle Radar Topography Mission (SRTM) dataset at 30 m resolution. Grasslands are the predominant land cover type, per the United States Geographic Survey National Land Cover Database [21] classification, for all selected pairs (Table A1). Soil data were acquired from the Soil Survey Geographic Database (SSURGO) through the U.S. Department of Agriculture, Natural Resources Conservation Service [22].

2.3. MODIS Surface Reflectance and Vegetation Index Data

To examine the effects of the wildfires on different plant characteristics and properties, the 8 day scale, 500 m Moderate Resolution Imaging Spectroradiometer (MODIS) surface reflectance data (MOD09A1) were used to produce three vegetation indices, including NDVI, EVI, and LSWI. All available, and reasonable, 16 day MODIS data were used; this equates to 23 images per year. There were a few notable exceptions when snow cover was present. The values for the MODIS data were then interpolated and smoothed using the cubic method in Python to generate the values shown. For each 3 × 3 km plot, there were between thirty and thirty-six MODIS pixels. The NDVI, EVI, and LSWI were calculated for this study using MODIS data downloaded from Google Earth Engine. The average of the pixels within individual 3 × 3 km plots was computed for each individual image of the specific indices.

2.4. Gross Primary Production (GPP) Data from the Data-driven Vegetation Photosynthesis Model (VPM)

Additionally, we used the 500 m spatial and 8 day temporal resolution GPP data product from the simulation of Vegetation Photosynthesis Model (VPM) [23]. The simulation of VPM model is driven by time series images from the by MODIS and climate data (photosynthetically active radiation (PAR); air temperature). GPP data have been evaluated at many CO2 eddy flux tower sites [24,25,26,27,28] and the results show that the VPM produces very good consistency with tower-derived GPP. The time series GPP data were acquired from at the University of Oklahoma’s Earth Observation and Modeling Facility (http://www.eomf.ou.edu/ accessed on 13 December 2019).

2.5. Statistical Analysis

To show the direct effects of the fire and the subsequent ecological recovery, the mean value from the five burned and unburned plots during the year of the fire was calculated. This resulted in a single mean value and variability represented by one standard deviation above and below the mean for burned plots and for unburned plots at each time step. To establish the context for the data from the wildfire year, the same statistics were calculated for the burned–unburned pairs three years prior to each wildfire.

3. Results

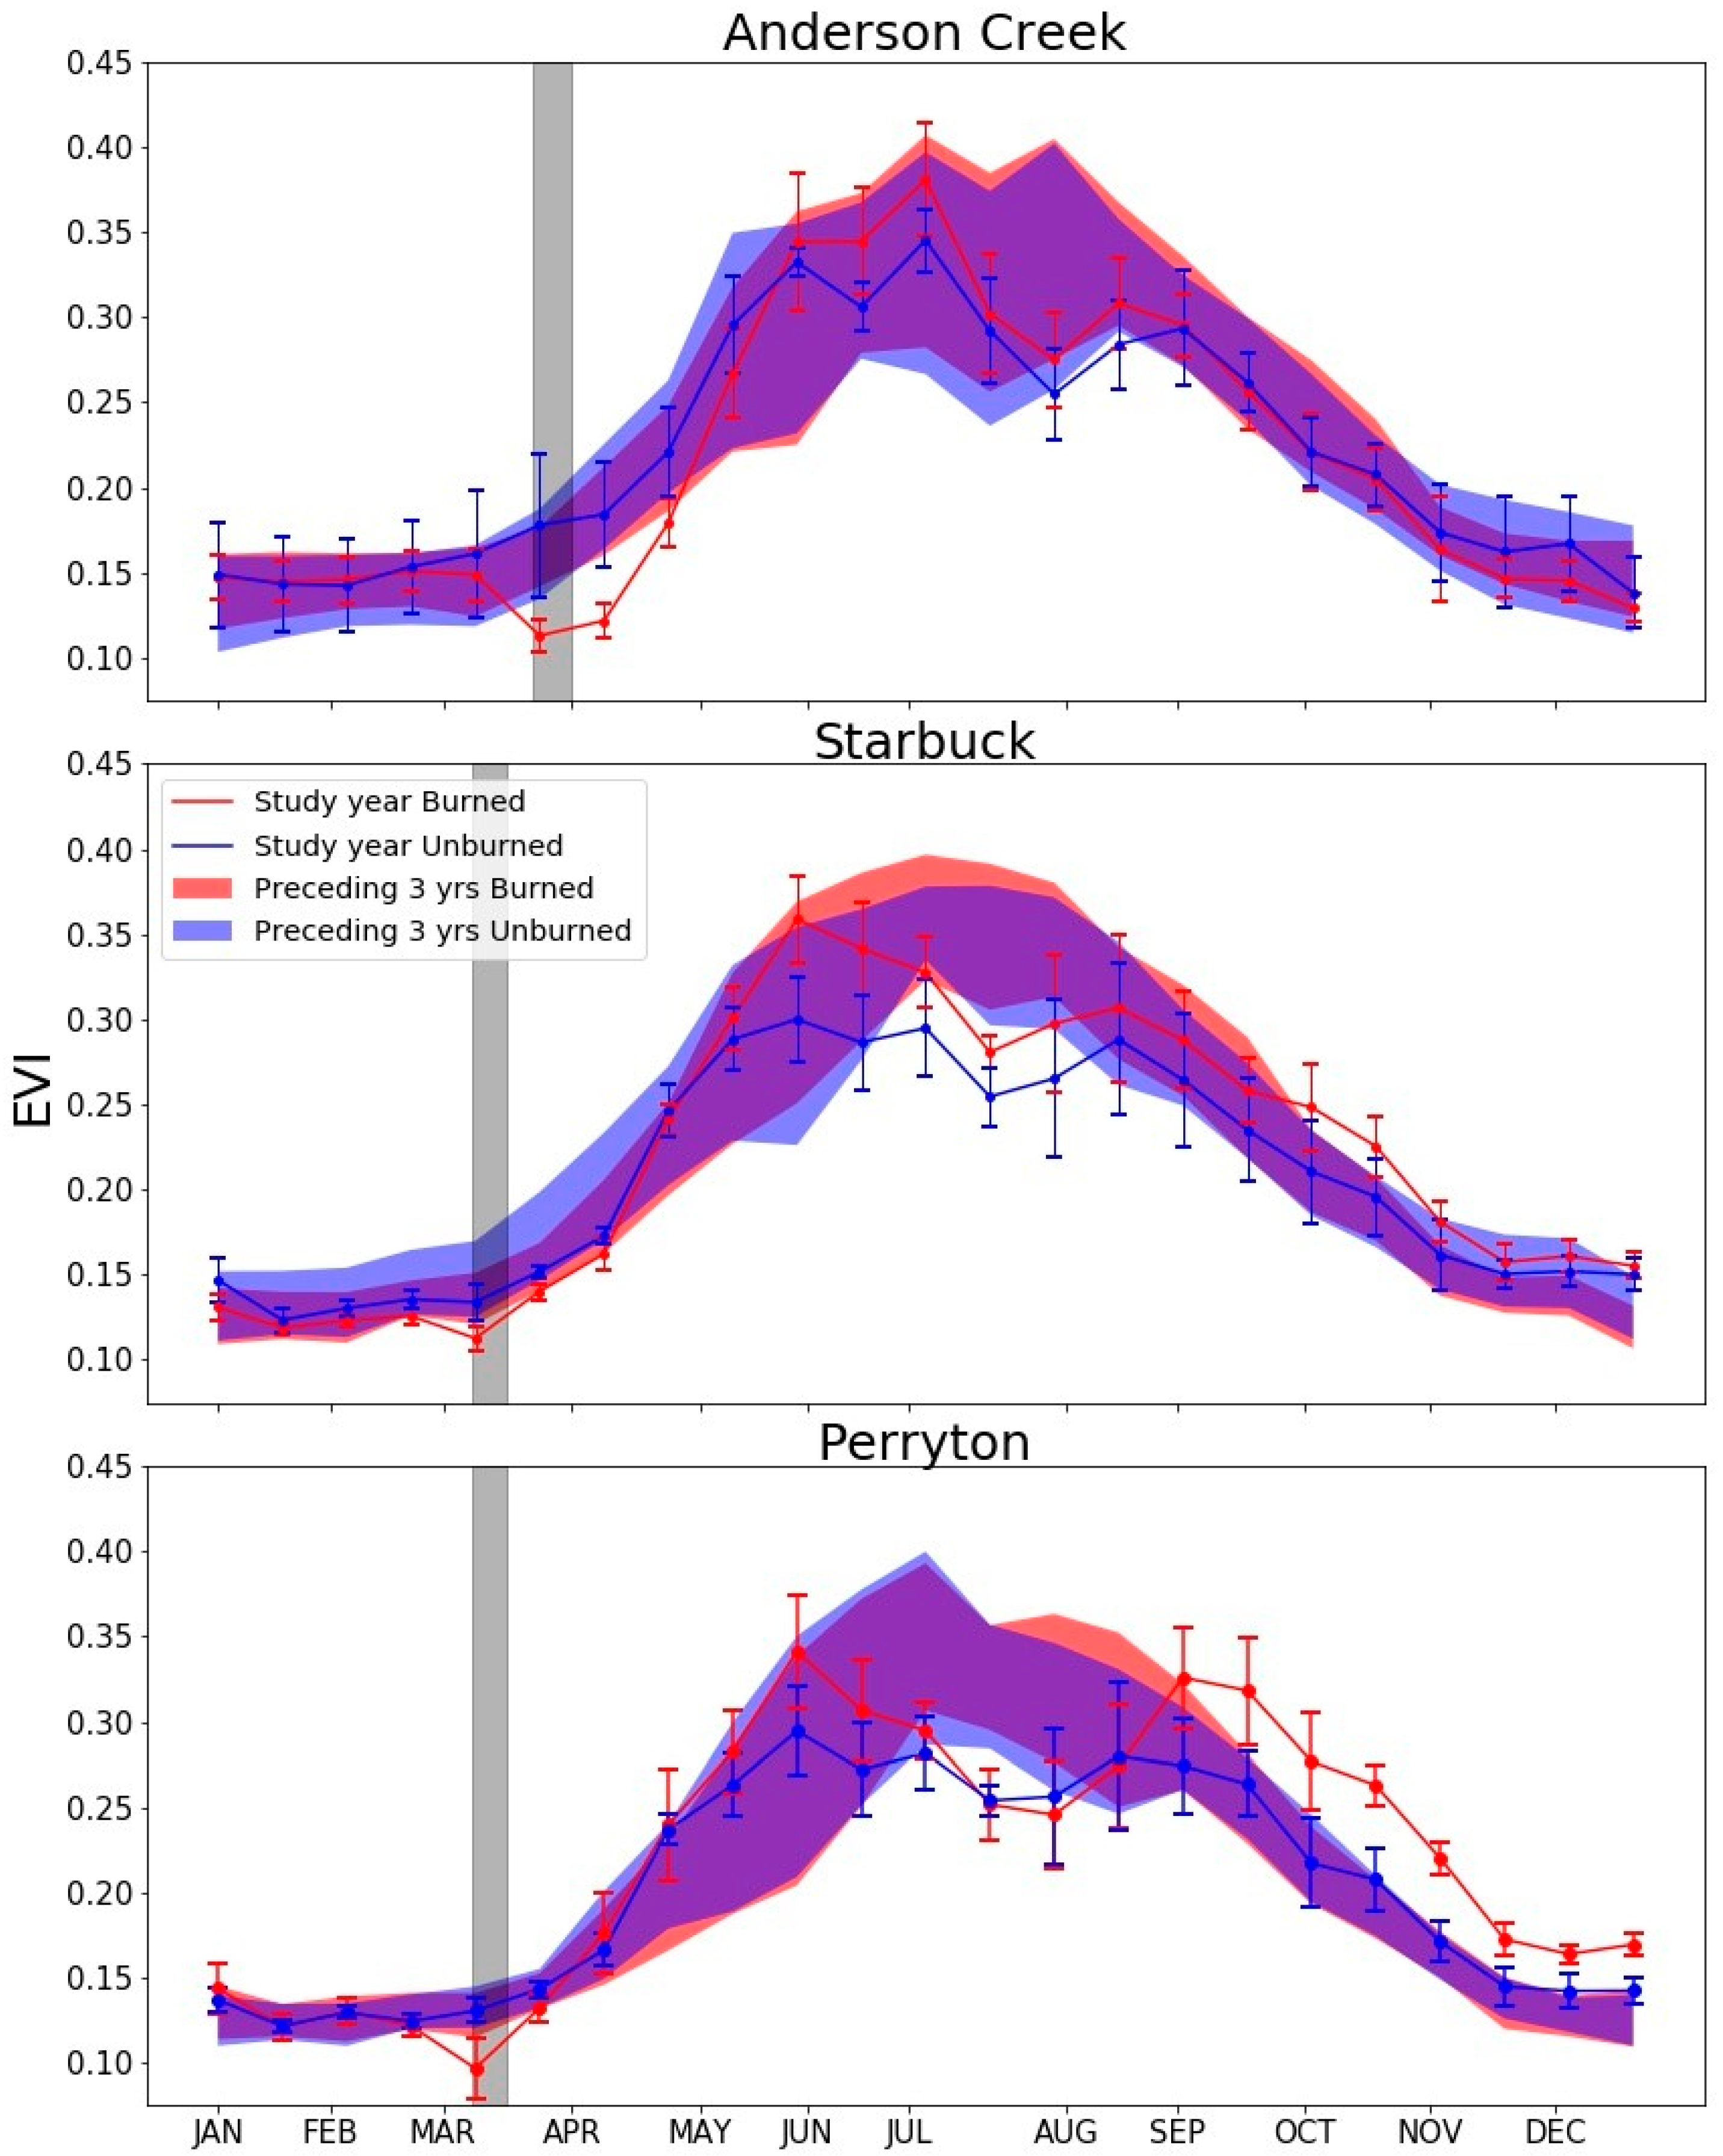
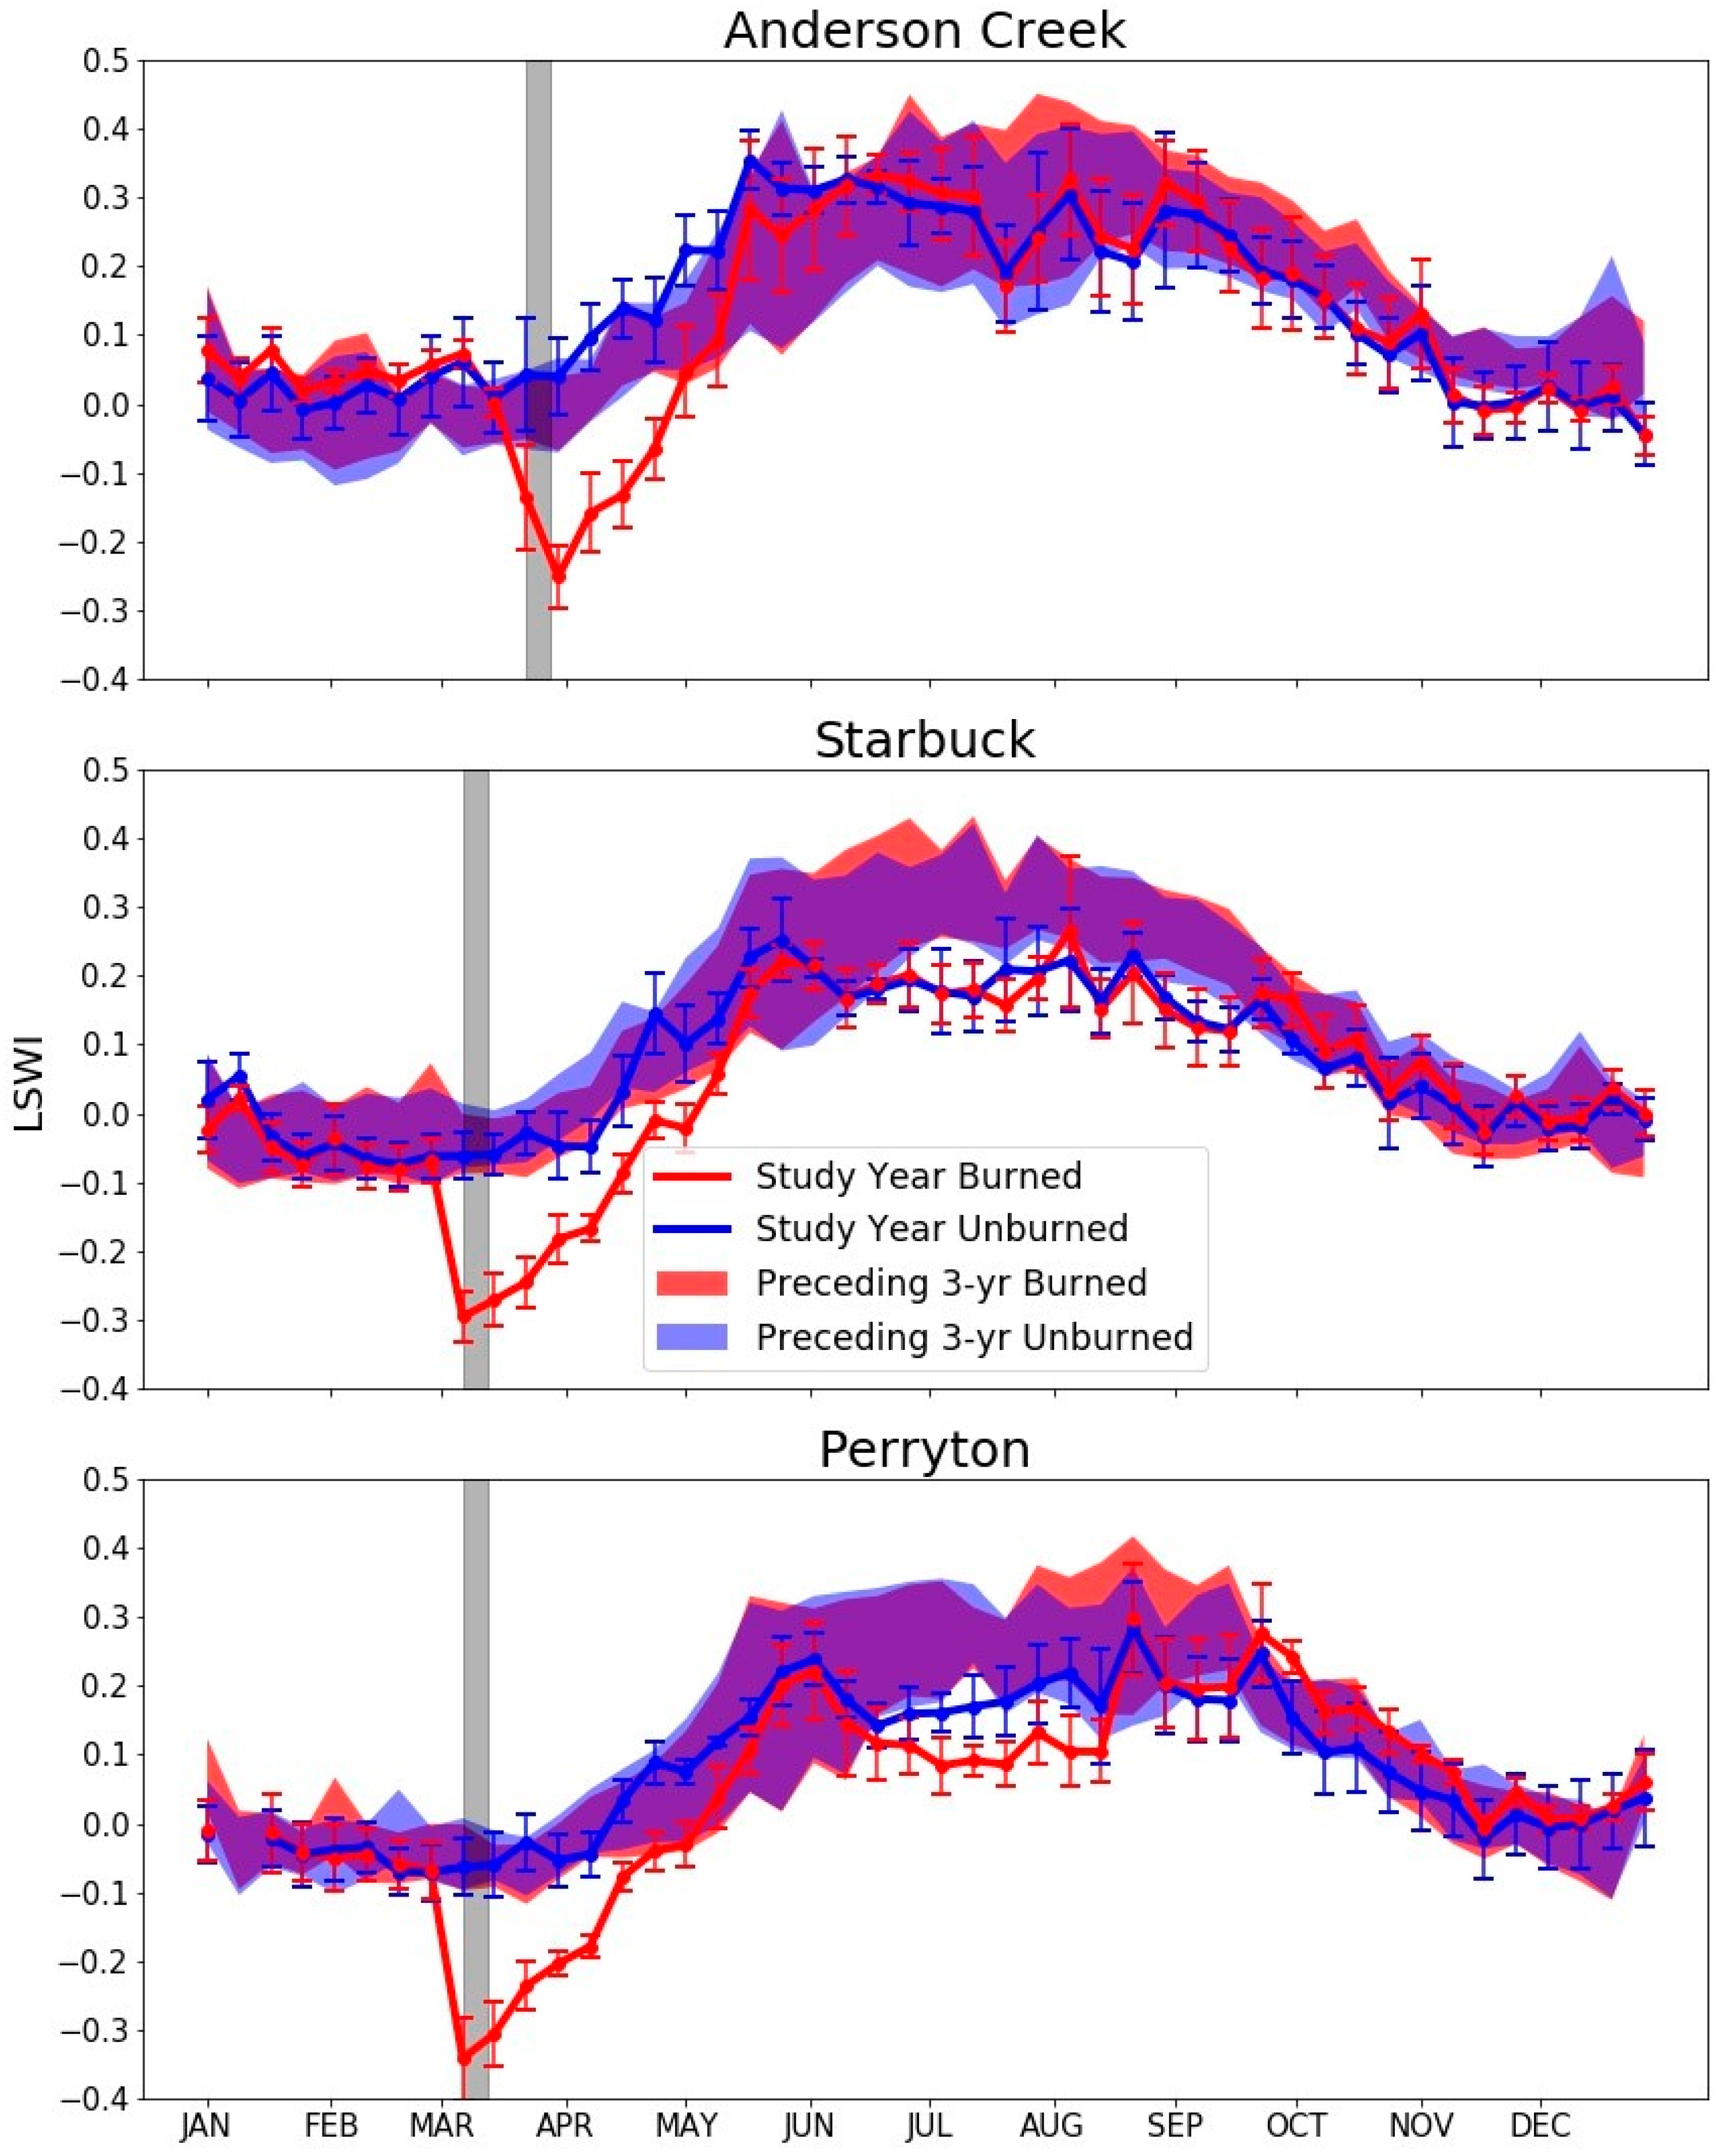
3.1. Effect of Wildfire on Vegetation Greenness—Pair-Wise Comparison of Vegetation Indices between Fire-Affected and No-Fire Areas

During the pre-fire period (winter and spring) the fire-year and 3 year prior NDVI values were similar (Figure 2). For 1 month post-fire, the NDVI values for burned plots dropped due to loss of biomass and the burnt surface which had low reflectance. During the green-up period in late spring to early summer, both burned and unburned plots had rapid increases in NDVI. By June, the burned and unburned plots had similar values of NDVI and were similar to the 3 years prior values. While the NDVI during the peak summer growing season in the first year post-fire was similar to 3 years prior values for the 2016 Anderson Creek fire, the post-burn mid-summer NDVI was lower than 3 years prior values for the Starbuck and Perryton fires, which occurred in 2017. The Perryton site and, to a lesser degree, the Starbuck site, showed a rebound in NDVI in the fall in the burned plots compared to the unburned plots. The US Drought Monitor (https://droughtmonitor.unl.edu, Accessed on 13 December 2019) indicates that, for the Southwest Kansas, Texas High Plains, and Oklahoma Panhandle and North Central climate regions, the summer of 2016 and 2017 were less dry than spring or fall of those years, and that 2017 had higher drought levels than 2016. While there may have been differences in post-fire species composition responses or grazing pressure for the different fires that could be reflected in the NDVI values, no data are available to evaluate those impacts.
The EVI is related to the chlorophyll content of the vegetation so we anticipated a reduction in EVI following wildfire. As with the NDVI, the winter and spring pre-fire EVI values (Figure 3) during the study year were low and similar to values observed during the 3 years prior period. Following the burn event, the EVI dropped in the burned plots, but the response was of lower magnitude and shorter duration for the Starbuck and Perryton fires than for the Anderson Creek fire. For all three fires, the EVI increased rapidly on burned and unburned plots during the green-up period. In contrast to the NDVI, the EVI on the burned plots reached or exceeded the unburned EVI values by mid-summer. However, the EVI values dropped in late summer, and were lower than 3 years prior values for the Starbuck and Perryton fires. At the Perryton site, which included a greater number of shrubs than the other two sites (Table A1), the EVI index for the burned plots remained significantly above the unburned plots through the fall and exceeded 3 years prior EVI values in October and November.
The LSWI, which is related to water in vegetation and soils, showed a strong response to the fire events (Figure 4), with a pronounced decrease in LSWI on the burned plots compared to the unburned. The unburned plots have a higher leaf area and maintained a higher LSWI through early spring, though the burned plots showed a rapid increase during late spring to early summer as the leaf area recovered. By June, when the canopies were fully closed, the indices of the burned and unburned plots were similar. The summer EVI values were similar to the 3 years prior values for the Anderson Creek fire but lower than 3 years prior values for the Starbuck and Perryton fires. For the Perryton fire, the LSWI was higher in the burned than unburned plots during fall.

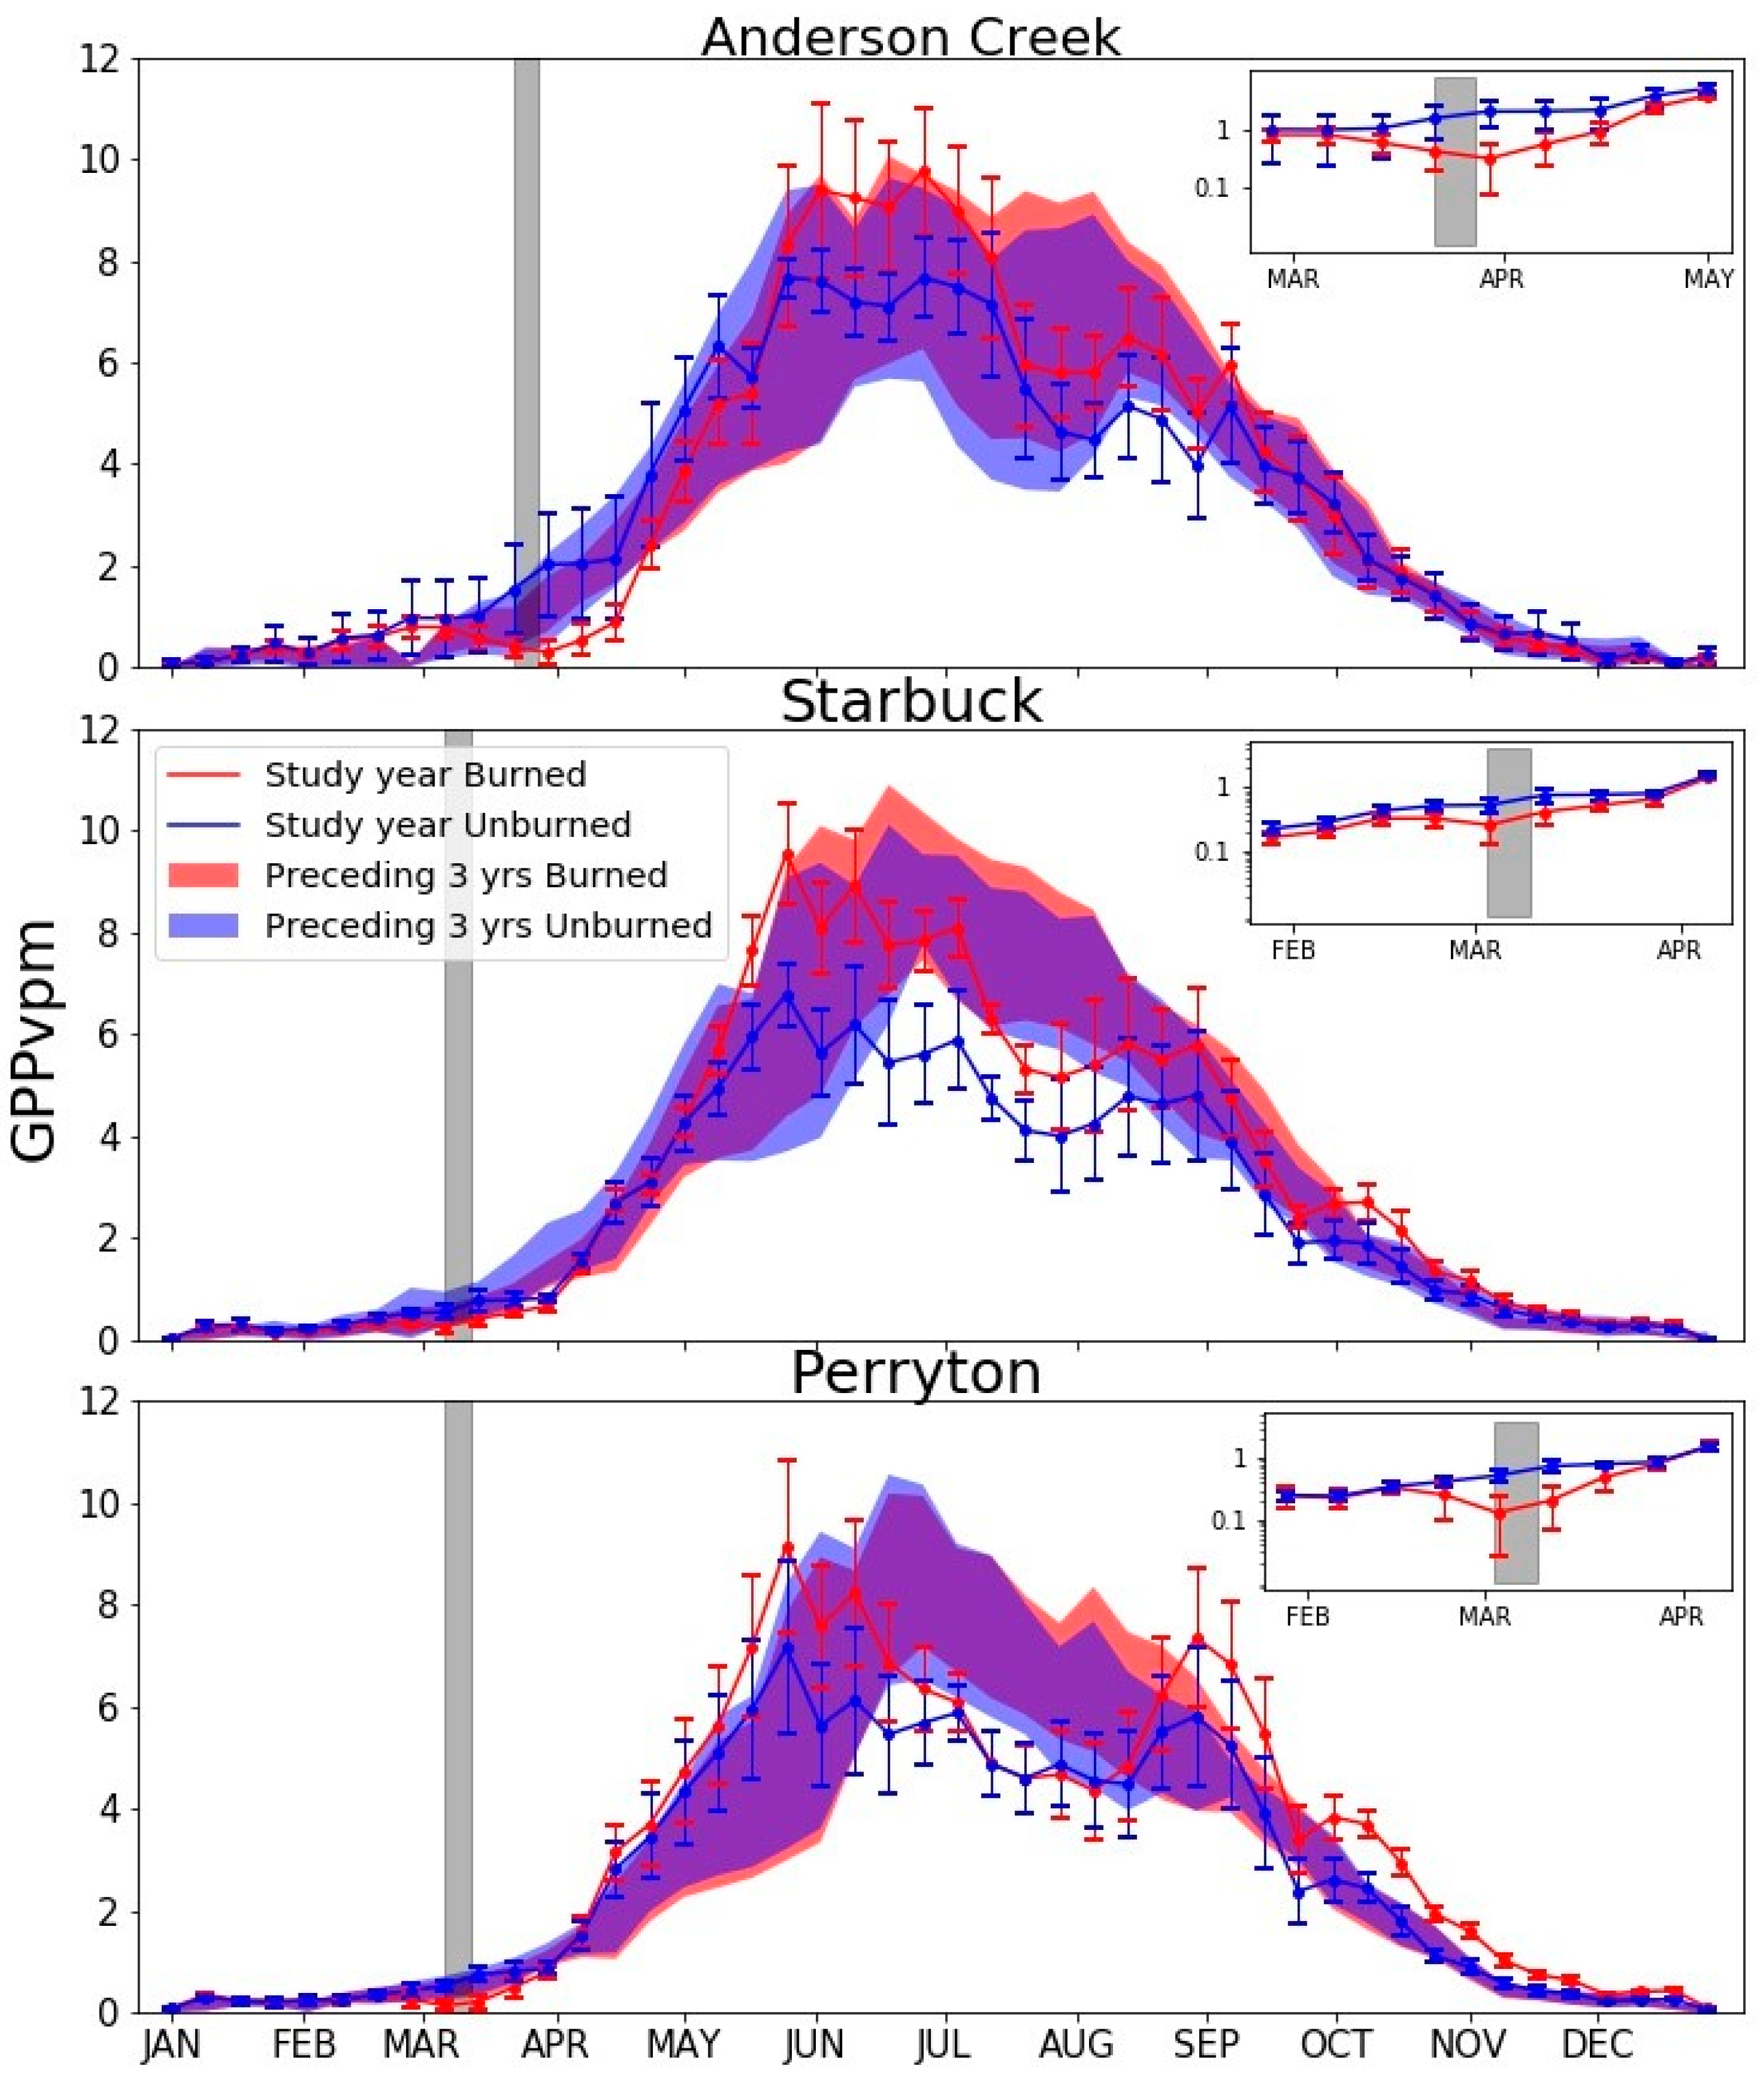
3.2. Effect of Wildfire on Gross Primary Production (GPP)—Pair-Wise Comparison of Gross Primary Production between Fire-Affected and Non-Fire Areas

The winter GPP values were very low for all treatments and study year values were similar to 3 years prior values (Figure 5). As the fires occurred during the dormant season, the GPP values were low but showed a distinct response to the burn, with a suppression of growth on the burned plots compared to the unburned plots for a few weeks (insets, Figure 5). Following the short suppression, there was very rapid increase in GPP on the burned compared to the unburned plots, with the values for burned plots exceeding unburned plots by early to mid-May and remaining significantly higher throughout the summer. A rapid increase in GPP on the burned compared to unburned plots is expected because the canopy is composed of fresh green vegetation with no litter in the canopy. The summer fire-year GPP was similar to 3 years prior GPP for the Anderson Creek fire, but lower than the 3 years prior GPP for the Starbuck and Perryton fires.

4. Discussion

4.1. Effect of Wildfire Impacts on Grassland Greenness As Described by Vegetation Indices

Vegetation indices prior to the beginning of the fire were all similar to the three years prior indices in early spring. The NDVI, EVI, and LSWI indices (Figure 2, Figure 3 and Figure 4) all indicated that recovery from the three major fires was rapid. In all cases, the fires occurred in spring (March or April) when the perennial, warm season vegetation was dormant. The native vegetation evolved with fire-disturbance and energy reserves are stored below-ground during dormant periods. The onset of spring growth was triggered soon after the fires as air temperatures increased. Wildfires occurring at other times of the year would show different recovery responses. However, spring time is the greatest period of risk for wildfire in the Southern Plains due to high windspeed, very low humidity, and dormant vegetation. Fire risks are particularly high if a spring drought follows wetter growing seasons which may produce substantial fuel loads. The LSWI provided a sharp decline at the time of the fires that was not exhibited by the NDVI and EVI indices. Li and Guo [29] also reported greater biomass within 3 months in burned compared to unburned regions in the Northern Great Plains using Landsat-based NDVI. Van Leeuwen et al. [30] applied the NDVI to monitor post-wildfire vegetation indicators in grasslands in the USA, Spain, and Israel.

4.2. Effect of Wildfire Impacts of Grassland GPP As Predicted by Data-Driven Models

The GPP shows great promise for monitoring grassland condition, due to its responsiveness throughout the season. Additionally, since it is based on physiological principles, it provides information about the rate of biomass production. The very high GPP rates in spring following burning are likely related to the high interception of radiation by young, green, rapidly growing leaf areas. There may also be shifts in species composition that could affect the duration of differences between burned and unburned plots. However, data are not available in this study to evaluate species composition pre- and post-fire. While the greater productivity on burned compared to unburned areas may be counterintuitive, Hulbert [31] reported the same response on the Konza Prairie Research Natural Area in Kansas, which he attributed to soil warming, increased surface light intensity, and nitrogen availability.

4.3. Use of Remotely Sensed Information for Monitoring and Assessment of Wildfire Recovery

Information about the recovery of the grasslands can support a wide range of efforts in post-fire recovery and mitigation. One critical need following a grassland fire is the provision of feed for livestock, since pastures for grazing cattle is the dominant use of grassland in this region. To ensure long-term recovery of the grassland, deferral or careful grazing management is needed post-fire [32,33], but there are few quantitative guidelines on how to balance short-term needs for forage with longer term sustainability of the grassland ecosystem. The GPP estimates the biomass productivity, providing needed information to guide stocking rates and the duration of differences in burned and unburned portions of a ranch. In the Northern Great Plains, Gates et al. [34] found that defoliation following a spring fire increased grassland productivity for 2 years following a wildfire and had minimal impact on community composition. They concluded that a post-fire rest from grazing may not be necessary to maintain productivity and species composition in a mixed-grass prairie. Gullap et al. [35] also found that prescribed burning increased crude protein levels during the first year after burning in a semi-arid steppe rangeland. In an evaluation of fire-grazing interactions in two northern Great Plains pastures, Powell et al. [36] found that cattle showed significant preference, use, and grazing utilization in recently burned patches that declined as time since fire increased. Cattle selection was driven by significantly increased crude protein in recently burned areas. They concluded that mixed-grass prairies of the Northern Great Plains are resilient to the fire–grazing interaction and that rest from grazing following fire is not required to sustain the ecological system. The results of this study in the Southern Great Plains (Figure 5) indicate that vegetation regrowth was very rapid and productivity in burned areas was very high, indicating that utilization of forage may be possible during the summer and fall following a wildfire. Fuhlendorf et al. [37] proposed recoupling fire and grazing for landscape management on agricultural grasslands which would have the benefit of sustained productivity and reduced wildfire risk.

5. Conclusions

The purpose of this study was to assess the usefulness of several satellite-based indices to monitor post-wildfire vegetation recovery following three significant grassland wildfires in the southern Great Plains. The results show that satellite-based information can indeed inform post-wildfire response and recovery efforts. Several vegetative indices—NDVI, EVI, and LSWI—and a data-driven model of GPP all provided useful information about the vegetation response to the Anderson Creek, Starbuck, and Perryton wildfires. However, the LSWI and GPP indices provided a distinct response to the wildfire events, and differentiated between burned and unburned plots throughout the subsequent growing seasons better than the NDVI and EVI indices. In particular, the LSWI responded distinctly differently in burned and unburned plots at the time of the fire event and may provide a useful tool for delineating the footprint of future wildfires. Such information could be used by federal agency, extension, and conservation programs to target post-wildfire program assistance and recovery resources. In addition, the GPP differentiated between burned and unburned areas throughout the post-fire seasons, and may provide information to guide post-wildfire grazing management. It is beneficial to the ranchers to return cattle to graze in the pastures as soon as biomass stock and productivity is adequate to support livestock requirements while also sustaining grassland ecosystem recovery. Further research is needed to develop these promising approaches to support operational needs, and to identify other data requirements necessary for fire preparedness planning from ranch to community scales.

Author Contributions

Conceptualization, J.L.S., D.B., X.X.; methodology, J.L.S., J.W., S.R., S.T.; analysis, J.L.S., S.R., J.W.; data curation, J.W., S.R., X.X.; writing—original draft preparation, J.L.S, J.W., S.R.; writing—review and editing, S.T., J.W., X.W., Y.Z., D.B., X.X.; visualization, J.W., S.R., J.L.S.; supervision, J.L.S., S.T., X.X., D.B. All authors have read and agreed to the published version of the manuscript.

Funding

This work was funded in part through USDA-ARS and University of Oklahoma Agreement No. 58-3070-8-012.

Acknowledgments

This analysis was undertaken as part of a broad-based, partner-focused response to the recent Southern Plains wildfires, coordinated through the USDA Southern Plains Climate Hub.

Conflicts of Interest

The authors declare no conflict of interest.

Appendix A

Table A1. Characteristics of paired burned (B) and unburned (U) plots for the Anderson (A), Starbuck (S), and Perryton (P) fires in western Kansas, Oklahoma, and Texas. Pairs were delineated based on similarity of soil type, land cover type, elevation, and gradient.
Plot IDBurn Date(s)23Soil Type (%)Land Cover Type (%)Elevation Mean (m)Elevation Range (m)Gradient Mean (%)Gradient Range (%)
A1B23 March 2016Loam (100)Grass (95)609.1579–6291.40.2–3.1
A1U Loam (100)Grass (98)622.9594–6451.20.0–2.7
A2B23 March 2016Clay (100)Grass (89)531.2500–5782.10.2–4.3
A2U Clay (100)Grass (97)523.9494–5591.50.2–3.5
A3B23 March 2016Loam (100)Grass (82),
DF (13)
580.7546–6161.60.2–3.6
A3U Loam (100)Grass (82),
CC (13)
571.7542–6181.40.1–3.6
A4B23 March 2016Clay (72),
Loam (28)
Grass (95)535.7504–5611.70.2–4.4
A4U Clay (44),
Loam (40),
Loamy Sand (16)
Grass (95)538.3512–5621.30.1–3.3
A5B21 March 2016
23 March 2016
25 March 2016
Sandy Loam (51),
Bedrock (39)
Grass (83),
CC (8)
454.0437–4831.10.0–3.5
A5U Bedrock (60),
Sandy Loam (34)
Grass (70),
CC (21)
439.0419–4701.00.0–3.0
S1B7 March 2017Sandy Loam (64),
Loamy Sand (36)
Grass (85),
Water (8)
692.4676–7251.10.1–2.9
S1U Sandy Loam (59),
Loamy Sand (31),
Silt Loam (10)
Grass (74),
Water (11),
CC (11)
710.2693–7550.90.0–2.4
S2B7 March 2017Fine Sand (70),
Loamy Sand (28)
Grass (94)544.0526–5690.50.0–2.0
S2U Fine Sand (75),
Loamy Sand (25)
Grass (91)527.8511–5520.50.0–1.9
S3B7 March 2017
8 March 2017
Loam (100)Grass (80),
CC (15)
607.2583–6331.10.1–2.7
S3U Loam (100)Grass (85),
CC (12)
602.0575–6300.90.0–2.8
S4B7 March 2017Clay Loam (100)Grass (97)716.7678–7622.50.5–5.3
S4U Clay Loam (100)Grass (94)730.6686–7712.10.2–4.3
S5B6 March 2017Clay Loam (68),
Sandy Loam (32)
Grass (95)713.9692–7491.20.1–2.5
S5U Clay Loam (80),
Loam (12)
Grass (94)657.8648–6710.40.0–1.2
P1B7 March 2017Sandy Loam (100)Grass (72),
Shrub (26)
771.6754–7860.90.0–2.2
P1U Sandy Loam (100)Grass (66),
Shrub (34)
776.5750–8000.70.0–2.4
P2B7 March 2017Sandy Loam (100)Grass (94)818.1794 – 8400.80.0 – 2.0
P2U Sandy Loam (100)Grass (81),
Shrub (13)
821.5796–8400.80.1–2.0
P3B7 March 2017Clay Loam (51),
Loam (49)
Grass (55),
Shrub (30),
CC (13)
774.0737 – 8001.50.0 – 4.2
P3U Loam (51),
Clay Loam (48)
Grass (49),
Shrub (41),
CC (8)
719.7694–7521.40.1–3.0
P4B5 March 2017
6 March 2017
Loam (100)Grass (69),
Shrub (30)
870.4796–9002.40.1–7.9
P4U Loam (100)Shrub (54),
Grass (42)
869.9812–9252.50.3–6.1
P5B7 March 2017Silt Loam (74),
Sandy Loam (26)
Shrub (55),
Grass (34),
CC (8)
871.6848–8891.00.2–2.2
P5U Silt Loam (64),
Loam (36)
Grass (61),
Shrub (27),
CC (8)
884.0860–9000.90.0–2.2
Figure A1. Illustration of paired burned (B) and unburned (U) plots for analysis of the 2016 Anderson Creek fire. Each color pair represents different soil-cover type-topographic combinations of characteristics.
Remotesensing 12 00619 g0a1

References

  1. Steiner, J.L.; Wagle, P.; Gowda, P. Management of water resources for grasslands. In Improving Grassland and Pasture Management in Agriculture; Marshall, A., Collins, R., Eds.; Burleigh Dodds Science Publishing: Cambridge, UK, 2017; pp. 265–282. [Google Scholar]
  2. Steiner, J.L.; Starks, P.J.; Neel, J.P.S.; Northup, B.; Turner, K.E.; Gowda, P.; Coleman, S.; Brown, M. Managing Tallgrass Prairies for Productivity and Ecological Function: A Long-Term Grazing Experiment in the Southern Great Plains, USA. Agronomy 2019, 9, 699. [Google Scholar] [CrossRef] [Green Version]
  3. Donovan, V.M.; Wonkka, C.L.; Twidwell, D. Surging wildfire activity in a grassland biome. Geophys. Res. Lett. 2017, 44, 5986–5993. [Google Scholar] [CrossRef]
  4. Dennison, P.E.; Brewer, S.C.; Arnold, J.D.; Moritz, M.A. Large wildfire trends in the western United States, 1984–2011. Geophys. Res. Lett. 2014, 41, 2928–2933. [Google Scholar] [CrossRef]
  5. Kloesel, K.; Bartush, B.; Banner, J.; Brown, D.; Lemery, J.; Lin, X.; Loeffler, C.; McManus, G.; Mullens, E.; Nielsen-Gammon, J.; et al. Chapter 23: Southern Great Plains. Impacts, Risks, and Adaptation in the United States: The Fourth National Climate Assessment, Volume II; U.S. Global Change Research Program: Washington, DC, USA, 2018; Volume II, pp. 987–1035. [CrossRef]
  6. Steiner, J.L.; Briske, D.D.; Brown, D.P.; Rottler, C.M. Vulnerability of Southern Plains agriculture to climate change. Clim. Chang. 2018, 146, 201–218. [Google Scholar] [CrossRef] [Green Version]
  7. Hoff, D.L.; Will, R.E.; Zou, C.B.; Lillie, N.D. Encroachment Dynamics of Juniperus virginiana L. and Mesic Hardwood Species into Cross Timbers Forests of North-Central Oklahoma, USA. Forests 2018, 9, 75. [Google Scholar] [CrossRef] [Green Version]
  8. Wang, J.; Xiao, X.; Qin, Y.; Doughty, R.B.; Dong, J.; Zou, Z. Characterizing the encroachment of juniper forests into sub-humid and semi-arid prairies from 1984 to 2010 using PALSAR and Landsat data. Remote. Sens. Environ. 2018, 205, 166–179. [Google Scholar] [CrossRef]
  9. Wang, J.; Xiao, X.; Qin, Y.; Dong, J.; Geissler, G.; Zhang, G.; Cejda, N.; Alikhani, B.; Doughty, R.B. Mapping the dynamics of eastern redcedar encroachment into grasslands during 1984–2010 through PALSAR and time series Landsat images. Remote. Sens. Environ. 2017, 190, 233–246. [Google Scholar] [CrossRef] [Green Version]
  10. Brunsell, N.A.; Van Vleck, E.S.; Nosshi, M.; Ratajczak, Z.; Nippert, J.B. Assessing the Roles of Fire Frequency and Precipitation in Determining Woody Plant Expansion in Central U.S. Grasslands. J. Geophys. Res. Biogeosci.s 2017, 122, 2683–2698. [Google Scholar] [CrossRef]
  11. Abrams, J.B.; Knapp, M.; Paveglio, T.B.; Ellison, A.; Moseley, C.; Nielsen-Pincus, M.; Carroll, M.S. Re-envisioning community-wildfire relations in the U.S. West as adaptive governance. Ecol. Soc. 2015, 20, 34. [Google Scholar] [CrossRef] [Green Version]
  12. Gorte, R. The rising cost of wildfire protection. Renew. Resourc. J. 2017, 31, 2–9. [Google Scholar]
  13. Johnstone, J.F.; Allen, C.D.; Franklin, J.F.; Frelich, L.E.; Harvey, B.J.; Higuera, P.E.; Mack, M.C.; Meentemeyer, R.K.; Metz, M.R.; Perry, G.L.; et al. Changing disturbance regimes, ecological memory, and forest resilience. Front. Ecol. Environ. 2016, 14, 369–378. [Google Scholar] [CrossRef]
  14. Marlon, J.R.; Bartlein, P.J.; Gavin, D.G.; Long, C.J.; Anderson, R.S.; Briles, C.E.; Brown, K.J.; Colombaroli, D.; Hallett, D.J.; Power, M.J.; et al. Long-term perspective on wildfires in the western USA. Proc. Natl. Acad. Sci. USA 2012, 109, E535–E543. [Google Scholar] [CrossRef] [PubMed] [Green Version]
  15. Schoennagel, T.; Balch, J.K.; Brenkert-Smith, H.; Dennison, P.E.; Harvey, B.J.; Krawchuk, M.A.; Mietkiewicz, N.; Morgan, P.; Moritz, M.A.; Rasker, R.; et al. Adapt to more wildfire in western North American forests as climate changes. Proc. Natl. Acad. Sci. USA 2017, 114, 4582–4590. [Google Scholar] [CrossRef] [PubMed] [Green Version]
  16. Seidl, R.; Spies, T.A.; Peterson, D.L.; Stephens, S.L.; Hicke, J.A. Searching for resilience: Addressing the impacts of changing disturbance regimes on forest ecosystem services. J. Appl. Ecol. 2016, 53, 120–129. [Google Scholar] [CrossRef] [PubMed] [Green Version]
  17. Syphard, A.D.; Bar Massada, A.; Butsic, V.; Keeley, J.E. Land Use Planning and Wildfire: Development Policies Influence Future Probability of Housing Loss. PLoS ONE 2013, 8, e71708. [Google Scholar] [CrossRef] [PubMed] [Green Version]
  18. Westerling, A.L. Increasing western US forest wildfire activity: Sensitivity to changes in the timing of spring. Philos. Trans. R. Soc. Lond. B Biol. Sci. 2016, 371, 20150178. [Google Scholar] [CrossRef]
  19. Shore, L. 2016–2018 Southern Plains Wildfire Assessment Report, 26pp. 2019. Available online: http://www.southernclimate.org/documents/Wildfire_Report.pdf. (accessed on 13 December 2019).
  20. Holden, Z.A.; Smith, A.M.S.; Morgan, P.; Rollins, M.G.; Gessler, P.E. Evaluation of novel thermally enhanced spectral indices for mapping fire perimeters and comparisons with fire atlas data. Int. J. Remote. Sens. 2005, 26, 4801–4808. [Google Scholar] [CrossRef]
  21. U.S. Geological Survey, National Land Cover Database (USGS NLCD). 2016. Available online: https://www.usgs.gov/centers/eros/science/national-land-cover-database?qt-science_center_objects=0#qt-science_center_objects. (accessed on 13 December 2019).
  22. Soil Survey Staff, Natural Resources Conservation Service, United States Department of Agriculture. Web Soil Survey. 2019. Available online: https://websoilsurvey.nrcs.usda.gov/ (accessed on 13 December 2019).
  23. Zhang, Y.; Xiao, X.; Wu, X.; Zhou, S.; Zhang, G.; Qin, Y.; Dong, J. A global moderate resolution dataset of gross primary production of vegetation for 2000–2016. Sci. Data 2017, 4, 170165. [Google Scholar] [CrossRef] [Green Version]
  24. Jin, C.; Xiao, X.; Merbold, L.; Arneth, A.; Veenendaal, E.; Kutsch, W.L. Phenology and gross primary production of two dominant savanna woodland ecosystems in Southern Africa. Remote. Sens. Environ. 2013, 135, 189–201. [Google Scholar] [CrossRef]
  25. John, R.; Chen, J.; Noormets, A.; Xiao, X.; Xu, J.; Lu, N.; Chen, S. Modelling gross primary production in semi-arid Inner Mongolia using MODIS imagery and eddy covariance data. Int. J. Remote. Sens. 2013, 34, 2829–2857. [Google Scholar] [CrossRef]
  26. Wagle, P.; Xiao, X.; Torn, M.S.; Cook, D.R.; Matamala, R.; Fischer, M.L.; Jin, C.; Dong, J.; Biradar, C. Sensitivity of vegetation indices and gross primary production of tallgrass prairie to severe drought. Remote. Sens. Environ. 2014, 152, 1–14. [Google Scholar] [CrossRef]
  27. Xin, F.; Xiao, X.; Zhao, B.; Miyata, A.; Baldocchi, D.; Knox, S.; Kang, M.; Shim, K.-M.; Min, S.; Chen, B.; et al. Modeling gross primary production of paddy rice cropland through analyses of data from CO2 eddy flux tower sites and MODIS images. Remote. Sens. Environ. 2017, 190, 42–55. [Google Scholar] [CrossRef] [Green Version]
  28. Doughty, R.; Xiao, X.; Wu, X.; Zhang, Y.; Bajgain, R.; Zhou, Y.; Qin, Y.; Zou, Z.; McCarthy, H.; Friedman, J.; et al. Responses of gross primary production of grasslands and croplands under drought, pluvial, and irrigation conditions during 2010–2016, Oklahoma, USA. Agric. Water Manag. 2018, 204, 47–59. [Google Scholar] [CrossRef]
  29. Li, M.; Guo, X. Evaluating Post-Fire Vegetation Recovery in North American Mixed Prairie Using Remote Sensing Approaches. Open J. Ecol. 2018, 8, 646–680. [Google Scholar] [CrossRef] [Green Version]
  30. Van Leeuwen, W.J.D.; Casady, G.M.; Neary, D.G.; Bautista, S.; Alloza, J.A.; Carmel, Y.; Wittenberg, L.; Malkinson, D.; Orr, B.J. Monitoring post-wildfire vegetation response with remotelysensed time-series data in Spain, USA, and Israel. Intern. J. Wildland Fire 2010, 19, 75–93. [Google Scholar] [CrossRef]
  31. Hulbert, L.C. Causes of Fire Effects in Tallgrass Prairie. Ecology 1988, 69, 46–58. [Google Scholar] [CrossRef]
  32. Glasgow, S.; Bidwell, T.G.; Weir, J.R.; Goodman, L.E. Management after wildfire. In NREM-2881; Oklahoma State University: Stillwater, OK, USA, 2016; Available online: http://www.okrangelandswest.okstate.edu/files/fire%20ecology%20pdfs/NREM-2881.pdf (accessed on 13 December 2019).
  33. Fick, W.H. Rangeland management following wildfire. In L514; Kansas State University: Manhattan, KS, USA, 2017; Available online: https://bookstore.ksre.ksu.edu/pubs/L514.pdf (accessed on 13 December 2019).
  34. Gates, E.A.; Vermeire, L.T.; Marlow, C.B.; Waterman, R.C. Fire and Season of Postfire Defoliation Effects on Biomass, Composition, and Cover in Mixed-Grass Prairie. Rangel. Ecol. Manag. 2017, 70, 430–436. [Google Scholar] [CrossRef]
  35. Gullap, M.K.; Erkovan, S.; Erkovan, H.I.; Koc, A. Effects of fire on litter, forage dry matter production, and forage quality in steppe vegetation of Eastern Anatolia, Turkey. J. Agric. Sci. Technol. 2018, 20, 61–70. [Google Scholar]
  36. Powell, J.; Martin, B.; Dreitz, V.J.; Allred, B.W. Grazing Preferences and Vegetation Feedbacks of the Fire-Grazing Interaction in the Northern Great Plains. Rangel. Ecol. Manag. 2018, 71, 45–52. [Google Scholar] [CrossRef]
  37. Fuhlendorf, S.D.; Engle, D.M.; Kerby, J.; Hamilton, R. Pyric herbifory: Rewilding landscapes through the recoupling of fire and grazing. Conserv. Biol. 2009, 23, 588–598. [Google Scholar] [CrossRef]
Figure 1. Delineated burned areas for Anderson Creek (2016), Starbuck (2017), and Perryton (2017) wildfires in western Kansas, Oklahoma, and Texas, USA.
Remotesensing 12 00619 g001
Figure 2. Three year average Normalized Difference Vegetative Index (NDVI) values for the unburned plots (blue shaded) and burned plots (red shaded) of the Anderson Creek (top), Starbuck (middle), and Perryton (bottom) wildfires. Purple shaded area is overlap of burned and unburned plots in this and subsequent figures. Fire year NDVI averages for the unburned (blue) and burned (red) plots are shown as solid lines with error bars of one standard deviation. Time of fire is marked by grey shaded columns.
Remotesensing 12 00619 g002
Figure 3. Three year average Enhanced Vegetation Index (EVI) values for the unburned plots (blue shaded) and burned plots (red shaded) of the Anderson Creek (top), Starbuck (middle), and Perryton (bottom) wildfires. Fire year EVI averages for the unburned (blue) and burned (red) plots are shown as solid lines with error bars of one standard deviation. Time of fire is marked by grey shaded columns.
Remotesensing 12 00619 g003
Figure 4. Three year average Land Surface Water Index (LSWI) values for the unburned plots (blue shaded) and burned plots (red shaded) of the Anderson Creek (top), Starbuck (middle), and Perryton (bottom) wildfires. Fire year LSWI averages for the unburned (blue) and burned (red) plots are shown as solid lines with error bars of one standard deviation. Time of fire is marked by grey shaded columns.
Remotesensing 12 00619 g004
Figure 5. Three year average Gross Primary Productivity (GPP) values as calculated following Zhang et al. (2017) for the unburned plots (blue shaded) and burned plots (red shaded) of the Anderson Creek (top), Starbuck (middle), and Perryton (bottom) wildfires. Fire-year GPP averages for the unburned (blue) and burned (red) plots are shown as solid lines with error bars of one standard deviation. Time of fire is marked by grey shaded columns.
Remotesensing 12 00619 g005

