The experiment contains the usage of two benchmark datasets, Middlebury and ETH3D, which supply a certain number of stereo pairs with ground truth disparity maps available. We rigidly split the provided datasets into non-overlapping training and validation sets (as shown below), in order to train our proposed algorithm and test the performance according to the validation accuracy. From the manually split training set, 500K pixels are randomly selected for training the random forest, while all the pixels are used to train MC-CNN-acrt. As for the Middlebury benchmark, the training set is acquired from 2005 and 2006 scenes, while 2014 scenes provide the validation set, as shown in
Table 2. Each dataset from Middlebury 2005 and 2006 consists of 7 views under 3 illumination and 3 exposure conditions (63 images in total). Ground truth disparity maps are provided for view-2 and view-6. We regard the former as the master epipolar frame, and randomly select illumination and exposure condition for two images to construct stereo pairs for further processing.
ETH3D stereo benchmark contains various indoor and outdoor views with ground truth extracted using a high-precision laser scanner. The images are acquired using a Digital Single-Lens Reflex (DSLR) camera synchronized with a multi-camera rig capturing varying field-of-views. The benchmark provides high-resolution multi-view stereo imagery, low-resolution many-view stereo on video data, and low-resolution two-view stereo images that are used in this paper. There are 27 frames with ground truth for training and 20 for test. We exploit the former for train/validation splits, as shown in
Table 3. For some scenes, the data include two different sizes. Both focus on the same target, however, with one contained in the field of view from the other (e.g., delivery_area_1s and delivery_area_1l). Therefore, we manually divide the datasets for training and validation, in order to avoid images taken for the same scene appearing in both splits.
4.1.1. Accuracy Evaluation
We evaluate the validation accuracy of SGM, SGM-ForestS, and our SGM-ForestM by comparing the generated disparity map with ground truth. Only the non-occluded pixels observed by both scenes are considered. The percentage of pixels with an estimation error less than 0.5, 1, 2, and 4 pixels, respectively, are calculated as indicated by
Table 4 and
Table 5. It should be noticed that, in
Table 4, a suffix of ‘-5dirs’ or ‘-8dirs’ is appended at the end of each algorithm to differentiate SGM, SGM-ForestS, and SGM-ForestM implemented using 5 or 8 scanlines, respectively. For the follow-up in this paper, unless mentioned explicitly, all the SGM related terms without a suffix represent the implementation based on 8 scanlines.
As for 8 scanlines implementation, it is found that the two SGM-Forest implementations perform steadily better than the standard SGM, in both benchmarks considering different estimation errors as the upper limit. With MC-CNN-acrt as matching cost, the results on Middlebury datasets report slightly worse performance of SGM-ForestM (about 0.1% difference) than SGM-ForestS. However, a stable improvement is achieved by SGM-ForestM in all the other cases (the results on Middlebury and ETH3D using Census as matching cost, on ETH3D using MC-CNN-acrt as matching cost), which indicates the significance of applying the multi-label classification strategy to train the random forest.
For 5 scanlines version, the performance of all the algorithms decreases as expected due to the information loss from fewer scanlines. Nevertheless, SGM-ForestM is still better than SGM-ForestS, and both of them are superior to the standard SGM. It is worth to mention that, SGM-ForestS-5dirs and SGM-ForestM-5dirs achieve even better results than SGM-8dirs on ETH3D datasets, which indicates the potential to embed SGM-Forest into efficient stereo systems. On Middlebury datasets, SGM-ForestS-5dirs is not able to keep its superiority to SGM-8dirs. However, it is good to find that SGM-ForestM-5dirs remains to be better than the standard SGM using 8 scanlines (except for 0.5 pixel error) and proves its robustness.
MC-CNN is a “data-hungry” method, which requires a large amount of training data to achieve high performance [
21]. The training of the random forest in SGM-Forest, nevertheless, relies on much less data (500K pixels used in this paper and in Reference [
10]). With Census as matching cost, SGM-ForestM consistently outperforms SGM and SGM-ForestS in all settings, which further indicates the potential of the algorithm, especially when the amount of data is too limited for training a well-performing MC-CNN.
In order to apply an unbiased demonstration for our multi-label classification strategy, below in
Table 6, we exhibit the official results of the ETH3D benchmark by evaluating our SGM-ForestM on the test datasets. As the proposed method focuses on the refinement of SGM itself, we simply use Census for a quick test. The random forest is also trained on 500K pixels, with 8 scanlines for disparity proposals.
The accuracy for ‘non-occluded pixels’ is consistent with the numbers obtained in
Table 4 (SGM-ForestM-8dirs), however, compared with other algorithms, our result is not competitive. The reason includes that, we execute no post-processing, for example, left-right consistency check, interpolation, and so forth, and Census is used for calculating matching cost instead of a well-trained MC-CNN. It should be noted that the main goal of this paper is to improve SGM and SGM-ForestS further, therefore, the whole processing pipeline is not fully considered.
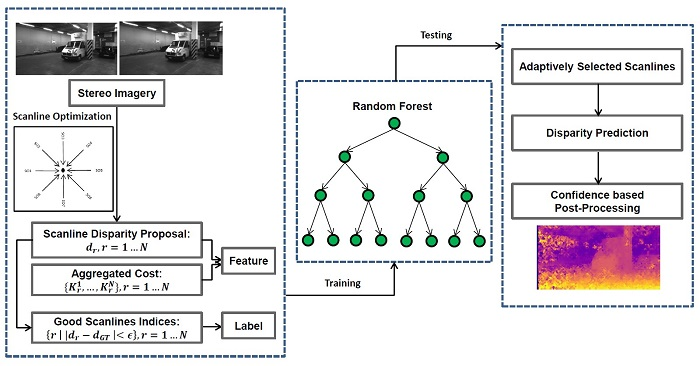
4.1.2. Random Forest Prediction
In addition, we analyze the quality of
(see
Section 3), which is the direct prediction of the random forest and the reference for further confidence based processing. Adaptive scanline selection based on a classification strategy is the core concept of SGM-Forest that is superior to the scanline average of the standard SGM. Hence,
and the corresponding
are necessary for further comparison between SGM-ForestS and SGM-ForestM.
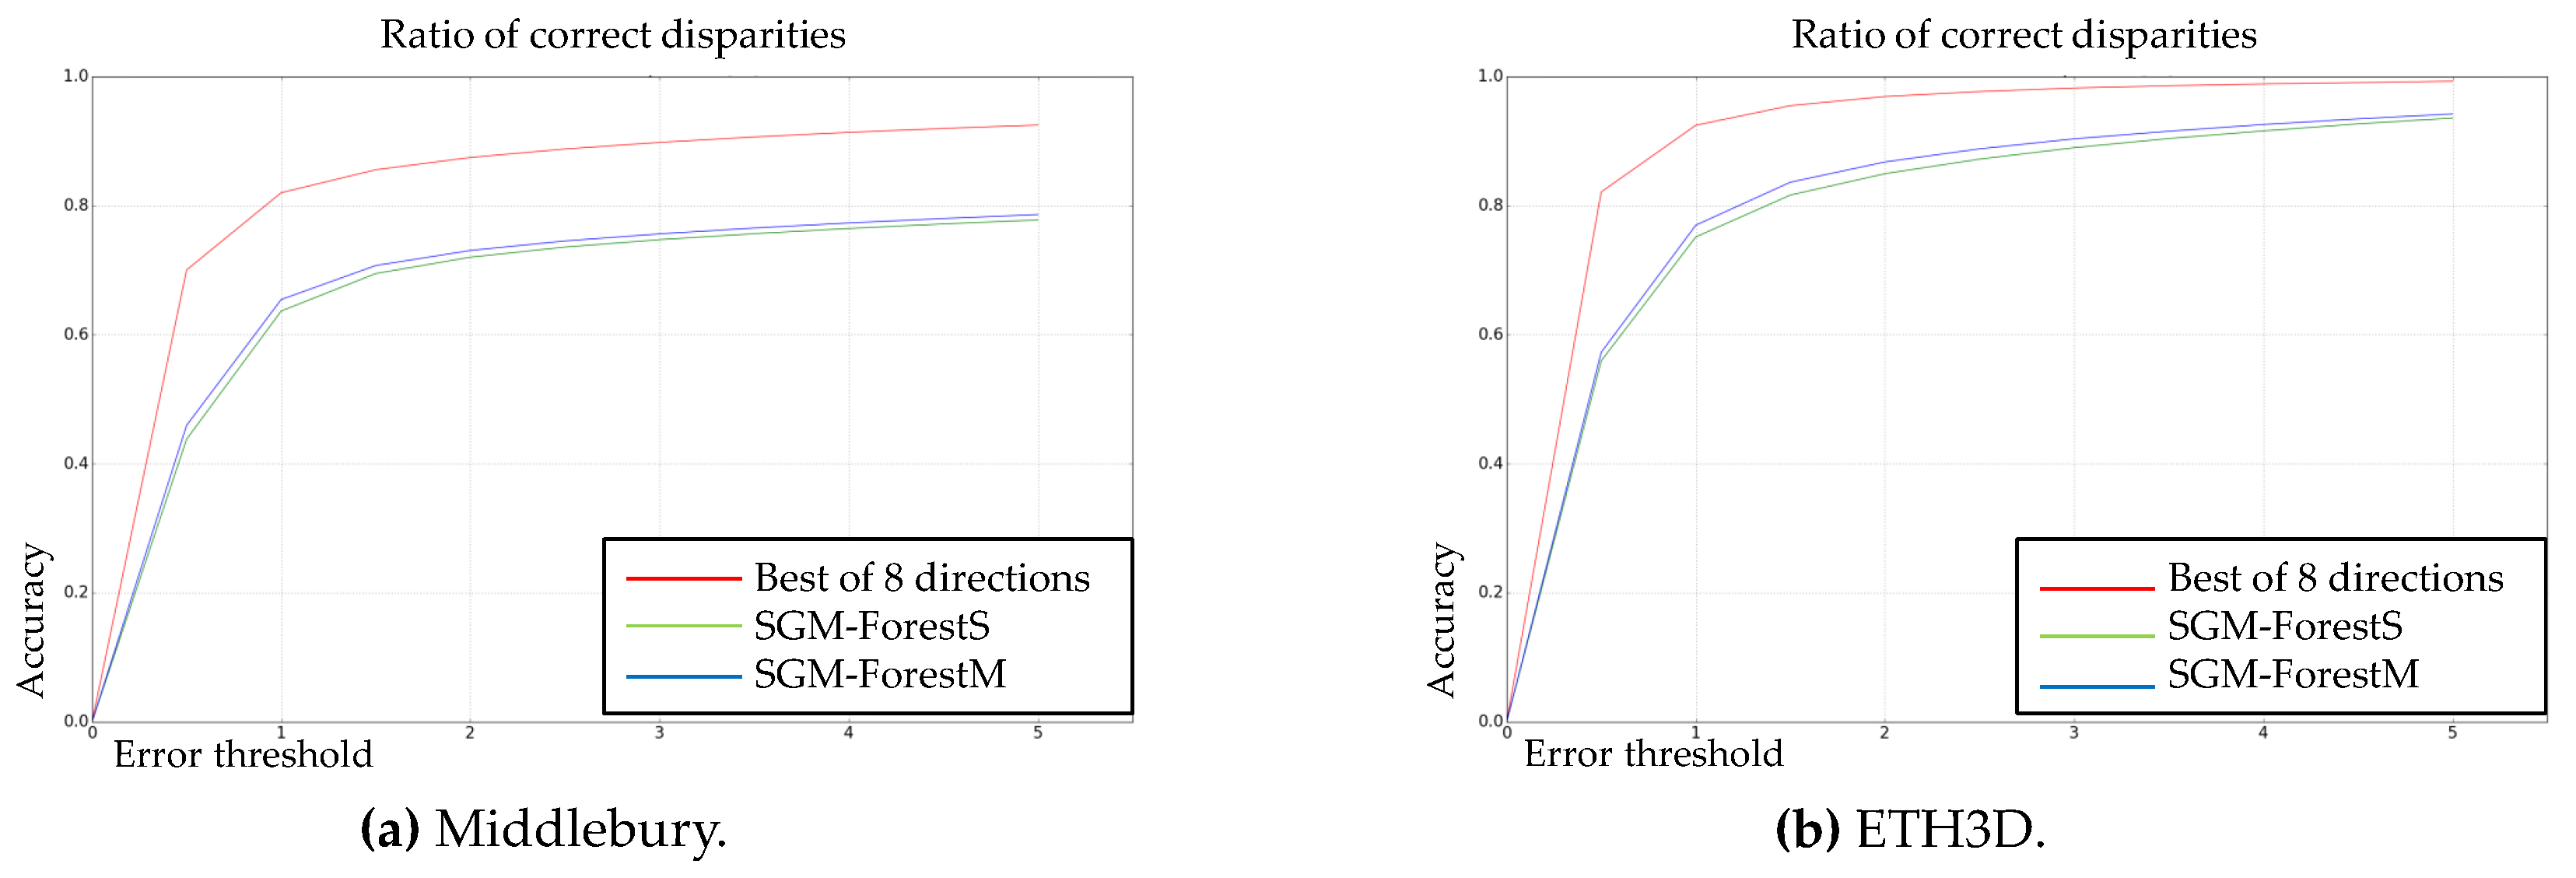
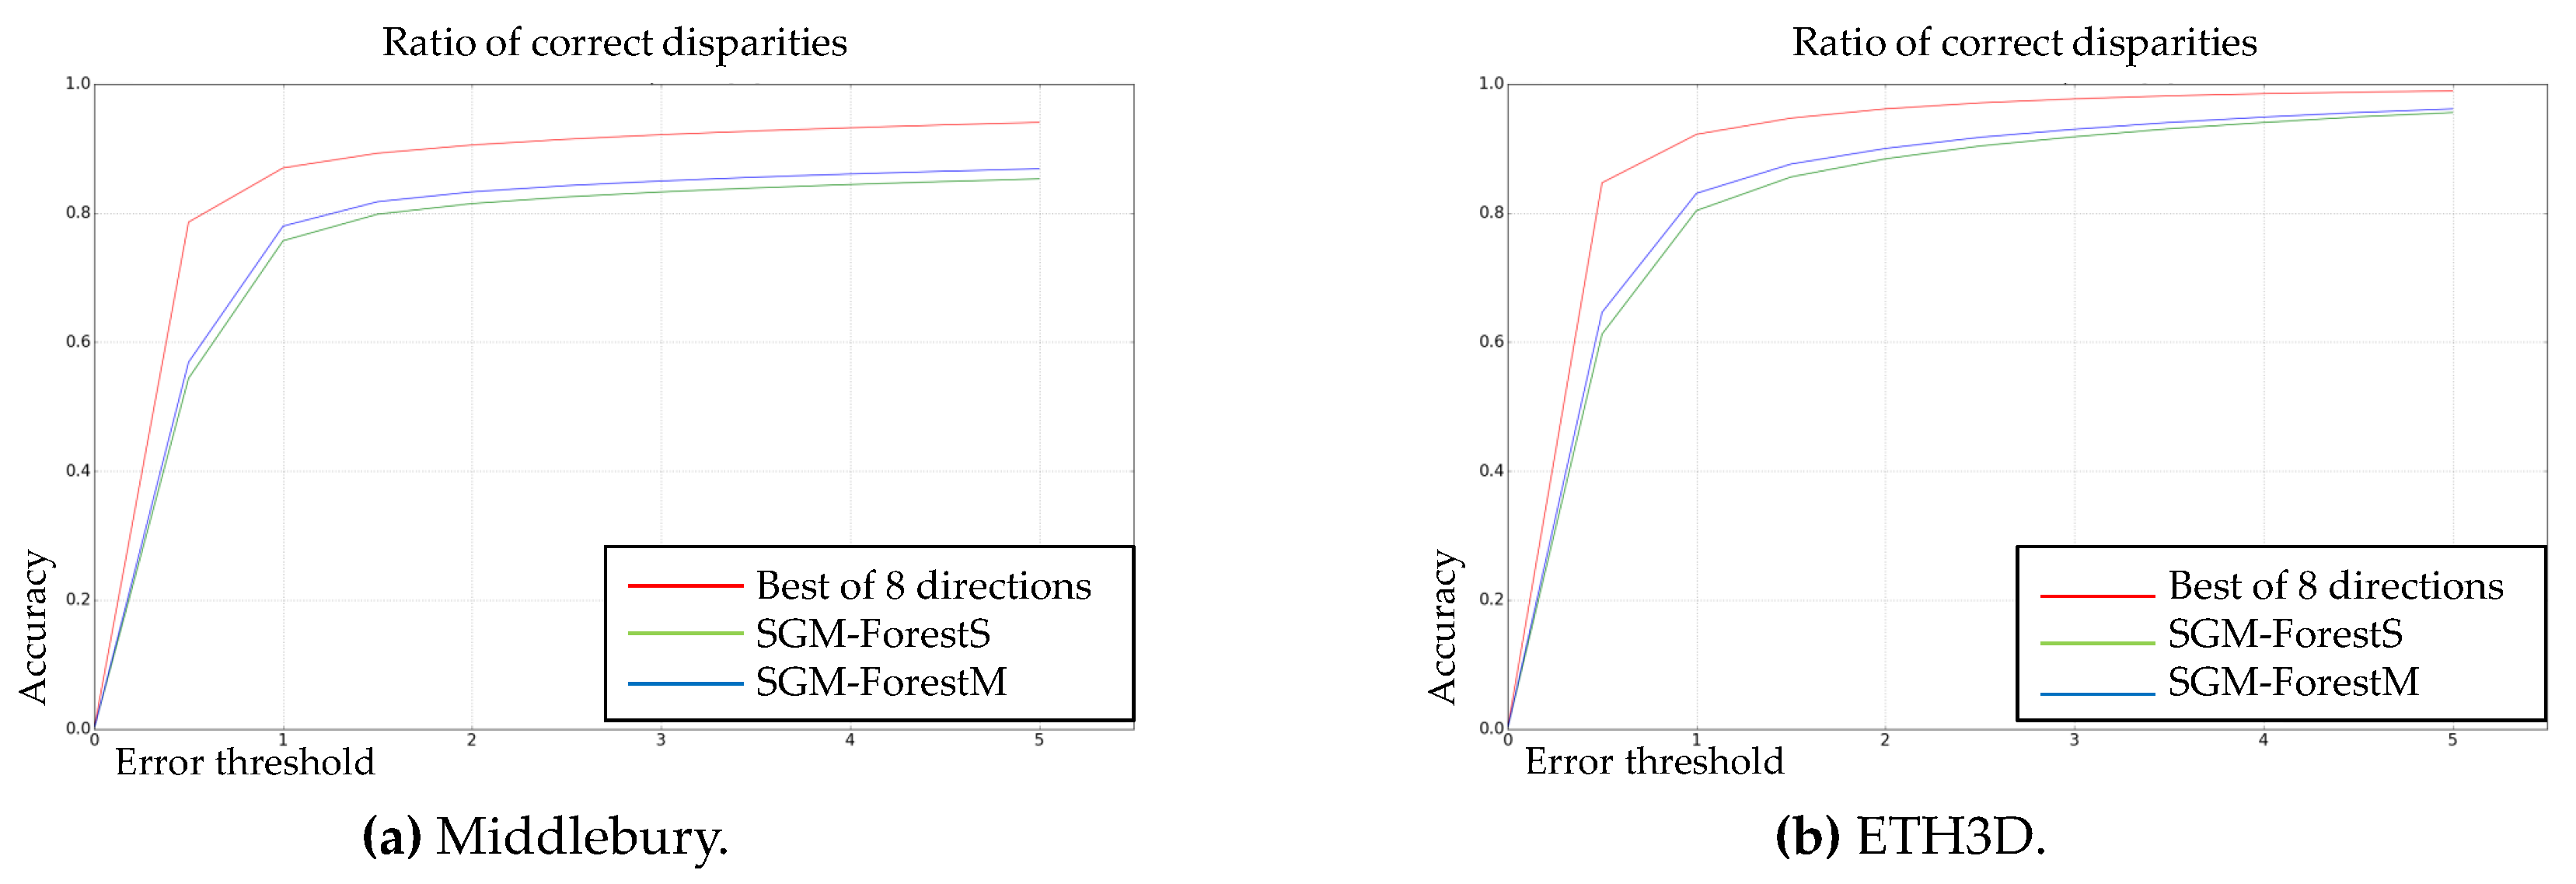
In
Figure 3 and
Figure 4, the error plots are displayed for SGM-ForestS, SGM-ForestM, and the upper bound of SO if the best scanline can always be selected from 8 alternatives. At here, it should be noted that the disparity prediction of the random forest (
) is directly compared to the ground truth for calculating the ratio of correct disparity estimation (y-axis), considering different estimation errors allowed (x-axis). We still test two matching cost algorithms (Census and MC-CNN-acrt) on two benchmark datasets (Middlebury and ETH3D).
The figures above show that both SGM-Forest implementations achieve good performance to approach the best SO, which demonstrates the feasibility of scanline selection based on a classification framework. In addition, SGM-ForestM is superior to SGM-ForestS in all cases. The results indicate that SGM-ForestM is essentially better at scanline prediction and capable of deriving preferable initial disparity values for further processing.
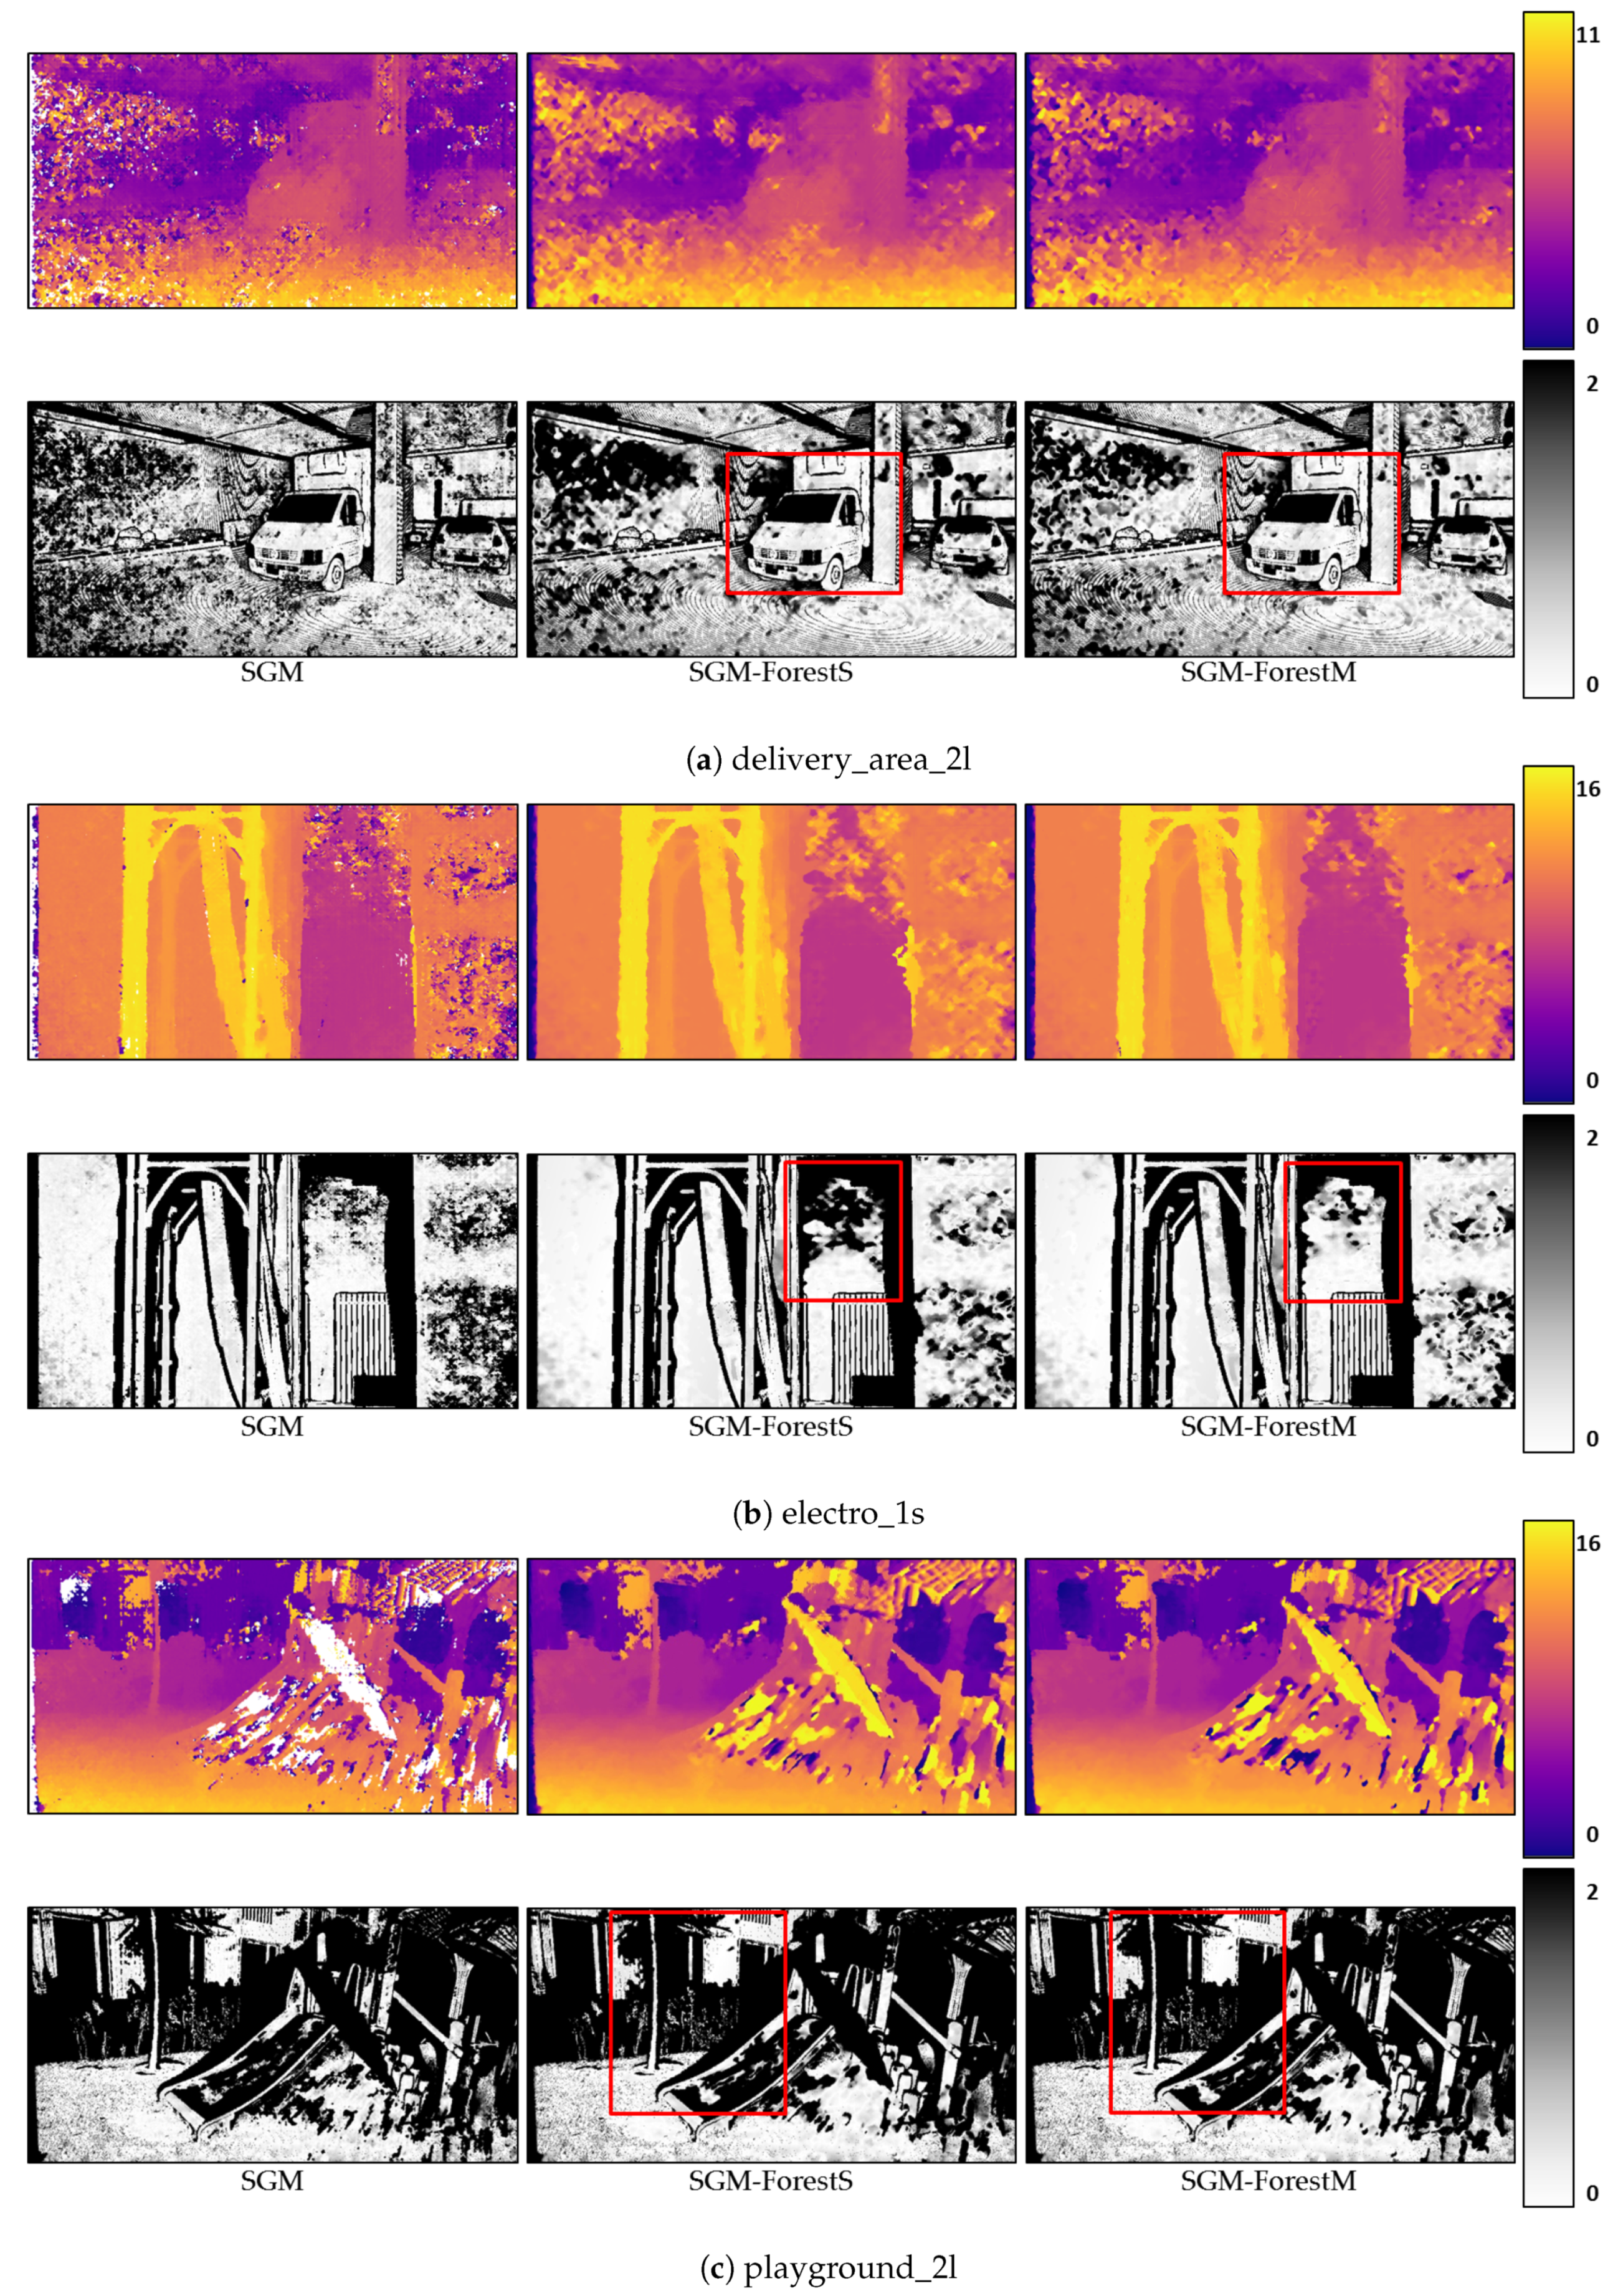
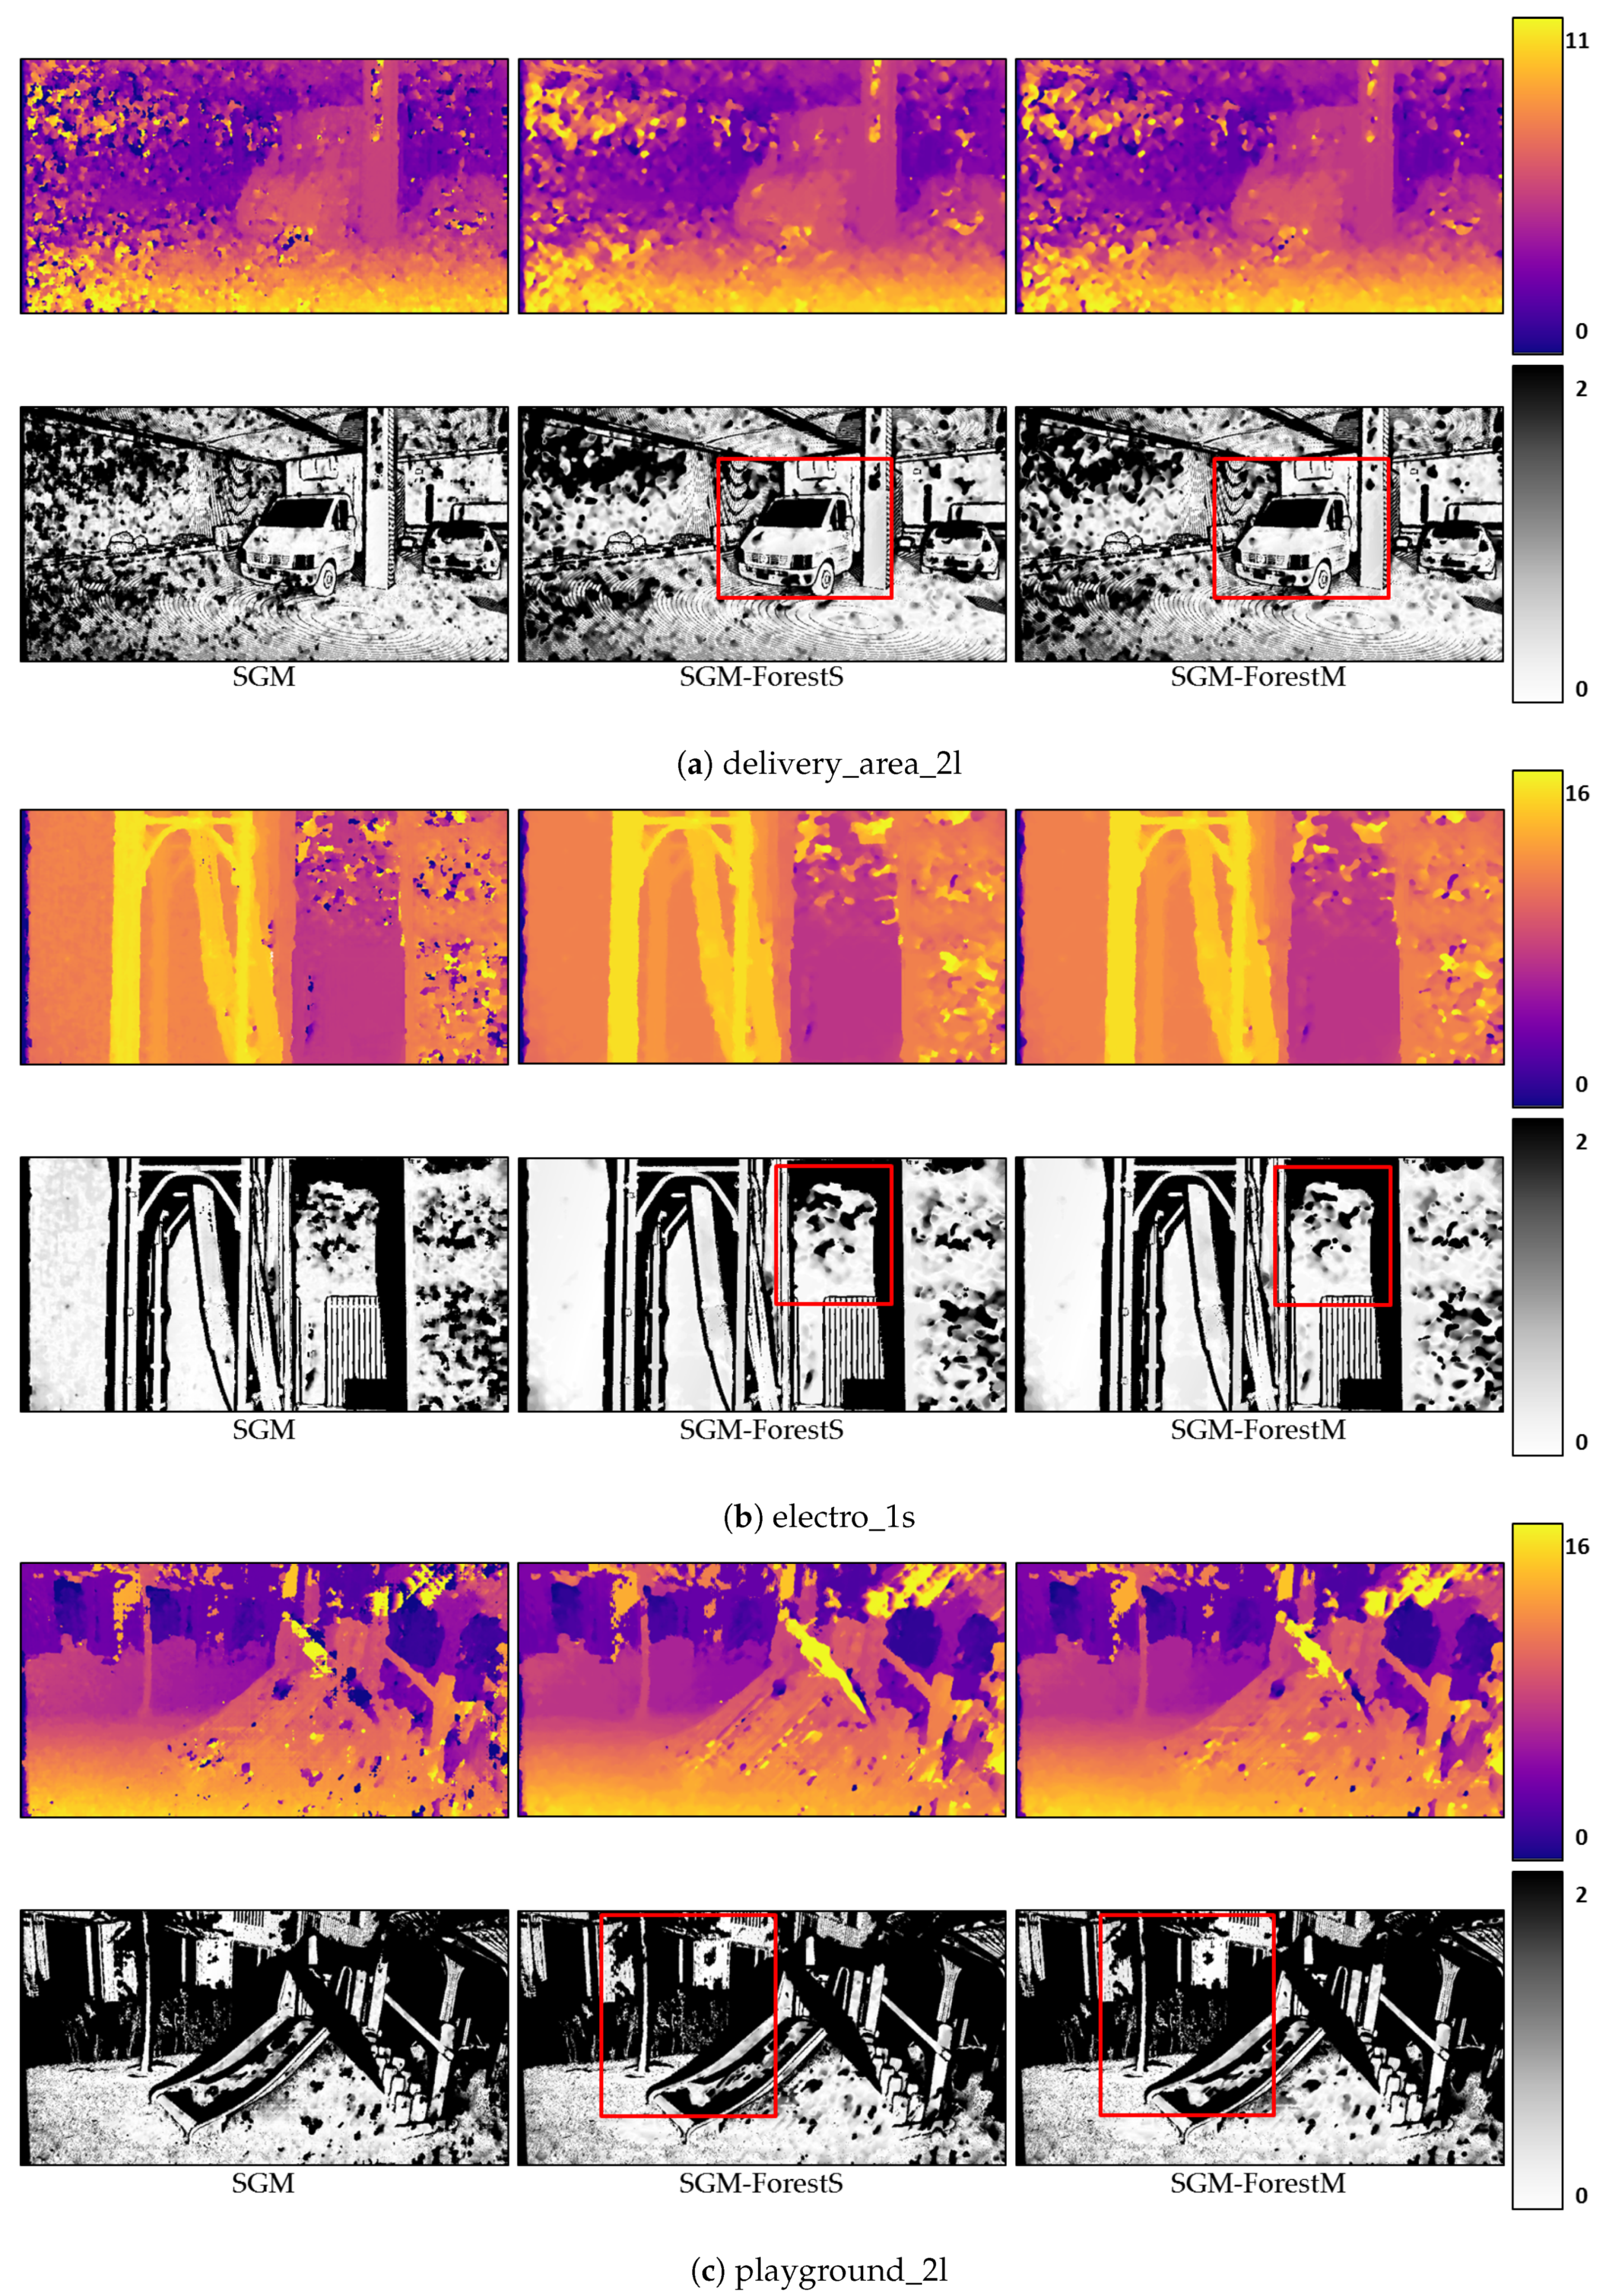
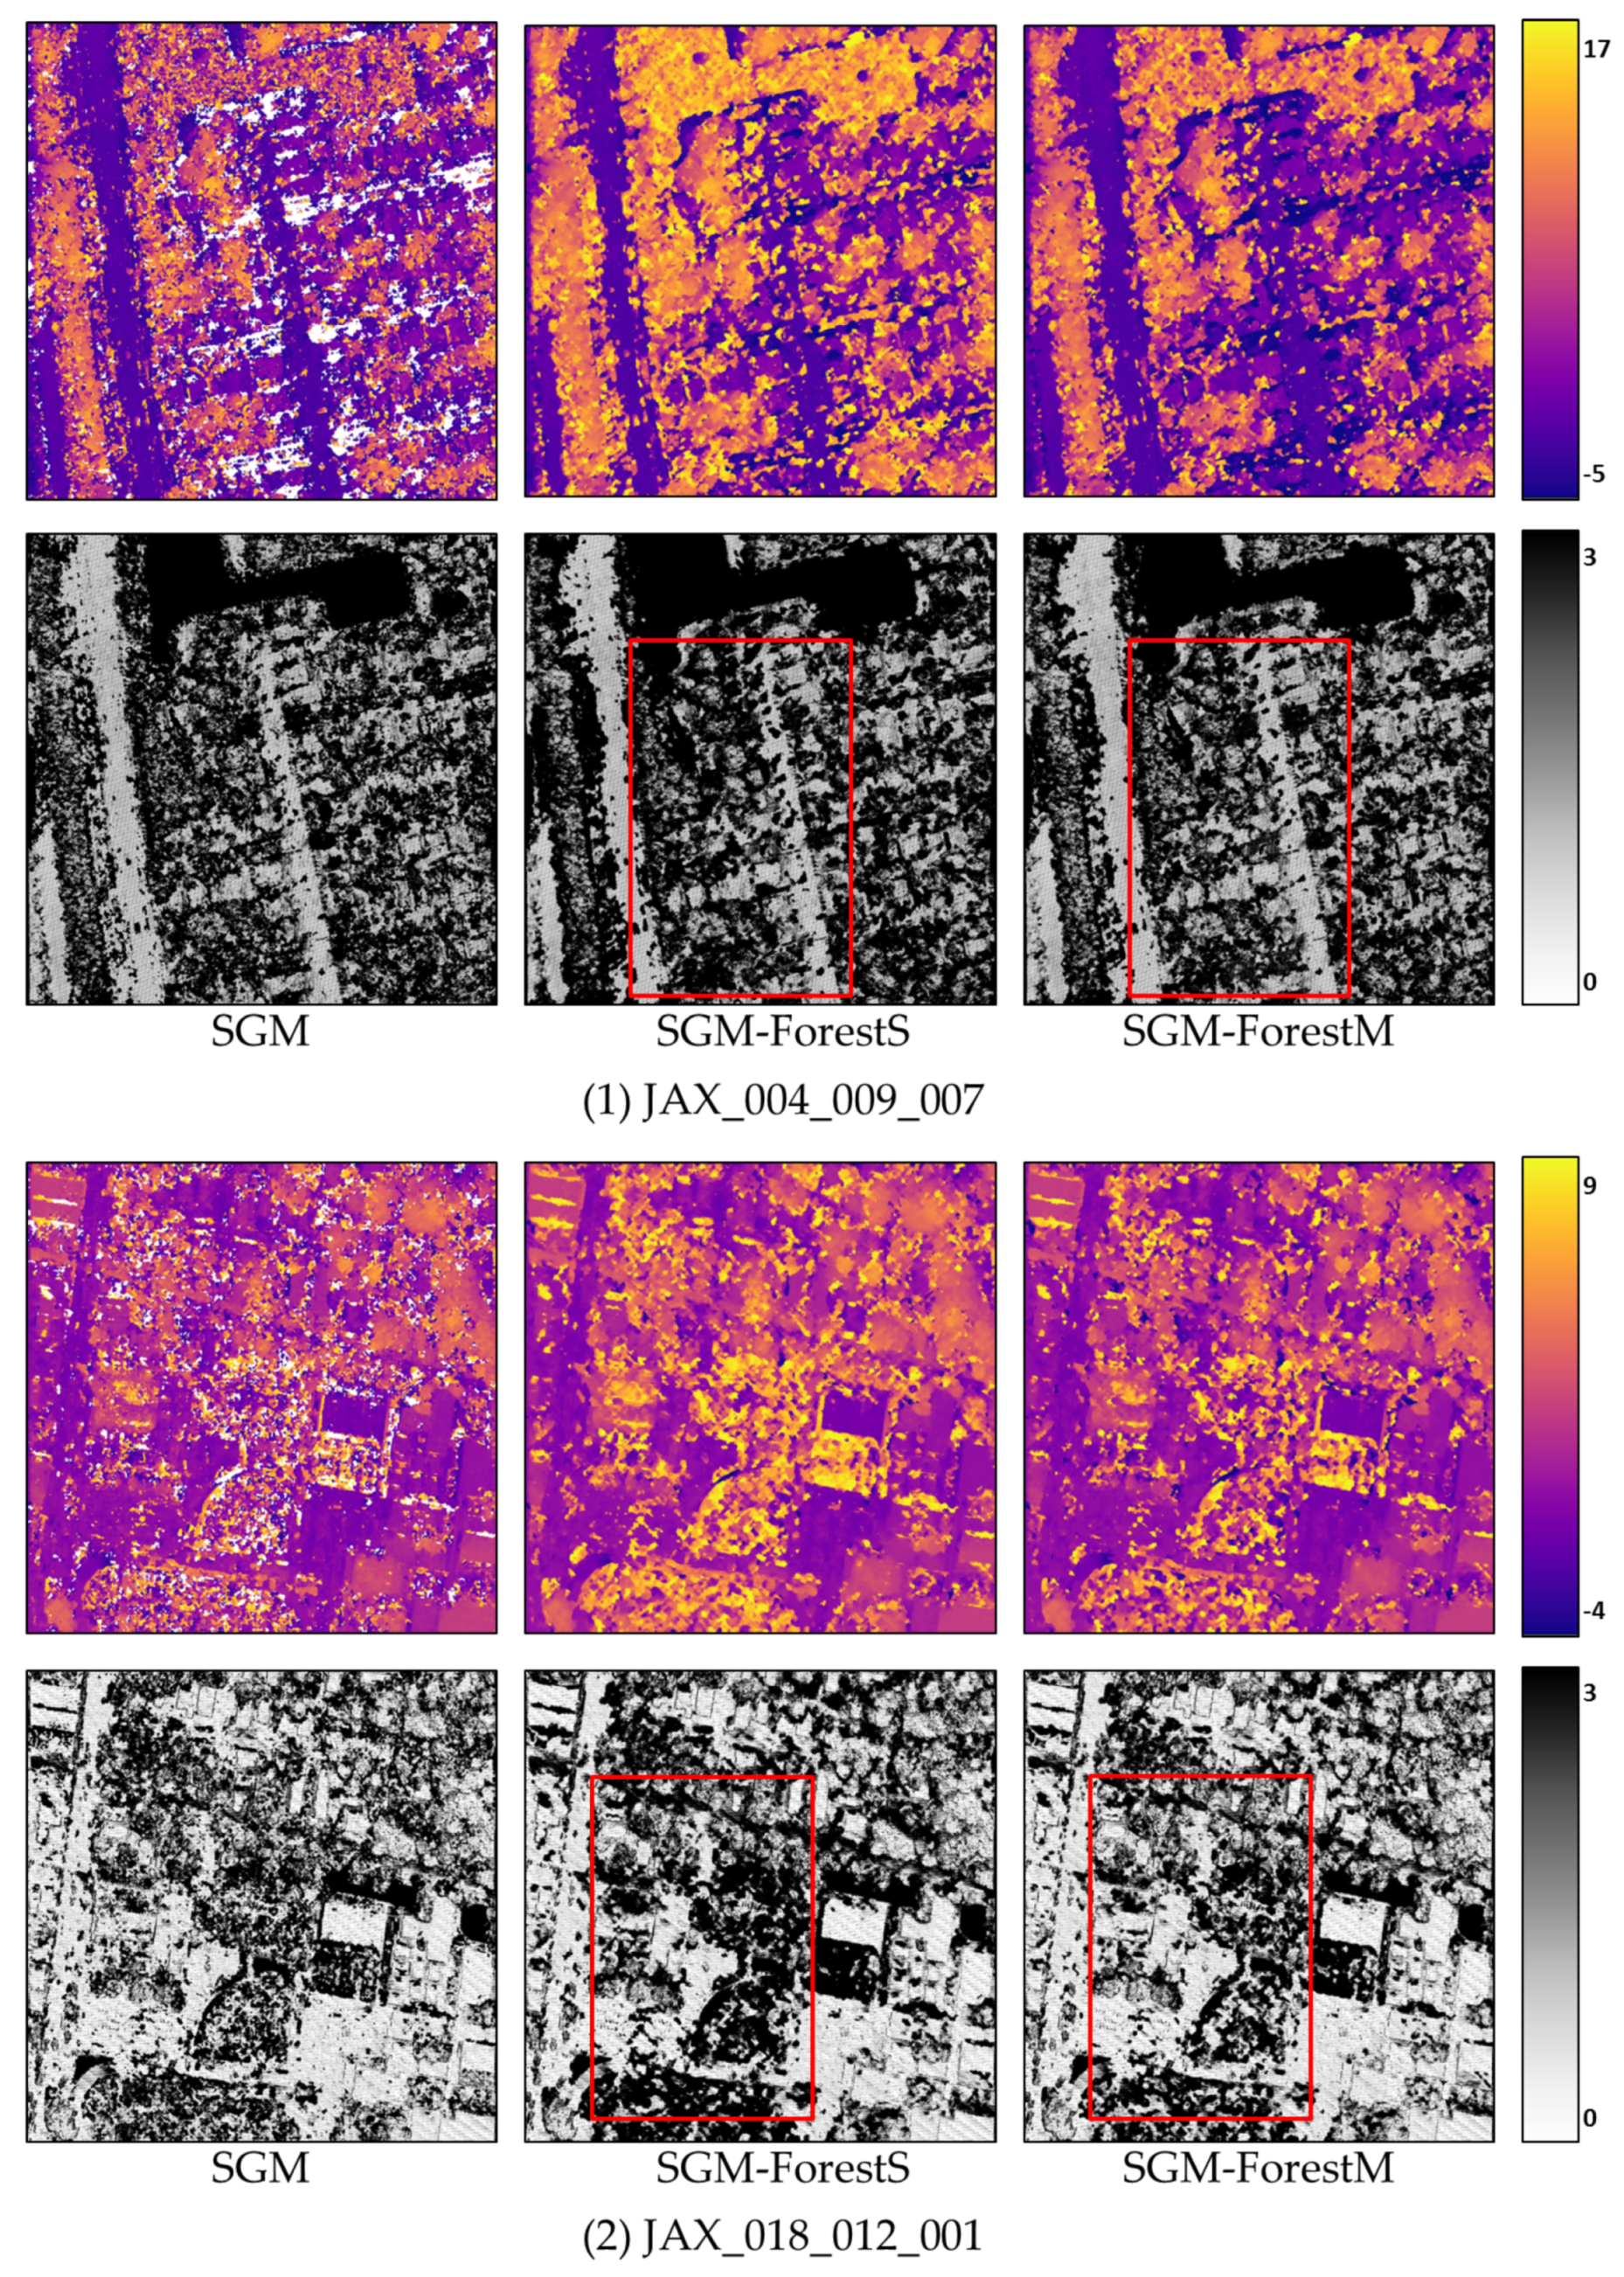
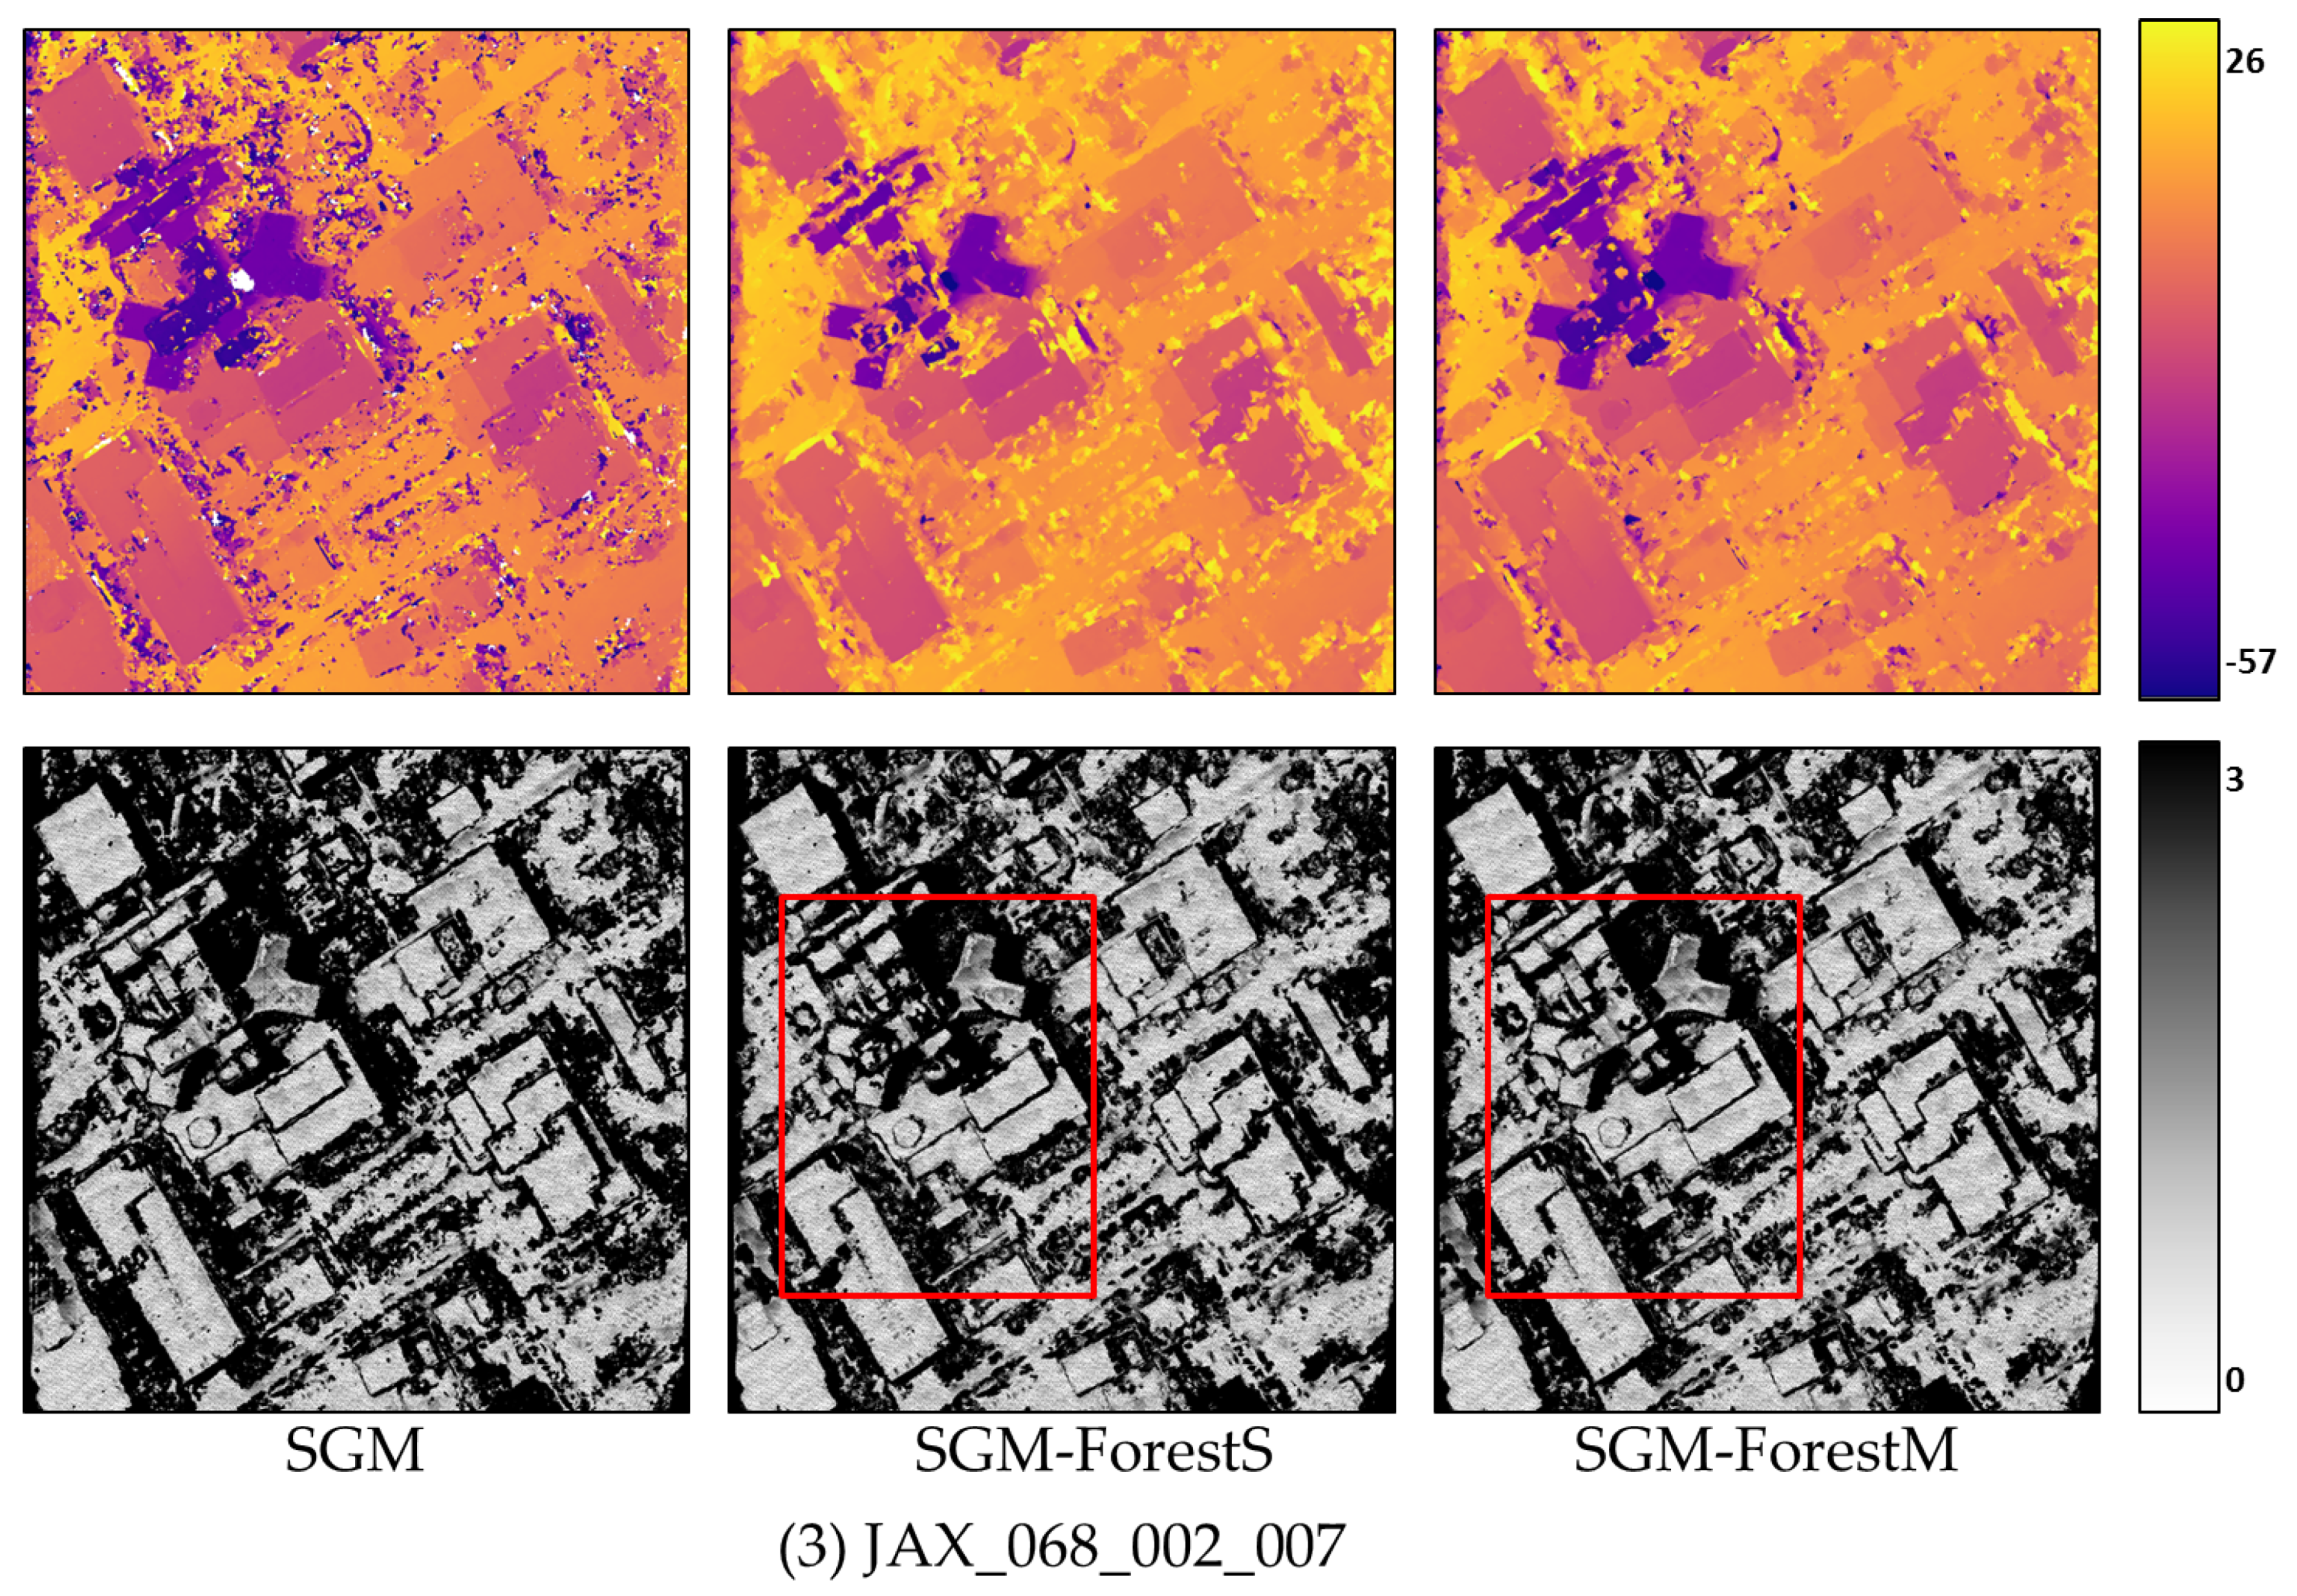
4.1.3. Qualitative Results
In this section, we select several stereo pairs from ETH3D to show the disparity maps generated based on SGM, SGM-ForestS, and SGM-ForestM, respectively. The corresponding error maps are displayed below. Regarding ‘2 pixel’ as the upper bound, all the pixels with an error above the bound are colored black, while the rest are colored uniformly according to the error as indicated by the color bar. We apply Census and MC-CNN-acrt to calculate the matching cost, respectively, and the results are displayed in
Figure 5 and
Figure 6.
In each subfigure, the disparity map and the error map for SGM, SGM-ForestS, and SGM-ForestM, respectively, are displayed from left to right, with a color bar at the end. The red rectangles marked in the error maps represent the main difference of the result between SGM-ForestS and SGM-ForestM. It is found that the disparity maps generated by the two SGM-Forest implementations are smoother than SGM. Moreover, according to the error map, SGM-ForestM suffers fewer errors compared with SGM-ForestS. Especially for the ill-posed regions (e.g., textureless areas, reflective surfaces, etc.), SGM-ForestM performs better as highlighted by the red rectangles.

 ,
, 


