Letter

Remote Detection of Uranium Using Self-Focusing Intense Femtosecond Laser Pulses

1
Department of Nuclear Engineering and Radiological Sciences, University of Michigan, Ann Arbor, MI 48109, USA
2
Gérard Mourou Center for Ultrafast Optical Science, University of Michigan, Ann Arbor, MI 48109, USA
*
Author to whom correspondence should be addressed.
Remote Sens. 2020, 12(8), 1281; https://doi.org/10.3390/rs12081281
Submission received: 14 March 2020 / Revised: 6 April 2020 / Accepted: 17 April 2020 / Published: 18 April 2020
(This article belongs to the Section Remote Sensing Communications)

Abstract

:
Optical measurement techniques can address certain important challenges associated with nuclear safety and security. Detection of uranium over long distances presents one such challenge that is difficult to realize with traditional ionizing radiation detection, but may benefit from the use of techniques based on intense femtosecond laser pulses. When a high-power laser pulse propagates in air, it experiences collapse and confinement into filaments over an extended distance even without external focusing. In our experiments, we varied the initial pulse chirp to optimize the emission signal from the laser-produced uranium plasma at an extended distance. While the ablation efficiency of filaments formed by self-focusing is known to be significantly lower when compared to filaments produced by external focusing, we show that filaments formed by self-focusing can still generate luminous spectroscopic signatures of uranium detectable within seconds over a 10-m range. The intensity of uranium emission varies periodically with laser chirp, which is attributed to the interplay among self-focusing, defocusing, and multi-filament fragmentation along the beam propagation axis. Grouping of multi-filaments incident on target is found to be correlated with the uranium emission intensity. The results show promise towards long-range detection, advancing the diagnostics and analytical capabilities in ultrafast laser-based spectroscopy of high-Z elements.

Graphical Abstract

1. Introduction

Mitigation of effects resulting from radioactive releases in nuclear systems such as nuclear power plants [1], enrichment, and reprocessing facilities would benefit from sophisticated methods for sensitive detection of actinides and rapid measurement of their spatial distribution. Remote detection of radioactive materials can be challenging due to the often low rates of emission and the limited range of characteristic ionizing radiation. For example, uranium is a relatively weak source of ionizing radiation, with minimal neutron emission from spontaneous fission and the relatively low-energy gamma emission that accompanies the much more frequent alpha-decay. Uranium is of pivotal importance for nuclear security because its fissile isotope 235U can be used for the construction of nuclear weapons. Although uranium does not present a significant radiological threat, it can be toxic when inhaled or digested [2]. Certain compounds of uranium (uranyl fluoride UO2F2 and uranium hexafluoride UF6) may be traced in the vicinity of uranium enrichment and UF6 storage facilities. Fast and accurate environmental surveillance performed in-situ and from a safe operating distance is desirable to detect and map the distribution of uranium and uranium-containing compounds. Conventional ionizing radiation detection techniques are highly sensitive, but are limited to shorter distances. As an alternative, optical methods to detect radioactive material have been demonstrated [3,4], but have not yet been scaled to longer distances.
Laser-induced breakdown spectroscopy (LIBS) represents a robust method for in-situ, remote, and real-time analytical measurements of material composition [5,6,7]. This method has demonstrated its high versatility in extraterrestrial [8] and deep-sea exploration [9], detection and classification of explosives [10,11], analysis of soil contaminants [12], use in nuclear power plants and dry cask storage systems [13,14,15], and detection of nuclear materials in general [16,17,18]. LIBS relies on focusing a high-power laser pulse onto the surface of a sample to produce ablation and, subsequently, a plasma. The sample composition information is obtained from the spectrally-resolved plasma radiation which may consist of continuous, ionic, atomic, and molecular emission. The transient character of a particular emission type strongly depends on laser-sample coupling and thermodynamic parameters of the plasma.

2. Libs Using Ultrashort Laser Pulses

Nowadays, the majority of LIBS measurements are performed with nanosecond Nd:YAG Q-switched lasers, but there is a notable trend to employ femtosecond Ti:sapphire and fiber lasers instead, as they are becoming more compact, reliable, and less expensive. The choice of laser is driven by a specific application, having in mind that the processes underlying femtosecond LIBS are intrinsically different from the nanosecond LIBS [19,20]. For instance, remote sensing applications demand strong laser–solid coupling and high detection sensitivity over an extended range. The ability to perform LIBS at a standoff critically depends on the ability to produce a relatively small laser spot on the surface of the interrogated material, such that the beam intensity exceeds the material breakdown threshold. In the linear optical propagation regime, diffraction and air turbulence [21] prevent the delivery of laser energy to a small spot over a large distance. In contrast, in LIBS based on a high-peak-power pulse that accompanies its ultrafast pulse duration one can take advantage of nonlinear beam propagation in the air to realize favorable beam propagation characteristics. The refractive index of a medium ( n 2 ) becomes nonlinear at high laser intensities: n = n 0 + n 2 I , where I is the laser intensity and n 0 is the linear refractive index. The onset of self-focusing occurs when the critical power ( P c r ) is exceeded: P c r ≈ 3.72 λ 2 /(8 π n 0 n 2 ), where λ is the laser wavelength. This regime of propagation leads to the effect to referred to as filamentation [22], and can be understood as a subtle balance between nonlinear self-focusing on one hand, and plasma defocusing and diffraction on the other. As a result, optical filaments are able to overcome the traditional diffraction limit that applies to longer (lower peak power) pulses. The effect of intensity clamping in laser filaments results in their typical intensity on the order of 10 13 Wcm−2 [23,24]. To the best of our knowledge, the maximum distance reported in a remote nanosecond LIBS experiment is 95 m [25], whereas filament-induced breakdown spectroscopy (FIBS) has achieved approximately double that distance to date [24] and has shown a clear potential to exceed it by an order of magnitude [26,27].
The characteristics of solid-target FIBS depend critically on the laser intensity. Even though the laser intensity can be increased locally via tight focusing [28], the focused filament structure cannot be sustained at long-distance since an increased ionization of air molecules rapidly depletes the beam energy. The work done on FIBS in the past mostly involved assisted self-focusing either through a single lens [29,30,31,32] or a telescope system combined with the change in compressor grating separation [33]. Comparative studies between induced and free-propagating filamentation indicate less target material removal [34] and lower thermodynamic parameters of produced plasma [35], leading to a weaker emission signal in the absence of external focusing. Nevertheless, the pioneering studies demonstrating signal detection at distances up to 180 m [24,36] have established free-propagating femtosecond filamentation as a promising method for practical realization of long-range FIBS. In this approach, the second-order dispersion (chirp) of the ultrashort laser pulse is adjusted to precompensate for air dispersion, which can lead to formation of the filament at a desired distance, up to tens of kilometers [26].
In this work, we show that the chirp optimization of filaments generated by free-propagating high-power, ultrashort laser pulses in the air can help to produce a luminous plasma from a uranium solid target at a laboratory-scale standoff of 10 m. We optimize the laser-produced plasma (LPP) emission signal to determine the optimal chirp that maximizes the characteristic atomic and molecular emission. Finally, we statistically analyzed the uranium detection efficiency based on several characteristic features in the plasma emission spectrum. The results confirm the viability of FIBS to detect uranium, which offers a promising path to remote measurements of uranium contamination.

3. Nonlinear Effects in Free Beam Propagation

The characteristics and propagation of an intense laser pulse are affected by the nonlinearity of the medium through the process referred to as self-phase modulation in the time (frequency) domain and self-focusing in the spatial domain. Briefly, in the time domain, the nonuniform pulse envelope results in a nonlinear phase that is reflected in the broadening of the pulse spectrum. In the spatial domain, the nonuniform pulse envelope induces a lens-like effect that modifies the beam profile.
A commonly used B-integral parameter [37] is defined as the measure of cumulative nonlinear phase acquired by the optical pulse along the medium of length L:
B = 2 π λ 0 L n 2 I ( z ) d z .
The nonlinear effects become significant as the B-integral approaches unity. An illustration of the degree of nonlinearity acquired by the pulse similar to our actual experimental conditions is provided in Figure 1, where a 12-mJ, 1-cm Gaussian diameter beam propagates freely in air over a distance of up to 10 m. In these conditions, appreciable nonlinear effects occur after several meters of propagation.

4. Experiment

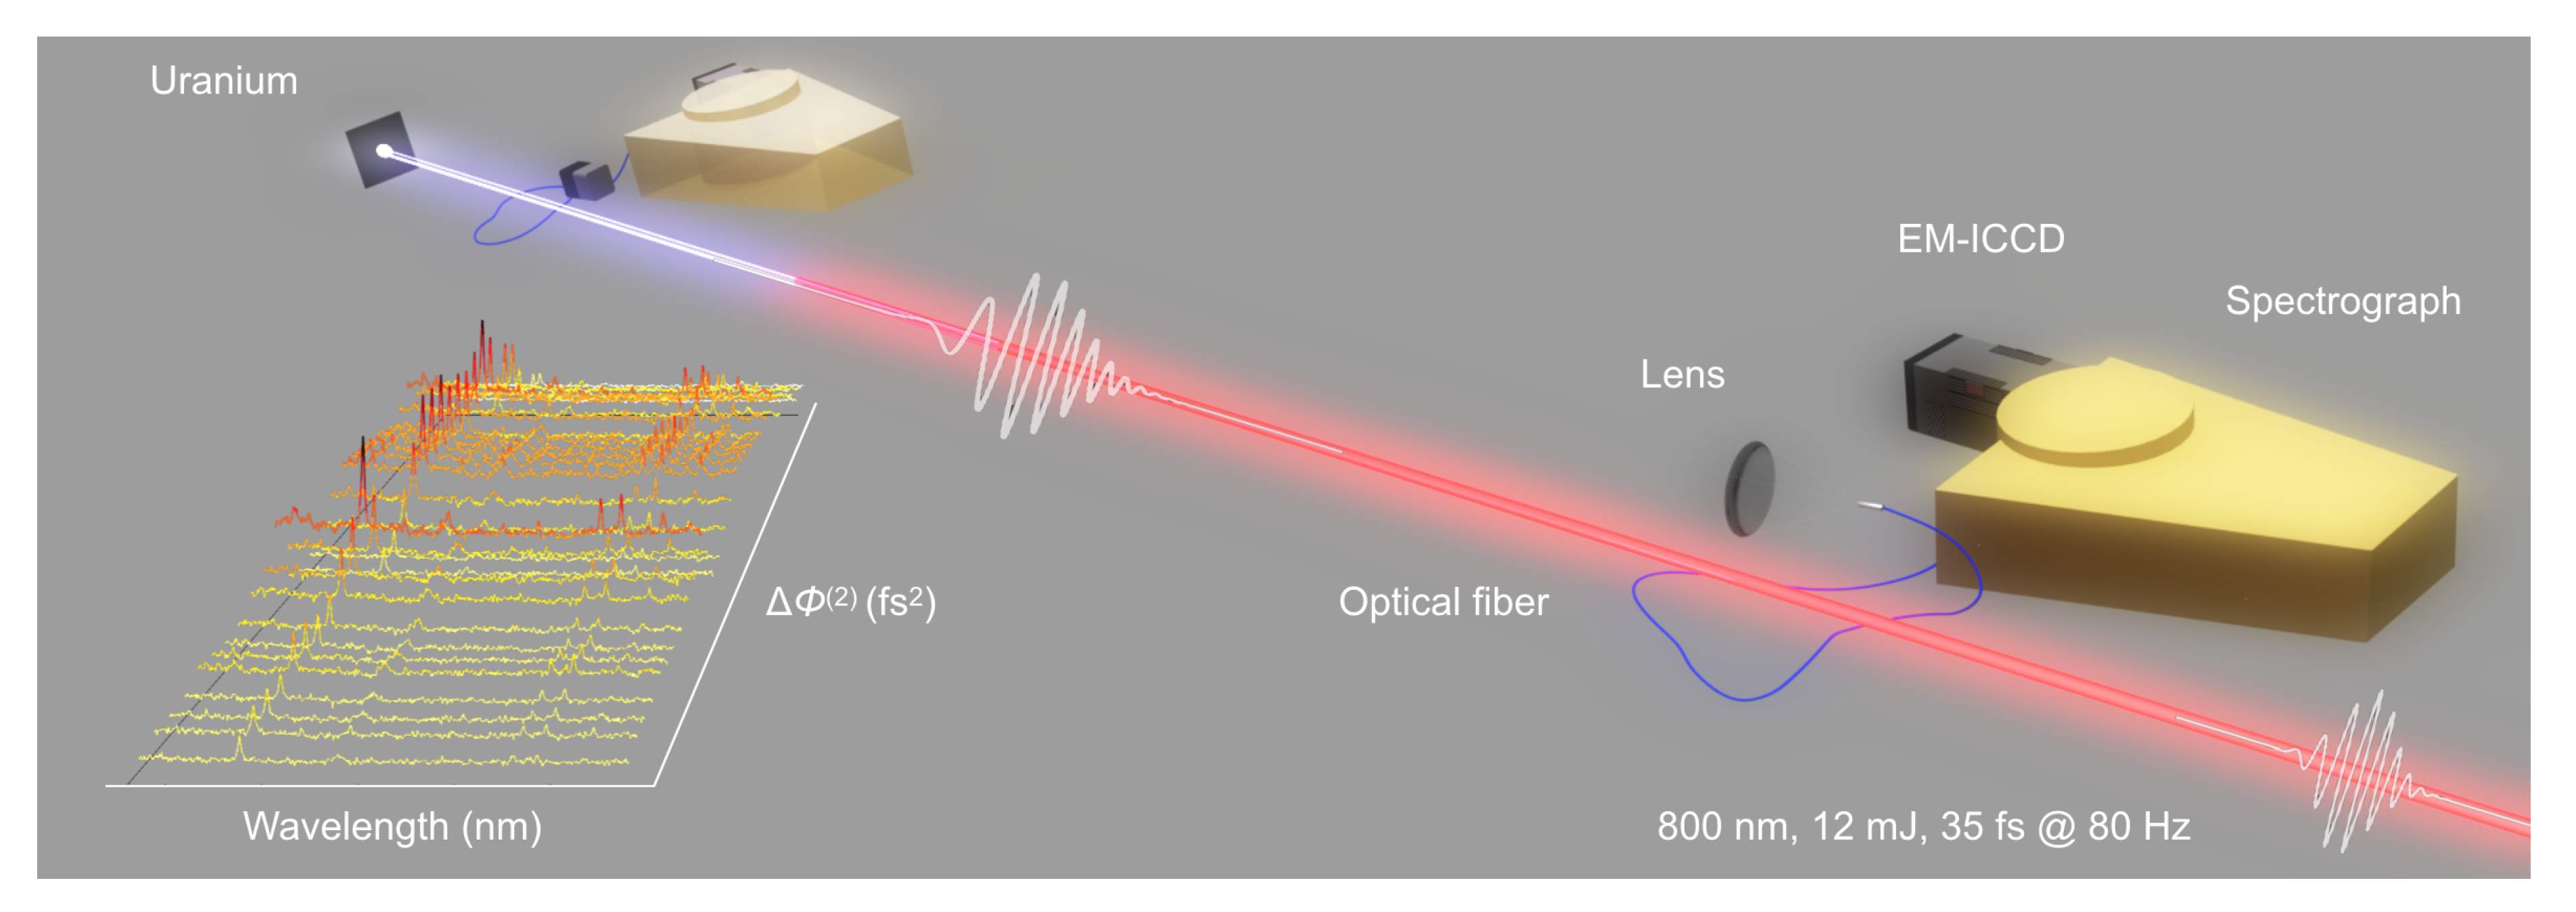
All experiments were performed in air using the setup shown in Figure 2. A Ti:sapphire chirped-pulse amplification laser system was used with the center wavelength of 800 nm and pulse duration of ∼35 fs. Pulses had an energy of 12 mJ, a repetition rate of 80 Hz, and a Gaussian beam diameter of 11 mm. The beam was freely propagated over a 10-m range to form filaments in air, which ablated a depleted uranium metal target placed within a fume hood. The target was positioned at a distance of 10 m from the laser output and mounted on a motorized translation stage for continuous movement during measurements. The collection system included a collimator (Andor CC52), a 400- μ m diameter optical fiber, a 0.55-m Czerny–Turner spectrometer (Horiba Jobin Yvon iHR550), and an electron multiplying-intensified CCD (EM-ICCD, Princeton Instruments PI-Max 4). The spectrometer is equipped with 1800 lines/mm grating, resulting in ∼104 resolving power. The spectral calibration was performed using a mercury–argon lamp. The gate width of the detector was set to 2 μ s. The collimator was placed at a fixed distance of 30 cm from the target. An emission spectrum from the LPP is a result of 2000 accumulated shots. The initial spectral phase of the laser pulse was varied by an acousto–optic programmable dispersive filter (Fastlite Dazzler, V370f). The beam profile on the target was measured by inserting a compact-disc surface at the position of the uranium target and characterizing the resulting burn. In the remote measurements, a 10-cm diameter, 20-cm focal length lens was placed at a 10-m standoff from the target and coupled the collected light into an optical fiber.

5. Results and Discussion

5.1. Uranium Spectrum

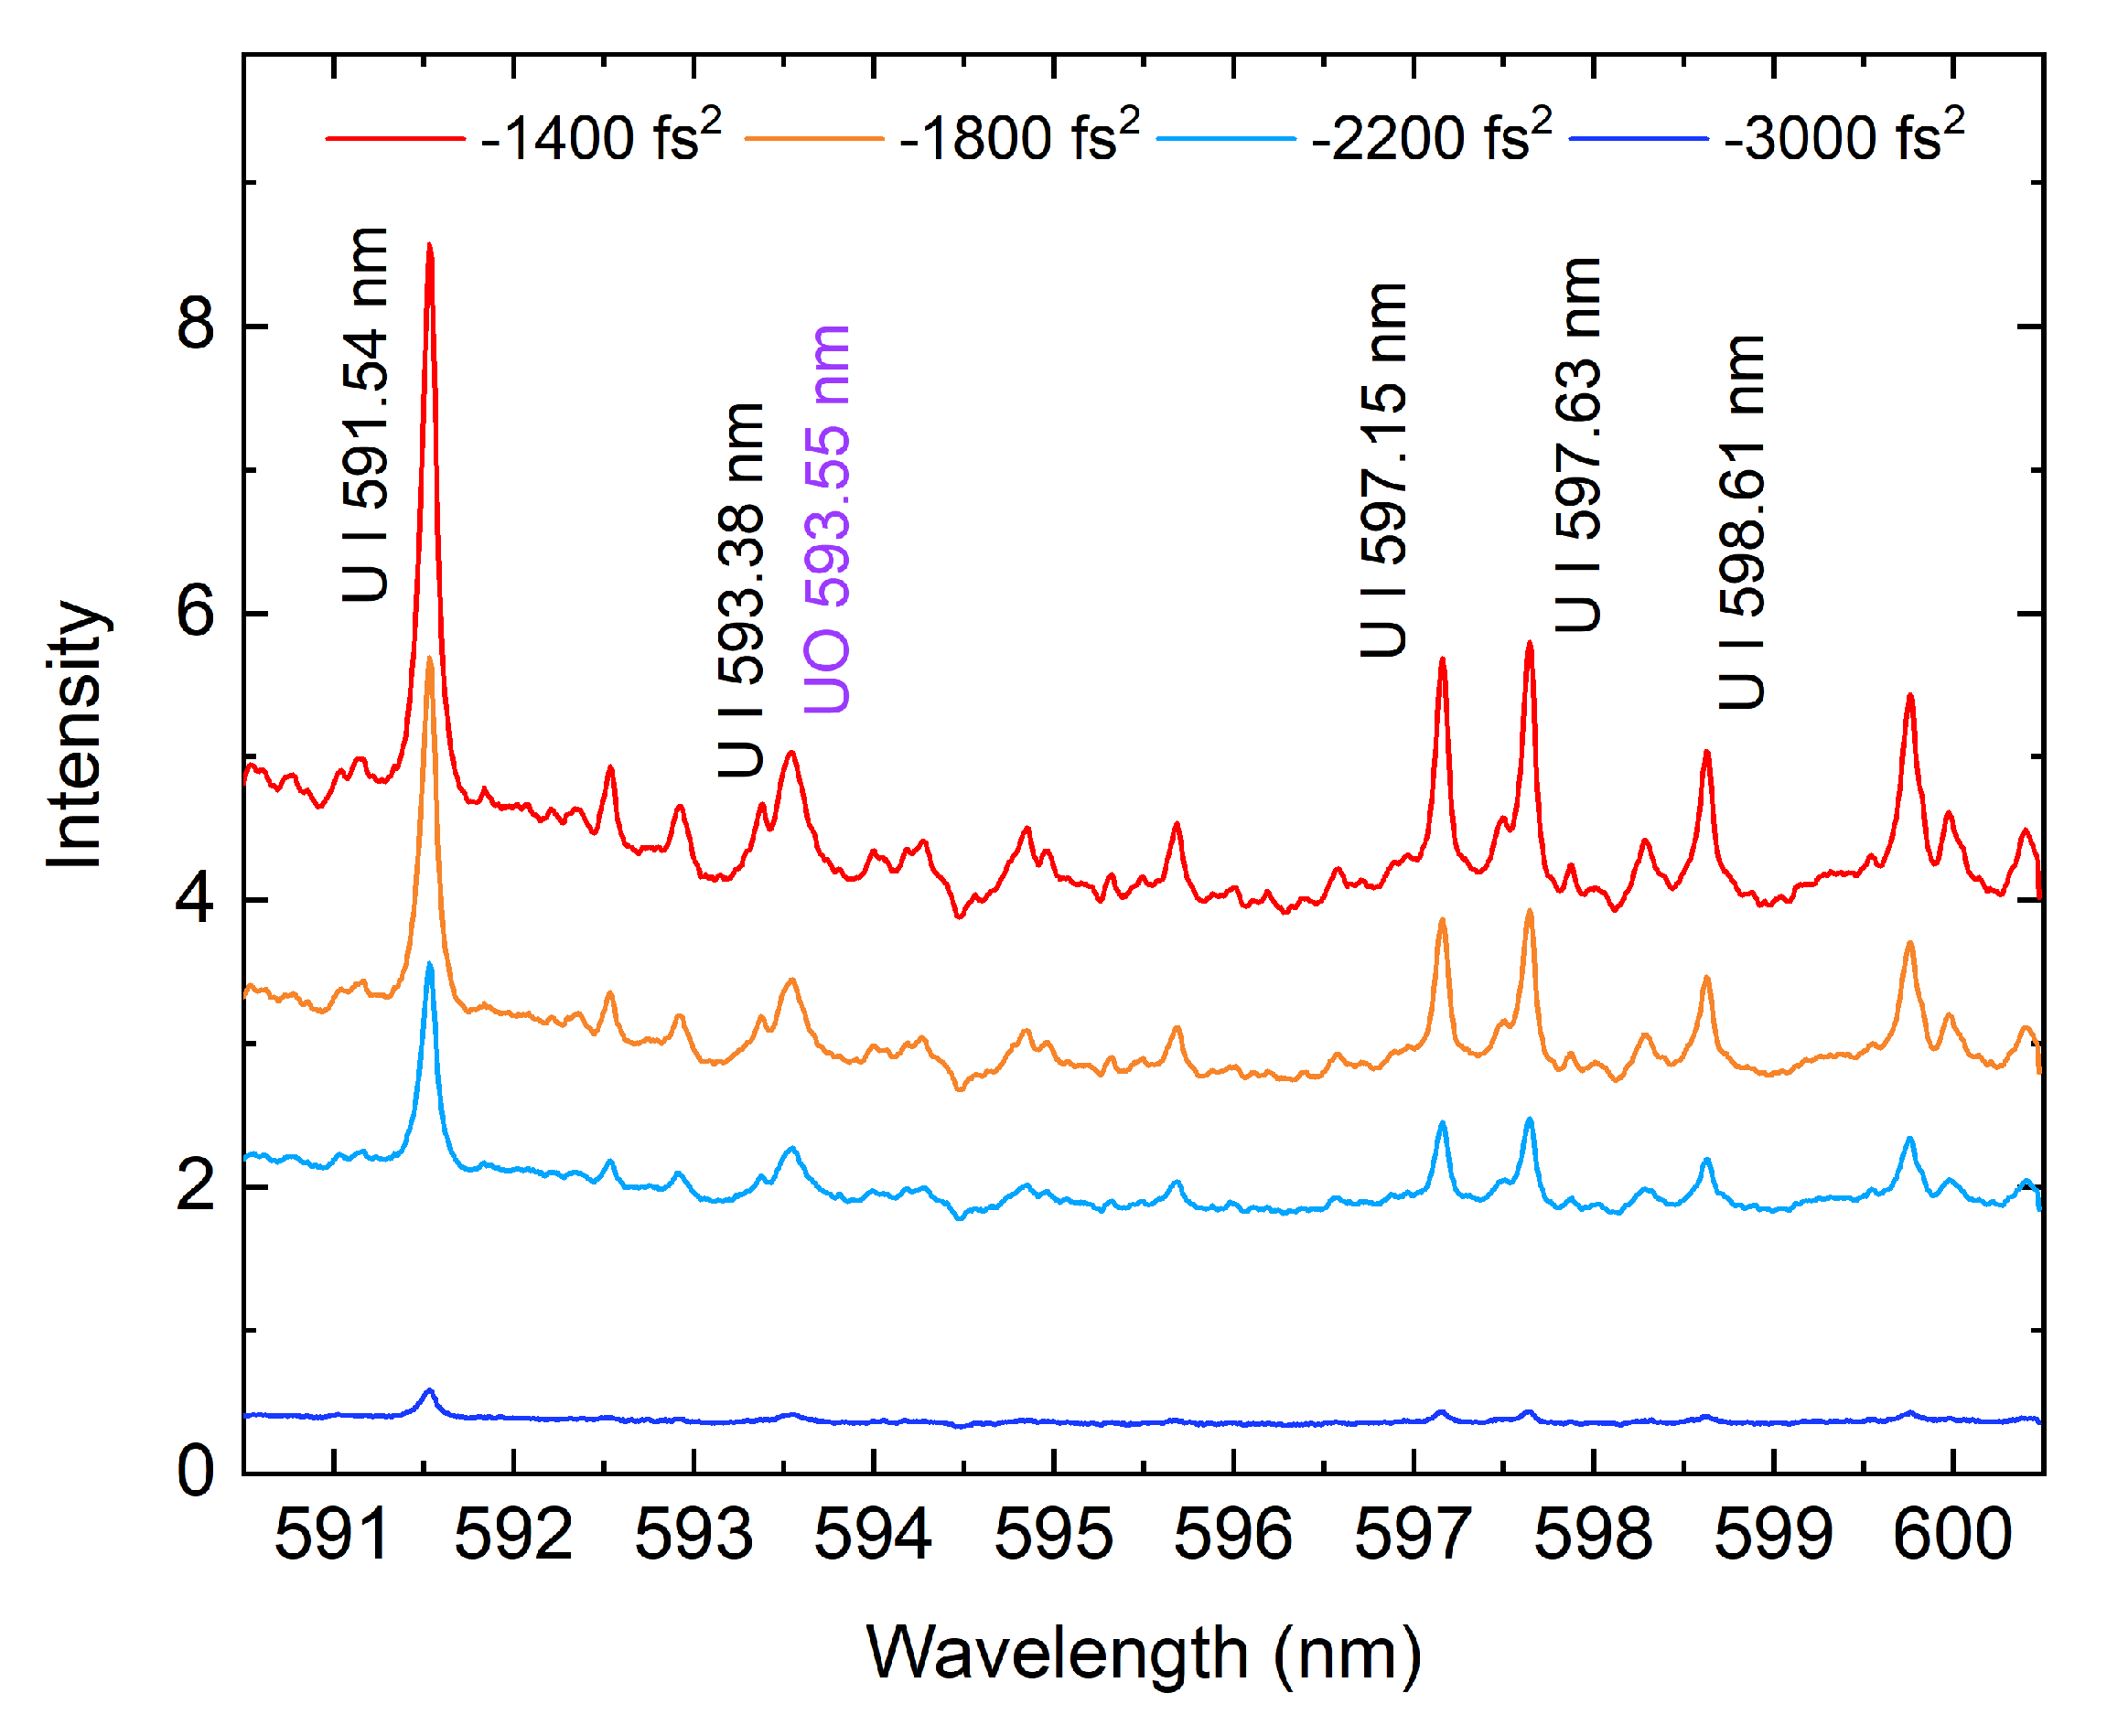
The challenges in performing emission spectroscopy of plasmas containing uranium have been associated with a congested spectrum containing more than 105 atomic and ionic lines originating from ∼1600 energy levels [38,39,40]. Figure 3 shows the emission spectra from uranium LPP for a range of spectral phase shaping applied to the incident laser pulse. Here, the sole parameter that is varied is the second-order dispersion, referred to as the group delay dispersion (GDD). In oxygen-rich environments such as air, formation and emission from uranium oxides introduces additional spectral features. In the past, those features were interpreted as arising mostly from a complex, unresolved atomic emission spectrum [41]. Recently, it has been shown that the unresolved features of uranium oxides contribute to a notable background in the emission spectrum of uranium-containing plasmas formed in the presence of oxygen [41,42]. These emission features from certain gas-phase uranium oxides heavier than uranium monoxide (UxOy, such that x 1 and y > 1 , e.g., UO2, UO3, U3O8) are still largely unidentified [43] and remain the subject of current studies. It should be noted that most of the previous efforts in uranium spectra characterization relied on nanosecond laser ablation. Plasma produced with femtosecond filaments has a lower temperature compared to that produced with a nanosecond laser [5], resulting in fewer excited states and spectrum congestion among the uranium lines. The line intensity was quantified by integrating the area within a given spectral window for each of the chosen prominent atomic and molecular features in the spectrum. The method for selecting the regions of interest for each of the signal features and the background is described in detail in previous work [32]. In our analysis, we consider both the UO band at 593.55 nm and the U I 591.54 nm line (Figure 3).

5.2. Chirp Optimization

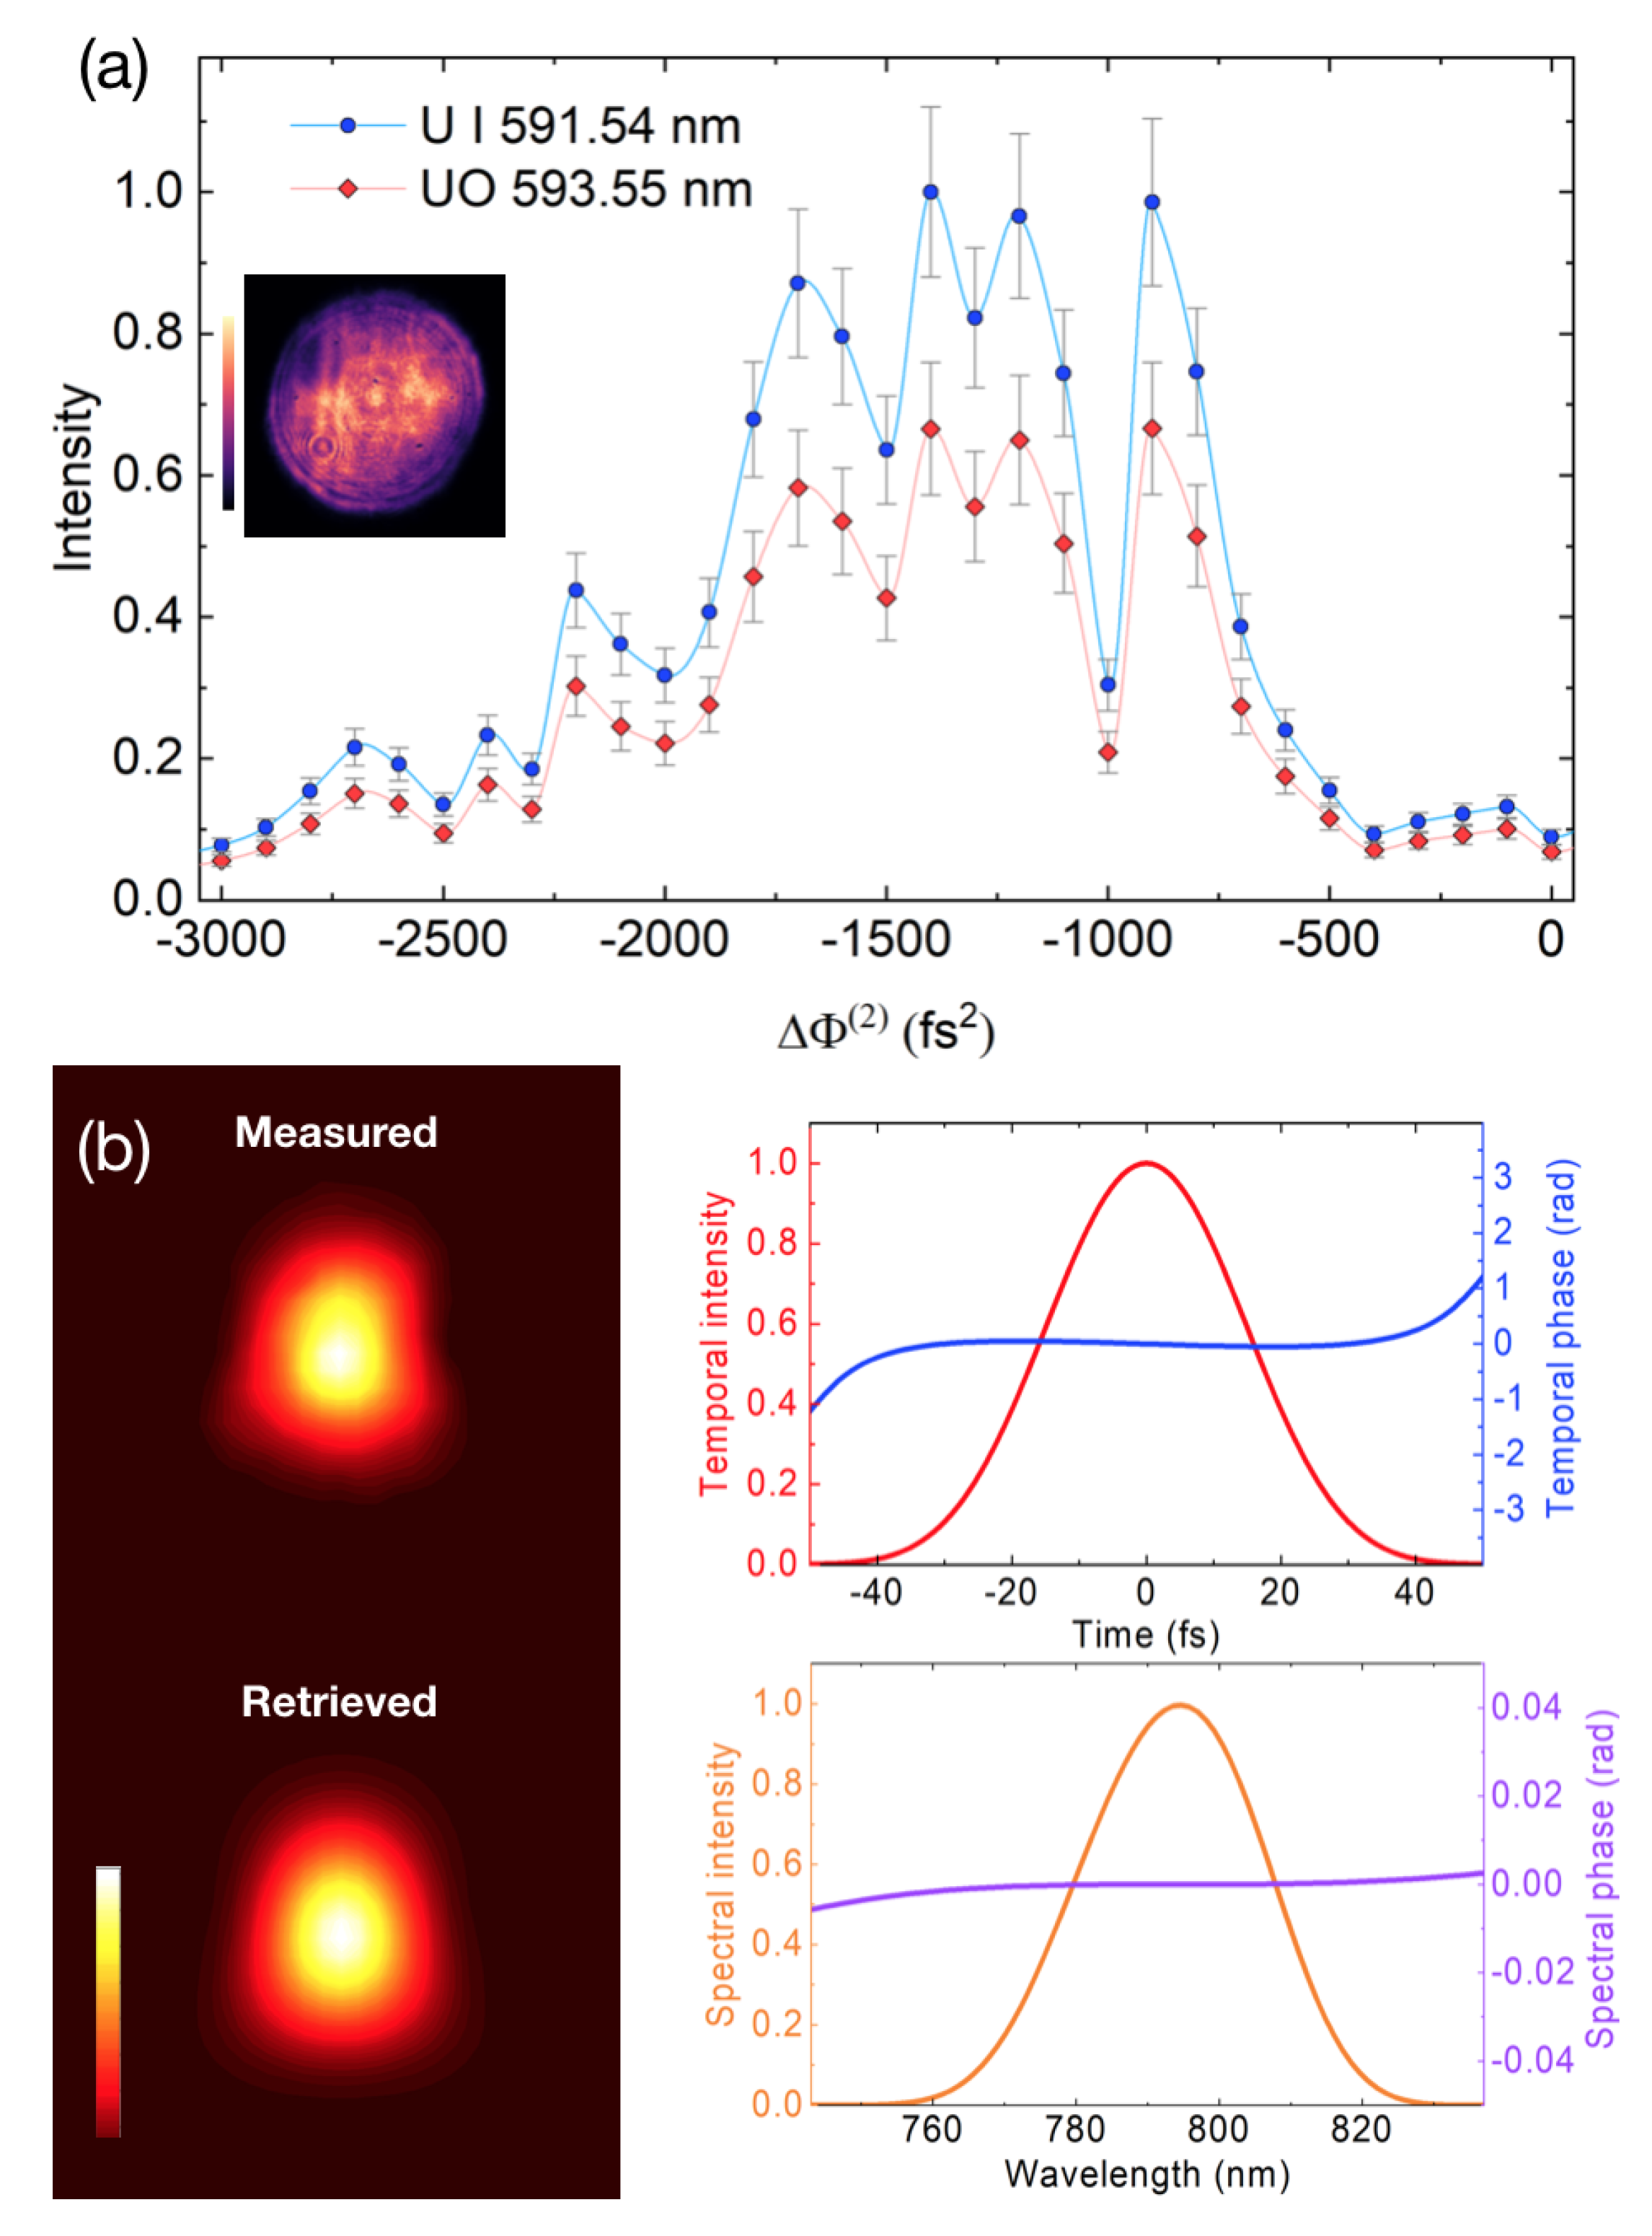
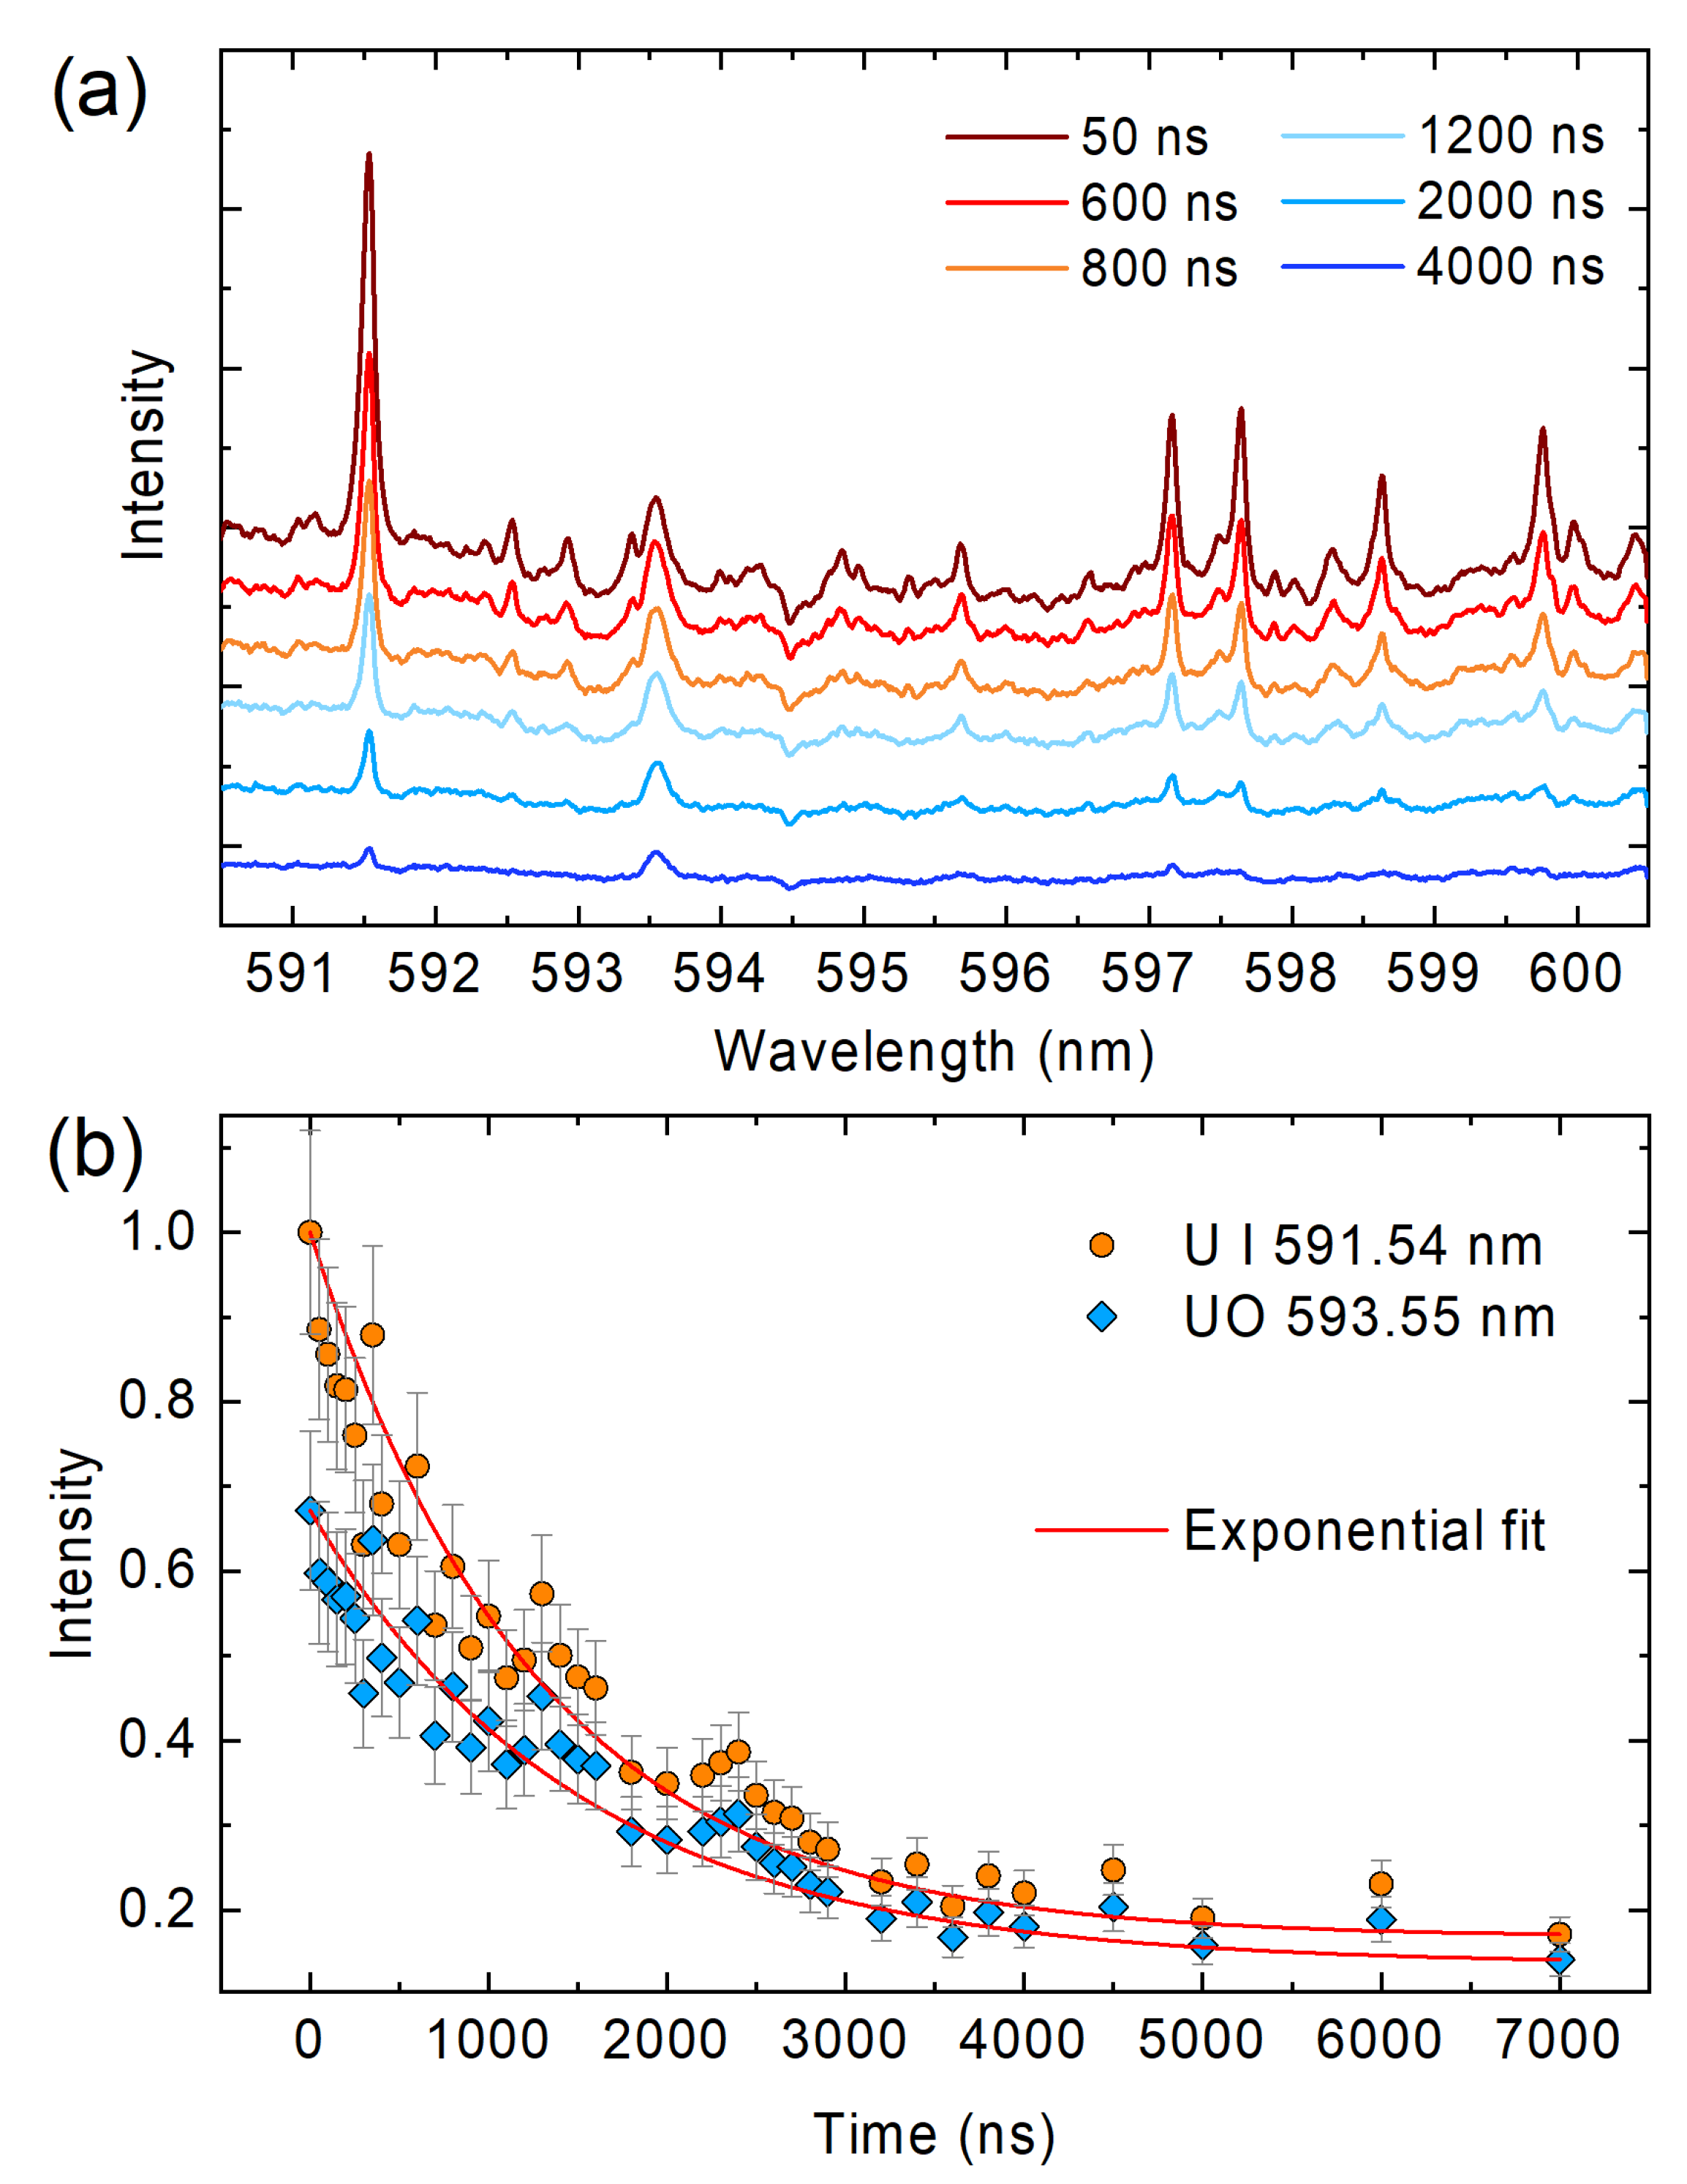
Imposing a negative pre-chirp can be used to control the location at which filament forms over long distances [44]. The pulses are gradually recompressed in the air as they undergo positive dispersion. At laser powers much greater than the critical power for self-focusing ( P c r ), the beam undergoes segmentation (also known as multiple filamentation) due to modulation instability [26]. Thus, by applying a negative pre-chirp, the location at which multi-filamentation takes place can be translated closer to the target surface. The spectral emission from uranium LPP as a function of the initial chirp is presented in Figure 4. The measured characteristic shape of the chirp dependence of LPP emission signal is consistent with observations made in Ref. [36], where the acoustic response of the filament channel was used as an observable. In the present study, the GDD is varied in steps of 100 fs2, which reveals a periodic pattern in the emission intensity. We interpret this behavior as a consequence of the dynamic interplay of multiple self-focusing/defocusing cycles along axial propagation [45], which results in variability of the filament intensity upon incidence on the target surface. Burn profiles on the compact disc were taken to observe the filamentation pattern incident on the target surface (Figure 5). A common feature for all recorded profiles relates to the apparent beam bifurcation into two groups of multiple filaments. It should be noted that the beam splitting shown here may not represent a universal behavior, as it is most likely the result of deviations of the incident beam from an ideal Gaussian beam profile (Figure 4a inset), which are amplified by nonlinear effects. In addition, the filament pattern shows signs of conglomeration in the cases of strong uranium emission (e.g., 900 fs2 shown in Figure 5), whereas the reduced uranium emission corresponds to more random filament distributions. The effects of conglomeration, self-focusing/defocusing cycles, and self-compression [45] along the propagation axis are all likely relevant for the variability of plasma emission intensity with the change of chirp (Figure 4a). A more detailed study is necessary to correlate the dependence of atomic LPP emission with the localized filament intensity, as well as to scale this correlation beyond the length constraints of the laboratory setting (Figure 6).

5.3. Remote Detection

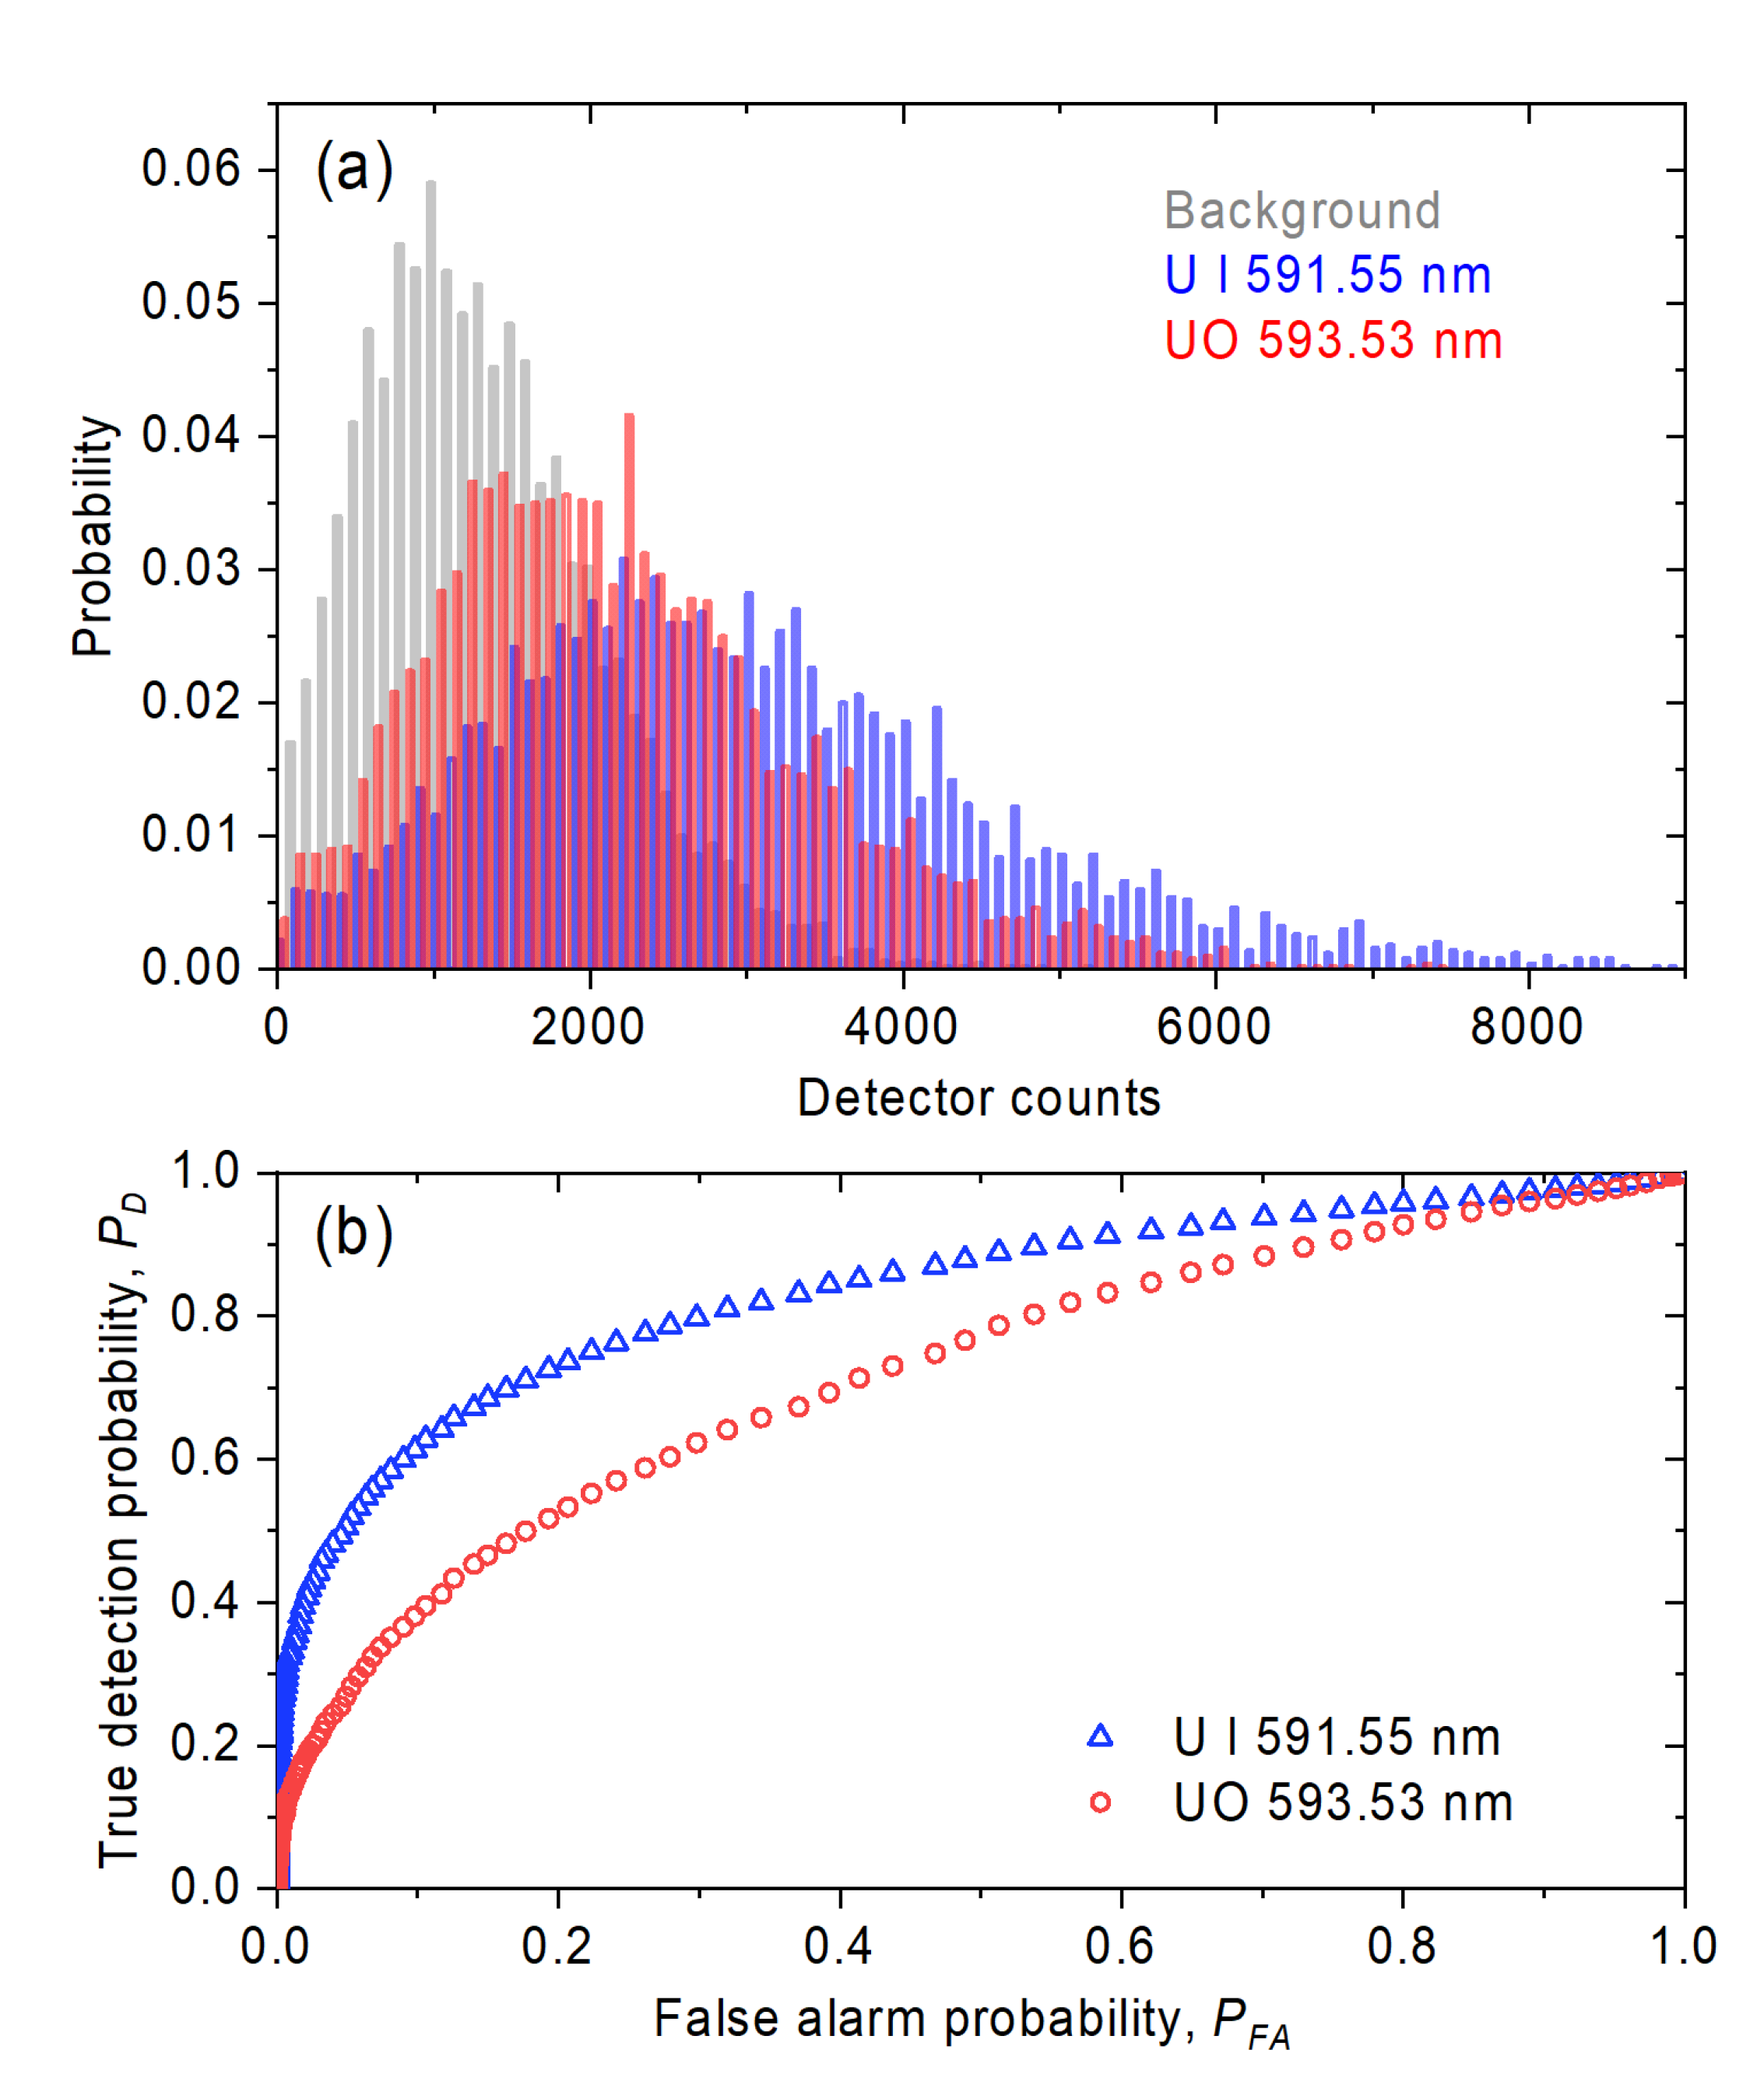
The efficacy of remote detection was assessed by moving the detector system 10 m away from the target to match the distance from which the laser pulse is delivered through filamentation. The remote detection study was done with a GDD setting of 900 fs2. The laser repetition rate was set to 480 Hz to record single-shot spectra with an EM-ICCD frame rate of 240 Hz. The detector system was synchronized to capture every other laser shot using a short gate delay and gate width. The short gate width allows the observation of a single laser shot each time the camera is triggered. The normalized probability of occurrence is shown in the histogram for each single laser shot in Figure 7a. We quantify the true detection probability ( P D = L C P ( N D ) d N D ) for a given false alarm probability ( P F A = L C P ( N B G ) d N B G ), where N D and N B G represent signal and background counts, respectively. The critical limit ( L C ) is varied in order to generate the ROC curve.
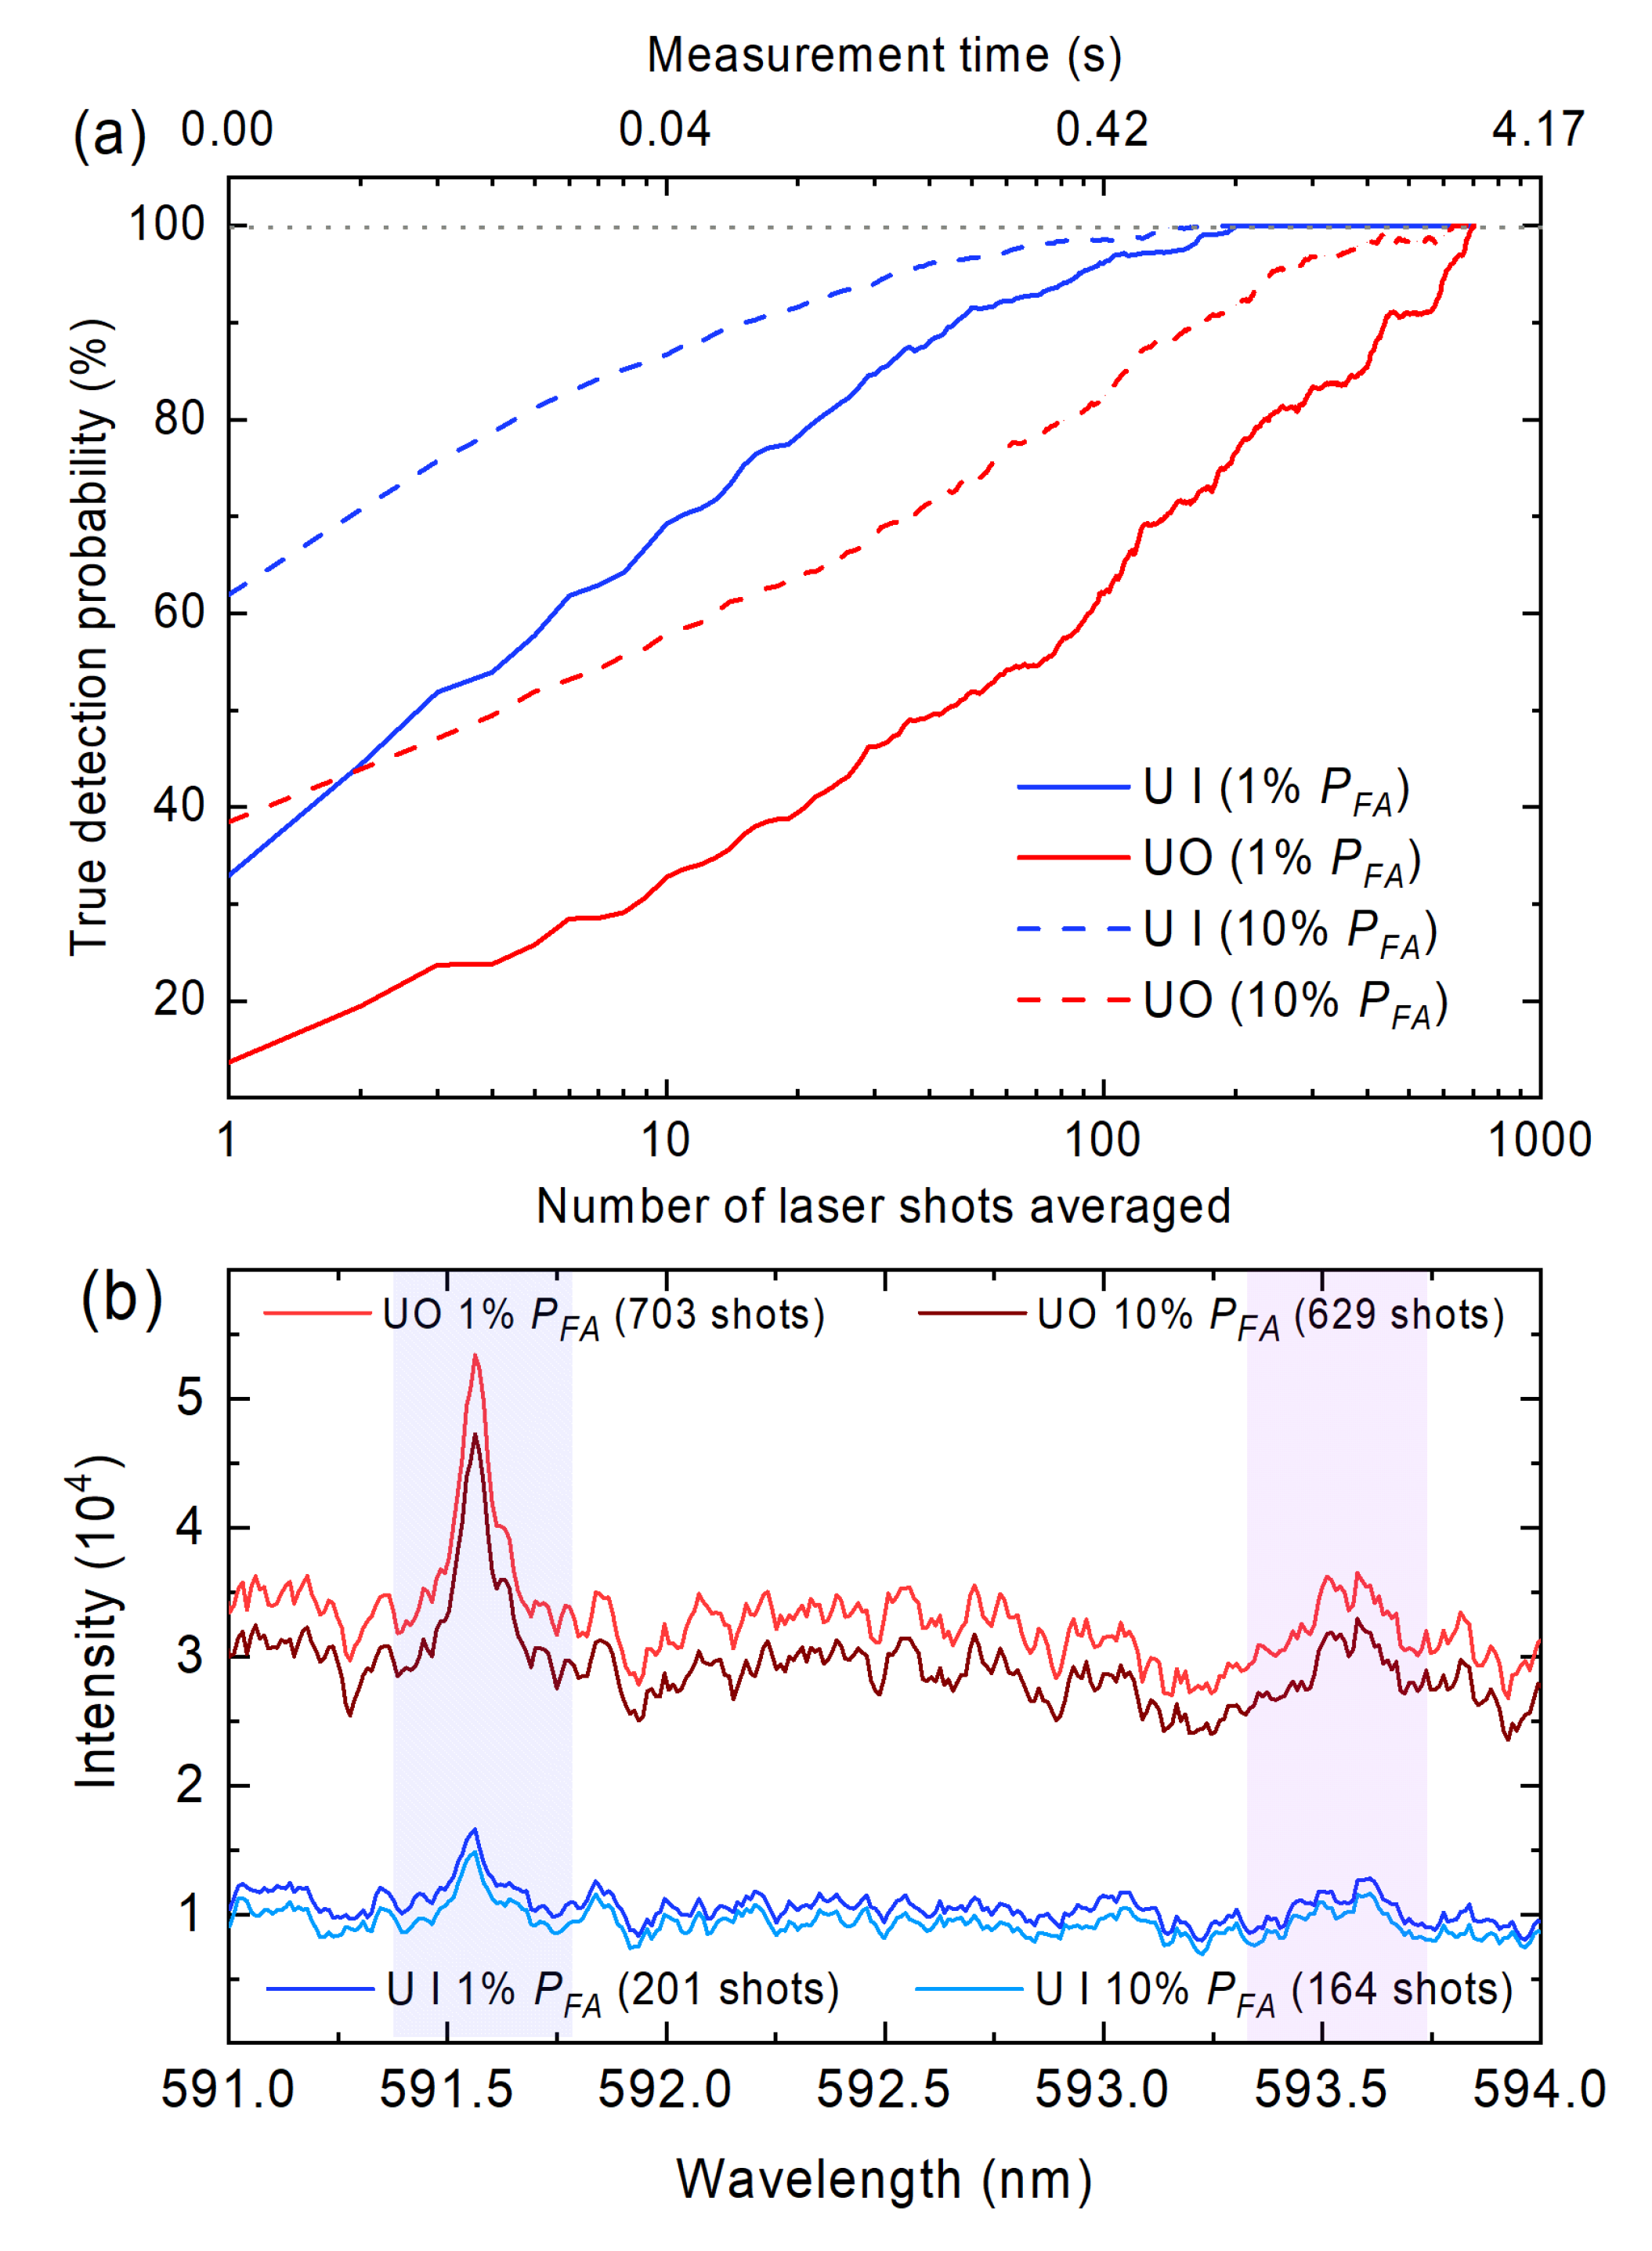
The detection and false alarm probabilities are compared in the receiver operating characteristic (ROC) curve in Figure 7b and demonstrate the ability to identify uranium signatures with a given false alarm rate for single-shot data. Subsequently, a similar analysis was performed with averaged spectra by gradually increasing the number of averaged shots. The ROC curves were produced in order to determine the true detection probabilities for fixed false alarm probabilities. Figure 8a shows the detection probabilities of both U I and UO signal features with false alarm rates of 10% and 1%, respectively. The number of shots in order to reach near-unity detection probability with a false alarm rate of 10% was 164 for the U I feature, and 629 for the UO band. The data acquisition times for each of these measurements were 0.68 s and 2.62 s, respectively. The number of shots to reach near-unity detection probability with 1% false alarm rate was 201 for U I (0.84 s) and 703 for UO (2.93 s). The error for U I peak was 16%; whereas the error for the UO feature is 15%. These values represent one standard deviation from five averages of 1000 shots each. The spectra which result from averaging these numbers of shots for near-unity true detection probability with fixed false alarm probabilities are shown in Figure 8b.
Although single-shot detection is not as effective with free-propagating filament ablation when compared to loosely-focused filament ablation [32], the present results demonstrate the ability for rapid detection with high fidelity. In a loose-focusing scheme in which a 10-m focal length lens was used for filament delivery to the target, a near-unity detection probability with 1% false alarm rate was reached in 24 and 90 shots for U I and UO signals, respectively [32]. A greater number of shots was required to reach the same detection fidelity in the present freely-propagating scheme when compared to the loose-focusing scheme indicates that free-propagation exhibits lower ablation efficacy than loose-focusing. The difference in ablation efficiency may be attributed to the lower contribution of the reservoir toward ablation as well as the sparser distribution of individual filaments (as shown in Figure 5) in the case of free-propagation. The use of beam wavefront control with feedback based on LPP emission may enable improved grouping of the filaments and thus better detection sensitivity.

6. Conclusions

In summary, we have demonstrated the feasibility of remote uranium detection using a self-focusing laser filament. In order to optimize the emission signal from the uranium LPP, we have varied the pulse chirp. The chirp optimization shows that LPP emission follows an oscillatory pattern, which is attributed to multiple effects including self-focusing/defocusing cycle interchange and self-compression along the propagation axis. Examination of burn profiles reveals the conglomeration of multiple-filaments incident on the target surface for the optimized chirp condition, whereas the filament distribution for non-optimized values is sparse. Both atomic (U I 591.54 nm) and molecular (UO 593.55 nm) uranium emission signals were monitored, and this emission persisted about several μ s after the laser. The remote measurements were performed from a 10-m distance using an optimized pulse chirp. The measurement system enabled the detection of U I and UO signatures with near-unity detection probability within seconds.
The use of adaptive optics such as deformable mirrors in a wavefront control scheme or beam shaping through phase modulation [46] may lead to signal enhancement and could be considered as an attractive future direction. More effort is needed to correlate the dependence of LPP emission to the localized filament intensity, assess trace uranium detection, and extend delivery range beyond the current laboratory length constraints.

Author Contributions

Conceptualization, M.B. and I.J.; design and experiment implementation, M.B., P.J.S., L.A.F. and J.N.; formal analysis, M.B., P.J.S. and L.A.F.; supervision, J.N. and I.J.; writing—original draft preparation M.B. and P.J.S. All authors have read and agreed to the published version of the manuscript.

Funding

This work has been funded by the Department of Energy National Nuclear Security Administration, Consortium for Verification Technology (DE-NA0002534), Consortium for Monitoring, Verification, and Technology (DE-NE000863), Air Force Office of Scientific Research (AFOSR) FA9550-16-1-0121, National Science Foundation Graduate Research Fellowship Program (DGE 1256260).

Conflicts of Interest

The authors declare no conflict of interest. The funders had no role in the design of the study; in the collection, analyses, or interpretation of data; in the writing of the manuscript, or in the decision to publish the results.

References

  1. Schneider, S.; Walther, C.; Bister, S.; Schauer, V.; Christl, M.; Synal, H.A.; Shozugawa, K.; Steinhauser, G. Plutonium release from Fukushima Daiichi fosters the need for more detailed investigations. Sci. Rep. 2013, 3, 2988. [Google Scholar] [CrossRef] [Green Version]
  2. Katz, S.A. The Chemistry and Toxicology of Depleted Uranium. Toxics 2014, 2, 50–78. [Google Scholar] [CrossRef] [Green Version]
  3. Chinni, R.C.; Cremers, D.A.; Radziemski, L.J.; Bostian, M.; Navarro-Northrup, C. Detection of Uranium Using Laser-Induced Breakdown Spectroscopy. Appl. Spectrosc. 2009, 63, 1238–1250. [Google Scholar] [CrossRef] [PubMed]
  4. Kim, D.; Yu, D.; Sawant, A.; Choe, M.S.; Lee, I.; Kim, S.G.; Choi, E. Remote detection of radioactive material using high-power pulsed electromagnetic radiation. Nat. Commun. 2017, 8, 15394. [Google Scholar] [CrossRef] [Green Version]
  5. Cremers, D.A.; Radziemski, L.J. Handbook of Laser-Induced Breakdown Spectroscopy; John Wiley & Sons: Hoboken, NJ, USA, 2013. [Google Scholar]
  6. Hermann, J.; Grojo, D.; Axente, E.; Gerhard, C.; Burger, M.; Craciun, V. Ideal radiation source for plasma spectroscopy generated by laser ablation. Phys. Rev. E 2017, 96, 053210. [Google Scholar] [CrossRef] [PubMed] [Green Version]
  7. Harilal, S.S.; Brumfield, B.E.; LaHaye, N.L.; Hartig, K.C.; Phillips, M.C. Optical spectroscopy of laser-produced plasmas for standoff isotopic analysis. Appl. Phys. Rev. 2018, 5, 021301. [Google Scholar] [CrossRef]
  8. Meslin, P.Y.; Gasnault, O.; Forni, O.; Schröder, S.; Cousin, A.; Berger, G.; Clegg, S.M.; Lasue, J.; Maurice, S.; Sautter, V.; et al. Soil Diversity and Hydration as Observed by ChemCam at Gale Crater, Mars. Science 2013, 341, 1238670. [Google Scholar] [CrossRef] [Green Version]
  9. Thornton, B.; Takahashi, T.; Sato, T.; Sakka, T.; Tamura, A.; Matsumoto, A.; Nozaki, T.; Ohki, T.; Ohki, K. Development of a deep-sea laser-induced breakdown spectrometer for in situ multi-element chemical analysis. Deep. Sea Res. Part I Oceanogr. Res. Pap. 2015, 95, 20–36. [Google Scholar] [CrossRef] [Green Version]
  10. Wang, Q.; Teng, G.; Li, C.; Zhao, Y.; Peng, Z. Identification and classification of explosives using semi-supervised learning and laser-induced breakdown spectroscopy. J. Hazard. Mater. 2019, 369, 423–429. [Google Scholar] [CrossRef]
  11. Shaik, A.K.; Epuru, N.R.; Syed, H.; Byram, C.; Soma, V.R. Femtosecond laser induced breakdown spectroscopy based standoff detection of explosives and discrimination using principal component analysis. Opt. Express 2018, 26, 8069–8083. [Google Scholar] [CrossRef]
  12. Barefield, J.E.; Judge, E.J.; Campbell, K.R.; Colgan, J.P.; Kilcrease, D.P.; Johns, H.M.; Wiens, R.C.; McInroy, R.E.; Martinez, R.K.; Clegg, S.M. Analysis of geological materials containing uranium using laser-induced breakdown spectroscopy. Spectrochim. Acta Part B At. Spectrosc. 2016, 120, 1–8. [Google Scholar] [CrossRef] [Green Version]
  13. Whitehouse, A.; Young, J.; Botheroyd, I.; Lawson, S.; Evans, C.; Wright, J. Remote material analysis of nuclear power station steam generator tubes by laser-induced breakdown spectroscopy. Spectrochim. Acta Part B At. Spectrosc. 2001, 56, 821–830. [Google Scholar] [CrossRef]
  14. Lang, A.; Engelberg, D.; Smith, N.T.; Trivedi, D.; Horsfall, O.; Banford, A.; Martin, P.A.; Coffey, P.; Bower, W.R.; Walther, C.; et al. Analysis of contaminated nuclear plant steel by laser-induced breakdown spectroscopy. J. Hazard. Mater. 2018, 345, 114–122. [Google Scholar] [CrossRef] [PubMed]
  15. Fobar, D.; Xiao, X.; Burger, M.; Berre, S.L.; Motta, A.; Jovanovic, I. Robotic delivery of laser-induced breakdown spectroscopy for sensitive chlorine measurement in dry cask storage systems. Prog. Nucl. Energy 2018, 109, 188–194. [Google Scholar] [CrossRef]
  16. Mao, X.; Chan, G.C.Y.; Choi, I.; Zorba, V.; Russo, R.E. Combination of atomic lines and molecular bands for uranium optical isotopic analysis in laser induced plasma spectrometry. J. Radioanal. Nucl. Chem. 2017, 312, 121–131. [Google Scholar] [CrossRef] [Green Version]
  17. Weisz, D.G.; Crowhurst, J.C.; Siekhaus, W.J.; Rose, T.P.; Koroglu, B.; Radousky, H.B.; Zaug, J.M.; Armstrong, M.R.; Isselhardt, B.H.; Savina, M.R.; et al. Formation of 238U16O and 238U18O observed by time-resolved emission spectroscopy subsequent to laser ablation. Appl. Phys. Lett. 2017, 111, 034101. [Google Scholar] [CrossRef]
  18. Wu, J.; Qiu, Y.; Li, X.; Yu, H.; Zhang, Z.; Qiu, A. Progress of laser-induced breakdown spectroscopy in nuclear industry applications. J. Phys. D Appl. Phys. 2019, 53, 023001. [Google Scholar] [CrossRef]
  19. Labutin, T.A.; Lednev, V.N.; Ilyin, A.A.; Popov, A.M. Femtosecond laser-induced breakdown spectroscopy. J. Anal. At. Spectrom. 2016, 31, 90–118. [Google Scholar] [CrossRef]
  20. Harilal, S.S.; Yeak, J.; Brumfield, B.E.; Suter, J.D.; Phillips, M.C. Dynamics of molecular emission features from nanosecond, femtosecond laser and filament ablation plasmas. J. Anal. At. Spectrom. 2016, 31, 1192–1197. [Google Scholar] [CrossRef]
  21. Laserna, J.; Reyes, R.F.; González, R.; Tobaria, L.; Lucena, P. Study on the effect of beam propagation through atmospheric turbulence on standoff nanosecond laser induced breakdown spectroscopy measurements. Opt. Express 2009, 17, 10265–10276. [Google Scholar] [CrossRef] [PubMed]
  22. Braun, A.; Korn, G.; Liu, X.; Du, D.; Squier, J.; Mourou, G. Self-channeling of high-peak-power femtosecond laser pulses in air. Opt. Lett. 1995, 20, 73–75. [Google Scholar] [CrossRef] [PubMed]
  23. Kasparian, J.; Rodriguez, M.; Méjean, G.; Yu, J.; Salmon, E.; Wille, H.; Bourayou, R.; Frey, S.; André, Y.B.; Mysyrowicz, A.; et al. White-Light Filaments for Atmospheric Analysis. Science 2003, 301, 61–64. [Google Scholar] [CrossRef] [PubMed]
  24. Stelmaszczyk, K.; Rohwetter, P.; Méjean, G.; Yu, J.; Salmon, E.; Kasparian, J.; Ackermann, R.; Wolf, J.P.; Wöste, L. Long-distance remote laser-induced breakdown spectroscopy using filamentation in air. Appl. Phys. Lett. 2004, 85, 3977–3979. [Google Scholar] [CrossRef]
  25. Sallé, B.; Mauchien, P.; Maurice, S. Laser-Induced Breakdown Spectroscopy in open-path configuration for the analysis of distant objects. Spectrochim. Acta Part B At. Spectrosc. 2007, 62, 739–768. [Google Scholar] [CrossRef]
  26. Rodriguez, M.; Bourayou, R.; Méjean, G.; Kasparian, J.; Yu, J.; Salmon, E.; Scholz, A.; Stecklum, B.; Eislöffel, J.; Laux, U.; et al. Kilometer-range nonlinear propagation of femtosecond laser pulses. Phys. Rev. E 2004, 69, 036607. [Google Scholar] [CrossRef] [Green Version]
  27. Durand, M.; Houard, A.; Prade, B.; Mysyrowicz, A.; Durécu, A.; Moreau, B.; Fleury, D.; Vasseur, O.; Borchert, H.; Diener, K.; et al. Kilometer range filamentation. Opt. Express 2013, 21, 26836–26845. [Google Scholar] [CrossRef] [Green Version]
  28. Kiran, P.P.; Bagchi, S.; Arnold, C.L.; Krishnan, S.R.; Kumar, G.R.; Couairon, A. Filamentation without intensity clamping. Opt. Express 2010, 18, 21504–21510. [Google Scholar] [CrossRef]
  29. Tzortzakis, S.; Anglos, D.; Gray, D. Ultraviolet laser filaments for remote laser-induced breakdown spectroscopy (LIBS) analysis: Applications in cultural heritage monitoring. Opt. Lett. 2006, 31, 1139–1141. [Google Scholar] [CrossRef]
  30. Xu, H.; Méjean, G.; Liu, W.; Kamali, Y.; Daigle, J.F.; Azarm, A.; Simard, P.; Mathieu, P.; Roy, G.; Simard, J.R.; et al. Remote detection of similar biological materials using femtosecond filament-induced breakdown spectroscopy. Appl. Phys. B 2007, 87, 151–156. [Google Scholar] [CrossRef]
  31. Hou, H.; Yang, B.; Mao, X.; Zorba, V.; Ran, P.; Russo, R.E. Characteristics of plasma plume in ultrafast laser ablation with a weakly ionized air channel. Opt. Express 2018, 26, 13425–13435. [Google Scholar] [CrossRef]
  32. Finney, L.A.; Skrodzki, P.J.; Burger, M.; Nees, J.; Harilal, S.S.; Jovanovic, I. Single-shot, multi-signature remote detection of uranium by filament-induced breakdown spectroscopy. Opt. Lett. 2019, 44, 2783–2786. [Google Scholar] [CrossRef]
  33. Zeng, B.; Wang, T.J.; Hosseini, S.; Cheng, Y.; Xu, Z.; Liu, W.; Chin, S.L. Enhanced remote filament-induced breakdown spectroscopy with spatio-temporally chirped pulses. J. Opt. Soc. Am. B 2012, 29, 3226–3230. [Google Scholar] [CrossRef]
  34. Valenzuela, A.; Munson, C.; Porwitzky, A.; Weidman, M.; Richardson, M. Comparison between geometrically focused pulses versus filaments in femtosecond laser ablation of steel and titanium alloys. Appl. Phys. B 2014, 116, 485–491. [Google Scholar] [CrossRef]
  35. Harilal, S.S.; Yeak, J.; Brumfield, B.E.; Phillips, M.C. Consequences of femtosecond laser filament generation conditions in standoff laser induced breakdown spectroscopy. Opt. Express 2016, 24, 17941–17949. [Google Scholar] [CrossRef] [PubMed]
  36. Rohwetter, P.; Stelmaszczyk, K.; Wöste, L.; Ackermann, R.; Méjean, G.; Salmon, E.; Kasparian, J.; Yu, J.; Wolf, J.P. Filament-induced remote surface ablation for long range laser-induced breakdown spectroscopy operation. Spectrochim. Acta Part B At. Spectrosc. 2005, 60, 1025–1033. [Google Scholar] [CrossRef]
  37. Konoplev, O.A.; Meyerhofter, D.D. Cancellation of B-integral accumulation for CPA lasers. IEEE J. Sel. Top. Quantum Electron. 1998, 4, 459–469. [Google Scholar] [CrossRef]
  38. Blaise, J.; Radziemski, L.J. Energy levels of neutral atomic uranium (Ui). J. Opt. Soc. Am. 1976, 66, 644–659. [Google Scholar] [CrossRef]
  39. Palmer, B.A.; Keller, R.A.; Engleman, R. An Atlas of Uranium Emission Intensities in A Hollow Cathode Discharge; Report No. LA 8251-MS; Los Alamos Scientific Lab.: Los Alamos, NM, USA, 1980. [Google Scholar]
  40. Blaise, J.; Wyart, J.F.; Vergès, J.; Engleman, R.; Palmer, B.A.; Radziemski, L.J. Energy levels and isotope shifts for singly ionized uranium (U ii). J. Opt. Soc. Am. B 1994, 11, 1897–1929. [Google Scholar] [CrossRef]
  41. Skrodzki, P.J.; Burger, M.; Jovanovic, I.; Phillips, M.C.; Brumfield, B.E.; Harilal, S.S. Tracking of oxide formation in laser-produced uranium plasmas. Opt. Lett. 2018, 43, 5118–5121. [Google Scholar] [CrossRef]
  42. Finko, M.S.; Curreli, D. Simulation of uranium plasma plume dynamics in atmospheric oxygen produced via femtosecond laser ablation. Phys. Plasmas 2018, 25, 083112. [Google Scholar] [CrossRef]
  43. Skrodzki, P.J.; Burger, M.; Jovanovic, I.; Phillips, M.C.; Yeak, J.; Brumfield, B.E.; Harilal, S.S. Plume dynamics and gas-phase molecular formation in transient laser-produced uranium plasmas. Phys. Plasmas 2019, 26, 083508. [Google Scholar] [CrossRef]
  44. Wille, H.; Rodriguez, M.; Kasparian, J.; Mondelain, D.; Yu, J.; Mysyrowicz, A.; Sauerbrey, R.; Wolf, J.P.; Wöste, L. Teramobile: A mobile femtosecond-terawatt laser and detection system. Eur. Phys. J. Appl. Phys. 2002, 20, 183–190. [Google Scholar] [CrossRef]
  45. Nuter, R.; Skupin, S.; Bergé, L. Chirp-induced dynamics of femtosecond filaments in air. Opt. Lett. 2005, 30, 917–919. [Google Scholar] [CrossRef] [PubMed]
  46. Burger, M.; Skrodzki, P.J.; Nees, J.; Jovanovic, I. Energy Transmission Efficiency of Laser-induced Vortical Filaments. In Proceedings of the 2019 Conference on Lasers and Electro-Optics (CLEO), Munich, Germany, 23–27 June 2019; pp. 1–2. [Google Scholar] [CrossRef]
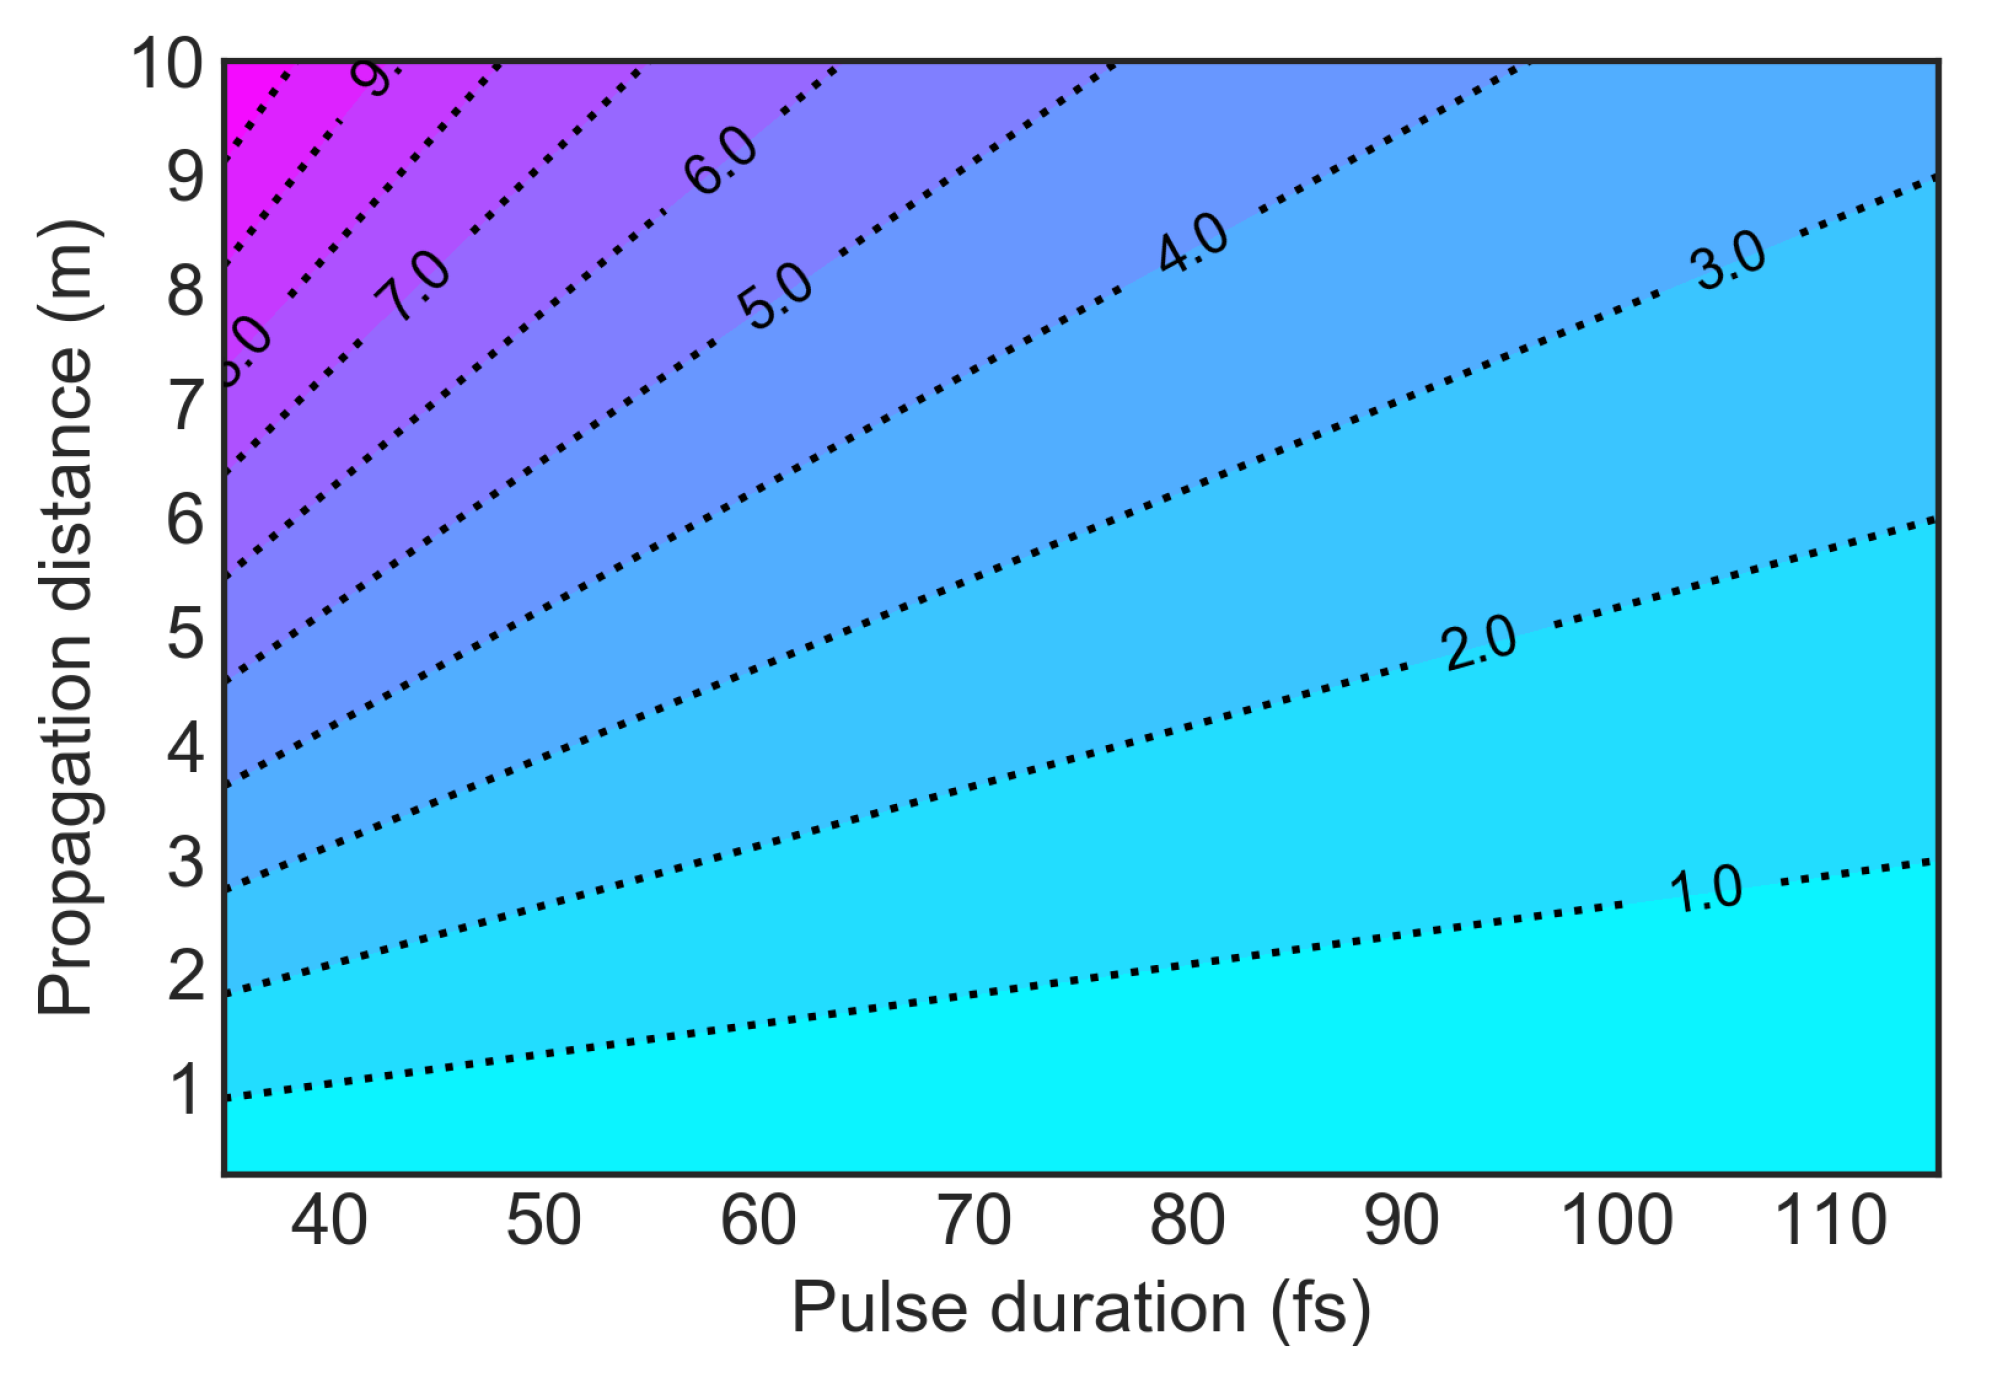
Figure 1. Estimate of B-integral accumulation for a freely-propagated 12-mJ, 1-cm Gaussian diameter beam of varying pulse duration.
Remotesensing 12 01281 g001
Figure 2. Experimental setup for optimization of uranium plasma emission from close range (left) and its detection from a remote distance (right). The inset shows the change of uranium spectra with a change in the initial spectral phase of an ultrashort laser pulse.
Remotesensing 12 01281 g002
Figure 3. Characteristic uranium emission spectra for various group delay dispersion (GDD) values of the incident laser pulse.
Remotesensing 12 01281 g003
Figure 4. (a) Intensity of atomic (U I 591.54 nm) line and molecular (UO 593.55 nm) spectral band for various applied quadratic phase to incident laser pulse. The left inset is the laser beam profile before 10-m propagation through the air. (b) Frequency-resolved optical gating (FROG) traces and laser pulse parameters corresponding to the case of zero applied quadratic phase.
Remotesensing 12 01281 g004
Figure 5. Burn profiles recorded on a compact disc surface with respect to change in the quadratic phase of the incident laser pulse. The burn profiles are produced with 40 laser shots at the target position.
Remotesensing 12 01281 g005
Figure 6. (a) Time-resolved evolution of uranium spectrum recorded with a quadratic phase application of 900 fs2. (b) Intensity of atomic (U I 591.54 nm) and molecular (UO 593.55 nm) uranium laser-produced plasma (LPP) emission for the emission features shaded in (a).
Remotesensing 12 01281 g006
Figure 7. (a) Normalized probability of occurrence is shown in the histogram for each single laser shot. (b) Detection and false alarm probabilities compared in the receiver operating characteristic (ROC) curve.
Remotesensing 12 01281 g007
Figure 8. (a) Detection probabilities of U I and UO signal features with false alarm rates of 10% and 1%, respectively. (b) The spectra which result from averaging these numbers of shots for unity detection probability with fixed false alarm probabilities.
Remotesensing 12 01281 g008