Abstract
Prescribed fires have been applied in many countries as a useful management tool to prevent large forest fires. Knowledge on burn severity is of great interest for predicting post-fire evolution in such burned areas and, therefore, for evaluating the efficacy of this type of action. In this research work, the severity of two prescribed fires that occurred in “La Sierra de Uría” (Asturias, Spain) in October 2017, was evaluated. An Unmanned Aerial Vehicle (UAV) with a Parrot SEQUOIA multispectral camera on board was used to obtain post-fire surface reflectance images on the green (550 nm), red (660 nm), red edge (735 nm), and near-infrared (790 nm) bands at high spatial resolution (GSD 20 cm). Additionally, 153 field plots were established to estimate soil and vegetation burn severity. Severity patterns were explored using Probabilistic Neural Networks algorithms (PNN) based on field data and UAV image-derived products. PNN classified 84.3% of vegetation and 77.8% of soil burn severity levels (overall accuracy) correctly. Future research needs to be carried out to validate the efficacy of this type of action in other ecosystems under different climatic conditions and fire regimes.
1. Introduction
Wildfires are a natural phenomenon that have dramatically increased in number, extent and severity in the Mediterranean Basin due to huge territorial changes and global warming in recent decades, amongst other causes [1,2]. Satisfactory management policies that stimulate vegetation regeneration after fire and impede soil losses can only be derived from accurate maps of the impact of fire on vegetation and soil [3]. Burn severity refers to the effects of a fire on the environment, typically focusing on the loss of vegetation both above and below ground, but also including soil impacts [4]. Vegetation burn severity refers to the effect on vegetation including short- and long-term impacts [5], whereas soil burn severity mainly refers to the loss of organic matter in soil [6]. In this context, technical advances in both in situ evaluation of fire damage and post-fire regeneration monitoring must be a priority for management purposes in fire prone areas [7]. In recent years, new insights into geo-information technology have provided a great opportunity for evaluating fire effects in natural ecosystems at different scales with low field effort [8]. Although satellite images have been widely applied in this field, they might show certain weaknesses, such as low temporal resolution not controlled by the user, cloud cover or multispectral spatial resolution >1 m. This could limit their use in post-fire monitoring studies requiring very high spatial resolution, such as those evaluating changes in soil organic carbon or soil structure [9,10]. Unmanned Aerial Vehicles (UAV) may assist in these situations. Their low speed and flight altitude enable very high spatial resolution images (less than 0.02 m) to be obtained [11]. Indeed, they are usually less costly than other techniques when used in small zones. Other relevant advantages are the possibility of user-programing flights for data collection in target areas and flexibility of type of sensor installed on board (for example, RedGreenBlue (RGB), multispectral or Laser Imaging Detection and Ranging (LiDAR)) [12].
Prescribed burnings are based on an intentional and controlled use of fire. Thus, fire is introduced with an established duration, determinate intensity and fixed rate of spread under specific environmental conditions [13]. Usually, the specific conditions are different to those encountered during the fire season. Consequently, prescribed burnings mainly impact surface fuels and understory vegetation, conversely to wildfires [13]. In prescribed burnings, vegetation is managed by controlling fire intensity to remove different percentages of fuel according to specific objectives [14]. The real intensity of fire and amount of consumed fuel are the key parameters when analysing the efficacy of this action [15]. Both factors are directly linked to burning severity and their assessment is essential to anticipate post-fire evolution. In general, spatial patterns of burn severity after prescribed burning may be highly heterogeneous depending on plant community composition prior to fire, fuel distribution and environmental characteristics during burning. In such cases, images with a spatial resolution of less than 1 m, like those collected by UAVs, can be used to measure the efficacy of both prescribed burnings and post-fire management actions [11]. Although few studies have been carried out to prove the usefulness of sensors onboard UAVs in the evaluation of post-fire vegetation damage and recovery [16,17], we are convinced of their usefulness.
Regarding the methodology used to classify multispectral images and estimate burn severity, Artificial Neural Networks (ANNs) demonstrated their suitability for classifying objects in forest science [18,19,20]. ANNs are a type of artificial intelligence (AI) modeled on the biological neural networks of the human brain, which are able to model any linear or non-linear relationships between a set of input and output variables [21]. Thus, an ANN is based on highly interconnected processing elements which simulate the basic functions of human neurons [21].
In this context, our goal is to evaluate the viability of images obtained by a multispectral sensor on board a UAV to estimate vegetation and soil burn severity after prescribed burning using an ANN-based classifier.
2. Materials and Methods
2.1. Study Area
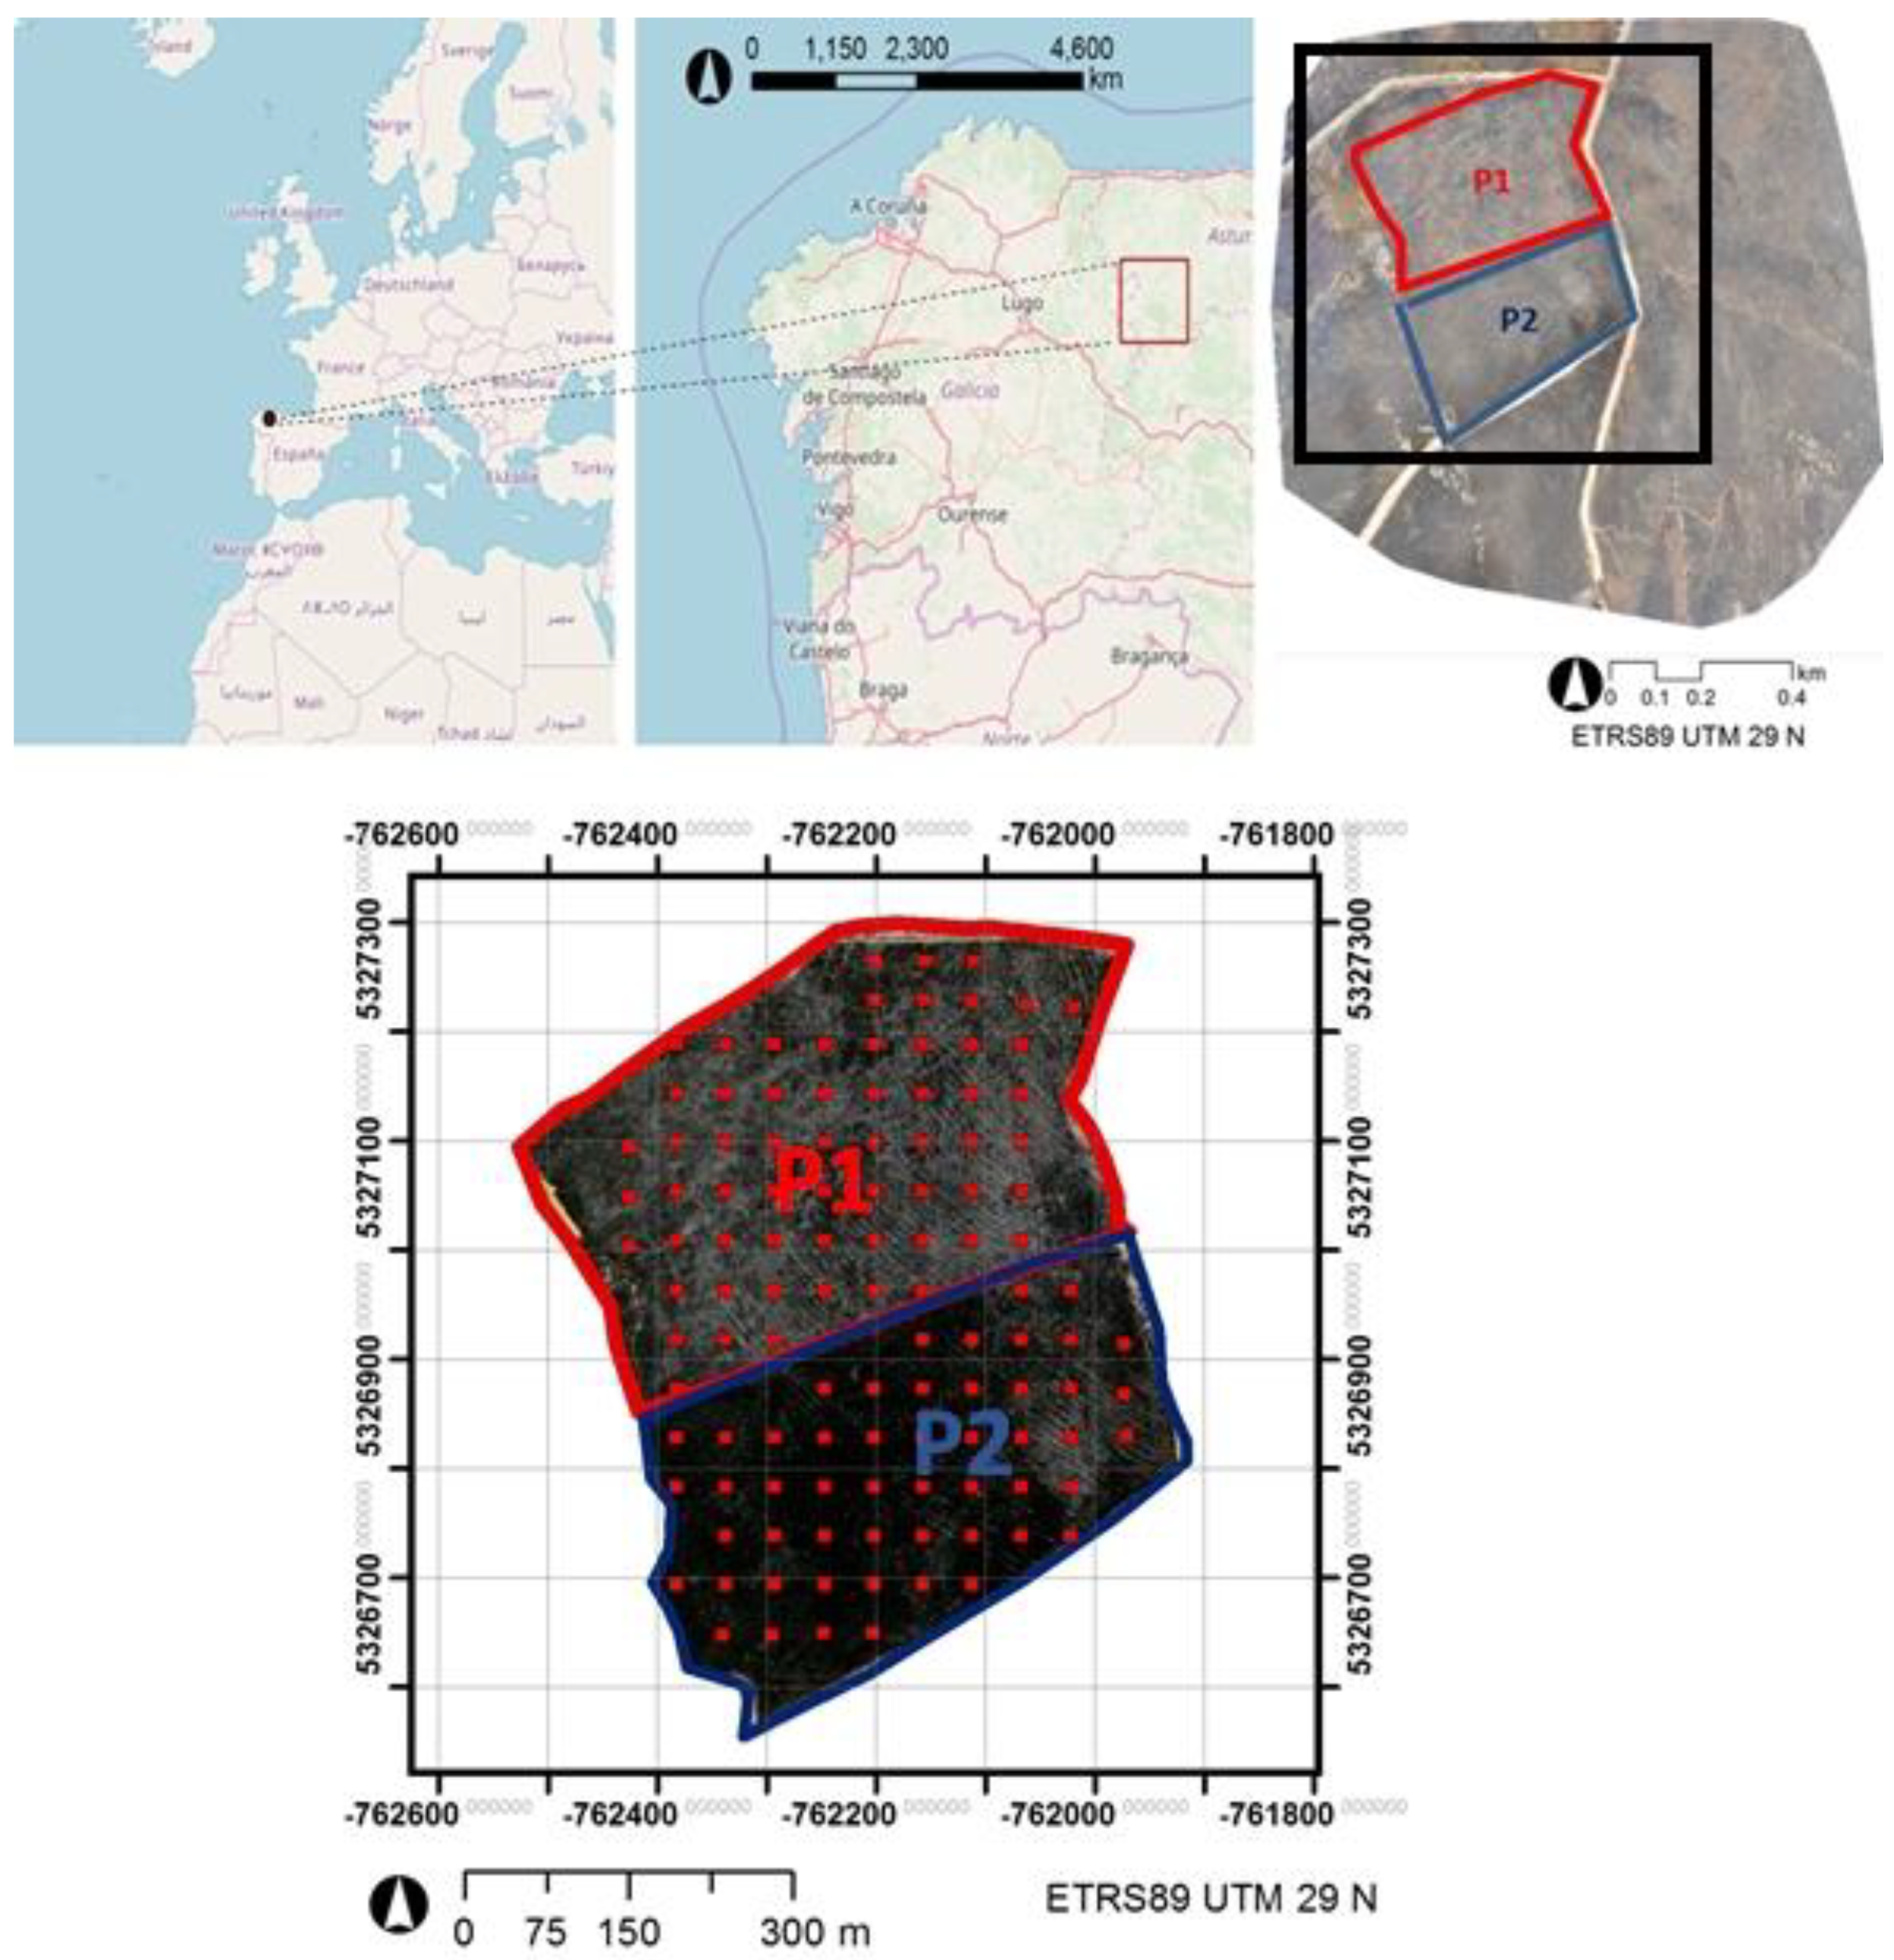
Our study area is located in Sierra de Uría (Asturias, Spain). The Principality of Asturias is a Spanish territory with a significant occurrence of forest fires. In the period 2015–2019, 6000 fires affecting a total of 65,000 ha occurred in the area. Two prescribed fires were conducted in adjacent 7 ha, plots located at 43°6′17″N, 6°50′52″ W (Figure 1). The first prescribed fire was performed on the 8th of October 2017 and the second, a week later. The area lies at an average altitude of 1170 m above sea level, with a 10% slope, facing west. There are no important topographic variations in slope or aspect in either plot. Similarly, the study area is fairly homogeneous regarding vegetation type. It comprises quartzite and highly organic stony ground with Umbrisol soils. The current vegetation is heath-gorse belonging to the Pterosparto-Ericetum aragonensis subas. ulicetosum breoganii nova association. The flora composition in these shrublands consists of Spanish heather (Erica australis subsp. aragonensis), bell heather (Erica cinerea and, Erica umbellate), common heather (Calluna vulgaris) and St Dabeoc’s heather (Daboecia cantabrica), with western gorse (Ulex gallii subsp. breoganii), prickly broom and winged broom (Pterospartum tridentatum subsp. lasianthum). It corresponds to a Rothermel’s fuel model 6 (0.5–1.2 m) [22].
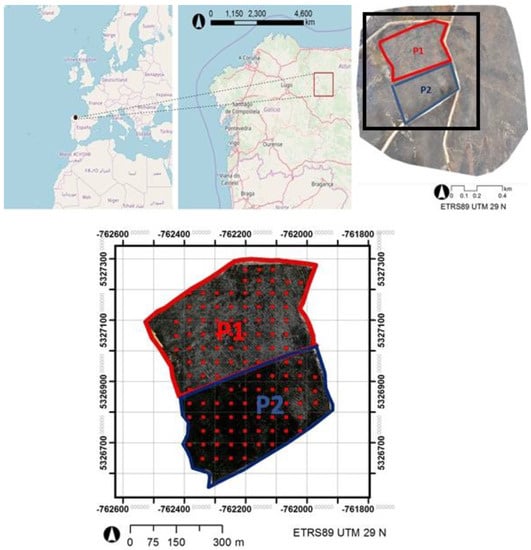
Figure 1.
Upper: Location of the study area (left and centre) and field plots for the prescribed burns (right). Lower: Detail of field plots.
2.2. Materials
An FV8 octocopter (from ATyges), weighing 3.5kg with a maximum payload mass of 1.5 kg, was used as UAV. We collected post-fire images using a Parrot Sequoia with a multispectral camera with four 1.2megapixel monochrome sensors. Each of the four sensors acquires data at a different wavelength range: green (530–570 nm), red (640–680 nm), red-edge (730–740 nm) and near-infrared (NIR, 770–810 nm). The horizontal field of view (HFOV) of the multispectral camera is 70.6°; the vertical field of view (VFOV), 52.6°, and the diagonal field of view (DFOV), 89.6°, the focal length being equal to 4 mm. At a mean flight altitude of 120 m, the ground sampling distance (GSD) was 14.4 cm. The multispectral data was georeferenced from the computed image positions based on an onboard Global Navigation Satellite System (GNSS). Mean geolocation accuracy (m) was x, 1.04; y, 1.04; and z, 1.27. In addition, an irradiance sensor recording the specific light condition was installed on the UAV facing upwards. Each image capture adjustment is kept in a metadata text file together with the irradiance sensor data.
During the pre-processing stage, the absolute reflectance values were obtained using Pix4D software. Thus, four surface reflectance images (GSD = 20cm) were achieved as output. The UAV covered a flight area of 0.9151 km2 (91.5137 ha). The flight took place approximately one month after burning (7th November 2017).
2.3. Methods
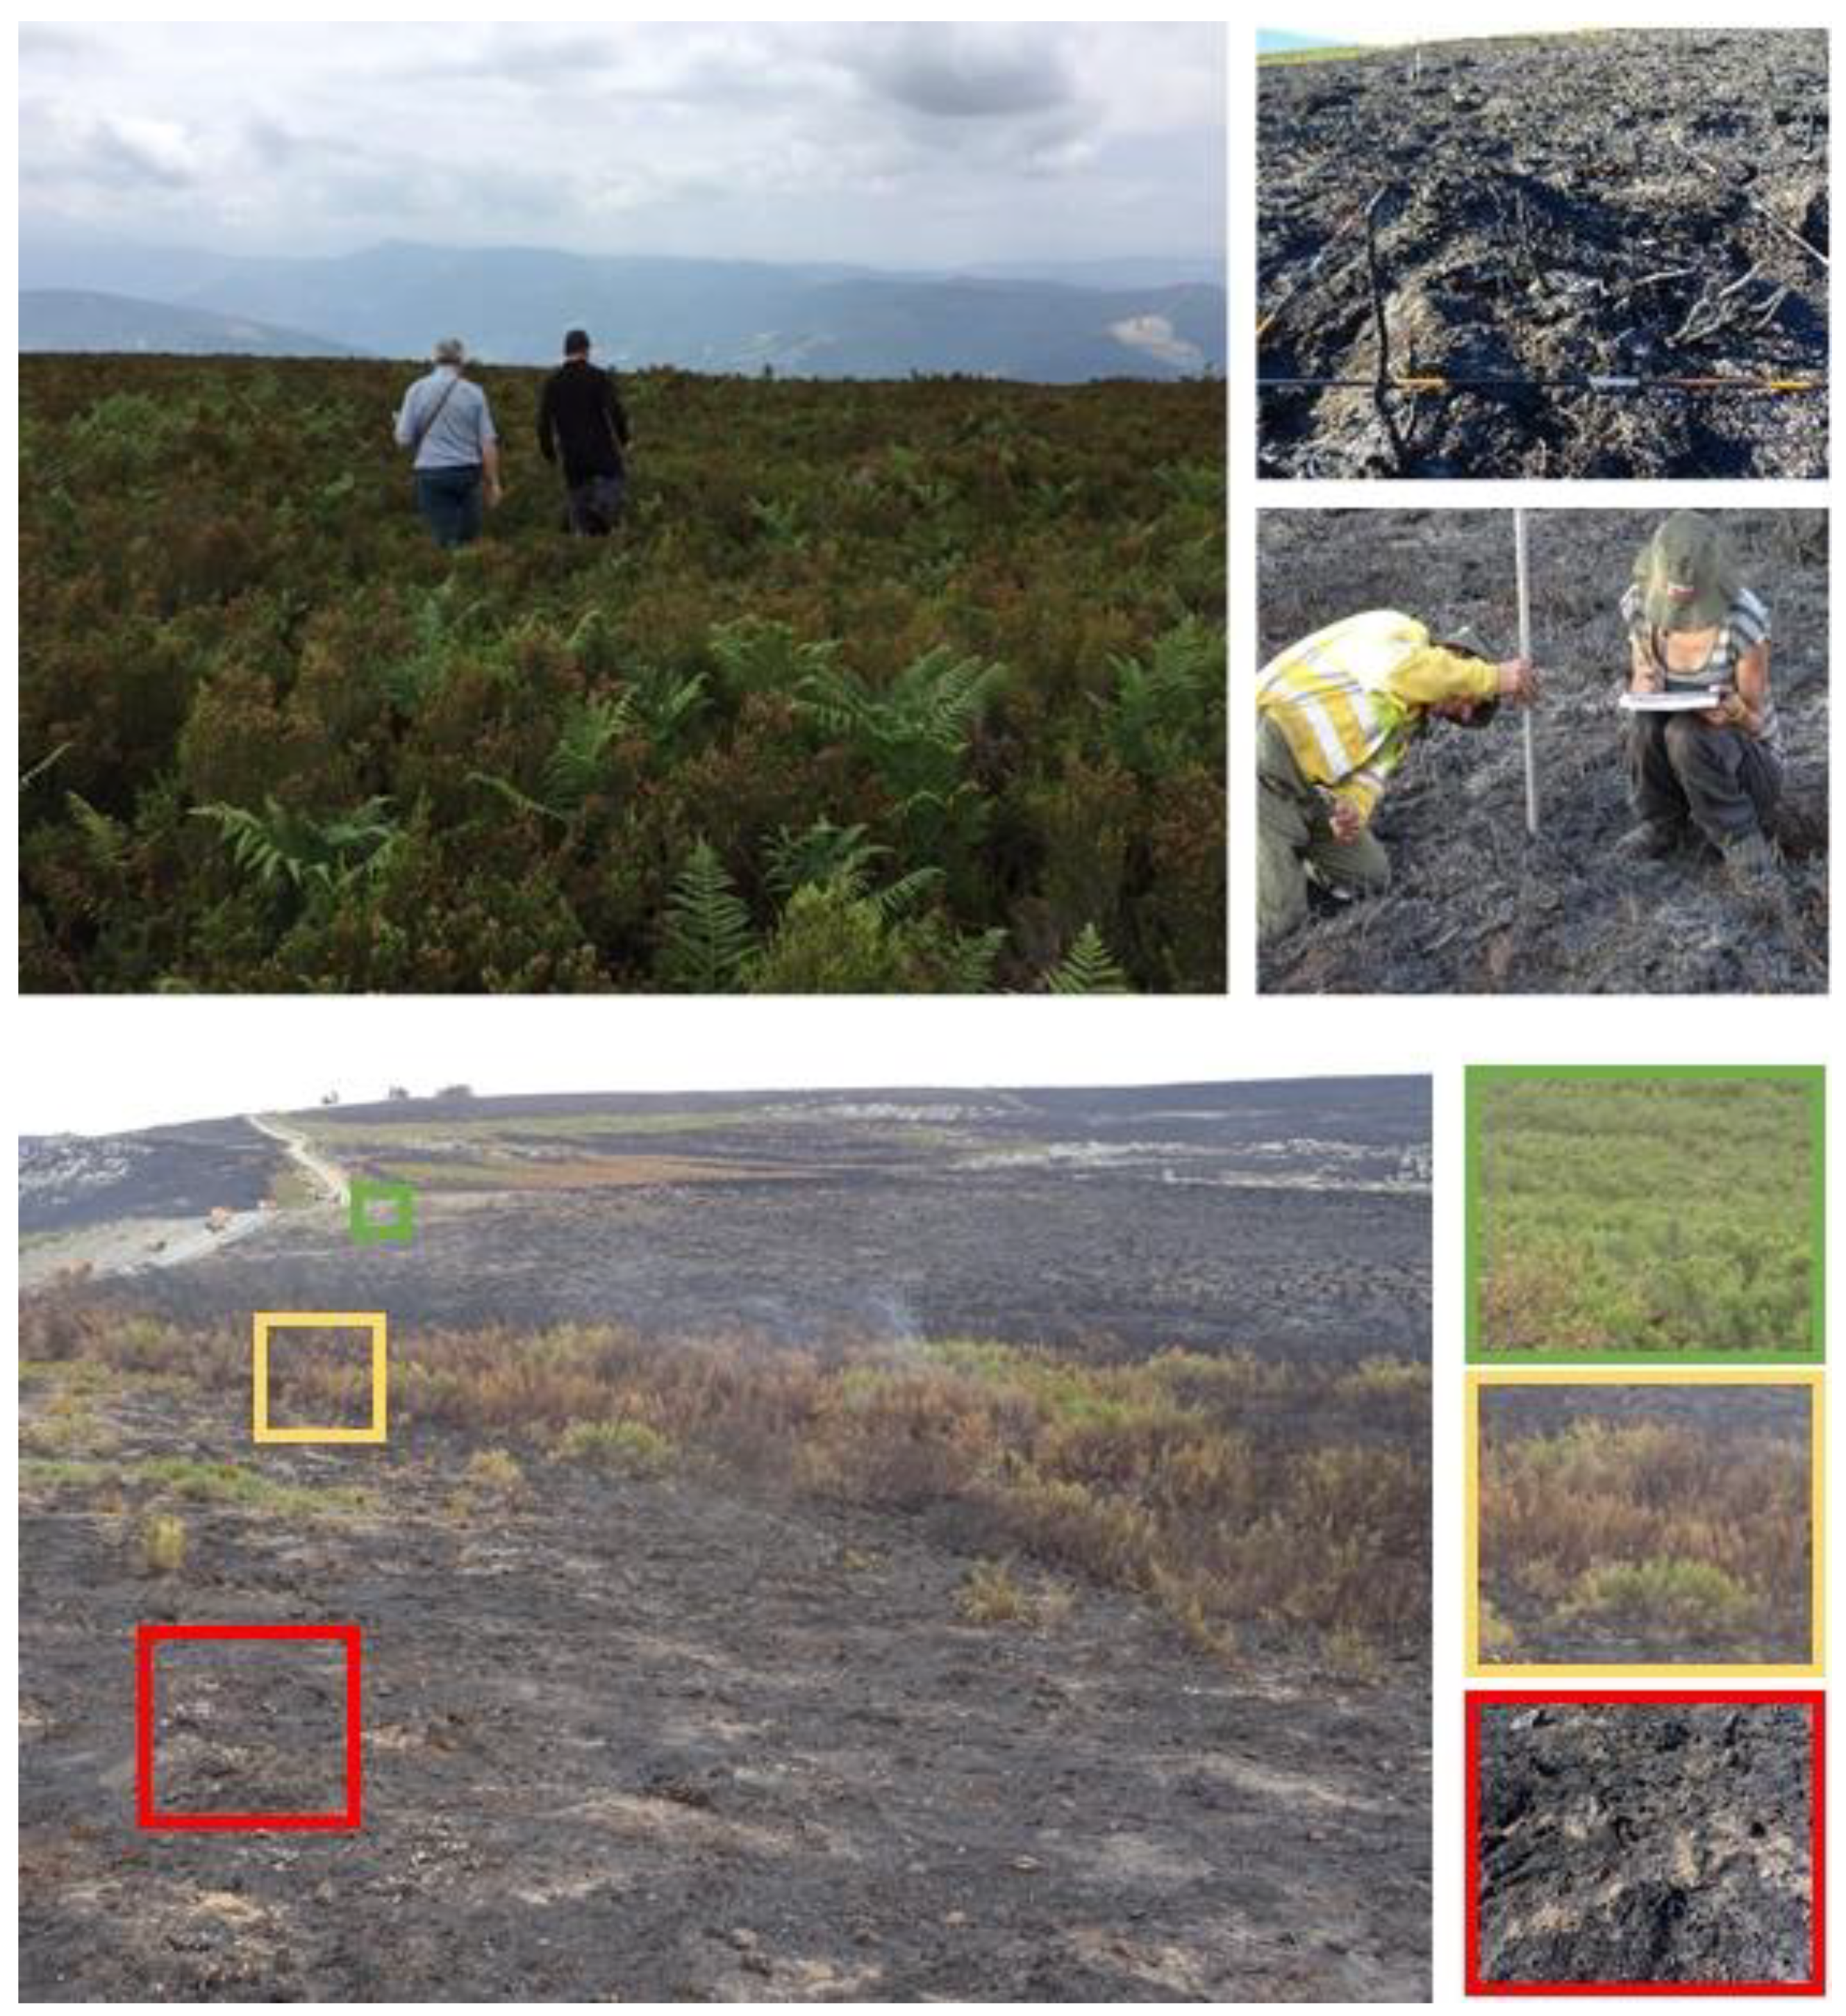
A set of 153 1 m 1 m plots were set up in the field to estimate soil and vegetation burn severity and positions were GPS recorded (see Figure 1: lower). Field plots were systematically distributed following a square grid. We established 88 plots in high burn severity, 25 in moderate-low burn severity, and 40 in non-burned areas. We adapted the method proposed by Key and Benson [23] to quantify burn severity in each plot. For each stratum (substrate and vegetation) we rated different parameters from 0 (non-burned) to 3 (maximum burn severity) and averaged them to obtain a single value per stratum. The following variables were used to assess burn severity: light fuel consumed, as well as char and color for the substrate; and foliage consumed and stem diameter for the vegetation stratum. Figure 2 shows some pictures before and after the prescribed burn and examples of the different burn severity levels (high, moderate-low and non-burned).
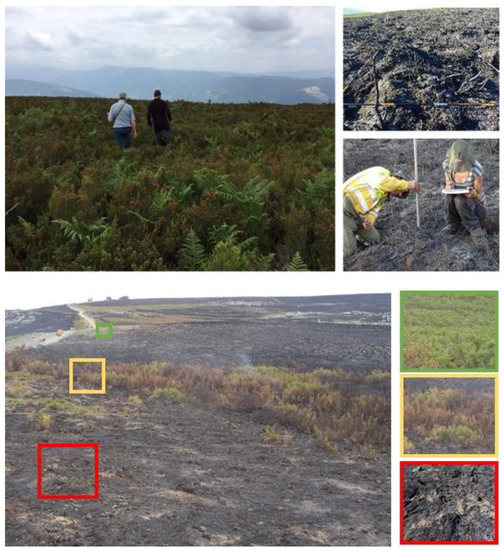
Figure 2.
Upper: Study area before (left) and after the prescribed burn (right). Lower: Details of the three levels of burn severity: non-burned (green), moderate-low (yellow) and high (red).
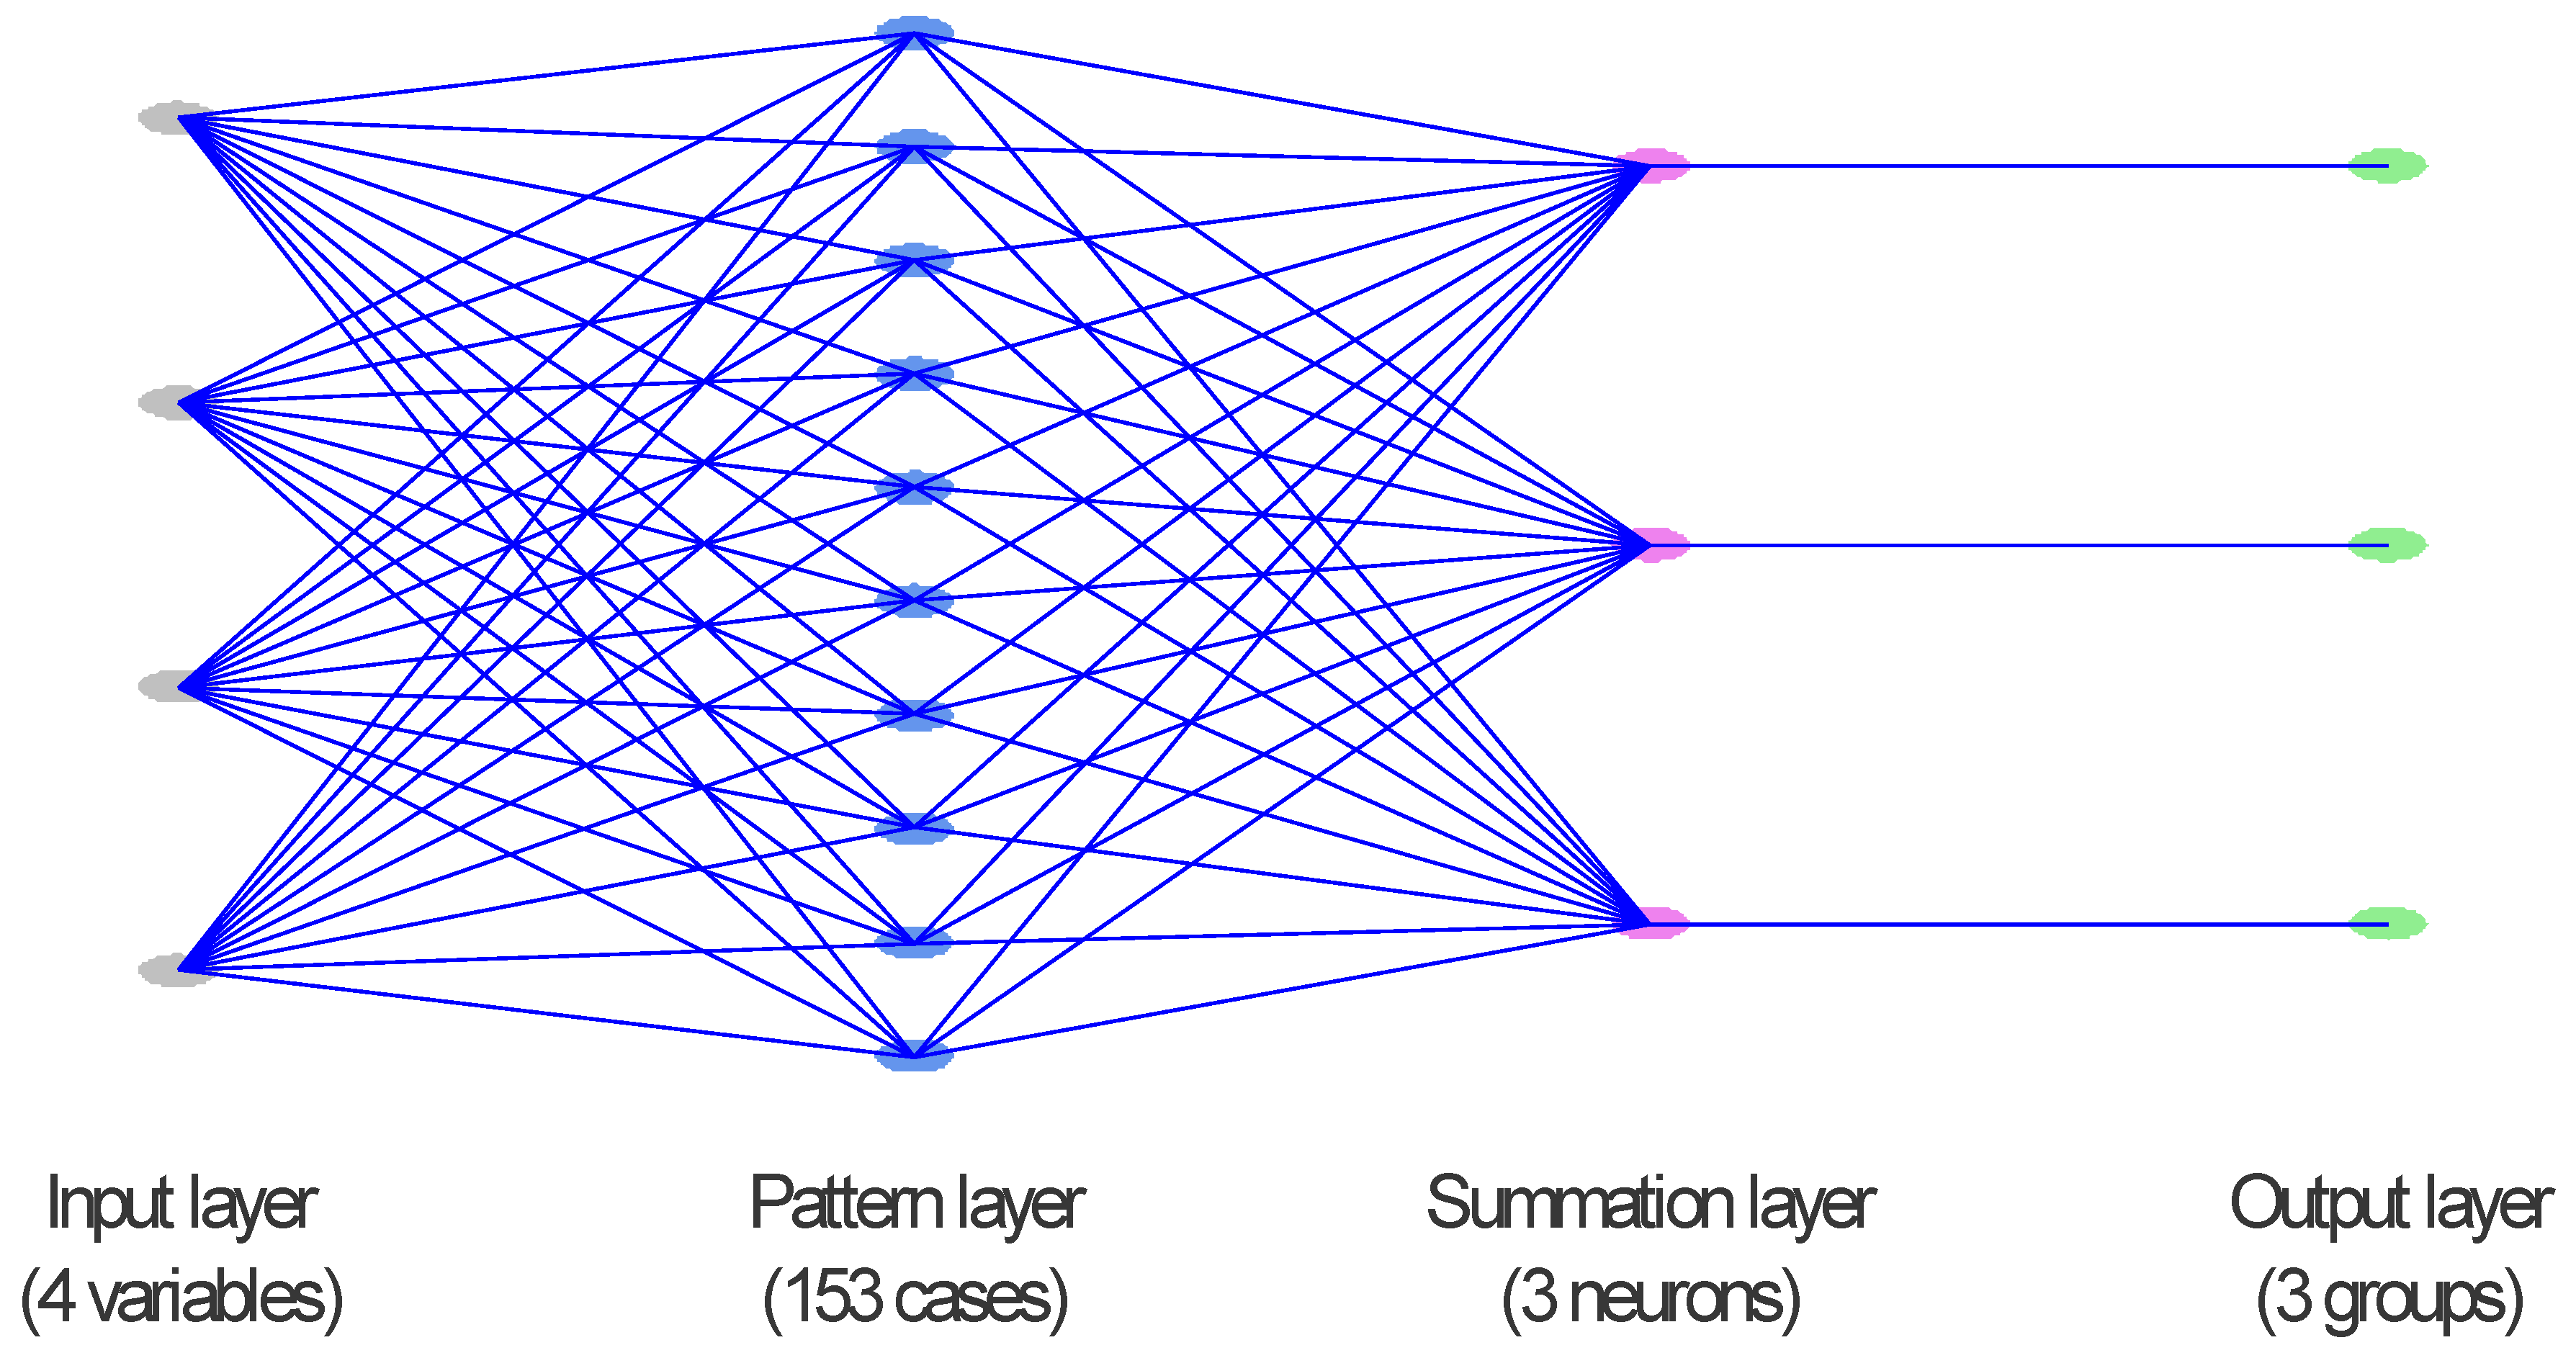
As the time between the prescribed burning was very short, the datasets were analyzed jointly using a specific type of ANN: Probabilistic Neural Network algorithm (PNN). This is a non-parametric method to classify observations, which has proved to be highly accurate in previous remotely sensed applications [24,25,26]. PNN-based classifiers have shown higher accuracy than back propagation neural networks (BpNNs), radial basis functions (RBFs) and multi perceptron neural networks (MLPs) [27,28]. The PNN classifiers do not make assumptions about the nature of the distribution of variables, as they are non-parametric algorithms [29,30]. They construct the assumption of the density function of each class using a Parzen window, an excellent kernel-based method that weighs observations in each group in relation to distance from the specified location [31]. Usually, the effect of the Parzen weight function can be optimized by jackknifing or can be defined by the user [29]. Figure 3 shows a basic scheme of the PNN structure developed in this study, consisting of (1) an input layer including four neurons (our four input variables: green, red, red-edge and NIR data), (2) a pattern layer including 153 neurons (the samples used to train the network as we used jackknifing), (3) a summation layer including three neurons (our outputs: high, moderate-low burn severity levels and non-burned) and (4) an output layer with a binary neuron for each output [24].
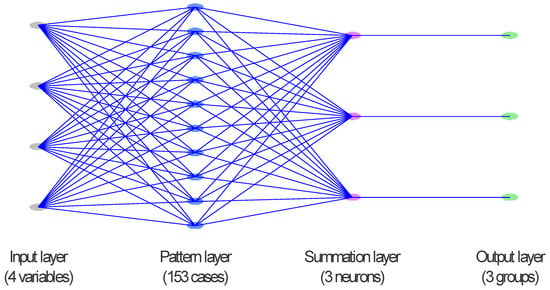
Figure 3.
Probabilistic Neural Network classifier developed in the study.
Basically, the input layer feeds the neurons of the pattern layer. It provides the next layer with the information from the four spectral bands of the UAV. These values, denoted by X1 through X4, are then standardized by subtracting the sample mean of the 153 training cases and dividing by the sample standard deviation. From these standardized values, the pattern layer builds an activation function to estimate the probability density function for each group. In this network, the activation function quantifies the contribution of the i-th value in the training case to the estimate the density function for group j and is given by:
Next, the estimates of the probability density function are transferred to the next layer. The summation layer puts the information from the 153 training cases together, with misclassification costs and prior probabilities, thus obtaining a score for each group. Allowing nj to represent the number of observations in the training set belonging to group j, the estimated density function for group j at location X is proportional to:
Finally, these scores enable the binary neuron in the output layer corresponding to the group with the largest score to be turned on and all other output neurons are turned off.
We trained the PNN using jackknifing. Jackknifing removes one sample at a time from the training set (n = 153), determining how often it is correctly classified when it is not used to estimate the group scores. We used jackknifing rather than training and validation sets because of the relatively low number of samples we had (in particular, low-moderate samples). All the computations were made using Statgraphics Centurion software.
3. Results
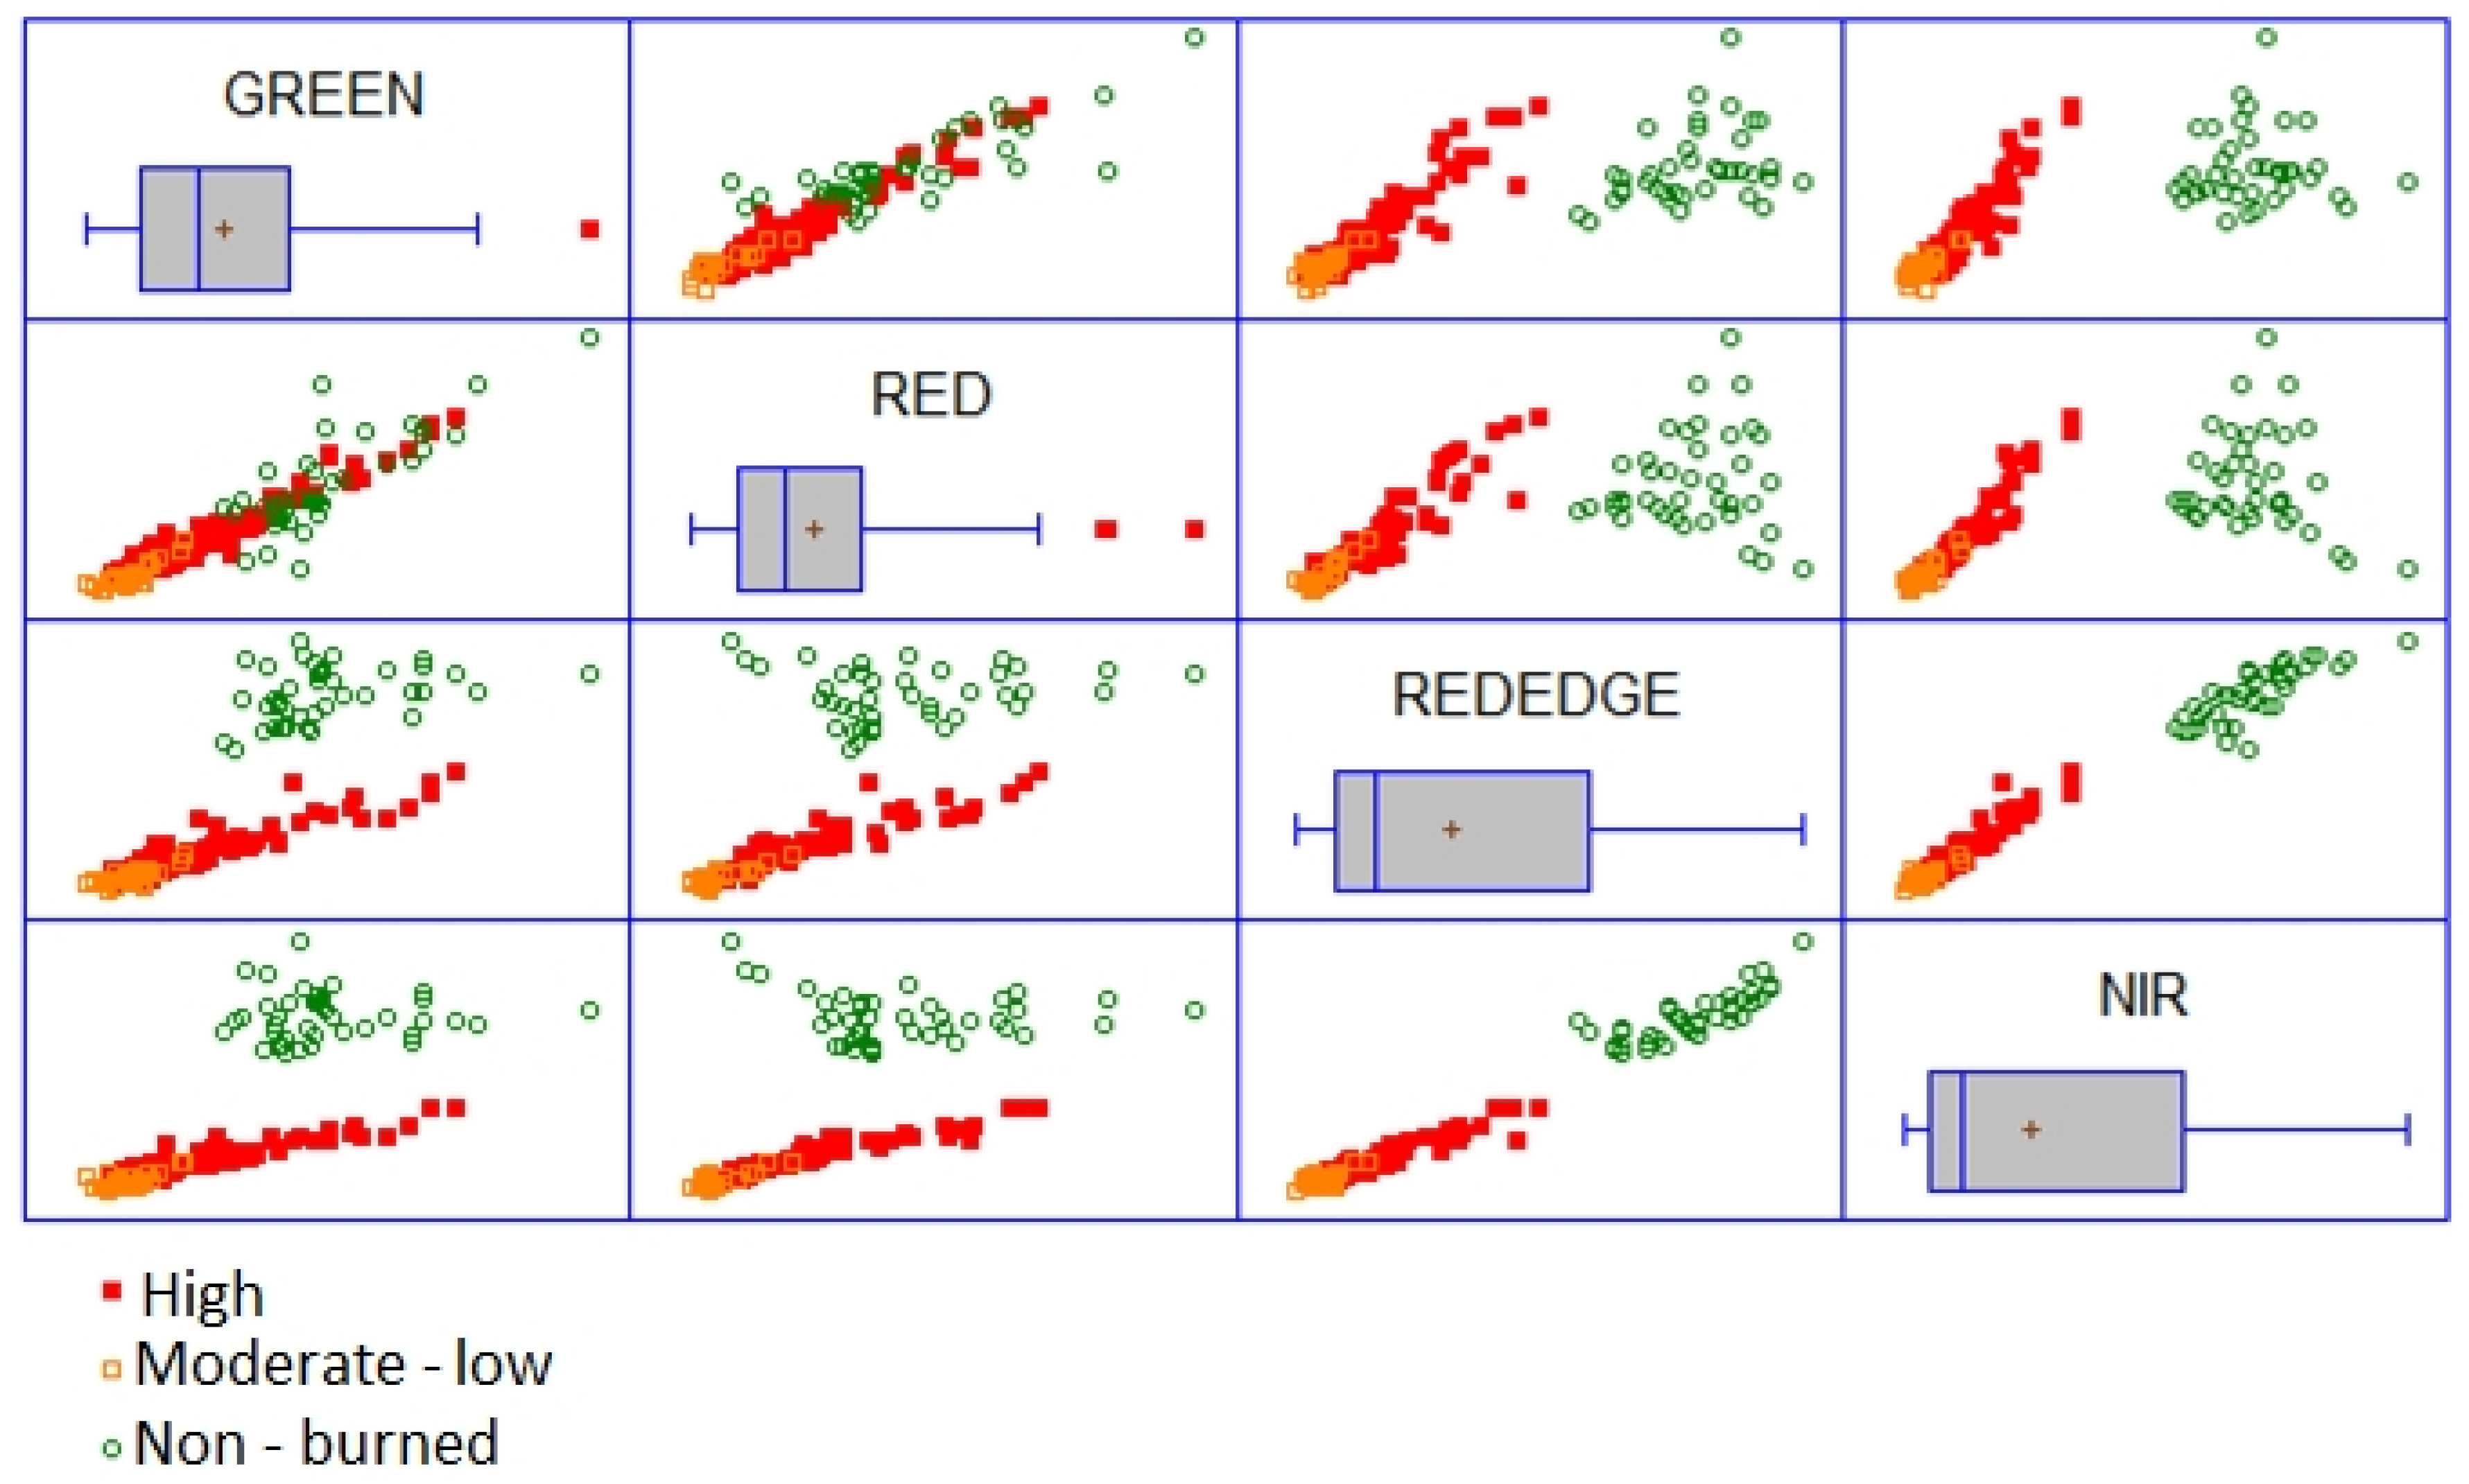
Based on the scatterplots in Figure 4 and partial correlation coefficients in Table 1, a linear relationship and high correlation were found for red-edge and NIR bands and for green and red bands. However, low separability between non-burned and burned samples can be observed in the green versus red scatterplot, whereas it is higher in the red-edge versus NIR. On the other hand, the scatterplots for green versus red-edge, green versus red, green versus NIR, and red versus NIR bands showed little confusion between burn severity levels (Figure 4).
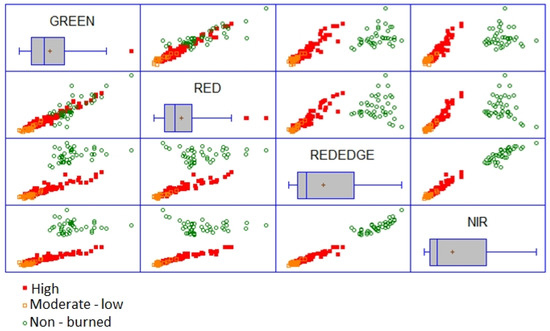
Figure 4.
Matrix plot including the scatterplots among the four Parrot Sequoia spectral bands taking into account the different burn severity levels (high, moderate-low and non-burned).

Table 1.
Partial correlation coefficient, intercept and slope of the linear regression among the four Unmanned Aerial Vehicle (UAV) spectral bands for each burn severity class (high, moderate-low and non-burned).
Partial correlation coefficients between each pair of UAV spectral bands are shown in Table 1. To complement this information, Table 1 also displays the coefficients (intercept and slope) of the linear regression among the four UAV spectral bands for each burn class (high burn severity, moderate-low burn severity, and non-burned).
Table 2 shows the percentage of vegetation and soil burn severity levels correctly classified (overall accuracy) by the PNN using the total data set. More accurate results were obtained for vegetation burn severity (84.31%) than for soil burn severity (77.78%). Percentages of accuracy for moderate-low severity levels were lower than for high severity levels (except for producer accuracy in vegetation burn severity). PNN discriminated categorically non-burned from burned areas (the percentage of correct classification for the non-burned class was 100.0%).

Table 2.
Overall, producer (PA), user (UA) accuracy and Kappa statistic for vegetation and soil burn severity levels.
4. Discussion
This research demonstrated the usefulness of UAV multispectral data for distinguishing soil and vegetation burn severity levels shortly after prescribed burnings. In this sense, our results agree with those from previous research papers [11,16,17], proving the efficacy of UAV multispectral data for analyzing fire damage. For instance, different levels of burn severity have been successfully determined in boreal forests on the basis of UAV imagery [17]. We tested an initial assessment of burn severity (as flights were conducted approximately one month after burning), but future studies should evaluate the persistence of the effects of prescribed burning.
Red, red-edge and NIR bands were the most useful spectral wavelengths to discriminate burn severity levels. Many studies have already validated the suitability of red and NIR bands for this purpose (e.g. [32]), whereas the red-edge wavelength is becoming increasingly useful as a key product in fire ecology applications [33,34]. In particular, spectral indices obtained from the Sentinel-2 MultiSpectral Instruments (MSI) have been successfully used for discriminating vegetation burn severity in Mediterranean ecosystems, the most suitable being those based on the red edge band which can measure variations in chlorophyll content, and NIR, mainly related to variations in leaf structure [33]. In this sense, a promising index based on Sentinel-2 MSI red-edge bands has been proposed to estimate the burned area affected by forest fires [34]. Our results highlighted that red-edge band at high spatial resolution could be sensitive not only to vegetation burn severity, but also to soil burn severity. Moreover, it has already been demonstrated that satellite products, like those derived from Landsat 7 ETM+, allowed for evaluating changes in soil properties affected by forest fires at high severity level [6], which agree with our results (see Table 2). We did not find other previous studies relating UAV multispectral data to soil burn severity. It is worth highlighting that this is a preliminary work based on the original spectral bands of UAV imagery. We recommend future studies to test the advantages of using spectral indices based on UAV multispectral imagery, or even texture metrics.
We distinguished two burn severity levels, high and low-moderate, due to the fact differences between low and moderate burn severity were very small in the field sampling, as has occurred in other similar studies [35,36,37,38]. Furthermore, from a management point of view, the priority areas to consider specific restoration activities are those affected by high burn severity [39]. Thus, accurate identification of these areas is key for post-fire management purposes [40].
Despite the promising results we obtained in this study, the use of red-edge bands of multispectral sensors on board UAVs to discriminate vegetation and soil burn severity should be further validated in other study areas with different vegetation types, climatic conditions and fire regimes. Similarly, the persistence in time of the scar in the UAV image should be tested to define the maximum time after prescribed burning to conduct the UAV flight. Though the PNN we used has shown a good performance, other machine learning algorithms such as Random Forest have also proved their validity when working with remotely sensed data [41,42,43,44]. Both machine learning methods (ANNs and RFs) tend to be more powerful than conventional classifiers, and both can be used as variable selection tools to identify informative variables based on the network’s performance [45] or variable importance score [46,47]. Therefore, in future research, we recommend comparing the performance of both algorithms when estimating burn severity from UAV multispectral data. Finally, we should underline that our study area has very homogeneous characteristics. A detailed study of the applicability of the proposed method in more heterogeneous soils should be conducted in the future.
5. Conclusions
Multispectral images obtained with a Parrot SEQUOIA camera on board a UAV, in combination with artificial intelligence-based methods, allow the successful evaluation of soil and vegetation burn severity at very high spatial resolution after prescribed burnings. These results can contribute to the accurate evaluation of the usefulness of prescribed burning. Nevertheless, further research is required to extrapolate the conclusions from this initial study to other forest fire regimes and different ecosystems.
Author Contributions
Conceptualization, A.F.-M.; methodology, A.F.-M.; validation, A.F.-M. and E.M.; writing—original draft preparation, L.A.P.-R. and A.F.-M; writing—review and editing, C.Q. and S.S.-S.; supervision, A.F.-M.; project administration, L.C. and S.S.-S.; funding acquisition, S.S.-S. and L.C. All authors have read and agreed to the published version of the manuscript.
Funding
This work is part of the FIRESEVES (AGL2017-86075-C2-1-R) project funded by the Spanish Ministry of Economy and Competitiveness and the European Regional Development Fund, and SEFIRECYL (LE001P17), funded by the government of Castile and León autonomous region.
Acknowledgments
The authors wish to thank the company Heligráficas for their cooperation in the study.
Conflicts of Interest
The authors declare no conflict of interest.
References
- Poursanidis, D.; Chrysoulakis, N. Remote Sensing, natural hazards and the contribution of ESA Sentinels missions. Remote Sens. Appl. Soc. Environ. 2017, 6, 25–38. [Google Scholar] [CrossRef]
- Quintano, C.; Fernández-Manso, A.; Calvo, L.; Marcos, E.; Valbuena, L. Land surface temperature as potential indicator of burn severity in forest Mediterranean ecosystems. Int. J. Appl. Earth Obs. 2015, 36, 1–12. [Google Scholar] [CrossRef]
- Lentile, L.; Holden, Z.; Smith, A.; Falkowski, M.; Hudak, A.; Morgan, P.; Lewis, S.; Gessler, P.; Benson, N. Remote sensing techniques to assess active fire characteristics and post-fire effects. Int. J. Wildland Fire 2006, 15, 319–345. [Google Scholar] [CrossRef]
- Meng, R.; Zhao, F. A Review for Recent Advances in Burned Area and Burn Severity Mapping. In Remote Sensing of Hydrometeorological Hazards; Petropoulos, G.P., Islam, T., Eds.; Taylor & Francis: Abingdon, UK, 2017. [Google Scholar]
- Jain, T.B.; Pilliod, D.; Graham, R.T. Tongue-tied. Confused meanings for common fire terminology can lead to fuels mismanagement. A new framework is needed to clarify and communicate the concepts. Wildfire 2004, 4, 22–26. [Google Scholar]
- Marcos, E.; Fernández-García, V.; Fernández-Manso, A.; Quintano, C.; Valbuena, L.; Tárrega, R.; Luis-Calabuig, E.; Calvo, L. Evaluation of Composite Burn Index and Land Surface Temperature for Assessing Soil Burn Severity in Mediterranean Fire-Prone Pine Ecosystems. Forests 2018, 9, 494. [Google Scholar] [CrossRef]
- Tessler, N.; Wittenberg, L.; Greenbaum, N. Vegetation cover and species richness after recurrent forest fires in the Eastern Mediterranean ecosystem of Mount Carmel, Israel. Sci. Total Environ. 2016, 572, 1395–1402. [Google Scholar] [CrossRef]
- Chu, T.; Guo, X.; Takeda, K. Remote sensing approach to detect post-fire vegetation regrowth in Siberian boreal larch forest. Ecol. Indic. 2016, 62, 32–46. [Google Scholar] [CrossRef]
- Zhang, J.; Hu, J.; Lian, J.; Fan, Z.; Ouyang, X.; Ye, W. Seeing the forest from drones: Testing the potential of lightweight drones as a tool for long-term forest monitoring. Biol. Conserv. 2016, 198, 60–69. [Google Scholar] [CrossRef]
- Matese, A.; Toscano, P.; Di Gennaro, S.F.; Genesio, L.; Vaccari, F.P.; Primicerio, J.; Belli, C.; Zaldei, A.; Bianconi, R.; Gioli, B. Intercomparison of UAV, Aircraft and Satellite Remote Sensing Platforms for Precision Viticulture. Remote Sens. 2015, 7, 2971–2990. [Google Scholar] [CrossRef]
- Fernández-Guisuraga, J.M.; Sanz-Ablanedo, E.; Suárez-Seoane, S.; Calvo, L. Using Unmanned Aerial Vehicles in Postfire Vegetation Survey Campaigns through Large and Heterogeneous Areas: Opportunities and Challenges. Sensors 2018, 18, 586. [Google Scholar] [CrossRef]
- Kellenberger, B.; Marcos, D.; Tuia, D. Detecting mammals in UAV images: Best practices to address a substantially imbalanced dataset with deep learning. Remote Sens. Environ. 2018, 216, 139–153. [Google Scholar] [CrossRef]
- Fernandez-Carrillo, A.; McCaw, L.; Tanase, M.A. Estimating prescribed fire impacts and post-fire tree survival in eucalyptus forests of Western Australia with L-band SAR data. Remote Sens. Environ. 2019, 224, 133–144. [Google Scholar] [CrossRef]
- Fernandes, P.M.; Davies, G.M.; Ascoli, D.; Fernandez, C.; Moreira, F.; Rigolot, E.; Stoof, C.R.; Vega, J.A.; Molina, D. Prescribed burning in southern Europe: Developing fire management in a dynamic landscape. Front. Ecol. Environ. 2013, 11, E4–E14. [Google Scholar] [CrossRef]
- Prichard, S.J.; Kennedy, M.C.; Wright, C.S.; Cronan, J.B.; Ottmar, R.D. Predicting forest floor and woody fuel consumption from prescribed burns in southern and western pine ecosystems of the United States. Forest Ecol. Manag. 2017, 405, 328–338. [Google Scholar] [CrossRef]
- McKenna, P.; Erskine, P.D.; Lechner, A.M.; Phinn, S. Measuring fire severity using UAV imagery in semi-arid central Queensland, Australia. Int. J. Remote Sens. 2017, 38, 4244–4264. [Google Scholar] [CrossRef]
- Fraser, R.H.; van der Sluijs, J.; Hall, R.J. Calibrating Satellite-Based Indices of Burn Severity from UAV Derived Metrics of a Burned Boreal Forest in NWT, Canada. Remote Sens. 2017, 9, 279. [Google Scholar] [CrossRef]
- Vega-Isuhuaylas, L.A.; Hirata, Y.; Ventura-Santos, L.C.; Serrudo-Torobeo, N. Natural forest mapping in the Andes (Peru): A comparison of the performance of machine-learning algorithms. Remote Sens. 2018, 10, 782. [Google Scholar] [CrossRef]
- Xu, C.; Manley, B.; Morgenroth, J. Evaluation of modelling approaches in predicting forest volume and stand age for small-scale plantation forests in New Zealand with RapidEye and LiDAR. Int. J. Appl. Earth Obs. Geoinf. 2018, 73, 386–396. [Google Scholar] [CrossRef]
- García-Hidalgo, M.; Blázquez-Casado, A.; Águeda, B.; Rodríguez, F. Stand types discrimination comparing machine-learning algorithms in Monteverde, Canary Islands. For. Syst. 2018, 27, 6. [Google Scholar] [CrossRef]
- Farifteh, J.; van der Meer, F.; Atzberger, C.; Carranza, E. Quantitative analysis of salt affected soil reflectance spectra: A comparison of two adaptive methods (PLSR and ANN). Remote Sens. Environ. 2007, 110, 59–78. [Google Scholar] [CrossRef]
- Rothermel, R.C. A mathematical model for fire spread predictions in wildland fires. USDA For. Ser. Res. Pap. INT 1972, 115. [Google Scholar]
- Key, C.H.; Benson, N.C. Landscape Assessment (LA). FIREMON: Fire Effects Monitoring and Inventory System. Gen. Tech. Rep. RMRS-GTR-164-CD; U.S. Department of Agriculture, Forest Service, Rocky Mountain Research Station: Fort Collins, CO, USA, 2006. [Google Scholar]
- Zhang, Y.; Wu, L.; Neggaz, N.; Wang, S.; Wei, G. Remote-Sensing Image Classification Based on an Improved Probabilistic Neural Network. Sensors 2009, 9, 7516–7539. [Google Scholar] [CrossRef] [PubMed]
- Ashish, D.; Hoogenboom, G.; McClendon, R.W. Land-use classification of gray-scale aerial images using probabilistic neural networks. Trans. Am. Soc. Agric. Eng. 2004, 47, 1813–1819. [Google Scholar] [CrossRef]
- Upadhyay, A.; Singh, S.K. Classification of IRS LISS-III images using PNN. In Proceedings of the 2015 International Conference on Computing for Sustainable Global Development, INDIACom, New Delhi, India, 11–13 March 2015. No. 7100284. [Google Scholar]
- Foody, G.M. Thematic mapping from remotely sensed data with neural networks: MLP, RBF and PNN based approaches. J. Geogr. Syst. 2001, 3, 217–232. [Google Scholar] [CrossRef]
- Gang, L. Remote sensing image segmentation with probabilistic neural networks. Geo-Spat. Inf. Sci. 2005, 8, 28–32. [Google Scholar] [CrossRef]
- Specht, D.F. Probabilistic neural network. Neural Netw. 1990, 3, 109–118. [Google Scholar] [CrossRef]
- Duda, R.O.; Hart, P.E. Pattern Classification and Scene Analysis; John Wiley: Hoboken, NJ, USA, 1993. [Google Scholar]
- Jiang, Q.; Aitnouri, E.; Wang, S.; Ziou, D. Automatic Detection for Ship Target in SAR Imagery Using PNN-Model. Can. J. Remote Sens. 2000, 26, 297–305. [Google Scholar] [CrossRef]
- Chuvieco, E.; Martín, M.P.; Palacios, A. Assessment of different spectral indices in the red-near-infrared spectral domain for burned land discrimination. Int. J. Remote Sens. 2002, 23, 5103–5110. [Google Scholar] [CrossRef]
- Fernández-Manso, A.; Fernández-Manso, O.; Quintano, C. Sentinel-2A red-edge spectral indices suitability for discriminating burn severity. Int. J. Appl. Earth Obs. Geoinf. 2016, 50, 170–175. [Google Scholar] [CrossRef]
- Filipponi, F. BAIS2: Burned area index for Sentinel-2. Proceedings 2018, 2, 364. [Google Scholar] [CrossRef]
- Quintano, C.; Fernández-Manso, A.; Roberts, D.A. Burn severity mapping from Landsat MESMA fraction images and Land Surface Temperature. Remote Sens. Environ. 2017, 190, 83–95. [Google Scholar] [CrossRef]
- Miller, J.D.; Thode, A.E. Quantifying burn severity in a heterogeneous landscape with a relative version of the delta Normalized Burn Ratio (dNBR). Remote Sens. Environ. 2007, 109, 66–80. [Google Scholar] [CrossRef]
- Cocke, A.E.; Fulé, P.Z.; Crouse, J.E. Comparison of burn severity assessments using Di_erenced Normalized Burn Ratio and ground data. Int. J. Wildland Fire 2005, 14, 189–198. [Google Scholar] [CrossRef]
- Tanase, M.; de la Riva, J.; Pérez-Cabello, F. Estimating burn severity in Aragón pine forest using optical based indices. Can. J. For. Res. 2011, 41, 863–872. [Google Scholar] [CrossRef]
- Vega, J.A.; Fontúrbel, M.T.; Fernández, C.; Arellano, A.; Díaz-Raviña, M.; Carballas, T.; Martín, A.; González-Prieto, S.; Merino, A.; Benito, E. Acciones Urgentes Contra la Erosión en áreas Forestales Quemadas: Guía para su Planificación en Galicia; Andavira, D.L., Ed.; Xunta de Galicia: Santiago de Compostela, Spain, 2013; p. 139. ISBN 978-84-8408-716-8. [Google Scholar]
- Ireland, G.; Petropoulos, G.P. Exploring the relationships between post-fire vegetation regeneration dynamics, topography and burn severity: A case study from the Montane Cordillera Ecozones of Western Canada. Appl. Geogr. 2015, 56, 232–248. [Google Scholar] [CrossRef]
- Belgiu, M.; Drăguţ, L. Random forest in remote sensing: A review of applications and future directions. ISPRS J. Photogramm. Remote Sens. 2016, 114, 24–31. [Google Scholar] [CrossRef]
- Collins, L.; Griffioen, P.; Newell, G.; Mellor, A. The utility of Random Forests for wildfire severity mapping. Remote Sens. Environ. 2018, 216, 374–384. [Google Scholar] [CrossRef]
- Hultquist, C.; Chen, G.; Zhao, K. A comparison of Gaussian process regression, random forests and support vector regression for burn severity assessment in diseased forests. Remote Sens. Lett. 2014, 5, 723–732. [Google Scholar] [CrossRef]
- Meddens, A.J.H.; Kolden, C.A.; Lutz, J.A. Detecting unburned areas within wildfire perimeters using Landsat and ancillary data across the northwestern United States. Remote Sens. Environ. 2016, 186, 275–285. [Google Scholar] [CrossRef]
- Kimes, D.S.; Nelson, R.F.; Manry, M.T.; Fung, A.K. Review article: Attributes of neural networks for extracting continuous vegetation variables from optical and radar measurements. Int. J. Remote Sens. 1998, 19, 2639–2663. [Google Scholar] [CrossRef]
- Were, K.; Bui, D.T.; Dick, Ø.B.; Singh, B.R. A comparative assessment of support vector regression, artificial neural networks, and random forests for predicting and mapping soil organic carbon stocks across an afromontane landscape. Ecol. Indic. 2015, 52, 394–403. [Google Scholar] [CrossRef]
- Genuer, R.; Poggi, J.-M.; Tuleau, C. Random Forests: Some Methodological Insights. 2008. Available online: http://arxiv.org/pdf/0811.3619v1.pdf (accessed on 1 April 2020).
© 2020 by the authors. Licensee MDPI, Basel, Switzerland. This article is an open access article distributed under the terms and conditions of the Creative Commons Attribution (CC BY) license (http://creativecommons.org/licenses/by/4.0/).

