Article

Characterization of the High-Resolution Infrared Radiation Sounder Using Lunar Observations

1
Meteorological Institute, Department of Earth Sciences, Faculty of Mathematics, Informatics and Natural Sciences, Universität Hamburg, Bundesstraße 55, 20146 Hamburg, Germany
2
Independent Researcher, 85748 Garching, Germany
*
Author to whom correspondence should be addressed.
Remote Sens. 2020, 12(9), 1488; https://doi.org/10.3390/rs12091488
Submission received: 1 April 2020 / Revised: 30 April 2020 / Accepted: 3 May 2020 / Published: 7 May 2020

Abstract

:
The High-Resolution Infrared Radiation Sounder (HIRS) has been operational since 1975 on different satellites. In spite of this long utilization period, the available information about some of its basic properties is incomplete or contradictory. We have approached this problem by analyzing intrusions of the Moon in the deep space view of HIRS/2 through HIRS/4. With this method we found: (1) The diameters of the field of view of HIRS/2, HIRS/3, and HIRS/4 have the relative proportions of 1.4 ° to 1.3 ° to 0.7 ° with all channels; (2) the co-registration differs by up to 0.031 ° among the long-wave and by up to 0.015 ° among the shortwave spectral channels in the along-track direction; (3) the photometric calibration is consistent within 0.7% or less for channels 2–7 (1.2% for HIRS/2), similar values were found for channels 13–16; (4) the non-linearity of the short-wavelength channels is negligible; and (5) the contribution of reflected sunlight to the flux in the short-wavelength channels can be determined in good approximation, if the emissivity of the surface is known.

Graphical Abstract

1. Introduction

The High-resolution Infra-Red Radiation Sounder (HIRS) performs temperature/humidity sounding on satellites in sun-synchronous orbit since the seventies. The first HIRS instrument has been operated on Nimbus-6 from 1975 through 1983. Starting with its first evolution, HIRS/2, built by the Optical Division of ITT Aerospace, it is equipped with 19 infrared channels and forms part of the TOVS sounding instrument suite (TIROS [Television Infrared Observation Satellite] Operational Vertical Sounder) on NOAA-6 to -19. The channel frequencies of each instrument can be found at [1]. It flies as well on TIROS-N, Metop-A, and Metop-B. In all these years the instrument evolved to HIRS/4 and has accumulated a large set of observations relevant to the study of long-term variations of temperature and upper tropospheric humidity (UTH), amongst other things. A trend analysis over three decades of HIRS channel 12 measurements, trying to find changes in tropical UTH, is described for example in [2]. Their investigation, however, was hampered by significant inter-satellite biases, the reason for which was not easily identified. Different spectral response functions, the on board black body calibration system or non-linear response of the detectors could all be at fault. The situation is similar with other channels [3]. A full understanding of the various effects contributing to the systematic errors of HIRS that manifest themselves as biases is further complicated by the fact that one encounters contradictory or incomplete information in the literature even about basic properties of this instrument. Examples are:
  • According to the first performance report from ITT Aerospace, the FoV (field of view) of HIRS/2 has a diameter of 1.22 ° [4]. This value increased to 1.25 ° in various books, for example [5], and reached a temporary height on the OSCAR web page with some 1.4 ° [6]. OSCAR gives the resolution in km at s.s.p., which introduces an uncertainty, because the altitude of a satellite on a sun-synchronous orbit can vary by almost 50 km during the mission, and its mean value is not the same for different satellites. The discrepancies get even larger for HIRS/4, where most web pages and documents give a value of some 0.7 ° , except for the ESA Metop performance page with its extravagant claim of 1.4 ° for the shortwave channels 13–19 and 1.3 ° for the long-wave channels 1–12 [7].
  • Experts on HIRS cannot agree, either, as to how good the spectral channels co-registration is. This property of the instrument can only be determined in flight for window channels, where it is possible to identify characteristic features on the surface of the Earth. As HIRS has a beamsplitter and two completely different optical paths for long-wave and shortwave channels, systematic pointing differences between these groups of channels are to be expected. Investigations into this matter on ground are not necessarily representative for the conditions in flight, because the strong vibrations during the launch phase can affect the optical path of the instruments.
  • The central wavelengths of several channels of HIRS are very similar, but spectral uncertainties remain [8]. This concerns in particular channels 13–16, which lie between 4.4 and 4.6 μ m, and channels 1–7, which lie between 13.3 and 15 μ m, i.e., close to the frequency of maximum spectral radiance for an object with a brightness temperature of 300 K. These wavelengths cover absorption bands of nitrous oxide and carbon dioxide in the atmosphere and produce therefore quite different flux values for Earth scenes, which makes it difficult to directly determine the inter-channel homogeneity of the sounding channels in flight.
  • Estimates of the non-linearity varied by more than a factor of two. A non-linear effect was first detected in flight with HIRS/2 on NOAA-10, where it was maximum in the ninth and tenth channel and lowest in the shortwave channels [9]. When [10] determined later the non-linearity terms for the long-wave channels 4 and 6 of HIRS/4 on Metop-B in flight, they found them exactly 3.333 times smaller than the pre-launch values. Their method worked by identifying those non-linearity terms that produced the smallest orbital mean bias against IASI (Infrared Atmospheric Sounding Interferometer) on the same satellite. The underlying assumption is here that non-linearity is the only reason for bias. An independent confirmation of this claim is highly desirable.
  • The impact of reflected solar radiance and the low signal-to-noise ratio at low temperatures adversely affect the accuracy and precision of radiance measurements with the short-wavelength channels, according to [11]. The exact value of the reflected solar radiance depends on the scan position, solar zenith angle, etc. [12], which makes its calculation difficult. It can, however, be very much simplified by assuming diffuse reflection—a concept that can be tested with the geometric albedo of the Moon.
The aim of our investigation is to shed some light on these and other issues concerning the performance of HIRS/2–HIRS/4 in flight, or at least to propose new ways of addressing the open questions. This is not only of interest to meteorologists trying to understand biases and other peculiarities in the data from HIRS, but provides as well helpful suggestions for verifying the compliance of future infrared sounders with requirements. Here we make use of intrusions of the Moon in the deep space view (DSV) of HIRS during routine operations. As the Moon has no atmosphere, its infrared spectrum has no narrow, variable features. The hemisphere it presented to the weather satellites was more or less the same for all observations: The sub-observer longitude varied between 351.2 ° and 6.8 ° , and the sub-observer latitude, i.e., the apparent planetodetic longitude and latitude of the nearest point of the target seen by HIRS, varied between − 5.6 ° and + 6.8 ° . We could not detect any significant correlation between either coordinate and the measured brightness temperatures. All of these things are strong evidence in favour of a basic assumption relevant for thermo-physical modeling, namely that the disk-integrated properties of the Moon were the same in all observations.
Its temperature, however, varies with the illumination by the Sun, and these variations are much larger than those of the Earth’s upper troposphere [13]. Hence observations of Moon intrusions make it possible to monitor the performance of an instrument over a very large range of flux values. They provide new insights into the effects causing systematic uncertainties in the measurements. Such deeper understanding is essential to produce fundamental climate data records from HIRS with consistent calibration. Such a data set could for example form the basis for new climate data records of upper tropospheric humidity as a complement to the corresponding microwave data set [14].
In the next section we describe the method used for identifying suitable observations of the Moon with HIRS, and how we derived brightness temperatures from the raw data. The results are presented in Section 3, and we show for each of the five items mentioned above, how the Moon can prove itself useful by providing new insights. In Section 4 we assess the relevance of these results by comparing them with expectations. Finally, we draw conclusions in the last section on the future use of the Moon in calibration and validation of instruments on weather satellites.

2. Materials and Methods

The first step in our efforts to take advantage of the intrusions of the Moon in the DSV of HIRS was to identify such events in the raw data (level 1b), which are supplied by the NOAA Comprehensive Large Array-data Stewardship System and which were read and procesed by us using Typhon [15]. The HIRS lunar contamination status can be found in plots that are available on the web page of the Center for Satellite Applications and Research Integrated Calibration/Validation System Long-Term Monitoring [16]. This web page, however, does not include monitoring data of HIRS/2, and it does not show the lunar contamination status before 2016. Another, but much more laborious method, is searching the raw data for anomalies in the counts from the DSV during periods of time when the Moon was close to its pointing direction. In 
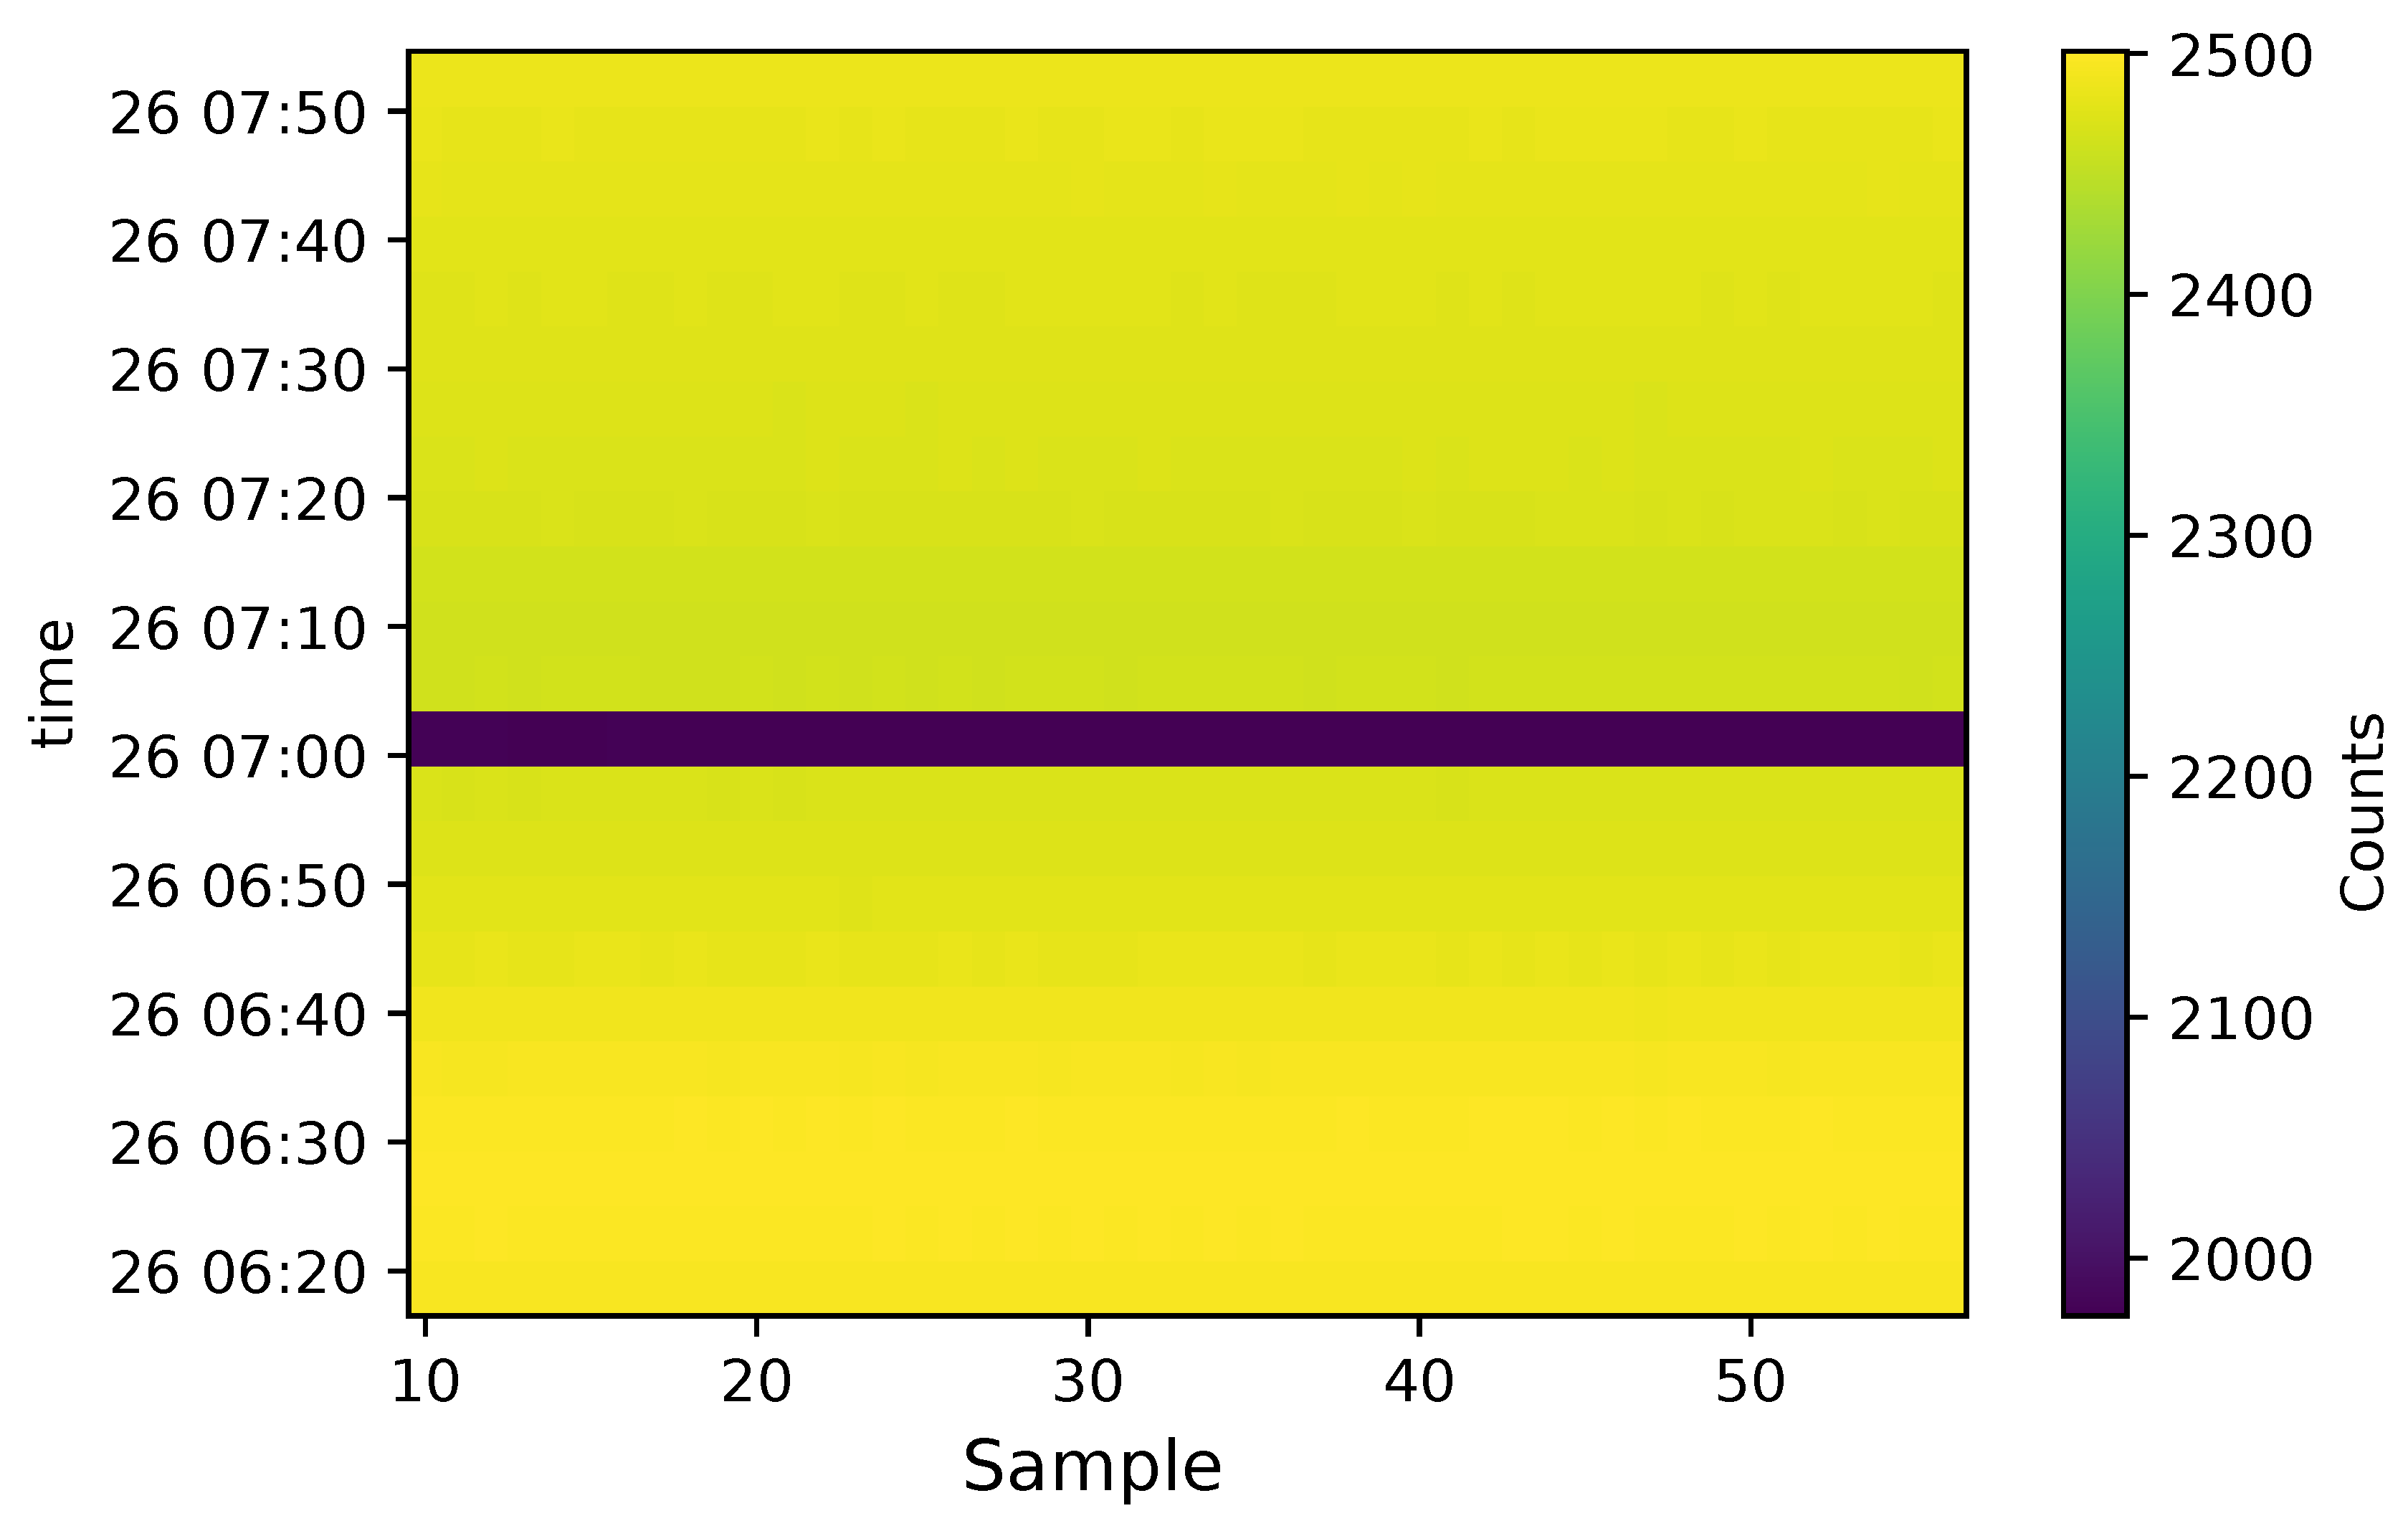
Figure 1 we show an example of the signal from deep space for all calibration lines of one orbit. The radiometric calibrations with deep space happen every 256 s, i.e., one gets 6100 / 256 24 such calibration lines per orbit. In between there are Earth scans. Each calibration line contains at least 46 useful measurements, and they are shown in Figure 1 as 24 × 46 counts. The plot betrays immediately the scan that was affected by the presence of the Moon, because the Moon adds flux to the otherwise empty space. As can be seen in the figure, HIRS produces a lower number of counts for stronger incoming flux. The signal is already reverse after processing in the amplifier chains and before analog to digital conversion, see Section 2.1 in [
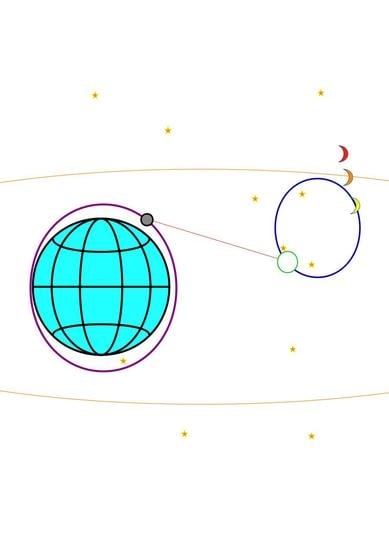
17]. In a second step we checked with the aid of the infrared light curve of the intrusion of the Moon in the DSV, whether the Moon was fully included in the FoV of HIRS or not. As the number of counts is inversely proportional to the fraction of the lunar disk that falls inside the FoV, this number decreases while the Moon is approaching the center of the FoV and increases while the Moon is leaving the FoV. It is constant at a high level, as long as the Moon is completely outside the FoV, and at a low level, as long as the Moon is completely inside the FoV, apart from random fluctuations of the counts. When during an orbit the Moon is at the orange position in Figure 2, then only a fraction of the lunar disk can be present in the FoV of HIRS, and a falling number of counts is followed immediately by a rise in the number of counts. Whenever it seemed like HIRS got infrared radiation from the whole lunar disk, we looked for additional evidence by comparing the counts with the signal from another intrusion of the Moon with similar phase angle. We usually carried out our search for Moon intrusions with light curves from channel 8, which means that the Moon might not have been fully included in the FoV of the short-wavelength channels, due to systematic pointing differences between long- and shortwave channels, see Section 3.1.2.
The blue circle in Figure 2 is close to the celestial equator and its center coincides with the direction of the orbital axis of the satellite carrying HIRS. When this direction is sufficiently close to the orbit of the Moon, i.e., the orange line, then the Moon will appear every month in the DSV. At other times of the year, however, such an alignment cannot happen. It is also possible, that only Earth scenes were observed, when the Moon crossed the direction of the DSV, or that only part of the Moon fell into the FoV. In consequence, a whole year might pass without a single, useful Moon intrusion.
We identified a total of 20 suitable intrusions of the Moon in the DSV of seven satellites. This number is large enough for a representative subset of all Moon intrusions and for demonstrating the methods we have developed to learn more about HIRS. It is a far cry, however, from a complete inventory of Moon intrusions, because it is heavily biased towards recent years and the latest satellites. We chose this approach in order to get a balanced set of Moon intrusions from different versions of HIRS, although HIRS/2 flew on more satellites than all other versions combined. Depending on the specific instrumental effect under investigation, we chose those Moon intrusions among our set of 20 that were particularly well suited. Examples are instances of different instruments observing the Moon at the same phase angle or observations, where the Moon appeared in all channels in spite of their small misalignment.
The observations of the Moon are not part of the standard processing of the raw data from HIRS, so we had to calibrate them ourselves. This was done by calculating the average counts X ¯ s p from the previous and the following DSV calibration line, i.e., 256 s before and 256 s after the Moon intrusion, and using the counts X ¯ b b from the black body (bb) calibration line that is closest in time to the Moon intrusion. The space radiance R s p is zero for all channels of HIRS, the black body radiance R b b is calculated from the temperature T b b of the black body. The reference counts are the average from some 47 samples, because the first eight to ten samples were taken while the scan mirror was still in motion. This average of 47 samples enters the equation of calibration, without non-linearity, as used by AAPP (ATOVS [Advanced TIROS Operational Vertical Sounder] and AVHRR [Advanced Very High Resolution Radiometer] Pre-processing Package) [18]. The counts obtained, when the Moon is in the FoV, are the average of less than 47 samples, because usually the whole disk of the Moon does not remain in the FoV during the entire duration of the calibration line (6.4 s). The radiant flux density received by HIRS from the lunar surface is calculated according to
R = G · X ¯ M o o n + I
where X ¯ M o o n is the average counts from the space target. G is defined as
G = R b b R s p X ¯ b b X ¯ s p
where the radiance of the black body is calculated according to Planck’s law
R b b = c 1 λ 5 · ( e c 2 λ · T b b * 1 )
The temperature of the black body needs a band correction with channel specific constants b and c, which are given in AAPP.
T b b * = b + c · T b b
The temperature of the black body is measured with n calibrated platinum sensors, where n = 4, except for for HIRS/4, where it is 5.
T b b = i = 1 n T i n
Every platinum sensor has its own resistance/temperature relationship.
T i = j = 0 5 a i j · P R T ¯ i j
The measured radiance is zero, when the instrument points at empty space.
I = G · X ¯ s p
with
  • a i j = conversion coefficient (numeric counts to temperature)
  • P R T ¯ i = mean numeric counts associated to PRT (platinum resistance thermometer) number i
  • c 1 = 3.74 · 10 16 W m 2
  • c 2 = 1.44 · 10 2 K m
  • λ = wavelength
The Moon has a smaller apparent diameter than the FoV of HIRS, but the calibration targets and also the Earth scenes are extended. For objects that do not fill the FoV, one has to divide R by the fraction of the FoV they cover and the included energy, i.e., the fraction of the flux that actually originates within the FoV as opposed to the contribution from stray light, like this:
R M o o n = R · ( d F O V / d M o o n ) 2 / η
with:
  • R M o o n = radiance of the lunar disk
  • d F O V = diameter of the optical field of view
  • d M o o n = diameter of the Moon as seen from the position of the satellite
  • η = total energy contained within a circle of 1.8 ° (1 − η is the fraction of the flux reaching the detector from outside the field of view. Such flux is present with extended sources, e.g., the black body, but not with the Moon. Numerical values can be found in [17,19]).
For the diameter of the FOV we assumed 1.4 ° for HIRS/2, 1.3 ° for HIRS/3, and 0.7 ° for HIRS/4. The included energy is 0.97 for HIRS/2 [4] and 0.98 for HIRS/3 and HIRS/4 [19]. As no uncertainties were reported for these values, it is not clear whether this difference between HIRS/2 and the following versions of the instrument is significant.
We did not correct for changes in temperature of the instrument with a self emission model, although they are known to affect the calibration measurements of the deep space view [20]. This means for our investigation that the self emission could be slightly different at the time of the intrusion of the Moon in the DSV than with the deep space calibration lines before and after. We mitigate this problem by using for our calibration the average of the counts from the deep space calibration lines before and after, but this method removes only the effects of a linear drift of the temperature. By comparing the counts from many sets of three consecutive deep space calibration lines when the Moon was nowhere to be seen, we concluded that the absence of a self emission model adds an uncertainty of one or two counts to the cold calibration reference, but that it does not introduce a systematic error. This does not rule out the possibility of long term effects on the photometric calibration, but they are something altogether different. We did not include a non-linearity term in our equation of calibration, either, because there is no consensus on the correct values for this term, and as a consequence it is set to zero in AAPP. Furthermore we would compromise our aim of deriving upper limits on the non-linearity, if we applied a non-linearity correction already in our processing of the data.

3. Results

As the Moon has got no atmosphere, its spectral energy distribution is close to that of a grey body, with gradual, small variations of its brightness temperature. For a comparison of the disk-integrated flux density of the Moon from HIRS with a thermo-physical model, see [21]. None of the spectral lines familiar from Earth’s atmosphere are present on the Moon, and this special quality allows checks of the performance of HIRS in flight that are much more difficult or even impossible in the framework of the routine calibration procedure. An example is checking the coregistration of sounding channels, because one cannot identify surface features on Earth with them. We give in the following several illustrations of how lunar intrusions in the deep space view can serve as diagnostic tool for an infrared sounder. The absolute photometric calibration is not among them, because a sufficiently accurate model of the lunar radiance in all channels of HIRS is not available yet [21].

3.1. System Characteristics

3.1.1. Optical Field of View

According to Equation (8) the measured radiance of the Moon is proportional to the solid angle of the FoV. Hence, it is possible to determine the ratio of the FoVs of different instruments with high accuracy, provided that they observed the Moon at very similar phase angles so that they got more or less the same radiance from the Moon. In this case they must measure the same value, if the assumed FoVs are correct. Variations of the included energy η are negligible, because this value is almost the same for all instruments, viz. close to one, and not controversial in the literature. With other words, the intrusions of the Moon in the DSV put us in a position to find out, which numbers in Table 1 are correct.
Table 2 is a collection of nine pairs of observations of the Moon at similar phase angle, but different times. In most cases different versions of HIRS are involved. There were for example intrusions of the Moon in the DSV of HIRS/2 on NOAA-14 on 1996-05-28 and with a very similar phase angle in the DSV of HIRS/3 on NOAA-17 on 2002-09-26. The average brightness temperature of the Moon for all twelve long-wave channels was calculated in order to reduce the uncertainty. We used the shifted, central wavelengths provided by ECMWF for our calculations. In some cases we could do the same calculation also for most shortwave channels; these values are given in Table 3. Because of the poor alignment between long- and shortwave channels, and because there are less shortwave channels to begin with, the calculated brightness temperatures at short wavelengths are averages of much fewer values. As we have chosen channel 8 to identify the Moon intrusions in the deep space view, other long-wave channels are more likely to provide useful data than the shortwave channels.

Long-Wave Channels

The calculations were carried out assuming a FoV of 1.4 ° for HIRS/2, 1.3 ° for HIRS/3, and 0.7 ° for HIRS/4. There is at least one comparison for each possible combination of versions of HIRS. Besides, we found three pairs of observations of the Moon with very similar phase angle that were performed with the same version of HIRS. When comparing observations of the Moon with different versions of HIRS, one has to take the slightly different central wavelengths of each channel into account. This inconsistency is particularly pronounced with channel 12, where the central wavelength is 6.7 μ m with HIRS/2 and 6.5 μ m with HIRS/3 and 4, according to the numbers given by ECMWF. Adding to the confusion in the literature about the HIRS system characteristics, ref. [23] claimed a central wavelength of 6.5 μ m also for HIRS/2, but only on two satellites [2], however, demonstrated convincingly that the central wavelength was shifted from 6.7 μ m to 6.5 μ m only with the launch of HIRS/3 on NOAA-15 in 1998. This shift resulted in a BT difference of 8 K [24] for Earth scenes, because the absorption caused by water vapour in the atmosphere varies strongly between these two wavelengths. On the Moon, however, the emissivity and with it the brightness temperature remain almost constant between 6.5 and 6.7 μ m [25]. This is also true for the other channels. In the example of the pair HIRS/2 and HIRS/3 mentioned above we find a value of 1.031 for the ratio of the average radiance of the Moon measured with HIRS/2 and HIRS/3, but 1.007 for the ratio of the corresponding brightness temperatures. This difference is caused in part by the different wavelengths of the channels in version 2 and 3 of HIRS. Hence we determined the ratios of the brightness temperature rather than the ratios of the radiance in each pair for all twelve long-wavelength channels and calculated their average and standard deviation of the mean for Table 2 and Table 3. We note that the biggest difference is found with two measurements made with the same instrument, viz. HIRS/2 on NOAA-14. Surprisingly the smaller flux was measured here for the smaller phase angle, i.e., closer to full Moon. The explanation for this unusual ratio is that this is also the pair with the largest ratio in the Sun->Moon distance: It amounts to 1.521 · 10 13 cm 1.475 · 10 13 cm = 1.031 . The different brightness temperatures measured on the Moon reflect therefore in this special case the fact that the solar irradiance at perihelion is 106% of the value at aphelion. In all other cases we find differences in measured brightness temperature among the various instruments below 1.1%. This corresponds to less than 4% difference in flux density, which gives an upper limit of the random uncertainty of the diameter of the FoV of about 2%.

Shortwave Channels

Our selection criterion for the Moon intrusions was based on the long-wave channels, but unfortunately there is a systematic misalignment between long- and shortwave channels, because their optical paths are separated by a beamsplitter [4]. Hence we have only five pairs of observations at the same phase angle with the shortwave channels. A direct comparison between measurements with HIRS/2 and HIRS/3 is not among them, but the excellent agreement between HIRS/2 and HIRS/4 and between HIRS/3 and HIRS/4 suggests that the FoVs we assumed are correct also with the shortwave channels. In particular we have proven wrong the occasional claims of different FoVs for different channels of HIRS/3 or HIRS/4 in documents, e.g., [19], or web pages [7] dedicated to HIRS. We note that also the shortwave channels produce the highest ratio of brightness temperatures for the pair with the largest difference in the Sun->Moon distance.
Our measurements suggest that the diameter of the FoV is 1.4 ° for HIRS/2, 1.3 ° for HIRS/3, and 0.7 ° for HIRS/4 with all channels. These values are relevant for the comparison of HIRS data with those from other instruments, when they observed simultaneously the same Earth scene.

3.1.2. Spectral Channels Co-Registration

In a few, rare cases, the light curve of the Moon intrusion shows both decreasing and increasing counts (see Figure 3). The lack of constant signal means that the Moon was never fully included in the FoV, because HIRS would receive the radiation from the complete disk as long as this is the case. At least, however, the moment of its closest approach to the pointing direction of the DSV happened during the calibration procedure. In this case it is possible to determine exactly the time of this closest approach for each channel and to derive from this information the HIRS spectral channels coregistration in the along-track direction. We did that by fitting a second order polynomial to the light curve of channel 8, shown in Figure 3, and the light curves of all other channels. Then we determined the number of the sample, where the second order polynomial reached its minimum. The uncertainty of the position of the minimum was calculated from the uncertainties of the parameters produced in the polynomial fit. Then we converted the number of the sample to an angular displacement. For this last step we followed the method described by [26]. The whole procedure allows us to find out, whether the different channels point in the same direction. This assumption is often taken for granted by meteorologists when working with data from HIRS.
Table 4 lists the sample number of this closest approach for each channel, except for number 1. Channel 1 was excluded because of its poor signal-to-noise ratio. Its SNR is small, because the difference in counts between low and high fluxes is smaller with channel 1 than with the other channels. There is a clear trend in the sense that this sample number decreases along the rows of the table, but there is a discontinuity between channels 12 and 13, i.e., between SW and LW. This suggests the presence of chromatic aberration. As the long-wave and shortwave optical paths have no lenses in common [17], their variations in refractive index are different. On the other hand the correlation between pointing direction and wavelength is in case of LW significantly higher than the correlation between pointing direction and channel number, because channel 10 does not fit the sequence of decreasing wavelength. This fact demonstrates that it is not some tilt of the filter wheel that matters for the misalignment of the different channels, but rather a property of the lenses.
During the calibration procedure, the instrument stays at the same scan position, which is 68 for space view, but its pointing direction in the sky changes because of the movement of the satellite on its orbit around the Earth. The angular distance between the pointing directions of two consecutive samples of the space calibration line is:
Δ ϕ = t · s i n θ · 360 ° / P = 0.0019 °
with:
  • t = dwell time = 100 msec
  • θ = space view position relative to the orbital axis = 161.1 ° (pointing away from the Sun)
  • P = orbital period = 101.5 min for NOAA-19.
The fourth and fifth row (Displacement) of Table 4 give the differences between the positions of the Moon in the along-track direction found with channel 19 and the other channels. These values are plotted in Figure 4. There is a systematic shift in the position of the Moon as seen through the different filters, and the slope of position as a function of wavelength is larger for the SW channels than for the LW channels. This misalignment must be taken into consideration for estimating the overall uncertainty of the result, when flux densities measured in different channels are combined to calculate climate variables.

3.1.3. Inter-Channel Uniformity

The sounding channels of HIRS measure flux densities at several different wavelengths in order to characterise the exact shape of a spectral feature. In order to obtain meaningful results, the different channels do not only have to point in the same direction, they also must have a consistent flux calibration. These preconditions are usually not questioned, when the measurements are used to retrieve atmospheric variables. It is desirable to check the validity of these assumptions, and therefore we want to derive now upper limits for the systematic discrepancies between channels.
As the Moon has got no atmosphere, the N 2 O (SW) and CO 2 (LW) sounding channels should always give almost the same lunar brightness temperature. In Table 5 we give the values for the brightness temperatures and their standard deviations based on channels 2–7 for different versions of HIRS. According to the last column of the table it is typically 1.0 K for HIRS/2 and 0.6 K for HIRS/4, corresponding to about 1.2% or 0.7%, respectively, in radiance. These figures, however, are only an upper limit of the inter-channel bias, because the brightness temperature decreases slightly with increasing wavelength for the channels considered here, and this systematic trend inflates the calculated standard deviations. This finding was expected in the light of the properties of the lunar soil [25] between 9 and 11 μ m, because it means that also the radiance and as a consequence the emissivity of the lunar soil decreases by about 1%. We note the fact that HIRS observed the disk-integrated radiance at non-zero phase angles of the Moon, i.e., the measured spectral energy distribution is the average over quite different angles of incidence and reflection. Hence, any systematic trends of brightness temperature with wavelength seen by HIRS could differ from those shown in the plots by [25].
The SW channels show an even stronger trend of increasing brightness temperature towards smaller wavelengths than the LW channels. There are two reasons for this:
  • At longer wavelengths one sees a temperature, which is close to the disk-average temperature of the Moon, but at shorter wavelengths the radiance is dominated by the hottest (sub-solar) surface areas on the Moon.
  • At shorter wavelengths the share of reflected sunlight becomes larger. It should be subtracted from the flux density that HIRS receives from the Moon, before one can analyze the inter-shortwave-channel uniformity (see Section 3.2).
Our measurements prove that the inter-channel uniformity of the carbon dioxide sounding channels has no systematic component larger than the random scatter of the measurements. The measurements with HIRS are trustworthy.

3.1.4. Non-Linearity

The correct equation of calibration is needed for calculating the correct radiance and its uncertainty, and therefore it is important to know, whether the relationship between counts and radiance is linear or not. The HIRS operational calibration algorithm [27] sets all non-linearity coefficients to zero, because their effect is supposed to be negligible. A detailed investigation of this question, however, was only carried out for a few LW channels [10]. We use the observations of the Moon to derive an upper limit on the non-linearity coefficient of most SW channels. In doing so we take advantage of the fact that the sub-solar region of the Moon reaches temperatures of almost 400 K, i.e., more than 100 K above the temperatures of the black body and typical Earth scenes. The shortwave channels have central wavelengths between 3.7 and 4.6 μ m, where the radiance grows exponentially with temperature according to Planck’s law for short wavelengths. This means that, when the DSV is pointed at full Moon, the SW channels receive flux densities that are several times higher than those the black body can provide. As the non-linearity term in the measurement equation increases with the square of the counts, it must feature in observations of the Moon, if it is there at all.
For the calculation of the non-linearity term we follow the definition of [10]:
R M o o n n l = ( ( R b b X b b X s p q · ( X b b X s p ) ) · ( X M o o n X s p ) + q · ( X M o o n X s p ) 2 ) · ( d F O V / d M o o n ) 2 / η
with:
  • q = non-linearity
  • R M o o n n l = radiance of the Moon after correction for non-linearity.
The non-linearity correction makes a difference d n l (in percent of the lunar radiance) of
d n l = R M o o n n l R M o o n R M o o n · 100 = q · ( X M o o n X b b ) · ( X M o o n X s p ) · ( d F O V / d M o o n ) 2 R M o o n · η · 100
On 6/15, 1997, there was an intrusion of the Moon in the DSV of HIRS/2 on NOAA-14, and on 7/21, 2019, in the DSV of HIRS/4 of Metop-B. The phase of the Moon was in either case some 47 ° , therefore R M o o n was almost the same. The FoV is different with the different versions—HIRS/2, HIRS/3, and HIRS/4—but in each case big enough to fully include the Moon, and therefore big enough to receive the flux from the whole disk. The situation is different, however, with the black body, because this calibration reference has a larger diameter than any FoV of HIRS. Therefore the flux received from the black body is proportional to the radius of the FoV squared. With other words, because the DSV of HIRS/4 has only half the radius of the one of HIRS/2, the flux density obtained from the black body S b b of HIRS/4 is four times smaller than S b b of HIRS/2. In the case we consider here, where the Moon is observed at a phase angle of 47 ° , it provides a similar flux density as the black body of HIRS/2 does. This means, however, that the term X M o o n X b b is close to zero, whereas the same term is much larger with the small FoV of HIRS/4, and d n l of all SW channels is more than ten times higher for HIRS/4 than for HIRS/2—in case of channel 17 the ratio even amounts to 236. Hence for an estimate of the non-linearity coefficient one can assume that the non-linearity is negligible with the Moon intrusion of HIRS/2, and we take the fluxes measured with this instrument as reference. They agree, however, within 1.5% with the flux values obtained with HIRS/4. Hence we conclude that the non-linearity, if uncorrected, causes at most an error of this size with HIRS/4. The corresponding upper limits for the values of q are given in Table 6.
The non-linearity terms of channels 13–17 are at least a factor ten smaller than the pre-launch values for the LW channels [10]. The shorter the wavelength, the larger the flux difference between Moon and black body, and the tighter the constraint on the non-linearity coefficient. Our data are compatible with q = 0 for all SW channels and lend support to the equation of calibration used in AAPP. It is planned to extend the search for non-linearity effects to observations of the Moon at a variety of phase angles in [21].

3.2. Reflected Solar Radiance

As the STD of the shortwave channels is so large that in the Antarctic June the observed radiance for example in channel 19 is at the level of instrument noise [11], they are best used at daytime. This rule applies also to observations of the Moon: When it is full, the reflected sunlight alone gives already a satisfactory signal-to-noise ratio. In order to calculate its flux density, we assume that the Sun is a black body with the temperature [28]:
T b l a c k b o d y = T e f f = ( L / σ ) 1 / 4 = 5778 K
with:
T e f f = solar effective temperature
L = solar absolute luminosity
σ = Stefan-Boltzmann constant.
This approximation is good enough for our purpose of getting an estimate of the contribution of reflected sunlight to Earth or Moon scenes at wavelengths around 4 μ m [29]. We want to demonstrate that the thermal emission of the Moon in the shortwave channels can be determined accurately enough by a correction of the measured flux density that only requires the reflectance of the scene and its distance from the Sun. For this we assume that the Moon reflects 20% of the incoming radiation at 4 μ m [25]. Table 7 gives the brightness temperatures of the Moon for three different phase angles from the SW sounding channels of HIRS/4 on three different satellites. The reflected sunlight was subtracted, taking the distance between the Sun and the Moon at the time of its intrusion in the DSV into account. None of the measured brightness temperatures differs by more than 0.4 K from the average value of channels 13–16, suggesting an even better inter-channel uniformity than with the long-wave channels.
The reflected sunlight is always less then 8% of the overall flux density received from the Moon in the examples of Table 7, and the average temperatures given in the last column of this table are our best estimate for the brightness temperature of the Moon in the shortwave range of HIRS. The Sun’s share in the measured flux densities increases, however, towards shorter wavelengths, because the Sun is on the Rayleigh-Jeans branch of the Planck function, and the Moon is on the Wien branch. Hence we can now use the average brightness temperatures from Table 7 to calculate the radiance from the Moon at the central wavelengths of channels 17–19, if there was no reflected sunlight present, and then calculate the albedo of the Moon at these wavelengths from the difference between the actually measured flux density and what we would get from the thermal radiation of the Moon alone. Here we assume that no thermal radiation of the Moon is emitted by its night side, because it is very cold and on the Wien branch of the Planck function. The results are listed in Table 8—all values are compatible with the emissivity determined by [25] and do not vary much among the three channels 17–19. This consistency, especially at the smallest phase angle, proves that the values for the albedo are close to the truth, else they would change towards shorter wavelengths, where the ratio between emitted and reflected infrared light shifts quickly in favour of the latter. A value for the reflectivity of the Moon at 4 μ m that is significantly larger than 20%, as for example proposed by [30], would cause larger inconsistencies among the values in Table 8 and is therefore off the mark.
This method can be applied also the other way round, when the emissivity of an Earth scene is known, for example when the satellite flies over the Sahara. In this case the unwanted contribution from reflected sunlight to the overall signal can be subtracted, and the shortwave window channels can supply trustworthy measurements.

4. Discussion

The random uncertainty of our determination of the diameter of the FoV amounts to 2%, but strictly speaking we have only proven that the relative proportions of the FoVs of the different versions of HIRS are 1.4:1.3:0.7. Absolute values for the FoVs can only be calculated, if absolute values for the radiance of the Moon are known with high accuracy. Existing models of the brightness temperature of the Moon, however, have typical uncertainties of 5 K [31], and only few observations of the Moon with other infrared sounders than HIRS have been analyzed and published. As the DIVINER Lunar Radiometer Experiment on the Lunar Reconnaissance Orbiter did neither cover the wavelength range between 3.0 and 7.5 μ m nor from 8.6 to 12.5 μ m, the measurements we present from HIRS must be considered a unique source of information about disk-integrated brightness temperatures of the Moon. Given the fact that values between 0.69 ° and 0.7 ° for the FoV of HIRS/4 are well established in the literature, we are confident that our assumptions about the size of the FoV are correct.
The ratio of the lunar radiance from our observations close to perihelion and aphelion was 1.056 according to the measurements in channel 4 (14.2 μ m). This value is very close to the 6% seasonal variation in the Moon’s thermal emission found with CERES (Clouds and the Earth’s Radiant Energy System) [32]. The solar flux that the Moon absorbs and also its emitted thermal flux are inversely proportional to the square of its distance from the Sun. 1.056 = 1.028 , which is quite close to the ratio of the distances: 1.031. Detecting the effect of the eccentricity of the Earth’s orbit on the temperature of the Moon’s surface with only two observations is an impressive demonstration of the performance of HIRS, and we conclude that the brightness temperature of the Moon in the thermal infrared is 1%–2% higher at perihelion than at aphelion for a phase angle of some 70 ° .
According to [19] the channel to channel registration is less than 0.01 ° for LW and less than 0.007 ° for SW. These values do not agree with our findings: The pointing direction in the along-track direction alone differs already by up to 0.031 ° among the long-wave channels of HIRS/4 on NOAA-19, and by up to 0.015 ° among the shortwave channels, based on accurate measurements of when the Moon came closest to the center of the FoV of each channel. The channel to channel registration in flight is hence at least two times worse than claimed in the KLM User’s Guide for SW and three times for LW. Our results, however, are very similar to actual measurements of the centroid location of the SW channels of HIRS for NIMBUS F before launch [33]. The average pointing direction of all SW channels differs by 0.026 ° from the direction of the LW channels in the along-track direction, therefore there is a significant misalignment between the two groups of channels. As a consequence of this and a possible misalignment in the along-scan direction as well, the Moon was never fully included in the sounding shortwave channels in a third of the intrusions we found with the long-wave channels. This problem is worst for HIRS/4, because of its small FoV. We attribute the misalignment to different chromatic aberration of the lenses in the long-wave and shortwave optical paths and recommend to take this defect into account in the design of similar instruments in the future.
The small, but significant differences among the brightness temperatures measured by the various N 2 O and CO 2 sounding channels contain information about the wavelength dependence of the emission properties of the bulk material on the Moon. As the disk-integrated fluxes, however, are the sum of areas with quite different distances from the “sub-Sun” and “sub-HIRS” point, a thermo-physical model is needed to interpret our findings—a task that goes beyond the scope of this article.
Our method is not able to reproduce the biases between different satellites detected by other authors in the past [3,11], because we do not have observations of the Moon at exactly the same phase angle with the satellite pairs they used. Besides, the uncertainty of a single observation of the Moon in a given channel would have to be a small fraction of a Kelvin, and we cannot achieve that without a self emission model for HIRS. We conclude, however, on the basis of our investigation into non-linearity that any biases that may be present in the shortwave channels are rather caused by errors in the HIRS spectral response function, as stated by [11].
Finally we mention the fact that a quite simple method for subtracting the contribution from sunlight in the shortwave channels produced surprisingly good results: Only the reflectance of the scene at the central wavelength of the channel and its distance from the Sun are needed. Hence we believe this technique could easily be applied to HIRS Earth-viewing measurements where both variables are readily available, such as from the study of surface emissivity and reflectance of northern Africa at 11.1 μ m, 8.3 μ m, and 4 μ m, which was carried out by [34]. Although the determination of the reflected sunlight gets less reliable, when the Sun-scene-HIRS angle (phase angle when the scene is the Moon) is close to 90 ° , it should be good enough for most of the swath of HIRS, which extends from 49.5 ° to + 49.5 ° around nadir. The Metop satellites have a local equator crossing time of 9:30, i.e., seen from the nadir pixel on Earth, the Sun has an hour angle of 37.5 ° when the satellite crosses the equator - again a value much smaller than 90 ° . This means that over tropical regions with known reflectance it should be possible to eliminate the reflected sunlight without major impact on the overall uncertainty of the measurements.

5. Conclusions

The Moon has been observed with HIRS on many different satellites. We identified a few of these observations that offered particularly illuminating information about basic properties of the instrument. A basic calibration of the raw data was sufficient to characterize various effects with an impact on the performance of the instrument. In some cases this concerned properties that have never been determined in flight before. We have described the methods employed and given examples of the accuracy that can be achieved. The accuracy of the measured brightness temperature of the Moon might be further improved by correcting for the HIRS instrument self-emission [20].
Although it was not our intention to present a thorough study of all observations of the Moon from all satellites that carried HIRS, we were able to fill some gaps in the knowledge about this instrument. We ended the confusion about the size of the field of view, characterised how the co-registration of channels depends on their central wavelength in flight, and supplied upper limits on the non-linearity of the shortwave channels. All of these things are essential for a proper estimate of the uncertainties of the data from HIRS and as well for judging its compliance with the requirements.
The Moon has also been observed with other infrared sounders, e.g., CERES [35] or IASI, and therefore it offers unique possibilities for cross calibration. This includes comparisons with future instruments like IASI—New Generation or the Meteorological Imager on Metop Second Generation.
The (disk-integrated) Moon data, obtained with different versions of HIRS in different wavelength channels, are very consistent. Hence, they are well suited to verify/benchmark thermo-physical model (TPM) techniques, which are widely used for (disk-integrated) thermal IR measurements of other airless bodies (like asteroids, satellites, trans-Neptunian objects, or inactive comets). The benchmarked TPM of the Moon would then also help to calibrate thermal IR instruments of other satellites, e.g., interplanetary missions like the Origins Spectral Interpretation Resource Identification Security—Regolith Explorer or Hayabusa2. Both of them have looked at the Moon during swing-by maneuvers with their IR instruments to obtain an in-flight calibration [36,37]. We aim for a thermophysical model of the Moon using the available global properties and also a well-established directional hemispherical emissivity. This model will take the true observing and illumination geometries (as seen from the satellites) into account. Eventually we intend to establish the Moon as a calibration reference with empirical uncertainties for infrared instruments to evaluate their calibration accuracy and to assess their long-term calibration stability. Similar efforts are already underway with microwave instruments [38] and optical sensors in the framework of inter-agencies collaborations, for example at ESA [39] and EUMETSAT [40].

Author Contributions

Conceptualization, M.J.B., T.G.M., S.A.B. and M.B.; software, M.J.B.; validation, T.G.M.; formal analysis, M.J.B. and M.P.; investigation, M.J.B. and T.G.M.; writing–original draft preparation, M.J.B.; writing–review and editing, T.G.M., S.A.B. and M.B.; supervision, S.A.B.; funding acquisition, S.A.B. All authors have read and agreed to the published version of the manuscript.

Funding

This research was funded by Deutsche Forschungsgemeinschaft, project number 421761264. With this work we contribute to the Cluster of Excellence “CLICCS—Climate, Climatic Change, and Society” funded by the Deutsche Forschungsgemeinschaft DFG (EXC 2037, Project Number 390683824), and to the Center for Earth System Research and Sustainability (CEN) of Universität Hamburg. TM received funding from the European Union’s Horizon 2020 Research and Innovation Programme, under Grant Agreement no 687378, as part of the project “Small Bodies Near and Far” (SBNAF).

Acknowledgments

The authors would like to thank Hu Yang for his comments on the first version of the manuscript. The level 1b files of HIRS were read and processed using Typhon [15].

Conflicts of Interest

The authors declare no conflict of interest.

Abbreviations

The following abbreviations and mathematical symbols are used in this manuscript:
AAPPATOVS and AVHRR Pre-processing Package
ATOVSAdvanced TIROS Operational Vertical Sounder
AVHRRAdvanced Very High Resolution Radiometer
BBBlack Body
BTBrightness Temperature
CERESClouds and the Earth’s Radiant Energy System
DSVDeep Space View
ESAEuropean Space Agency
FoVField of View
HIRSHigh-resolution Infrared Radiation Sounder
IASIInfrared Atmospheric Sounding Interferometer
IRInfraRed
ITTInternational Telephone and Telegraph
LWLong-Wave
MetopMeteorological operational satellite
NOAANational Oceanic and Atmospheric Administration
OSCARObserving Systems Capability Analysis and Review tool
PRTPlatinum Resistance Thermometer
s.s.p.sub-satellite point
SNRsignal-to-noise ratio
spspace
STDSTandard Deviation
SWShortWave
TIROSTelevision InfraRed Observation Satellite
TOVSTIROS Operational Vertical Sounder
TPMThermo-Physical Model
UTHUpper Tropospheric Humidity
Δ R contribution by reflected sunlight to the radiance from the Moon
η total energy contained within a circle of 1.8 ° , i.e., fraction of flux received that is not straylight
λ shifted, central wavelength of a channel
σ Stefan-Boltzmann constant
θ space view position relative to the orbital axis = 161.1 ° (pointing away from the Sun)
a i j conversion coefficient (numeric counts to temperature)
bchannel specific band-correction coefficient in the file calcoef.dat in AAPP
cchannel specific band-correction coefficient in the file calcoef.dat in AAPP
c 1 3.74 · 10 16 W m 2
c 2 1.44 · 10 2 K m
d F O V diameter of the optical field of view
d M o o n diameter of the Moon as seen from the position of the satellite
d n l non-linearity correction as percentage of the measured radiance
Ggain
Ioffset term in measurement equation
L solar absolute luminosity
nnumber of platinum sensors on the black body
pgeometric albedo
Porbital period = 101.5 min for NOAA-19
P R T ¯ i mean numeric counts associated to PRT number i
qnon-linearity
Rradiant flux density received by HIRS from the lunar surface
R b b radiance of the black body
R M o o n radiance of the lunar disk
R M o o n n l radiance of the Moon after correction for non-linearity
R s p radiance of the space target, zero for all channels
S b b flux density obtained from the black body
S M o o n flux density obtained from the Moon
tdwell time = 100 msec
T B brightness temperature of the Moon without reflected sunlight
T b b temperature of the black body as measured with PRTs
T e f f solar effective temperature
T i temperature of the black body as measured with PRT number i
T b b * temperature of the black body after band correction
T b r brightness temperature
X ¯ b b average counts from the black body
X ¯ M o o n average counts from the space target, Moon in FoV
X ¯ s p average counts from the space target, no Moon in FoV

References

  1. EUMETSAT NWP SAF. Visible/IR Spectral Response Functions. 2017. Available online: https://www.nwpsaf.eu/site/software/rttov/download/coefficients/spectral-response-functions/ (accessed on 4 May 2020).
  2. Shi, L.; Bates, J.J. Three decades of intersatellite-calibrated High-Resolution Infrared Radiation Sounder upper tropospheric water vapor. J. Geophys. Res. 2011, 116, D04108. [Google Scholar] [CrossRef]
  3. Shi, L. Intersatellite Differences of HIRS Longwave Channels Between NOAA-14 and NOAA-15 and Between NOAA-17 and METOP-A. IEEE Trans. Geosci. Remote 2013, 51, 1414–1424. [Google Scholar] [CrossRef]
  4. Koenig, E.W. Performance of the HIRS/2 Instrument on TIROS-N. In Remote Sensing of Atmospheres and Oceans; Deepak, A., Ed.; Academic Press: New York, NY, USA, 1980; pp. 67–94. [Google Scholar]
  5. Cracknell, A.P. The Advanced Very High Resolution Radiometer; Taylor & Francis: London, UK, 1997; p. 31. [Google Scholar]
  6. WMO OSCAR. Space-Based Capabilities—Instruments. 2016. Available online: http://www.wmo-sat.info/oscar/instruments (accessed on 4 May 2020).
  7. ESA. HIRS/4 Performance. Undated. Available online: https://www.esa.int/Applications/Observing$_$the$_$Earth/\Meteorological$_$missions/MetOp/Performance8 (accessed on 4 May 2020).
  8. Chen, R.; Cao, C.; Menzel, W.P. Intersatellite calibration of NOAA HIRS CO2 channels for climate studies. J. Geophys. Res.-Atmos. 2013, 118, 5190–5203. [Google Scholar] [CrossRef]
  9. Dong, C.; Liu, Q.; Li, G.; Zhang, F. The study of in-orbit calibration accuracy of NOAA satellite infrared sounder and its effect on temperature profile retrievals. Adv. Atmos. Sci. 1990, 7, 211–219. [Google Scholar] [CrossRef]
  10. Chen, R.; Cao, C. Physical analysis and recalibration of MetOp HIRS using IASI for cloud studies. J. Geophys. Res. 2012, 117, D03103. [Google Scholar] [CrossRef] [Green Version]
  11. Cao, C. Intersatellite Radiance Biases for the High-Resolution Infrared Radiation Sounders (HIRS) on board NOAA-15, -16, and -17 from Simultaneous Nadir Observations. J. Atmos. Ocean Tech. 2005, 22, 381–395. [Google Scholar] [CrossRef]
  12. Norman, M.N.; Becker, F. Terminology in thermal infrared remote sensing of natural surfaces. Agric. For. Meteorol. 1995, 77, 153–166. [Google Scholar] [CrossRef]
  13. Maghrabi, A.H. On the measurements of the moon’s infrared temperature and its relation to the phase angle. Adv. Space Res. 2014, 53, 329–347. [Google Scholar] [CrossRef]
  14. Lang, T.; Buehler, S.A.; Burgdorf, M.J.; Hans, I.; John, V. MW UTH CDR. Submitted to SCIENTIFIC DATA 2020. Available online: http://cedadocs.ceda.ac.uk/1411/1/Attachment_0-13.pdf (accessed on 31 March 2020).
  15. Lemke, O.; Kluft, L.; Mrziglod, J.; Pfreundschuh, S.; Holl, G.; Larsson, R.; Yamada, T.; Mieslinger, T.; Doerr, J. Atmtools/Typhon. Zenodo 2020. Available online: https://zenodo.org/record/3626449 (accessed on 31 March 2020).
  16. NOAA. STAR ICVS Long-Term Monitoring. 2019. Available online: https://www.star.nesdis.noaa.gov/icvs/ (accessed on 4 May 2020).
  17. Koenig, E.W. Final Report on the High Resolution Infrared Radiation Sounder/Mod 2; Goddard Space Flight Center: Greenbelt, MD, USA, 1979; N80-33055.
  18. Labrot, T.; Lavanant, L.; Whyte, K.; Atkinson, N.; Brunel, P. AAPP Documentation Scientific Description. Satellite Application Facility for Numerical Weather Prediction. NWPSAF-MF-UD-001. 2019. Available online: https://nwpsaf.eu/site/download/documentation/aapp/NWPSAF-MF-UD-001_Science.pdf (accessed on 31 March 2020).
  19. Robel, J.; Graumann, A. NOAA KLM User’s Guide; National Oceanic and Atmospheric Administration: Silver Spring, MD, USA, 2014.
  20. Chang, T.; Cao, C. Analysis of MetOp/HIRS instrument self-emission and its impact on on-orbit calibration. In Sensors, Systems, and Next-Generation Satellites XV; International Society for Optics and Photonics: Bellingham, WA, USA, 2011. [Google Scholar]
  21. Müller, T.G.; Burgdorf, M.J.; Lagoa, V.A. The Moon in the thermal IR. In preparation. Will be made available online: http://home.mnet-online.de/tmueller/ (accessed on 7 May 2020).
  22. NASA. Polar Operational Environmental Satellites. Undated. Available online: https://www.star.nesdis.noaa.gov/icvs/ (accessed on 4 May 2020).
  23. Holl, G.; Mittaz, J.P.D.; Merchant, C.J. Error Correlations in High-Resolution Infrared Radiation Sounder (HIRS) Radiances. Remote Sens. 2019, 11, 1337. [Google Scholar] [CrossRef] [Green Version]
  24. Chung, E.-S.; Soden, B.J.; Huang, X.; Shi, L.; John, V.O. An assessment of the consistency between satellite measurements of upper tropospheric water vapor. J. Geophys. Res.-Atmos. 2016, 121, 2874–2887. [Google Scholar] [CrossRef] [Green Version]
  25. Salisbury, J.W.; Basu, A.; Fischer, E.M. Thermal Infrared Spectra of Lunar Soils. Icarus 1997, 130, 125–139. [Google Scholar] [CrossRef]
  26. Bonsignori, R. In-orbit verification of microwave humidity sounder spectral channels coregistration using the moon. J. Appl. Remote Sens. 2018, 12, 025013. [Google Scholar] [CrossRef]
  27. Cao, C.; Jarva, K.; Ciren, P. An improved algorithm for the operational Calibration of the High-Resolution Infrared Radiation Sounder. J. Atmos. Ocean Tech. 2007, 24, 169–181. [Google Scholar] [CrossRef]
  28. Lodders, K.; Fegley, B. The Planetary Scientist’s Companion; Oxford University Press: New York, NY, USA, 1998; p. 95. [Google Scholar]
  29. Rieke, G.H.; Blaylock, M.; Decin, L.; Engelbracht, C.; Ogle, P.; Avrett, E.; Carpenter, J.; Cutri, R.M.; Armus, L.; Gordon, K.; et al. Absolute Physical Calibration in the Infrared. Astron. J. 2008, 135, 2245–2263. [Google Scholar] [CrossRef]
  30. Shaw, J.A. Modeling infrared lunar radiance. Opt. Eng. 1998, 38, 1763–1764. [Google Scholar] [CrossRef]
  31. Keihm, S.J.; Peters, K.; Langseth, M.G.; Chute, J.L. Apollo 15 measurement of lunar surface brightness temperatures thermal conductivity of the upper 1 1/2 meters of regolith. Earth Planet. Sci. Lett. 1973, 19, 337–351. [Google Scholar] [CrossRef]
  32. Matthews, G. Celestial body irradiance determination from an underfilled satellite radiometer. Appl. Opt. 2008, 47, 4981–4993. [Google Scholar] [CrossRef] [PubMed]
  33. Koenig, E.W. High Resolution Infrared Radiation Sounder for the Nimbus F Spacecraft; Goddard Space Flight Center: Greenbelt, MD, USA, 1975.
  34. Chédin, A.; Péquignot, E.; Serrar, S.; Scott, N.A. Simultaneous determination of continental surface emissivity and temperature from NOAA 10/HIRS observations. J. Geophys. Res.-Atmos. 2004, 109, D20110. [Google Scholar] [CrossRef] [Green Version]
  35. Daniels, J.; Smith, G.L.; Priestley, K.J.; Thomas, S. Using lunar observations to validate pointing accuracy and geolocation, detector sensitivity stability and static point response of the CERES instruments. In Remote Sensing of Clouds and the Atmosphere XIX; and Optics in Atmospheric Propagation and Adaptive Systems XVII; International Society for Optics and Photonics: Bellingham, WA, USA, 2014. [Google Scholar]
  36. Simon, A.A.; Reuter, D.C.; Emery, J.; Cosentino, R.G.; Gorius, N.; Lunsford, A.; Lauretta, D.S. OSIRIS-REx Earth Flyby. In Proceedings of the 50th Lunar and Planetary Science Conference, The Woodlands, TX, USA, 18–22 March 2019. [Google Scholar]
  37. Okada, T.; Fukuhara, T.; Tanaka, S.; Taguchi, M.; Arai, T.; Senshu, H.; Demura, H.; Ogawa, Y.; Kouyama, T.; Sakatani, N.; et al. Earth and moon observations by thermal infrared imager on Hayabusa2 and the application to detectability of asteroid 162173 Ryugu. Planet. Space Sci. 2018, 158, 46–52. [Google Scholar] [CrossRef]
  38. Yang, H.; Burgdorf, M.J. A Study of Lunar Microwave Radiation Based on Satellite Observations. Remote Sens. 2020, 12, 1129. [Google Scholar] [CrossRef] [Green Version]
  39. ESA. Enabling & Support. 2018. Available online: https://www.esa.int/Enabling$_$Support/Preparing$_$for$_$the$_$Future/\Discovery$_$and$_$Preparation/Moon$_$holds$_$key$_$to$_$improving$_$satellite$_$views$_$of$_$Earth (accessed on 4 May 2020).
  40. EUMETSAT. Science Studies. Undated. Available online: https://www.eumetsat.int/website/home/Data/ScienceActivities/\ScienceStudies/Moonasreferenceforlongtermstabilityassessmentofopticalsensors/index.html (accessed on 4 May 2020).
Figure 1. Plot of the numeric counts corresponding to space radiance with HIRS/3 on NOAA-17 during one orbit on 26 September 2002. The first samples were excluded, because the radiometer scanning mirror needs some time to reach its final pointing. The Moon was present in the FoV at 7:01 UTC and provided additional flux. Each scan takes 6.4 s.
Remotesensing 12 01488 g001
Figure 2. The pointing direction of the DSV describes a circle (blue) in the sky during one orbit of the satellite. When the position of the Moon on its orbit around the Earth (orange) coincides with this circle, it will appear for a short while in the FoV of HIRS. The orbit of the Moon is tilted against the celestial equator, so its minimum distance from the line of sight (straight red line) of the DSV of an instrument on a polar, sun-synchronous orbit (violet) is different each month. The orange position corresponds to a case, where part of the Moon stays outside the FoV, the yellow position corresponds to a case, where HIRS gets the radiation of the complete lunar disk. During that time the signal remains constant.
Remotesensing 12 01488 g002
Figure 3. Signal from all samples taken during the calibration line performed by HIRS/4 on NOAA-19 on 2012-03-04 between 5:07:0.8 and 5:07:7.2 UTC. The first positions were excluded, because the radiometer scanning mirror needs some time to reach its final pointing. The Moon came closest to the center of the FoV of channel 8—the one plotted here—for scanposition 34.
Remotesensing 12 01488 g003
Figure 4. Position of the Moon in the along-track direction according to each infrared channel of HIRS/4 on NOAA-19 during its intrusion in the DSV on 2012-03-04 at 5:07 UTC. The values are relative to the position of the Moon in channel 19, and they are positive, if the pointing direction of a channel is displaced in the flight direction. The relationship between the central wavelength of the channels and the displacement is plotted as two different red lines for the SW and the LW channels. The channel numbers are, from left to right: 19, 18, 17, 16, 15, 14, 13, 12, 11, 9, 8, 10, 7, 6, 5, 4, 3, 2.
Remotesensing 12 01488 g004
Table 1. Diameter of the field of view of different versions of HIRS according to different sources. The values from the NASA and OSCAR web pages are approximate, because they needed to be converted from km at s.s.p. to degrees.
SourceHIRS/2HIRS/3HIRS/4
DegreesDegreesDegrees
[4]1.22--
[5]1.25--
[18]1.251.250.72
[19]-1.4 (SW), 1.3 (LW)0.7
[6]≈1.38≈1.27≈0.67
[7]1.251.251.4 (SW), 1.3 (LW)
[22]-≈1.32≈0.66
Moon intrusions in DSV 1.4 ± 0.03 1.3 ± 0.03 0.7 ± 0.01
Table 2. Ratio of the average brightness temperature T b r of the Moon as measured with the long-wave channels 1-12 of HIRS on different satellites. This ratio would be one for perfect instruments. The uncertainties reflect the random scatter of the ratios among the different channels. The first column gives the absolute value of the phase angles of the Moon; the pairs were chosen just so these angles are almost the same for either measurement. The value in bold face refers to the only pair, where both measurements were made with the same instrument on the same satellite, but at different times. It is also the only pair, where the measurements were made close to minimum and maximum distance between the Sun and the Moon, which explains the large ratio.
|Phase Angle| T HIRS / 2 br / T HIRS / 3 br T HIRS / 2 br / T HIRS / 4 br
34.6 ° / 34.8 ° 0.996 ± 0.001 (NOAA-11/Metop-B)
46.3 ° / 47.5 ° 1.003 ± 0.002 (NOAA-14/NOAA-18)
51.1 ° / 50.5 ° 1.007 ± 0.005 (NOAA-14/NOAA-17)
70.8 ° / 70.6 ° 1.011 ± 0.002 (NOAA-11/Metop-A)
|Phase Angle| T H I R S / 3 b r / T H I R S / 4 b r T H I R S / t i m e 1 b r / T H I R S / t i m e 2 b r
24.8 ° / 23.8 ° 1.000 ± 0.002 (NOAA-15/NOAA-18)
40.1 ° / 40.9 ° 0.998 ± 0.002 (NOAA-11/NOAA-14)
47.5 ° / 48.5 ° 1.006 ± 0.002 (NOAA-18/Metop-B)
69.3 ° / 68.0 ° 1.014 ± 0.002 (NOAA-14/NOAA-14)
73.8 ° / 73.1 ° 0.991 ± 0.002 (NOAA-17/NOAA-18)
Table 3. Ratio of the average brightness temperature T b r of the Moon as measured with channels 13-17 (no channel but 17 was used for the calculation of the pair 24.8 ° / 23.8 ° ) of HIRS on different satellites. As the brightness temperatures were derived from less than six measurements, we did not calculate uncertainties based on their scatter. The value in bold face refers to the only pair, where both measurements were made with the same instrument on the same satellite, but at different times. It is also the only pair, where the measurements were made close to minimum and maximum distance between the Sun and the Moon, which explains the large ratio.
|Phase Angle| T HIRS / 2 br / T HIRS / 4 br T HIRS / 3 br / T HIRS / 4 br T HIRS / time 1 br / T HIRS / time 2 br
24.8 ° / 23.8 ° 1.007 (NOAA-15/NOAA-18)
40.1 ° / 40.9 ° 0.997 (NOAA-11/NOAA-14)
46.3 ° / 48.5 ° 0.998 (NOAA-14/NOAA-18)
69.3 ° / 68.0 ° 1.011 (NOAA-14/NOAA-14)
73.8 ° / 73.1 ° 0.996 (NOAA-17/NOAA-18)
Table 4. Sample number of the smallest distance between the position of the Moon and the center of the DSV for the space calibration line from 2012-03-04 at 5:07 UTC with HIRS/4 on NOAA-19. The differences in sample number correspond to differences in the pointing direction of the different channels in the along-track direction. The numbers given in the fourth and fifth row are relative to the position of the Moon in channel 19, and they are positive, if the pointing direction of a channel is displaced in the flight direction.
Channel Number23456
Wavelength/ μ m14.68514.52614.23213.97313.635
Sample Number 39.8 ± 10.3 38.1 ± 4.6 36.9 ± 3.9 36.4 ± 5.4 37.8 ± 3.0
Displacement/ ° 0.0444 ± 0.0197 0.0412 ± 0.0088 0.0389 ± 0.0075 0.0379 ± 0.0103 0.0406 ± 0.0057
Displacement/km0.670.630.590.580.62
Channel Number7891011
Wavelength/ μ m13.34711.1249.72912.4567.352
Sample Number 39.7 ± 4.2 33.9 ± 1.4 28.3 ± 2.9 41.6 ± 4.0 26.8 ± 4.1
Displacement/ ° 0.0442 ± 0.008 0.0331 ± 0.0027 0.0224 ± 0.0056 0.0479 ± 0.0077 0.0195 ± 0.0079
Displacement/km0.670.50.340.730.3
Channel Number1213141516
Wavelength/ μ m6.5294.5774.5174.4794.451
Sample Number 21.5 ± 7.5 25.2 ± 1.1 23.5 ± 0.7 23.0 ± 0.9 22.2 ± 0.9
Displacement/ ° 0.0094 ± 0.0144 0.0165 ± 0.0021 0.0132 ± 0.0013 0.0122 ± 0.044 0.0107 ± 0.0425
Displacement/km0.140.250.20.190.16
Channel Number171819
Wavelength/ μ m4.1313.9713.757
Sample Number 20.3 ± 0.9 17.5 ± 1.0 16.6 ± 0.4
Displacement/ ° 0.0071 ± 0.0389 0.0017 ± 0.0335 0 ± 0.0008
Displacement/km0.110.0030
Table 5. Average brightness temperatures and their standard deviations for channels 2–7 at different phase angles of the Moon. The central wavelengths of these long-wave CO 2 channels lie between 13.3 and 14.8 μ m for HIRS/2, 3, and 4; their calibration has been studied in detail by [8].
InstrumentSatellitePhase Angle< T B Ch 2 7 > σ ( T B Ch 2 7 )
DegreesKK
HIRS/2NOAA-11−34.6343.30.9
HIRS/2NOAA-11−40.1335.30.9
HIRS/2NOAA-11−57.5306.61.2
HIRS/2NOAA-11−70.8282.51.0
HIRS/2NOAA-14−46.3323.71.1
HIRS/2NOAA-14−51.1310.81.1
HIRS/3NOAA-15+24.8349.10.6
HIRS/4NOAA-18+23.8348.10.8
HIRS/4NOAA-19−15.6359.10.6
HIRS/4Metop-B+34.8343.80.5
HIRS/4Metop-B+48.5320.30.7
Table 6. Upper limit of the non-linearity and the ratio of flux densities received from the Moon and the black body for channels 13-17 of HIRS/4 on Metop-B.
ChannelCentral WavelengthMaximum Non-linearity TermDynamic Range ( S Moon S bb )
μ m 10 8 mW m 2 cm sterad 1 counts 2
134.5751.13.0
144.5321.13.1
154.4760.83.1
164.4580.73.2
174.1300.64.0
Table 7. Brightness temperature of the Moon in the four channels with central wavelengths around 4.5 μ m for three different phase angles. T B is the brightness temperature of the Moon after subtraction of the reflected sunlight.
Phase angleSatelliteDistance Sun-Moon T B Ch 13 T B Ch 14 T B Ch 15 T B Ch 16 T B average
Degrees 10 13 cmKKKKK
48.5Metop-B1.5228338.45337.89337.91338.02338.07
70.6Metop-A1.4806318.63319.03318.84318.85318.84
−73.1NOAA-181.4883312.92312.66312.44312.51312.58
Table 8. Contribution by reflected sunlight to the radiance obtained from the Moon Δ R and geometric albedo p of the Moon at the central wavelengths of the three SW window channels with HIRS/4. T B is the brightness temperature of the Moon after subtraction of the reflected Sun light.
Phase Angle T B Δ R Ch 17 p Ch 17 Δ R Ch 18 p Ch 18 Δ R Ch 19 p Ch 19
DegreesK 10 6 MJy sterad 1 10 6 MJy sterad 1 10 6 MJy sterad 1
48.5338.073.310.233.540.233.850.23
70.6318.843.040.202.920.183.080.17
−73.1312.582.910.202.990.192.920.17

