1. Introduction
Model simulations suggest that around 50% of the total clear-sky long-wave cooling of the Earth to space occurs within the Far InfraRed (FIR) spectral region [
1,
2], conventionally between 100 and 667 cm
or between 100 and 15 microns in wavelength. An even larger fraction of this cooling is predicted to occur in the FIR when both clear- and cloudy-sky (all-sky) conditions are considered [
3]. This is because the presence of clouds causes lower emitting temperatures, and thus a shift to longer wavelengths of the peak of the black-body emission. Many previous studies have outlined the importance of the FIR rotational band of water vapour and its influence on climate [
1]. Furthermore, Huang et al. (2009) [
4] have shown that accurate and continuous measurements of the outgoing long-wave radiation extending to the FIR region represent a valuable tool to monitor climate changes and to validate climate models. Cirrus clouds play an important role in the determination of the Earth’s energy budget. They may have both a warming and cooling effects, since they modulate both the incoming solar radiation and the outgoing long-wave emission. The relative importance of the two effects depends on the cloud optical and micro-physical properties [
5,
6]. Moreover, the FIR component of the spectrum is very sensitive to the particle habit and the size of ice crystals [
7,
8], which makes it very important to characterize the cirrus radiative properties [
9].
Despite its importance, for technological reasons, to date the FIR upwelling radiance from the atmosphere and surface has never been measured spectrally resolved from space. To cover this long-standing observational gap, in September 2019 the FORUM (Far-infrared Outgoing Radiation Understanding and Monitoring) experiment has been approved to be the ninth Earth Explorer mission of the European Space Agency (ESA, 2019 [
10]). FORUM is scheduled for launch on a Polar satellite in the 2025–2026 time frame. The core instrument of FORUM will be a Fourier Transform Spectrometer (FTS) measuring, at nadir, the upwelling spectral radiance emitted by the Earth across the most relevant infrared part of the electromagnetic spectrum, from 100 to 1600 cm
(from 100 to 6.25 microns in wavelength), with a spectral resolution of 0.5 cm
. FORUM will fly in loose formation with the MetOp-SG-1A satellite, hosting the Infrared Atmospheric Sounding Interferometer, New Generation (IASI-NG). Since IASI-NG will measure the Middle-InfraRed (MIR) part of the upwelling atmospheric spectrum (from 645 to 2760 cm
, or from 15.5 to 3.62 microns in wavelength), the matching FORUM FIR spectra can be effectively used to synergistically complement the IASI-NG measurements which, as compared to FIR measurements, are less sensitive to the water vapour content in the Upper Troposphere/Lower Stratosphere (UTLS), an important driver of the outgoing long-wave radiation flux [
11,
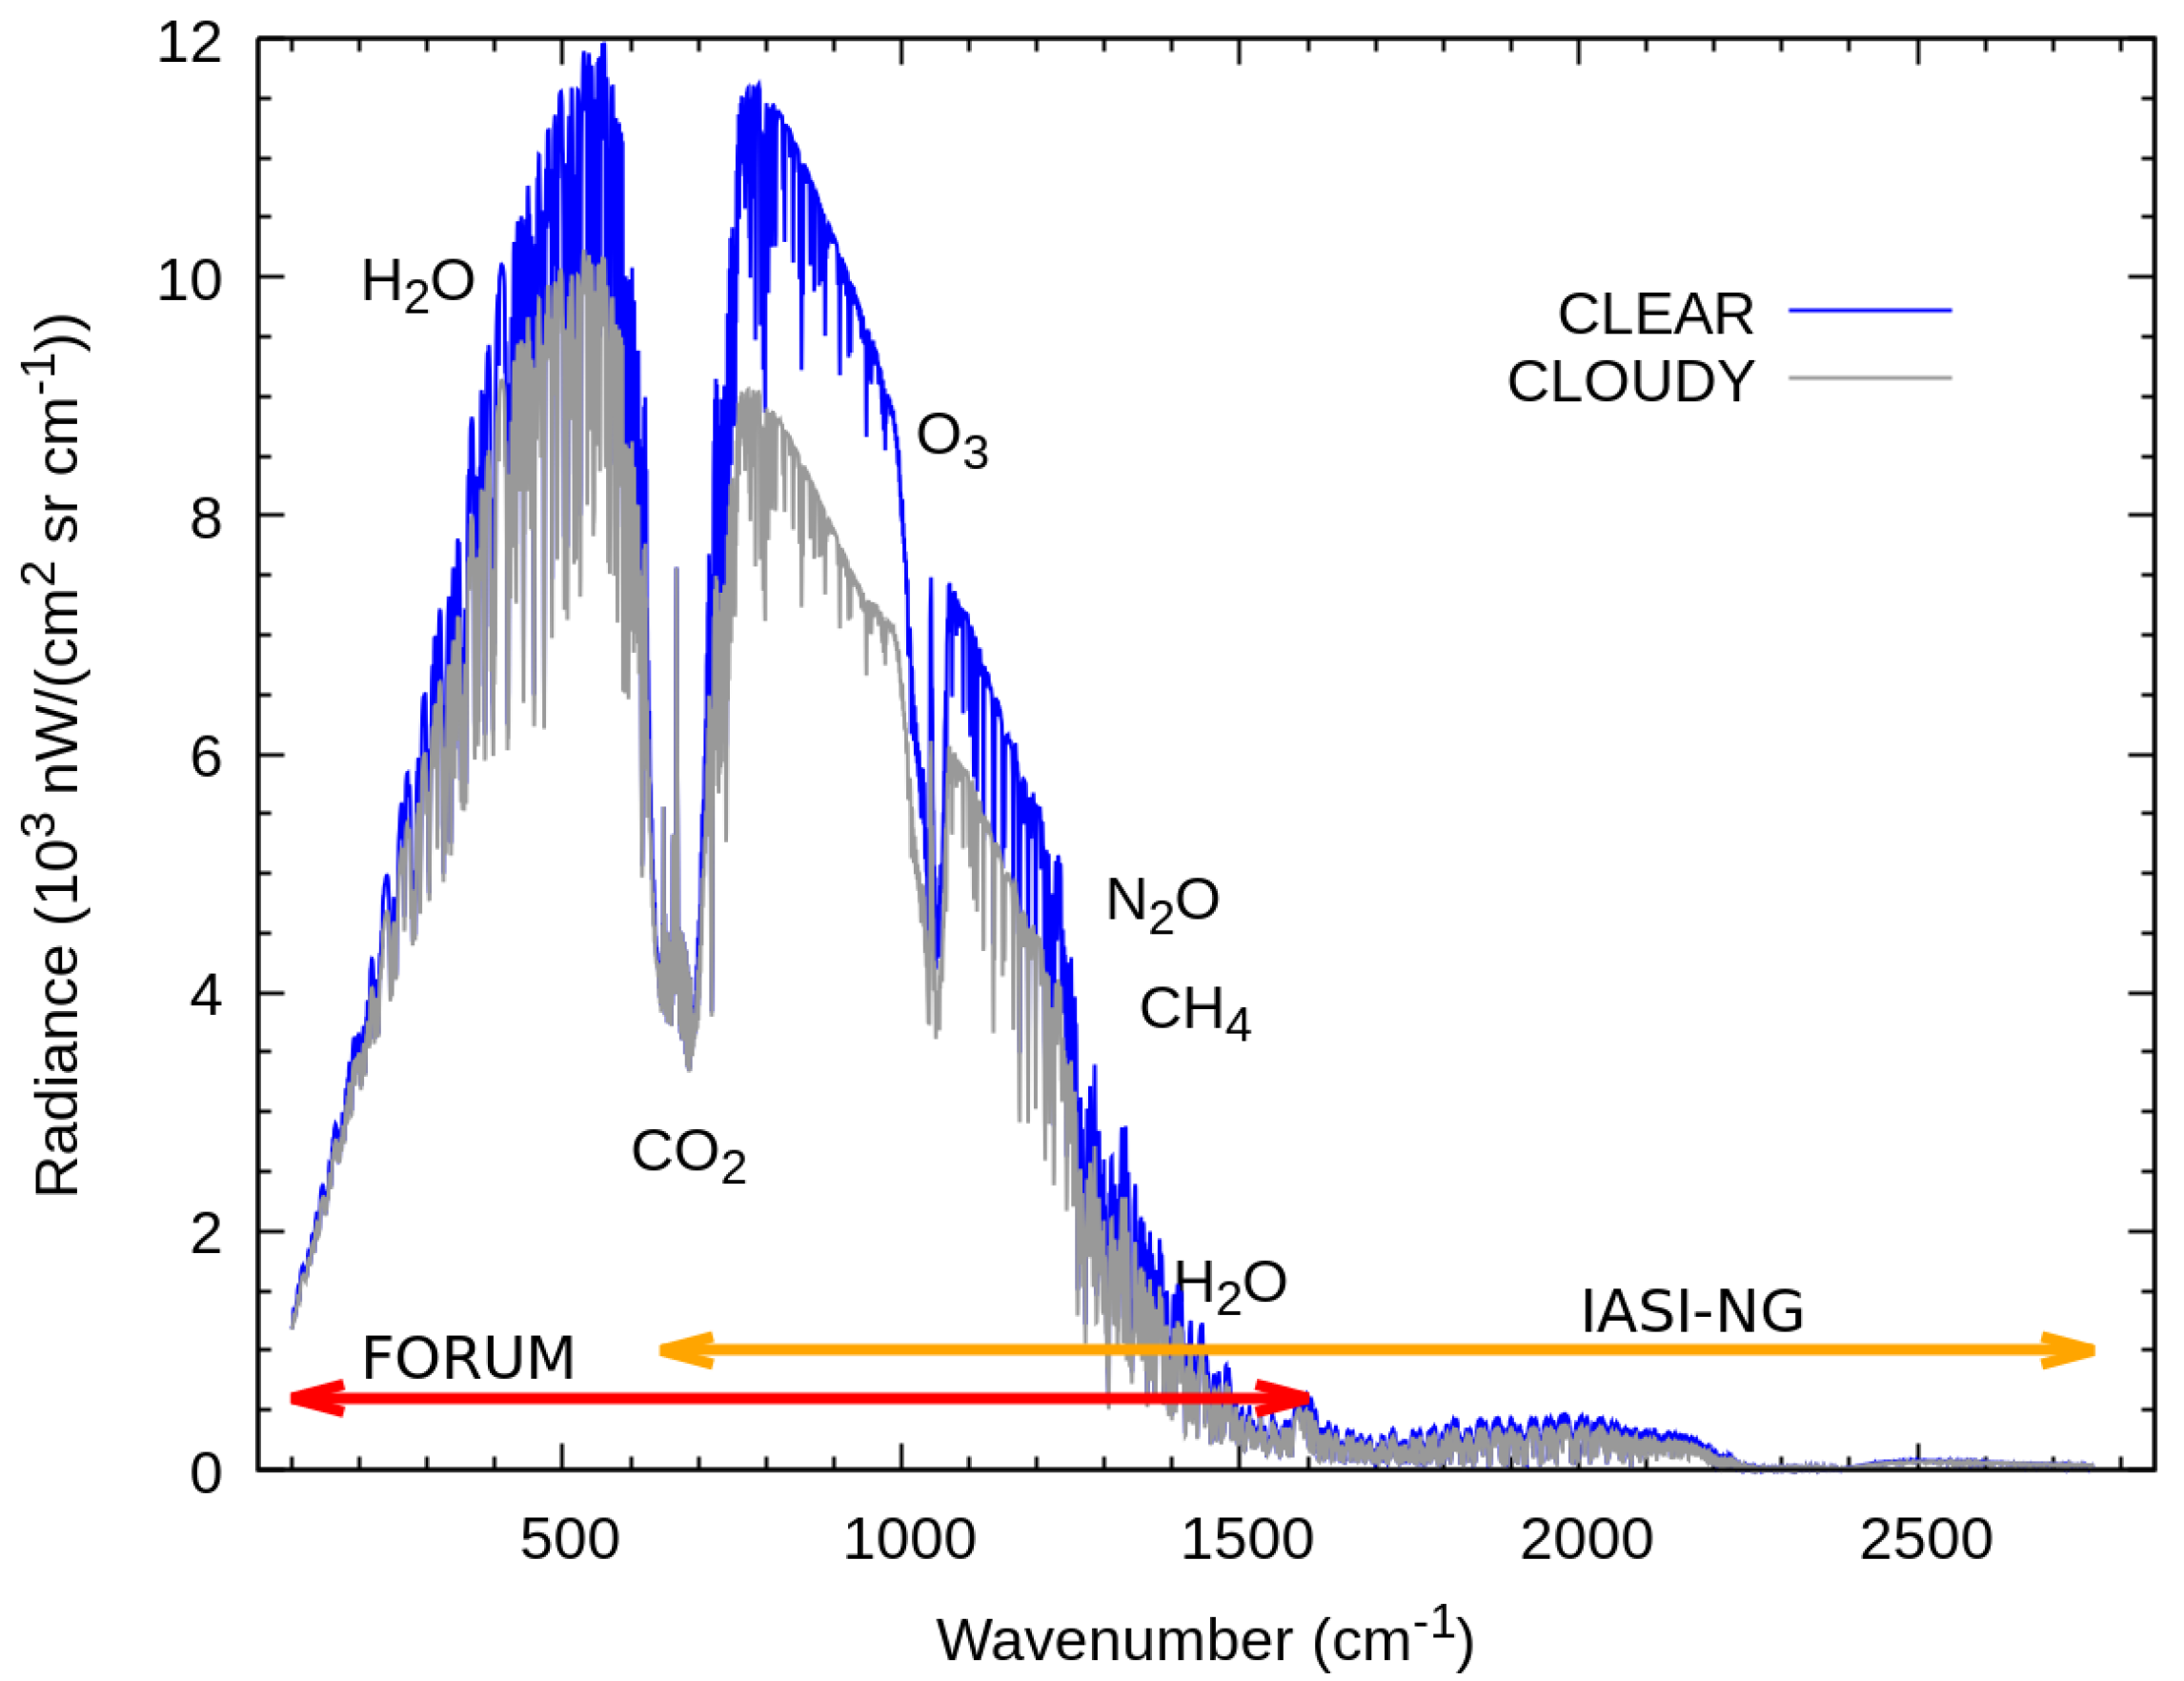
12]. For illustrative purposes,
Figure 1 shows two long-wave upwelling spectra simulated assuming Tropical atmospheric and land surface state parameters. The blue spectrum refers to clear-sky conditions, while for the simulation of the gray spectrum, an ice cloud layer has been introduced between 8.5 and 15.5 km, with a total Ice Water Path (IWP) of 8.9 g/m
and optical depth of 0.34 at 1000 cm
. The plot highlights the FORUM and the IASI-NG spectral ranges, as well as the main absorbing gases. The spectral contribution of the water vapour rotational band in the FIR, and the effect of the ice cloud are clearly visible. The importance of FORUM measurements and their sensitivity to various atmospheric, cloud, and surface parameters are analysed in more detail in [
13].
The calibrated spectral radiance will be, on its own, the main product of the FORUM mission, however, the radiances will also be processed up to Level 2. From the point of view of Level 2 products, while the main atmospheric profiling instrument will remain IASI-NG, the novel product that FORUM will provide is the FIR surface spectral emissivity in dry regions. FORUM Level 2 products will also include the water vapour profile, cloud parameters [
14] and spectral fluxes; all of them are crucial variables in climate studies [
15,
16]. In this work we present the results of (synthetic) retrievals from FORUM clear-sky measurements and show how the product errors can be reduced in all-sky conditions, with the synergistic exploitation of FORUM and IASI-NG matching measurements. We also quantify the impact of the mismatch between the measurements on the final product’s error.
The paper is organised as follows. In
Section 2, we introduce the characteristics assumed for the FORUM and IASI-NG measurements and their expected matching. In
Section 3, we illustrate the results of synthetic retrievals based on FORUM-only, clear-sky measurements. In
Section 4, we show how the matching FORUM and IASI-NG measurements can be exploited for a synergistic retrieval of atmospheric, surface and ice cloud parameters. In that Section, the impact of a mismatch between the measurements on the product’s quality is also analysed. Finally, in
Section 5, we present a summary of the work and draw the conclusions.
2. Instrument Features and Expected Matching
FORUM mission will operate from a Sun-Synchronous Polar orbiting satellite. The orbit characteristics will be the same as for the MetOp-SG-1A satellite, hosting the IASI-NG instrument. Specifically, the repeat cycle of the orbits will be of 29 days, with a length of 412 orbits. The resulting orbit inclination will be of 98.7, with a mean local solar time of 09:30 at the descending node, and an average altitude of 830 km.
The main instrument of the FORUM mission will be a Fourier Transform Spectrometer measuring the Earth’s upwelling spectral radiance [
10]. The measurement technique adopted is named “step and stare”: the instrument line of sight will be adjusted during the individual interferogram acquisitions in a range of
around the nadir, in order to observe a fixed ground pixel for the whole time interval of the measurement. The ground pixel will be circular, with a diameter of 15 km. At the surface, the distance between subsequent measured pixels will be around 100 km. No azimuth scanning is foreseen, therefore the longitudinal distance between the measurements will depend on latitude. The observational repeat cycle will be of 29 days, like the orbit repeat cycle.
The output of the FORUM Level 1 processing chain includes calibrated spectral radiances in the range from 100 to 1600 cm
, with unapodized spectral resolution of 0.5 cm
. The spectral sampling step is ≈ 0.413 cm
. The Noise Equivalent Spectral Radiance (NESR) of the unapodized spectrum is required to be smaller than 40 as
goal (or than 60, as
threshold) nW/(cm
sr cm
) in the range between 200 and 800 cm
and smaller than 100 as
goal (or than 200, as
threshold) nW/(cm
sr cm
) elsewhere. The Absolute Radiometric Accuracy (ARA) of the measured spectrum is specified as a maximum (
) systematic error in brightness temperature, for an observed blackbody with temperatures in the range between 190 and 300 K. The requirements are very stringent in this case, as summarized in
Table 1.
The characteristics assumed here for the IASI-NG instrument are those anticipated in [
17]. Like FORUM, IASI-NG will also measure the upwelling spectral radiance, however its range will be limited to the MIR region, specifically from 645 to 2760 cm
. IASI-NG will be an imaging FTS, therefore it will simultaneously measure the spectra upwelling from 16 circular ground pixels, each with a diameter of 12 km. A set of 16 pixels constitutes a so called Field Of Regard (FOR). The instrument pointing will be scanned in the azimuth (across orbit) direction, to acquire up to 14 FORs on either side of the orbit track, to get a global coverage of the measurements. IASI-NG will provide a spectrum apodized with a Gaussian function with a Full Width at Half Maximum (FWHM) equal to 0.25 cm
, coinciding with the spectral resolution. The spectral sampling step will be of 0.125 cm
. The measurement NESR will be half of the typical NESR of the current IASI instrument onboard of MetOp [
17], while the ARA is specified to be better than 0.25 K (2
) when a blackbody at T=280 K is observed.
Figure 2 summarizes the assumed FORUM and IASI-NG NESR and ARA error specifications. To ease the comparison, all values have been scaled to
and transformed into radiance units, assuming a blackbody source at 280 K.
FORUM orbit parameters will be tuned to meet the following two requirements. First, the maximum distance between the FORUM and MetOp-SG-1A orbit ground tracks shall be less than 100 km as a goal (and less than 300 km as a threshold). Second, the time lag between the two satellites shall be less than 1 min. These requirements are usually summarized by saying that FORUM and MetOp-SG-1A will be flying in loose formation.
Figure 3 illustrates the FORUM and IASI-NG ground sampling patterns for the IASI-NG FORs either side of the sub-satellite track. For these near nadir observations, the distance between the centres of IASI-NG pixels is up to 32 km increasing to about 87 km for the FORs at the edges of the IASI-NG swath (not shown). Since FORUM is single-pixel nadir-viewing, it will only be matched to the IASI-NG pixels close to the FORUM sub-satellite point. The requirement specified above, regarding the maximum distance between the FORUM and MetOp-SG-1A ground tracks, guarantees that the FORUM pixel and the nearest IASI-NG pixel centres will be separated on the ground by less than 23 km (26 km
threshold). This separation is actually the worst case occurring if the FORUM pixel falls right in-between the FORs of IASI-NG. Orbit simulations, however, suggest that with a proper tuning of the offset angle between FORUM and IASI-NG orbits, this distance may range from 6 to 14 km depending on latitude, with an average value around 9.7 km.
For an assumed satellite altitude of 830 km, the above mentioned requirement on the maximum distance between the two satellite ground tracks implies that the two orbit tracks will be within a viewing angle of 6.9 (19.7 threshold). Therefore, the horizontal smearing of the tropospheric (<15 km) air mass sounded by the matched IASI-NG measurement will be less than 2.0 km (6.2 km threshold), i.e., significantly smaller than the maximum allowed distance between the FORUM and IASI-NG pixels (23 km or 26 km as a threshold).
3. Retrievals from FORUM-FTS Synthetic Measurements in Clear-Sky Conditions
In this Section we assess the quality of FORUM-only Level 2 products from clear-sky measurements. The assessment is based on the evaluation of the retrieval uncertainty due to measurement noise and calibration error (NESR and ARA components). The evaluation of other error components, such as the error on the model of the Instrument Spectral Response Function (ISRF), the errors due to interferences of non-retrieved gases, or other forward model uncertainties is considered beyond the scope of the present work. A preliminary analysis of these errors is presented in [
10], showing that their overall contribution is much smaller than the NESR contribution considered here.
As a first step, we simulated the high resolution spectral radiances reaching the satellite instrument for 80 clear-sky atmospheric scenarios selected out of a set of 5000 diverse profiles sampled from the outputs of the Numerical Weather Prediction (NWP) model of the European Center for Medium-range Weather Forecasts (ECMWF) available from the European Organisation for the Exploitation of Meteorological Satellites (EUMETSAT) NWP Satellite Application Facilities (for data and related documentation, see:l
www.nwpsaf.eu/site/software/atmospheric-profile-data/). The diverse profile dataset includes vertical distributions of T, H
O, CO
, O
, N
O, CO, and CH
as a function of pressure. For each profile the dataset also includes data for its geolocation and time of the year, the relative value of the surface pressure, temperature and land/sea classification. These profiles are representative of the full range of atmospheric conditions, spanning different seasons, latitudes (30 polar, 27 mid-latitudes, and 23 tropical latitudes) and surface types (vegetation, snow, ocean, and desert). Vertical profiles of trace gases not included in this dataset were taken from the
Initial Guess for Level 2 (IG2) climatological database [
18]; surface spectral emissivity models were taken from [
19]. In each radiance simulation, the atmosphere and the surface properties are considered constant in the horizontal domain. For the generation of these radiances we used the Linearized Discrete Ordinate Radiative Transfer (LIDORT) model [
20], with gases optical depths provided by the Broad Band (BB)—Nadir model described in [
21] and references therein. The high resolution spectra were computed on a 0.0005 cm
frequency grid using HITRAN2016 spectroscopic database, the same used in the retrieval exercise.
The FORUM apodized synthetic measurements were then obtained as the result of the following steps:
Single pencil-beam, high resolution spectral radiances reaching the instrument are simulated for three pointing angles around the nadir direction (0 and ±0.52), within the instrument FOV aperture (that is ±0.52).
Spectral radiances are then convolved by the ISRF, assumed to be a sinc function with a distance of 0.413 cm between the main maximum and the first adjacent zero (FWHM = 0.5 cm).
For each spectral channel, assuming linear variation of the radiance within the simulated pointing observation angles, we convolve the radiance by the FOV angular response. This latter is assumed constant within the FOV aperture, as the real response is not yet known.
Pseudo-random noise is added, with standard deviation compliant with the
goal (and
threshold) NESR specifications given in
Section 2.
A systematic (spectrally correlated, and the same for all the simulated measurements) error component is added, compliant with the
goal (and
threshold) ARA specifications given in
Section 2.
The spectrum is finally apodized with a Norton-Beer strong function [
22,
23] assuming a Maximum Optical Path Difference (MOPD), so that 1/(2 MOPD) = 0.413 cm
.
We then applied the inversion algorithm to the synthetic measurements. The algorithm is based on the Maximum A-Posteriori (MAP) method [
24] implemented in the KLIMA (Kyoto protocoL Informed Management of the Adaptation) forward/retrieval model [
25]. This model has been extensively validated against BB+LIDORT and the differences have been found to be much smaller than both the ARA and the NESR measurement errors. Based on each synthetic spectrum, we carry out the simultaneous retrieval of temperature, water vapour and ozone profiles, surface temperature and emissivity. The gas Volume Mixing Ratio (VMR) and temperature profiles are retrieved on a vertical grid at fixed pressure levels, corresponding to about 2 km height steps from 0 to 8 km, 1 km steps from 8 to 20 km, and 5 km steps from 20 to 80 km. Surface spectral emissivity is retrieved every 50 cm
, from 100 to 1600 cm
, the initial guess and a-priori emissivity estimates are set equal to 1, with an a-priori error equal to 0.1. The initial guess and a-priori states of the retrieval are assumed equal to their true value (i.e., the value used to generate the synthetic observation) increased by an amount equal to the error assumed for the a-priori. These latter errors are those used at the United Kingdom MetOffice for the assimilation of the current IASI measurements in their operational NWP model. The specific a-priori errors used for the various target parameters of the retrieval are included in the figures presented later.
To check the self-consistency of the inversion we computed the normalized chi-square () of the retrieval and the statistics of the residuals (differences between synthetic observation and simulated radiance).
The left panel of
Figure 4 shows the normalized chi-square of the retrieval at the beginning of the inversion procedure (red symbols) and at convergence (green symbols), for the different test cases explored (horizontal axis). Despite the large initial values, at convergence the
is very close to 1 as expected, suggesting: (a) proper convergence to a good minimum and (b) that the differences between the two forward models (BB+LIDORT and KLIMA) used for the generation of the observations and for the retrieval are negligible when compared to the measurement NESR and ARA errors. The right panel of
Figure 4 compares, for each spectral channel, the standard deviation of the residuals (light green) with the NESR level relative to the apodized spectrum (dark green), and the average residuals (orange) with the systematic calibration error of the apodized spectrum, estimated for a temperature of 280 K (red). It is clear that the statistics of the residuals is fully compliant with the random and systematic error components added to the synthetic spectrum, thus confirming the above conclusions regarding the
statistics.
We compute the errors on the retrieved parameters as the square roots of the diagonal elements of the covariance matrix
of the retieval:
where
is the Jacobian of the forward model simulating FORUM measurements at convergence,
is the error covariance matrix of the a-priori state vector, and
the covariance matrix representing the noise and calibration errors of the synthetic observation. In the test retrievals presented here,
is computed as the summation of two covariance matrices:
.
represents the NESR error of the apodized spectrum. While the NESR error is spectrally uncorrelated in the original unapodized spectrum, apodization decreases the Root Mean Square (RMS) of the noise and introduces spectral correlations. These effects are both taken into account when setting up
.
represents the systematic component of the calibration error, which is assumed as fully correlated in the spectral domain.
When dealing with synthetic retrievals, the true atmospheric and surface states that generated the observations are known, therefore the total retrieval error can also be evaluated as the RMS of the differences between retrieved and true parameters. For the set of synthetic retrievals at mid-latitudes (27 cases), the retrieval errors evaluated from the square roots of the diagonal elements of Equation (
1) show little relative variations within the set, therefore, for this specific scenario we verified that the average error evaluated from Equation (
1) is equivalent to the RMS of the differences between retrieved and true parameter values. After this check, Equation (
1) has always been our preferred option for the calculation of the retrieval error.
Figure 5 shows the average retrieval errors from Equation (
1) for
goal (solid lines) and
threshold (dashed lines) NESR and ARA requirements. The plots from top left to bottom right refer to temperature, H
O, O
and surface emissivity profiles, respectively. Different colors refer to different latitude bands: Polar (75
–90
, blue lines), Middle (30
–75
, green lines) and Tropical latitudes (0
–30
, red lines). The solid black lines indicate the assumed a-priori errors.
Table 2 reports the average retrieval error of surface temperature for the various latitude bands. As we can see, the retrieval errors of the water profile and surface emissivity depend quite markedly on the atmospheric scenario considered. Particularly, we note that the H
O VMR error in the UTLS amounts to 12–15% in Polar- and Middle- Latitudes, and decreases to 10% or less at the Tropics. This indicates that the relative water vapour error changes inversely with the water vapour amount itself. On the other hand, the error on surface emissivity in the FIR is reasonably small only if the atmosphere is sufficiently dry (as in the Polar cases). Moving from Middle- to Tropical- latitudes, the water vapour column increases, the atmosphere becomes progressively more opaque and the width of the FIR spectral interval where FORUM is sensitive to the surface properties decreases.
This interpretation is confirmed by the analysis of the averaging kernels (AKs) and of the degrees of freedom (DOFs, trace of the averaging kernel matrix, see [
24]) of the various retrieval vector components.
Figure 6,
Figure 7 and
Figure 8 show typical relative AKs of H
O profile and surface emissivity for Polar-, Mid- and Tropical- latitudes, respectively.
Figure 9 shows the number of DOFs for the various target parameters of the retrieval as a function of latitude. Again, we see that the sensitivity of the measurements to the target profiles, changes on the basis of the observational scenario examined. Interestingly, in the Polar Winter dry atmospheres, many AKs relating to the surface emissivity show a diagonal element very close to one, indicating that, as compared to the measured spectrum, in this case the a-priori information contributes only very marginally to the inversion. In other words, in these conditions the observing system is able to capture variations in the true surface emissivity.
The relatively small number of DOFs for temperature, H
O and O
profiles shown in
Figure 9 is a direct consequence of the realistically small a-priori errors we used in our tests for these variables: In these cases the information gain over the a-priori knowledge is limited. The behaviours reported in
Figure 9 also show that the sensitivity of the measurements to temperature, H
O and O
profiles increases when moving from Polar to Equatorial conditions (i.e., as soon as temperature and water vapour content increase). Conversely, the sensitivity to surface emissivity and surface temperature is greater in cold, dry scenarios, when the atmosphere is more transparent.
4. Synergies with IASI-NG
Flying the FORUM mission in loose formation with the EUMETSAT MetOp-SG-1A satellite offers many benefits. There is a strong synergy between the FORUM FIR spectral measurements and IASI-NG MIR spectral observations. Together, the FORUM mission and IASI-NG, will deliver unique hyperspectral observations of Earth’s emission spectrum spanning almost five octaves in frequency, from 100 to 2760 cm and comprising virtually the whole long-wave range of Earth’s outgoing energy. Matching FORUM and IASI-NG measurements will offer the opportunity for synergistic retrieval schemes to generate improved Level 2 products, specifically: surface spectral emissivity and temperature, cloud parameters, temperature and water vapour profiles.
With the term
synergistic retrieval, here we indicate the simultaneous inversion of the matching measurements of two instruments, to determine an unique atmospheric and surface state. In this work we assess the improvements in the synergistic retrieval products over the FORUM-only products, in terms of error and degrees of freedom of the solution. Considering the huge computational effort that would be required to perform a full synergistic simulated inversion with our KLIMA forward/retrieval model, this assessment is based only on the evaluation of the retrieval error and of the averaging kernels of the solution. Since FORUM and IASI-NG measurements will be fully independent from each other, the synergistic retrieval error covariance matrix can be computed as:
where
and
are the Jacobians of the forward model simulating FORUM and IASI-NG measurements, respectively.
and
are the covariance matrices representing FORUM and IASI-NG measurement errors and, as usual,
is the error covariance matrix of the a-priori state vector. The averaging kernel matrix of the synergistic inversion is given by:
First we compare the FORUM-only Level 2 products with the synergistic FORUM plus IASI-NG products, assuming perfectly matching (both in time and space) measurements. In this configuration the error covariance matrices and account only for the NESR and the ARA of the two instruments. Secondly, we study the effect of possible mismatches between the measurements, either in time and/or in space. Mismatches are treated as additional error components affecting the IASI-NG measurement, arising from the fact that the instrument is not sounding exactly the same atmosphere and/or surface as FORUM.
As one could easily imagine, the most relevant mismatch error source stems from the different cloud coverage that may affect the two measurements, therefore for this assessment we focus more on cloudy scenarios. Specifically, we consider only three clear-sky atmospheric scenarios (Antarctic Winter over ice, Mid-Latitude Spring over land, and Tropical Summer over ocean) selected out of the 80 scenarios used for the analysis presented in
Section 3, and 21 scenarios with a single ice cloud layer. Again, these ice cloud cases are selected out of the 5000 diverse profiles dataset described in
Section 3. In this case, the variables extracted from this dataset are the profiles of temperature, water vapour, ozone and cloud water content (ice and liquid). The Jacobians
and
are obtained by convolving with the respective FORUM and IASI-NG apodized ISRF’s, the high resolution Jacobians computed by the LIDORT radiative transfer model [
20], with gases optical depth computed by the Line-By-Line Radiative Transfer Model (LBLRTM) [
26].
For this assessment we assume in all cases a simultaneous retrieval of the following target parameters: temperature, H
O and O
VMR profiles with 1 km vertical retrieval grid steps in the 0–50 km range, surface temperature and spectral emissivity (from 100 to 2700 cm
with 50 cm
steps). In the cloudy cases, three additional scalar parameters are included in the retrieval vector. They represent: Ice Water Path (IWP, that is the total vertical column of ice, in g/m
[
14]), Cloud Top Height (CTH) and Cloud Bottom Height (CBH).
As an example,
Figure 10 and
Figure 11 show the retrieval errors for the H
O VMR profile (left panels) and surface emissivity (right panels).
Figure 10 refers to a clear-sky Antarctic Winter scenario over ice, while
Figure 11 refers to a Tropical atmosphere over sea scenario.
Figure 12 shows the retrieval errors in surface temperature and cloud parameters (IWP, CTH and CBH), for the various atmospheric scenarios considered. Each measurement scenario is characterized by a given value of IWP as reported in the horizontal axis of the plots. In the panel relating to surface temperature, the three clear-sky scenarios (Polar Winter, Mid-Lat Spring and Tropical) are artificially associated with IWP values less than 0.01 g/m
to enhance plot clarity (see the grey area in the top left plot of
Figure 12). The black lines show the a-priori error assumed in the retrieval, the red symbols indicate the error achieved with the inversion of FORUM-only measurements and the blue symbols refer to the error associated with the synergistic retrieval of FORUM plus IASI-NG measurements. As we can see from
Figure 12, the synergistic retrieval with IASI-NG results in marked reductions of the retrieval errors in most of the cases. The synergistic retrieval typically reduces the surface temperature error by about one order of magnitude. In the case of cloud parameters, the synergistic use of IASI-NG measurements is also effective at reducing the retrieval errors, with the error reductions dependent on the value of IWP.
In the Antarctic Winter case of
Figure 10, the atmosphere is very dry and therefore it is sufficiently transparent in the FIR region to be able to retrieve surface emissivity with small uncertainty across the majority of the IR. Due to the relatively small thermal contrast between the surface and the troposphere, water vapor is retrieved with a larger relative error as compared to Tropical cases. The Tropical case illustrated in
Figure 11 is somehow symmetrical to that of
Figure 10: in this case the large amount of water in the lower atmosphere prevents the detection of the surface characteristics in the FIR region. On the other hand, due to the large thermal contrast between the lower and the upper troposphere, water vapor is retrieved with smaller relative uncertainty as compared to the Polar case. These findings for the synergistic retrieval approach confirm the behaviors already observed in
Section 3 for the FORUM-only inversions. In
Figure 10 and
Figure 11, the differences between red and blue curves highlight the improvements achieved with the synergistic FORUM plus IASI-NG retrievals. We see that, while the H
O VMR error is reduced quite marginally when IASI-NG measurement is used, the error on the retrieved surface emissivity turns out to be significantly reduced. Particularly, we see that in the Polar case, in the FIR region between 300 and 600 cm
, we get a 70% reduction of the error as compared to the inversion of the FORUM measurement alone. Note that this error reduction occurs despite the fact that IASI-NG measurements do not cover the FIR spectral region. Thanks to the very high signal-to-noise ratio of the IASI-NG measurements in the so called
atmospheric window (In the absence of optically thick clouds, the region between 780 and 980 cm
(the atmospheric window) is very transparent and therefore the radiance measurements are particularly sensitive to surface and near-surface state parameters.) (see
Figure 2), when these measurements are included in the inversion, a significant reduction of the errors in the retrieved temperature profile and surface temperature is observed (see, e.g., the top left panel of
Figure 12). Due to the correlation among retrieval parameters, and especially between surface emissivity, surface temperature and temperature in the lowest atmospheric layers, using IASI-NG measurements results in a significant reduction of the error on the whole set of retrieved parameters, including surface emissivity in the FIR.
Figure 13 shows the DOFs connected to the various sets of retrieval parameters as a function of the IWP value of the test case. In the presence of ice clouds, atmospheric opacity is more sensitive to IWP rather than to the meridional atmospheric variability, therefore, for these tests we decided to show the behaviour of the DOFs as a function of IWP rather than as a function of latitude as we did in
Figure 9 that includes only clear sky scenarios. For clarity, in
Figure 13 the three clear sky scenarios (Polar Winter, Mid-Lat Spring and Tropical) are artificially associated to IWP values less than 0.01 g/m
. Open symbols refer to the FORUM-only observing system, full symbols to the synergistic FORUM plus IASI-NG retrieval. From the plot it is evident that the synergistic inversion significantly increases the number of DOFs only in the cases in which the FORUM-only retrieval shows errors close to the assumed a-priori error. It is also very interesting to note that in the thickest ice cloud cases considered (i.e., for IWP > 10 g/m
) the FORUM-only surface temperature error rapidly increases and the related DOFs become less than 1. In these cases the synergistic retrieval nicely helps in keeping sufficiently small the surface temperature error and the related DOFs close to 1. Suggestively, one could say that the synergistic retrieval helps in seeing through the cloud.
Note that a marginal increase in the DOFs (i.e., a small distance between a given open symbol of
Figure 13 and its full counterpart) does not imply that the synergistic retrieval is not beneficial in that specific test case. For example, the first scenario plotted in
Figure 13 (for IWP = 0.0015 g/m
) refers to the Antarctic Winter retrieval whose errors are plotted in
Figure 10. For this specific scenario the synergistic retrieval implies a negligible increase in the FIR emissivity DOFs, however, from the right panel of
Figure 10 we see that the synergistic retrieval error in FIR surface emissivity is much smaller than that of the FORUM-only retrieval error.
4.1. Matching Errors
If a mismatch between FORUM and IASI-NG measurements exists, we expect the improvements achieved with the synergistic inversion to be reduced. We evaluate the impact of measurement mismatch on the synergistic retrieval by assigning to the IASI-NG measured spectral radiance an additional error component, named
matching error, that accounts for the fact that the measurement of the second instrument is not exactly acquired for the same atmospheric and surface conditions as those of the FORUM measurement. In this case, the covariance matrix representing the error on the IASI-NG spectrum is written as:
In this expression, and are the covariance matrices accounting for the measurement noise and the systematic mis-calibration error components, respectively. The summation on the right side accounts for the matching error components that may affect the IASI-NG measurement. For example, if a time lag exists between the measurements, the HO profile may be different in the two measurements. This change will be factored by a term of the summation, with an covariance matrix representing the HO profile variability in time intervals of length , and a matrix representing the forward model Jacobian with respect to the HO profile.
In our assessment we considered the following mismatch error components, with characteristics compliant with the FORUM orbit requirements presented in
Section 2:
Natural variability of HO VMR and temperature profiles in 23 km radius areas.
Natural variability of HO VMR profile in 1 min. time intervals.
1 K variability of surface temperature (typical variability in 23 km radius areas).
20% variability of surface emissivity, to account for the cases in which the surface type is different in the two matching measurements.
2% and 10% opaque cloud fraction difference between FORUM and IASI-NG FOVs. This mismatch error component accounts for the cases in which an opaque cloud slides in- or out- of the instrument’s FOV in a time lag of 1 or 5 min, respectively, between the two measurements. The 5 min. time-lag was included in the calculations just for testing purposes. Given the 1 min. requirement on the time delay between FORUM and IASI-NG, this considered case should never occur.
We estimate the covariances of the variabilities from 1 to 4 on the basis of high-resolution (1.5 km) atmospheric and surface fields provided by a NWP model run at the UK MetOffice, for a limited geographical area over the UK, and for three different times of the day of 25 January 2018. These variabilities are considered typical for mid-latitude, Winter conditions. Larger variabilities may be expected in specific geographical areas and seasons; however, due to the large computational effort needed to run such an high-resolution model, we necessarily had to limit this analysis to a restricted region and time period. For operational data analysis, these variabilities may need to be evaluated for different latitude bands or geographical areas, and different seasons.
We compute
by including in Equation (
4), alternatively, the individual mismatch errors listed above. In each of the cases, we then compute the synergistic retrieval error with Equation (
2). To illustrate how the performance of the synergistic retrieval degrades as soon as the different mismatch errors come into play, we compute the ratio
r between the synergistic retrieval error and the FORUM-only retrieval error for the various retrieval parameters. In case of vector retrieval parameters, i.e., in the cases of H
O- and T- profiles and in the case of the surface spectral emissivity, the average of
r over the vector elements is computed. Values of
r much smaller than 1 indicate that a marked reduction of the error is achieved using the synergistic retrieval relative to the FORUM-only retrieval. Values of
r approaching unity indicate that a negligible error reduction is obtained using the synergistic retrieval.
Figure 14 and
Figure 15 show, for each retrieved parameter, the error reduction factor
r as a function of the IWP for the various measurement scenarios considered. The blue symbols refer to the case of perfect matching of the measurements. The other coloured symbols refer to the error reduction factors achieved in the presence of the individual mismatch errors, as indicated in the plot’s key. We see that, in general, the mismatch errors due to variations of water and temperature profiles (cyan and orange symbols, respectively) cause only a marginal loss of the improvements obtained in the synergistic retrievals. The case in which an opaque cloud significantly slides in or out of the instrument FOV, is the most critical (grey and black symbols). In this case the improvements achieved with the synergistic retrieval are partially or significantly lost depending on the retrieval variable. Significant differences in the emissivity and the temperature of the ground surfaces sounded by the two instruments (green and red symbols, respectively) also result in a reduction of the improvement obtained in the synergistic retrieval of surface emissivity.
In operational conditions, the total error of the synergistic retrieval can be computed
case by case, using Equation (
2), with
given by Equation (
4), taking simultaneously into account all the actual components of the mismatch error. The individual components can be evaluated on the basis of available auxiliary information and measurements. For example, differences in cloud fraction between FORUM and IASI-NG FOVs can be estimated via the FORUM embedded imager and/or the MetOp-SG-1A Meteorological Imager (MetImage) measurements. Similarly, geolocation data and maps of surface type can be used to check if the ground pixels of the two instruments are sounding surfaces with significantly different spectral emissivity. A mitigation strategy can be devised to cope with the most unfavourable matching conditions, producing a total error of the synergistic retrieval similar to the FORUM-only retrieval error (
). A possibility for these difficult cases, could be to skip the synergistic retrieval and carry out the FORUM-only inversion, using as a-priori the only target quantities retrieved from IASI-NG that are believed to differ very little between the scenarios sounded by the two instruments. For example, if the surfaces sounded by the two instruments are found to differ significantly in terms of emissivity, one could just use the H
O VMR and the Temperature profiles retrieved from IASI-NG as an a-priori constraint in the FORUM-only retrieval.
5. Conclusions
In the first part of this work we assess the performance of the Level 2 products expected from FORUM clear-sky measurements. The assessment is limited to the study of the error components due to measurement noise (NESR) and the systematic uncertainty on the radiometric calibration (ARA). The main clear-sky Level 2 products of the FORUM mission will be the water vapour VMR in the UTLS region (150–400 hPa) and surface spectral emissivity of the Polar regions in the FIR (specifically in the range from 300 to 600 cm). We find that the retrieval performance depends on the actual atmospheric and surface scenario sounded. In dry Polar atmospheres it will be possible to retrieve the FIR surface emissivity with an absolute error smaller than 0.01, and the HO VMR profile in the UTLS with an error of less than 15% and a sampling step of 1 km. As soon as the atmosphere becomes more opaque, moving from Polar- to Mid- and Tropical- latitudes, the sensitivity of the measurements to surface parameters decreases and, therefore, the error on the FIR surface emissivity becomes very large. Conversely, the sensitivity of the measurements to the UTLS water vapour increases as moving towards the Equator, and the HO VMR error ranges from 15% in Polar regions, to about 10% at the Tropics.
In the second part of the work, we analyse the improvements of the Level 2 products achieved when the co-located measurements of IASI-NG are exploited in the inversion. Assuming a perfect matching of the measurements, we find that the error on the FIR surface emissivity comes down to values as small as 0.001 in dry, Polar atmospheres. The quality of the HO VMR profile also benefits from the synergistic inversion of the IASI-NG measurements, however, the improvements are not as dramatic as in the case of surface emissivity. We also explore the advantages of the synergistic inversion of FORUM and IASI-NG measurements in the presence of ice clouds. We find that, while the product’s error depends on the cloud optical thickness, the advantages obtained from the synergistic inversion are preserved also in the presence of ice cloud layers, at least for IWP in the range from 0.01 to about 60 g/m. For IWP > 0.2 and < 60 g/m, the synergistic inversion delivers IWP with a retrieval error of less than 10% and CTH with error < 1 km.
In the last part of the work we analyse the effect of both time- and space- mismatches between FORUM and IASI-NG measurements on the synergistic retrieval products. For measurement mismatches compatible with the current FORUM and IASI-NG orbit requirements, the most significant errors arise when: different surface types are sounded by the two instruments (with different emissivities and temperatures) and when a different cloud fraction affects the two measurements. These error sources may significantly attenuate the advantages obtained from the synergistic inversion. Nonetheless, in operational conditions, thanks to both correlative imager measurements (from MetOp-SG-1A MetImage and the FORUM Embedded Imager) and geographical maps, it will be possible to detect, quantify and mitigate the effect of the mismatch error sources.
Note that the errors due to the interferences of non-retrieved gases and other forward model uncertainties will also contribute to the total error budget of the Level 2 products. These components, however, are expected to be much smaller than the error due to NESR [
10]. For this reason, and to keep this work more focused, these error components are not considered here, they will be dealt with in a future work.

 ,
, 


