Letter

Assessing the Applicability of Mobile Laser Scanning for Mapping Forest Roads in the Republic of Korea

1
Institute of Ecological Restoration, Kongju National University, 54 Daehak-ro, Yesan-eup, Yesan-gun, Chungcheongnam-do 32439, Korea
2
Department of Forest Resources, Kongju National University, 54 Daehak-ro, Yesan-eup, Yesan-gun, Chungcheongnam-do 32439, Korea
3
Department of Environment and Forest Resources, Chungnam National University, 99 Daehak-ro, Yuseong-gu, Daejeon 34134, Korea
*
Author to whom correspondence should be addressed.
Remote Sens. 2020, 12(9), 1502; https://doi.org/10.3390/rs12091502
Submission received: 8 April 2020 / Revised: 4 May 2020 / Accepted: 6 May 2020 / Published: 8 May 2020

Abstract

:
Forest roads are an essential facility for sustainable forest management and protection. With advances in survey technology, such as Light Detection and Ranging, forest road maps with greater accuracy and resolution can be produced. This study produced a 3D map for establishment of a forest road inventory using a Mobile Laser Scanning (MLS) device mounted on a vehicle in four study forest roads in Korea, in order to review its precision, accuracy and efficiency based on comparisons with mapping using Total Station (TS) and Global Navigation Satellite System (GNSS). We counted the points that consist of the cloud data of the maps to determine the degree of precision density, and then compared this with 50 points at 20-m intervals on the centerlines bisecting the widths of the study forest roads. Then, we evaluated the relative positional accuracy of the MLS data based on three criteria: the total length of each forest road; the Root Mean Square Error (RMSE) obtained from coordinate values of the MLS and TS surveys compared to the GNSS survey; and the ratios of the centerlines extracted by the MLS and TS surveys overlaid to the buffer zone by the GNSS survey. Finally, we estimated the time and cost per unit length for producing the map to examine the efficiency of MLS mapping compared to the other two surveys. The results showed that the point cloud data acquired by the MLS survey on the study forest roads had very high precision and so is sufficient to produce a 3D forest road map with high-precision density and a low RMSE value. Although the equipment rental cost is somewhat high, the fact that information targeting on all spatial elements of forest roads can be obtained with a low cost of labor is a benefit when evaluating the efficiency of MLS survey and mapping. Our findings are expected to provide a quantitative assessment of both maintaining sustainable effectiveness and preventing potential environmental damage of forest roads.

Graphical Abstract

1. Introduction

Worldwide, forest roads are essential facilities for the sustainable management and conservation of forests with economic and/or public value [1,2,3,4]. Forest roads, however, are low-volume roads built not only on lowland areas but also on rough terrain in the forest, so they may have both steep longitudinal lines and complex planar features [5]. They therefore need to be well-managed to maintain their sustainable effectiveness and to prevent potential environmental damage. For the systematic management of forest roads, the acquisition and inventory of spatial information of the roads should be prioritized. In addition, monitoring changes in the spatial information and follow-up treatments based on these changes are required.
The acquisition of spatial information related to forest roads is drawing keen attention due to the recent development of survey technology [6]. In particular, the development of technology for processing and analyzing data obtained through laser and photographic measurements has enabled efficient surveys and analysis of forest resources. Light Detection and Ranging (LiDAR) surveys using Aerial Laser Scanning (ALS) and Terrestrial Laser Scanning (TLS) technologies can efficiently acquire and visualize high-resolution forest spatial information, and thus are widely used for characterizing forest resources and topography. Conceptually, aircraft-based ALS should be suitable for measurements targeting a relatively wide range of forest spaces [3,7,8,9], and ground point-based TLS should be suitable for measurements targeting a relatively narrow range of forest spaces [10,11,12,13]. However, LiDAR surveys are limited to obtaining spatial information on forest roads in the form of lines. For example, it is challenging if not impossible to use ALS for surveying cut- and fill-slopes that are shielded by stand crowns; and it is difficult to survey long stretches of forest roads within a short timeframe by using TLS. Unmanned Aerial Vehicles (UAVs) can be suggested as an alternative, but their low battery charge greatly limits survey time [14]. As one of the ways to overcome these limitations, Mobile Laser Scanning (MLS) is a highly advanced mapping technology that can acquire and visualize spatial information on and around forest roads [15]. In particular, MLS equipped vehicles is a technology that is accurate and efficient, and can help rational decision making for systematic forest road management by obtaining the best spatial information for given spatiotemporal conditions.
Research on MLS dates back to the early 1970s when research on measurement technology using film cameras was conducted. Later, the use of Global Positioning Systems (GPS) expanded and the production and analysis techniques of images were developed, evolving into an image-based mapping technique by the late 1980s [16]. In the 1990s, MLS techniques went through a technological sophistication phase, and in the 2000s, high-performance MLS laser scanning sensors began to be used [17]. As a representative study, Grejner-Brzeinska et al. [18] suggested ways to overcome the effects of gravity, eliminate signal noise, and mitigate Inertial Measurement Unit (IMU) errors to increase the positioning accuracy of GPS and Inertial Navigation Systems (INS), which are the basic elements of MLS. During the 2010s, practical application and industrialization of MLS technology became well-established. For example, De Agostino [13] obtained spatial information related to rock walls adjacent to roads using vehicle MLS and then corrected that information with a Global Navigation Satellite System (GNSS), thereby providing a reliable technique to manage areas vulnerable to rock collapse and falls. In addition, Qin et al. [19] proposed a line-based model to improve accuracy by combining Point Cloud Data acquired using MLS with images taken on the ground. Cui et al. [20] set a line-based model for point cloud data and panoramic images acquired through MLS, applying a multisensor in urban areas, and evaluated the accuracy of the converted model by Root Mean Square Error (RMSE) analysis. Recently, MLS surveys are used to acquire and analyze on- and off-road information inventory, including the detection and extraction of on-road objects (e.g., road surface, road crack, and driving line) and off-road objects (e.g., traffic lights, signs, and utility poles), to use as the basis of Advanced Driving Assistant Systems [21,22]. Nevertheless, few studies have dealt with cases in which MLS has been applied to the field of forestry because that there are severe limitations on using laser scanning systems due to vegetation in forested areas, unlike urban areas [15,21]. Exception only includes several studies have mainly investigated the accuracy of measuring tree diameter by handheld MLS system [23,24,25]. Upon considering the spatial peculiarity of forests, it may be very labor-intensive to collect large quantities of high-quality spatial information. However, it is expected that it will be relatively easy to obtain large quantities of high-quality spatial information on and around the forest roads where the crown layer of forests is opened due to the tree cutting, which is considered a great advantage in building an inventory for forest road management.
From this background, this study was aimed at using a MLS system to accurately and conveniently acquire rich spatial information on and around forest roads, and thereby to provide precise data for efficient forest road management. The objectives of this study were: (i) to produce 3D forest road maps using MLS system, including characterization of both on-road surface and cut- and fill-slopes, and (ii) to evaluate MLS precision density, relative positional accuracy, and mapping efficiency by comparing it to data obtained by GNSS and Total Station (TS) techniques. To achieve these objectives, we conducted the study in the order shown in Figure 1.

2. Materials and Methods

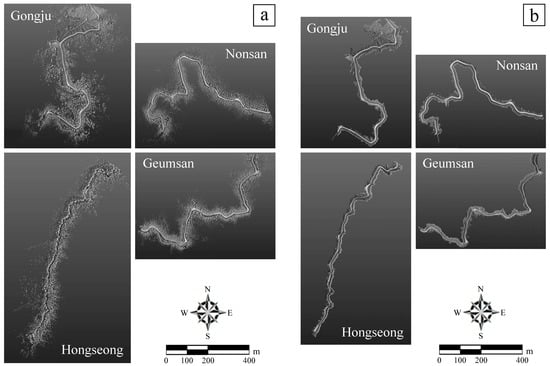
2.1. Study Site Descriptions

In the study, four forest roads, one each from four forested areas in Gongju-si, Nonsan-si, Hongseong-gun, and Geumsan-gun in Chungcheongnam-do, Republic of Korea, were selected as the study sites for the 3D forest road mapping using MLS. These forests, covered with mixed pines and oaks of approximately 40 years in age, are managed by the local government and on steep and rugged terrain at an altitude of 100–500 m above sea level.
The four road routes selected for the study were unpaved with lengths approximately equal to each other. Based on the GNSS survey, the Gongju route was 1022 m, the Nonsan route was 1015 m, and the Hongseong and Geumsan routes were 1019 m. The difference in altitude above sea level within each road route was the largest in the Nonsan route with 62.7 m, the smallest in the Gongju route with 11.7 m, and the Geumsan route (34.7 m) and Hongseong route (19.3 m) were intermediate. The forest roads were newly built within the last two years on hillslopes with steep cross-sectional gradient, and in a condition that both the cut-and-fill slope surfaces of the road routes were not yet fully covered with even understory vegetation.
The locations and general characteristics of the sites subject to field investigation are shown in Figure 2 and Table 1.

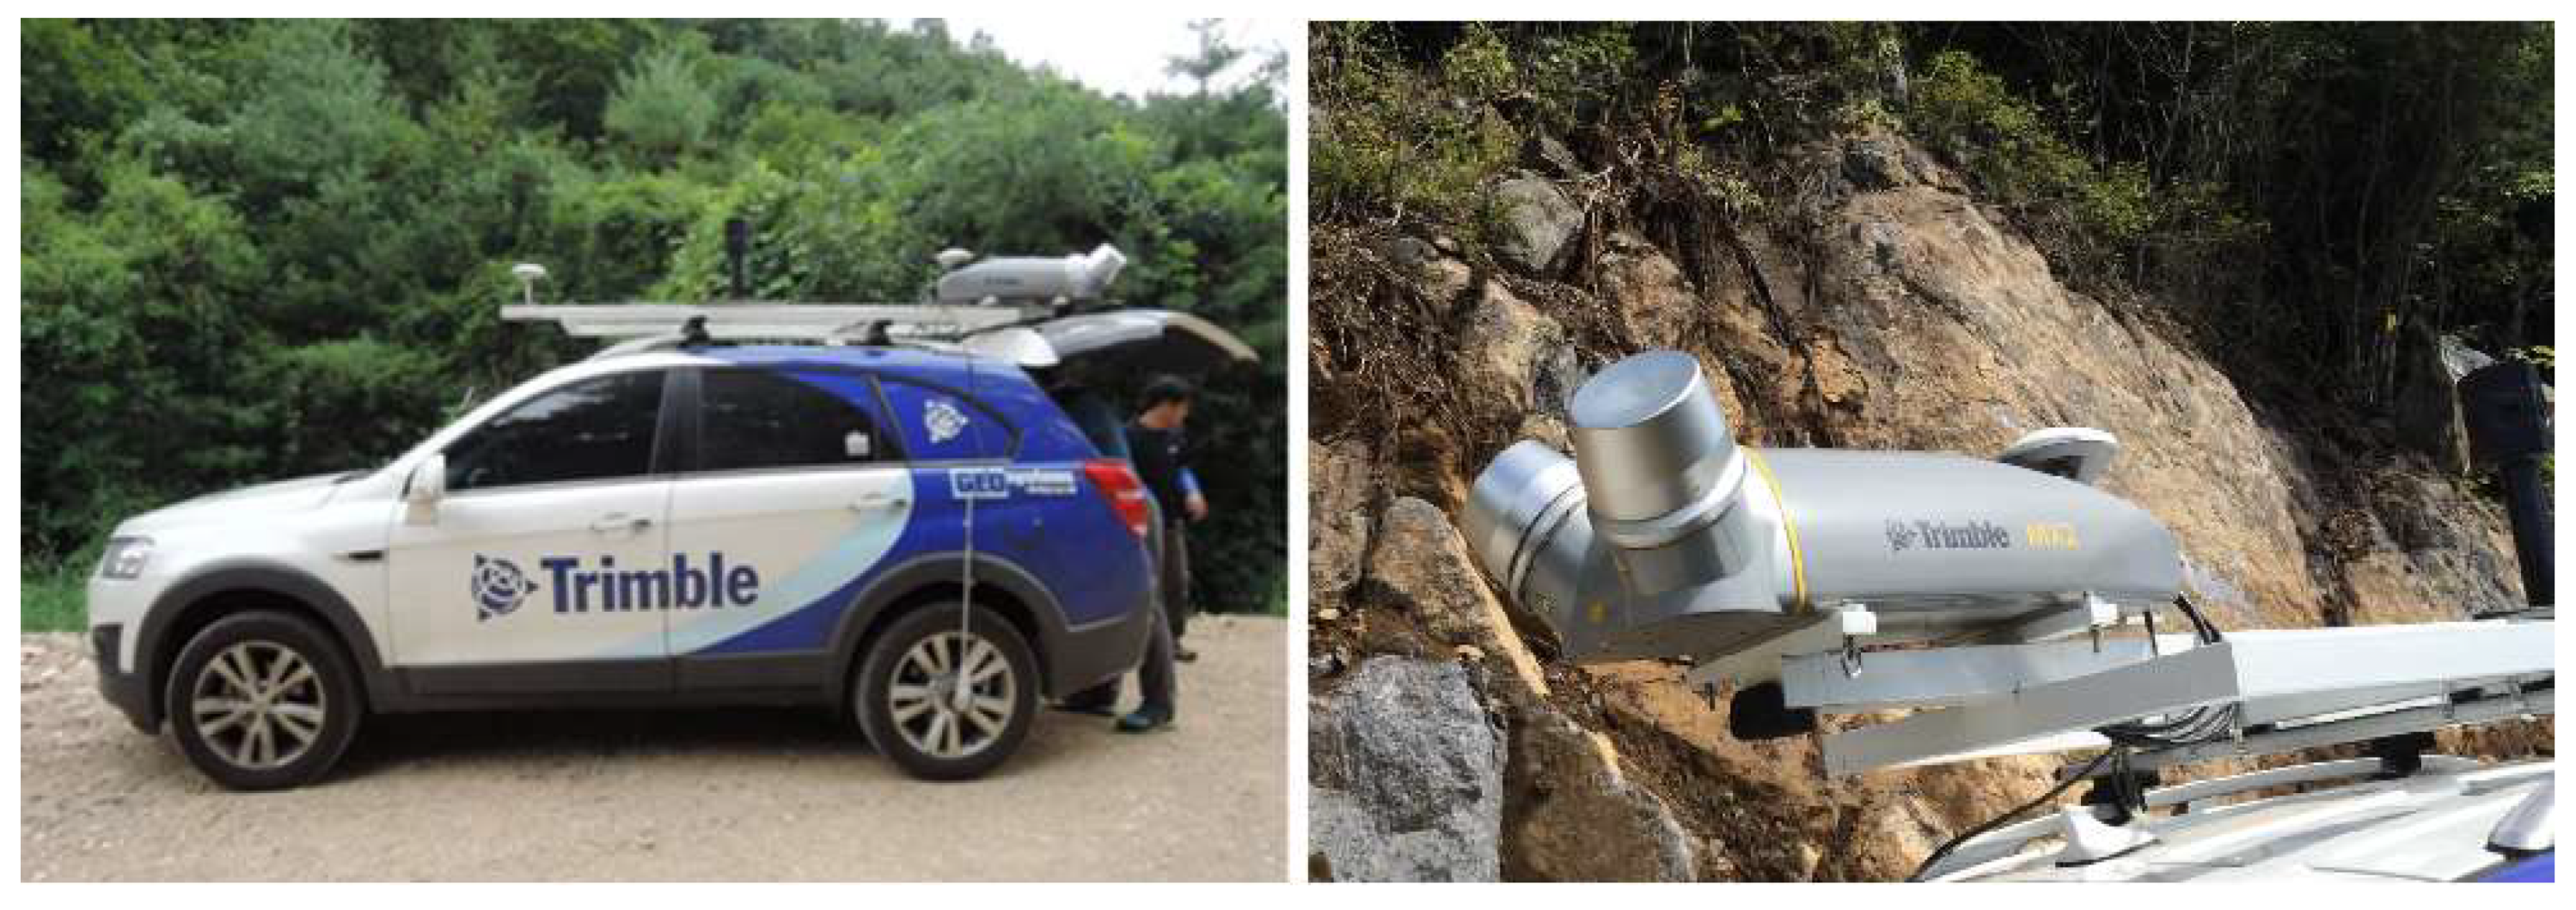
2.2. Collection and Mapping of MLS Data

Field collection of point cloud data was conducted using a vehicle equipped with a model MX2 MLS instrument (Trimble Inc., Sunnyvale, CA, USA, Figure 3). The performance of the Trimble MX2 model is very accurate and efficient (Table 2). Each on the left and right sides of the model’s body has one laser scanner, and therefore two data sets were collected as the vehicle moved forward, providing an accurate and complete point cloud of the terrain along the road.
To secure the accuracy of the point cloud data acquired from not only the on-road and cut-slope surfaces (with relatively large viewing angles while driving) but also the fill-slope surfaces (with relatively small viewing angles while driving) of forest roads, we drove the MLS vehicle back and forth. Here, we drove it close to the right edge of the road based on the direction of driving, especially to survey the fill-slopes even at a sharp angle. We also maintained a speed of less than 20 km/h because the MLS survey was conducted on rough unpaved roads, although the maximum design speed of vehicles on forest roads in Korea is 40 km/h [26]. Consequently, we therefore acquired four sets of point cloud data from two laser sensors for each study road.
The coordinates of the acquired point cloud data were calibrated based on the national reference points, and the 3D maps of the studied road routes were produced using the calibrated data in the Trimble Realworks 10.4 software (Trimble Inc.). However, these maps include spatial information relevant to not only topographic and structural features belonging to cut-slope, on-road, and fill-slope surfaces, but also vegetation on those surfaces and outside the cut-and-fill slopes. We therefore removed only the information relevant to vegetation from the maps, and finally extracted a 3D map that visualized the topographic and structural features that actually constituted the forest roads. To examine the change in the degree of precision density during these 3D mapping processes as well as to evaluate quantitatively MLS survey with relatively high-precision, we counted the number of points that consisted of the cloud data for both the initial and final 3D forest road maps.
On each final 3D map produced previously, we digitized the centerline bisecting the width of forest road and extracted it as a polyline-type shape file. We then extracted coordinate values (i.e., x, y, z) of 50 points with 20-m intervals on the centerline shape file of each forest road, and estimated the distances between two consecutive points.

2.3. Collection and Mapping of TS and GNSS Data

TS and GNSS are instruments that are commonly used to survey the geographic position of any given point. Using these instruments (i.e., NPL 352, Nikon, Tokyo, Japan, and Trimble R8, respectively; Table 3), we surveyed the 50 points at 20 m intervals on the centerline that bisects the width of each forest road route. The data obtained by the GNSS, which have absolute coordinates of the 50 points, were used to make the reference map displaying the centerline, and those by TS, which have relative coordinates of the exact same 50 points, were used to make the comparative one to the reference map (Figure 4).

2.4. Comparison of the Relative Positional Accuracy on MLS, TS, and GNSS Data

The evaluation of the relative positional accuracy of the three types of survey data above was based on three criteria. First, using the length of each 20 m section extracted previously on the centerline, the length of the road route on the comparative map surveyed by the MLS or TS survey was compared to the GNSS survey reference map. Second, the 50 coordinate values (i.e., x, y, z) determined from the MLS or TS survey for each road route were applied to calculate the Root Mean Square Error (RMSE), Equation (1) [29], based on a comparison to the same points established by the GNSS survey:
R M S E =   ( C i C t ) 2 ( n 1 )
where Ci are the coordinates from the GNSS survey, Ct are the coordinates from the MLS or TS survey results, and n represents the total number of stations. Third, the ratio of the comparative map (polyline) by the MLS or TS survey overlaid to the buffer zone (polygon) of the GNSS survey reference map for each road route was calculated. Here, the radius of the buffer zone was increased by 0.1 m, and the buffer diameters were compared with each other when 95% and 100% of the comparative maps by the MLS and TS surveys were included within the buffer zone of the GNSS survey reference map. All spatial analysis was performed using QGIS 2.18 (QGIS development team, Boston, MA, USA) to compare the relative positional accuracy of the studied roads.

2.5. Comparison of the Mapping Time and Cost Using MLS, TS, and GNSS

The time and cost of mapping the survey results are typically expressed as the value per unit area [30,31]. However, because this study targeted the linear object, i.e., forest road, the time per unit length (unit time, min/km) and the cost per unit length (unit cost, USD/km) required to produce the map were estimated. Here, the mapping by the MLS survey generated a 3D spatial map displaying on-road surfaces and cut-and-fill slopes of the forest road as the final output, while the mapping by TS or GNSS surveys provided a 3D line map representing only the centerline of the forest road as the final output. Although these outputs do not contain the same level of spatial information, the time and cost spent obtaining the outputs were compared.

3. Results

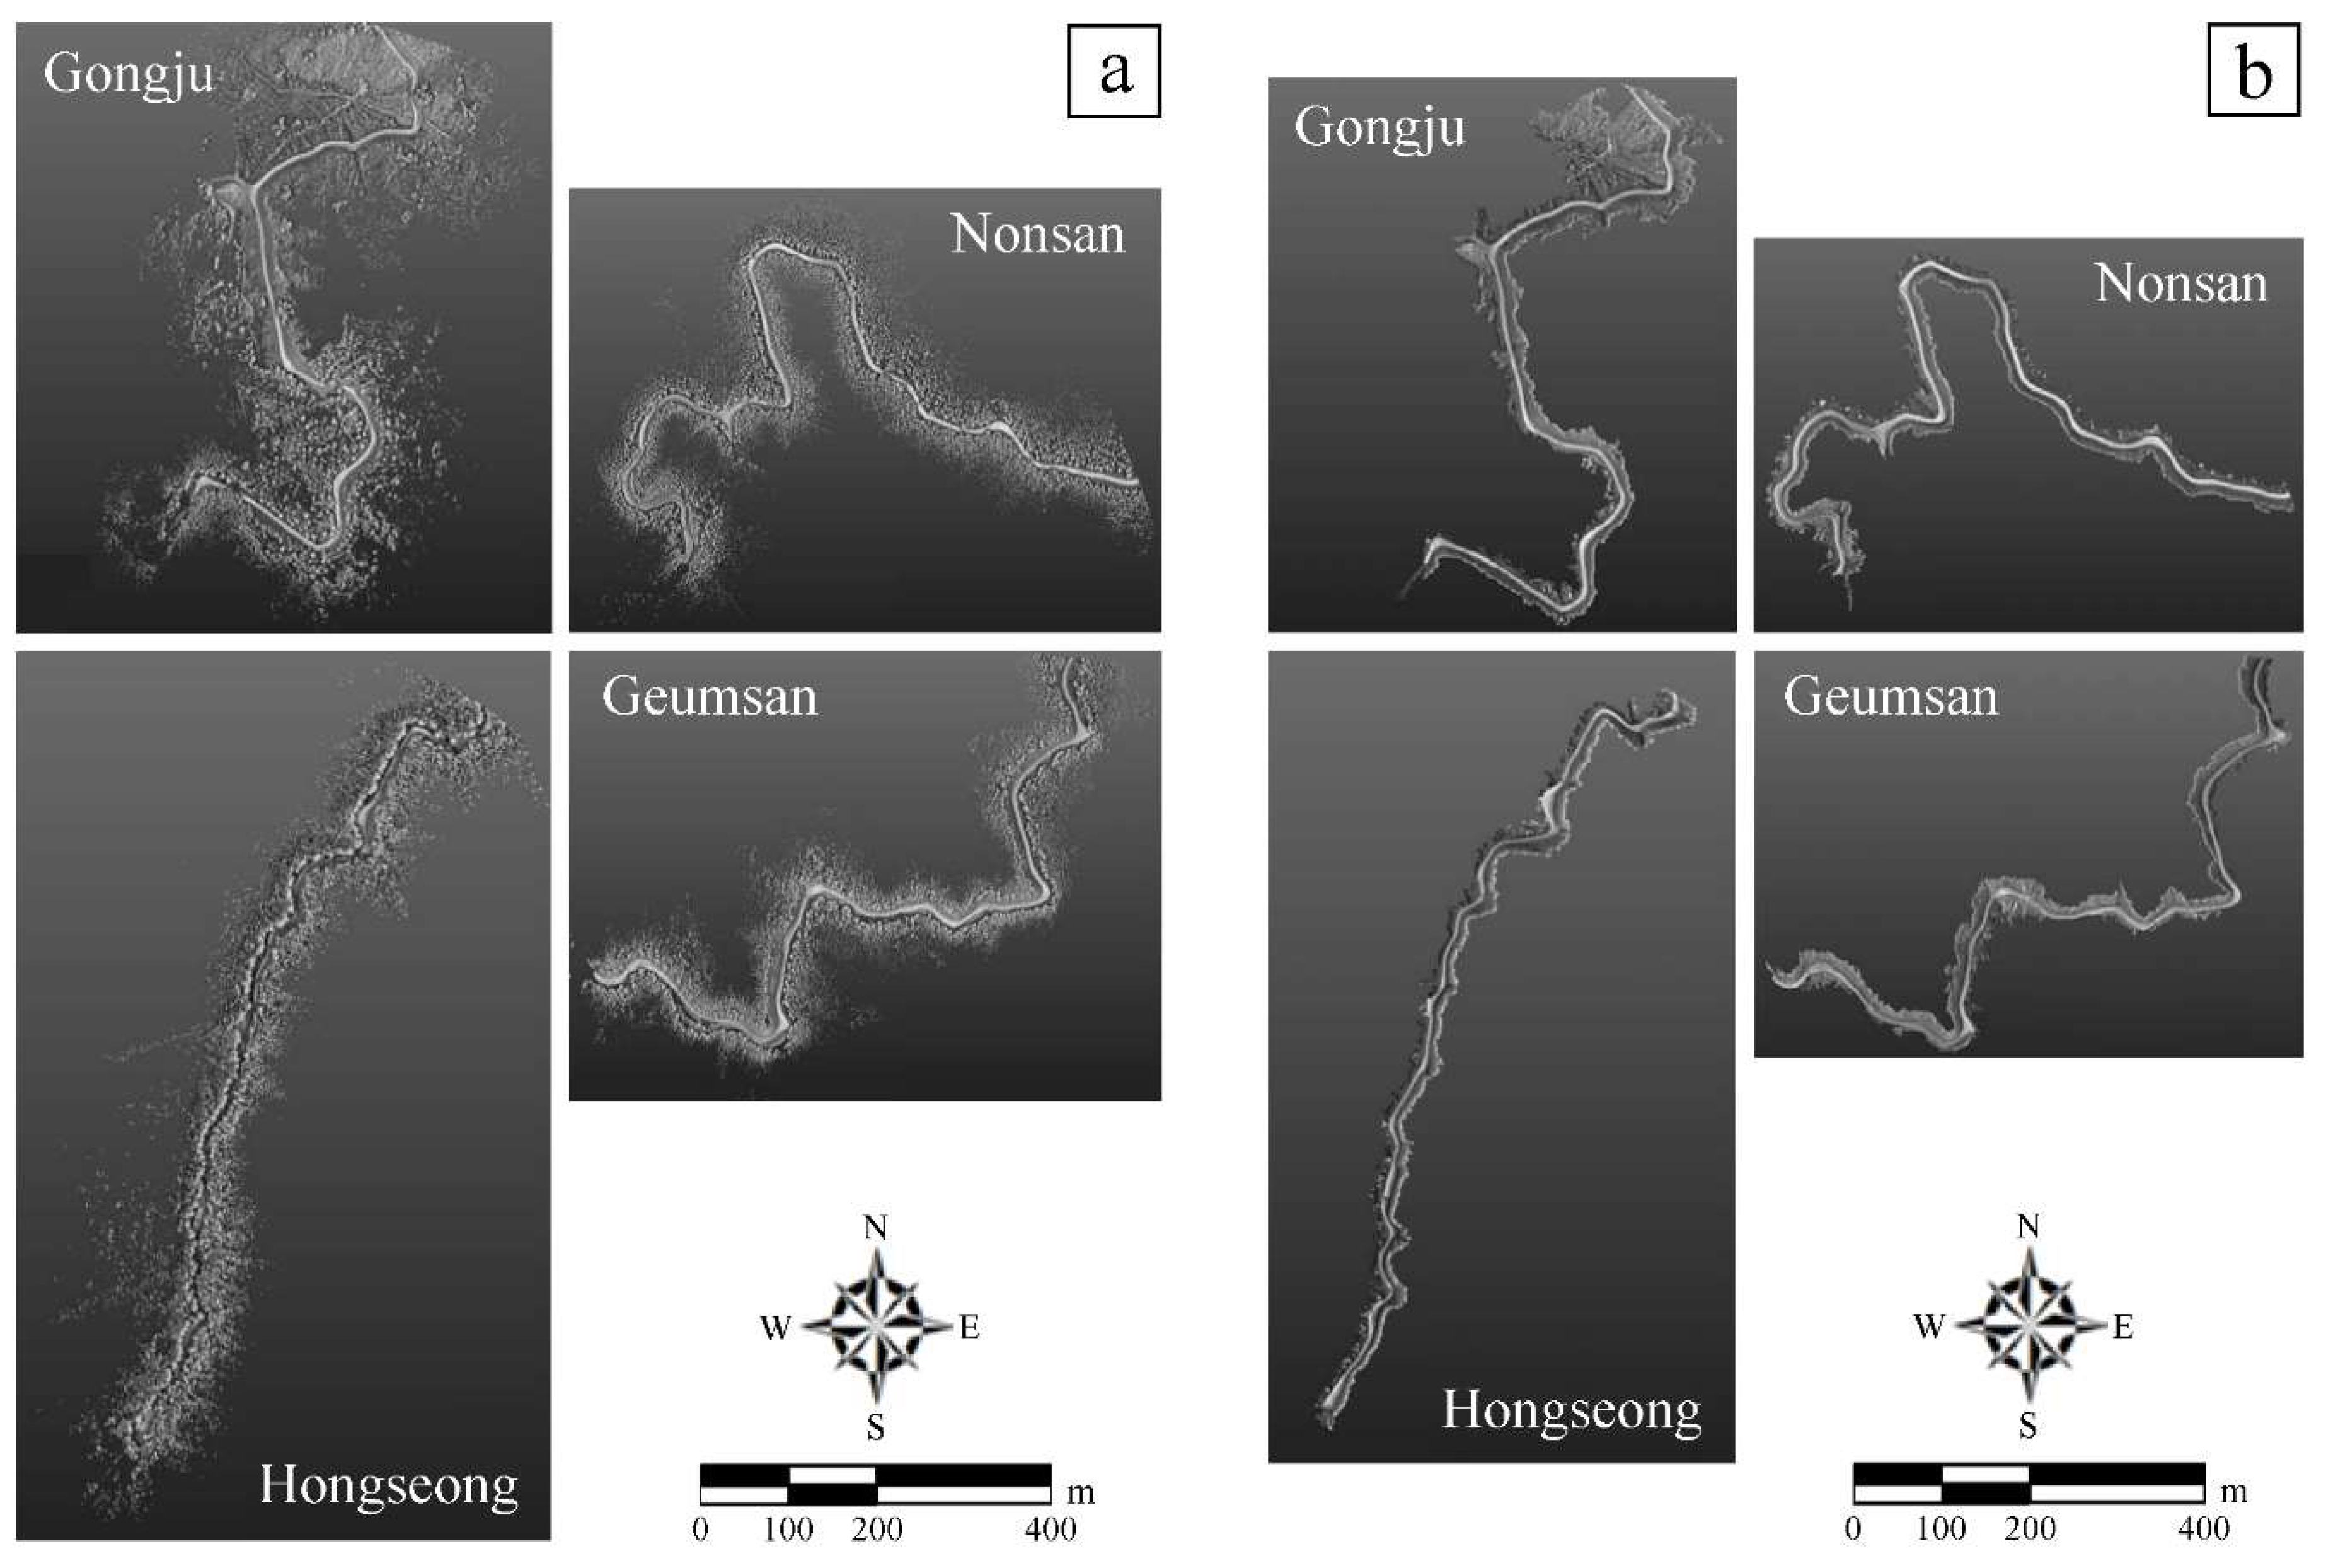
3.1. 3D Forest Road Maps Created Using MLS and The Degree of Precision Density

The 3D forest road maps produced initially by the MLS survey in the four study roads are shown in Figure 5a and Figure 6a. By removing vegetation information from these maps, the 3D maps show only the topography and structures (e.g., ditches and drainage facilities exposed to the ground) of the forest roads (Figure 5b and Figure 6b).
The results examining the number of point data comprising these two types of 3D maps (Table 4) showed that the number of points lost in removing the vegetation information ranged from 54.4% to 75.1%, with a mean of 65.6%, based on the initial number of point data. In addition, the numbers of point data per unit road surface area (unit point numbers), which were estimated in the final 3D maps, ranged from 725.8 point/m2 to 1249.3 point/m2, with a mean of 878.2 point/m2.

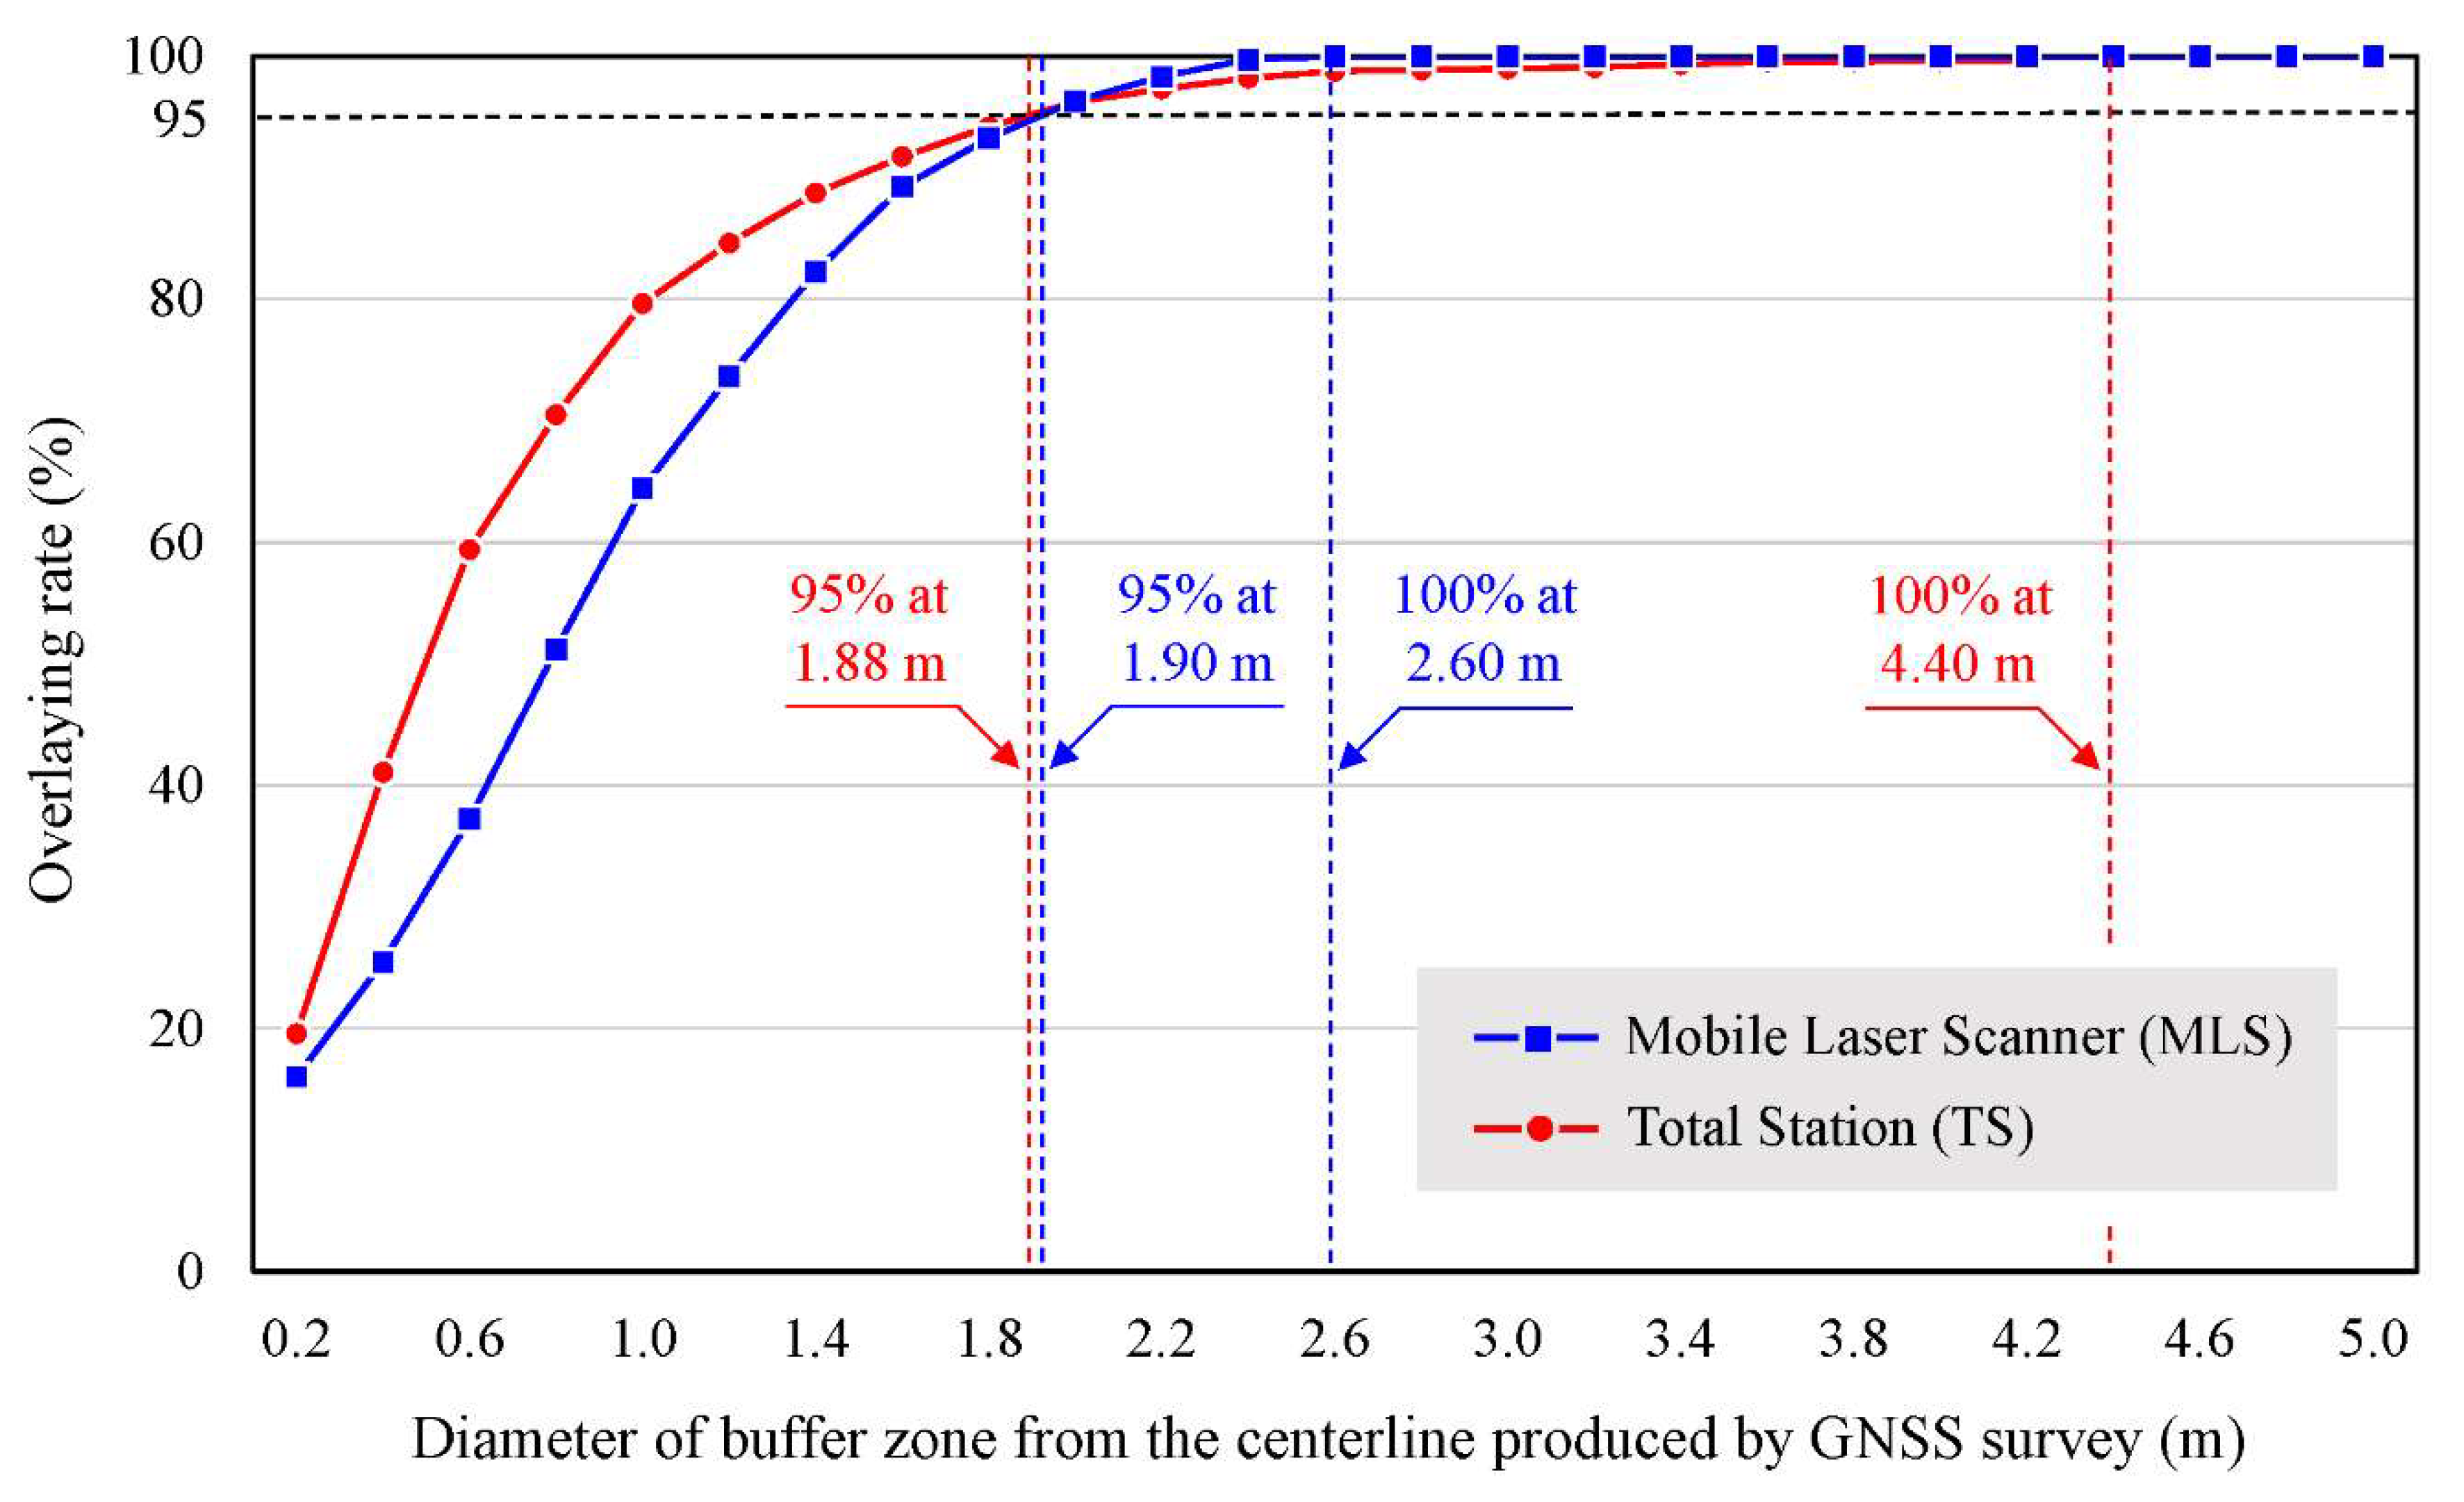
3.2. Relative Positional Accuracy Estimated from MLS, TS, and GNSS Data

The length of the road route surveyed was determined as the first criterion to compare the relative positional accuracy of the MLS survey with other survey results. As noted in the site descriptions, the length of each route was approximately 1 km. However, the lengths showed slight differences according to the survey methods (Table 5); that is, difference in the road lengths (i.e., lengths of the centerlines bisecting the widths of forest road routes) between GNSS and MLS surveys only ranged from 0.1 to 0.7 m, while the difference between GNSS and TS surveys revealed a larger range, from 2.1 to 4.7 m.
Calculating the RMSEs of the MLS or TS survey to the GNSS survey for 50 corresponding points for each road route, which is the second criterion to examine the relative positional accuracy of the MLS survey, showed that there is no significant differences in the RMSEs between the MLS and the TS at all study road routes (Table 6).
Calculating the ratio of the comparative map by MLS or TS survey overlaid to the buffer zone of the GNSS survey reference map for each road route, which is the third criterion to examine the relative positional accuracy of the MLS survey, gave the results shown in Figure 7. The centerline comparative maps produced with the MLS and TS surveys were nested by 95% within diameters of 1.88 m (0.94 m radius) and 1.90 m (0.95 m radius), respectively, and also were nested by 100% within diameters of 2.6 m (1.3 m radius) and 4.4 m (2.2 m radius), respectively, from the centerline produced by the GNSS survey.

3.3. Estimated Mapping Time and Cost Using MLS, TS, and GNSS

Table 7 shows that the unit mean time and cost spent for mapping the four forest road routes were different with different surveying methods. The mapping starting with the MLS survey spent the unit mean time of approximately 127 min/km (i.e., 31.7 min/km for field survey, 64 min/km for mapping). In the mapping by the TS survey, the unit mean time spent was approximately 313 min/km (i.e., 195 min/km for field survey, 118 min/km for mapping).
The mapping by GNSS survey required a unit mean time spent of approximately 188 min/km (i.e., 128 min/km for field survey, 60 min/km for mapping). Upon considering that three, four, and two persons participated in the mapping by MLS, TS, and GNSS surveys, respectively, the unit mean cost for mapping using the TS survey (201.9 USD/km) was the largest, followed by the MLS (175.2 USD/km) and GNSS (82.5 USD/km) surveys. Here, two assistants for prisms were employed in the TS survey to shorten the expected long working time even if the relevant labor cost was to increase.

4. Discussion

4.1. Precision Density of Mapping by the MLS Survey

Numerous studies (e.g., [1,2,3,7]) indicate the need to establish a road inventory for maintenance of forest roads. To accomplish this, surveys using TS and GNSS have been conducted worldwide [6]. In recent years, the interest and need for 3D data using high density point clouds using remote exploration, such as LiDAR, has increased [6,10,11,32].
Mapping by MLS survey was shown to have a relatively high density of precision compared to other survey methods (Table 4), and this is not based solely on the findings of this study, which showed that the mean of unit point numbers on the MLS maps (removed vegetation information) is arithmetically 230,565 times those of both GNSS and TS (with 50 point/km). Of the previous studies regarding the establishment of a forest road inventory, Kim et al. [31] and Talebi et al. [2] conducted TS and GNSS surveys, respectively, to acquire spatial information including locations and/or boundaries of road centerlines, cut-and-fill slopes, and drainage and auxiliary facilities. Here, they acquired spatial information from points of 251 point/km and 131 point/km, respectively, and these precision densities are only approximately 0.002% and 0.001% compared to the mean of unit point numbers of the MLS maps produced in this study. In addition, White et al. [3] and Kiss et al. [7] acquired spatial information of the forest roads using an ALS survey, with precision densities of 0.8 point/m2 and 1.2 point/m2, respectively, which were only approximately 0.09% and 0.14% of the MLS maps in this study. Based on the results above, it is judged that the quality of point cloud data acquired through MLS survey in this study has a very high precision. In particular, mapping by MLS survey is sufficient to be considered very useful for creating a forest road inventory, in that it can visualize not only the centerline of the road but also all the spatial elements making up the forest roads, such as the road surface, cut-and-fill slope surfaces, and the ditches and drainage facilities exposed to the ground.

4.2. Relative Positional Accuracy of the MLS Map

The accuracy of the MLS survey was also seen in the RMSE values relative to the corresponding points on the reference centerline maps created by the GNSS survey (Table 6). The RMSEs of the MLS survey, which are not significantly different from those of the TS survey, averaged about 0.8 m. These results are likely to be very accurate compared to those of previous studies, which examined positional accuracy of topographical features using ALS (with RMSEs ranging between 1 and 3 m) (e.g., [3,7]) and GNSS (with RMSEs ranging between 1 and 88 m) (e.g., [1,2,3,6]) in forest roads and/or mountain terrains. Conversely, Kim [22] reported that the RMSEs on the location accuracy of topographical features in urbanized areas ranged between 0.09 and 0.293 m, which is more accurate than the results of this study. This difference may be due to the lower reception rate of the GNSS signals on the forest roads compared to that in urban areas.
For determining positional accuracy of linear objects, such as roads and railways, consistency of the shape itself can also be used as one of the most important criteria [33]. In this study, whereas 95% of both centerlines produced from MLS and TS surveys were nested at similar diameters (i.e., 1.90 m and 1.88 m, respectively) from that produced by the GNSS survey, the buffer diameter of the reference map at which 100% were nested was found to be smaller in the MLS survey (i.e., 2.60 m) than the TS survey (i.e., 4.40 m) (Figure 7). Although it may be difficult to attach a relative meaning to the quantitative differences between these two methods (may be due to user error at turning points in TS survey and/or difference in machine accuracy of two survey instruments), this also reflects the advantages of mapping by MLS survey, as shown in the results of the RMSE analysis, in excluding potential user error during field surveying and in ensuring the positional accuracy of forest roads with a long linear form.

4.3. Efficiency of MLS Mapping for Forest Road Inventory

Numerous studies (e.g., [3,6,7,10,11,32,34]) have suggested that it is necessary to survey using LiDAR (such as ALS, TLS, and MLS) on the basis of the efficiency in terms of working time and cost. Although the high equipment rental price of MLS mapping with high precision and accuracy can be pointed out as a drawback in the deployment of a forest road inventory, the advantage is that labor costs incurred are only 57% and 21% of the GNSS and TS mappings, respectively, due to relatively short working time (Table 7). In particular, as described previously, it may be assessed that the quality and quantity of the point cloud data collected during a MLS survey are large enough to allow the production of a 3D map, including all elements of the forest roads (such as roadbed, cut-and-fill slopes, drainages, auxiliary facilities), and are superior in comparison with mapping by other survey methods.

5. Conclusions

By paying attention to both surveying methodologies and implementation of research results to facilitate sustainable forest road management, this study produced a 3D map for the establishment of a forest road inventory using MLS, and reviewed its precision, accuracy, and efficiency. As a result, the point cloud data acquired by the MLS survey on the study forest roads has very high precision and therefore is sufficient to produce a high-resolution 3D forest road map. Although the equipment rental cost is somewhat high, the fact that information on all spatial elements of forest roads, which are linear objects, can be obtained at a low cost of labor is expected to act as a positive contributor for evaluating the efficiency of MLS survey and mapping. Our findings are likely to be meaningful in that it can provide a quantitative assessment of both maintaining sustainable effectiveness and preventing potential environmental damage of forest roads.
Nevertheless, several technical and academic challenges still remain in the establishment of a forest road inventory through MLS survey and mapping. First, if it is inevitable for forest roads to be constructed on forested area with steep slopes like Korea, spatial information on the fill-slope surfaces, which is obtained at a sharp angle, may not be fully acquired, even if vehicles equipped with MLS drive close to the right edge of the road based on the direction of driving. Thus, technical supplementation is required to overcome this limitation. Second, the heavy canopy covering forest areas acts as a restricting factor for MLS surveys [15,35,36], and thus further studies are needed to develop ways to reduce the loss of point data due to this restriction and to improve the survey accuracy. Third, it is believed that studies to automate or simplify digitization of spatial information during the MLS mapping process will be needed, as forest roads are linear objects that have a slightly regular form (although not as regular as general roads or railways). These studies may refer to recent studies conducted on general roads and railways [21,35]. Fourth, in order to compensate for the disadvantages of a MLS survey with high equipment rental costs, it is necessary to explore ways to diversify the use of spatial information in the form of point clouds that can be obtained from limited spaces (i.e., forest roads). Here, we should take note of the fact that we can effectively create 3D maps including longitudinally and cross-sectionally detailed components of forest roads and their surroundings in a relatively short time using MLS. Solving these four challenges is a necessary condition for enabling rational decision-making for systematic forest road management, which will ultimately lead to the maintenance of the permanent utility of and the prevention of potential environmental damage from forest roads.

Author Contributions

Conceptualization, H.K. and J.-W.L.; Data curation, H.K. and J.I.S.; Funding acquisition, H.K.; Project administration, J.-W.L.; Supervision, J.I.S.; Writing—original draft, H.K. and J.-W.L.; Writing—review & editing, J.I.S. All authors have read and agreed to the published version of the manuscript.

Funding

This research was supported by Basic Science Research Program through the National Research Foundation of Korea (NRF) funded by the Ministry of Education (grant number: 2018R1A6A3A03013244).

Acknowledgments

The authors would like to thank Myeongjun Kim and Seongmin Choi for offering valuable comments on the early drafts of the manuscript. Sincere appreciation goes to the anonymous reviewers that improved the manuscript concision and perspective.

Conflicts of Interest

The authors declare no conflict of interest.

References

  1. Abdi, E.; Sisakht, L.; Goushbor, L.; Soufi, H. Accuracy assessment of GPS and surveying technique in forest road mapping. Ann. For. Res. 2012, 55, 309–317. [Google Scholar]
  2. Talebi, M.; Majnounian, B.; Abdi, E.; Tehrani, F.B. Developing a GIS database for forest road management in Arasbaran forest, Iran. For. Sci. Technol. 2015, 11, 27–35. [Google Scholar] [CrossRef]
  3. White, R.A.; Dietterick, B.C.; Mastin, T.; Strohman, R. Forest roads mapped using LiDAR in steep forested terrain. Remote Sens. 2010, 2, 1120–1141. [Google Scholar] [CrossRef] [Green Version]
  4. Laschi, A.; Foderi, C.; Fabiano, F.; Neri, F.; Cambi, M.; Mariotti, B.; Marchi, E. Forest road planning, construction and maintenance to improve forest fire fighting: A review. Croat. J. For. Eng. 2019, 40, 207–219. [Google Scholar]
  5. Kweon, H. Comparisons of estimated circuity factor of forest roads with different vertical heights in mountainous areas, Republic of Korea. Forests 2019, 10, 1147. [Google Scholar] [CrossRef] [Green Version]
  6. Kweon, H.; Kim, M.; Lee, J.-W.; Seo, J.I.; Rhee, H. Comparison of horizontal accuracy, shape similarity and cost of three different road mapping technique. Forests 2019, 10, 452. [Google Scholar] [CrossRef] [Green Version]
  7. Kiss, K.; Malinen, J.; Tokola, T. Forest road quality control using ALS data. Can. J. For. Res. 2015, 45, 1636–1642. [Google Scholar] [CrossRef]
  8. Höhle, J.; Höhle, M. Accuracy assessment of digital elevation models by means of robust statistical methods. ISPRS J. Photogramm. 2009, 64, 398–406. [Google Scholar] [CrossRef] [Green Version]
  9. Stereńczak, K.; Kozak, J. Evaluation of digital terrain models generated from airborne laser scanning data under forest conditions. Scand. J. For. Res. 2011, 26, 374–384. [Google Scholar] [CrossRef]
  10. Akgul, M.; Yurtseven, H.; Akburak, S.; Demir, M.; Cigizoglu, H.K.; Ozturk, T.; Eksi, M.; Akay, A.O. Short term moniterning of forest road pavement degradation using terrestrial laser scanning. Measurement 2017, 103, 283–293. [Google Scholar] [CrossRef]
  11. Akay, A.O.; Akgul, M.; Demir, M. Determination of temporal changes in forest road pavement with terrestrial laser scanner. Fresenius Environ. Bull. 2018, 27, 1437–1448. [Google Scholar]
  12. Liang, X.; Hyyppa, J.; Kukko, A.; Kaartinen, H.; Jaakkola, A.; Yu, X. The use of a mobile scanning system for mapping large forest plots. IEEE Geosci. Remote Sens. Lett. 2014, 11, 1504–1508. [Google Scholar] [CrossRef]
  13. De Agostino, M.; Lingua, A.; Piras, M. Rock face surveys using a LiDAR MMS. Ital. J. Remote Sens. 2012, 44, 141–151. [Google Scholar] [CrossRef]
  14. Qin, R. An Object-based hierarchical method for change detection using unmanned aerial vehicle images. Remote Sens. 2014, 6, 7911–7932. [Google Scholar] [CrossRef] [Green Version]
  15. Čerňava, J.; Mokroš, M.; Tuček, J.; Antal, M.; Slatkovská, Z. Processing chain for estimation of tree diameter from GNSS-IMU-based mobile laser scanning Data. Remote Sens. 2019, 11, 615. [Google Scholar] [CrossRef] [Green Version]
  16. Schwarz, K.P.; Lapucha, D.; Cannon, M.E.; Martell, H. The use of GPS/INS in a highway inventory system. In Proceedings of the FIG XIX Congress, Helsinki, Finland, 10–19 May 1990; Volume 5, pp. 238–249. [Google Scholar]
  17. Kang, I. Method for Improving the Integrity of the Data from Land-Based Mobile Mapping System to Create Multipurpose Precise Road Map. Ph. D. Thesis, University of Seoul, Seoul-si, Korea, 2013. (In Korean with English abstract). [Google Scholar]
  18. Grejner-Brzezinska, D.; Toth, C.; Yi, Y. On improving navigation accuracy of GPS/INS systems. Photogramm. Eng. Remote Sens. 2005, 4, 377–389. [Google Scholar] [CrossRef]
  19. Qin, R.; Gruen, A. 3D change detection at street level using mobile laser scanning point clouds and terrestrial images. ISPRS J. Photogramm. Remote Sens. 2014, 90, 24–35. [Google Scholar] [CrossRef]
  20. Cui, T.; Ji, S.; Shan, J.; Gong, J.; Liu, K. Line-based registration of panoramic images and LiDAR point clouds for mobile mapping. Sensors 2017, 17, 70. [Google Scholar] [CrossRef]
  21. Ma, L.; Li, Y.; Li, J.; Wang, C.; Wang, R.; Chapman, M.A. Mobile laser scanned point-clouds for road object detection and extraction: A review. Remote Sens. 2018, 10, 1531. [Google Scholar] [CrossRef] [Green Version]
  22. Kim, Y. A Study on Calibration Method of Vehicle-Based Mobile Mapping System. Master’s Thesis, Sungkyunkwan University, Suwon-si, Korea, 2011. (In Korean with English abstract). [Google Scholar]
  23. Tang, J.; Chen, Y.; Kukko, A.; Kaartinen, H.; Jaakkola, A.; Khoramshahi, E.; Hakala, T.; Hyyppä, J.; Holopainen, M.; Hyyppä, H. SLAM-aided stem mapping for forest inventory with small-footprint mobile LiDAR. Forests 2015, 6, 4588–4606. [Google Scholar] [CrossRef] [Green Version]
  24. Forsman, M.; Holmgren, J.; Olofsson, K. tree stem diameter estimation from mobile laser scanning using and hyperspectral data. Sensors 2011, 11, 5158–5182. [Google Scholar]
  25. Buwens, S.; Bartholomeus, H.; Calders, K.; Lejeune, P. Forest inventory with terrestrial LiDAR: A Comparison of static and hand-held mobile laser scanning. Forests 2016, 7, 127. [Google Scholar] [CrossRef] [Green Version]
  26. Korea Forest Service (KFS). Available online: http://www.law.go.kr/DRF/MDRFLawService.do?OC=foalaw&ID=10317 (accessed on 5 August 2019).
  27. Trimble Korea. Available online: https://geospatial.trimble.com (accessed on 15 September 2019).
  28. Spectra. Available online: https://spectrageospatial.com/ (accessed on 15 September 2019).
  29. Kagawa, Y.; Sekimoto, Y.; Shibasaki, R. Comparative study of positional accuracy evaluation of line data. In Proceedings of the 20th Asian Conference on Remote Sensing, Hong Kong, China, 22–25 November 1999. [Google Scholar]
  30. Ömer, M.; Ayhan, C. Accuracy and cost comparison of spatial data acquisition methods for the development of geographical information systems. J. Geogr. Reg. Plan. 2009, 2, 235–242. [Google Scholar] [CrossRef] [Green Version]
  31. Kim, M.; Kweon, H.; Choi, Y.; Yeom, I.; Lee, J. Evaluation of horizontal position accuracy in forest road completion drawing. Korean J. Agric. Sci. 2010, 37, 471–479, (In Korean with English abstract). [Google Scholar]
  32. Yurtseven, H.; Akgul, M.; Akay, A.O. High accuracy monitoring system to estimate forest road surface degradation on horizontal curves. Environ. Monit. Assess. 2019, 191, 32. [Google Scholar] [CrossRef] [PubMed]
  33. Velkamp, R.C. Shape matching: Similarity measures and algorithms. In Proceedings of the International Conference on Shape Modeling and Applications, Genova, Italy, 7–11 May 2001. [Google Scholar]
  34. Balenović, I.; Gašparović, M.; Milas, A.S.; Seletković, A.B. Accuracy assessment of digital terrain models of lowland pedunculate oak forests derived from airborne laser scanning and photogrammetry. Croat. J. For. Eng. 2018, 39, 117–127. [Google Scholar]
  35. Arastounia, M. Automated recognition of railroad infrastructure in rural areas from LIDAR data. Remote Sens. 2015, 7, 14916–14938. [Google Scholar] [CrossRef] [Green Version]
  36. Zhong, M.; Sui, L.; Wang, Z.; Yang, X.; Zhang, C.; Chen, N. Recovering missing tracjectory data for mobile laser scanning systems. Remote Sens. 2020, 12, 899. [Google Scholar] [CrossRef] [Green Version]
Figure 1. Flowchart displaying an approach of the study.
Remotesensing 12 01502 g001
Figure 2. Locations of the study sites.
Remotesensing 12 01502 g002
Figure 3. The vehicle equipped with Mobile Laser Scanner (MLS, Trimble MX2 model).
Remotesensing 12 01502 g003
Figure 4. Schematic diagram displaying the difference between (a) Total Station (TS) survey with relative coordinates) and (b) Global Navigation Satellite System (GNSS) survey with absolute coordinates.
Remotesensing 12 01502 g004
Figure 5. The 3D maps created using point cloud data obtained from the Mobile Laser Scanner (MLS) survey on the study forest roads. The map (a) before and (b) after removing point cloud data displaying vegetation on the outsides of cut-and-fill slopes.
Remotesensing 12 01502 g005
Figure 6. An example of the close range view of the 3D map displaying forest roads using point cloud data obtained from the Mobile Laser Scanner (MLS) survey. The view (a) before and (b) after removing point cloud data displaying vegetation on the outsides of cut-and-fill slopes.
Remotesensing 12 01502 g006
Figure 7. Changes in mean ratios of the comparative maps by Mobile Laser Scanner (MLS) and Total Station (TS) surveys overlaid to the buffer zones of the Global Navigation Satellite System (GNSS) survey reference maps for the four forest road routes.
Remotesensing 12 01502 g007
Table 1. General characteristics of the study sites.
IndexStudy AreaRoad Length
Surveyed (m)
Altitude above
Sea Level (m)
Construction
Year
Forest Type
MinimumMaximum
AGongju1022439.1450.82017Mixed forest
BNonsan1015127.9190.62017Mixed forest
CHongseoung1019135.4154.72018Mixed forest
DGeumsan1019424.5459.22017Mixed forest
Table 2. Specifications of Trimble MX2 [27].
Mobile Laser Scanning (MLS) Trimble MX2
TypeSingle or dual SLM-250 Class 1 lasers
RangeUp to 250 m
Accuracy±1 cm at 50 m
Scanner FOV360 degrees
Scan rateDual laser head: 2 × 20 Hz (1200 rpm)
Maximum effective
measurement rate
Single laser head: 36,000 points per second
Dual laser head: 72,000 points per second
Pulse rateDual laser head: 2 × 36 kHz
Table 3. Specifications of Total Station (TS) [28] and Global Navigation Satellite System (GNSS) [27].
TS (Nikon NPL 352)GNSS (Trimble R8)
Operating temperature–40 to +60 °C–40 to +65 °C
Distance measurement1.6 to 200 m-
Weight5.5 kg1.52 kg
Accuracyx : 3 mm
y : 3 mm
z : 3 mm
x : 8 mm
y : 8 mm
z : 15 mm
Table 4. Change in the number of point data by excluding vegetation information from the initial 3D maps of the four forest roads studied.
Study
Road
Number of Point Data (point/km)Point Data Loss by Excluding Vegetation Information
(point/km, %)
Forest Road Area in the Final 3D Map
(m2/km)
Unit Point Number in the Final 3D Map
(point/m2)
Initial 3D MapFinal 3D Map
Gongju26,310,7049,729,38516,581,319 (63.0)12,427.4782.9
Nonsan33,920,19310,174,68423,745,509 (70.0)13,480.0754.8
Hongseong36,070,7368,971,47827,099,258 (75.1)12,360.8725.8
Geumsan37,813,71817,237,51420,576,204 (54.4)13,797.71249.3
Mean33,528,83811,528,26522,000,573 (65.6)13,016.5878.2
Table 5. Lengths of road routes surveyed by Mobile Laser Scanner (MLS), Total Station (TS), and Global Navigation Satellite System (GNSS) in the forest roads studied.
Study RoadRoad Length (m)
GNSSMLSMLS–GNSSTSTS–GNSS
Gongju1022.21022.30.11025.12.9
Nonsan1015.11015.80.71019.84.7
Hongseong1019.21019.70.51021.32.1
Geumsan1019.41019.60.21023.23.8
Mean 0.4 3.4
Table 6. RMSEs of the Mobile Laser Scanner (MLS) or Total Station (TS survey) to the Global Navigation Satellite System (GNSS) survey for 50 corresponding points for each road route.
Survey
Method
Total
(n = 200)
Gongju
(n = 50)
Nonsan
(n = 50)
Hongseong
(n = 50)
Geumsan
(n = 50)
MeanSDMeanSDMeanSDMeanSDMeanSD
MLS0.8020.4730.6850.3280.7450.3640.9610.4810.8170.631
TS0.7160.5930.5530.4010.8150.6420.8680.7240.6250.501
t1.7781.801–0.8330.8281.796
p0.0760.0740.4060.4090.076
The SD denotes standard deviation.
Table 7. Differences in the unit mean time and cost spent depending on the surveying methods in the four forest road routes.
Survey
Method
WorkLaborWorking
time
(min/km)
Labor CostEquipment
Cost *
(USD)
Total
Cost
(USD)
Unit
(USD/h)
Total
(USD)
MLSField survey1 professional
1 assistant
3220.5
10.1
32.0143.2175.2
Mapping1 technician6415.2
TSField survey1 professional
2 assistants
19520.5
10.1
155.146.8201.9
Mapping1 technician11815.2
GNSSField survey1 professional12820.556.226.382.5
Mapping1 technician6015.2
* Equipment rental price during the operation time.

