Abstract
Grasslands in the Southern Great Plains of the United States have major ecological and economic importance, with strong climate and water cycle connections. The historic native prairie grassland has been managed differently for enhancing productivity, while consequently altering water vapor fluxes. However, little is known about the impacts of different management activities on evapotranspiration (ET) at different spatio-temporal scales. In this study, we quantified and compared ET between co-located introduced managed pasture (MP) and native prairie (NP) pasture. Additionally, we compared the Moderate Resolution Imaging Spectroradiometer (MODIS)-derived ET at four different spatial scales: 30 m (ETMOD30), 200 m (ETMOD200), 500 m (ETMOD500), and 1000 m (ETMOD1000) with eddy covariance-measured ET (ETEC). Large differences in ETEC were observed between two pastures from half-hourly to seasonal scales, with variations mainly controlled by the amount of rainfall and management activities. The results demonstrated differential responses of MP and NP in a pluvial year. The ETMOD30 showed a better agreement with ETEC than did the ETMOD200, ETMOD500, and ETMOD1000. The ETMOD200, ETMOD500, and ETMOD1000 largely underestimated ETEC, most likely due to their inability to capture the spatial heterogeneity of vegetation growth impacted by various management activities. Our results facilitate understanding of the difference in ET of MP and NP due to differences in vegetation resulting from different management activities and their differential responses to precipitation.
1. Introduction
Major grassland areas occur in Russia, Australia, China, and North America [1,2,3]. Grasslands cover about 30% of the land area of North America and play a major agro-economic role due to their linkage to livestock industry in this region. Additionally, these grasslands play an important role in the regional carbon and water cycles [4]. Anticipated increases in the demand for beef are expected to intensify land use demands on the grassland ecosystem, with potentially adverse environmental risks. Additionally, the major grassland areas of this region are in the water limited areas (semi-arid region); thus, the region’s ecosystem processes are primarily controlled by water availability, and water loss from the ecosystem is dominated by evapotranspiration (ET) accounting for about 90–95% of the annual precipitation. Therefore, it is necessary to understand the water use and loss from grassland ecosystems to enhance higher grass production under limited water supply via better management strategies.
The once predominant native prairie (NP) pastures of the Southern Great Plains (SGP) of the United States have been largely converted into introduced and managed prairie (MP) pastures to enhance forage productivity [5,6]. Because carbon and water exchange processes are tightly coupled, management practices to increase grassland productivity may also impact water usage. Although there are several studies on water exchange in grassland ecosystems [7,8,9,10], relatively few studies have examined the impacts of management activities on grassland ET [11,12,13]. A detailed quantification of ET from co-located NP and MP with respect to different management schemes and different temporal scales (from hourly to daily to seasonal/annual scales) is lacking. In addition, quantifying and comparing ET under different hydrologic conditions such as relatively wet years versus dry years is fundamental for better understanding of ecosystem functions because ET directly links several physiological processes in an ecosystem [14,15]. It is hypothesized that different magnitudes of ET can be expected between NP and MP under variable wet and dry climatic conditions as water usage by multi species (NP) and monoculture (MP) pastures can differ markedly even in the same environment. Therefore, this comparative study between co-located NP and MP prairie pastures with similar climate, topography, and soil is intended to provide better insights on how these two pasture types respond to the same climatic conditions under different management. This study also has importance for sustainable pasture management under the highly volatile climate (e.g., greater variability of dry-wet dipole events) of the SGP [16,17].
The concept of paddock grazing by cattle has resulted in different sizes of pastures with different management activities. Therefore, there is a larger spatial variability of grass growth depending upon duration and intensity of grazing. The estimation of grass growth at the paddock scale has been previously explored at the 10–30 m scale using relatively small footprint global satellite imagery from Landsat and Sentinel 2 [18,19,20]. However, the information on plant growth heterogeneity retrieved from the finer resolution sensors has not been sufficiently extended to understand the water status of heterogeneous pasture paddocks. Although the most commonly used satellite ET data is available globally at 500 m spatial resolution from the Moderate Resolution Imaging Spectroradiometer (MODIS) Global Evapotranspiration Product (MOD16), the scale of these observations may still be too coarse to distinguish finer scale land management, water use, and ET patterns in heterogeneous grasslands [21,22]. When compared to ET from eddy covariance measurements (ETEC), the ET derived from MOD16 (ETMOD500) was underestimated, with reported uncertainties up to 60% in monthly ET, mostly attributed to lack of resolution in landscape heterogeneity due to the coarse sensor footprint [23,24,25]. The footprint of ETEC can range from less than 100 m to hundreds of meters depending on tower height and several other factors. Thus, ETEC can be used to validate the satellite-estimated ET at different spatial scales. In this study, we compared ETEC from contrasting MP and NP pastures, with alternative MOD16 based ET simulations derived at different spatial resolutions (30 m, 200 m, 500 m, and 1000 m). A guiding hypothesis for this investigation is that the satellite-based ET estimated at finer spatial scale provides the best accuracy and performance relative to the field-measured ETEC for both natural and managed grassland pastures characteristic of the SGP region. Regarding the recognized variability of ET due to the spatial variability in vegetation growth resulting from pasture management, the investigation of ET at different spatial scales by comparing between differently managed pasture is very useful. This study can guide the development of ET products at the finer spatial scales for sustainable water use in different pastures systems of SGP.
2. Materials and Methods
2.1. Study Sites
Two co-located MP and NP flux sites (flux towers are 500 m apart) located at the United States Department of Agriculture (USDA), Agricultural Research Service (ARS), Grazingland Research Laboratory (GRL) in El Reno, Oklahoma (OK) were used in this study (Figure 1). These sites are representative of the grasslands of the SGP, which are characterized by sub-humid climate and mean annual temperature of ~15 °C, with monthly average temperature ranging from −13 °C in the coldest month (Jan) to 36 °C in the warmest month (Aug). The long-term average annual rainfall (1980–2010) is about 860 mm, but with larger interannual variability ranging from 200 mm (2003) to 1300 mm (2015). Rainfall patterns follow a bimodal distribution, with 30% of annual rainfall in spring (Feb–Apr) and 25% in autumn (Aug–Oct). Soils in the two grassland sites are largely Norge loamy prairie (Fine, mixed, thermic Udertic Paleustalf) with a depth greater than 1 m, high water holding capacity, and slope averaging about 1% (USDA1999).
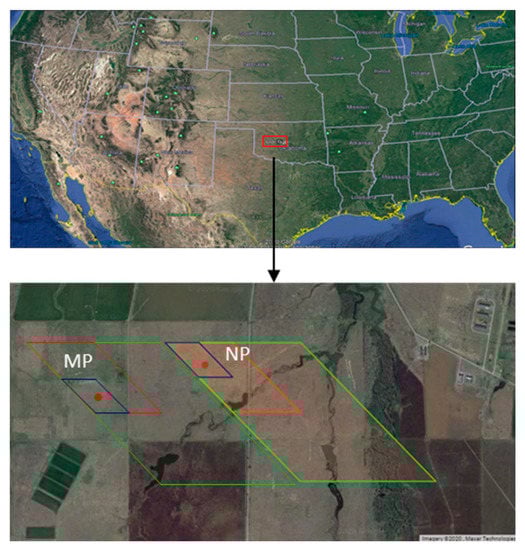
Figure 1.
Location of the study sites: managed pasture (MP) and native pasture (NP). Green, red, and blue rectangles represent the 1000 m, 500 m, and 250 m MODIS pixels, respectively, and the red circles inside the rectangle represent the location of eddy covariance tower.
History of pasture establishment and management for two pastures are as follows:
Managed pasture (MP) site: The MP site was converted from an NP by planting old world bluestem (Bothriochloa caucasica C. E. Hubb) in 1998 [26]. After the establishment of the pasture, the site has received varying management operations including burning, baling, fertilizer, herbicide, and cattle grazing [27,28]. Significant management activities during or prior to the study period in the MP included:
- burning in 2001, 2009, 2010, and 2014;
- periodic fertilizing and herbicide spraying (e.g., nitrogen fertilizer of about 67 N kg ha−1 and 44 kg N ha−1 was applied in 2007 and 2009, respectively);
- significant biomass was removed from the pasture by haying every year from 2008 to 2011, and in 2014 and 2016;
- the pasture was grazed with different stocking density almost every year except in 2006 and 2007.
Native pasture (NP) site: Tallgrass prairie is predominantly warm season vegetation representing the native, mixed species grassland of Oklahoma. The site has mixture of C4 and C3 species. The dominant C4 species were big bluestem (Andropogon gerardi Vitman), little bluestem (Schizachyrium halapense (Michx.) Nash), Indian grass (Sorghastrum nutans), and crab grass (Digitaria sanguinalis). The major C3 species were tall fescue, perennial rye grass, Kentucky bluegrass, bermudagrass, and other forbs. The pasture has been minimally managed over the years, except for cattle grazing, prescribed burn, and weed control by spraying herbicide. The details on the management activities at MP and NP sites in 2015 and 2016 are presented in Table S1.
2.2. Data
2.2.1. Eddy Covariance ET (ETEC) Data Collection and Processing
Eddy covariance (EC) towers were deployed to measure ET from MP (35.5685, −98.0558) and NP (35.54865°, −98.03759°). Continuous 10 Hz frequency (10 samples s−1) of H2O fluxes was measured from the two pastures from January 2015 to December 2016. In both pastures, a three-dimensional sonic anemometer (CSAT3, Campbell Scientific Inc., Logan, UT, USA) and an open path infrared gas analyzer (LI-7500, LI-COR Inc., Lincoln, NE, USA) were mounted in a tower structure at a height of 2.5 m from the ground with the fetch area of about 300 m in all directions. The EC system was set up near the center of each site facing south, towards the prevalent wind direction. Additional sensors were deployed to measure other meteorological and soil variables as listed in Table 1.

Table 1.
List of the auxiliary sensors deployed at the study sites for the measurement of meteorological and soil variables.
The EddyPro software (LI-COR Inc., Lincoln, NE, USA) was used to process the raw data into 30-min ET values. Quality flags (QC/QA) were applied to screened data as identified by the software (0: good quality, 1: medium quality, and 2: bad quality). During the quality check, we also excluded data outside a ±3.5 standard deviation range from a 14-day running mean window [29]. This allowed us to filter out the data outside of the accepted range [30,31,32]. The gaps in the dataset created due to filtering of bad quality and unreliable values and malfunctioning of the sensors were gap filled using REddyProc package, developed at the Max Planck Institute for Biogeochemistry, Jena, Germany [33,34]. Mean diurnal variation, look up tables, and regressions techniques were employed in the REddyProc to fill the gaps. The details on the gap filling using this R package have been described in previous studies [33,35,36,37,38]. The computed half hourly ET values were then used to generate daily, monthly, and seasonal ET values.
2.2.2. MODIS ET Data at Different Spatial Resolutions
The commonly used MOD16 ET global data product (MOD16A2) is operationally available at a 500 m spatial resolution [39]. The MOD16 algorithm is based on the Penman-Monteith equation, which uses daily global meteorological reanalysis data and MODIS observed vegetation fractional cover (Fc), leaf area index (LAI), albedo, and land cover as primary inputs for the ET calculation. A detailed description of the MOD16 ET algorithm and performance is presented in Mu et al. (2011). In this study, we used a field scale implementation of MOD16 that is available at a 30 m resolution [25]. To assess how differing spatial resolution affects model accuracy relative to EC observations, we averaged all 30 m pixels for each time step within 30 m (MODET30), 200 m (MODET200), 500 m (MODET500), and 1000 m (MODET1000) diameter circles around each tower in both pastures. The key Fc and LAI MOD16 inputs were derived from 30 m EVI record using the methodology of [25]:
where min and max represent minimum and maximum values of EVI, respectively.
2.2.3. Statistical Validation of MODIS ET Estimates with ETEC
Seasonal patterns of MODIS ET at four different spatial scales were compared with the seasonal pattern of ETEC in both pastures. In addition, simple linear regression analyses were conducted between each MODIS ET series (MODET30, ETMOD200, ETMOD500, and ETMOD1000) and ETEC for each pasture site in each year to assess the ability of MODIS satellite to predict ET as measured by the eddy flux towers at four different spatial scales. The linear relationship was evaluated using the R2 values computed from the regressions. In addition to R2, we also reported slope, which provides useful information about the magnitude of bias affecting higher/lower ET estimates as compared to ETEC. Root mean square error (RMSE) was computed using the following equation to test the goodness of fit between ET estimates:
where, ET (MOD) is the ET estimates for ETMOD16 at different spatial scales, i represents the time step (8-day), and N is the total number of observations.
3. Results
3.1. Weather Conditions, Vegetation Growth, and ET in 2015 and 2016
We assume that both co-located pastures experienced similar weather conditions. The daily records of rainfall, air temperature, soil water content, and the weekly photosynthetically active radiation are presented in Figure 2. Seasonal rainfall and mean temperature compared with the 30-year average (1981–2010) are presented in Table 2. Meteorologically, 2015 and 2016 were slightly warmer than the 30-year average (1980–2010). However, with respect to annual rainfall, 2015 was a pluvial year and 2016 was a drier year with total annual rainfall of 1273 mm and 635 mm, respectively, compared to the 30-year mean total annual rainfall of 871 mm. Throughout year 2015, the sites received good rainfall with a record high monthly rainfall of 393 mm occurring in May (30-year average May rainfall = 124 mm). Both sites showed similar trends in soil water content (SWC) fluctuations corresponding with rainfall events (Figure 2b).
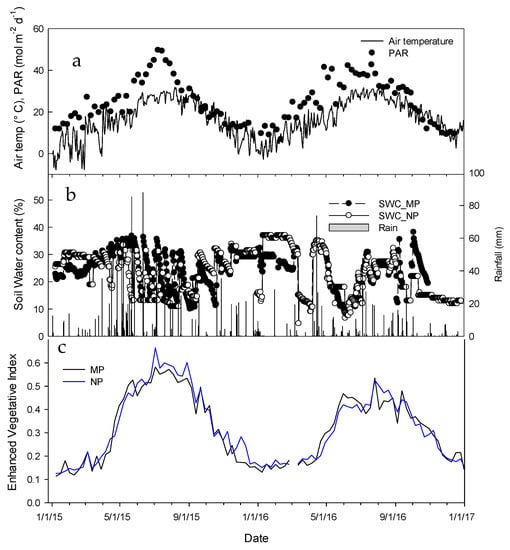
Figure 2.
Seasonal dynamics of (a) air temperature, photosynthetically active radiation (PAR), (b) soil water content, rainfall, and (c) Moderate Resolution Spectroradiometer (MODIS)-derived enhanced vegetation index for the study sites in 2015 and 2016.
Table 2.
Seasonal total rainfall and seasonal mean temperature in 2015 and 2016 as compared to the 30-year mean (1981–2010) for El Reno, OK, USA.
The vegetation phenology and productivity of the pastures during the growing season are dependent on the amount and distribution of rainfall. We used the MODIS-derived EVI as a proxy to determine the difference in phenology and productivity between two pastures, as affected by rainfall conditions. The EVI was higher in the wet year (2015) than it was in the dry year (2016) in both pastures. In both pastures, the maximum EVI was observed one month earlier in 2015 (July first week) than in 2016 (end of July–first week of August). This difference in phenology between the two years was driven by the higher spring temperature in 2015 than in 2016 (Table 2), consistent with the findings of [40]. The green-up of the MP pasture was earlier by about two weeks than the NP as evidenced by the higher EVI during 2015 and 2016 (Figure 2c). This result was consistent with the multi-year EVI average (2010–2016) (Figure S1). The in situ records of LAI and aboveground biomass (AGB) also showed earlier green-up of MP than NP responding to the warmer and wetter spring. For example, in 2015, LAI and AGB in MP were measured 0.62 and 78.7 g/m2, respectively, on DOY 100 whereas LAI and AGB in NP were 0.45 and 72.8 g/m2, respectively, on the same day. Observations from both study years as well as from the multi-year average EVI data revealed more variability in EVI values in MP than NP during the growing seasons, reflecting greater sensitivity of MP with regard to management and climatic factors.
Diurnal courses of ET and changes in ET rates (half hourly) for MP and NP across the 2015 and 2016 growing seasons are presented in Figure 3. Typical diurnal trends (average for all days in a month) in both pastures across the growing seasons are compared in Figure 4. Higher half-hourly ET rates (dark red color) were observed between 10 am and 6 pm of each day. There were large differences in ET at half-hourly and daily scales between sites and years. The patterns of ET at the 8-day time step are presented in Figure 5. During the growing season, daily ET (8-day average) in MP was in the range of 0.5 to 6.4 mm d−1 in 2015 and 0.6 to 5.0 mm d−1 in 2016.
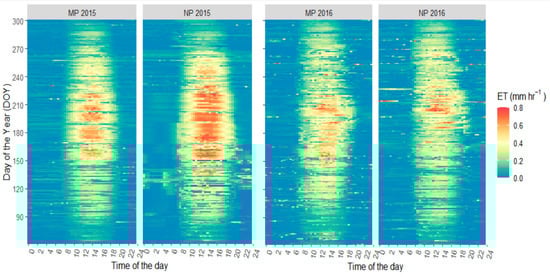
Figure 3.
Half-hourly evapotranspiration (ET) footprints of managed pasture (MP) and native pasture (NP) during the 2015 and 2016 growing season (March–October). Each data point is a 30-min time-stamp average value calculated from 10-Hz frequency data.
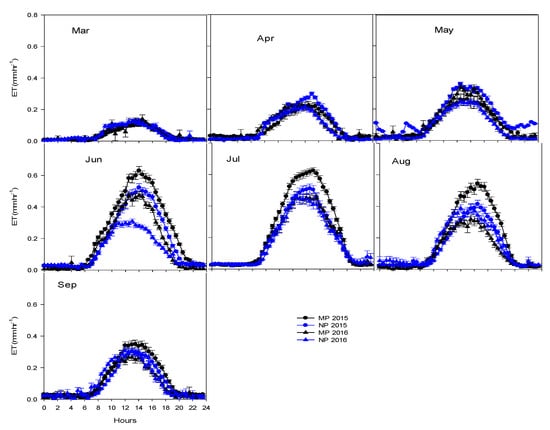
Figure 4.
Half-hourly binned diurnal courses of evapotranspiration (ET) in managed pasture (MP) and native pasture (NP) during the 2015 and 2016 growing seasons. Each data point is a 30-min time-stamp average value for the entire month. Bars represent standard errors of the means.
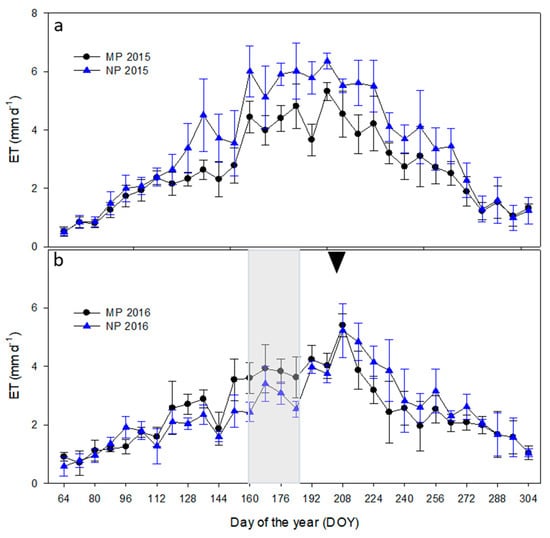
Figure 5.
Patterns of 8-day average daily evapotranspiration (ET) in managed pasture (MP) and native pasture (NP) during the 2015 (a) and 2016 (b) growing seasons. Bars represent standard errors of the means. The shaded region in b represents a case of 30-day grazing window in both pastures, and the black inverted triangle in b represents the timing for hay in MP.
Daily ET for NP was in the range of 0.5 to 4.6 mm d−1 in 2015 and 0.9 to 4.8 mm d−1 in 2016. Generally, in both years, with the growth of vegetation, the ET rates started to increase and reached a maximum during June–July before declining during the late growing season in both pastures. However, the magnitude and timing of higher ET rates varied between years and pasture types depending upon weather conditions and plant growth. Good rainfall distribution in 2015 contributed to higher ET rates from mid-April to September in NP than MP (dark red shades in Figure 3. In 2016, ET rates followed the growth patterns of vegetation. The earlier green-up in MP showed higher ET rates in MP during the early growing season, while this pattern was vice versa during the late growing season. In both years, monthly sums of ET followed the pattern of EVI sums (Figure 6). However, the magnitudes of ET were dependent on the rainfall conditions. The higher EVI values in 2015 in NP than MP corresponded with the highest seasonal ET values of 804 mm (63% of total annual rainfall). The total growing season ET for MP in 2015 was only 616 mm (48% of annual rainfall). The growing season ET totals in 2016 were similar between the two pastures, with 573 mm (90% of total annual rainfall) in MP and 561 mm (88% of total annual rainfall) in NP. However, the monthly sums of EVI and ET for these two pastures were different. The MP had both higher EVI and ET (monthly sums) in April–June, whereas the sums of EVI and ET in August and September were higher in NP.
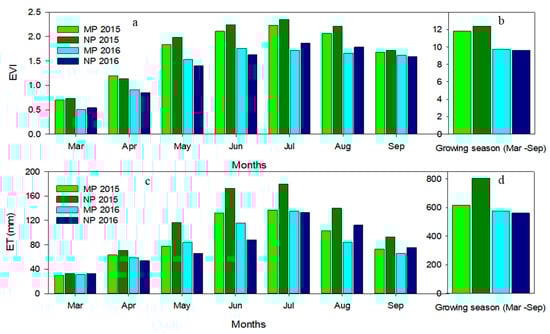
Figure 6.
Monthly and seasonal sums of: Enhanced Vegetation index (EVI) (a,b), and Evapotranspiration (ET) (c,d) in managed pasture (MP) and native pasture (NP) in 2015 and 2016.
3.2. Comparison of MODIS ET (MODET30, ETMOD200, ETMOD500, and ETMOD1000) and ETEC at the Study Sites during 2015–2016
In general, all MOD16 ET records at the four spatial scales performed well in capturing the variability of ET, with R2 > 0.8, regardless of pasture types and rainfall conditions. However, the ET estimation accuracies varied across different spatial scales of MOD16 ET products. The MOD16 ET at all spatial scales was underestimated compared to ETEC irrespective of sites and years (Figure 7). However, ETMOD30 was more accurate than ETMOD200, ETMOD500, and ETMOD1000 when compared to ETEC. More specifically, ETMOD30 had less bias and smaller RMSE than the coarser spatial resolution MOD16 ET products (Figure 7). For both sites and years, the difference between ETEC and MOD16 ET products, except for ETMOD30, was substantial throughout the growing season, with the largest difference being observed in 2015 at the NP site (RMSE = 1.54 mm d−1, bias = 1.56 mm d−1). However, the difference in ETMOD30 and ETEC during the beginning and towards the end of growing season was minimal. The magnitude of difference between ETMOD30 and ETEC during the middle of growing season was also smaller when compared to other MOD16 ET products of higher spatial scales irrespective of sites and years.
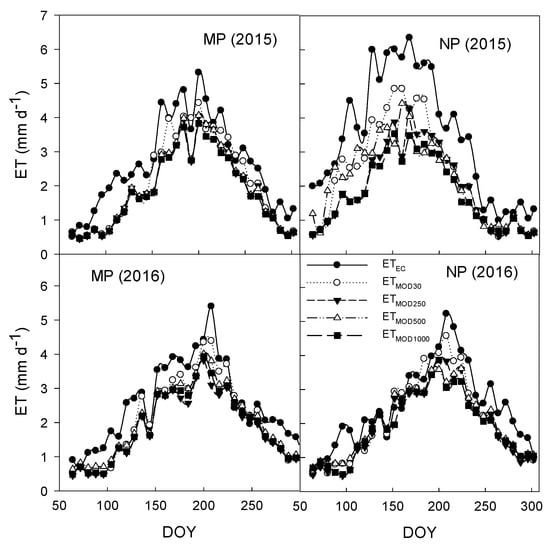
Figure 7.
Seasonal dynamics of 8-day average daily values of eddy covariance measured evapotranspiration (ECET) and MODIS ET (ETMOD30, ETMOD200, ETMOD500, and ETMOD1000) at 30, 250, 500, and 1000 m spatial resolution in managed pasture (MP) and native pasture (NP) during the 2015 and 2016 growing seasons.
4. Discussion
4.1. Grassland Productivity, Vegetation Composition and ET in Pluvial Year
The differential response of pastures to rainfall may reflect differences in vegetation composition between MP and NP. The type of grass and inclusion of C3 and C4 species will influence the pasture composition that determines the annual growth cycle of the pasture. For example, the majority of growth of cool season species occurs in the spring and early summer, while peak production of warm season grasses occurs during summer. The MP in our study is a C4 monoculture pasture dominated by old world bluestem whereas NP maintains its diversity naturally with varying proportion of C3 and C4 species depending upon weather conditions. The temperature and rainfall also determine the growth cycle, as well as the relative abundance of C3/C4 species [41]. Consequently, vegetation phenology (measured by EVI) was varied, and ET showed considerable variations between years as the ratio of plant transpiration to total ET largely depends on vegetation coverage, which increases with vegetation growth [42,43]. With different species composition, it is expected that the two pastures would behave differently in terms of water use. In our study, we found that the two pastures behaved differently in terms of ET magnitudes in 2015 and 2016, which corresponded with the change in EVI. MP is supposed to have higher productivity when water resources in the soil are not limiting. However, MP did not harness the advantage of record rainfall in 2015 fully as compared to NP. Throughout the growing season, the EVI in 2015 was smaller in MP than in NP. Similarly, the peak AGB was also lower in MP (952 g m−2) than NP (1048 gm−2). The NP used the excess rainfall of 2015 more efficiently than did MP, resulting in higher EVI and ET. The relationship of higher vegetation growth with higher ET was also observed in the 2016 growing season, with higher ET in MP during the early growth season when EVI was larger. Similarly, higher ET was observed during the late growing season in NP when EVI of NP was higher than that of MP. The EVI has been reported as a driving factor of ET by several other studies [44,45,46,47]. One of the most distinctive features we observed is the difference of ET during high rainfall periods. Generally, C4 species use water more efficiently than C3 species under water-limited conditions, but less attention has been given to how C4 species respond to excess water. Lower EVI in C4 pasture (MP) showed that it was less efficient in using excess water (rainfall) than mixed species (NP), resulting lower ET in MP than NP, which might be explained by the lower leaf area or the inability of roots to absorb available water. Similar results of higher ET of mixed species grassland have been reported by [48], compared to monocultures in wet years.
4.2. Management Factors and ET Differences between Two Pastures
In this study, we compared both patterns and magnitudes of ET between two differently managed pastures during contrasting wet and dry years. One of the most important insights on the variability of ET is the management factor in MP. The combined variability of climate, management, and plant functional type have influenced the overall ET in MP, although this study did not attempt to disentangle the contributions separately. The higher intensity of management activities such as burning and grazing and different plant functional types might have contributed to the alteration of growth phenology such as earlier green-up and earlier senescence in MP than NP, resulting in different half hourly ET rates and magnitudes at respective time periods between the two pasture types. In 2014, MP was burned and hayed whereas NP did not receive any treatment. During 2015–2016, the grazing intensity between the two pastures was different and MP was hayed in mid-August in 2015 (Table 3). There are contrasting observations on the impacts of grazing on ET in pastures. The total ET can be either reduced [13,49,50,51] or enhanced [52,53,54] by cattle grazing. A few studies have also reported no change in ET due to grazing [55,56]. In our study, we found decreased ET after grazing in both pastures because grazing can change the biophysical properties of the canopy through decrease in canopy density affecting the transpiration contribution to total ET. For example, ET decreased by ~1 mm d−1 (managed = 1.28, native = 0.97) during the grazing period which was recovered after one week of grazing (Table 3, Figure 5a,b shaded region). The recovery of the plant growth was faster after grazing which again compensated for the decreased ET. Since MP is more intensely grazed than NP, we observed that total ET of the MP was also impacted more by grazing than that of NP. Another important management activity that affected total ET of MP was hay cutting (Figure 5b, black triangle) in early August of 2016. The weekly ET rates of about 7.7 mm d−1 were reduced to 4.6 mm d−1 following haying and then slowly recovered after a week. After the pasture was hayed, vegetation recovery was slow, and ET did not reach to the previous stage (before haying) (Figure 2c), resulting in lower ET in MP than NP for the same period (Figure 4).
Table 3.
Effects of management activities (grazing and haying) on evapotranspiration (ET) at native and manage pastures.
4.3. Smaller Spatial Scales Provide Better ET Estimates in Grazing Pasture
The objective of paddocks grazing is to maintain the vigor and production of forage resources for increasing cattle productivity. Overall, remote sensing techniques have been widely used to assess the health of vegetation affected by various factors. Until recently, operational and technical challenges have existed due to the segmentation scale (management) and spatial scale (satellite) mismatch [57]. The widely used MODIS-derived normalized difference vegetation index (NDVI) or EVI to describe vegetation growth is often obtained at a resolution larger than the size of pastures, thereby capturing information from the adjacent land [20]. However, the use of finer spatial footprint satellite observations (e.g., Landsat-8, Sentinel-1, and Sentinel-2) allows for ET estimates that more effectively delineate pasture zones segregated by management. For instance, the MOD16 ET estimates at 30 m (MODET30) spatial scales, derived from the fusion of Landsat and MODIS EVI, showed better performances than the ET estimates made at 200, 500, and 1000 m scales (ETMOD200, ETMOD500, and ETMOD1000) when compared to ETEC (Figure 8). The RMSE and mean biases of the ETMOD30 were generally small and corresponded strongly with ETEC. The MOD16 ET data at coarser spatial resolutions tended to increasingly underestimate ET in both pastures, which was consistent with previous studies reporting poor performances of the MOD16 ET algorithm for multiple biomes [58,59,60]. The main reasons for the underestimation are the lack of optimization of several parameters including the vegetation characteristics representative of the study site. One of the site-specific parameters in our study site is the heterogeneous vegetation growth resulting from cattle grazing preferences and the rotational grazing. To capture the inherent spatial variability in ET caused by cattle grazing and management, our results suggested that ET estimated at finer scale would be more reliable and that has been reflected to some extent in the MODET30 estimates. The error in flux estimation due to mismatches between coarser spatial resolution of the MOD16 operational ET product and finer spatial heterogeneity of vegetation characteristics has been discussed previously [21,61,62]. Previous model performance evaluation of ETMOD16 showed errors due to underestimation of ET associated with uncertainties in poor retrievals of LAI (large canopies) and high soil moisture condition [63,64]. Our results of spatial mismatch between EC footprint and the satellite products in the grazing paddocks were consistent with the findings of Wagle et al. (2020). They showed the improved performance of satellite products that are comparable to EC tower footprints in heterogeneous pastures.
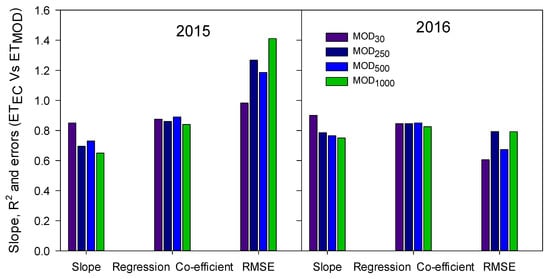
Figure 8.
Performance of MOD ET (MODET30, ETMOD200, ETMOD500, and ETMOD1000) data at 30, 250, 500, and 1000 m spatial scales based on bias (slope), regression coefficients (R2), and root mean square error (RMSE) obtained from the linear regression against ET from eddy covariance (ETEC).
5. Conclusions
Differently managed pastures showed differences in ET at half-hourly to seasonal scales. Managed pasture (MP) showed lower ET than native pasture (NP) during a pluvial year (2015) whereas the seasonal variation existed in ET magnitudes between two pastures in 2016 (relatively drier year). The C3 and C4 species composition of NP showed greater ability to utilize higher rainfall with good vegetation growth and higher ET. Management activities like grazing and haying affected the vegetation growth, which in turn impacted the total ET of the pastures. The ET estimates at finer spatial sales (30 m) derived using complimentary satellite information was closer to the ET values obtained from eddy covariance measurements (ETEC). The MOD16 ET estimated at the 30 m scale still showed significant underestimation relative to the ETEC, which might be due to the spatial variability of vegetation growth due to grazing and management activities within the pixel. This study reinforces the need to assess ET of pastures at finer spatial scales closer to the level of management treatments, especially when the pastures have diverse management inputs and heterogeneities. Results from this study showed that when native pastures undergo different management activities for enhancing higher grass production, the water use and loss are dependent on climate variability and the heterogeneities within management units. Therefore, a better estimation of the water uses and loss from differently managed pasture at finer scale would be required for establishing resilient and higher productive pasture.
Supplementary Materials
The following are available online at https://www.mdpi.com/2072-4292/13/1/82/s1, Figure S1: Comparison of 8-day enhanced vegetation index (EVI) between introduced managed pasture (MP) and native pasture (NP). Each point is a mean from 2010 to 2016 and vertical bar represents the standard errors. Table S1: Major management activities at the managed and native prairie pastures during the study period (2015–2016).
Author Contributions
Conceptualization, R.B., X.X., and P.W.; data collection, R.B., J.B.B., P.J.S., and J.P.S.N.; methodology, R.B., J.S.K., and C.B.; writing—review and editing, R.B., P.W., P.J.S., J.S.K., and C.B.; resources, X.X., J.B.B., P.G., and P.J.S. All authors have read and agreed to the published version of the manuscript.
Funding
This study was supported in part by research grants from the USDA National Institute of Food and Agriculture (NIFA) (award # 2013-69002-23146 and 2016-68002-24967) and the US National Science Foundation (NSF) EPSCoR (IIA-1301789). This research was a contribution from the Long-Term Agroecosystem Research (LTAR) network. LTAR is supported by the United States Department of Agriculture.
Data Availability Statement
The data presented in this study are available on request from the corresponding author.
Conflicts of Interest
The authors declare no conflict of interest.
References
- White, R.P.; Murray, S.; Rohweder, M.; Prince, S.; Thompson, K. Grassland Ecosystems; World Resources Institute: Washington, DC, USA, 2000. [Google Scholar]
- O’Mara, F.P. The role of grasslands in food security and climate change. Ann. Bot. 2012, 110, 1263–1270. [Google Scholar] [CrossRef]
- Suttie, J.M.; Reynolds, S.G.; Batello, C. Grasslands of the World; Food and Agriculture Organizaton: Rome, Italy, 2005; Volume 34. [Google Scholar]
- Hayes, D.J.; Turner, D.P.; Stinson, G.; McGuire, A.D.; Wei, Y.; West, T.O.; Heath, L.S.; De Jong, B.; McConkey, B.G.; Birdsey, R.A. Reconciling estimates of the contemporary North American carbon balance among terrestrial biosphere models, atmospheric inversions, and a new approach for estimating net ecosystem exchange from inventory-based data. Glob. Chang. Biol. 2012, 18, 1282–1299. [Google Scholar] [CrossRef]
- Muir, J.; Pitman, W.; Foster, J. Sustainable, low-input, warm-season, grass–legume grassland mixtures: Mission (nearly) impossible? Grass Forage Sci. 2011, 66, 301–315. [Google Scholar] [CrossRef]
- Bajgain, R.; Xiao, X.; Basara, J.; Doughty, R.; Wu, X.; Wagle, P.; Zhou, Y.; Gowda, P.; Steiner, J.J.A.; Meteorology, F. Differential responses of native and managed prairie pastures to environmental variability and management practices. Agric. For. Meteorol. 2020, 294, 108137. [Google Scholar] [CrossRef]
- Novick, K.A.; Stoy, P.C.; Katul, G.G.; Ellsworth, D.S.; Siqueira, M.; Juang, J.; Oren, R. Carbon dioxide and water vapor exchange in a warm temperate grassland. Oecologia 2004, 138, 259–274. [Google Scholar] [CrossRef]
- Kim, J.; Verma, S.B. Carbon dioxide exchange in a temperate grassland ecosystem. Bound. Layer Meteorol. 1990, 52, 135–149. [Google Scholar] [CrossRef]
- Rajan, N.; Maas, S.J.; Cui, S. Extreme drought effects on summer evapotranspiration and energy balance of a grassland in the Southern Great Plains. Ecohydrology 2015, 8, 1194–1204. [Google Scholar] [CrossRef]
- Bremer, D.J.; Auen, L.M.; Ham, J.M.; Owensby, C.E. Evapotranspiration in a prairie ecosystem. Agron. J. 2001, 93, 338–348. [Google Scholar] [CrossRef]
- Pronger, J.; Campbell, D.; Clearwater, M.; Rutledge, S.; Wall, A.; Schipper, L. Low spatial and inter-annual variability of evaporation from a year-round intensively grazed temperate pasture system. Agric. Ecosyst. Environ. 2016, 232, 46–58. [Google Scholar] [CrossRef]
- Rose, L.; Coners, H.; Leuschner, C. Effects of fertilization and cutting frequency on the water balance of a temperate grassland. Ecohydrology 2012, 5, 64–72. [Google Scholar] [CrossRef]
- Niraula, R.; Saleh, A.; Bhattarai, N.; Bajgain, R.; Kannan, N.; Osei, E.; Gowda, P.; Neel, J.; Xiao, X.; Basara, J. Understanding the effects of pasture type and stocking rate on the hydrology of the Southern Great Plains. Sci. Total Environ. 2020, 708, 134873. [Google Scholar] [CrossRef]
- Villegas, J.C.; Dominguez, F.; Barron-Gafford, G.A.; Adams, H.D.; Guardiola-Claramonte, M.; Sommer, E.D.; Selvey, A.W.; Espeleta, J.F.; Zou, C.B.; Breshears, D.D. Sensitivity of regional evapotranspiration partitioning to variation in woody plant cover: Insights from experimental dryland tree mosaics. Glob. Ecol. Biogeogr. 2015, 24, 1040–1048. [Google Scholar] [CrossRef]
- Fisher, J.B.; Melton, F.; Middleton, E.; Hain, C.; Anderson, M.; Allen, R.; McCabe, M.F.; Hook, S.; Baldocchi, D.; Townsend, P.A. The future of evapotranspiration: Global requirements for ecosystem functioning, carbon and climate feedbacks, agricultural management, and water resources. Water Resour. Res. 2017, 53, 2618–2626. [Google Scholar] [CrossRef]
- Christian, J.; Christian, K.; Basara, J.B. Drought and pluvial dipole events within the great plains of the United States. J. Appl. Meteorol. Climatol. 2015, 54, 1886–1898. [Google Scholar] [CrossRef]
- Bajgain, R.; Xiao, X.; Wagle, P.; Basara, J.; Zhou, Y. Sensitivity analysis of vegetation indices to drought over two tallgrass prairie sites. ISPRS J. Photogramm. Remote Sens. 2015, 108, 151–160. [Google Scholar] [CrossRef]
- Wang, J.; Xiao, X.; Bajgain, R.; Starks, P.; Steiner, J.; Doughty, R.B.; Chang, Q. Estimating leaf area index and aboveground biomass of grazing pastures using Sentinel-1, Sentinel-2 and Landsat images. ISPRS J. Photogramm. Remote Sens. 2019, 154, 189–201. [Google Scholar] [CrossRef]
- Laurin, G.V.; Balling, J.; Corona, P.; Mattioli, W.; Papale, D.; Puletti, N.; Rizzo, M.; Truckenbrodt, J.; Urban, M. Above-ground biomass prediction by Sentinel-1 multitemporal data in central Italy with integration of ALOS2 and Sentinel-2 data. J. Appl. Remote Sens. 2018, 12, 016008. [Google Scholar] [CrossRef]
- Rigge, M.; Smart, A.; Wylie, B.; Gilmanov, T.; Johnson, P. Linking phenology and biomass productivity in South Dakota mixed-grass prairie. Rangel. Ecol. Manag. 2013, 66, 579–587. [Google Scholar] [CrossRef]
- Mu, Q.; Zhao, M.; Running, S.W. Improvements to a MODIS global terrestrial evapotranspiration algorithm. Remote Sens. Environ. 2011, 115, 1781–1800. [Google Scholar] [CrossRef]
- Knipper, K.; Hogue, T.; Scott, R.; Franz, K. Evapotranspiration estimates derived using multi-platform remote sensing in a semiarid region. Remote Sens. 2017, 9, 184. [Google Scholar] [CrossRef]
- Velpuri, N.M.; Senay, G.B.; Singh, R.K.; Bohms, S.; Verdin, J.P. A comprehensive evaluation of two MODIS evapotranspiration products over the conterminous United States: Using point and gridded FLUXNET and water balance ET. Remote Sens. Environ. 2013, 139, 35–49. [Google Scholar] [CrossRef]
- King, E.; Van Niel, T.; Van Dijk, A.; Wang, Z.; Paget, M.; Raupach, T.; Guerschman, J.; Haverd, V.; McVicar, T.; Miltenburg, I. Actual Evapotranspiration Estimates for Australia Inter-Comparison and Evaluation; CSIRO: Canberra, Australia, 2011; pp. 1–5.
- He, M.; Kimball, J.S.; Yi, Y.; Running, S.W.; Guan, K.; Moreno, A.; Wu, X.; Maneta, M. Satellite data-driven modeling of field scale evapotranspiration in croplands using the MOD16 algorithm framework. Remote Sens. Environ. 2019, 230, 111201. [Google Scholar] [CrossRef]
- Coleman, S.; Phillips, W.; Volesky, J.; Buchanan, D. A comparison of native tallgrass prairie and plains bluestem forage systems for cow-calf production in the Southern Great Plains. J. Animal Sci. 2001, 79, 1697–1705. [Google Scholar] [CrossRef] [PubMed]
- Northup, B.K.; Rao, S.C. Green manure and forage potential of lablab in the U.S. Southern Plains. Agron. J. 2015, 107, 1113–1118. [Google Scholar] [CrossRef]
- Zhou, Y.T.; Xiao, X.M.; Wagle, P.; Bajgain, R.; Mahan, H.; Basara, J.B.; Dong, J.W.; Qin, Y.W.; Zhang, G.L.; Luo, Y.Q.; et al. Examining the short-term impacts of diverse management practices on plant phenology and carbon fluxes of Old World bluestems pasture. Agr. For. Meteorol. 2017, 237, 60–70. [Google Scholar] [CrossRef]
- Wagle, P.; Kakani, V.G.; Huhnke, R.L. Net ecosystem carbon dioxide exchange of dedicated bioenergy feedstocks: Switchgrass and high biomass sorghum. Agric. For. Meteorol. 2015, 207, 107–116. [Google Scholar] [CrossRef]
- Ní Choncubhair, Ó.; Osborne, B.; Finnan, J.; Lanigan, G. Comparative assessment of ecosystem C exchange in Miscanthus and reed canary grass during early establishment. GCB Bioenergy 2017, 9, 280–298. [Google Scholar] [CrossRef]
- Joo, E.; Hussain, M.Z.; Zeri, M.; Masters, M.D.; Miller, J.N.; Gomez-Casanovas, N.; DeLucia, E.H.; Bernacchi, C.J. The influence of drought and heat stress on long term carbon fluxes of bioenergy crops grown in the Midwestern US. Plant Cell Environ. 2016, 39, 1928–1940. [Google Scholar] [CrossRef]
- Zeri, M.; Anderson-Teixeira, K.; Hickman, G.; Masters, M.; DeLucia, E.; Bernacchi, C.J. Carbon exchange by establishing biofuel crops in Central Illinois. Agric. Ecosyst. Environ. 2011, 144, 319–329. [Google Scholar] [CrossRef]
- Moffat, A.M.; Papale, D.; Reichstein, M.; Hollinger, D.Y.; Richardson, A.D.; Barr, A.G.; Beckstein, C.; Braswell, B.H.; Churkina, G.; Desai, A.R. Comprehensive comparison of gap-filling techniques for eddy covariance net carbon fluxes. Agric. For. Meteorol. 2007, 147, 209–232. [Google Scholar] [CrossRef]
- Reichstein, M.; Falge, E.; Baldocchi, D.; Papale, D.; Aubinet, M.; Berbigier, P.; Bernhofer, C.; Buchmann, N.; Gilmanov, T.; Granier, A. On the separation of net ecosystem exchange into assimilation and ecosystem respiration: Review and improved algorithm. Glob. Chang. Biol. 2005, 11, 1424–1439. [Google Scholar] [CrossRef]
- Amiro, B.; Barr, A.; Black, T.; Iwashita, H.; Kljun, N.; McCaughey, J.; Morgenstern, K.; Murayama, S.; Nesic, Z.; Orchansky, A. Carbon, energy and water fluxes at mature and disturbed forest sites, Saskatchewan, Canada. Agric. For. Meteorol. 2006, 136, 237–251. [Google Scholar] [CrossRef]
- Falge, E.; Baldocchi, D.; Olson, R.; Anthoni, P.; Aubinet, M.; Bernhofer, C.; Burba, G.; Ceulemans, R.; Clement, R.; Dolman, H. Gap filling strategies for defensible annual sums of net ecosystem exchange. Agric. For. Meteorol. 2001, 107, 43–69. [Google Scholar] [CrossRef]
- Hui, D.; Wan, S.; Su, B.; Katul, G.; Monson, R.; Luo, Y. Gap-filling missing data in eddy covariance measurements using multiple imputation (MI) for annual estimations. Agric. For. Meteorol. 2004, 121, 93–111. [Google Scholar] [CrossRef]
- Wilson, K.; Baldocchi, D. Comparing independent estimates of carbon dioxide exchange over 5 years at a deciduous forest in the southeastern United States. J. Geophys. Res. D 2001, 106, 34. [Google Scholar] [CrossRef]
- Running, S.W.; Mu, Q.; Zhao, M.; Moreno, A. MODIS Global Terrestrial Evapotranspiration (ET) Product (MOD16A2/A3 and Year-End Gap-Filled MOD16A2GF/A3GF) NASA Earth Observing System MODIS Land Algorithm (For Collection 6); National Aeronautics and Space Administration: Washington, DC, USA, 2019.
- Wagle, P.; Gowda, P.H.; Northup, B.K.; Starks, P.J.; Neel, J.P.S. Response of tallgrass prairie to management in the US Southern Great Plains: Site descriptions, management practices, and eddy covariance instrumentation for a long-term experiment. Remote Sens. 2019, 11, 1988. [Google Scholar] [CrossRef]
- Paruelo, J.M.; Lauenroth, W. Relative abundance of plant functional types in grasslands and shrublands of North America. Ecol. Appl. 1996, 6, 1212–1224. [Google Scholar] [CrossRef]
- Gong, D.; Kang, S.; Yao, L.; Zhang, L. Estimation of evapotranspiration and its components from an apple orchard in northwest China using sap flow and water balance methods. Hydrol. Process. 2007, 21, 931–938. [Google Scholar] [CrossRef]
- Wagle, P.; Skaggs, T.H.; Gowda, P.H.; Northup, B.K.; Neel, J.P.J.A.; Meteorology, F. Flux variance similarity-based partitioning of evapotranspiration over a rainfed alfalfa field using high frequency eddy covariance data. Agric. For. Meteorol. 2020, 285, 107907. [Google Scholar] [CrossRef]
- Nagler, P.; Glenn, E.; Kim, H.; Emmerich, W.; Scott, R.; Huxman, T.; Huete, A. Relationship between evapotranspiration and precipitation pulses in a semiarid rangeland estimated by moisture flux towers and MODIS vegetation indices. J. Arid Environ. 2007, 70, 443–462. [Google Scholar] [CrossRef]
- Wagle, P.; Xiao, X.; Gowda, P.; Basara, J.; Brunsell, N.; Steiner, J.; Anup, K. Analysis and estimation of tallgrass prairie evapotranspiration in the central United States. Agric. For. Meteorol. 2017, 232, 35–47. [Google Scholar] [CrossRef]
- Polhamus, A.; Fisher, J.B.; Tu, K.P. What controls the error structure in evapotranspiration models? Agric. For. Meteorol. 2013, 169, 12–24. [Google Scholar] [CrossRef]
- Glenn, E.P.; Neale, C.M.; Hunsaker, D.J.; Nagler, P.L. Vegetation index-based crop coefficients to estimate evapotranspiration by remote sensing in agricultural and natural ecosystems. Hydrol. Process. 2011, 25, 4050–4062. [Google Scholar] [CrossRef]
- De Boeck, H.J.; Lemmens, C.M.; Bossuyt, H.; Malchair, S.; Carnol, M.; Merckx, R.; Nijs, I.; Ceulemans, R. How do climate warming and plant species richness affect water use in experimental grasslands? Plant Soil 2006, 288, 249–261. [Google Scholar] [CrossRef]
- Wang, L.; Liu, H.; Bernhofer, C. Grazing intensity effects on the partitioning of evapotranspiration in the semiarid typical steppe ecosystems in Inner Mongolia. Int. J. Climatol. 2016, 36, 4130–4140. [Google Scholar] [CrossRef]
- Wang, L.; Liu, H.; Ketzer, B.; Horn, R.; Bernhofer, C. Effect of grazing intensity on evapotranspiration in the semiarid grasslands of Inner Mongolia, China. J. Arid Environ. 2012, 83, 15–24. [Google Scholar] [CrossRef]
- Li, Y.; Fan, J.; Hu, Z.; Shao, Q.; Zhang, L.; Yu, H. Influence of land use patterns on evapotranspiration and its components in a temperate grassland ecosystem. Adv. Meteorol. 2015, 2015. [Google Scholar] [CrossRef]
- Day, T.; Detling, J. Water relations of Agropyron smithii and Bouteloua gracilis and community evapotranspiration following long-term grazing by prairie dogs. Am. Midl. Nat. 1994, 132, 381–392. [Google Scholar] [CrossRef]
- Pereyra, D.A.; Bucci, S.J.; Arias, N.S.; Ciano, N.; Cristiano, P.M.; Goldstein, G.; Scholz, F.G. Grazing increases evapotranspiration without the cost of lowering soil water storages in arid ecosystems. Ecohydrology 2017, 10, e1850. [Google Scholar] [CrossRef]
- Deng, X.; Güneralp, B.; Su, H. Observations and modeling of the climatic impact of land-use changes. Adv. Meteorol. 2014, 2014. [Google Scholar] [CrossRef]
- Chen, Y.; Lee, G.; Lee, P.; Oikawa, T. Model analysis of grazing effect on above-ground biomass and above-ground net primary production of a Mongolian grassland ecosystem. J. Hydrol. 2007, 333, 155–164. [Google Scholar] [CrossRef]
- Ketzer, B.; Liu, H.; Bernhofer, C. Surface characteristics of grasslands in Inner Mongolia as detected by micrometeorological measurements. Int. J. Biometeorol. 2008, 52, 563. [Google Scholar] [CrossRef] [PubMed]
- Liu, D.; Xia, F. Assessing object-based classification: Advantages and limitations. Remote Sens. Lett. 2010, 1, 187–194. [Google Scholar] [CrossRef]
- Long, D.; Singh, V.P. Integration of the GG model with SEBAL to produce time series of evapotranspiration of high spatial resolution at watershed scales. J. Geophys. Res. 2010, 115. [Google Scholar] [CrossRef]
- Yang, Y.; Shang, S. A hybrid dual-source scheme and trapezoid framework–based evapotranspiration model (HTEM) using satellite images: Algorithm and model test. J. Geophys. Res. 2013, 118, 2284–2300. [Google Scholar] [CrossRef]
- Yao, Y.; Liang, S.; Li, X.; Hong, Y.; Fisher, J.B.; Zhang, N.; Chen, J.; Cheng, J.; Zhao, S.; Zhang, X. Bayesian multimodel estimation of global terrestrial latent heat flux from eddy covariance, meteorological, and satellite observations. J. Geophys. Res. 2014, 119, 4521–4545. [Google Scholar] [CrossRef]
- Ershadi, A.; McCabe, M.F.; Evans, J.P.; Walker, J.P. Effects of spatial aggregation on the multi-scale estimation of evapotranspiration. Remote Sens. Environ. 2013, 131, 51–62. [Google Scholar] [CrossRef]
- Sharma, V.; Kilic, A.; Irmak, S. Impact of scale/resolution on evapotranspiration from Landsat and MODIS images. Water Resour. Res. 2016, 52, 1800–1819. [Google Scholar] [CrossRef]
- Tang, R.; Shao, K.; Li, Z.-L.; Wu, H.; Tang, B.-H.; Zhou, G.; Zhang, L. Multiscale validation of the 8-day MOD16 evapotranspiration product using flux data collected in China. IEEE J. Sel. Top. Appl. Earth Obs. Remote Sens. 2015, 8, 1478–1486. [Google Scholar] [CrossRef]
- Biggs, T.W.; Marshall, M.; Messina, A. Mapping daily and seasonal evapotranspiration from irrigated crops using global climate grids and satellite imagery: Automation and methods comparison. Water Resour. Res. 2016, 52, 7311–7326. [Google Scholar] [CrossRef]


Publisher’s Note: MDPI stays neutral with regard to jurisdictional claims in published maps and institutional affiliations. |
© 2020 by the authors. Licensee MDPI, Basel, Switzerland. This article is an open access article distributed under the terms and conditions of the Creative Commons Attribution (CC BY) license (http://creativecommons.org/licenses/by/4.0/).