1. Introduction
Moving from our previous paper on the topic [
1], a more accurate description of the work carried out is presented in this manuscript, where the theoretical background has been extended and details about the measurements have been more deeply analyzed and explained.
Radar systems play a very important role in modern cars since many years, before being nowadays exploited in autonomous driving vehicles. Radars can be used for different applications, as an example, for door opening warning, or park assistance to the driver. For each application, specific norms regulate the type of radar that it is possible to use [
2,
3]. During the time, the operating frequencies have been moved from the initial 24 GHz band to the 77 GHz one, and the reason of this shift is the increased necessity of larger bandwidth from other communication systems, such as the 5G [
4]. As a consequence, radar manufacturers have moved their systems between these two frequency bands [
5]. In most of the cases, these radars use the FMCW modulation technique, because of its simplicity (compared to other modulation techniques) and the use of fewer hardware components inside the devices, which reduces costs and complexity. FMCW Radar sensors are at present widely available in the market, since, thanks to technology advances, their cost and form factor have been shrinking over time. Many of these Radar sensors are designed for automotive and/or industrial applications, with working frequencies in the mmWave bands. In typical applications, FMCW Radars are used to detect objects inside an area [
6,
7], making it possible to detect the distance of the targets from the sensor, their radial velocity and their angle of arrival. Regardless of the application in the automotive field, these systems can be classified on the basis of distance sensing capability. In
Table 1 the classification is reported [
8].
The range capability of the sensor depends not only on the transmitted power and the antenna design, but on the sampling frequency of the ADC inside the device. With these Radars, the ADC can sample the signal with a lower frequency than the carrier frequency. On one hand, this is an advantage because it allows to use cheaper converters, but on the other hand it is also a drawback, because the maximum detectable range is related to the beat frequency, and the maximum value will correspond to the maximum sampling frequency of the ADC. In general, an FMCW Radar transmits chirps, that are reflected from the targets inside the observed scene and, by a multiplication between these signals, it is possible to extract the range information. In
Figure 1 a basic scheme of the FMCW Radar sensor is given.
In general, in a Radar system, the range estimation derives from the time delay between the transmitted signal and the returning echo signal. So, it is possible to evaluate the range based on the following equation [
9]:
where
c is the speed of light and
the echo delay. In an FMCW Radar, the range estimation derives directly from the product between the transmitted and the received signals. The result of this product is a signal called Beat signal and its frequency depends on the echo delay. With this type of Radars it is also possible to estimate the velocity of the targets in the scene: again, this is possible by evaluating the frequency of the Beat signal, according to:
were
is the frequency of the beat signal,
R is the distance of the target from the Radar,
is the frequency difference between the transmitted and the received chirp, and
T is the chirp time. Another term appears in the equation, namely
, which represents the value of the Doppler effect caused by a moving target [
10]. A graphical representation of the transmitted and received signal chirps is depicted in
Figure 2.
To estimate the velocity of the target, the transmission of multiple chirps is necessary. The performances of the system are related mainly to these parameters: the bandwidth used in each chirp, the chirp repetition time, the slope of the chirps, and also the wavelength. From [
11], it is possible to estimate the range resolution
and the velocity resolution
based on the following equations:
Another important feature used in these systems is the MIMO technology. The estimation of the angle of arrival of the targets is necessary for many ADAS applications, but the problem relies in the size of the Radar device, which must be very small to allow its integration in the vehicle. For this reason, many automotive radars use the MIMO technique to improve their angular resolution. This technique is well-known in communication systems but it can be also exploited for improving the angular resolution of Radar systems. The basic idea is to measure the phase difference between signals at a receiver array. This is possible by performing a FFT along the spatial axis, using the signals’ samples. In
Figure 3 this principle is depicted by using two receiver antennas and two transmitters. It is important to specify that the target must be in far-field so the paths travelled by the reflected signals can be considered as parallel.
In
Figure 3 only the transmitters and the Rx1 and Rx2 receivers are real elements of the antenna; Rx3 and Rx4 are virtual elements. The phase difference
at each receiver antenna depends on the distance
between the elements, and can be calculated from:
The changes if the transmitter is Tx1 or Tx2, so, considering the receiver elements spaced by a distance of , and Tx2 at a distance of from Tx1, the at Rx1 is 0 when Tx1 transmits, and when Tx2 transmits. The same happens for Rx2, where the phase difference is when Tx1 transmits, and when Tx2 transmits. For this reason it is possible to extend the MIMO array with two additional elements, and the new array is called Virtual Array. The elements Rx3 and Rx4 are virtual and generated by the phase delay. This way, the angular resolution can be improved, but still keeping a physically smaller antenna.
As described in [
12], for a target with an angle of arrival equal to
, the reflected signal arriving at the receivers has a spatial frequency equal to:
A second target can have the same spatial frequency, but the sine argument is
so the difference between these two spatial frequencies can be calculated as:
These two spatial frequencies are separated by
and this value is visible inside the FFT computation. The number of points used in the FFT depends on the number of virtual elements. The Radar condition to resolve two targets in the angular domain is:
where
N is the number of virtual elements of the receiver antenna. In general, the receiver antenna elements are spaced by a
distance so, at the end, the angular resolution for an FMCW MIMO radar is:
By observing Equation (
9) it is possible to understand why the use of the MIMO technique is important. In order to attain better angular resolution, the device needs more receiver elements, but this is a drawback in terms of physical dimensions of the device. By implementing MIMO, it is possible to improve the virtual elements of the array while maintaining a small form factor at the same time.
1.1. Radar micro-Doppler Effect for a Vibrating Target
With the exploitation of the Doppler effect it is possible to measure the velocity of the targets, but there is another interesting effect in Radar systems. Suppose that our target moves in the direction of the Radar system, towards it: this movement produces a Doppler effect depending on the relative velocity between Radar and target. It is possible also that the target is composed of any multiple parts, that could be rotating or moving independently from the bulk. For example, in the case of a vehicle, the rotating elements can be the wheels; in the case of a moving person, arms or legs can be the moving elements [
13]. These movements produce another Doppler effect called micro-Doppler and it is possible to exploit this effect to identify the target signature, or to measure other parameters [
14,
15]. By extracting the micro-Doppler information from a Radar signal, it is possible to extend the application field of such devices and use them to detect small vibrations [
16,
17]. In fact, the vibration of the target generates a phase modulation in the received Radar signal, and by applying specific algorithms, it is possible to extract the phase information [
18,
19]. To explain how the micro-Doppler appears in the signal generated by a vibrating target, it is possible to resort to the discussion and the Radar model presented in [
20,
21]. The latter is shown in
Figure 4.
It is important to understand how in general the micro-Doppler effect works, and its mathematical model can be derived from the classical Doppler formulation. The target located in position P can be vibrating: in this case, its movement can be not only along the radial axis of the Radar system. The Radar can detect vibrations that are along a radial direction so, for the sake of simplicity, we suppose that the target vibrates in this direction. It is possible to identify the movement of the target by using two parameters: the main vibration frequency
, and the displacement
. In general, the frequency is not a single tone but, for the time being, it is possible to use a simplified model. Under these assumptions, it is possible to represent the vibration model of the target as:
where
and
are taken equal to zero to simplify the model. These angles represent, respectively, the elevation angle of the Radar system with respect to the plane (U,V), and
is the radial direction of the displacement. If we denote by
the distance between the Radar and the target, the range distance can vary according to the law
. At this point, the received signal becomes:
where
is the backscattering coefficient,
is the carrier frequency and
is the wavelength. As defined above,
is the displacement of the target so it is possible to substitute these terms inside Equation (
11), and the result is a new formulation of
:
The equation is composed by two terms, the former is related to the main distance of the target
, the latter is related to the vibrational movement of the target. It is now easy to extract the phase of this signal and evaluate the micro-Doppler part of the total Doppler effect. By indicating the quantity
with
, it is possible to re-write the micro-Doppler expression as:
As specified above, this model doesn’t take into account the direction of the vibrations. In a more general model,
and
are not zero and the equation must include also these terms. But for the aims of this work it is enough to understand the principle of the vibration analysis performed with a Radar system. At this point it is possible also to understand how the wavelength plays a key role in the detection of small vibrations. This parameter identifies the vibration resolution capability of the system: the higher the carrier frequency, the better the resolution. For example, by using a mmWave Radar it is possible to detect vibrations with a displacement in the order of microns. Another remarkable feature of this technique is the use of MIMO: thanks to the angular detection capability, the Radar system can simultaneously detect many targets, so it is possible to measure the vibration of any object inside the Radar scene. This is not possible when using a not MIMO radar and the vibrations are summed together for a certain direction. In
Section 2, the algorithm to extract the vibration by using an automotive radar is illustrated.
1.2. Related Work
The usage of a Radar system for detecting small vibrations is possible with different Radar technologies. As described above, the micro-Doppler effect is the same in all Radar systems, but the signal processing techniques to extract the information on it can be different.
In an FMCW Radar, the transmitted signal is a chirp, so the value of
changes along the time. In this modulation scheme, the micro-Doppler effect is extracted from the Beat signal, as previosuly shown, and in [
22,
23] different approaches are proposed. The detection of an object vibration is possible not only with a terrestrial Radar system, but also with aerospace-born Radars. In [
24,
25], different techniques using SAR are illustrated. In this work, the focus is on automotive Radars, so the discussion will be limited to this type of sensors.
Exploiting the information about the vibration-related micro-Doppler in a Radar system can extend the range of its possible applications. There are many examples of the application of these sensors, not only for position detection but also for medical or industrial purposes. It is possible, for example, to detect the vital parameters of several patients inside a clinical setting [
26]. The human heart beat can be detected because the heart can be seen as a vibrating object that produces a micro-Doppler signature in the Radar echo. Respiration as well, even if with a simpler detection methodology, produces the same effect and can be detected through micro-Doppler [
27,
28,
29]. The use of a Radar for such purposes allows to implement a contactless measurement technique, which can be very powerful when the patients’ conditions are not compatible with the application of contact sensors.
The same principle can be also applied to monitor the structural health of buildings or bridges [
30,
31,
32]. Other industrial applications include the detection of water levels inside a tank [
33], or the estimation of tyre wear [
34].
The transmitted signal wavelength plays a key role in the Radar sensor ability to detect small vibrations, and determines its vibrational resolution [
35]. Radars operating at frequencies up to 60 GHz and beyond are classified as mmWave on behalf of the wavelength of the emitted signal. Such a range of wavelength values enables sensors to detect a vibration in the range of hundreds of microns, which is a great result, considering the relatively low cost of the device. Moreover, this technique allows for a high sampling rate, that makes it possible to analyze a wide spectrum of vibrational frequencies, thus making Radar devices even more versatile. Comparing, for example, the results of [
36] with [
37], it is possible to assert that using a higher frequency makes it possible to detect smaller vibrations. This is possible also with a lower frequency, but the system will be more complex and more expensive. Thanks to the growth of the automotive market, driving the manufacturers of these devices, automotive Radar sensors are easily available for this type of applications, and, as described above, these Radars work with FMCW modulation. Such a modulation has an advantage against the CW technique: if many targets are present in the measurement area, the CW technique does not make it possible to discriminate them along the range, and the detected vibrational signal will be not accurate. CW Radars are not able to detect multiple target vibrations and they need a more cleared measurement area. For this reason, CW Radars are well suited for the detection of vital signs [
38,
39], but for more general-purpose applications, FMCW Radars provide better performances.
In this work we aim to evaluate the accuracy attainable from an FMCW Radar sensor, in terms of vibrational analysis in a real scenario, in which measurements are carried out inside a mechanical measurements laboratory at Università Politecnica delle Marche. The paper is organized as follows.
Section 2 presents the materials and methods used in the evaluation of the Radar sensor performance and its comparison to a reference laser vibrometer.
Section 3 describes the experiments performed, the results of which are discussed in
Section 4. Finally,
Section 5 concludes the paper.
3. Experimental Tests
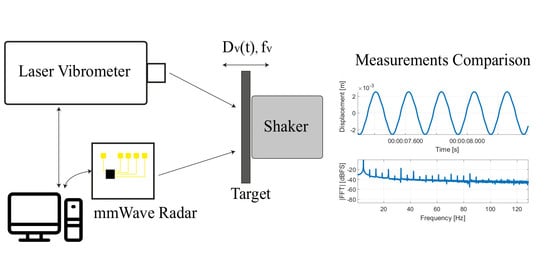
The area chosen for the measurements is a mechanical measurement laboratory. Inside this area, not only the measurement setup is present, but also other instruments and objects. This means that the area is not clean, but suitable to reproduce a generic environment where many objects can be present, not only the chosen target. The measurement setup includes a signal generator, a mechanical shaker, an oscillating panel (the target), and a laser vibrometer. The dimension of the panel is 46 × 34.5 cm and is made with a sandwich in fiberglass and the core is in polyurethane foam. The facing surface in the direction of radar and laser vibrometer is coated with aluminum tape thick of 0.5 mm. The generator is used to generate a sinusoidal signal with given stable amplitude and frequency. Signal’s parameters are varied throughout the tests. The generator is connected both to an ADC (part of the laser vibrometer system), and to a mechanical shaker. The latter is bounded to an aluminium-coated panel which is the oscillating target in our setup. This setup is shown in
Figure 9. Once the position of the target is chosen, the map in
Figure 8 shows the angular-range information in terms of FFT bins, not the converted Range-Angle axis. The target used stands along with the angular bin no. 1 and the range bin no. 46. As it is also evident, the target structure stands along with three range bins, but the correct one is only the first, which gives the position of the vibrating panel.
In order to avoid the Radar to receive spurious reflections from the shaker support and the floor, a set of microwave absorbers have been placed on the measurement field. As mentioned above, each element that stands inside a “pixel” contributes to the beat signal, so even to the extracted vibration. For example, if we don’t exclude the support of the panel, the algorithm will also detect its vibration.
Radar and laser Vibrometer are 3.013 m far from the target and are operated simultaneously. The distance value is the range measure of the Radar. Such a distance value is taken from the Radar detection and the error is the resolution range. Both the measurement systems are aiming at the shaking panel. The laser vibrometer sight of the target is greatly improved by using the laser spot as a reference. On the other hand, the Radar aiming is obtained by orientating the PCB so that the transmitter’s antenna boresight axis is lined-up with the center of the shaking panel. Two measurement campaigns have been carried out. In the former, a setup is used like the one shown in
Figure 9. In the latter, the microwave absorbers are removed and the position of some objects in the Radar field of view is changed, in order to verify the repeatability of the measurement results, and their reliability. During each measurement campaign the signal generator’s frequency and amplitude are chosen within a set of possible values, thus changing the target’s shaking frequency and displacement accordingly. In
Table 3 all these values are reported: they are chosen to produce vibration with unknown amplitude and even non-integer value of their frequency.
Following the system setup, measurements with both instruments used at the same time are performed, in order to determine the target vibration frequency and displacement. Each measurement lasts for 50 seconds. The Radar sensor’s signals are collected and saved on a storage memory, to be processed off-line. Matlab processing will extract frequency and displacement magnitude versus time. A sample result is given in
Figure 10. The number of samples collected by the Radar system is different from the laser vibrometer. For the former device, the number of samples depends on the number of transmitted measurement chirps (in this case, 51,200); for the latter, the number of samples depends on the configuration (4096). The result is evident in the harmonic analysis, where a different frequency resolution is obtained. The sampling frequency of the vibration for the Radar system is 1024 Hz, and it is 1280 Hz for the laser vibrometer. So, the frequency resolution is 0.02 Hz and 0.3125 Hz, respectively. This must be taken into account during the analysis of the results.
To evaluate the Radar sensor performances in measuring the target displacement, the reference laser vibrometer is used, that can determine the target shaking displacement in real-time. The target shaking frequency as measured by the Radar equipment is directly compared with the signal generator displayed value. In
Figure 11, an example of the vibrometer console output, used for the laser vibrometer measurement, is provided. The values used in experimental evaluation are taken from such a console.
For each couple of frequency and voltage settings, ten measurements are repeated in the first setup, and two in the second one. For each signal, the value of the positive relative maxima was calculated; from the average of these values, it is possible to obtain the average measure of the target displacement. This is possible because the signal generator doesn’t change the generated signal along the time, so it is possible to assert that the movement of the target remains the same during all the fifty seconds of the measurement.
4. Results
In
Table 4 and
Table 5 the average values and standard deviations of the measurement data obtained from the vibrometer (
) and from the Radar sensor (
and
, as a result of signal processing) are reported.
Starting from the frequency results, these are the same at all voltage values, and for this reason
Table 4 reports one value for each frequency. The laser vibrometer and the Radar system have a different resolution in frequency, but anyway it is possible to state that the Radar system produces very similar results to the vibrometer.
The results obtained from the second setup are the same as the first one. So, the effect of other objects located inside the scene and of the ground do not degrade too much the attained measurements.
Table 5 reports the result for the detected displacement: even in this case, for the first and second setup, similar results are obtained so in the table only the former are presented.
In the second measurement setup similar results were btained, either for displacement and frequency. By the analysis of the data, it is possible to assess that the Radar system gives stable measurement results, with a resolution of 100 m.
The Radar used is a MIMO device, so it is possible to identify the position of the target not only in range but also in angle. This is helpful to resolve near targets and reduce the interference, especially in a radar-noisy environment. With respect to [
19], the signal processing is similar but in this case the Radar is not able to discriminate targets at the same distance. This means having a degradation of the measurements. For analyzing this degradation we compare the laser vibrometer measurement with the Radar one, using the MIMO identification or not. The second Radar technique is called in this section “Radar Linear”. With the setup used, the position of the target is “46” along the range FFT axis and “1” along the angular FFT axis. All the results presented are obtained from these values. In the case of the linear algorithm, only the range is present, so the identification of the position is the range bin (46).
Figure 12 depicts the result of applying MIMO identification or not.
Observing
Figure 12, it is possible to see how the exploitation of the MIMO capability improves significantly the quality of the measurements. The signal generated by the generator is sinusoidal, and the most similar signal is obtained when applying MIMO. Without using MIMO, the signal is still periodic but with noticeably high amplitude and phase distortion. In a measurement area where multiple objects are present and not only the designated target, it is very difficult to obtain a clean measurement of displacement and vibration frequency. In some cases, the measured displacement is completely wrong and, following the model given in Equation (
23), this is the result of summing together all the contributions coming from many targets at the same distance.
Inside Equation (
23), the beat signal is the sum of multiple terms. With the application of the MIMO transmission it is possible to discriminate each component not only in range but also in angle. If the angular discrimination is not considered, the equation becomes:
Equation (
24) considers all the angular components of the signal; conversely, inside Equation (
23) the angular terms are not summed together so this improves the performances of the detection. The result is a beamforming of the receiver antenna diagram, which allows to separate the elements along the angle.
Another type of analysis can be focused on the harmonics of the detected vibrations. The signals’ spectra are reported in
Figure 13.
Comparing the results in terms of the detected vibration frequency, the laser vibrometer and the Radar system with MIMO technique achieve similar results. The scale of the spectral amplitudes shown in
Figure 13 is in dB full scale [dBFS] for a better comparison. Both the systems can detect the main frequency of vibration and the other multiple harmonics with a decreasing trend. In the case of the linear Radar measurement, the detected maximum value is not always correct: in the example shown, the main frequency is around 32 Hz when the vibration is set to 4.7 Hz. The application of the algorithm with the range detection only can reach good performance when the measurement area is clear from other objects, and there is only the desired target inside the chosen range bin.
5. Conclusions
In this work, a 77 GHz FMCW automotive Radar is used for detecting small vibrations of a target, performing frequency and displacement measurements in comparison to a laser vibrometer taken as the reference instrument. Two techniques for the Radar are analyzed, one exploiting the MIMO capability, and one without it.
From the results, it is possible to see how the Radar can detect with good performance the vibration frequency and the displacement of the target, the latter one with a resolution of hundreds of microns. Moreover, when the microwave absorbers are removed from the measurement scenario, thus increasing Radar noise and clutter, the performances remain the same. Comparing all the measurements with those provided by the vibrometer, a mean arithmetic value of
is calculated and results of 0.15 mm. This is bigger than the error stated in [
47], but the setup used in this work is more realistic and the target is located at a greater distance from the sensor.
The comparison between the two Radar techniques shows how the correct detection of the position of the target is important to improve the performance of the Radar-based system. The angular detection can somehow filter out the undesired targets, and this allows to obtain a better quality Radar measurement.

 ,
, 


