Abstract
Woody plant encroachment into grasslands ecosystems causes significantly ecological destruction and economic losses. Effective and efficient management largely benefits from accurate and timely detection of encroaching species at an early development stage. Recent advances in unmanned aircraft systems (UAS) enabled easier access to ultra-high spatial resolution images at a centimeter level, together with the latest machine learning based image segmentation algorithms, making it possible to detect small-sized individuals of target species at early development stage and identify them when mixed with other species. However, few studies have investigated the optimal practical spatial resolution of early encroaching species detection. Hence, we investigated the performance of four popular semantic segmentation algorithms (decision tree, DT; random forest, RF; AlexNet; and ResNet) on a multi-species forest classification case with UAS-collected RGB images in original and down-sampled coarser spatial resolutions. The objective of this study was to explore the optimal segmentation algorithm and spatial resolution for eastern redcedar (Juniperus virginiana, ERC) early detection and its classification within a multi-species forest context. To be specific, firstly, we implemented and compared the performance of the four semantic segmentation algorithms with images in the original spatial resolution (0.694 cm). The highest overall accuracy was 0.918 achieved by ResNet with a mean interaction over union at 85.0%. Secondly, we evaluated the performance of ResNet algorithm with images in down-sampled spatial resolutions (1 cm to 5 cm with 0.5 cm interval). When applied on the down-sampled images, ERC segmentation performance decreased with decreasing spatial resolution, especially for those images coarser than 3 cm spatial resolution. The UAS together with the state-of-the-art semantic segmentation algorithms provides a promising tool for early-stage detection and localization of ERC and the development of effective management strategies for mixed-species forest management.
1. Introduction
Woody plant encroachment affects ecological stability and causes significant economic loss worldwide [1,2,3], especially in semi-arid and sub-humid grasslands and savannas [4,5]. As the encroachment progresses, species composition and community, and ecosystem services including biodiversity, biogeochemical and hydrological cycles can shift at the local and regional scales [6,7,8]. Encroaching species are currently being managed using mechanical (e.g., prescribed fire, grazing and felling) or chemical approaches (e.g., herbicide) [9,10,11], which are costly and sometimes lead to severe ecological destructions [11]. In the Great Plains of the U.S., eastern redcedar (Juniperus virginiana, ERC) is one of the most aggressive species that encroaching the grasslands [7,12,13,14,15,16,17,18,19]. Managing ERC in encroached sites can become costly over time with an increase in density and size of the species, which lead to ecological and economic consequences (e.g., changing ecosystem functioning and reducing livestock production) [20]. Therefore, early detection and control of woody plant encroachment are critical for ecological and cost-effective management practices.
Remote sensing has been used in forest classification, species distribution mapping and invasive species detection for several years [5,17,21,22,23,24,25,26,27,28,29,30]. With the development of remote sensing technologies, satellites can now provide images in a spatial resolution as high as a few decimeters, e.g., WorldView-4 provides images in 0.31 m spatial resolution. Images from manned aircrafts with high spatial resolution are also readily available from public and commercial sources, e.g., free images in 0.6 m spatial resolution by the national agriculture imagery program (NAIP). However, it is difficult to use these images with coarse spatial resolution for detecting seedlings or small-sized plants, and plants mixing with other species. If a small ERC had a canopy diameter around 1 m, it would only show as 3 × 3 pixels in a remote sensing image with a spatial resolution at 30 cm. For encroaching plants mixing with other species, at the boundary of the plants, there are many mixed pixels that cover both encroaching plants and the other species. These challenge accurate species detection and classification, as the texture features are missing with a very limited amount of pixel numbers, not to mention the issue of mixed pixels on the edges of a target. Thus, the accurate early detection of ERC and its detection within a multi-species forest context will be greatly beneficial from remote sensing images in a centimeter level spatial resolution. As satellite and manned aircraft remote sensing technologies continue to advance rapidly, unmanned aircraft systems (UAS) emerge as a new player in this arena and provides us a handy platform to acquire imagery in an ultra-high spatial resolution usually at or higher than the centimeter level. Though UAS have their own limitations such as the short flight endurance (up to five hours for consumer grade fixed-wing UAS with battery power [31]), they offer an opportunity to test the potential of future technologies that the other platforms are quickly evolving into.
Various machine learning algorithms have been applied for vegetation mapping in remote sensing. Among them, object-based classification is a classical and well-recognized approach to classify different vegetation covers with the advantages of quick and accurate classification based on an object’s spectral, textural, and structural features and removing the salt-and-pepper effect compared with other classification approaches that are based purely on single pixels [32]. With the advent of ultra-high resolution aerial imagery and high performance computing systems, convolutional neural network (CNN) based deep learning algorithms have started to be investigated more and more in remote sensing based vegetation mapping [22]. Studies can be found in exploring applications of various CNN-based pixelwise classification or object detection models, including forest mapping [33,34,35], dynamic change monitoring [36], and invasive species encroachment assessment [37]. CNN models for region-based classifications can be trained with information included in rectangular bounding boxes of the whole individual objects [22]. However, delineating the targeted plant from the background and monitoring its progress and increase in size over time is one of the key topicsin remote sensing for woody plant encroachment. In addition, plants are irregularly shaped and in various sizes based on stage of growth. In these cases, CNN-based pixelwise classification models showed advantages with input patches of the same image size (instead of plant size) and class name labelled in the center pixel of the patch. That means, with the limited samples of individual object, the vegetation mapping or classification task can be accomplished using CNN-based pixelwise models with less raw images in higher spatial resolution.
UAS imagery in a centimeter level spatial resolution has shown great potential of precisely detecting the location and estimating the size of vegetation plants [28,38,39,40] as well as differentiating among species, which can be challenging for imagery in lower spatial resolutions. This benefits from the detailed spectral or morphological information offered by the images which also enables the utilization of various classical and state-of-the-art machine learning algorithms. Random forest, maximum likelihood classifier, and support vector machine techniques are commonly used machine learning classifiers in vegetation classification [40,41,42]. Besides the classical machine learning algorithms, rich information included in the ultra-high resolution images can be well utilized by the CNN-based deep learning models, with which a series of features are automatically extracted using the convolutional layers [43]. Various studies used machine learning-based [39,40] and CNN-based [44,45] classification methods for encroaching species mapping. The CNN-based classification methods gained promising results for encroaching species mapping [46]. However, encroaching species with small plant size and mixed with other species at early encroaching stages make the classification task more challenging. The promising result and the challenging environmental context inspired us to investigate the application of the machine or deep learning-based algorithms on an encroaching species classification in a multi-species terrestrial ecosystem.
There were two major research questions we were trying to answer in this study: first, what are the performances of those popular classification algorithms on ERC segmentation within a multi-species forest context? Second, what is the optimum spatial resolution of the UAS imagery to have a trade-off between the segmentation performance and spatial coverage? Therefore, the objective of this study was to evaluate the performance of a few popular semantic segmentation algorithms and an optimal spatial resolution for ERC early detection and its classification within a multi-species forest context. Specifically, we evaluated the segmentation performance (1) of four popular semantic segmentation algorithms with UAS images in their original spatial resolution; and (2) at different spatial resolutions by down-sampling the UAS images to a series of coarse spatial resolutions. Recommendations from this study can be helpful in the monitoring of encroaching species dynamics and the decision making of management strategies in grasslands ecosystems.
2. Materials and Methods
2.1. Study Area and Data Acquisition System
UAS images were collected at a University of Nebraska-Lincoln rangeland property (41°05′05.2″N, 100°45′53.7″W) located in North Platte, Nebraska (Figure 1a,b). The total study area was 17,673 m2 (4.37 acres). There were five tree species: eastern redcedar (Juniperus virginiana), ponderosa pine (Pinus ponderosa), Scots pine (Pinus sylvestris), green ash (Fraxinus pennsylvanica), and hackberry (Celtis occidentalis). The five types of tree species were at different stages from small sized seedlings to their full, mature size. To differentiate ERC with pines especially at early stage, the five tree species were grouped into three classes in our study (Figure 2): the ERC class which was the species of interest, the pine class including ponderous pine and Scots pine, and the defoliation class including green ash and hackberry. A fourth class was also created, namely others class, including grass, bare soil, and snags (felled trees).
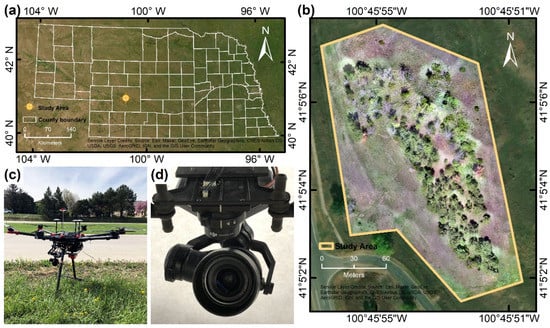
Figure 1.
The study area located in North Platte, Nebraska (a); an overview of the study area with the orthomosaic (b); the UAS used in this study (c); and the RGB camera mounted on the UAS (d).
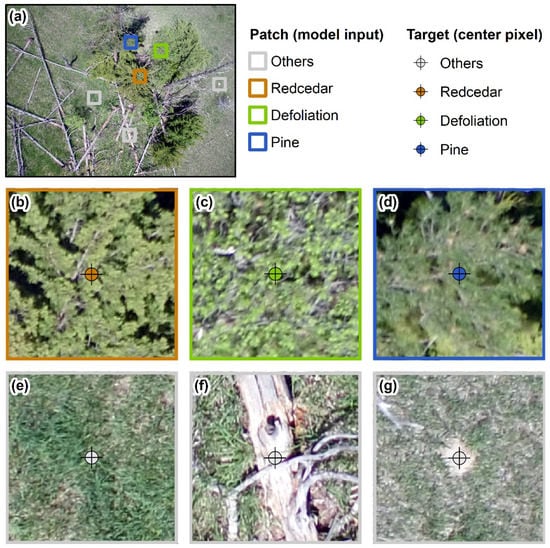
Figure 2.
Example image patches of the four classes in this study: (a) is an example raw image collected from the UAS; (b) is a sample patch of redcedar class; (c) is a sample patch of defoliation class; (d) is a sample patch of pine class; and (e–g) are example patches of others class. Each patch was the input of the AlexNet and ResNet in this study with size of 227 × 227 × 3 or 224 × 224 × 3. The target of the models was the class for the center pixel.
A rotary-wing UAS (Matrice 600 Pro, DJI, Shenzhen, China) with an RGB camera (Zenmuse X5R, DJI, Shenzhen, China) (Figure 1c,d) was flown over the study area at an altitude of 30.5 meters above the ground level on 18 May 2019 with the front and side overlaps of 90% and 85%. RGB imaging was selected in this study considering its popularity and low-cost in UAS applications. Two hundred and fifty-three RGB images were collected in total over the study area, each with a size of 4608 × 3456 pixels. Six ground control points were distributed across the study area and their geolocations were surveyed with a survey-grade RTK GNSS system. The images were stitched into an orthomosaic in an original spatial resolution of 0.694 cm using Pix4Dmapper software (PIX4D, Lausanne, Switzerland). Geometric correction was performed during the processing by correcting the geolocation of the orthomosaic with those surveyed by the RTK GNSS system.
2.2. Data Pre-Processing
Raw images collected with the UAS and four cropped segments from the orthomosaic were used to randomly sample patches as input for machine learning algorithms. Data balance was considered among the four classes (redcedar, pine, defoliation, and others) when we did the random sampling process (i.e., equal samples for each class). The purpose of having both the orthomosaic cropped segments and raw images was to include various angles of view for the same objects serving as a natural augmentation of the training dataset. In total 72 full-size images (3456 × 4608 pixels) were prepared for patch sampling, including 68 raw images and 4 cropped segments from the orthomosaic. The spatial resolution was 0.694 cm for the orthomosaic cropped segments, which varied slightly for the raw images. Image patches sampled from 65 out of the 72 images were used as the training set, and the patches sampled from the remaining seven images were used as a testing set. There were patches generated from both raw images and orthomosaic included in both training and testing sets. This resulted in 40,000 training patches, 8000 patches for validation, and 8000 testing patches for both AlexNet and ResNet.
The boundary of each tree was manually delineated as polygon shapefile in ArcGIS (ESRI, Redlands, CA, USA). The shapefiles were converted to the raster type with the targeted spatial resolution. To evaluate the model performance on images with coarse spatial resolutions, raw images and the cropped segments were downsampled using bilinear interpolation from an original spatial resolution of 0.694 cm to a series of resolutions ranging from 1 cm to 5 cm with a 0.5 cm interval.
2.3. Semantic Segmentation Algorithms and Hyperparameter Fine-Tuning
Semantic segmentation, or CNN-based pixelwise classification in this study, was a technique to assign a class label to each pixel with contextual information in an image [47,48,49]. The CNN-based pixelwise classification model in this study includes information within a patch from the center pixel that we are interested in [49,50,51]. It provided detailed information on the location and size of the targets which were useful in mapping forest species and monitoring their dynamic. Four widely used classical and state-of-the-art semantic segmentation algorithms were evaluated in this study: decision tree (DT), random forest (RF), AlexNet, and ResNet.
Decision tree and random forest algorithms were implemented with Python 3.7 in Spyder IDE with sklearn library on a desktop computer. This computer has a CPU of Intel® Core™ i9-7980XE @2.60GHz, a GPU of NVIDIA GeForce RTX 2080 Ti with a memory of 42.9 GB (11.0 GB dedicated GPU memory and 31.9 GB shared GPU memory), and a RAM of 64 GB. The AlexNet and ResNet algorithms were implemented with keras and tensorflow libraries at a performance computing facility (Holland Computing Center) at the University of Nebraska to speed up the training process with parallel computing. The configurations of the HCC cluster used in this study were: RAM of 32 GB, 2 GPUs of NIVIDIA Tesla V100 with 32 GB memory, and 16 tasks per submitted node.
2.3.1. Decision Tree and Random Forest
Decision tree classified each sample as one class using decision functions [52]. It can be illustrated by a tree-like diagram consisting of decision nodes, chance nodes and terminal nodes [23]. Random forest used many small decision trees as base level classifiers [24,53]. Each tree was trained on a sub-dataset of samples randomly selected from the training dataset. For an individual training sample, a class was assigned with majority votes among all the decision trees [54].
The output of the decision tree and random forest algorithms was the predicted class label of each targeted pixel, i.e., the ERC class, the pine class, the defoliation class, or the others class. The input variables of the algorithms were features extracted from the pixel and its neighbors. In this study, we selected ten input variables: digital numbers of red, green, and blue bands, averaged digital numbers of a 3 × 3 neighborhood centered the target pixel in each of the three bands, and four features (contrast, homogeneity, energy, and correlation) extracted from the gray level co-occurrence matrix (GLCM) calculated on a 227 × 227 neighborhood [55,56].
2.3.2. Convolutional Neural Networks
AlexNet and ResNet algorithms were selected as the two CNN algorithms comparing with the two classic machine learning algorithms. CNN had been proved to be successful in semantic segmentations [26,27,43,44,57]. Comparing with the two classic machine learning algorithms where manually extracting features from an image, CNN algorithms automatically extracted, and selected features with various filters and techniques during the training process which tends to be much more effective than many other algorithms [43]. The AlexNet used in this study reserved its original architecture as shown in Table 1 [58]. Relu activation method was used for each convolutional layer with l2 regularizer and dense layer, and softmax activation method was used for the last dense layer. A moderate dropout rate of 0.5 was adopted for the first two fully connected layers in AlexNet to regularize the model and prevent overfitting. Adam optimizer was used with a learning rate of 0.001. ResNet used residual blocks to make shortcut connections between convolutional layers (Table 2) [59], which offers a higher classification performance without a significant increase of computational burden [60]. Relu activation and batch normalization methods were used for each convolutional layer, and softmax activation method was used for the last dense layer. Adam optimizer was used with learning rate of 0.001. The input of the AlexNet and ResNet algorithms was RGB image patches in the size of 227 × 227 pixels for the AlexNet and 224 × 224 pixels for the ResNet. The output of these two algorithms is the class of the pixel at the center of each image patch. Hence, though we used “pixelwise classification”, the classifications were really made not only based on single pixels but also the surrounding pixels which were the patches in our case.

Table 1.
The architecture of AlexNet used in this study with an input dimension of 227 × 227 × 3.
Table 2.
The architecture of ResNet-50 used in this study with an input dimension of 224 × 224 × 3.
2.3.3. Model Hyperparameters Fine-Tuning
The four algorithms were fine-tuned with different hyperparameter settings to achieve the highest performance for our dataset and application. Two hyperparameters were fine-tuned in training the decision tree: the minimum number of samples required to split an internal node (ranging from 2 to 50 with an interval of 2), and the minimum number of samples required to be at a leaf node (ranging from 1 to 10 with an interval of 1). Similarly, the hyperparameters fine-tuned for random forest algorithm were the maximum number of depths in each decision tree (ranging from 10 to 50 with an interval of 2) and the number of trees in the forest (ranging from 10 to 100 with an interval of 5). Other hyperparameters of decision tree and random forest keep the default value of decision tree classifier and random forest classifier from the sklearn library in Python 3.7. Three different batch sizes of 4, 32, and 128 were tested for the two CNN algorithms with 100 epochs for each algorithm [61]. Other hyperparameters (e.g., activation, regularizer) were fixed with the default value of the keras library in Python 3.7.
2.4. Semantic Segmentation Performance Evaluation
Semantic segmentation was performed using the well-trained algorithm with the same input size as required by the algorithm (i.e., 227 × 227 × 3 for AlexNet and 224 × 224 × 3 for ResNet). The performance was evaluated with different datasets: algorithm testing performance was evaluated with the testing dataset, research area segmentation visualization was performed with input pixels of every 50 columns and every 50 rows, testing performance of different spatial resolutions, and individual ERCs were evaluated with all pixels in the image. Overall accuracy (OA) and intersection over union (IoU) were used to evaluate the performance of the four semantic segmentation models. The OA (Equation (1)) was the total number of true positives divided by the number of all samples [62,63]. The higher OA value, the more correctly classified samples among the entire samples among the dataset. IoU (Equation (2)) was a parameter calculated by the number of samples intersection divided by that of union [64], or the ratio between the number of true positive and the sum of the number of true positives, false positives, false negatives [65]. The higher IoU of ith class (), the fewer samples with wrong predictions or misclassified of ith class.
where N was the number of all samples, n was the number of classes, , , were the number of true positive, false positive, and false negative samples for ith class.
In addition, we reported precision, recall, and F1 score of each algorithm. Precision was the fraction of true positive sample number among all true positive and false positive sample number (Equation (3)). Recall was the fraction of true positive sample number among all true positive and false negative sample number (Equation (4)). F1 score considered both the precision and the recall to measure an overall performance for different classes (Equation (5)). Precision and recall indicated the ratios of correctly classified sample numbers among the sample number of predicted, and ground truth ith class, respectively. F1 score was a weighted average of precision and recall.
3. Results
3.1. Semantic Segmentation Performance of Individual Algorithms with Images in Original Spatial Resolution
Semantic segmentation performance of the four popular algorithms (i.e., decision tree, random forest, AlexNet, and ResNet) was evaluated with UAS images in their original spatial resolution using the same training and testing datasets to gain fair comparison. Among the four semantic segmentation algorithms, ResNet showed the best performance (Table 3) after hyperparameters fine-tuning. ResNet with a batch size of 32 had the highest OA (0.918) and mIoU (85.0%) on the multi-species classification with the images in original spatial resolution (0.694 cm). In general, among the four algorithms, CNNs (i.e., AlexNet and ResNet) gained higher performance than classical machine learning algorithms (i.e., decision tree and random forest) for this case study with complex multi-species forest environment settings. The decision tree had the lowest OA (0.610) and mIoU (44.7%). Random forest, with an OA of 0.666 and a mIoU of 50.7%, performed slightly better than the decision tree. AlexNet resulted in an OA of 0.878 and a mIoU of 78.2%, while ResNet resulted in an OA of 0.918 and a mIoU of 85.0%.
Table 3.
Overall performance of the four semantic segmentation algorithms on multi-species forest classification from UAS images in their original spatial resolution (0.694 cm).
AlexNet and ResNet gained highest OA of 0.878 and 0.918, mIoU of 78.2% and 85.0%, respectively. The performances of AlexNet and ResNet with different batch sizes were evaluated with x axis of performance name and y axis of performance value (Figure 3). In general, OA and mIoU decreased with an increasing number of batch size for the two algorithms. AlexNet algorithms’ performance dropped more quickly than those of ResNet. Especially for large batch size (i.e., 128), the OA of ResNet was still greater than 0.9 (i.e., 0.903), while that of AlexNet was 0.828. From the perspective of batch size, ResNet was robust for this multi-species forest classification problem. For IoUs of the four classes, the pine class gained the highest IoU for almost every algorithm (except AlexNet with a batch size of 32). The defoliation class gained lowest IoU for almost every algorithm (except AlexNet with a batch size of 128). In other words, the pine class was the one that had the highest accuracy to be segmented, followed by redcedar and others classes, and the defoliation class was the one with the lowest accuracy. There was not a significant impact on the hyperparameter fine-tuning for decision tree and random forest algorithms though.
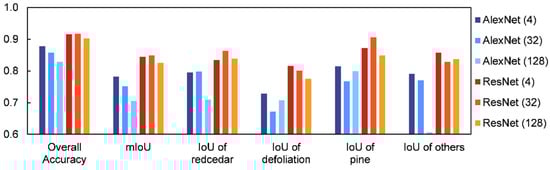
Figure 3.
AlexNet and ResNet algorithms’ performances with different numbers of batch size (i.e., 4, 32, 128). ResNet algorithms gained higher performance than AlexNet, while algorithms with small batch size gained higher performance than those with large batch size. Pine class gained the highest IoU, while defoliation class gained lowest IoU.
3.2. Semantic Segmentation Performance with Images in Down-Sampled Spatial Resolutions
The segmentation and classification performance with images in down-sampled spatial resolutions were investigated with the algorithm that had the best performance in the previous section, i.e., the ResNet. Although ResNet with a batch size of 32 showed slightly higher accuracies than those with the batch sizes of 4 and 128 (Figure 3), the batch size 4 was used in this section to investigate the performance of down-sampled spatial resolution to save training time. Figure 4 showed the OA, precision, recall, and F1 score with the UAS images downsampled to a series of coarse spatial resolutions using the same number of samples to train, validate and test the model. The OA decreased slowly as the spatial resolution decreased from original 0.694 cm to 4 cm, then started to decrease significantly (Figure 4a). The precision, recall, and F1-score had a similar trend and a threshold between 3 and 4 cm (Figure 4b–d).
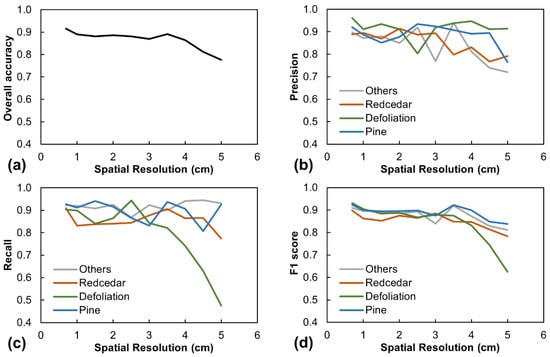
Figure 4.
OA (a), precision (b), recall (c), and F1 score (d) of ResNet algorithm with UAS images in various down-sampled spatial resolutions. All showed a decrease trend with decreasing spatial resolution and most of the performances got quick decrease with images coarser than 4 cm. For ERC segmentation from multi-species forest, 3 cm was a recommended spatial resolution due to the quick decrease of precision with images coarser than 3 cm.
The segmentation performance with UAS images in various down-sampled spatial resolutions for different classes was presented with precision, recall, and F1 score (Figure 4). In general, precision ranged from 0.720 to 0.961 for the four classes with UAS images in various spatial resolutions. For individual class, precision for the others class decreased, and that of the redcedar class had an obvious decrease. The decreasing trend meant more samples of defoliation or pine classes were predicted as others or redcedar class in images of coarser spatial resolutions. The precision of defoliation and pine classes had no obvious increasing or decreasing trend with UAS images in various spatial resolutions. In general, recall ranged from 0.476 to 0.945 for the four classes. For individual class, recall of defoliation class decreased quickly, which meant more samples of defoliation class were predicted as other classes with coarser spatial resolution images. Others class had the highest recall value among the four classes with images in nearly all spatial resolutions. That meant the number of others class samples predicting as other classes were minimum among the four classes. Recall of redcedar and pine classes had the moderate value among the four classes.
In general, F1 score ranged from 0.626 to 0.931 with a decreasing trend, especially for those coarser than 4 cm spatial resolution. For individual classes, the decreasing trend of defoliation class was more pronounced than other classes, especially for those images with coarse spatial resolutions. F1 score for redcedar class ranged from 0.783 to 0.899 and exhibited a pattern of “decreasing-increasing-decreasing” with the image resolution becoming coarser. The peak value before decreasing trend is at 3 cm spatial resolution. To obtain a high classification performance for the redcedar class, 3 cm would be an optimum choice for balancing the performance and the spatial resolution. F1 score had similar pattern for others and pine classes with redcedar class, ranged from 0.812 to 0.919 and 0.838 to 0.923, respectively. Among the four classes, the pine class had the highest F1 score, especially for those coarse than 4 cm spatial resolution images.
3.3. Visualizations of the Forest Classification
In this section, three examples of multi-species forest classification results derived from the semantic segmentation model with best performance in this study (ResNet with a batch size of 4) were visualized, (1) the stitched orthomosaic image, (2) two testing images with different spatial resolutions, and (3) test images with a single ERC in each image.
Figure 5 showed the classification result of the stitched orthomosaic processed in its original spatial resolution. All trees were successfully identified though there were errors on the boundaries, especially for those mixed together. ERCs were shown in the brown pixels by which their sizes and locations can be further extracted. Figure 6 showed two testing images processed at their original (ultra-high), 2 cm (medium), and 5 cm (coarse) spatial resolutions. With the coarse spatial resolution images, the algorithm’s prediction performance decreased, with most of the wrong predictions existing in tree boundaries. Nevertheless, regions with different tree species could still be delineated with acceptable accuracy and consistency when compared with the ground truth.
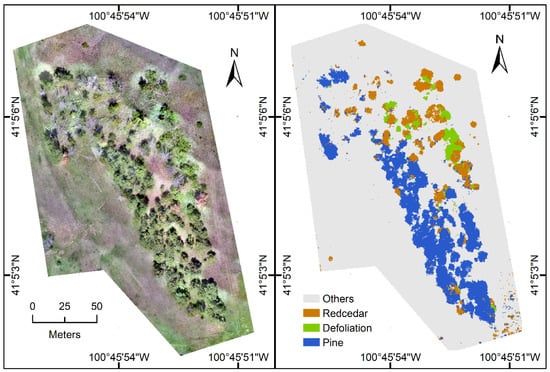
Figure 5.
Visualization of the multi-species forest classification result: orthomosaic of the study area (left) and the classification result using images in 0.694 cm spatial resolution and the well-trained ResNet algorithm (right).
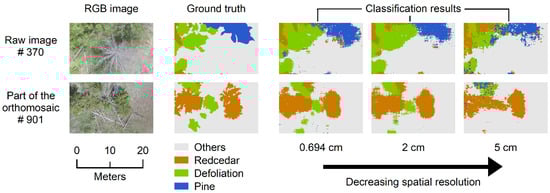
Figure 6.
Visualization of examples of multi-species forest classification results with UAS images in original (0.694 cm) and down-sampled spatial resolutions at 2 cm, and 5 cm. The classification performance reduced as the spatial resolution decreased.
Small ERCs can be segmented with ultra-high spatial resolution images but were difficult to be segmented with coarse spatial resolutions under complex environment settings, especially for those neighbor pixels that looked similar to ERCs. Figure 7 showed four ERCs picking up with partial images from the stitched orthomosaic, and segmentation results predicted by ResNet algorithm with 0.694 cm spatial resolution images were shown in the first two columns of Figure 7. The well-trained model can predict single trees, even those with a diameter of less than one meter. Although there were errors at the boundary of trees, the segmentation results were acceptable with their location, shape, and size reasonably identified. Segmentation results predicted by ResNet in the down-sampled spatial resolution at 5 cm images shown in the last two columns of Figure 7. Small ERCs with a diameter less than 1 m failed to be segmented in the spatial resolution at 5 cm, where all pixels were predicted as others class.
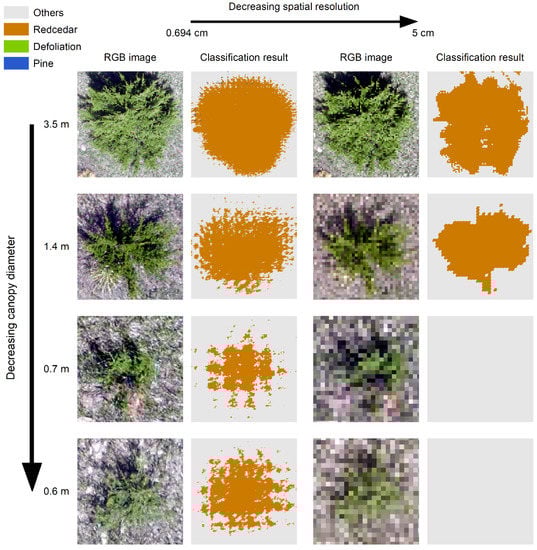
Figure 7.
Classification results of cases for small individual ERCs with the ResNet algorithm and UAS images in their original (0.694 cm) and downsampled (5 cm) spatial resolution. In this study, ERCs with a diameter less than 1 m were able to be accurately classified and delineated in the images with the original resolution but failed to be detected when the spatial resolution decreased to 5 cm.
4. Discussion
4.1. Opportunities and Challenges in ERC Early Detection with High Spatial Resolution Remote Sensing Imagery
ERC encroachment has been caused great ecological and economic issues on the Great Plains [5,30]. With the encroaching of ERC in the grasslands, ecological destruction and land management costs are increasing to remove fast growing ERC from the original ecosystem. An early detection on ERC and a close monitoring of their encroaching and infilling rates can significantly decrease the destruction and costs in ERC management while increasing its management efficiency and success. However, most of the efforts so far on using remote sensing approaches for ERC encroaching and infilling status monitoring are mainly based on imagery from satellite and manned aircraft with a coarse or medium spatial resolution [5,66]. Despite the decent results obtained by many of them over a regional scale, they often excluded or had lower performance at the areas with low canopy covers due to the inherent challenges of detecting low canopy cover with remotely sensed imagery in a low spatial resolution [30]. Basically, with the limited spatial resolution, most of those efforts relied on the relationship established between the ground truth and the remotely sensed spectral reflectance in each band. This type of method is fairly efficient and practical in roughly estimating forest components and encroachment mapping but is not capable enough to identify small tree canopies or the change of infilling rate in time, which are critical in ERC management.
This study used UAS imagery to investigate its capability on ERC early detection and mapping with the hope that the findings of this study can be applied to other types of high spatial resolution remotely sensed imagery. With the rapid advance of the remote sensing technologies, we noticed the trend of convergence for some functions of the various platforms, i.e., the remote sensing satellites, airplanes, and unmanned aircraft systems are evolving to provide us imagery in higher spatial and temporal resolutions and larger spatial coverages at the same time. There are commercial remote sensing satellites that provide meter or sub-meter level imagery (e.g., WorldView, Planet Labs), and commercial off-the-shelf UAS systems that can fly up to five hours (e.g., HSE SP9, Casselberry, FL, USA [31]). We believe it is the right time to study the potentials of high spatial resolution imagery on the management of encroaching tree species.
One of the major issues of forest classification with the high spatial resolution imagery is how to utilize the rich information in the imagery. Besides the spectral features that are typically used, we now have multiple or many pixels in the same area which can provide textural or structural features of the tree canopies. This on one side provides greatly more details for us to differentiate objects, but on the other side makes it a meaningful research topic to see how this information can be utilized to achieve better canopy detection and classification results. The effort of this study demonstrated the performance of the classical machine and deep learning models on effectively utilizing this rich information to accurately classify early stage ERCs and their infilling rates in the multi-species context.
4.2. CNN-Based Models Improve Data Utilization of Ultra-High Spatial Resolution Imagery for Multi-Species Classification
The semantic segmentation or CNN-based pixelwise classification used in this study can not only classify and localize the woody species but also delineate their detailed shape and boundaries. This is especially useful for delineating the boundaries of ERCs and monitoring the progress of their encroaching and infilling rates over time to derive precision and appropriate management strategies.
The ultra-high spatial resolution imagery used in this study enabled a better utilization of CNN-based semantic segmentation models compared with non-CNN-based classification models. CNN-based models were trained with raw images and orthomosaic segments to increase the dataset from multi-view of the objects (i.e., nadir and oblique) [67]. Results showed that the two CNN-based models used in this study, i.e., the AlexNet and ResNet, outperformed the two popular non-CNN based machine-learning models, i.e., the decision tree and random forest (Table 3). A similar finding was reported in previous studies [43]. Rather than inputting into the models with certain pre-extracted image features, CNN-based models automatically extract a large number of spatial features with series of filters in repeated convolutional and pooling layers, which is considered as a primary reason for their superior performance [58,68]. However, such advantages of the CNN-based models may not be fully utilized if the image spatial resolution is relatively coarse, which is the reason why classical single pixel-based classification together with machine learning or deep neural network models are still preferred methods in many applications especially with satellite imagery [69,70]. In addition, CNN-based models gained multiple features from the convolutional layers but required high computational systems and more computational time, which is the reason why classical object-based non-CNN classification is still preferred [70,71]. Although classical object-based classification methods showed potential to classify multiple-species forests with high spatial resolution images [72], they did not gain high accuracy for this case study. This could possibly be due to the high similarity among different classes. Fine-tuning the parameters are needed in future studies. More samples of individual objects are needed to do region-based CNN classification by resizing the single images with irregular shapes and different sizes to the same shape and size as required by the CNN model [49].
Results indicated that the well-trained ResNet algorithm can classify the four classes among the multi-species forest context (Figure 5 and Figure 6). As shown in the figures, most of the trees were classified with the shape and size of the tree with ResNet algorithm. This was consistent with other studies using CNN models and UAS images for forest mapping [73,74]. The promising results indicated that the state-of-the-art CNN models and ultra-high resolution images can be applied for other study topics with the classification purpose. However, there were areas that misclassified even for images with the original spatial resolution, especially for the tree boundary areas. Take Figure 6 image #370, for example, at the boundary of the pine class, there were pixels of pine class that misclassified as ERC class. This phenomenon was because cedar and pine had similar shape and color information from the top view remote sensing images. In addition, at the boundary of the defoliation class, there were pixels of others class that misclassified as defoliation class. This was because of the sparse leaves of defoliation class on 18 May that we collected the image. The background information that below the ERC canopy was trained with the CNNs. To solve those misclassification problems, more images that collected with dense canopy cover or new machine or deep learning algorithms that can be used for encroachment species detection and mapping are rolling out at a fast pace with better accuracy and computational efficiency. The promising results on the ERC classification and delineation in both the early growth-stage singular form and the multi-species context demonstrated the potential of improvements on the encroachment species detection and mapping that can be achieved by the high-resolution aerial imagery and appropriate machine/deep learning algorithms.
4.3. Trade-Off between Spatial Resolution and Coverage for Encroachment Species Detection and Mapping
The goal of our study was to improve the early detection of ERCs when they are in a small canopy size (less than 1 meter diameter was set in this study) and the precise delineation of them in a multi-species context. Theoretically speaking, a canopy of any size can be possibly detected as long as the spatial resolution of the image is high enough; in practice, however, the image resolution is limited to the imaging system and platform. This is the primary reason why most of the studies so far had to exclude the areas with low canopy cover. Hence, the trade-off between spatial resolution and spatial coverage or cost of images always needs to be taken into consideration [75,76]. With the highest performance algorithm in this study (ResNet), we identified a threshold of 3 cm as the lowest image spatial resolution required for a desired multi-species forest classification result using only the RGB imagery. When the resolution of the RGB images used in this study was downsampled to be greater than 3 cm, the precision of ERC delineation in a multispecies context started to decrease significantly (Figure 4b), and the detection of small singular ERCs with a canopy diameter less than 1 meter was not possible (Figure 7). This finding may just hold true for this particular dataset collected with the specific camera and flight configurations and the image segmentation models developed in this study. For example, if other types of imagery are included such as multispectral images with near-infrared bands even at a lower spatial resolution [77], other important information may be given to help differentiate species, then the 3 cm spatial resolution may not be a necessity. Data (image) spatial resolution, modalities, quality, collection timing or season, their processing and analysis methods and algorithms, and the complexity of the interested objects together determine the final classification performance [22,78].
Although higher ERC classification results were reported with CNN-based deep learning there were challenges in applying the CNN algorithm on coarse resolution images in this study. In other words, the advantages of the CNN algorithms could not be well utilized if the image resolution is not high enough. This might be another major reason for the inferior detection and classification performance when the original images were downsampled to 3 to 5 cm resolution (Figure 4, Figure 6 and Figure 7). Use the case of a singular ERC with a diameter of 0.6 m as an example. When the image was downsampled to 5 cm resolution, it showed as a patch about 12 × 12 pixels in the image. This patch was too small compared with the input patch size of ResNet which is 224 × 224 pixels. One potential perspective is how to better adapt and utilize the latest CNN-based deep learning on the relatively lower resolution remote sensing imagery and particularly in the challenging multispecies forest classification and encroachment species early detection. Besides the constant advances of the algorithms, the integration multi-modal data source might be worth investigating given a set or limited spatial resolution [40].
5. Conclusions
In this study, we investigated the potential of UAS based RGB remote sensing and four semantic segmentation algorithms (decision tree, random forest, AlexNet, and ResNet) on the early detection of ERCs and the classification and delineation of ERCs in a multi-species forest context. The size of the ERCs in an early and singular form was within 0.6 m and 3.5 m. We also investigated the change of performance under the original and downsampled image resolutions (0.694 cm, 1 cm to 5 cm with 0.5 cm interval). In the multi-species forest context, the ResNet performed the best on the ERC classification with an OA of 0.918 and a mIoU of 85.0%, followed by the AlexNet with 0.878 and 78.2%. The decision tree and random forest models trained in this study had lower OAs and mIoUs. With downsampled spatial resolutions, the ERC segmentation performance dropped significantly when the spatial resolution lower than 3 cm. At a spatial resolution of 5 cm, early stage singular ERCs with a diameter less than 1 m was failed to be detected by the ResNet which had the best performance with images in the original resolution.
As ERC has been posing a serious threat to the biodiversity and rangeland productivity on the Great Plains, developing remote sensing technologies and associated data analysis techniques to closely monitor its encroachment status especially at an early growth stage is critical to a successful and effective management. The ultra high resolution RGB imagery collected by UAS in this study provided an example dataset to investigate the potential of ERC early detection in a singular form and its delineation for infilling rate monitoring in a multi-species forest context. As the rapid development of remote sensing technology and the arrival of long-endurance UAS and high resolution satellite imagery, we concur with many other studies in this area and envision that data modality, generation, and analytics are among the key research topics to answer how to utilize the latest remote sensing technologies and techniques to improve encroachment species monitoring and management.
Author Contributions
Conceptualization, Y.S. and Y.Z.; methodology, L.W., Y.Z. and Y.S.; formal analysis, L.W.; resources, A.S. and T.A.; writing—original draft preparation, L.W.; writing—review and editing, Y.S., Y.Z., Q.H., Z.T., Y.G., A.S. and T.A.; supervision, Y.S.; project administration, Y.Z.; funding acquisition, Y.Z., Y.S., Y.G., Z.T. and A.S. All authors have read and agreed to the published version of the manuscript.
Funding
This research was funded by McIntire Stennis Fund (project Accession Number 1017851), the Hatch Act capacity funding program (Accession Number 1011130), and a competitive grant (Award No. 2018-67007-28529) from the USDA National Institute of Food and Agriculture.
Institutional Review Board Statement
Not applicable.
Informed Consent Statement
Not applicable.
Data Availability Statement
Data available in a publicly accessible repository. The data presented in this study are openly available in Dryad (https://datadryad.org/stash, accessed on 17 May 2021) with the DOI of doi:10.5061/dryad.9s4mw6mgh (https://doi.org/10.5061/dryad.9s4mw6mgh, accessed on 17 May 2021) and title of Data from: Early Detection of Encroaching Woody Juniperus virginiana and its Classification in Multi-species Forest Using UAS Imagery and Semantic Segmentation Algorithms.
Conflicts of Interest
The authors declare no conflict of interest.
References
- Parr, C.L.; Gray, E.F.; Bond, W.J. Cascading Biodiversity and Functional Consequences of a Global Change-Induced Biome Switch. Divers. Distrib. 2012, 2012, 493–503. [Google Scholar] [CrossRef]
- Ratajczak, Z.; Nippert, J.B.; Collins, S.L. Woody Encroachment Decreases Diversity across North American Grasslands and Savannas. Ecology 2012, 93, 697–703. [Google Scholar] [CrossRef]
- Stevens, N.; Lehmann, C.E.R.; Murphy, B.P.; Durigan, G. Savanna Woody Encroachment Is Widespread across Three Continents. Glob. Chang. Biol. 2017, 23, 235–244. [Google Scholar] [CrossRef]
- Saintilan, N.; Rogers, K. Research Review Woody Plant Encroachment of Grasslands: A Comparison of Terrestrial and Wetland Settings. New Phytol. 2015, 205, 1062–1070. [Google Scholar] [CrossRef]
- Wang, J.; Xiao, X.; Qin, Y.; Doughty, R.B.; Dong, J.; Zou, Z. Characterizing the Encroachment of Juniper Forests into Sub-Humid and Semi-Arid Prairies from 1984 to 2010 Using PALSAR and Landsat Data. Remote Sens. Environ. 2018, 205, 166–179. [Google Scholar] [CrossRef]
- McKinley, D.C.; Norris, M.D.; Blair, J.M.; Johnson, L.C. Altered Ecosystem Processes as a Consequence of Juniperus virginiana L. Encroachment into North American Tallgrass Prairie. In Western North American Juniperus Communities; Springer: New York, NY, USA, 2008; pp. 170–187. [Google Scholar]
- Zou, C.; Twidwell, D.; Bielski, C.; Fogarty, D.; Mittelstet, A.; Starks, P.; Will, R.; Zhong, Y.; Acharya, B.; Zou, C.B.; et al. Impact of Eastern Redcedar Proliferation on Water Resources in the Great Plains USA—Current State of Knowledge. Water 2018, 10, 1768. [Google Scholar] [CrossRef]
- Archer, S.R.; Andersen, E.M.; Predick, K.I.; Schwinning, S.; Steidl, R.J.; Woods, S.R. Woody Plant Encroachment: Causes and Consequences. In Rangeland Systems; Springer: Cham, Switzerland, 2017; pp. 25–84. [Google Scholar]
- Scholtz, R.; Polo, J.A.; Fuhlendorf, S.D.; Engle, D.M.; Weir, J.R. Woody Plant Encroachment Mitigated Differentially by Fire and Herbicide. Rangel. Ecol. Manag. 2018, 71, 239–244. [Google Scholar] [CrossRef]
- Policelli, N.; Picca, P.; Gómez Villafañe, I.E. Is Prescribed Fire a Suitable Management Tool to Reduce Shrub Encroachment in Palm Savannas? Restor. Ecol. 2019, 27, 109–119. [Google Scholar] [CrossRef]
- Sühs, R.B.; Giehl, E.L.H.; Peroni, N. Preventing Traditional Management Can Cause Grassland Loss within 30 Years in Southern Brazil. Sci. Rep. 2020, 10, 783. [Google Scholar] [CrossRef] [PubMed]
- Schmidt, T.L.; Stubbendieck, J. Factors Influencing Eastern Redcedar Seedling Survival on Rangeland. J. Range Manag. 1993, 46, 448. [Google Scholar] [CrossRef]
- van Els, P.; Will, R.E.; Palmer, M.W.; Hickman, K.R. Changes in Forest Understory Associated with Juniperus Encroachment in Oklahoma, USA. Appl. Veg. Sci. 2010, 13, 356–368. [Google Scholar] [CrossRef]
- Qiao, L.; Zou, C.B.; Stebler, E.; Will, R.E. Woody Plant Encroachment Reduces Annual Runoff and Shifts Runoff Mechanisms in the Tallgrass Prairie, USA. Water Resour. Res. 2017, 53, 4838–4849. [Google Scholar] [CrossRef]
- Hoff, D.L.; Will, R.E.; Zou, C.B.; Weir, J.R.; Gregory, M.S.; Lillie, N.D. Estimating Increased Fuel Loading within the Cross Timbers Forest Matrix of Oklahoma, USA Due to an Encroaching Conifer, Juniperus virginiana, Using Leaf-off Satellite Imagery. For. Ecol. Manag. 2018, 409, 215–224. [Google Scholar] [CrossRef]
- Donovan, V.M.; Burnett, J.L.; Bielski, C.H.; Birgé, H.E.; Bevans, R.; Twidwell, D.; Allen, C.R. Social-Ecological Landscape Patterns Predict Woody Encroachment from Native Tree Plantings in a Temperate Grassland. Ecol. Evol. 2018, 8, 9624–9632. [Google Scholar] [CrossRef] [PubMed]
- Kaskie, K.D.; Wimberly, M.C.; Bauman, P.J. Rapid Assessment of Juniper Distribution in Prairie Landscapes of the Northern Great Plains. Int. J. Appl. Earth Obs. Geoinf. 2019, 83, 101946. [Google Scholar] [CrossRef]
- Meneguzzo, D.M.; Liknes, G.C. Status and Trends of Eastern Redcedar (Juniperus virginiana) in the Central United States: Analyses and Observations Based on Forest Inventory and Analysis Data. J. For. 2015, 113, 325–334. [Google Scholar] [CrossRef]
- Eggemeyer, K.D.; Awada, T.; Wedin, D.A.; Harvey, F.E.; Zhou, X. Ecophysiology of Two Native Invasive Woody Species and Two Dominant Warm-Season Grasses in the Semiarid Grasslands of the Nebraska Sandhills. Int. J. Plant Sci. 2006, 167, 991–999. [Google Scholar] [CrossRef]
- Huddle, J.A.; Awada, T.; Martin, D.L.; Zhou, X.; Pegg, S.E.; Josiah, S.J. Do invasive riparian woody plants affect hydrology and ecosystem processes? Gt. Plains Res. 2011, 21, 49–71. [Google Scholar]
- Sankey, T.T.; McVay, J.; Swetnam, T.L.; McClaran, M.P.; Heilman, P.; Nichols, M. UAV Hyperspectral and Lidar Data and Their Fusion for Arid and Semi-Arid Land Vegetation Monitoring. Remote Sens. Ecol. Conserv. 2018, 4, 20–33. [Google Scholar] [CrossRef]
- Kattenborn, T.; Leitloff, J.; Schiefer, F.; Hinz, S. Review on Convolutional Neural Networks (CNN) in Vegetation Remote Sensing. ISPRS J. Photogramm. Remote Sens. 2021, 173, 24–49. [Google Scholar] [CrossRef]
- Friedl, M.A.; Brodley, C.E. Decision Tree Classification of Land Cover from Remotely Sensed Data. Remote Sens. Environ. 1997, 61, 399–409. [Google Scholar] [CrossRef]
- Du, P.; Samat, A.; Waske, B.; Liu, S.; Li, Z. Random Forest and Rotation Forest for Fully Polarized SAR Image Classification Using Polarimetric and Spatial Features. ISPRS J. Photogramm. Remote Sens. 2015, 105, 38–53. [Google Scholar] [CrossRef]
- Michez, A.; Piégay, H.; Lisein, J.; Claessens, H.; Lejeune, P. Classification of Riparian Forest Species and Health Condition Using Multi-Temporal and Hyperspatial Imagery from Unmanned Aerial System. Environ. Monit. Assess. 2016, 188, 1–19. [Google Scholar] [CrossRef]
- Chang, T.; Rasmussen, B.; Dickson, B.; Zachmann, L. Chimera: A Multi-Task Recurrent Convolutional Neural Network for Forest Classification and Structural Estimation. Remote Sens. 2019, 11, 768. [Google Scholar] [CrossRef]
- Descals, A.; Szantoi, Z.; Meijaard, E.; Sutikno, H.; Rindanata, G.; Wich, S. Oil Palm (Elaeis guineensis) Mapping with Details: Smallholder versus Industrial Plantations and Their Extent in Riau, Sumatra. Remote Sens. 2019, 11, 2590. [Google Scholar] [CrossRef]
- Durfee, N.; Ochoa, C.; Mata-Gonzalez, R.; Durfee, N.; Ochoa, C.G.; Mata-Gonzalez, R. The Use of Low-Altitude UAV Imagery to Assess Western Juniper Density and Canopy Cover in Treated and Untreated Stands. Forests 2019, 10, 296. [Google Scholar] [CrossRef]
- Cavender-Bares, J.; Gamon, J.A.; Townsend, P.A. Remote Sensing of Plant Biodiversity; Pinto-Ledezma, J.N., Cavender-Bares, J., Eds.; Springer: Cham, Switzerland, 2020. [Google Scholar]
- Filippelli, S.K.; Vogeler, J.C.; Falkowski, M.J.; Meneguzzo, D.M. Monitoring Conifer Cover: Leaf-off Lidar and Image-Based Tracking of Eastern Redcedar Encroachment in Central Nebraska. Remote Sens. Environ. 2020, 248, 111961. [Google Scholar] [CrossRef]
- Long Range Drone|5 Hour Flight Time|Commercial Drones|HSE-UAV. Available online: https://hse-uav.com/product/sp9-fixed-wing-drone/ (accessed on 9 April 2021).
- Liu, D.; Xia, F. Assessing Object-Based Classification: Advantages and Limitations. Remote Sens. Lett. 2010, 1, 187–194. [Google Scholar] [CrossRef]
- Wagner, F.H.; Sanchez, A.; Tarabalka, Y.; Lotte, R.G.; Ferreira, M.P.; Aidar, M.P.M.; Gloor, E.; Phillips, O.L.; Aragão, L.E.O.C. Using the U-net Convolutional Network to Map Forest Types and Disturbance in the Atlantic Rainforest with Very High Resolution Images. Remote Sens. Ecol. Conserv. 2019, 5, 360–375. [Google Scholar] [CrossRef]
- Weinstein, B.G.; Marconi, S.; Bohlman, S.A.; Zare, A.; White, E.P. Cross-Site Learning in Deep Learning RGB Tree Crown Detection. Ecol. Inform. 2020, 56, 101061. [Google Scholar] [CrossRef]
- Liu, T.; Abd-Elrahman, A.; Morton, J.; Wilhelm, V.L. Comparing Fully Convolutional Networks, Random Forest, Support Vector Machine, and Patch-Based Deep Convolutional Neural Networks for Object-Based Wetland Mapping Using Images from Small Unmanned Aircraft System. GISci. Remote Sens. 2018, 55, 243–264. [Google Scholar] [CrossRef]
- Mazzia, V.; Khaliq, A.; Chiaberge, M. Improvement in Land Cover and Crop Classification Based on Temporal Features Learning from Sentinel-2 Data Using Recurrent-Convolutional Neural Network (R-CNN). Appl. Sci. 2020, 10, 238. [Google Scholar] [CrossRef]
- Qian, W.; Huang, Y.; Liu, Q.; Fan, W.; Sun, Z.; Dong, H.; Wan, F.; Qiao, X. UAV and a Deep Convolutional Neural Network for Monitoring Invasive Alien Plants in the Wild. Comput. Electron. Agric. 2020, 174, 105519. [Google Scholar] [CrossRef]
- Kattenborn, T.; Eichel, J.; Wiser, S.; Burrows, L.; Fassnacht, F.E.; Schmidtlein, S. Convolutional Neural Networks Accurately Predict Cover Fractions of Plant Species and Communities in Unmanned Aerial Vehicle Imagery. Remote Sens. Ecol. Conserv. 2020, 6, 472–486. [Google Scholar] [CrossRef]
- Lehmann, J.R.K.; Prinz, T.; Ziller, S.R.; Thiele, J.; Heringer, G.; Meira-Neto, J.A.A.; Buttschardt, T.K. Open-Source Processing and Analysis of Aerial Imagery Acquired with a Low-Cost Unmanned Aerial System to Support Invasive Plant Management. Front. Environ. Sci. 2017, 5, 44. [Google Scholar] [CrossRef]
- Dash, J.P.; Watt, M.S.; Paul, T.S.H.; Morgenroth, J.; Pearse, G.D. Early Detection of Invasive Exotic Trees Using UAV and Manned Aircraft Multispectral and LiDAR Data. Remote Sens. 2019, 11, 1812. [Google Scholar] [CrossRef]
- Al-Ali, Z.M.; Abdullah, M.M.; Asadalla, N.B.; Gholoum, M. A Comparative Study of Remote Sensing Classification Methods for Monitoring and Assessing Desert Vegetation Using a UAV-Based Multispectral Sensor. Environ. Monit. Assess. 2020, 192, 1–14. [Google Scholar] [CrossRef] [PubMed]
- Abeysinghe, T.; Simic Milas, A.; Arend, K.; Hohman, B.; Reil, P.; Gregory, A.; Vázquez-Ortega, A. Mapping Invasive Phragmites Australis in the Old Woman Creek Estuary Using UAV Remote Sensing and Machine Learning Classifiers. Remote Sens. 2019, 11, 1380. [Google Scholar] [CrossRef]
- O’Mahony, N.; Campbell, S.; Carvalho, A.; Harapanahalli, S.; Hernandez, G.V.; Krpalkova, L.; Riordan, D.; Walsh, J. Deep Learning vs. Traditional Computer Vision. In Advances in Intelligent Systems and Computing, Proceedings of the Computer Vision Conference (CVC), Las Vegas, NV, USA, 25–26 April 2019; Springer: Cham, Switzerland, 2020; Volume 943, pp. 128–144. [Google Scholar]
- Lateef, F.; Ruichek, Y. Survey on Semantic Segmentation Using Deep Learning Techniques. Neurocomputing 2019, 338, 321–348. [Google Scholar] [CrossRef]
- Patel, M.; Jernigan, S.; Richardson, R.; Ferguson, S.; Buckner, G. Autonomous Robotics for Identification and Management of Invasive Aquatic Plant Species. Appl. Sci. 2019, 9, 2410. [Google Scholar] [CrossRef]
- Zhang, C.; Pan, X.; Li, H.; Gardiner, A.; Sargent, I.; Hare, J.; Atkinson, P.M. A Hybrid MLP-CNN Classifier for Very Fine Resolution Remotely Sensed Image Classification. ISPRS J. Photogramm. Remote Sens. 2018, 140, 133–144. [Google Scholar] [CrossRef]
- Long, J.; Shelhamer, E.; Darrell, T. Fully Convolutional Networks for Semantic Segmentation. In Proceedings of the IEEE Conference on Computer Vision and Pattern Recognition (CVPR), Boston, MA, USA, 7–12 June 2015; pp. 3431–3440. [Google Scholar]
- Huang, L.; Luo, J.; Lin, Z.; Niu, F.; Liu, L. Using Deep Learning to Map Retrogressive Thaw Slumps in the Beiluhe Region (Tibetan Plateau) from CubeSat Images. Remote Sens. Environ. 2020, 237. [Google Scholar] [CrossRef]
- Zhu, Y.; Gei, C.M.; So, E.; Jin, Y. Multi-Temporal Relearning with Convolutional LSTM Models for Land Use Classification. IEEE J. Sel. Top. Appl. Earth Obs. Remote Sens. 2021. [Google Scholar] [CrossRef]
- Sun, Y.; Zhang, X.; Xin, Q.; Huang, J. Developing a Multi-Filter Convolutional Neural Network for Semantic Segmentation Using High-Resolution Aerial Imagery and LiDAR Data. ISPRS J. Photogramm. Remote Sens. 2018, 143, 3–14. [Google Scholar] [CrossRef]
- Ding, L.; Zhang, J.; Bruzzone, L. Semantic Segmentation of Large-Size VHR Remote Sensing Images Using a Two-Stage Multiscale Training Architecture. IEEE Trans. Geosci. Remote Sens. 2020, 58, 5367–5376. [Google Scholar] [CrossRef]
- Swain, P.H.; Hauska, H. Decision tree classifier: Design and potential. IEEE Trans. Geosci. Electron. 1977, 15, 142–147. [Google Scholar] [CrossRef]
- Géron, A. Hands-On Machine Learning with Scikit-Learn, Keras, and TensorFlow: Concepts, Tools, and Techniques to Build Intelligent Systems; O’Reilly Media: Sebastopol, CA, USA, 2019. [Google Scholar]
- Breiman, L. Random Forests. Mach. Learn. 2001, 45, 5–32. [Google Scholar] [CrossRef]
- Haralick, R.M.; Shanmugam, K.; Dinstein, I. Textural Features for Image Classification. IEEE Trans. Syst. Man. Cybern. 1973, 3, 610–621. [Google Scholar] [CrossRef]
- Kekre, H.; Thepade, S.; Sarode, T.K.; Suryawanshi, V. Image Retrieval Using Texture Features Extracted from GLCM, LBG and KPE. Int. J. Comput. Theory Eng. 2010, 2, 695. [Google Scholar] [CrossRef]
- Nezhad, M.Z.; Zhu, D.; Yang, K.; Sadati, N.; Zafar Nezhad, M. A Predictive Approach Using Deep Feature Learning for Electronic Medical Records: A Comparative Study. arXiv 2018, arXiv:1801.02961v1. [Google Scholar]
- Krizhevsky, A.; Sutskever, I.; Hinton, G.E. ImageNet Classification with Deep Convolutional Neural Networks. Commun. ACM 2017, 60, 84–90. [Google Scholar] [CrossRef]
- He, K.; Zhang, X.; Ren, S.; Sun, J. Deep Residual Learning for Image Recognition. In Proceedings of the IEEE Conference on Computer Vision and Pattern Recognition (CVPR), Las Vegas, NV, USA, 27–30 June 2016; pp. 770–778. [Google Scholar]
- Canziani, A.; Paszke, A.; Culurciello, E. An Analysis of Deep Neural Network Models for Practical Applications. arXiv 2016, arXiv:1605.07678. [Google Scholar]
- Wilson, D.R.; Martinez, T.R. The General Inefficiency of Batch Training for Gradient Descent Learning. Neural Netw. 2003, 16, 1429–1451. [Google Scholar] [CrossRef]
- Story, M.; Congalton, R.G. Accuracy Assessment: A User’s Perspective. Photogramm. Eng. Remote Sens. 1986, 52, 397–399. [Google Scholar]
- Congalton, R.G. A Review of Assessing the Accuracy of Classifications of Remotely Sensed Data. Remote Sens. Environ. 1991, 37, 35–46. [Google Scholar] [CrossRef]
- Choi, H.; Lee, H.-J.; You, H.-J.; Rhee, S.-Y.; Jeon, W.-S. Comparative Analysis of Generalized Intersection over Union and Error Matrix for Vegetation Cover Classification Assessment. Sensors Mater. 2019, 31, 3849–3858. [Google Scholar] [CrossRef]
- Hu, Y.; Chen, Z.; Lin, W. RGB-D Semantic Segmentation: A Review. In Proceedings of the IEEE International Conference on Multimedia and Expo Workshops, ICMEW 2018, San Diego, CA, USA, 23–27 July 2018; Institute of Electrical and Electronics Engineers, Inc.: Piscataway, NJ, USA, 2018. [Google Scholar]
- Wang, J.; Xiao, X.; Qin, Y.; Dong, J.; Geissler, G.; Zhang, G.; Cejda, N.; Alikhani, B.; Doughty, R.B. Mapping the Dynamics of Eastern Redcedar Encroachment into Grasslands during 1984–2010 through PALSAR and Time Series Landsat Images. Remote Sens. Environ. 2017, 190, 233–246. [Google Scholar] [CrossRef]
- Nesbit, P.; Hugenholtz, C. Enhancing UAV–SfM 3D Model Accuracy in High-Relief Landscapes by Incorporating Oblique Images. Remote Sens. 2019, 11, 239. [Google Scholar] [CrossRef]
- Sharir, O.; Shashua, A. On the Expressive Power of Overlapping Architectures of Deep Learning. arXiv 2017, arXiv:1703.02065. [Google Scholar]
- Kamal, M.; Phinn, S. Hyperspectral Data for Mangrove Species Mapping: A Comparison of Pixel-Based and Object-Based Approach. Remote Sens. 2011, 3, 2222–2242. [Google Scholar] [CrossRef]
- Duro, D.C.; Franklin, S.E.; Dubé, M.G. A Comparison of Pixel-Based and Object-Based Image Analysis with Selected Machine Learning Algorithms for the Classification of Agricultural Landscapes Using SPOT-5 HRG Imagery. Remote Sens. Environ. 2012, 118, 259–272. [Google Scholar] [CrossRef]
- Meneguzzo, D.M.; Liknes, G.C.; Nelson, M.D. Mapping Trees Outside Forests Using High-Resolution Aerial Imagery: A Comparison of Pixel- and Object-Based Classification Approaches. Environ. Monit. Assess. 2013, 185, 6261–6275. [Google Scholar] [CrossRef] [PubMed]
- Myint, S.W.; Gober, P.; Brazel, A.; Grossman-Clarke, S.; Weng, Q. Per-Pixel vs. Object-Based Classification of Urban Land Cover Extraction Using High Spatial Resolution Imagery. Remote Sens. Environ. 2011, 115, 1145–1161. [Google Scholar] [CrossRef]
- Liu, T.; Abd-Elrahman, A.; Zare, A.; Dewitt, B.A.; Flory, L.; Smith, S.E. A Fully Learnable Context-Driven Object-Based Model for Mapping Land Cover Using Multi-View Data from Unmanned Aircraft Systems. Remote Sens. Environ. 2018, 216, 328–344. [Google Scholar] [CrossRef]
- Kattenborn, T.; Eichel, J.; Fassnacht, F.E. Convolutional Neural Networks Enable Efficient, Accurate and Fine-Grained Segmentation of Plant Species and Communities from High-Resolution UAV Imagery. Sci. Rep. 2019, 9, 17656. [Google Scholar] [CrossRef]
- Lu, B.; He, Y. Species Classification Using Unmanned Aerial Vehicle (UAV)-Acquired High Spatial Resolution Imagery in a Heterogeneous Grassland. ISPRS J. Photogramm. Remote Sens. 2017, 128, 73–85. [Google Scholar] [CrossRef]
- Wulder, M.A.; White, J.C.; Goward, S.N.; Masek, J.G.; Irons, J.R.; Herold, M.; Cohen, W.B.; Loveland, T.R.; Woodcock, C.E. Landsat Continuity: Issues and Opportunities for Land Cover Monitoring. Remote Sens. Environ. 2008, 112, 955–969. [Google Scholar] [CrossRef]
- Franklin, S.E. Pixel- and Object-Based Multispectral Classification of Forest Tree Species from Small Unmanned Aerial Vehicles. J. Unmanned Veh. Syst. 2018, 6, 195–211. [Google Scholar] [CrossRef]
- Mukherjee, A.; Kumar, A.A.; Ramachandran, P. Development of New Index-Based Methodology for Extraction of Built-Up Area from Landsat7 Imagery: Comparison of Performance with SVM, ANN, and Existing Indices. IEEE Trans. Geosci. Remote Sens. 2021, 59, 1592–1603. [Google Scholar] [CrossRef]


Publisher’s Note: MDPI stays neutral with regard to jurisdictional claims in published maps and institutional affiliations. |
© 2021 by the authors. Licensee MDPI, Basel, Switzerland. This article is an open access article distributed under the terms and conditions of the Creative Commons Attribution (CC BY) license (https://creativecommons.org/licenses/by/4.0/).