Abstract
Water resources are rich on the Tibetan Plateau, with large amounts of glaciers, lakes, and permafrost. Terrestrial water storage (TWS) on the Tibetan Plateau has experienced a significant change in recent decades. However, there is a lack of research about the spatial difference between TWSC and lake water storage change (LWSC), which is helpful to understand the response of water storage to climate change. In this study, we estimate the change in TWS, lake water storage (LWS), soil moisture, and permafrost, respectively, according to satellite and model data during 2005−2013 in the inner Tibetan Plateau and glacial meltwater from previous literature. The results indicate a sizeable spatial difference between TWSC and LWSC. LWSC was mainly concentrated in the northeastern part (18.71 ± 1.35 Gt, 37.7% of the total) and southeastern part (22.68 ± 1.63 Gt, 45.6% of the total), but the increased TWS was mainly in the northeastern region (region B, 18.96 ± 1.26 Gt, 57%). Based on mass balance, LWSC was the primary cause of TWSC for the entire inner Tibetan Plateau. However, the TWS of the southeastern part increased by 3.97 ± 2.5 Gt, but LWS had increased by 22.68 ± 1.63 Gt, and groundwater had lost 16.91 ± 7.26 Gt. The increased TWS in the northeastern region was equivalent to the increased LWS, and groundwater had increased by 4.47 ± 4.87 Gt. Still, LWS only increased by 2.89 ± 0.21 Gt in the central part, and the increase in groundwater was the primary cause of TWSC. These results suggest that the primary cause of increased TWS shows a sizeable spatial difference. According to the water balance, an increase in precipitation was the primary cause of lake expansion for the entire inner Tibetan Plateau, which contributed 73% (36.28 Gt) to lake expansion (49.69 ± 3.58 Gt), and both glacial meltwater and permafrost degradation was 13.5%.
1. Introduction
The Tibetan Plateau, the largest and highest plateau globally, is the headstream of many large Asian rivers (e.g., the Yellow, Yangtze, and Brahmaputra Rivers). Large numbers of lakes and glaciers are distributed on the Tibetan Plateau, especially the inner Tibetan Plateau, e.g., Puruogangri, which is one of the largest ice fields outside of the Arctic and Antarctic, and Selin Co and Nam Co are the largest lakes (>2000 km2) on the Tibetan Plateau. There are abundant water resources on the Tibetan Plateau, described as the “Water Tower of Asia”. However, the climatic conditions of the Tibetan Plateau experienced severe changes, due to westerly monsoon interactions, which will seriously affect the “Water Tower of Asia” [1], and most glaciers experienced an abrupt retreat, and most lakes experienced an abrupt expansion [2,3,4,5,6].
Water resources on the Tibetan Plateau play an essential role in human production and life in Asia. It is of great significance to analyze the cause of water resource changes. The terrestrial water storage change (TWSC) is a good indicator for analyzing the water resource changes, which is a comprehensive result that included the change of lake water storage, soil moisture (SM), groundwater, glacier, permafrost, and so on. However, those factors have been experiencing large changes in recent decades, e.g., lake expansion [3,4,7,8], glacier retreat [2,9], and permafrost degradation [10,11]. The results from the Gravity Recovery and Climate Experiment (GRACE) indicated that the TWSC of the inner Tibetan Plateau showed an increasing trend from 2003 to 2012 and then decreased from 2012 to 2016 [12,13]. The increased rate of TWSC derived from GRACE was 7 ± 7 Gt/y during 2003−2010 on the Tibet and Qilian Shan (Gt = km3 with an assumption that the density of lake water is 1000 kg/m3) [14]. Zhang et al. [15] calculated the water storage changes in 117 lakes on the inner Tibetan Plateau, and suggested that the lake water storage change (LWSC) with 4.28 Gt/y explained 61% of the increased TWS from the results of Jacob et al. [14], and that the increased water storage of all the lakes (8.06 Gt/y) could explain the total increased TWS by rough estimation. The results of Song et al. [7] also suggested that the LWS increased by 81.34 km3 (6.79 km3/y) from 2000 to 2011 based on ICESat data and models, which was consistent with the increased TWS (54.5 km3, 6.81 km3/y) from 2003 to 2010 derived from GRACE satellite data. By quantifying the water mass budget of different factors on the Tibetan Plateau, increased LWSC and groundwater were the primary cause of increased TWS [4]. Deng et al. [12] suggested that precipitation increased and lake expansion drove increasing TWS in the inner Tibetan Plateau. These results indicated that the cause of increased TWS of the inner Tibetan Plateau was the increased LWS, because glacial meltwater had little influence on the TWSC of the inner Tibetan Plateau, as it merely converted from solid to liquid. Wang et al. [16] analyzed the spatial-temporal divergence and consistency between surface water area change and TWSC in China during 1989–2016. Previous studies have mainly focused on the whole Tibetan Plateau, and the increase in LWS and TWS of the whole Tibetan Plateau was consistent. There is little research about the spatial difference between the changes of TWS and LWS. However, increased TWS was mainly concentrated in the northern and central of inner Tibetan Plateau in previous literature [7,12,14], and increased LWS was concentrated primarily on the southeastern of inner Tibetan Plateau [17,18]. Qiao et al. [18] had suggested that there was a sizeable spatial difference between LWSC and TWSC in the inner Tibetan Plateau, but they had not explained the cause further. Therefore, studies of the spatial difference between the LWSC and TWSC on the Tibetan Plateau are still blanking, and further research is needed.
Lakes are an essential component of the water cycle and TWS, and lake change influences the regional environment and climate. According to two detailed investigations [19,20], there were more than 1000 lakes (>1 km2) with a total area of 4.07 × 10⁵ km2 on the Tibetan Plateau. Based on remote sensing images and satellite elevation data, most Tibetan Plateau lakes have expanded in past decades, except for some lakes in the southern Tibetan Plateau that showed shrinkage [3,7,21,22,23,24]. There are different origins of the precipitation (e.g., Westerlies and Monsoon) on the Tibetan Plateau and their seasonal appearance [25]. Precipitation has increased in recent decades, especially in the central Tibetan Plateau [26], and the average precipitation during 1996–2015 was 21 ± 7% greater than that during 1976–1995 [27]; therefore, increased precipitation considered to be the primary cause of lake expansion based on correlation analysis and hydrological models [8,24,28,29,30,31]. Wang et al. [32] suggested the evaporated water of 75 large lakes was 29.4 ± 1.2 km3/y on the Tibetan Plateau based on remote sensing, in situ observation, and reanalysis. However, variation in surface water evaporation had little influence on lake change [33,34]. Most Tibetan Plateau glaciers have experienced severe shrinkage in past decades, especially in the Himalayas [2,9]. The Tibetan Plateau lakes are more or less dependent on glacial meltwater based on geometric dependency [35]. Increased precipitation, glacial meltwater, and permafrost degradation made 74%, 13%, and 12% contributions, respectively, to lake expansion based on satellite and model data from the inner Tibetan Plateau [4]. Zhang et al. [36] suggested that glacial meltwater of 14 lake-basins contributed 0.3~29.1% to lake expansion on the Tibetan Plateau. The contribution of glacial meltwater was equivalent to the increase in precipitation contribution to lake expansion based on comparing the difference between glacier-fed and non-glacier-fed lakes changes on the Tanggula Mountains and northwestern region of the Tibetan Plateau [37,38]. However, it is challenging to quantify glacial meltwater’s contribution to Tibetan Plateau lake expansion, due to the extreme climate environment and complicated hydrological processes. Permafrost degradation with rising temperature is also considered a primary reason for the Tibetan Plateau lake expansion because the distribution of permafrost showed a close relationship with lake expansion [21]. There is a large amount of permafrost on the Tibetan Plateau, which accounts for approximately half of the Tibetan Plateau [39,40]. Ice content is a crucial parameter on the released permafrost meltwater [41], and the total volume of ground ice, which stored in the permafrost, is estimated to be 9528 km3 [42]. However, permafrost has been warming, thawing, and degrading in recent decades based on observational data [43]. The active layer thickness has deepened by 10 to 40 cm along the Qinghai-Tibet Highway [44,45,46,47]. Permafrost degradation is an essential factor influencing regional water circulation and water balance [48], and it is also vital for protecting water resources and ecological security [49]. Therefore, it is also important to analyze the spatial difference of the causes for changes in the lakes, based on the water balance of the closed basin in the inner Tibetan Plateau.
In this study, we estimated the TWSC, LWSC of 284 lakes, glacial meltwater, permafrost meltwater, and SM according to satellite images, models, and literature (Figure 1); additionally, we compared the spatial difference between the TWSC and LWSC, and analyzed the cause of TWSC and LWSC based on the water balance. The purposes of this study are to (1) estimate the water storage change derived from the remote sensing data, and related models, including the changes of the TWS, LWS, glacier, SM, and permafrost; (2) compare the spatial differences between TWSC and LWSC; and (3) analyze the causes of TWSC and LWSC and their linkages to climate change.

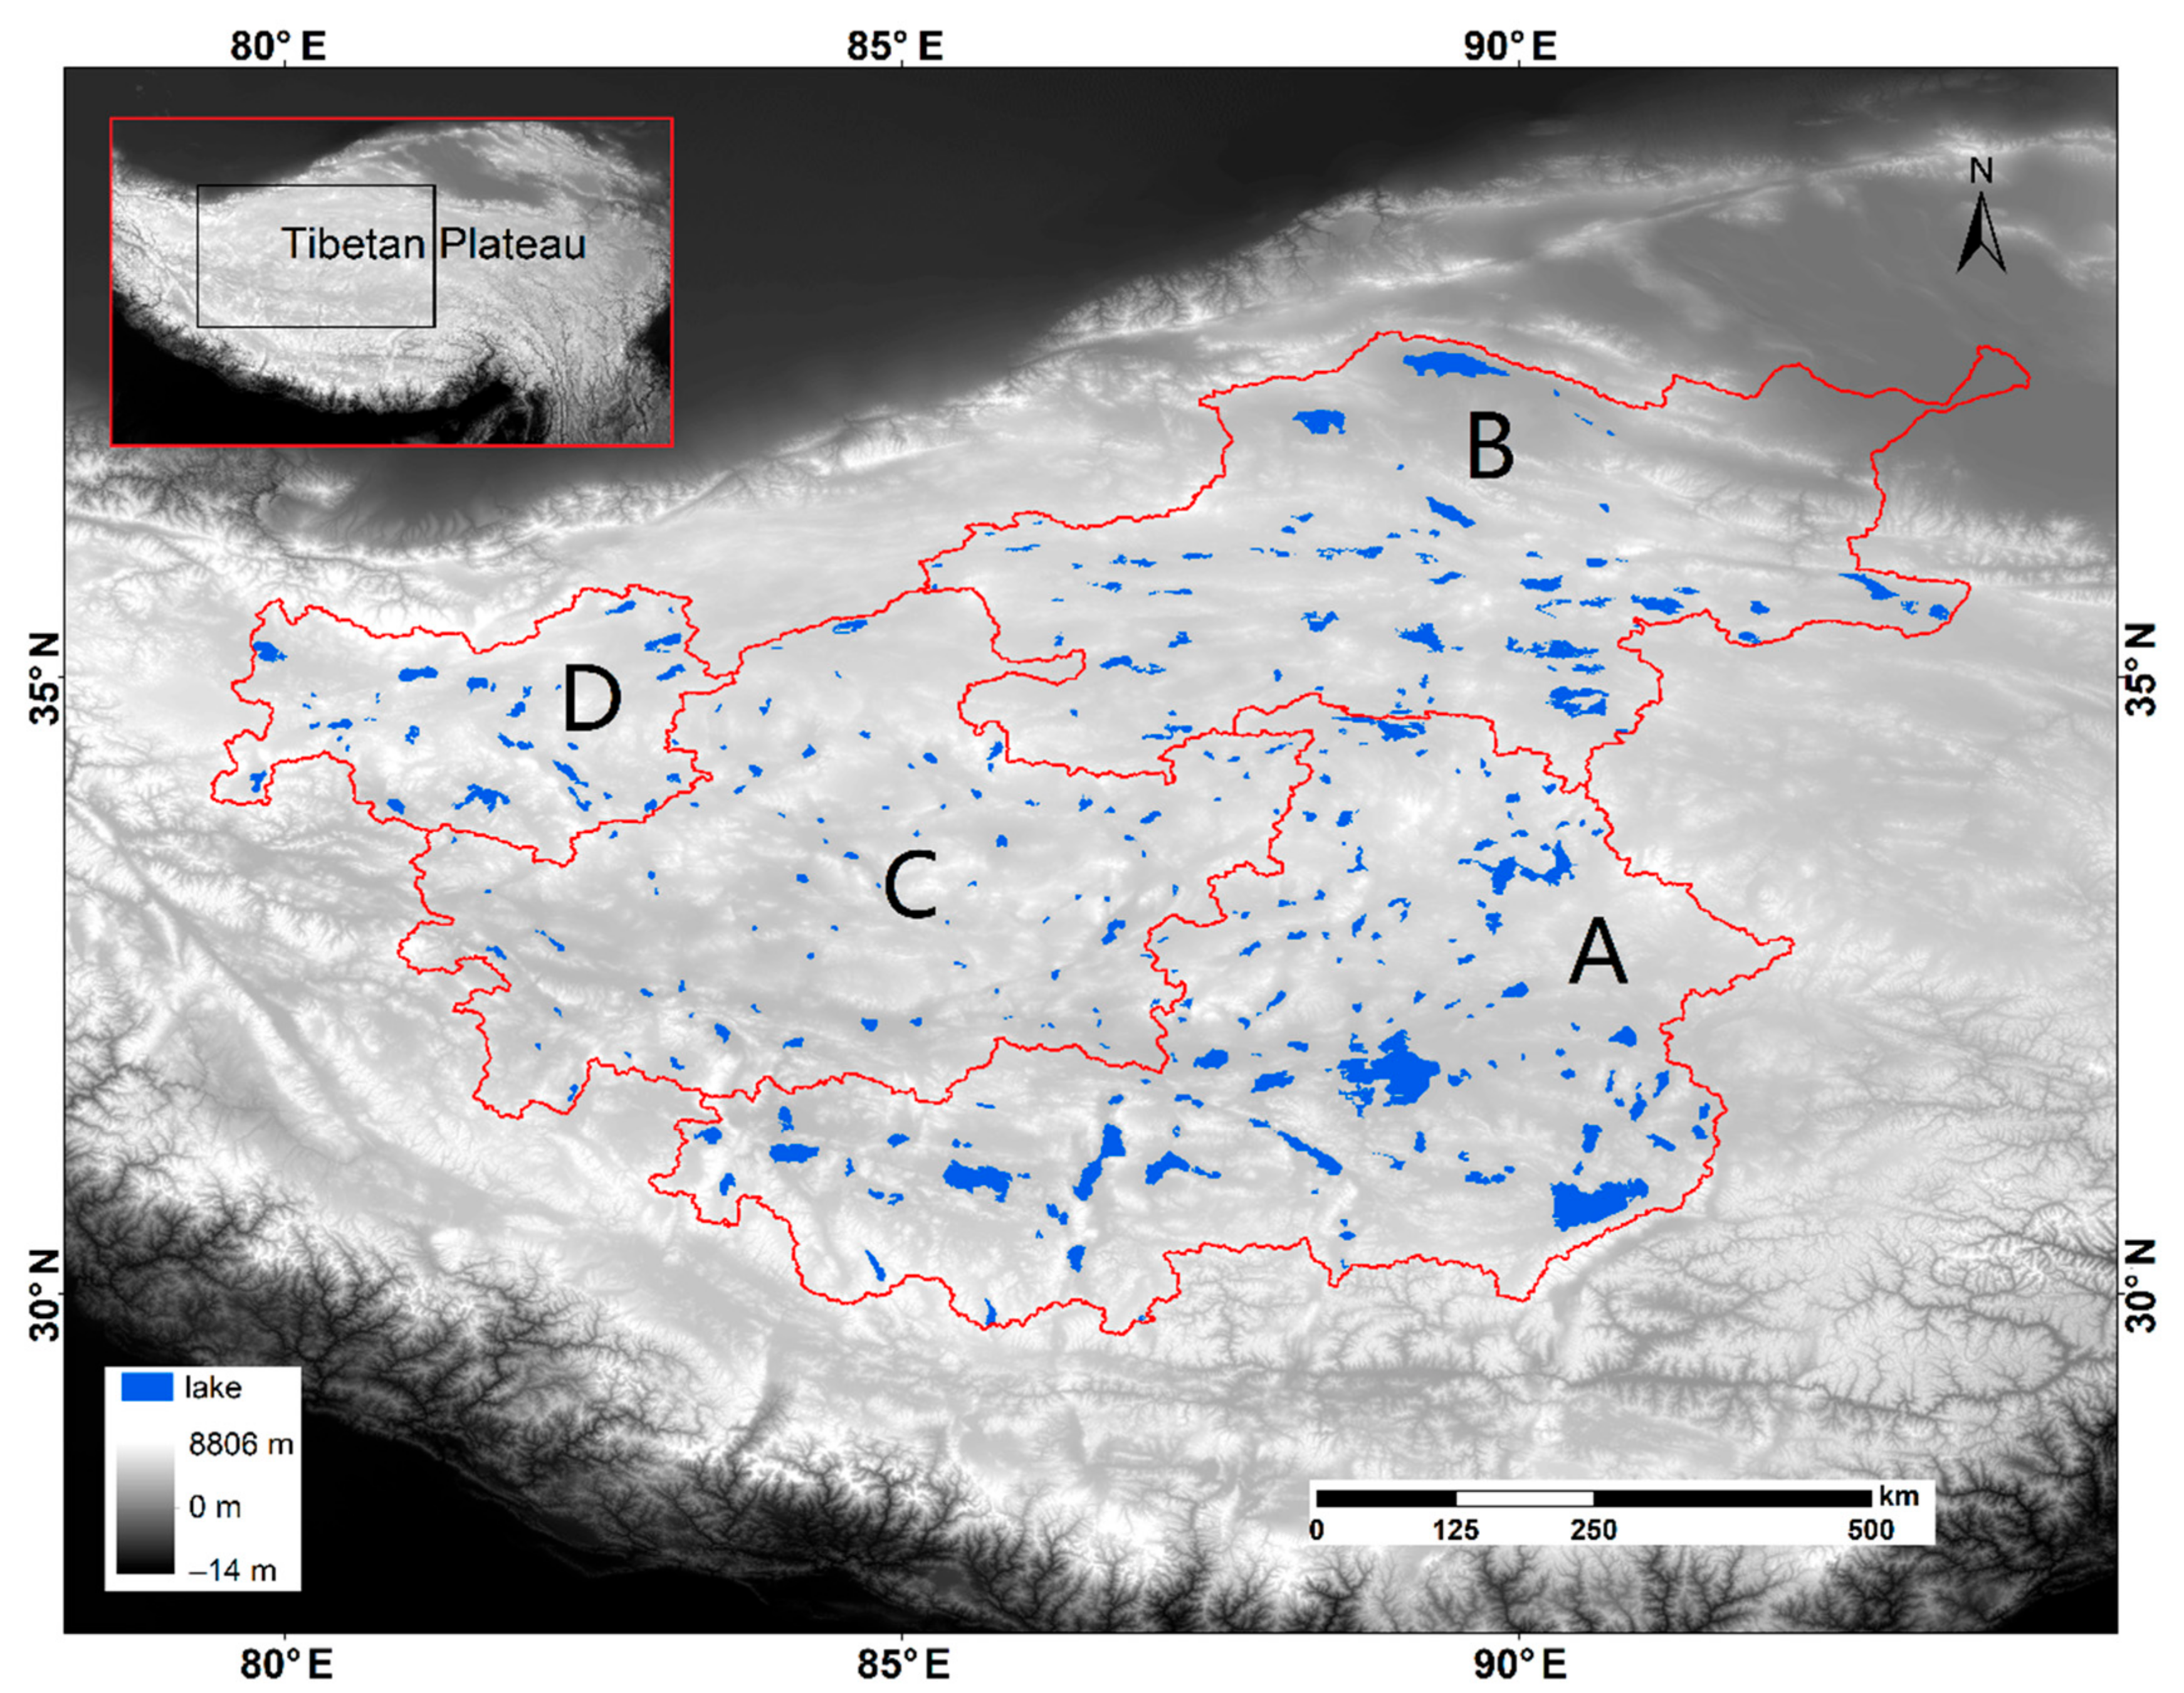
Figure 1.
Location of the study area and distribution of lakes in the inner Tibetan Plateau. A, southeastern part; B, northeastern part; C, the inner part of study region; D, northwestern part.
2. Methods
2.1. Mass Change Based on the Gravity Recovery and Climate Experiment Satellite
The Gravity Recovery and Climate Experiment (GRACE) satellite mission was launched by the National Aeronautics and Space Administration (NASA) and Deutsches Zentrum für Luft- und Raumfahrt (DLR) in March 2002. It has been widely used to estimate vertically integrated TWSC [50,51,52,53,54] and to obtain higher accuracy at larger scales [54]. Generally, TWS consists of soil water, glaciers, snow water, lake water, permafrost, and groundwater [55]. We used the latest CSR GRACE RL06 Mascon Solutions from Save [56] to calculate the change rate of equivalent water thickness for each month from October 2005 to October 2013, and then calculated the rate of TWSC by multiplying by the basin area, available online: http://www2.csr.utexas.edu/grace/RL06_mascons.html (accessed on 19 May 2021).
TWSC is a comprehensive result of changes in different factors, including lake water storage (LWS), glaciers (G), snow water equivalent (SWE), soil moisture (SM), permafrost (PM), and groundwater storage (GWS) [4,55]. The mass budget can be expressed as follows:
ΔTWS is equal to TWSC, ΔLWS is equal to LWSC.
The mass budget for closed lakes in the endorheic basin can be estimated as follows:
where ΔPnet is the net precipitation (total precipitation minus total evaporation) over the lake surface and runoff.
2.2. Extraction of the Lake Area and Estimation of Lake Water Storage Change
2.2.1. Multi-Temporal Landsat Images for Extracting Lake Area
We extracted the lake surface boundary based on multi-temporal Landsat images and downloaded these images from the U.S. Geological Survey (USGS), available online: http://glovis.usgs.gov/ (accessed on 19 May 2021). To reduce the influence of lake surface area seasonal variation, we selected the highest quality images between September and November with the least cloud and snow coverage to calculate lake area. The Normalized Difference Water Index (NDWI) method [57] is used to extract lake area with NDWI = (green-NIR)/(green + NIR), where green represents the green band, and NIR represents the near-infrared band. This method has been widely used to extract lake areas on the Tibetan Plateau [4,16,58], and modifies some incorrect lake boundaries obtained through automatic extraction by manual interpretation.
2.2.2. Estimation of Water Storage Change
The Shuttle Radar Topography Mission (SRTM) acquired digital elevation model (DEM) data for over 80% of the globe during an 11 day mission in February 2000. The absolute vertical and horizontal precision of the SRTM (90 m grid) was 16 m and 20 m, respectively. However, the absolute height error of SRTM varies from 5.6 to 9.0 m worldwide, and the error of Asia is 6.2 m [59]. The levels of most lakes over the Tibetan Plateau have risen since 2000. We acquired the topography above the 2000 lake surface based on the SRTM and calculated the increased lake area when the lake level rose by 1 m. Thus, we estimated water storage change by using an empirical equation with area and level, and then established the relationship between lake area and LWSC. We calculated the water storage change since 2000 when the lake area was known. By comparing with the results of water storage change based on the bathymetry data of five lakes in Yang et al. [58], the average relative error was 4.98%. A comparison of the water storage change results from the SRTM and altimetry data, indicated that the average error between them was 7.2% [60]. The detailed method can be seen in Qiao et al. [16] and Yang et al. [58].
S1 and S2 represent the lake areas for the two periods; Δh represents the lake level change during the two periods; and ΔV represents the water storage change during the two periods.
2.3. Other Materials Used for the Mass Budget Analysis
The active-layer depth (ALD) model is simulated by applying a one-dimensional heat transfer model with phase change on the Tibetan Plateau, including two main forcing variables (snow depth and surface air temperature), which ranged from January 1980 to December 2001 [61]. ALD represents the maximum annual thaw depth, and this model has been used for researching permafrost degradation [4,55].
The Global Land Data Assimilation System (GLDAS) provided a high-resolution and offline terrestrial modeling system based on satellite, ground observations, and a model reanalysis that included snow, land surface temperature, and SM. The data forced four land surface models (Mosaic, Noah, Community Land Model, and Variable Infiltration Capacity). SM dataset was produced from the Climate Prediction Center’s (CPC) monthly precipitation overland from over 17,000 gauges and temperatures from the global reanalysis data [62]. Four models (Mosaic, Noah, Variable Infiltration Capacity, and CPC) are averaged to reduce the model bias [55]. They are used to analyze the changing trend in SM from 2005 to 2013 in this study region.
Most glaciers have experienced severe shrinkage on the Tibetan Plateau, and many researchers have focused on the glacier mass balance [2,9,63,64], and its contribution to lake expansion [65,66]. We collected the glacier mass balance data from previous literature that calculated them according to multi-temporal DEMs. We calculated the average value of all glacier mass balance data in a sub-region to represent the glacier mass balance of this sub-region, and estimated the volume of glacial meltwater based on glacier mass balance data and glacier area from the second Chinese glacier inventory [67].
2.4. The Related Elements for Climate Change
The China Meteorological Forcing Dataset (CMFD) was developed by the Institute of Tibetan Plateau Research, Chinese Academy of Sciences [68], which had been widely used to analyzing climate change over the Tibetan Plateau [13,69,70,71,72]. This dataset covered 1979–2018, merging the meteorological data of 740 operational stations of the China Meteorological Administration (CMA) into the Princeton meteorological forcing data [73], and the Tropical Rainfall Measuring Mission (TRMM) 3B42 precipitation products [74] to produce near-surface temperature, pressure, wind speed, specific humidity, and so on. The temporal and spatial resolutions are 3 h and 1°, respectively. We obtained the annual precipitation and average annual temperature data during the studied period from this dataset.
The Tibetan Plateau has a sparse population, and the accessibility for most of these regions is poor. Lake surface water evaporation is an essential factor in the lake water balance, which may be the only way for water to be removed from closed lakes. However, actual evaporation is challenging to acquire on the Tibetan Plateau, due to the sparse distribution of meteorological stations. The Penman equation [75] has been widely used to estimate open-water evaporation [76]. We used this method to estimate the potential evaporation (Ep) based on data from 57 meteorological stations on the Tibetan Plateau. We estimated the Ep of the study area using the interpolation method of Kriging. We used the daily maximum and minimum temperatures, relative humidity, sunshine duration, and wind velocity at each meteorological station to calculate Ep from 2000 to 2013.
where Rn is daily net radiation (MJ m−2day−1); △ is the slope of the saturation vapor pressure curve (kPa/°C); γ is the psychrometric constant (kPa/°C); D is the vapor pressure deficit (Pa); u2 is the daily average wind speed at the 2 m height (m/s), and λ is the latent heat of vaporization of water (2.45 × 10⁶ J/kg).
3. Results
3.1. Terrestrial Water Storage Change
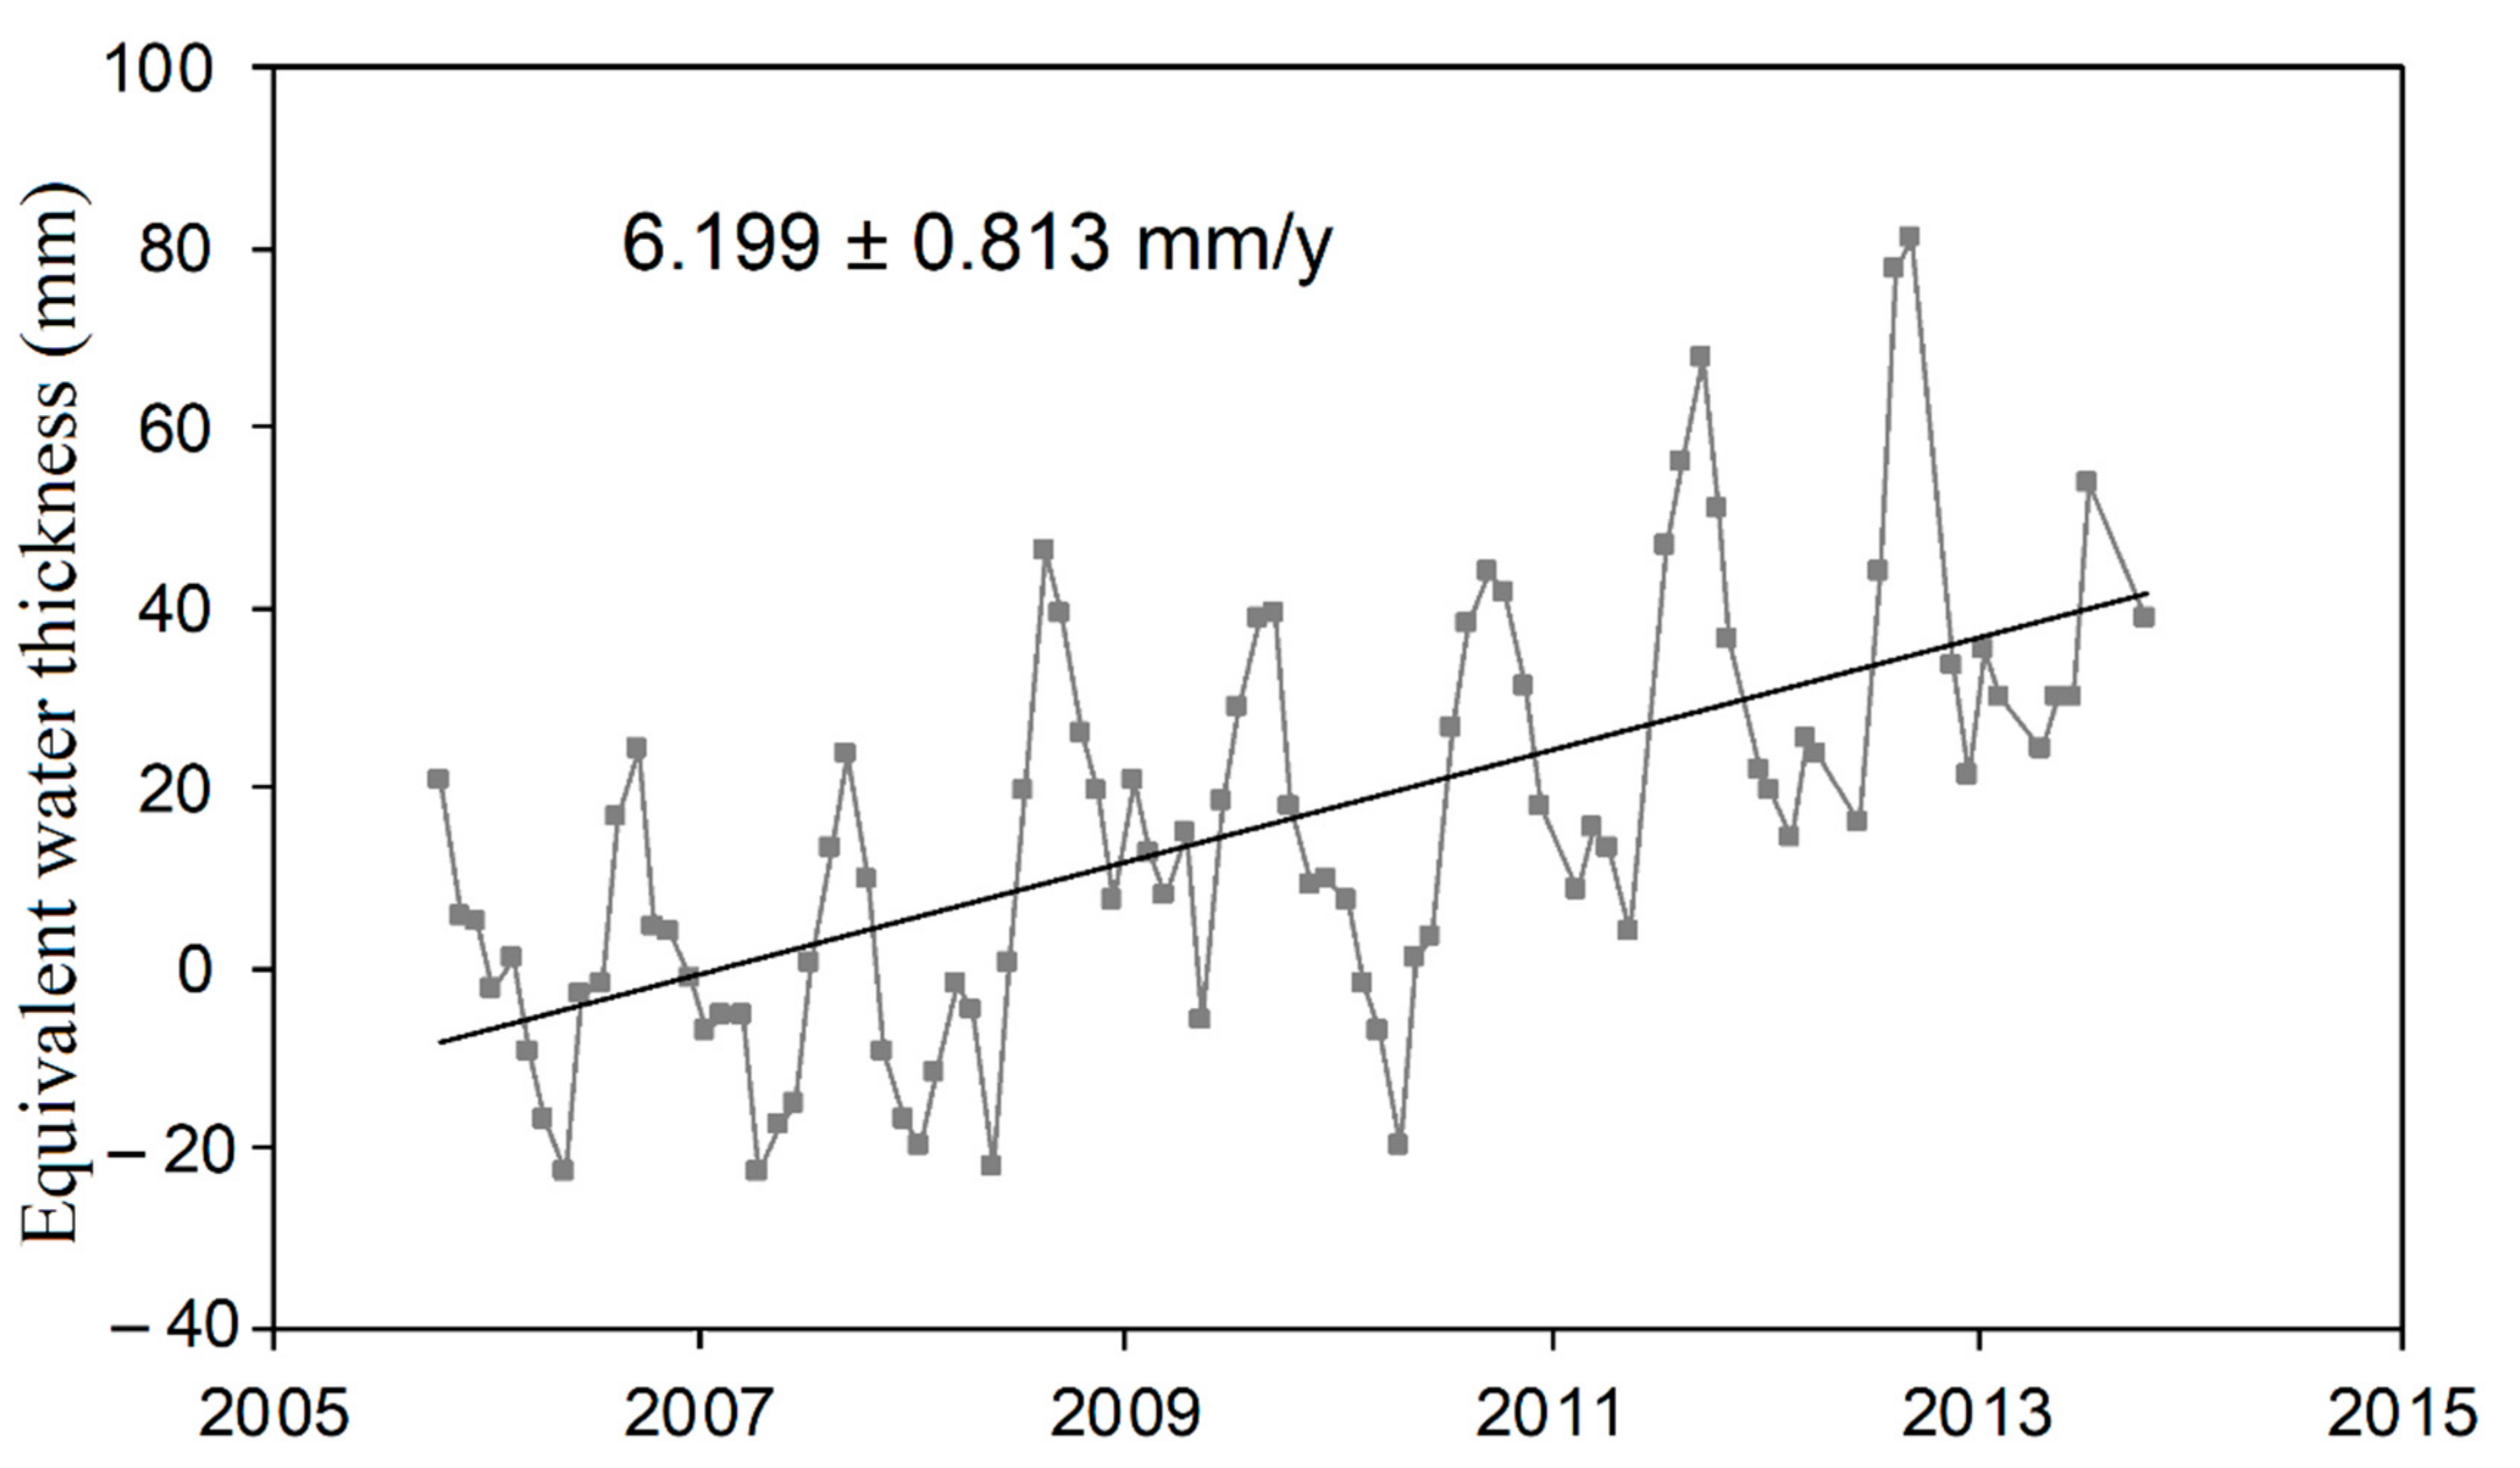
As shown in Figure 2, we calculated the change of equivalent water thickness from October 2005 to October 2013. The results showed that the equivalent water thickness had a significant increasing trend with a rate of 6.199 ± 0.813 mm/y from 2005 to 2013 in this study region (665,908 km2), which was equivalent to a water increase of 33 ± 4.33 Gt with an increasing rate of 4.13 ± 0.54 Gt/y.
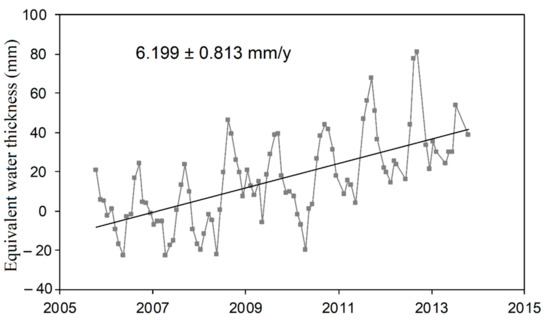
Figure 2.
The changing trend of equivalent water thickness from GRACE data in the inner Tibetan Plateau during 2005–2013.
There was a sizeable spatial difference in TWSC. Increased TWS was mainly concentrated in the northeastern part of this study region, and the smallest increase was in the inner part of this study region. We separated 284 lakes into four sub-regions according to the spatial differences between the LWSC and TWSC (Figure 3). The LWSC was mainly concentrated in the southeastern and northeastern parts of the study region, but the TWSC was mainly concentrated in the northeastern region; thus, we separated this part into two sub-regions based on the basin boundary and named them as region A and region B. The LWSC was little for many lakes in the inner part of this study region, and the increased rate of the TWS was also the lowest in this part, and we named this area region C. The increased rates of the LWS and TWS were much greater than those of region C in the northwestern part of this study region, and we named region D. A, southeastern part; B, northeastern part; C, the inner part of study region; D, northwestern part.
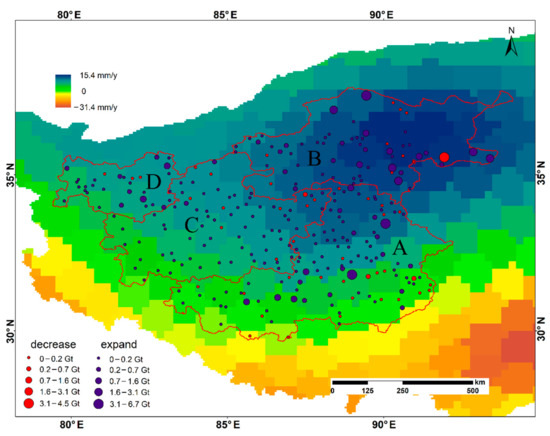
Figure 3.
The spatial distribution of LWSC from SRTM and Landsat image, and TWSC from GRACE data during 2005–2013. The red line represents the boundary of four subregions, and the background represents the changing rate of TWS during 2005–2013.
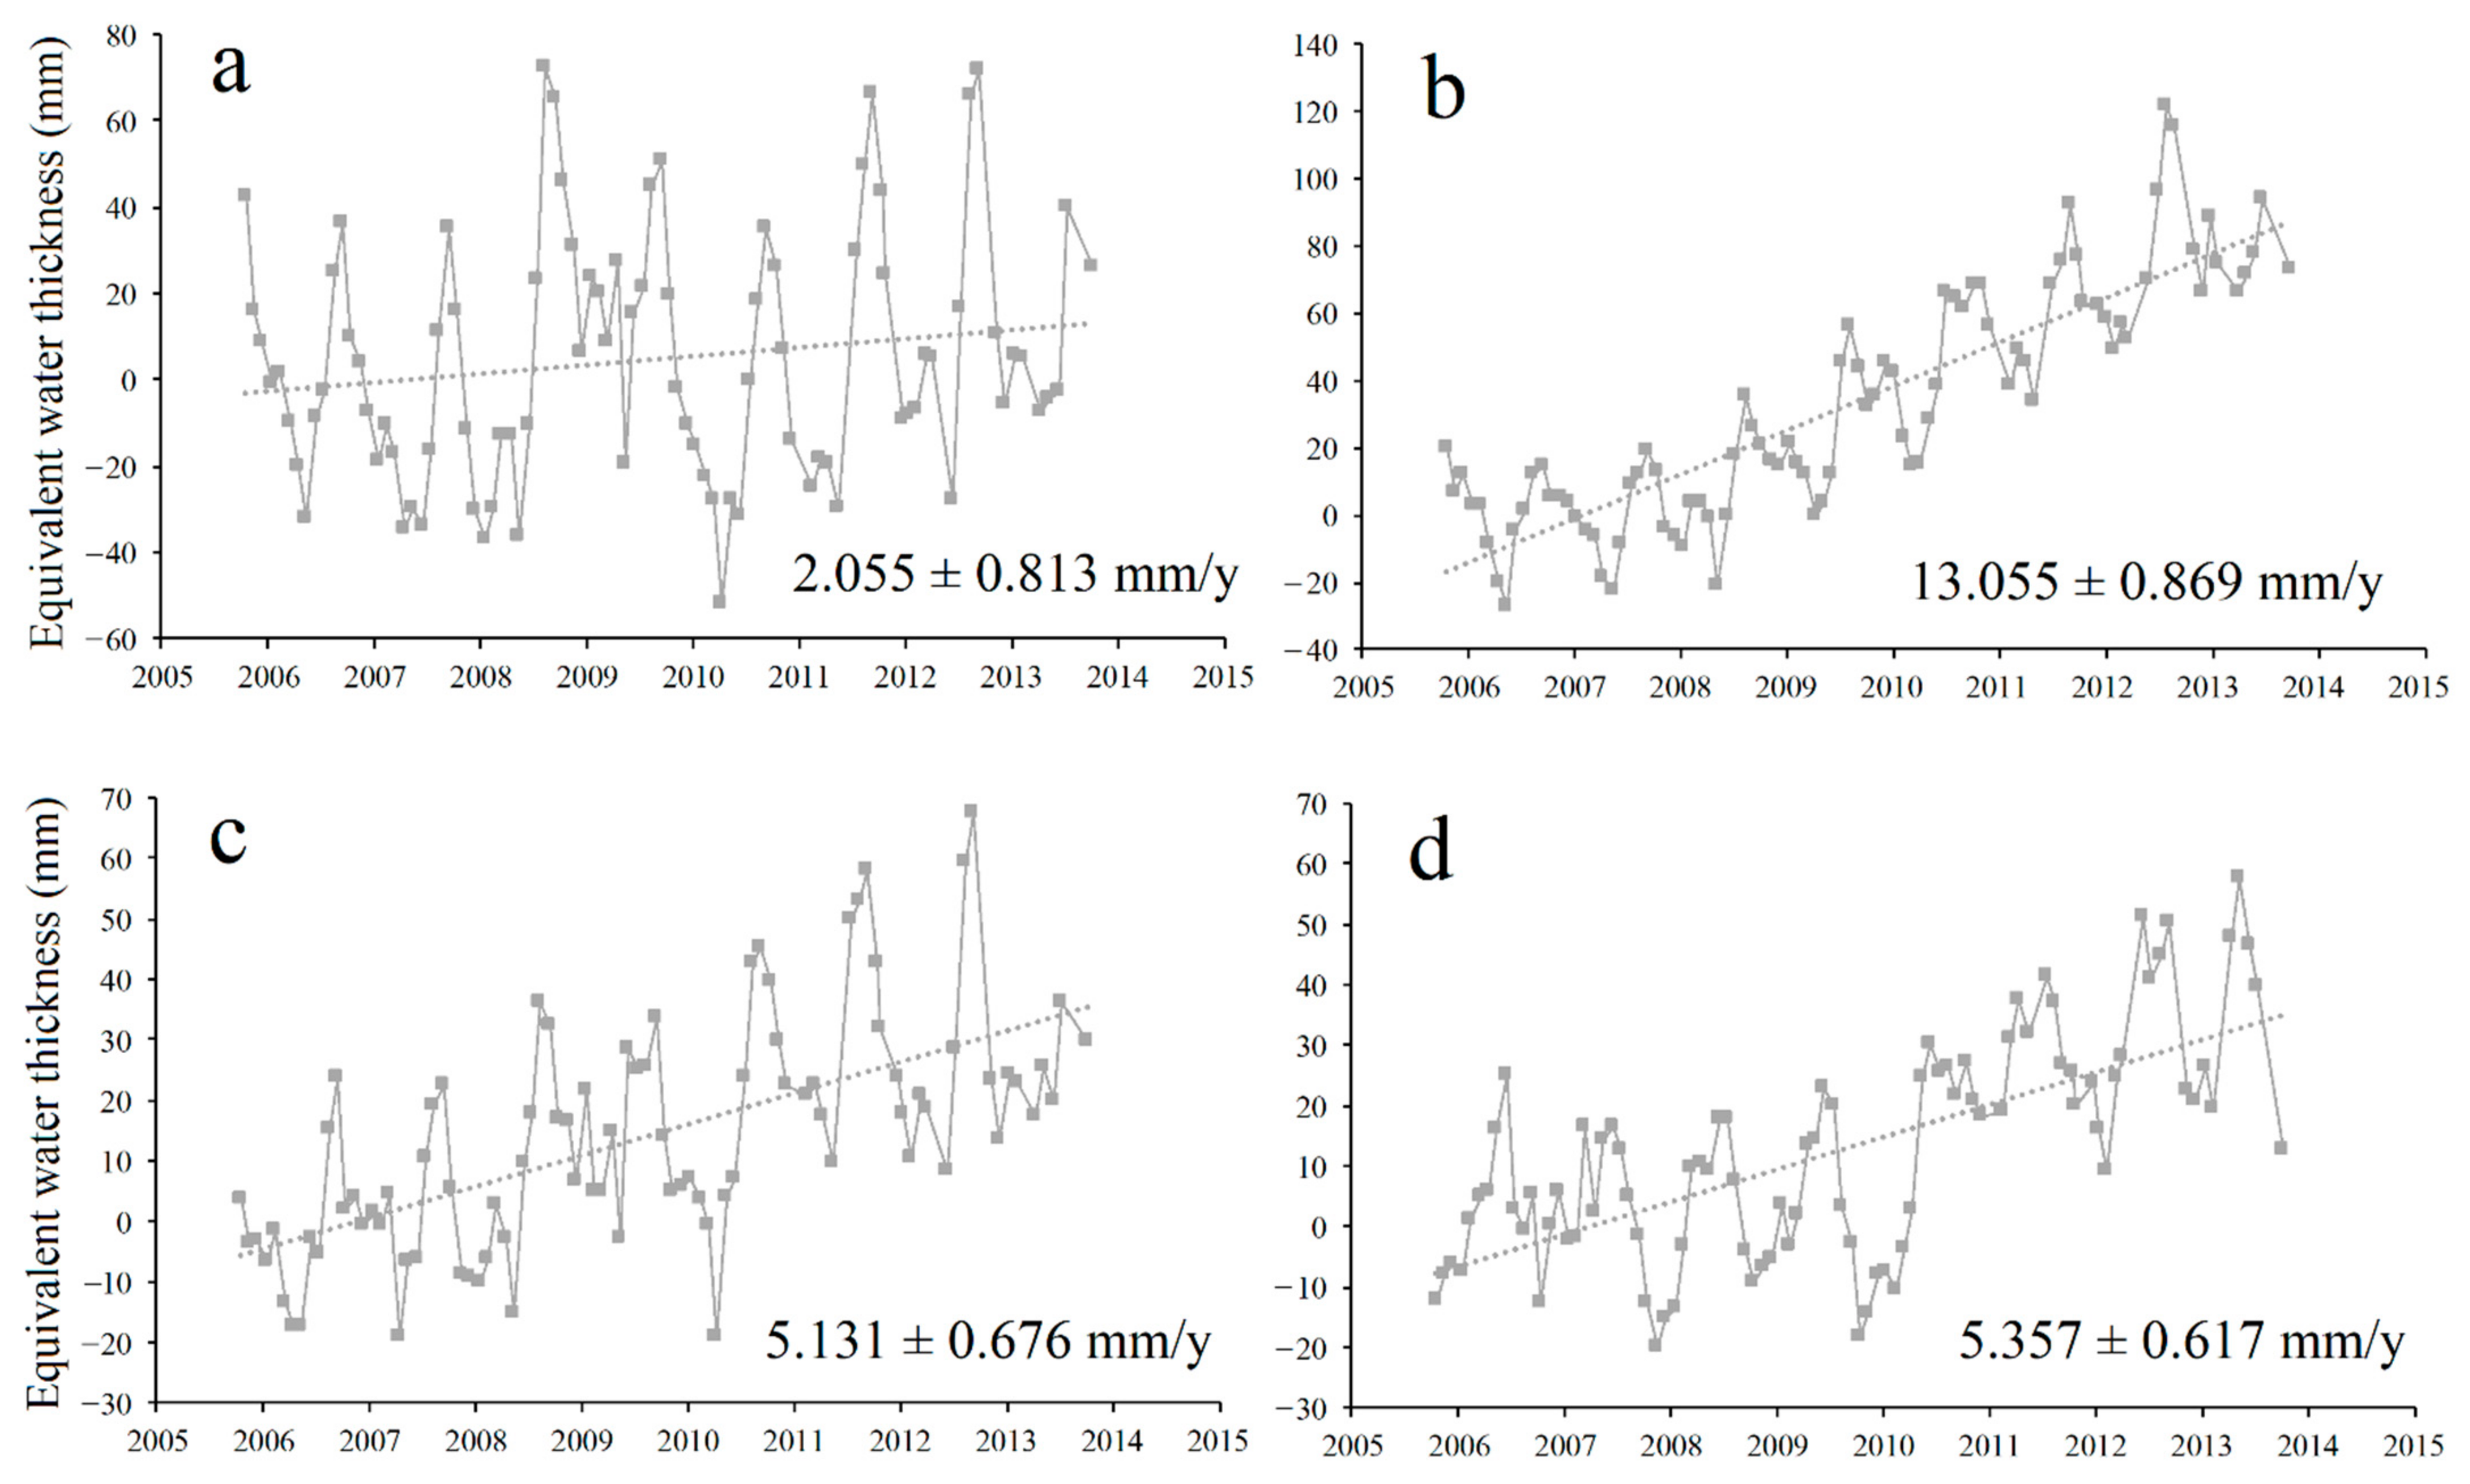
As shown in Figure 4, the increased rates of TWS in the four sub-regions (regions A, B, C, and D) were 2.06 ± 1.3 mm/y, 13.06 ± 0.87 mm/y, 5.13 ± 0.68 mm/y and 5.38 ± 0.62 mm/y, respectively, and the increased TWS was 3.97 ± 2.5 Gt, 18.96 ± 1.26 Gt, 7.57 ± 1 Gt, and 2.5 ± 0.29 Gt, respectively, according to the basin area. The increased water storage of regions B and C accounted for 80% of the total increased water storage, and the increased water storage of region D was the smallest.
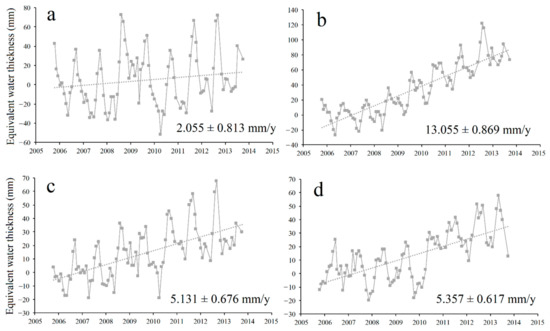
Figure 4.
The changing trend of equivalent water thickness from GRACE data for the four subregions (a–d) in the inner Tibetan Plateau during 2005–2013.
3.2. Lake Water Storage Change
The areas of 284 lakes, which each of the lakes was larger than 10 km2, were calculated. There were 113 lakes in region A, 62 lakes in region B, 79 lakes in region C, and 30 lakes in region D. The total lake area increased by 1296.7 km2 (28.59 km2/y) from 2005 (28,245.2 km2) to 2013 (30,505.91 km2), and the LWS increased by 49.69 ± 3.58 Gt with an increased annual rate of 6.21 ± 0.45 Gt/y, which was much more than the amount of TWS increase (4.13 ± 0.54 Gt/y). Most lakes experienced a quick increase in the inner Tibetan Plateau, and only a few lakes showed a shrinkage trend, which was mainly distributed in the southeastern and northeastern parts of the study region. 26 lakes in region A had a decreasing trend with total decreasing water storage of 1.39 Gt, and the total LWS increased by 22.68 ± 1.63 Gt; the LWS of 8 lakes decreased by 4.66 Gt in the region B, and the total LWS increased by 18.71 ± 1.35 Gt; 4 lakes in region C decreased by 0.02 Gt water storage, and the total LWS increased by 2.89 ± 0.21 Gt; finally, three lakes in region D decreased by 0.06 Gt of water storage, and the total LWS increased by 5.41 ± 0.39 Gt. The increased LWS was mainly concentrated in region A and region B, and there was only a small LWS increase in small lakes in region C.
As shown in Table 1, the increased lake area of region B was approximately 1.5 times that of region A, but the increased LWS was only 82% of that in region A; the increased lake area of region A was approximately 2.5 times that of region C, but the increased water storage was approximately 7.8 times that in region C. This result indicated that lake area change could not represent the real difference in lake change, due to the different topography around lakes.

Table 1.
The change of lake area and lake water storage from 2005 to 2013 based on Landsat images and SRTM.
3.3. Change Trends in Other Related Factors
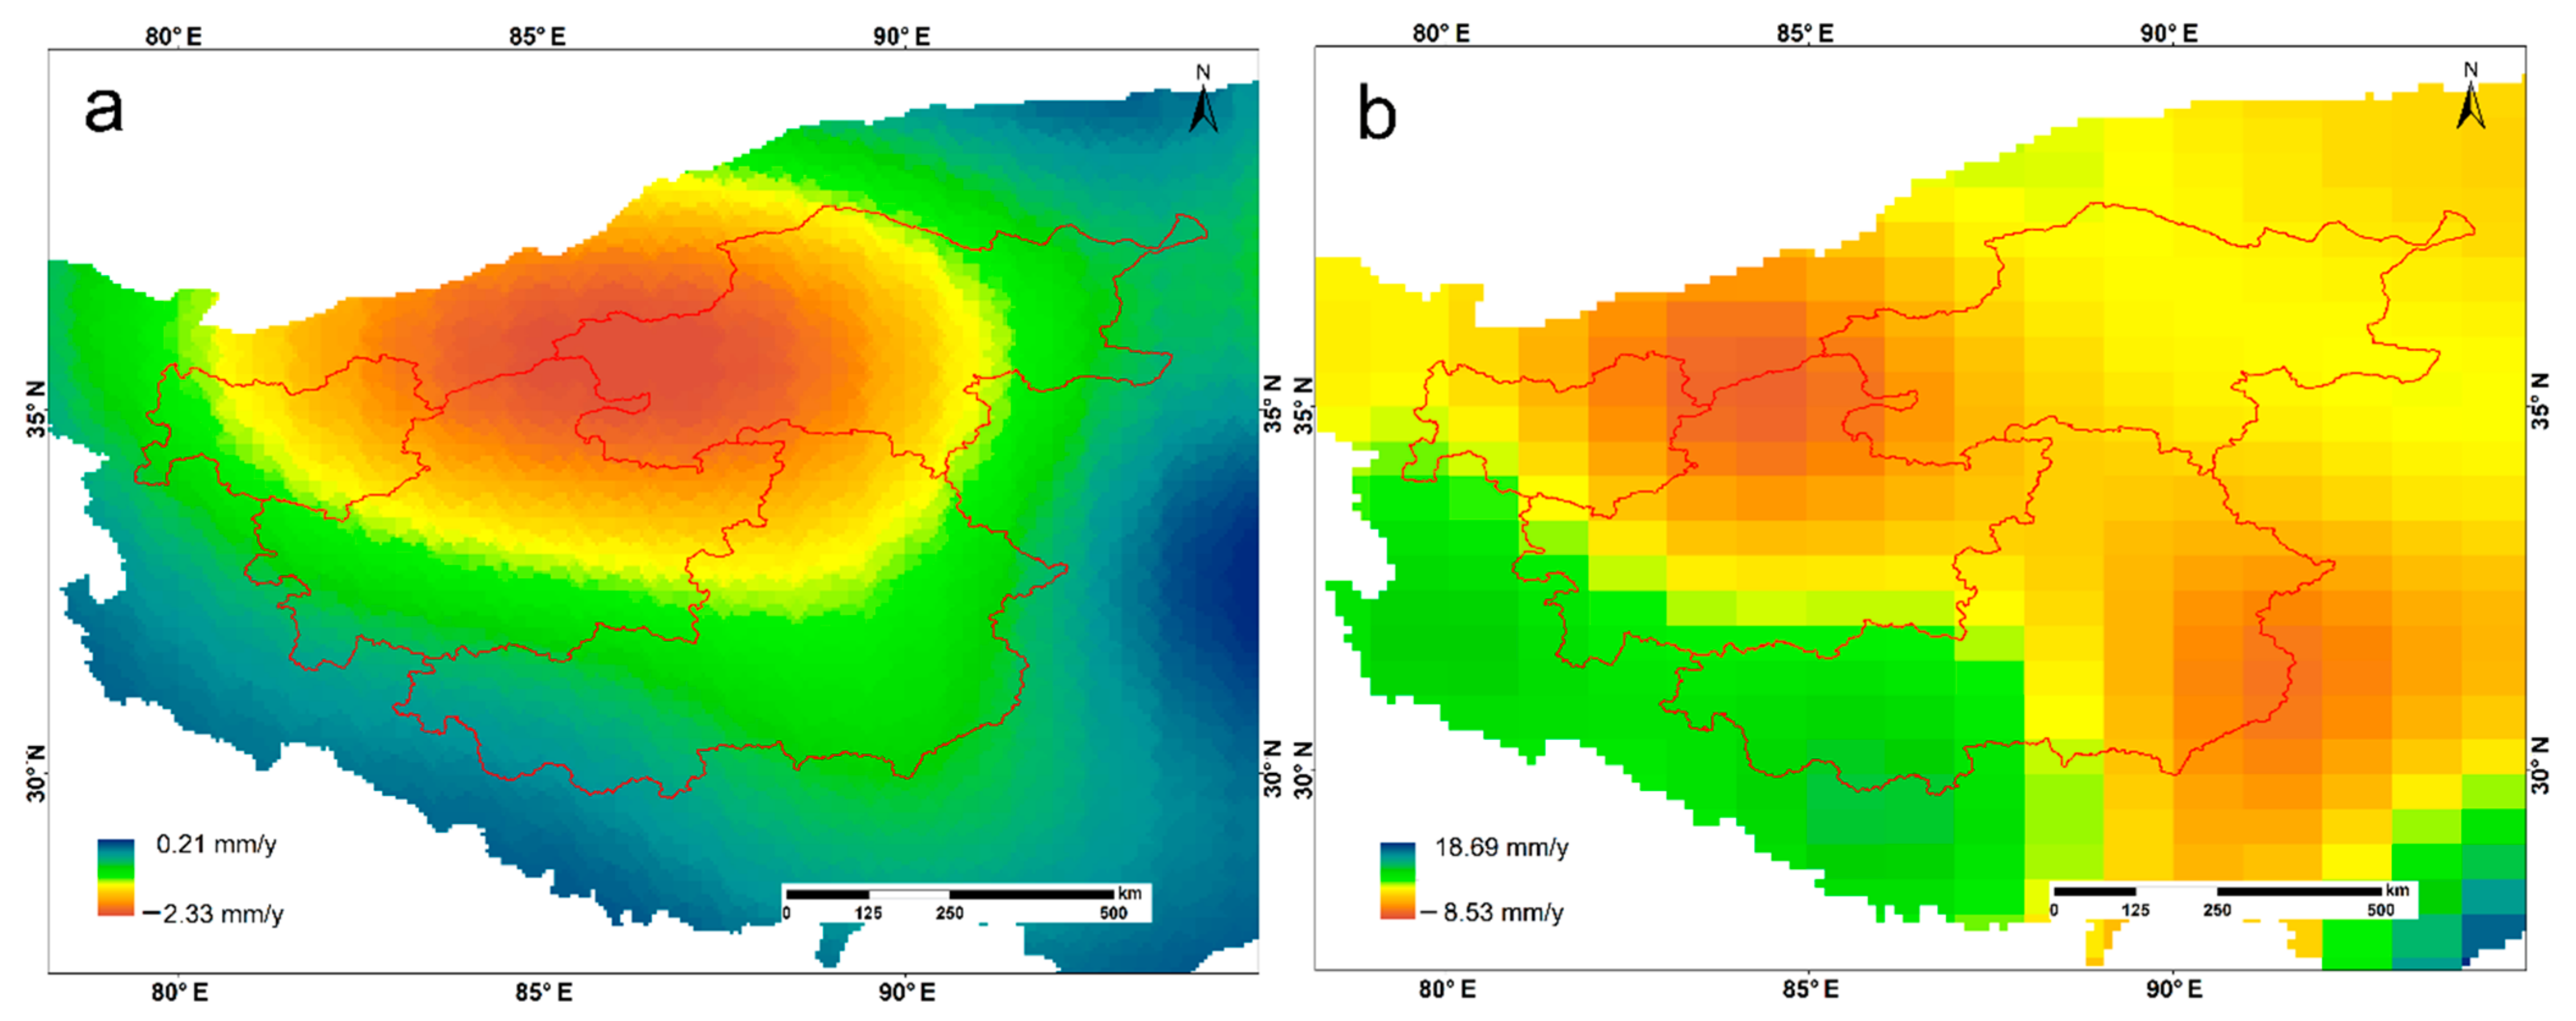
We analyzed the changing trend in permafrost based on the ALD model. The results indicated that the active layer depth of permafrost increased, especially for the northern part of this study region (Figure 5a). The increased rates of ALD for the four regions (region A, region B, region C and region D) were 0.9 ± 0.45 mm/y, 1.61 ± 0.8 mm/y, 1.34 ± 0.67 mm/y, and 1.38 ± 0.69 mm/y, respectively. As the basin area of each region was known, it was equivalent to release 1.74 ± 0.87 Gt, 2.34 ± 1.17 Gt, 1.97 ± 0.98 Gt, and 0.65 ± 0.32 Gt permafrost meltwater, respectively, during 2005–2013 by multiply basin area and eight years.

Figure 5.
The changing trend in ALD and soil moisture. (a) ALD; (b) soil moisture.
There was a sizeable spatial difference in the changes of SM, the decreasing SM was mainly concentrated in the northwestern and southeastern parts of the study area, and other regions showed an increasing trend from 2003 to 2013 (Figure 4b). The changing trend of SM for all basins was 1.418 ± 0.555 mm/y, and the change rates of SM for regions A, B, C, and D were 1.63 ± 0.64 mm/y, 0.59 ± 0.23 mm/y, −0.15 ± 0.06 mm/y, and −0.81 ± 0.32 mm/y, respectively. The results showed increases or releases of 3.14 ± 1.26 Gt, 0.86 ± 0.34 Gt, −0.23 ± 0.09 Gt, and 0.38 ± 0.16 Gt water during the same period, respectively.
As shown in Equation (1), we calculated the changes of groundwater when the changes of TWS, LWS, SM, permafrost, and glacial meltwater were known. The results indicated that the groundwater in region A had decreased by 16.91 ± 7.26 Gt, and region B, region C, and region D had increased by 4.47 ± 4.87 Gt, 7.68 ± 2.63 Gt, and 1.88 ± 1.08 Gt, respectively.
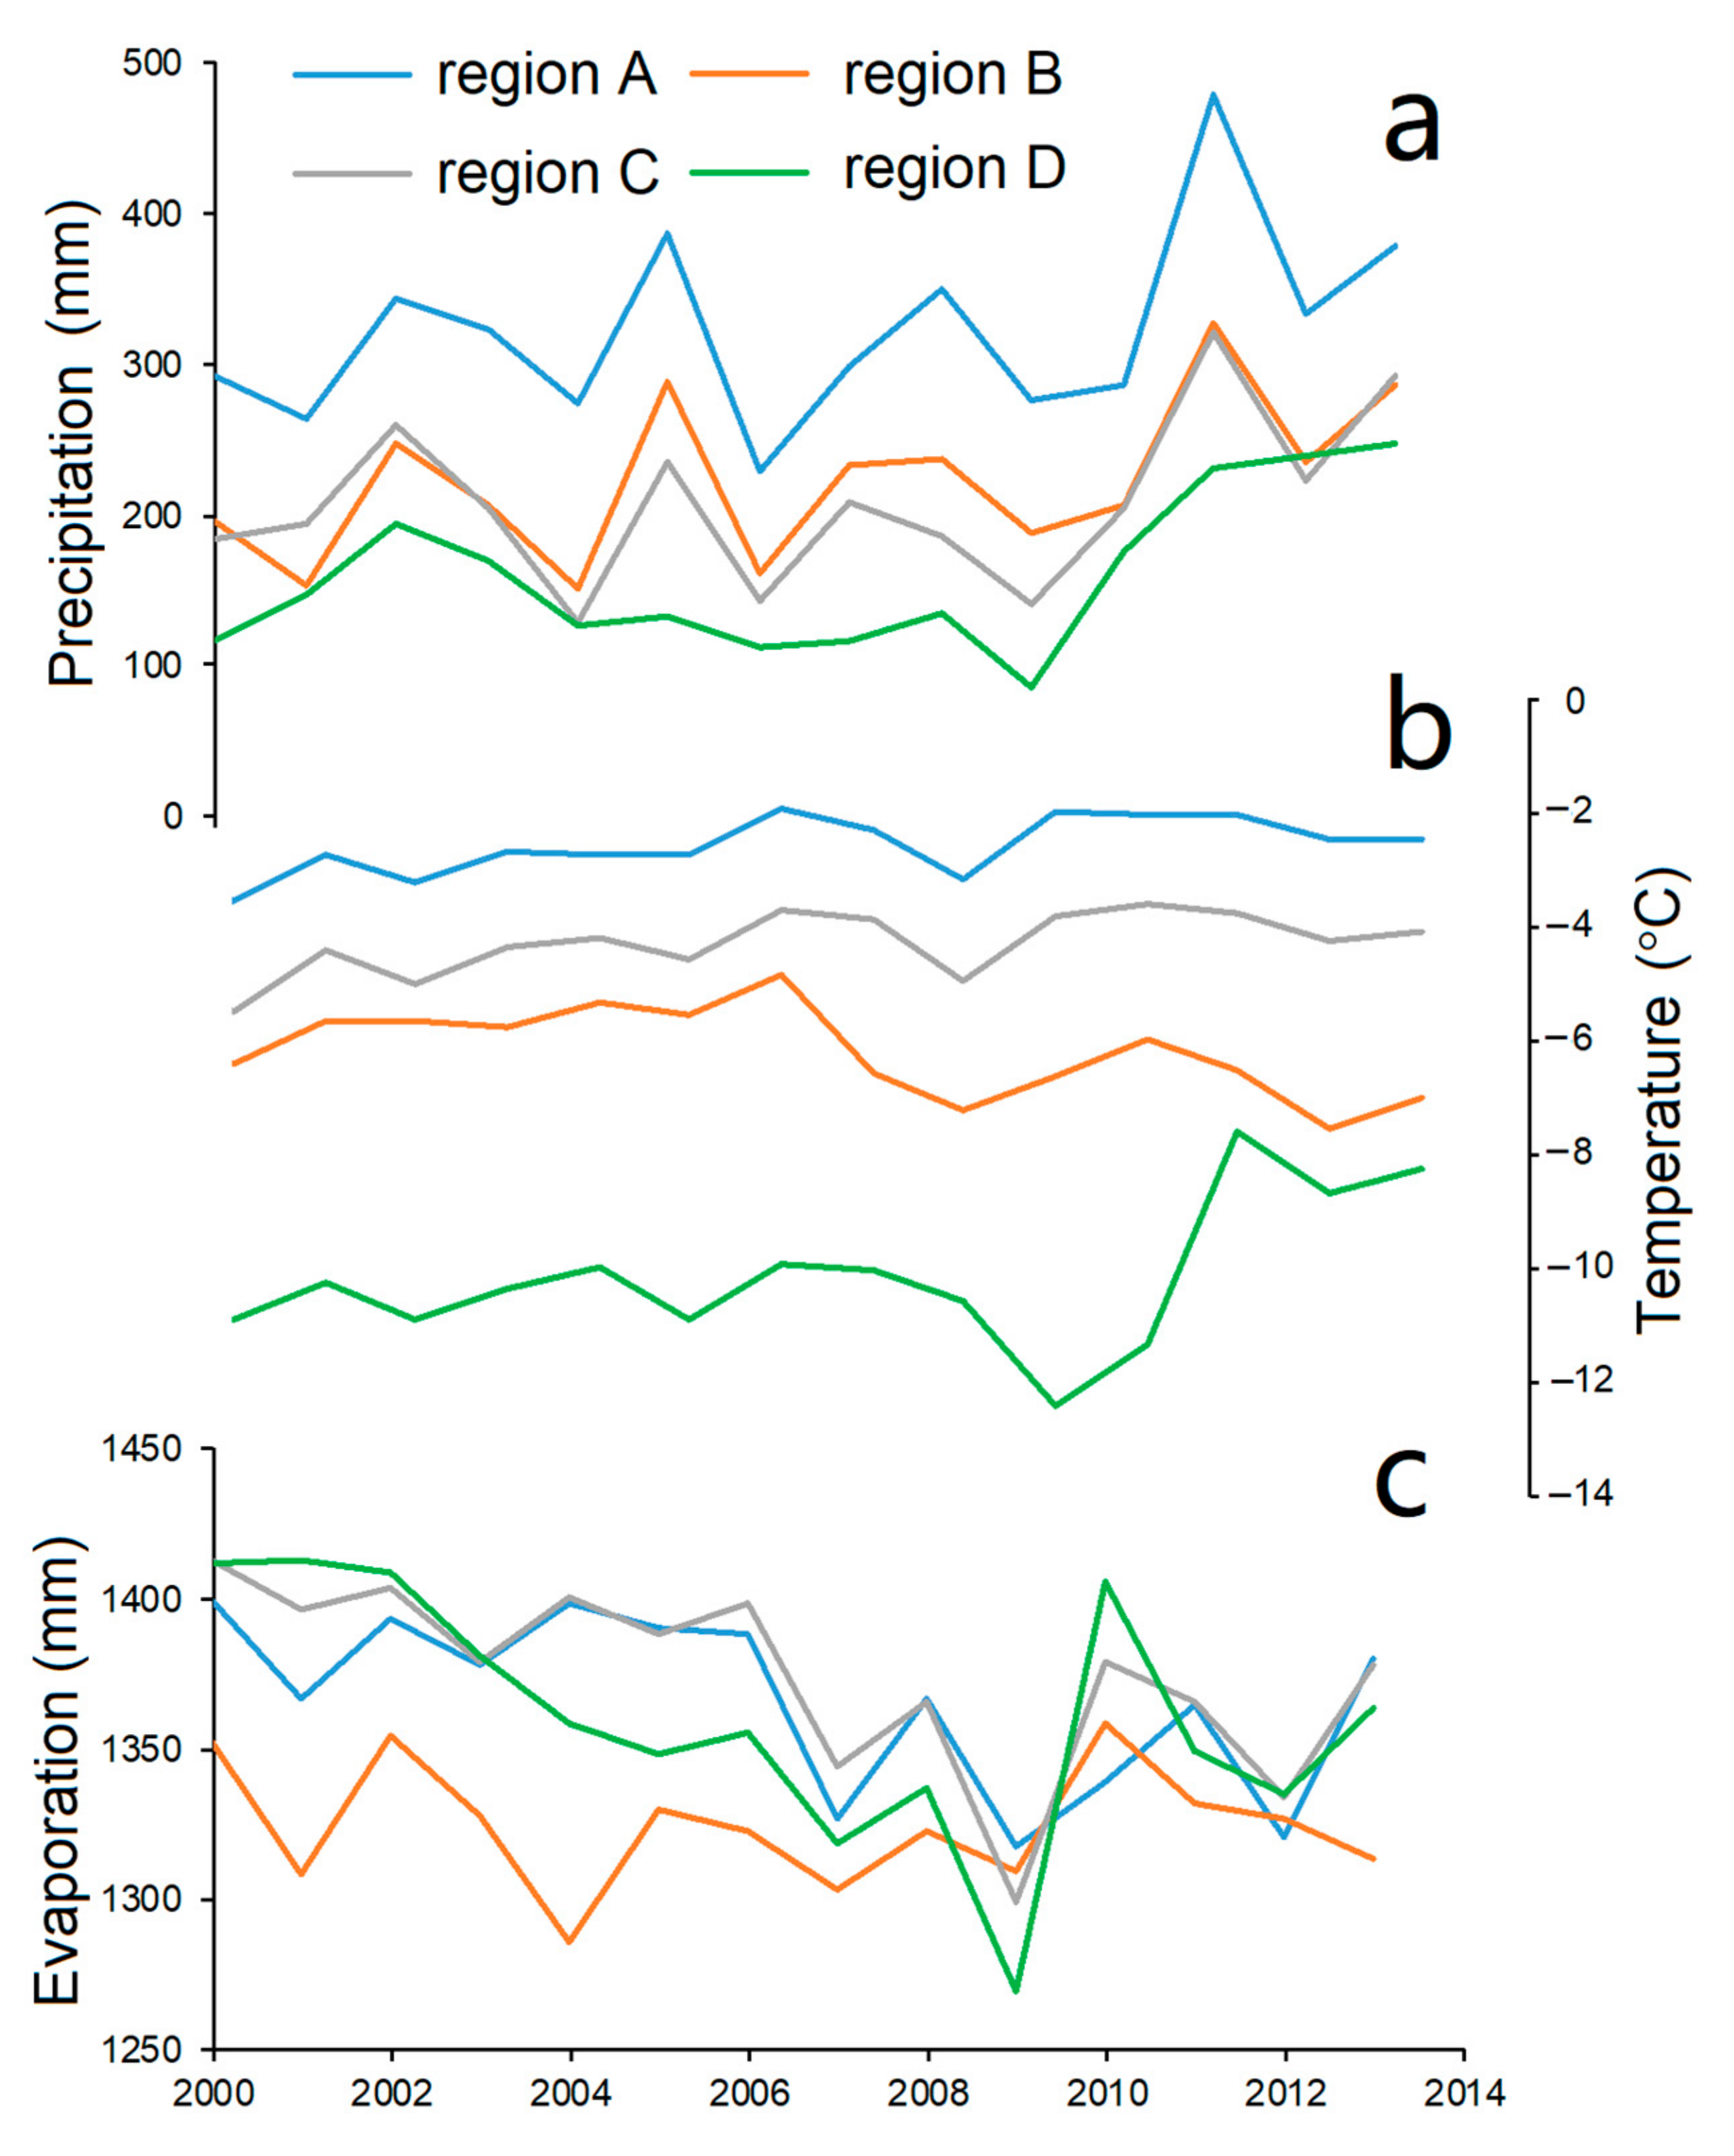
As shown in Figure 6, we analyzed the changing rate of annual precipitation, average annual temperature, and annual evaporation during 2000–2013. Precipitation showed a significantly increasing trend, especially for regions A and D. The average annual precipitation of region A was the highest (322 mm/y), and region D was the lowest (159 mm/y). Annual precipitation of regions B and C were 222 mm/y and 209 mm/y, respectively. The annual temperature had a rising trend, except for region C. The annual temperature of region A was the highest (−2.66 °C), and region D was the lowest (−10.25 °C), which was similar to the annual precipitation. The average annual temperature in region B showed a decreasing trend. The annual evaporation showed a significant decreasing trend, and the annual evaporation values in regions A, C, and D were consistent (~1370 mm/y), and region B was the lowest (1325 mm/y) among these regions.
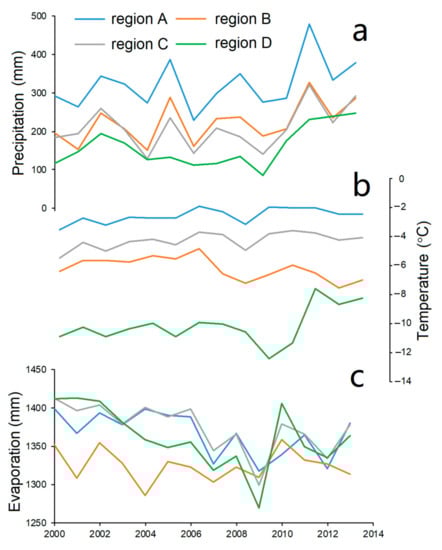
Figure 6.
Variation in meteorological elements from 2000 to 2013. (a) precipitation; (b) temperature; (c) evaporation.
4. Discussion
4.1. Spatial Difference between TWSC and LWSC
TWSC is the comprehensive result of inputs and outputs, including precipitation, evaporation, groundwater, and glacial meltwater or permafrost meltwater cannot increase TWS because it only transforms from solid to liquid in a closed basin. As shown in Figure 3, increased TWSC and LWSC were primarily concentrated in the northeastern and eastern regions, respectively. There was a large spatial difference between LWSC and TWSC. Table 2 revealed that the increased LWSC was approximately five times the increased TWSC in region A, and region D was approximately twice that of the LWSC; and the increased TWSC in region B was equivalent with the increased LWSC, and region C was approximately double of the LWSC.
Table 2.
Changes and uncertainty of different factors in four regions during 2005–2013.
To further analyze the spatial difference, we calculated the average changes in TWSC and LWSC for each small drainage basin (TWSC or LWSC/basin area, mm or km3/km2) from 2005 to 2013, assigned the difference (TWSC/basin area–LWSC/basin area) to each basin, and then transferred these data to the raster images (Figure 7). The results showed that there was a large spatial difference between TWSC and LWSC. The average change in the LWSC for most basins was close to the TWSC, except for several basins of northwestern and northeastern, which was much greater than that of TWSC. Due to several lakes showed a shrinkage trend with decreasing water storage during the study period and the TWS showed an increasing rate, there were several small dark blue regions in the central and northeastern regions of the study region. Further quantitative analysis is needed regarding the relationship between TWSC and LWSC because TWSC includes several factors.
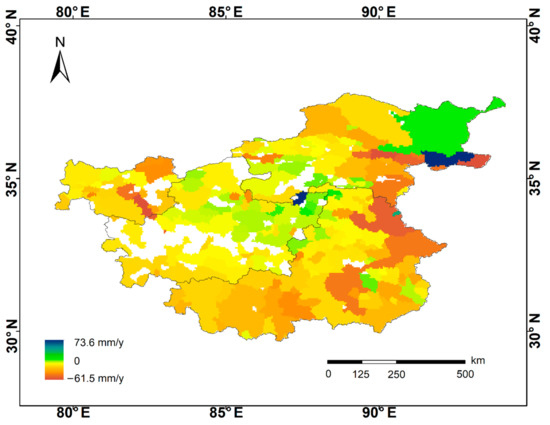
Figure 7.
The difference between terrestrial water storage change and lake water storage change (TWSC–LWSC).
4.2. Climate Factors
The resources of inner Tibetan Plateau precipitation are mainly from the Indian monsoon, East Asian monsoon, and Westerlies [2]. Precipitation has shown an increasing trend in recent decades, according to meteorological station data and models [26,27]. As shown in Figure 5a, increased precipitation could make an important contribution to the TWSC and LWSC during this period. Even though the average annual precipitation in region A (322 mm/y) was the highest among these four regions, which was approximately 1.5 times that in region B (222 mm/y), the increased rate of equivalent water thickness in region B (15.26 mm/y) was the highest, which was approximately 2.5 times that in region A (6.39 mm/y), indicating that increased precipitation was not the only cause of increased TWS. The rising temperature would accelerate glacier melt, and glacial meltwater would supply lakes and rivers. However, increased glacial meltwater would not increase the TWS, which simply transformed from solid to liquid, and it would decrease the TWS, due to evaporation during the runoff process. Decreasing evaporation had a positively influence on the TWSC and LWSC, which reduced water out from the lake surface and runoff water, so that much more water was stored in the lake.
4.3. Mass Budget Analysis
4.3.1. Glacial Meltwater
Most glaciers over the Tibetan Plateau have experienced serious retreat in recent decades based on satellite data and field measurements of glacier mass balance [2,9,77,78], and the area of all glaciers on the Tibetan Plateau interior (7270 km2 in 2009) has decreased by 9.5% since the 1970s [79]. Increased glacial meltwater may have made an essential contribution to lake expansion, but it could not increase the TWS of the inner Tibetan Plateau, and a portion of glacial meltwater could be removed by evaporation and decrease the TWS.
Glacier mass balance has been widely researched based on different methods, e.g., glaciological methods from in situ observation, geodetic methods from multi-temporal DEMs or altimetry data, albedo-based methods from MODIS data, and physical model-based methods [80]. Data on glacier mass balance based on in situ observations are lacking, due to complex conditions and remote locations with small coverage, and altimetry data only cover some regions of the glacier surface. However, using the multi-temporal DEMs to estimate glacier mass balance could cover the total study region of a glacier or several glaciers. The glacier mass balance of the central Kunlun glaciers according to multi-temporal DEMs was −0.16 ± 0.05 m w.e.year−1 and [66], which was close to Brun et al. [1] with −0.15 ± 0.04 m w.e.year−1 during 2000–2016, but less than the results from ICESat data with −0.77 ± 0.35 m w.e.year−1 [9]. The Geladandong glaciers’ mass balance based on multi-temporal DEMs from 2000 to 2012 was −0.128 ± 0.049 m w.e.year−1 [81], which was close to Brun et al. [1] and Liu et al. [63], who used the same method, but less than the result from ICESat data, which was −0.58 ± 0.31 m w.e.year−1 [9]. The glacier mass balance based on multi-temporal DEMs had a much broader coverage than those from ICESat, which has small coverage. We used the results from this method to study the average glacier mass balance of our study region in this study.
Glacier areas of regions A, B, C, and D from the second Chinese glacier inventory during 2006–2010 were 1906.4 km2, 2136.8 km2, 688 km2, and 2715.8 km2, respectively [67]. The glacier areas of Puruogangri (420 km2), Geladandong (352 km2), and Nyainqntanglha (170 km2) accounted for 49% of the total glacier area of region A, and the mass balance was −0.269 ± 0.025 m w.e.year−1 [63], −0.128 ± 0.049 m w.e.year−1 [81], and −0.268 ± 0.129 m w.e.year−1 [65], respectively, during the recent decade, which calculated the average mass balance of these glaciers (−0.21 ± 0.053 m w.e.year−1) as the value of the glacier mass balance in this region. We selected the result (−0.16 ± 0.05 m w.e.year−1) from Zhou et al. [66] as the average glacier mass balance of region B, and glacier area of that study (967 km2) accounted for 45% of the total glacier area in region B. Due to the lack of glacier mass balance data of region C, we selected the average value of the inner Tibetan Plateau (−0.14 ± 0.07 m w.e.year−1) from Brun et al. (2017) as the mass balance. The glacier area of west Kunlun in region D is the largest among these regions. The mass balance of these glaciers was positive based on ICESat data and in situ observation [2,9]. Zhang et al. [81] suggested that glacier mass balance was approximately 0 in this region based on high-resolution KH-9 and TanDEM-X data. Glacial meltwater during 2005–2013 in regions A, B, C could be estimated as −3.2 ± 0.8 Gt, −2.74 ± 0.85 Gt, and −0.77 ± 0.39 Gt, respectively, according to the results of glacier mass balance.
4.3.2. Total Mass Budget
Previous studies indicated that increased LWS and groundwater were the primary cause of increased TWS on the Tibetan Plateau according to remote sensing data (GRACE, ICESat, Landsat) and model data [4,7,15]. SWE had a smaller magnitude than other factors (e.g., permafrost meltwater, TWSC, and LWSC), so SWE was not considered in this study [7]. For the entire study region, the changes in TWS, LWS, glacial meltwater, permafrost degradation, and SM were 33 ± 4.33 Gt, 49.69 ± 3.58 Gt, −6.71 ± 2.04 Gt, −6.7 ± 3.3 Gt, and 3.36 ± 1.77 Gt, respectively, and groundwater had increased by 6.64 Gt based on the mass balance.
There was a large spatial difference between the LWSC and TWSC. According to the mass balance, the groundwater in region A decreased by 16.91 ± 7.26 Gt during 2005–2013, and regions B, C, and D increased by 4.47 ± 4.87 Gt, 7.68 ± 2.63 Gt, and 1.88 ± 1.08 Gt, respectively (Table 2). For region A, the increased LWS (22.68 ± 1.63 Gt) was the primary cause of increased TWS (3.97 ± 2.5 Gt), and followed by increased SM (3.14 ± 1.46 Gt), which was also an important factor affecting the increase in TWS in region A and decreasing groundwater (16.91 ± 7.26 Gt) had a large negative contribution to TWS. For region B, the increased LWS (18.71 ± 1.35 Gt) was the primary cause of the increased TWS (18.96 ± 1.26 Gt), followed by increased groundwater (4.47 ± 4.87 Gt). The increased groundwater (7.68 ± 2.63 Gt) was the primary cause of increased TWS (7.57 ± 1 Gt) in region C, followed by an LWS increase of 2.89 ± 0.21 Gt. For region D, increased LWS (5.41 ± 0.39 Gt) was the main reason for increased TWS (2.5 ± 0.29 Gt). There are large spatial gradients about the change of TWSC and the relationship between TWSC and LWSC. Increased TWS is mainly concentrated in region B in which it is approximately equal to the increase in LWS, but the increased LWS is mainly concentrated in region A and B, and the increase in LWS is five times that of the increase in TWS in region A. The cause of changes in TWS was complicated, and the increase in TWS had different characteristics and causes in different regions of the inner Tibetan Plateau.
4.3.3. Lake Mass Balance
We quantified the change in LWS, glacial meltwater, and permafrost degradation, and we also calculated the contribution of net precipitation with Equation (2). For the total inner Tibetan Plateau, the increased LWS was 49.69 ± 3.58 Gt (6.21 ± 0.45 Gt/y) over the study period, and glacial meltwater and permafrost were −6.71 ± 2.04 Gt (0.84 ± 0.26 Gt/y) and 6.7 ± 3.3 Gt (0.84 ± 0.41 Gt/y), respectively. Increased net precipitation was the primary cause of lake expansion, which contributed 73% (36.28 Gt) to lake expansion, and the contributions from increased glacial meltwater and permafrost degradation were 13.5% and 13.5%, respectively. These results were consistent with those of Zhang et al. [4].
However, the climate conditions in different regions of the inner Tibetan Plateau showed large differences, e.g., the precipitation and temperature of the northwestern part (region D) were less and lower than those of the eastern part (regions A and B) (Figure 6), respectively. We also analyzed the causes of these differences in different regions based on the water balance (Table 3). For region A, increased net precipitation was the primary cause of lake expansion with high precipitation level, as the increased precipitation contributed 78.2% to lake expansion, followed by increased glacial meltwater (14.1%), and permafrost degradation (7.7%). These results were consistent with Li et al. [65] in Nam Co, in which glacial meltwater contributed 10.5 ± 9% to lake expansion. For region B, increased net precipitation contributed 72.8% to lake expansion, followed by increased glacial meltwater (14.6%), and permafrost degradation (12.5%). The result was consistent with that of Qiao et al. [34] in Chibuzhang Co and Duoersuodong Co, where the glacial meltwater contributed 19.3 ± 4.5% to lake expansion, and glacial meltwater contributed 9.9% and 11.1% to LexieWudan Lake and KekeXili Lake in Zhou et al. [66]. For region C, permafrost degradation contributed 68.2% to lake expansion, followed by increased glacial meltwater (26.6%) and net precipitation (5.2%). For region D, due to the glacier mass balance was close to 0 based on the results of Zhang et al. [82], increased glacial meltwater contributed little to lake expansion, increased net precipitation (88%) was the primary cause of lake expansion, and followed by permafrost degradation (12%). However, region D is located in extremely dry and cold conditions with a large amount of glacier distribution. Perhaps glacial meltwater had an essential contribution to lake expansion, which needs to study further.
Table 3.
Contributions of different factors to lake expansion in different regions.
There are large spatial gradients about the cause of lake change. Precipitation is higher in the eastern of inner Tibetan Plateau than that of the western, and which is the primary cause of lake change in regions A and B. Still, permafrost is the primary cause of lake change in region C, in which there is low precipitation and little glacier. Precipitation is the primary cause of lake change in region D, due to we used the results of Zhang et al. [82], which the glacier mass balance was close to 0, however, there is a large amount of glaciers distribution and low precipitation, this real reason of lake expansion need to research further. Our results are consistent with the climate conditions and water resource distribution (e.g., permafrost and glacier).
The results of the glacial meltwater contribution to lake expansion in this study were lower than the results in Qiao et al. [16]. The main reason was that Qiao et al. [16] used the mean glacier mass balance (−0.455 m w.e.year−1) from observation data of several small glaciers, which was larger than that of the mean glacier mass balance value of −0.14 ± 0.07 m w.e.year−1 in the inner Tibetan Plateau from Brun et al. [1].
5. Conclusions
In this study, we estimated the change in TWS, LWS, SM, and permafrost according to satellite and model data during 2005–2013 on the inner Tibetan Plateau. The results showed that the total increased TWS (33 ± 4.33 Gt) was less than that of LWS (49.69 ± 3.58 Gt), and there was a large spatial difference between them. The increased LWS was mainly concentrated in the northeastern part (region B, 18.71 Gt, 37.7% of total) and the southeastern part (region A, 22.68 Gt, 45.6% of the total), and the increased TWS was mainly in the northeastern region (region B, 18.96 ± 1.26 Gt, 57%).
Based on the mass balance principle, increased LWS was the primary cause of increased TWS for the entire inner Tibetan Plateau. However, increased LWS was the primary cause in the southeastern part (region A), northeastern part (region B), and northwestern part (region D), followed by increased groundwater except in region A, which had a great water loss with decreasing groundwater. Increased groundwater was the primary cause in the central part (region C), which showed little increase in LWS. There was a large spatial difference in the cause of increased TWS among these regions.
Increased net precipitation was the primary cause of lake expansion, which contributed 73% (36.28 Gt) to lake expansion, followed by increased glacial meltwater (13.5%) and permafrost degradation (13.5%) for the entire inner Tibetan Plateau. However, the causes of lake change varied greatly for different regions, due to different climate conditions. Increased net precipitation was the primary cause of lake expansion in the southeastern part (region A, 78.2%) and northeastern part (region B, 72.8%) with high precipitation, followed by an increase in glacial meltwater (14.1% and 14.6%), and permafrost degradation (7.7% and 12.5%). Increased permafrost degradation contributed 68.2% to lake expansion, followed by an increase in glacial meltwater (26.6%) and net precipitation (5.2%) in the central part (region C). Increased net precipitation (88%) was the primary cause of lake expansion in the northwestern Tibetan Plateau (region D) with extremely dry and cold climate conditions, and followed by permafrost degradation (12%).
Author Contributions
Conceptualization, B.Q.; and L.Z.; methodology, B.Q.; L.X.; software, B.Q.; and B.N.; L.Z.; validation, B.Q.; writing—original draft preparation, B.Q.; writing—review and editing, B.Q. and L.Z.; visualization, B.Q.; and C.L.; project administration, L.Z.; funding acquisition, L.Z. All authors have read and agreed to the published version of the manuscript.
Funding
This work is supported by NSFC project (41831177, 41901078, 42004007), the Second Tibetan Plateau Scientific Expedition and Research (STEP) (2019QZKK0202), CAS Strategic Priority Research Program (XDA20020100, XDA19020303), the CAS Alliance of Field Observation Stations (KFJ–SW–YW038).
Institutional Review Board Statement
Not applicable.
Informed Consent Statement
Not applicable.
Data Availability Statement
This analysis data could be available on request from the corresponding author (lpzhu@itpcas.ac.cn).
Conflicts of Interest
The authors declare no conflict of interest.
Abbreviations
lake water storage (LWS), lake water storage change (LWSC), terrestrial water storage (TWS), terrestrial water storage change (TWSC), Gravity Recovery and Climate Experiment (GRACE), Active-layer depth (ALD), Global Land Data Assimilation System (GLDAS), China Meteorological Forcing Dataset (CMFD), Climate Prediction Center’s (CPC), snow water equivalent (SWE), soil moisture (SM), permafrost (PM), and groundwater storage (GWS).
References
- Immerzeel, W.W.; van Beek, L.P.H.; Bierkens, M.F.P. Climate change will affect the Asian water towers. Science 2010, 328, 1382–1385. [Google Scholar] [CrossRef] [PubMed]
- Brun, F.; Berthier, E.; Wagnon, P.; Kääb, A.; Treichler, D. A spatially resolved estimate of High Mountain Asia glacier mass balances from 2000 to 2016. Nat. Geosci. 2017, 10, 668–673. [Google Scholar] [CrossRef] [PubMed]
- Yao, T.D.; Thompson, L.; Yang, W.; Yu, W.S.; Gao, Y.; Guo, X.J.; Yang, X.X.; Duan, K.Q.; Zhao, H.B.; Xu, B.Q.; et al. Different glacier status with atmospheric circulations in Tibetan Plateau and surroundings. Nat. Clim. Chang. 2012, 2, 663–667. [Google Scholar] [CrossRef]
- Zhang, G.Q.; Xie, H.J.; Kang, S.C.; Yi, D.H.; Ackley, S.F. Monitoring lake level changes on the Tibetan Plateau using ICESat altimetry data (2003−2009). Remote Sens. Environ. 2011, 115, 1733–1742. [Google Scholar] [CrossRef]
- Zhang, G.Q.; Yao, T.D.; Shum, C.K.; Yi, S.; Yang, K.; Xie, H.J.; Feng, W.; Bolch, T.; Wang, L.; Behrangi, A.; et al. Lake volume and groundwater storage variations in Tibetan Plateau’s endorheic basin. Geophys. Res. Lett. 2017, 44, 5550–5560. [Google Scholar] [CrossRef]
- Zhang, G.Q.; Yao, T.D.; Xie, H.J.; Yang, K.; Zhu, L.P.; Shum, C.K.; Bolch, T.; Yi, S.; Allen, S.; Jiang, L.G.; et al. Response of Tibetan Plateau lakes to climate change: Trends, patterns, and mechanisms. Earth Sci. Rev. 2020, 208, 103269. [Google Scholar] [CrossRef]
- Song, C.Q.; Huang, B.; Ke, L.H. Modeling and analysis of lake water storage changes on the Tibetan Plateau using multi-mission satellite data. Remote Sens. Environ. 2013, 135, 25–35. [Google Scholar] [CrossRef]
- Song, C.Q.; Huang, B.; Ke, L.H.; Richards, K.S. Seasonal and abrupt changes in the water level of closed lakes on the Tibetan Plateau and implications for climate impacts. J. Hydrol. 2014, 514, 131–144. [Google Scholar] [CrossRef]
- Neckel, N.; Kropáček, J.; Bolch, T.; Hochschild, V. Glacier mass changes on the Tibetan Plateau 2003−2009 derived from ICESat laser altimetry measurements. Environ. Res. Lett. 2014, 9, 014009. [Google Scholar] [CrossRef]
- Wu, Q.B.; Hou, Y.D.; Yun, H.B.; Liu, Y.Z. Changes in active-layer thickness and near-surface permafrost between 2002 and 2012 in alpine ecosystems, Qinghai-Xizang (Tibet) Plateau, China. Glob. Planet. Chang. 2014, 124, 149–155. [Google Scholar] [CrossRef]
- Yang, M.X.; Nelson, F.E.; Shiklomanov, N.I.; Guo, D.L.; Wan, G.N. Permafrost degradation and its environmental effects on the Tibetan Plateau: A review of recent research. Earth Sci. Rev. 2010, 103, 31–44. [Google Scholar] [CrossRef]
- Deng, H.J.; Pepin, N.C.; Liu, Q.; Chen, Y.N. Understanding the spatial differences in terrestrial water storage variations in the Tibetan Plateau from 2002 to 2016. Clim. Chang. 2018, 151, 379–393. [Google Scholar] [CrossRef] [Green Version]
- Zou, F.; Tenzer, R.; Jin, S.G. Water storage variations in Tibet from GRACE, ICESat, and hydrolgoical data. Remote Sens. 2019, 11, 1103. [Google Scholar] [CrossRef] [Green Version]
- Jacob, T.; Wahr, J.; Pfeffer, W.; Swenson, S. Recent contributions of glaciers and ice caps to sea level rise. Nature 2012, 482, 514–518. [Google Scholar] [CrossRef]
- Zhang, G.Q.; Yao, T.D.; Xie, H.J.; Kang, S.C.; Lei, Y.B. Increased mass over the Tibetan Plateau: From lakes or glaciers? Geophys. Res. Lett. 2013, 40, 2125–2130. [Google Scholar] [CrossRef]
- Wang, X.X.; Xiao, X.M.; Zou, Z.H.; Dong, J.W.; Qin, Y.W.; Doughty, R.B.; Menarguez, M.A.; Chen, B.Q.; Wang, J.B.; Ye, H.; et al. Gainers and losers of surface and terrestrial water resources in China during 1989–2016. Nat. Commun. 2020, 11, 3471. [Google Scholar] [CrossRef] [PubMed]
- Qiao, B.J.; Zhu, L.P.; Yang, R.M. Temporal-spatial differences in lake water storage changes and their links to climate change throughout the Tibetan Plateau. Remote Sens. Environ. 2019, 222, 232–243. [Google Scholar] [CrossRef]
- Yao, F.; Wang, J.; Yang, K.; Wang, C.; Walter, B.A.; Crétaux, J.-F. Lake storage variation on the endorheic tibetan plateau and its attribution to climate change since the new millennium. Environ. Res. Lett. 2018, 13, 064011. [Google Scholar] [CrossRef]
- Ma, R.H.; Duan, H.T.; Hu, C.M.; Feng, X.Z.; Li, A.N.; Ju, W.M.; Jiang, J.H.; Yang, G.S. A half-century of changes in China’s lakes: Global warming or human influence? Geophys. Res. Lett. 2010, 37, L24106. [Google Scholar] [CrossRef]
- Wang, S.M.; Dou, H.S. Chinese Lakes Inventory; Science Press: Beijing, China, 1998. [Google Scholar]
- Li, Y.K.; Liao, J.J.; Guo, H.D.; Liu, Z.W.; Shen, G.Z. Patterns and potential drivers of dramatic changes in Tibetan lakes, 1972−2010. PLoS ONE 2014, 9, e111890. [Google Scholar] [CrossRef] [PubMed] [Green Version]
- Wang, X.W.; Gong, P.; Zhao, Y.Y.; Xu, Y.; Cheng, X.; Niu, Z.G.; Luo, Z.C.; Huang, H.B.; Sun, F.D.; Li, X.W. Water-level changes in China’s large lakes determined from ICESat/GLAS data. Remote Sens. Environ. 2013, 132, 131–144. [Google Scholar] [CrossRef]
- Zhang, G.Q.; Xie, H.J.; Yao, T.D.; Kang, S.C. Water balance estimates of ten greatest lakes in China using ICESat and Landsat data. Chin. Sci. Bull. 2013, 58, 3815–3829. [Google Scholar] [CrossRef] [Green Version]
- Zhang, G.Q.; Yao, T.D.; Xie, H.J.; Zhang, K.X.; Zhu, F.J. Lakes’ state and abundance across the Tibetan Plateau. Chin. Sci. Bull. 2014, 59, 3010–3021. [Google Scholar] [CrossRef]
- Maussion, F.; Scherer, D.; Mölg, T.; Collier, E.; Curio, J.; Finkelnburg, R. Precipitation Seasonality and Variability over the Tibetan Plateau as Resolved by the High Asia Reanalysis. J. Clim. 2013, 27, 1910–1927. [Google Scholar] [CrossRef] [Green Version]
- Xu, Z.X.; Gong, T.L.; Li, J.Y. Decadal trend of climate in the Tibetan Plateau-regional temperature and precipitation. Hydrol. Process. 2008, 22, 3056–3065. [Google Scholar] [CrossRef]
- Yang, K.; Lu, H.; Yue, S.Y.; Zhang, G.Q.; Lei, Y.B.; La, Z.; Wang, L. Quantifying recent precipitation change and predicting lake expansion in the Inner Tibetan Plateau. Clim. Chang. 2018, 147, 149–163. [Google Scholar] [CrossRef]
- Biskop, S.; Maussion, F.; Krause, P.; Fink, M. Differences in the water-balance components of four lakes in the southern-central Tibetan Plateau. Hydrol. Earth Syst. Sci. 2016, 20, 209–225. [Google Scholar] [CrossRef] [Green Version]
- Lei, Y.B.; Yao, T.D.; Bird, B.; Yang, K.; Zhai, J.Q.; Sheng, Y.W. Coherent lake growth on the central Tibetan Plateau since the 1970s: Characterization and attribution. J. Hydrol. 2013, 483, 61–67. [Google Scholar] [CrossRef]
- Liu, J.S.; Wang, S.Y.; Yu, S.M.; Yang, D.Q.; Zhang, L. Climate warming and growth of high-elevation inland lakes on the Tibetan Plateau. Global Planet. Chang. 2009, 67, 209–217. [Google Scholar] [CrossRef]
- Zhou, J.; Wang, L.; Zhang, Y.S.; Guo, Y.H.; Li, X.P.; Liu, W.B. Exploring the water storage changes in the largest lake (SelinCo) over the Tibetan Plateau during 2003−2012 from a basin-wide hydrological modeling. Water Resour. Res. 2015, 51, 8060–8086. [Google Scholar] [CrossRef] [Green Version]
- Wang, B.B.; Ma, Y.M.; Su, Z.B.; Wang, Y.; Ma, W.Q. Quantifying the evaporation amounts of 75 high-elevation large dimictic lakes on the Tibetan Plateau. Sci. Adv. 2020, 6, 8558. [Google Scholar] [CrossRef]
- Ma, N.; Szilagyi, J.; Niu, G.Y.; Zhang, Y.S.; Zhang, T.; Wang, B.B.; Wu, Y.H. Evaporation variability of Nam Co Lake in the Tibetan Plateau and its role in recent rapid lake expansion. J. Hydrol. 2016, 537, 27–35. [Google Scholar] [CrossRef]
- Qiao, B.J.; Zhu, L.P.; Wang, J.B.; Ju, J.T.; Ma, Q.F.; Huang, L.; Chen, H.; Liu, C.; Xu, T. Estimation of lake water storage and changes based on bathymetric data and altimetry data and the association with climate change in the central Tibetan Plateau. J. Hydrol. 2019, 578, 124052. [Google Scholar] [CrossRef]
- Phan, V.; Lindenbergh, R.; Menenti, M. Geometric dependency of Tibetan lakes on glacial runoff. Hydrol. Earth Syst. Sci. 2013, 17, 4061–4077. [Google Scholar] [CrossRef] [Green Version]
- Zhang, G.Q.; Bolch, T.; Chen, W.F.; Crétaux, J.F. Comprehensive estimation of lake volume changes on the tibetan plateau during 1976–2019 and basin-wide glacier contribution. Sci. Total Environ. 2021, 772, 145463. [Google Scholar] [CrossRef] [PubMed]
- Qiao, B.J.; Zhu, L.P. Differences and cause analysis of changes in lakes of different supply types in the north-western Tibetan Plateau. Hydrol. Process. 2017, 31, 2752–2763. [Google Scholar] [CrossRef]
- Song, C.Q.; Sheng, Y.W. Contrasting evolution patterns between glacier-fed and non-glacier-fed lakes in the Tanggula Mountains and climate cause analysis. Clim. Chang. 2016, 135, 493–507. [Google Scholar] [CrossRef]
- Zhang, T.J.; Heginbottom, J.A.; Barry, R.G.; Brown, J. Further statistics of the distribution of permafrost and ground ice in the northern hemisphere. Polar Geogr. 2000, 24, 126–131. [Google Scholar] [CrossRef]
- Zhou, Y.W.; Guo, D.X.; Qiu, G.Q.; Cheng, G.D.; Li, S.D. Geocryology in China; Science Press: Beijing, China, 2000; (In Chinese with English Abstract). [Google Scholar]
- Dörfer, C.; Kühn, P.; Baumann, F.; He, J.S.; Scholten, T. Soil Organic Carbon Pools and Stocks in Permafrost-Affected Soils on the Tibetan Plateau. PLoS ONE 2013, 8, e57024. [Google Scholar]
- Zhao, L.; Ding, Y.J.; Liu, G.Y.; Wang, S.L.; Jin, H.J. Estimates of the reserves of ground ice in permafrost regions on the Tibetan Plateau. J. Glaciol. Geocryol. 2010, 32, 1–9. (In Chinese) [Google Scholar]
- Cheng, G.D.; Wu, T.H. Responses of permafrost to climate change and their environmental significant, Qinghai-Tibet Plateau. J. Geophys. Res. Earth 2007, 112, F02S03. [Google Scholar]
- Wu, Q.; Liu, Y. Ground temperature monitoring and its recent change in Qinghai-Tibet Plateau. Cold Reg. Sci. Technol. 2004, 38, 85–92. [Google Scholar]
- Wu, Q.B.; Cheng, G.D.; Ma, W.; Niu, F.J.; Sun, Z.Z. Technical approaches on permafrost thermal stability for Qinghai-Tibet Railway. Geomech. Geoengin. Int. J. 2006, 1, 119–127. [Google Scholar] [CrossRef]
- Wu, Q.B.; Zhang, T.J. Changes in active layer thickness over the Qinghai-Tibetan Plateau from 1995 to 2007. J. Geophys. Res. Atom. 2010, 115, D09107. [Google Scholar] [CrossRef]
- Yang, J.P.; Ding, Y.J.; Chen, R.S.; Shen, Y.P. Permafrost change and its effect on eco-environment in the source regions of the Yangtze and Yellow Rivers. J. Mt. Sci. 2004, 22, 278–285. (In Chinese) [Google Scholar]
- Xu, X.; Zhao, T.; Lu, C.; Gao, Y.; Chen, B.; Liu, R.; Li, Y.; Shi, X. An important mechanism sustaining the atmospheric “water tower” over the Tibetan plateau. Atmos. Chem. Phys. 2014, 14, 11287–11295. [Google Scholar] [CrossRef] [Green Version]
- Wang, G.X.; Li, Y.S.; Wang, Y.B.; Shen, Y.P. Impacts of alpine ecosystem and climate changes on surface runoff in the headwaters of the Yangtze River. J. Glaciol. Geocryol. 2007, 29, 159–168, (In Chinese with English Abstract). [Google Scholar]
- Landerer, F.; Swenson, S. Accuracy of scaled GRACE terrestrial water storage estimates. Water Resour. Res. 2012, 48, W04531. [Google Scholar] [CrossRef]
- Swenson, S.; Wahr, J.; Milly, P. Estimated accuracies of regional water storage variations inferred from the gravity recovery and climate experiment (GRACE). Water Resour. Res. 2003, 39, 1223. [Google Scholar] [CrossRef]
- Swenson, S.; Wahr, J. Multi-sensor analysis of water storage variations of the Caspian Sea. Geophy. Res. Lett. 2007, 34, L16401. [Google Scholar] [CrossRef] [Green Version]
- Tang, Q.H.; Gao, H.L.; Yeh, P.; Oki, T.; Su, F.; Lettenmaier, D. Dynamics of terrestrial water storage change from satellite and surface observations and modeling. J. Hydrometeorol. 2010, 11, 156–170. [Google Scholar] [CrossRef] [Green Version]
- Wahr, J.; Swenson, S.; Zlotnicki, V.; Velicogna, I. Time-variable gravity fromGRACE: First results. Geophys. Res. Lett. 2004, 31, L11501. [Google Scholar] [CrossRef] [Green Version]
- Xiang, L.W.; Wang, H.S.; Steffen, H.; Wu, P.; Jia, L.L.; Jiang, L.M.; Shen, Q. Groundwater storage changes in the Tibetan Plateau and adjacent areas revealed from GRACE satellite gravity data. Earth Planet. Sci. Lett. 2016, 449, 228–239. [Google Scholar] [CrossRef] [Green Version]
- Save, H. CSR GRACE RL06 Mascon Solutions. Tex. Data Repos. 2019, V1. [Google Scholar] [CrossRef]
- Mcfeeters, S. The use of the Normalized Difference Water Index (NDWI) in the delineation of open water features. Int. J. Remote Sens. 1996, 17, 1425–1432. [Google Scholar] [CrossRef]
- Yang, R.M.; Zhu, L.P.; Wang, J.B.; Ju, J.T.; Ma, Q.F.; Turner, F.; Guo, Y. Spatiotemporal variations in volume of closed lakes on the tibetan plateau and their climatic responses from 1976 to 2013. Clim. Chang. 2017, 140, 621. [Google Scholar] [CrossRef]
- Rodriguez, E.; Morris, C.; Belz, J. A global assessment of the SRTM performance. Photogramm. Eng. Rem. Sens. 2006, 72, 249–260. [Google Scholar] [CrossRef] [Green Version]
- Qiao, B.J.; Zhu, L.P. Difference and cause analysis of water storage changes for glacier-fed and non-glacier-fed lakes on the Tibetan Plateau. Sci. Total. Environ. 2019, 693, 133399. [Google Scholar] [CrossRef] [PubMed]
- Oelke, C.; Zhang, T.J. Modeling the Active-Layer Depth over the Tibetan Plateau. Arct. Antarct. Alp. Res. 2007, 39, 714–722. [Google Scholar] [CrossRef] [Green Version]
- Fan, Y.; van den Dool, H. Climate Prediction Center global monthly soil moisture data set at 0.5° resolution for 1948 to present. J. Geophys. Res. Atmos. 2004, 109. [Google Scholar] [CrossRef] [Green Version]
- Liu, L.; Jiang, L.M.; Sun, Y.D.; Yi, C.L.; Wang, H.S.; Hsu, H. Glacier elevation changes (2012–2016) of the Puruogangri Ice Field on the Tibetan Plateau derived from bi-temporal TanDEM-X InSAR data. Int. J. Remote Sens. 2016, 37, 5687–5707. [Google Scholar] [CrossRef]
- Zhou, Y.S.; Li, Z.W.; Li, J.; Zhao, R.; Ding, X.L. Glacier mass balance in the Qinghai-Tibet Plateau and its surroundings from the mid-1970s to 2000 based on Hexagon KH-9 and SRTM DEMs. Remote Sens. Environ. 2018, 201, 96–112. [Google Scholar] [CrossRef]
- Li, G.; Lin, H. Recent decadal glacier mass balances over the Western Nyainqentanglha Mountains and the increase in their melting contribution to Nam Co Lake measured by differential bistatic SAR interferometry. Glob. Planet. Chang. 2017, 49, 177–190. [Google Scholar] [CrossRef] [Green Version]
- Zhou, Y.S.; Hu, J.; Li, Z.W.; Li, J.; Zhao, R.; Ding, X.L. Quantifying glacier mass change and its contribution to lake growths in central Kunlun during 2000−2015 from multi-source remote sensing data. J. Hydrol. 2019, 570, 38–50. [Google Scholar] [CrossRef]
- Guo, W.Q.; Liu, S.Y.; Xu, J.L.; Wu, L.Z.; Shangguan, D.H.; Yao, X.J.; Wei, J.F.; Bao, W.J.; Yu, P.C.; Liu, Q.; et al. The second Chinese glacier inventory: Data, methods and results. J. Glaciol. 2015, 61, 357–372. [Google Scholar] [CrossRef] [Green Version]
- He, J.; Yang, K.; Tang, W.; Lu, H.; Qin, J.; Chen, Y.Y.; Li, X. The first high-resolution meteorological forcing dataset for land process studies over China. Sci. Data 2020, 7, 25. [Google Scholar] [CrossRef] [PubMed] [Green Version]
- Chen, Y.Y.; Yang, K.; He, J.; Qin, J.; Shi, J.C.; Du, J.Y.; He, Q. Improving land surface temperature modeling for dry land of China. J. Geophys. Res. Atmos. 2011, 116. [Google Scholar] [CrossRef]
- Liu, J.G.; Xie, Z.H. Improving simulation of soil moisture in China using a multiple meteorological forcing ensemble approach. Hydrol. Earth Syst. Sci. 2013, 17, 3355–3369. [Google Scholar] [CrossRef] [Green Version]
- Yang, W.; Guo, X.F.; Yao, T.D.; Zhu, M.L.; Wang, Y.J. Recent accelerating mass loss of southeast Tibetan glaciers and the relationship with changes in macroscale atmospheric circulations. Clim. Dyn. 2016, 3-4, 805–815. [Google Scholar] [CrossRef]
- Yang, W.; Yao, T.D.; Guo, X.J.; Zhu, M.L.; Li, S.H.; Kattel, D. Mass balance of a maritime glacier on the southeast Tibetan Plateau and its climatic sensitivity. J. Geophys. Res. Atmos. 2013, 118, 9579–9594. [Google Scholar] [CrossRef]
- Sheffield, J.; Goteti, G.; Wood, E. Development of a 50-year high-resolution global dataset of meteorological forcings for land surface modeling. J. Clim. 2006, 19, 3088–3111. [Google Scholar] [CrossRef] [Green Version]
- Huffman, G.; Adler, R.; Bolvin, D.; Gu, G.; Nelkin, E.; Bowman, K.; Hong, Y.; Stocker, E.; Wolff, D. The TRMM multisatellite precipitation analysis (TMPA): Quasi-global, multiyear, combined-sensor precipitation estimates at fine scales. J. Hydrometeorol. 2007, 8, 38–55. [Google Scholar] [CrossRef]
- Penman, H. Natural evaporation from open water, bare soil and grass. Proc. R. Soc. Lond. 1948, 193, 120–145. [Google Scholar]
- McMahon, T.A.; Peel, M.C.; Lowe, L.; Srikanthan, R.; McVicar, T.R. Estimating actual, potential, reference crop and pan evaporation using standard meteorological data: A pragmatic synthesis. Hydrol. Earth Syst. Sci. 2013, 17, 1331–1363. [Google Scholar] [CrossRef] [Green Version]
- Bolch, T.; Kulkarni, A.; Kääb, A.; Huggel, C.; Paul, F.; Cogley, J.; Frey, H.; Kargel, J.; Fujita, K.; Scheel, M.; et al. The state and fate of Himalayan glaciers. Science 2012, 336, 310–314. [Google Scholar] [CrossRef] [PubMed] [Green Version]
- Bolch, T.; Yao, T.D.; Kang, S.C.; Buchroithner, M.; Scherer, D.; Maussion, F.; Huintjes, E.; Schneider, C. A glacier inventory for the western Nyainqentanglha Range and the Nam Co Basin, Tibet, and glacier changes 1976–2009. Cryosphere 2010, 4, 419–433. [Google Scholar] [CrossRef] [Green Version]
- Wei, J.F.; Liu, S.Y.; Guo, W.Q.; Yao, X.J.; Xu, J.L.; Bao, W.J.; Jiang, Z.L. Surface-area changes of glaciers in the Tibetan Plateau interior area since the 1970s using recent Landsat images and historical maps. Ann. Glaciol. 2014, 55, 213–222. [Google Scholar]
- Zhang, Z.M.; Jiang, L.M.; Liu, L.; Sun, Y.F.; Wang, H.S. Annual glacier-wide mass balance (2000–2016) of the interior Tibetan Plateau reconstructed from MODIS albedo products. Remote Sens. 2018, 10, 1031. [Google Scholar] [CrossRef] [Green Version]
- Liu, L. Glacier Mass Balances in the Tibetan Plateau Observed from SAR Interferometry; University of Chinese Academy of Science: Beijing, China, 2016. [Google Scholar]
- Zhang, G.; Chen, W.F.; Li, G.; Yang, W.; Yi, S.; Luo, W. Lake water and glacier mass gains in the northwestern Tibetan Plateau observed from multi-sensor remote sensing data: Implication of an enhanced hydrological cycle. Remote Sens. Environ. 2020, 237, 111554. [Google Scholar] [CrossRef]


Publisher’s Note: MDPI stays neutral with regard to jurisdictional claims in published maps and institutional affiliations. |
© 2021 by the authors. Licensee MDPI, Basel, Switzerland. This article is an open access article distributed under the terms and conditions of the Creative Commons Attribution (CC BY) license (https://creativecommons.org/licenses/by/4.0/).