Abstract
This paper designs a cascading vector tracking loop based on the Unscented Kalman Filter (UKF) for high dynamic environment. Constant improvement in dynamic performance is an enormous challenge to the traditional receiver. Due to the doppler effect, the satellite signals received by these vehicles contain fast changing doppler frequency shifts and the first and second derivatives of doppler frequency, which will directly cause a negative impact on the receiver’s stable tracking of the signals. In order to guarantee the dynamic performance and the tracking accuracy, this paper designs a vector carrier structure to estimate the doppler component of a signal. Firstly, after the coherence integral, the IQ values are reorganized into new observations. Secondly, the phase error and frequency of the carrier are estimated through the pre-filter. Then, the pseudorange and carrier frequency are used as the observations of the main filter to estimate the motion state of the aircraft. Finally, the current state is fed back to the carrier Numerical Controlled Oscillator (NCO) as a complete closed loop. In the whole structure, the cascading vector loop replaces the original carrier tracking loop, and the stable signal tracking of code loop is guaranteed by carrier assisted pseudo-code method. In this paper, with the high dynamic signals generated by the GNSS signal simulator, this designed algorithm is validated by a software receiver. The results show that this loop has a wider dynamic tracking range and lower tracking error than the second-order frequency locked loop assisted third-order phase locked loop in high dynamic circumstances. When the acceleration of carrier is 100 g, the convergence time of vector structure is about 100 ms, and the carrier phase error is lower than 0.6 mm.
1. Introduction
Since the advent of the global positioning system (GPS), the global navigation satellite system (GNSS) has become the most efficient technology for positioning. Normally, according to some location solution methods, such as the Real Time Kinematic (RTK) or the Precise Point Positioning (PPP), the accuracy of GNSS positioning is guaranteed, but the upper limit of positioning accuracy is determined by the quality of signal tracking. In some special circumstances (e.g., low signal to noise ratio or high dynamics), the GNSS receiver has no tracking ability or low tracking quality, causing invalid positioning.
In 1998, NF Krasner [1] introduced the automatic frequency control (AFC) loop into the GNSS receiver for locking carriers for better navigation signal tracking. The AFC method tracks the carrier frequency by repeatedly adjusting a series of CNC oscillators with simple structures and low accuracies [2]. In 1987, maximum likelihood estimation (MLE) was used to track GPS signals [3], with high estimated frequency accuracy but a complex structure [4]. Many estimation methods are being used in signal tracking, such as fast Fourier transform [5] and adaptive least mean square [6]. However, the many tracking methods are limited to the signal field, only utilizing a single channel to deal with signal tracking.
The carrier loop structure using Kalman filter (KF) is more flexible than MLE and other estimation technologies [7,8], and the estimation accuracy varies with the KF type selected. We used unscented KF (UKF) technology in our subsequent carrier tracking solutions because UKF has been proven equally accurate as the third order EKF [9].
In 1996, J.J. Spilker first proposed the vector tracking loop [9], which combines the tracking loop with the positioning module as an integral loop. In the traditional receiver structure, the tracking loop and the positioning module are independent of each other, with data flowing in one direction and independent signal channels. Thus, no information exchange occurs between channels, which makes aiding weak signals according to the strong signals of channels impossible.
Compared with the traditional loop, the vector loop can make full use of the information of each channel [10,11] and the positioning message feedback in the tracking loop to easily achieve deep integration with other sensors [12,13]. The vector loop completely utilizes signal information for the receiver to work in a low Carrier to Noise Ratio (CNR) environment [14]. The vector loop is an advanced structure that provides performance improvements in many circumstances. The advantage of vector tracking technology in a highly sensitive receiver is explained with a theoretical formula in [14]. On the basis of the vector loop, the structure of the ultra-tight integration navigation system was explored. The advantages of vector tracking in anti-jamming were verified [15]. Vector tracking is a navigation signal processing structure in which different estimation methods form different vector loops. The influences of different KFs on the ultra-tight integrated navigation system based on vector tracking are discussed in [16], which can serve as a reference for the implementation of subsequent projects.
Given the tracking loop and positioning module combination, the frequency of positioning must be promoted to guarantee the accuracy of tracking. Therefore, the computational cost of vector tracking must be considered. Continuous explorations are conducted to reduce the calculation cost. In terms of structural improvement, a study [17] provides a balance between the pure Vector Phase Lock Loop (VPLL) and the classic scalar tracking loops and results in increased tolerance to ionospheric disturbances. According to the corresponding decision conditions of the vector structure, optimal positioning results can be obtained with the minimum computation based on indoor navigation [18]. A study [19] used the vector tracking structure to minimize the effect of multipath interference and aid NLOS detection.
Given the limit of noise bandwidth and wavelength, the carrier loop, whether the phase-locked loop (PLL) or the frequency-locked loop (FLL), is more prone to lose locking than the delay-locked loop (DLL). To solve the receiver problem of signal loss in highly dynamic environments based on vector tracking, we designed and verified a cascade tracking structure to replace the original carrier loop, and as the first level of the cascade structure, this pre-filter based on the UKF can work independently when it is close-looped and be used for the vector structure when it is open-looped. Therefore, the switching between the scalar and vector structures can be unified well.The rest of the paper is organized as follows. Section 2 introduces our vector tracking method. Section 3 presents a series of experiments to prove the performance of vector loop from tracking error and robustness. Section 4 discusses the future work. Section 5 summarizes the main work of this paper.
2. Structure and Methods
2.1. Tracking Loop Structure
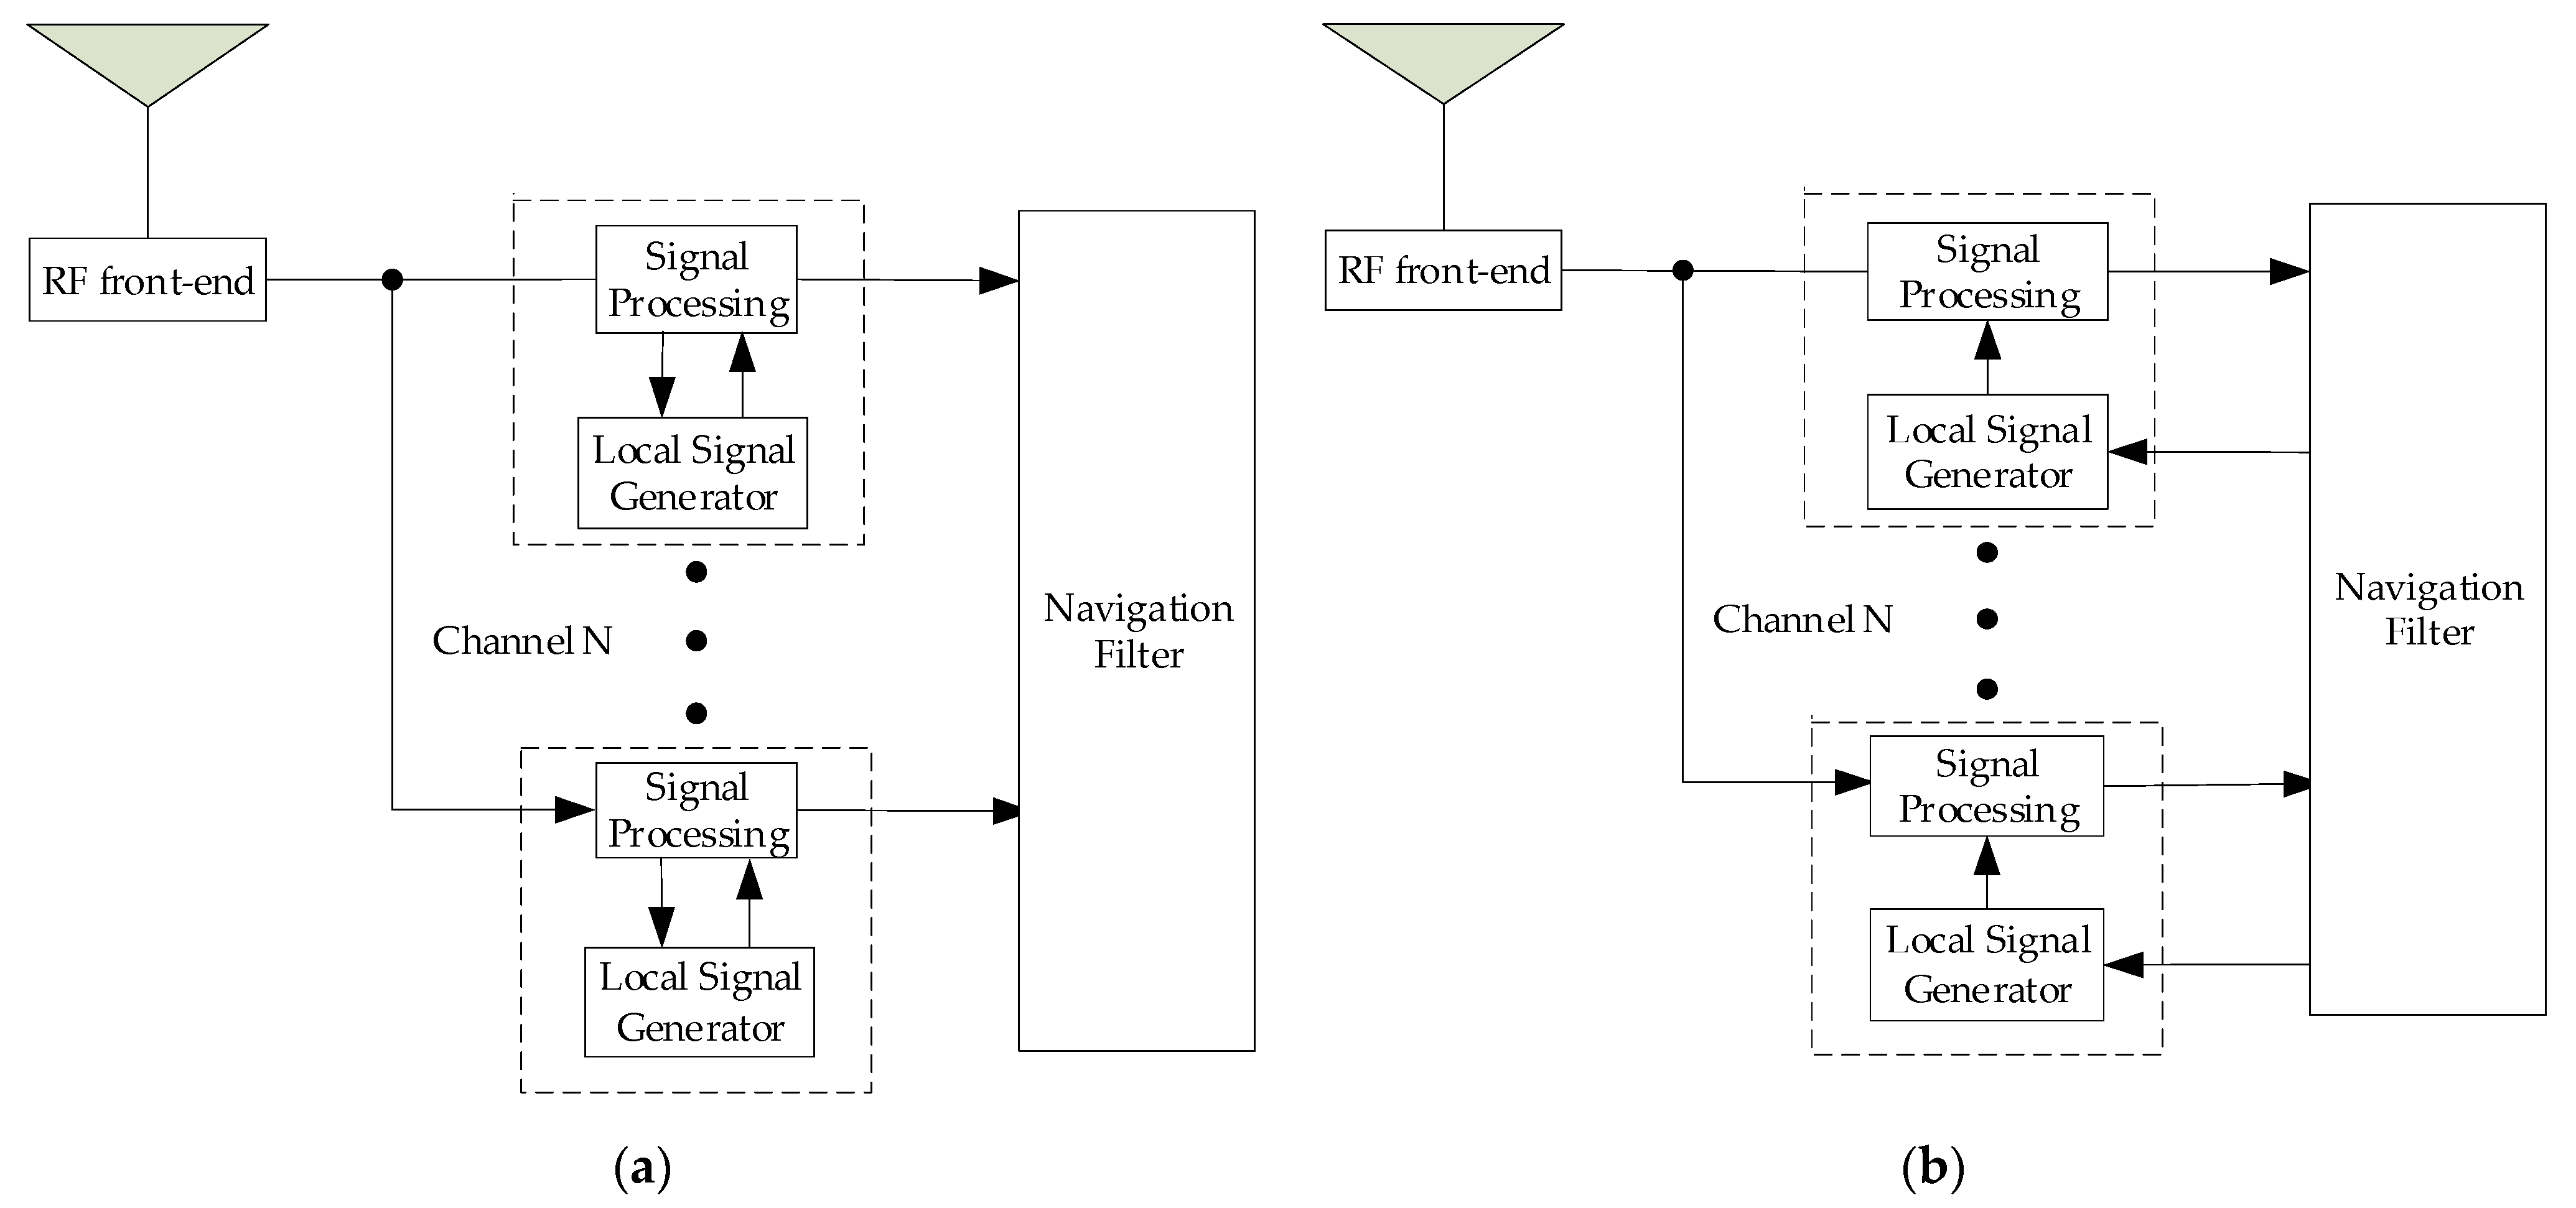
Figure 1 shows the principles of the scalar loop and the vector loop, respectively. In Figure 1a, signal processing and information processing are two separate parts, and each channel processes its own signal. In Figure 1b, the current state of the receiver (receiver reference oscillation frequency drift, user dynamics) can be utilized by every channel. The demodulation results, I and Q values, of each tracking channel are directly used in positioning with the KF. Then, the numerically controlled oscillator (NCO) of each channel is controlled by the feedback of positioning results to achieve the joint tracking of multiple channels. According to this information fusion, different channels can complement each other, and the tracking performance can be improved.
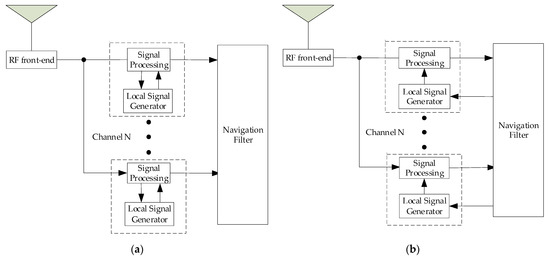
Figure 1.
(a) Scalar tracking schematic, (b) Vector tracking schematic.
2.2. Cascading Tracking Methods
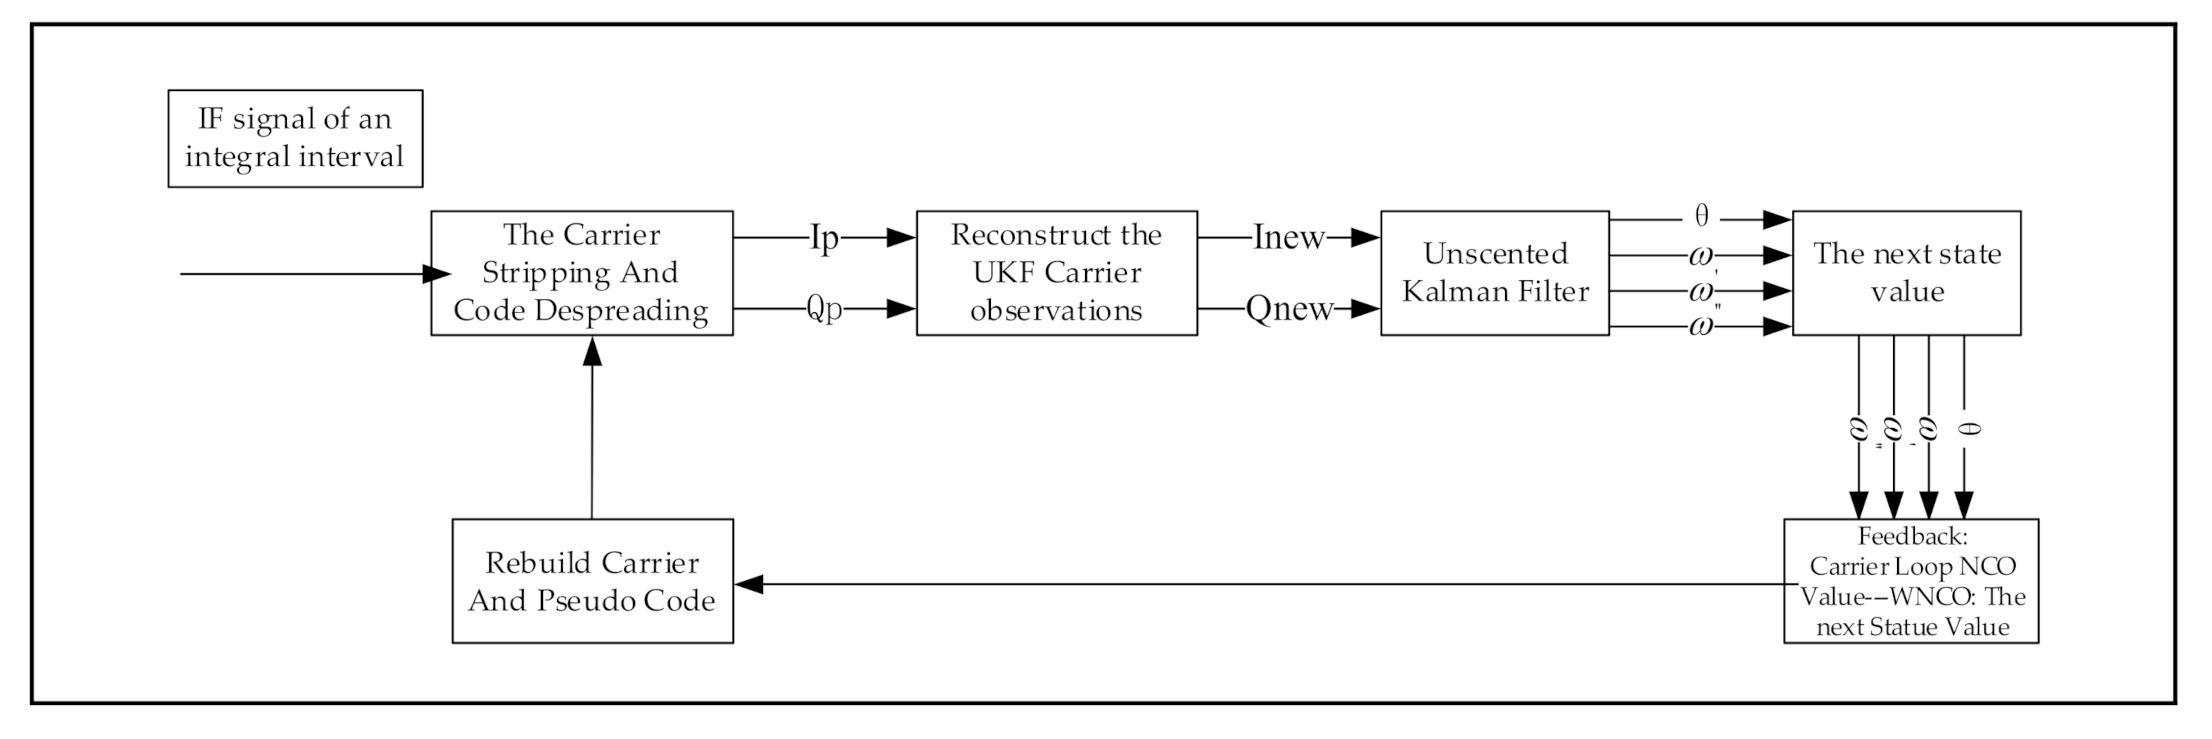
Figure 2 presents the carrier’s UKF structure with the data flow. After the demodulation, given that the original observations contain the navigation code flip and other unknown parameters, we design a restructuring module as shown in Formula (1) to eliminate unknown parameters. Then, the current state vector is calculated with the UKF. Finally, the feedback value of the loop is calculated by using the state vector to control the carrier’s NCO, which adjusts the generation of the local carrier signal at the next moment.
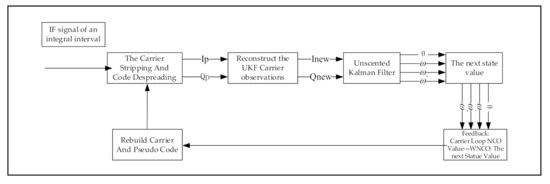
Figure 2.
Carrier tracking loop flow (also the pre-filter).
Equation (1) expresses the original values of I and Q after demodulation. is the number of samples in an interval. is the average carrier amplitude over the integral interval. is the navigation data, and is the autocorrelation function of the PRN code. Given the plus or minus flip of the navigation data, and cannot be used directly as measurements. Therefore, in the rebuild module, the original I and Q are reconstructed as Equations (2) and (3), which can be further derived from reference [20]:
Considering the priority processing, the parameters are uncertain at moment k, except for parameter , but after the reconstruction, combined measurements and will not be influenced by the navigation data and other unknown parameters. Thus, the observation equation is established as Equation (4), and is the zero-mean Gaussian discrete-time white noise. Equation (5) expresses the mean carrier phase difference between the replicated and actual signals over an integral period, is the interval average of the carrier phase error, and R(τ) is the autocorrelation function of the PRN code:
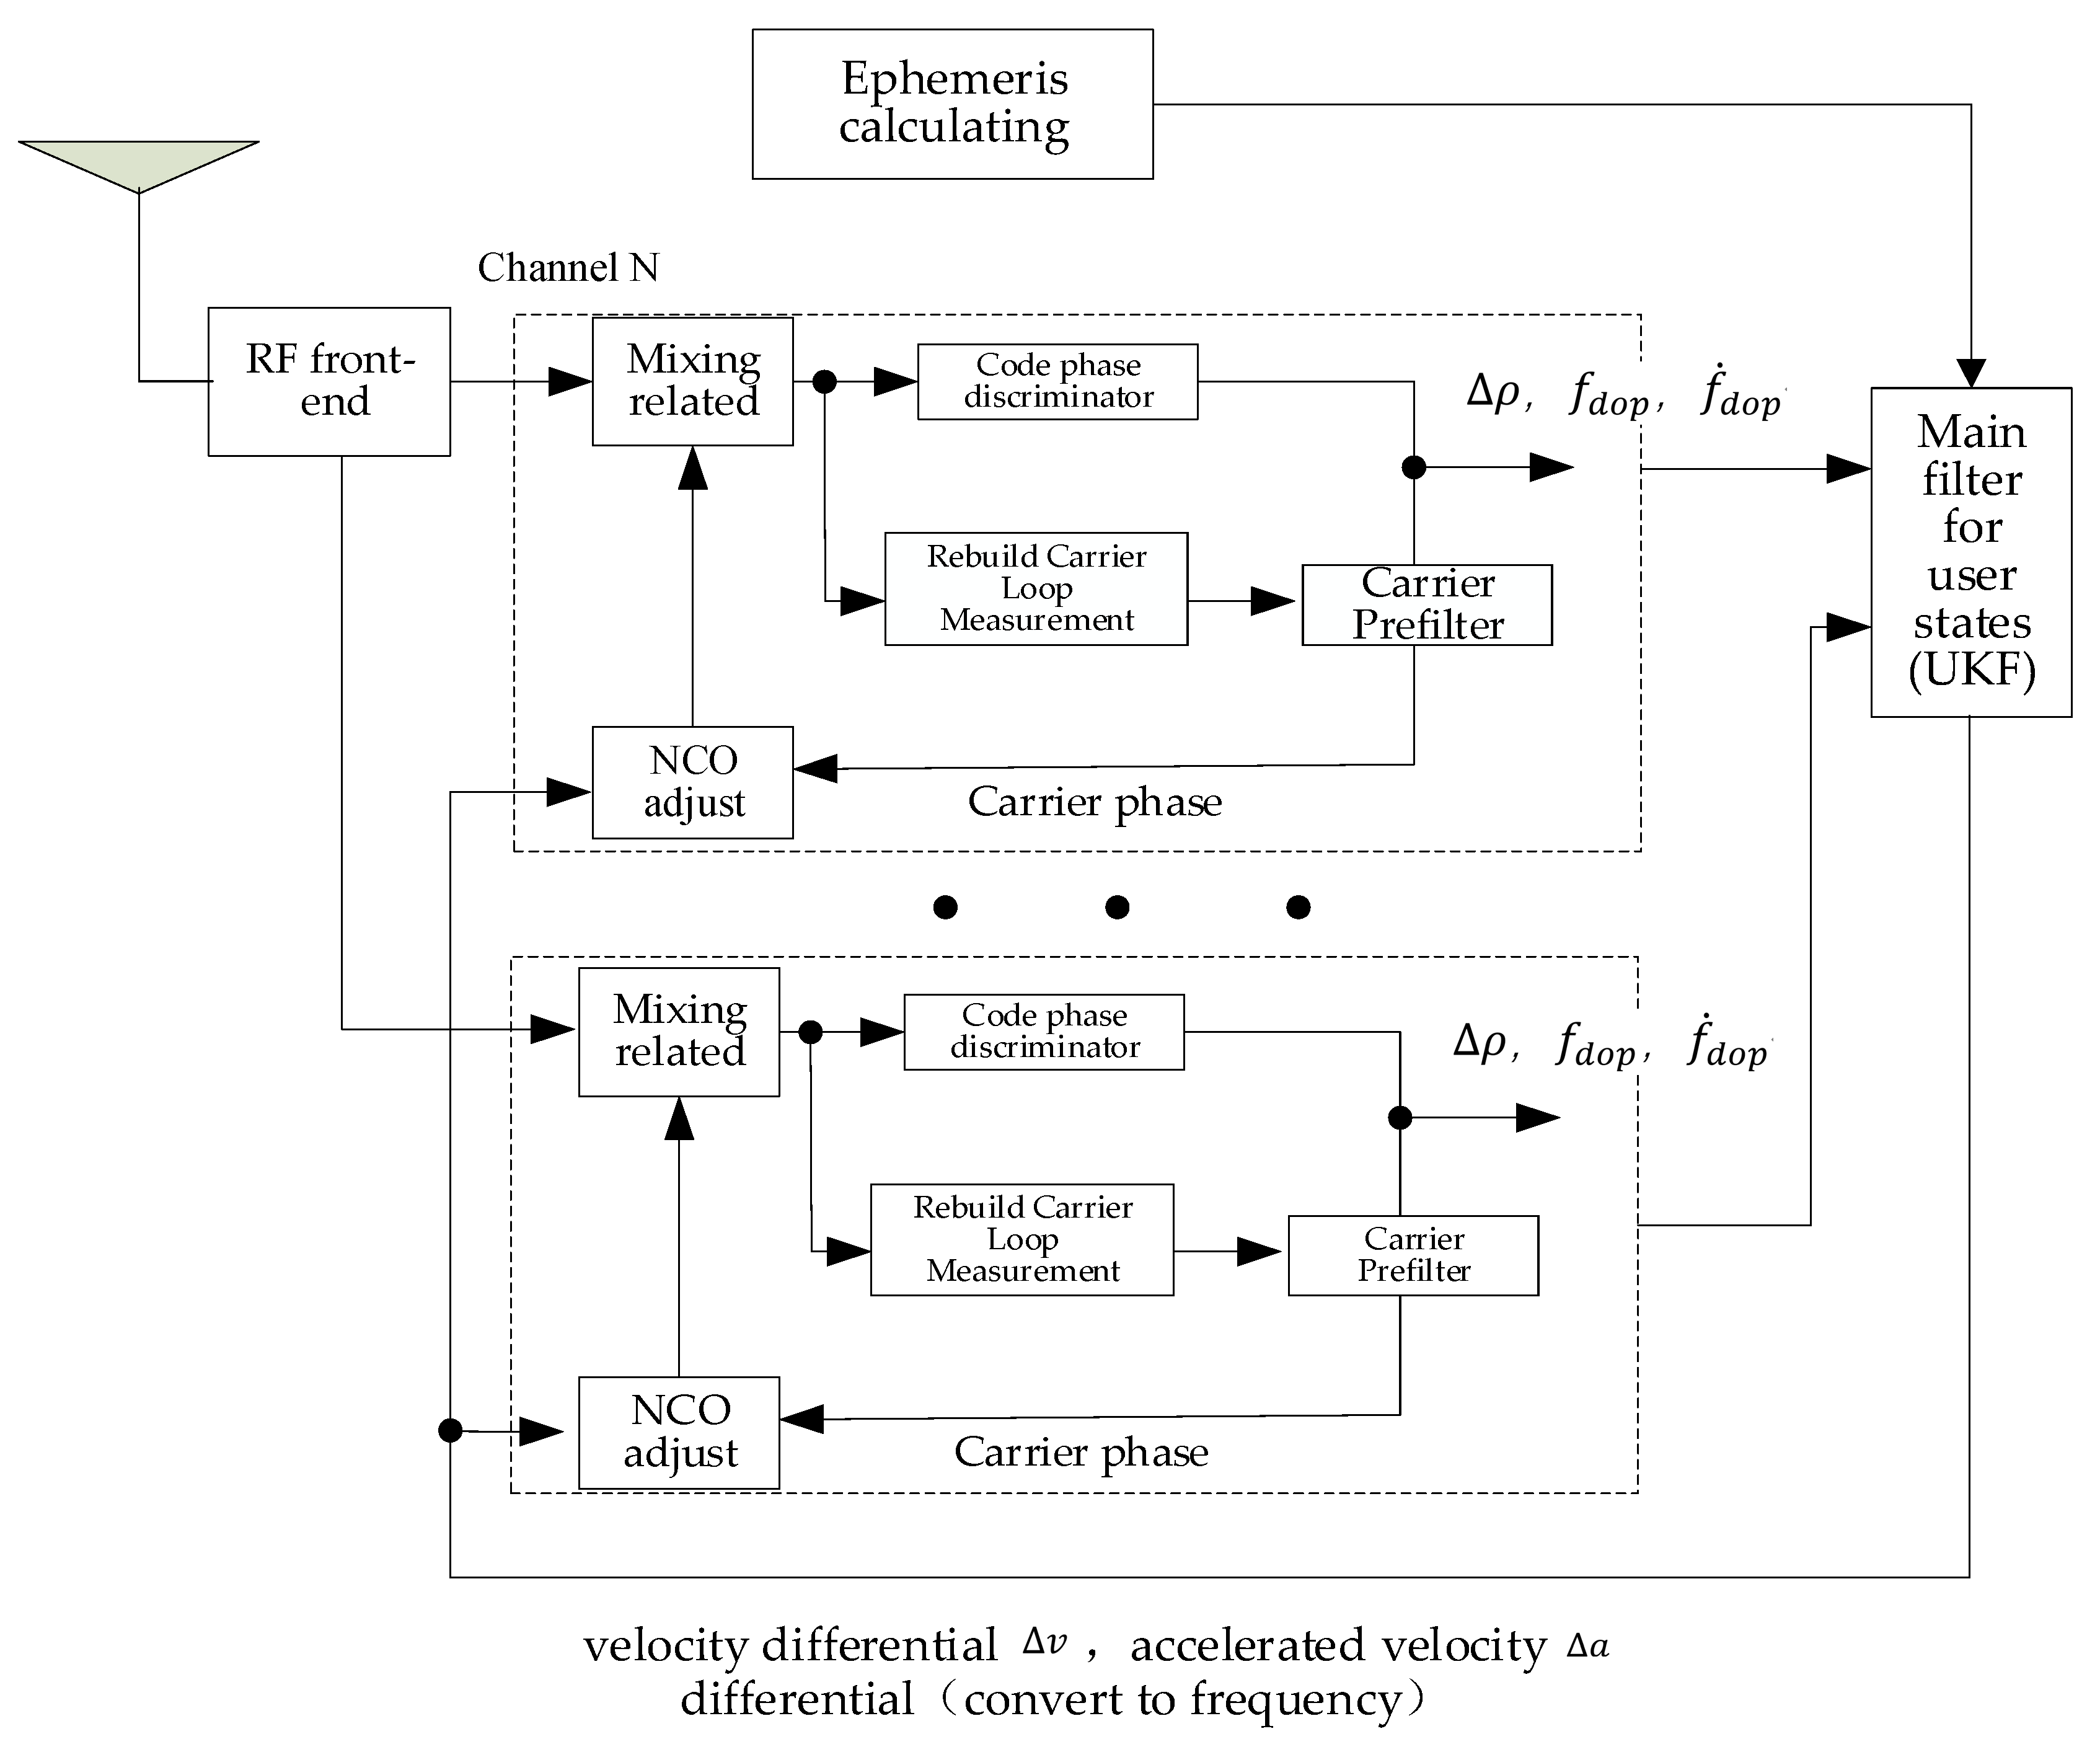
Figure 3 shows the structure of cascading vector tracking. Compared with Figure 2, the original UKF carrier loop becomes the pre-filter with an open loop. The pseudorange differential, the Doppler frequency, and the first order of the Doppler frequency are provided to the main filter by the pre-filter. This structure mainly aims to replace the original carrier loop with a cascade vector structure. Given that the influence of the high dynamics in the signal is mainly reflected on the carrier, the stable tracking of the carrier must be ensured. Then, the carrier-assisted code tracking method can be used to obtain the tracking performance under high dynamics while reducing the loop structure changes. For the feedback, the carrier phase difference must be provided by the pre-filter, and the rest of the frequency feedback values can be provided by the relevant velocity results of the main filter rather than the pre-filter frequency results. Therefore, in this tracking structure, the main filter and its feedback ensure that the channel with a strong signal can assist the channel tracking with a weak signal. Furthermore, the pre-filter can be a rampart for blocking extremely bad signals from contaminating other channels.
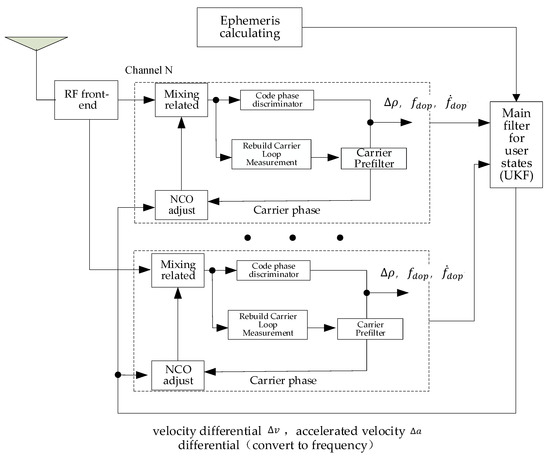
Figure 3.
Cascading vector tracking loop structure chart.
Further, if the vector receiver works in the low dynamic environment, with the cascading filtering, the pre-filter and the main filter can work in different rates. The pre-filter frequency is the same as that of the coherent integration, but the main filter can decelerate the frequency of computation to reduce the calculation because the carrier signal changes caused by low-speed motion are not very large.
In Figure 2 and Equation (6), considering the feedback, the states of the pre-filter are ,, , and . is the difference between the true carrier phase and the receiver NCO’s carrier phase at the start of an integral interval. Therefore, the carrier phase relationship can be expressed as Equation (6), where T is the length of the accumulation interval, and is the intermediate frequency (IF). is the feedback to the carrier’s NCO at time k;
Combined with the Doppler angular frequency, the carrier phase kinetic model is expressed as Equations (7) and (8). At moment k, , , and express the estimated Doppler angular frequency and the first and second order change rates, respectively. is the state noise matrix of the kinetic model. The detailed noise covariance matrixes of the carrier pre-filter formula are provided in [21];
In the main filter, the user states consist of three-axis coordinates ,,, three-axis velocities ,,, three-axis accelerations ,,, clock error , and clock drift . The state equations of the main filter are (9) and (10). is the discrete-time state noise matrix of the main dynamic model. The initial value of the state quantity of the main filter here is provided by the least square module of the scalar tracking;
The output states of the pre-filter are the measurements in the main filter, and the observation equation can be obtained through Equations (11)–(15):
is the code phase difference provided by the code phase detector., , and are the carrier frequency, the first order change rate of the pre-filter, and the clock error of time k, respectively. is the speed of light. , , and are the position, velocity, and acceleration information of the i-th satellite. is the CA code frequency, and is the CNR of channel . is the slope between the code phase difference and the corresponding pseudocode distance difference [22]. is the spacing of correlators. When the narrow correlation technique is not considered, the spacing is generally considered as 0.5 code slices.
Through Equations (11)–(13), the nonlinear observation equation can be integrated as follows (16). Each tracked channel provides three observation values to the main filter through the corresponding pre-filter:
In (8), the feedback of the pre-filter only consists of the tracking results of a single channel, but in the main filter (17)–(19), the feedback is provided by the navigation results. Meanwhile, the position of the receiver is determined by the pseudorange, which causes the carrier phase information to be covered by the pseudo-distance information with large perturbations. Therefore, the difference () between the actual signal and replication carrier phases must be obtained through the pre-filter rather than the main filter. Compared with the feedback of pre-filter (8), in Equations (17)–(19), the effect of the second derivative of the Doppler frequency on the feedback can be ignored. is still the difference between the true and receiver NCO’s carrier phases. represents the carrier Doppler frequency converted from the carrier and corresponding satellite velocities. represents the carrier Doppler frequency first derivative converted from the carrier and corresponding satellite accelerations:
3. Results
3.1. GPS Signal Source Used
First, this paper takes the GPS L1 CA code as the main verification object, and the data is divided into two types: highly dynamic and static. Given the particularity of highly dynamic data, this study adopted two methods, namely, self-generation and navigation signal simulator acquisition.
Three GPS signal sources were used in this study. The first one was generated from a self-designed signal generator and is described in detail in Section 3.2.1. The second signal source was generated by the Spirent GSS8000 GNSS signal simulator. OLinkStar NS210M was used as the sampler, the corresponding intermediate frequency was 4.123968 MHz, the sampling frequency was 16.367667 MHz, and the sampling bit width was set to 2 bits. The final source is a low dynamic signal measured from an outdoor antenna. The measured data’s bit width was 8 bits, the sampling frequency was 38.192 MHz, and the IF was 9.548 MHz.
3.2. Results Analysis
In this section, the verification of the vector loop is divided into two primary aspects. One is the testing with the simulated signal generated by a self-designed signal generator, which is used to inspect the dynamic performance of the loop. The other is illustrating the completeness of the entire structure in highly dynamic environments with the signal of the navigation signal simulator, and the convergence performance of the vector loop is verified by these signals. Finally, the positioning results of actual data and simulator data are added as supplementary verification results.
3.2.1. Simulation and Analysis of High Dynamic Signal
The simulation conditions are summarized as follows: the sampling frequency is set as 40 MHz, the IF frequency is set to 4 MHz, and the sampling bit width is set to 8 bits. The signal is unblocked, and the carrier to noise density of each tracking channel is above 40 dB∙Hz. The selected satellite PRN is 05. Without navigation data, the acquired carrier Doppler frequency (f) is approximately 26,572 Hz (The relative velocity between the receiver and the satellite is 5060 m/s).
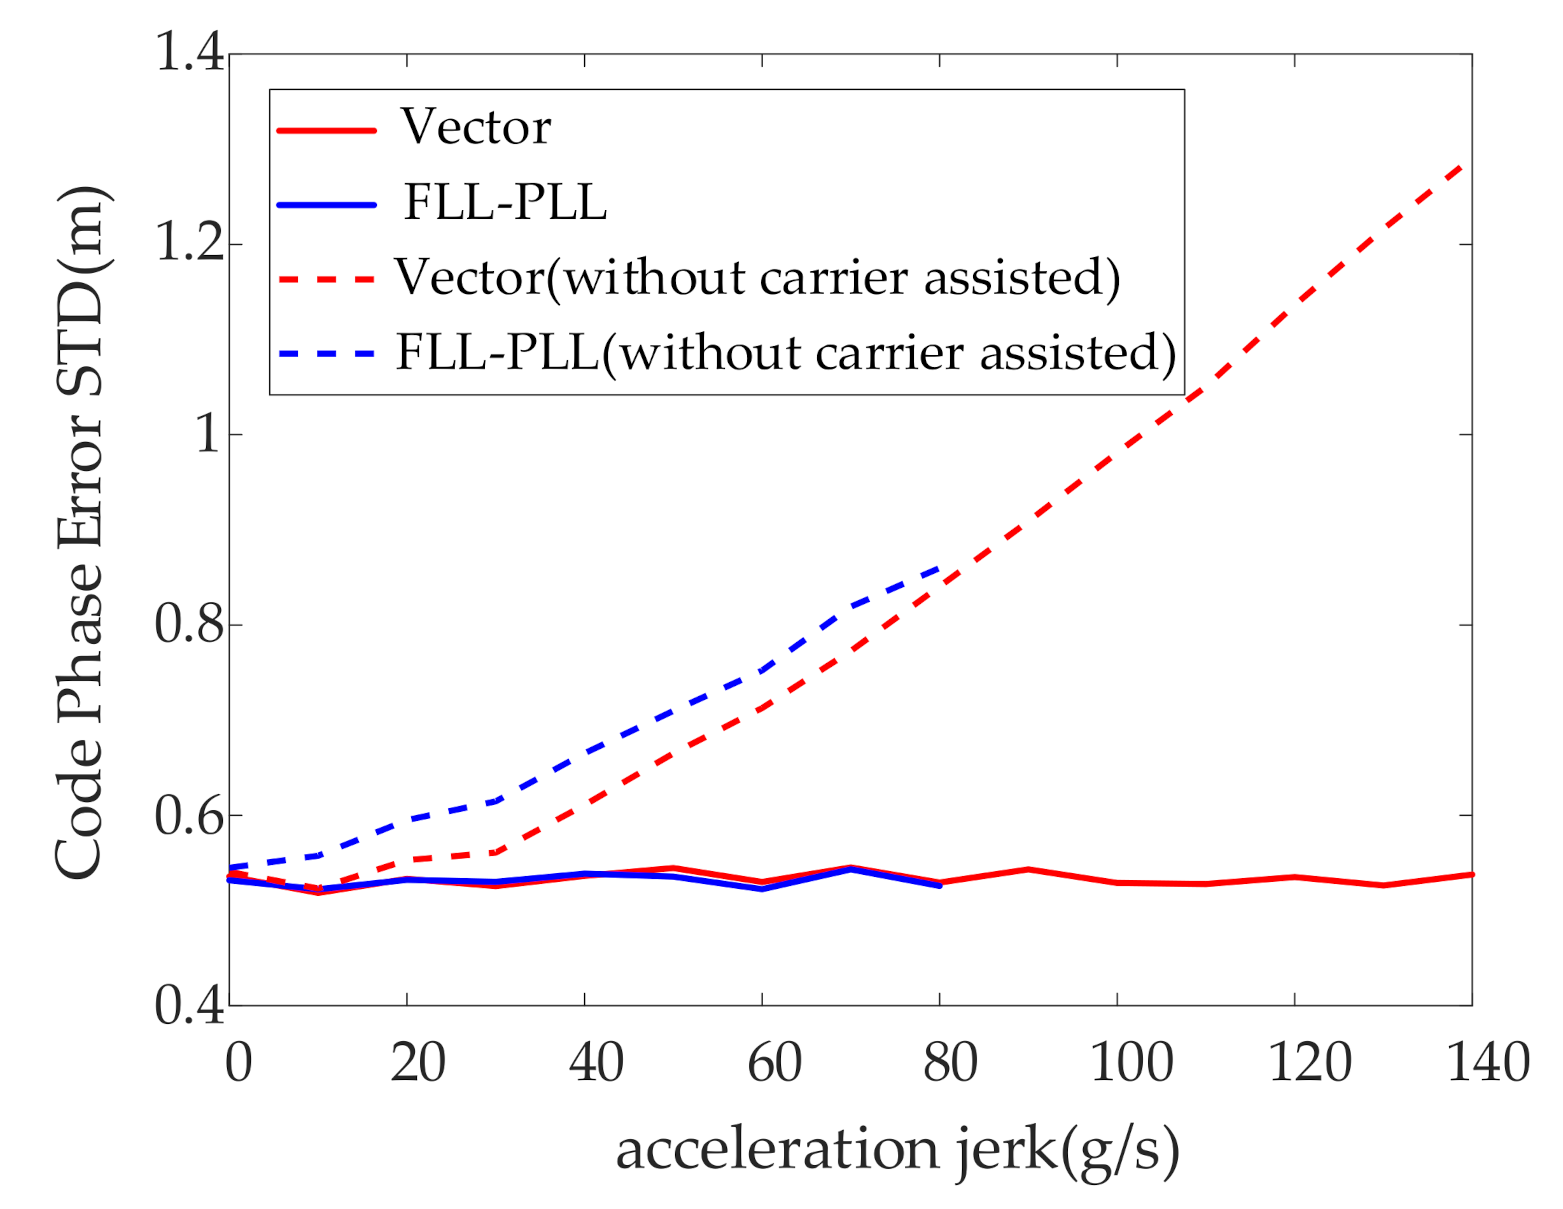
First, to illustrate the difference in dynamic performance of the FLL-PLL and the vector tracking loop, we designed 15 scenarios, ranging from 0 g/s to 140 g/s, in the unit of 10 g/s. In Figure 4, the X coordinate is the acceleration jerk (g/s) in different dynamic conditions, and the Y coordinate represents the tracking standard deviation (STD) of the code phase. The blue and red curves represent the code phase errors of the FLL-PLL and the vector loop, respectively. The dotted curves are the corresponding results without the carrier loop assistance. Although the high dynamic signal will deteriorate the tracking accuracy of the independent code loop, the lock loss in the high dynamic signal is mainly caused by the carrier loop. Furthermore, the code loop is not very sensitive to the change in receiver dynamics. This result also shows that we need not to modify the code loop, but rather use the carrier frequency to assist the normal code tracking for high dynamic signals. The carrier-assisted method will also be adopted later and will not be described again.
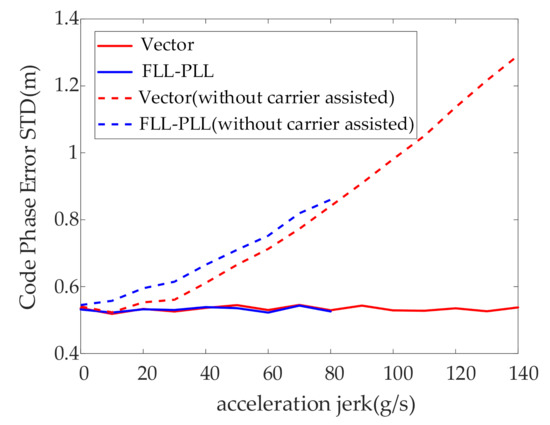
Figure 4.
Stable tracking results of carrier frequency in the acceleration jerks 30 g/s.
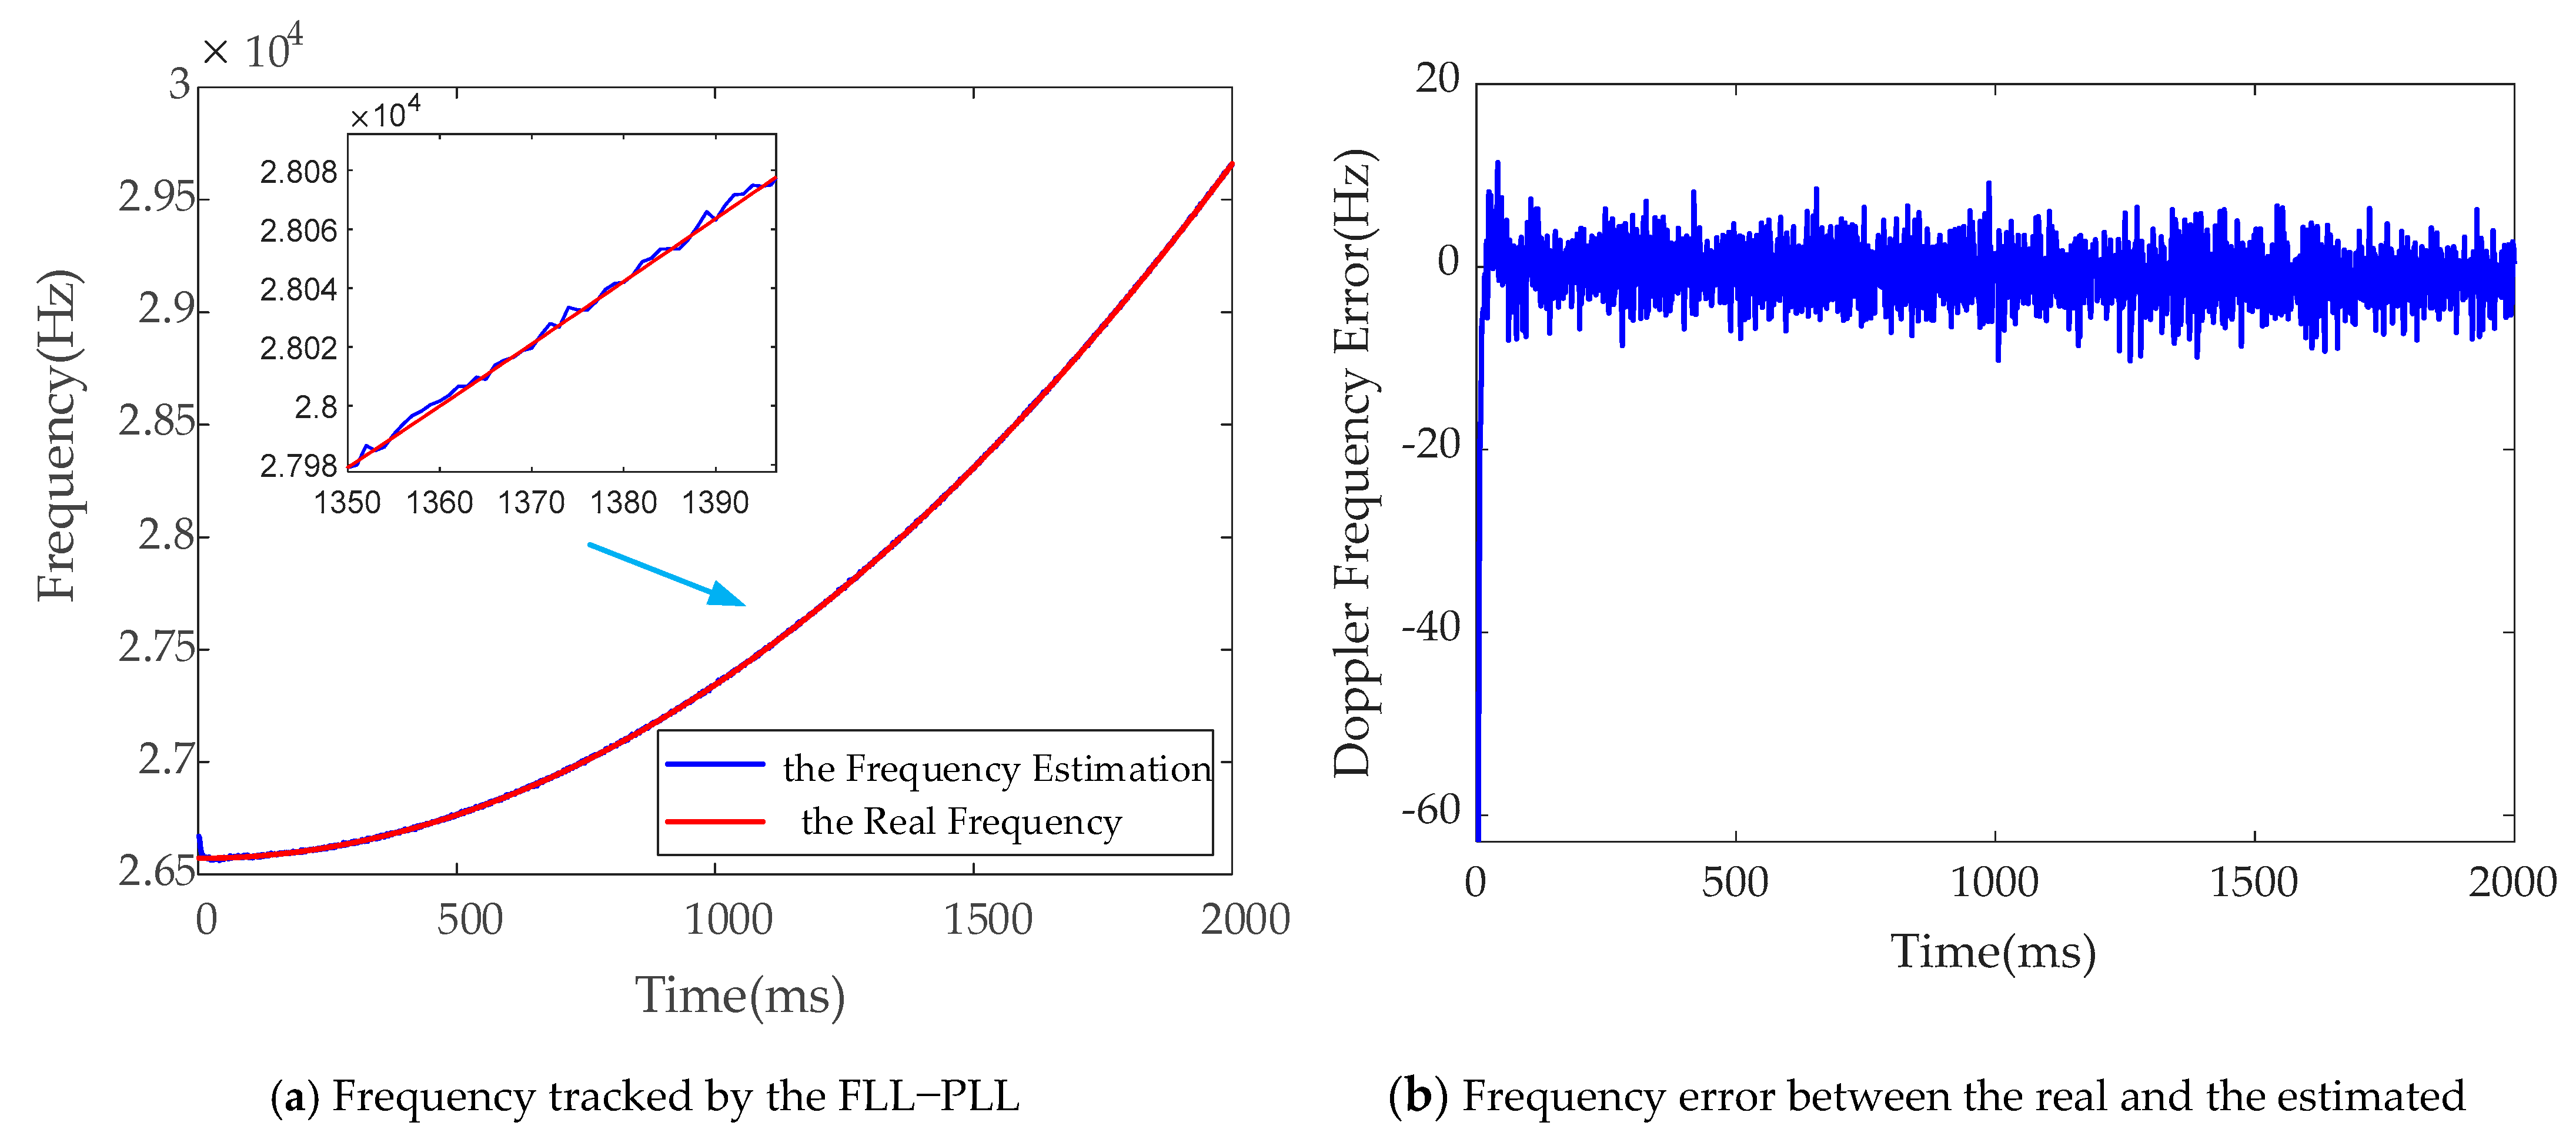
Figure 5a shows the estimated and real carrier frequencies based on the IF. When the acceleration jerk is 30 g/s, the blue curve oscillates around the truth value with the motion. In Figure 5b, the Doppler frequency error is calculated by subtracting the true Doppler value from the filter output. Frequency tracking can be stabilized around the real value (for tracking highly dynamic signals, the frequency bandwidth is 20 Hz, and the phase bandwidth is 40 Hz).
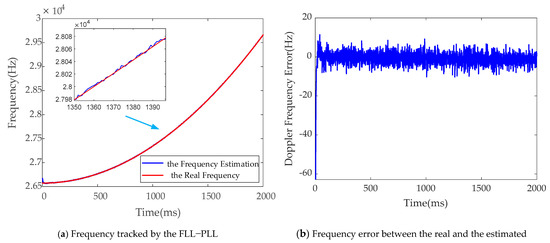
Figure 5.
Stable tracking results of carrier frequency in the acceleration jerks 30 g/s.
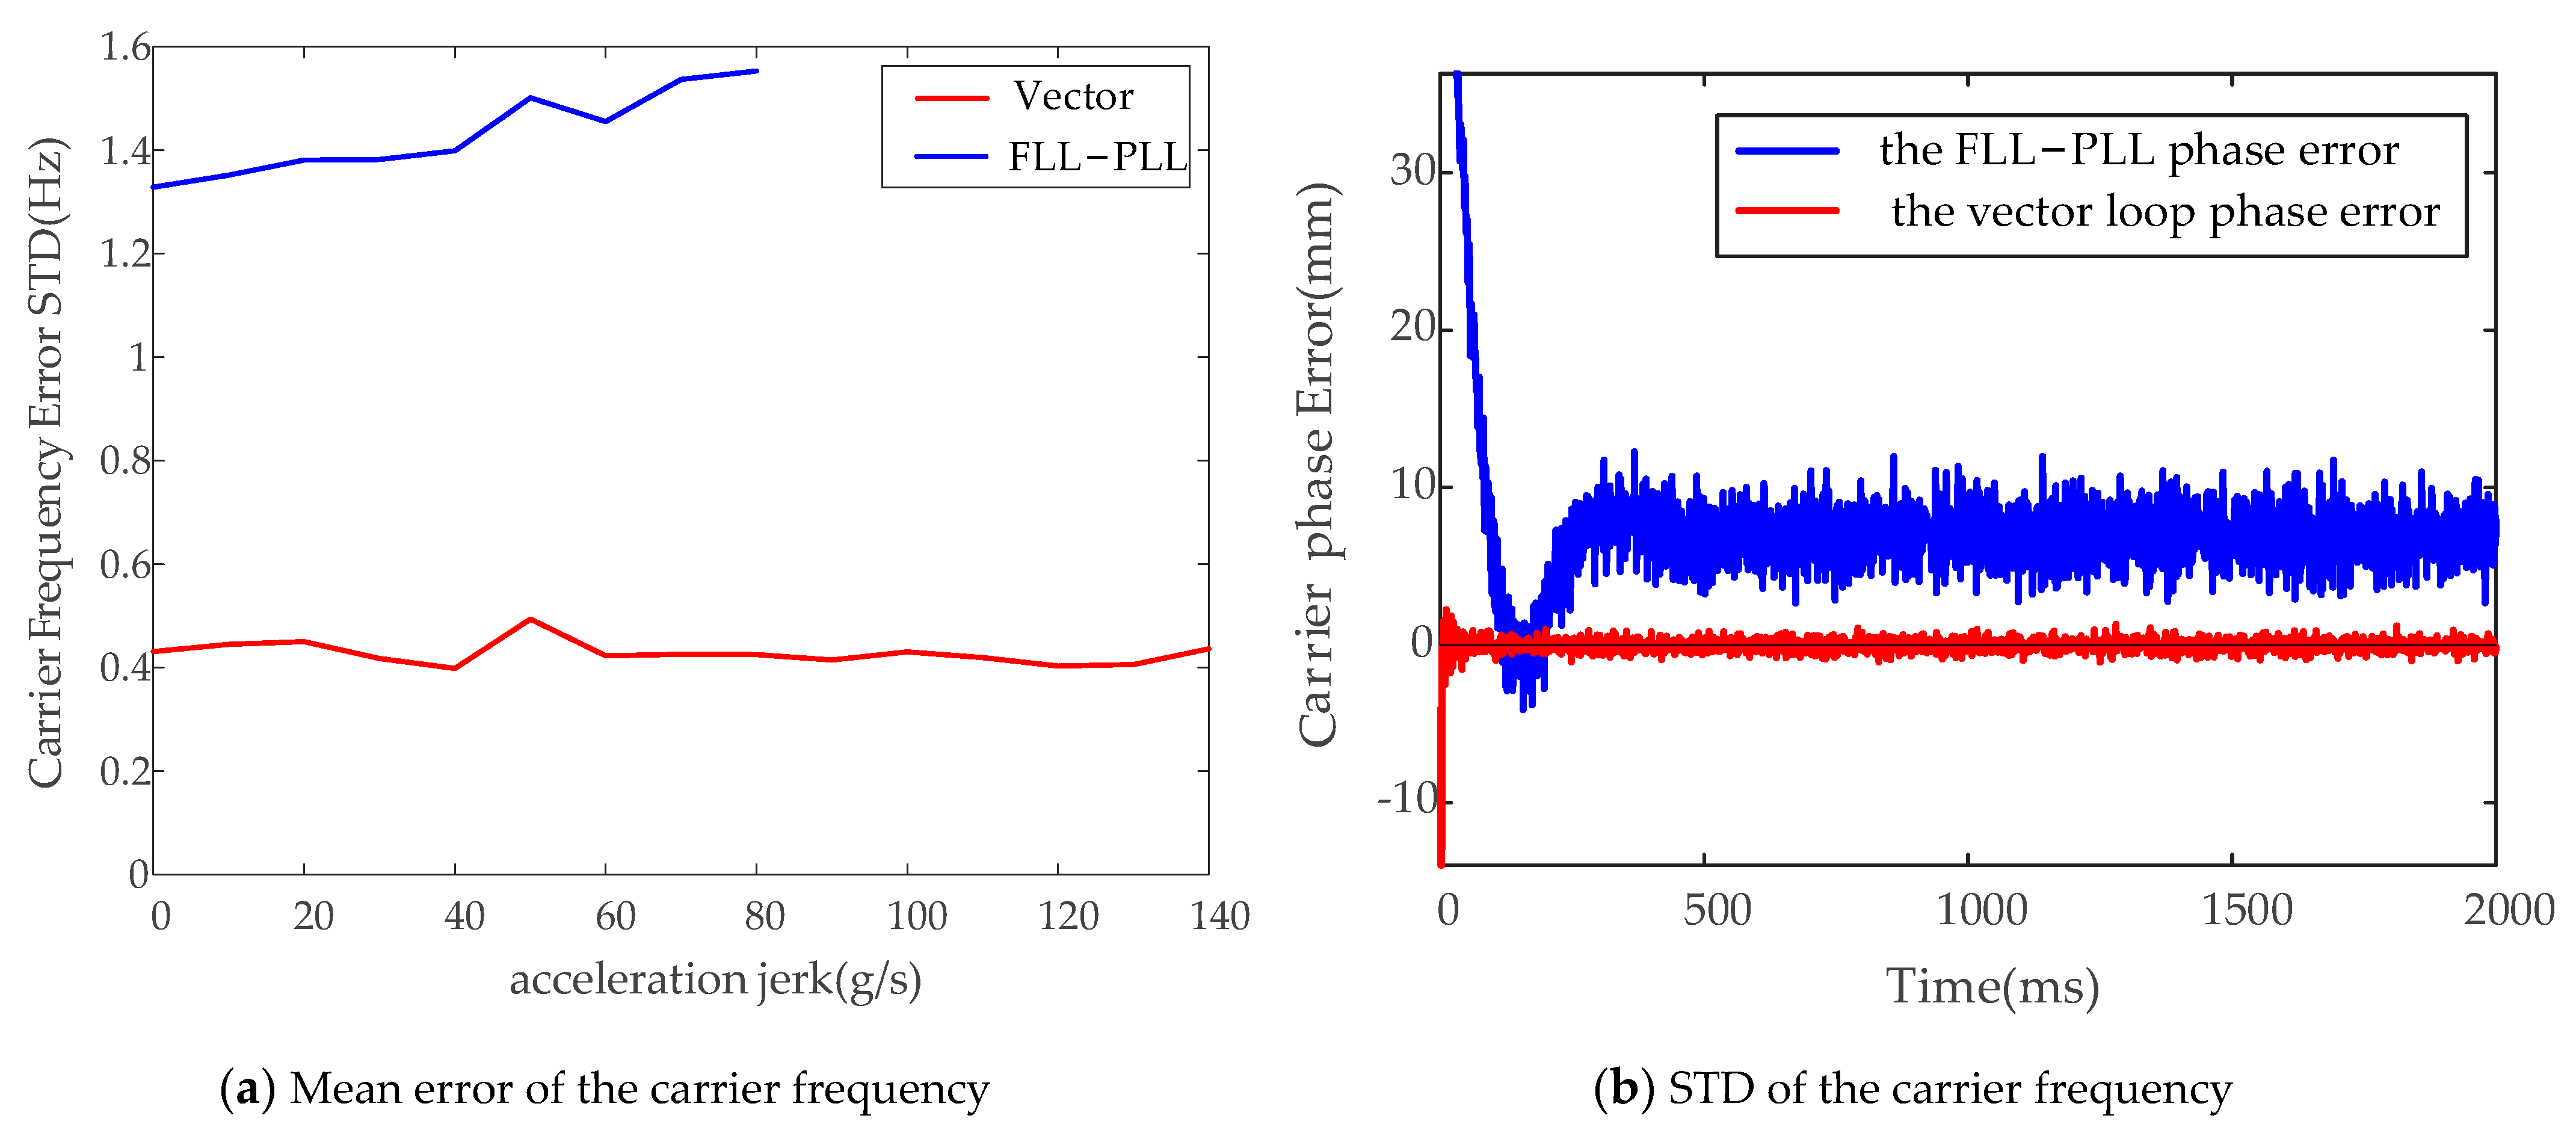
The red curves represent the results of the vector structure, and the blue curves represent the results of the FLL-PLL. In Figure 6a, the STD of the carrier frequency error of FLL-PLL increases slowly with the acceleration jerk. The original STD of FLL-PLL is much larger than that of the vector loop because of the amplification of the noise bandwidth. In Figure 6b, the steady-state phase tracking error of FLL-PLL is constant in the acceleration jerk scene, which is consistent with the theoretical trend of the steady-state tracking error of the FLL-PLL structure. However, in the pre-filter of this vector structure, we estimate the second derivative of carrier frequency as a parameter, so the vector loop can still track the signal with jerk acceleration accurately.
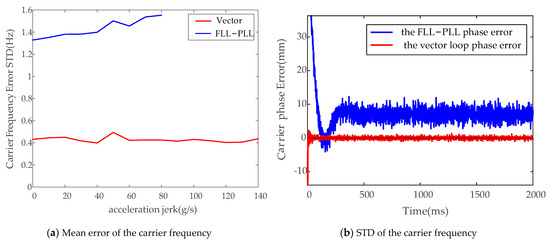
Figure 6.
Stable tracking results of carrier frequency under different acceleration jerks.
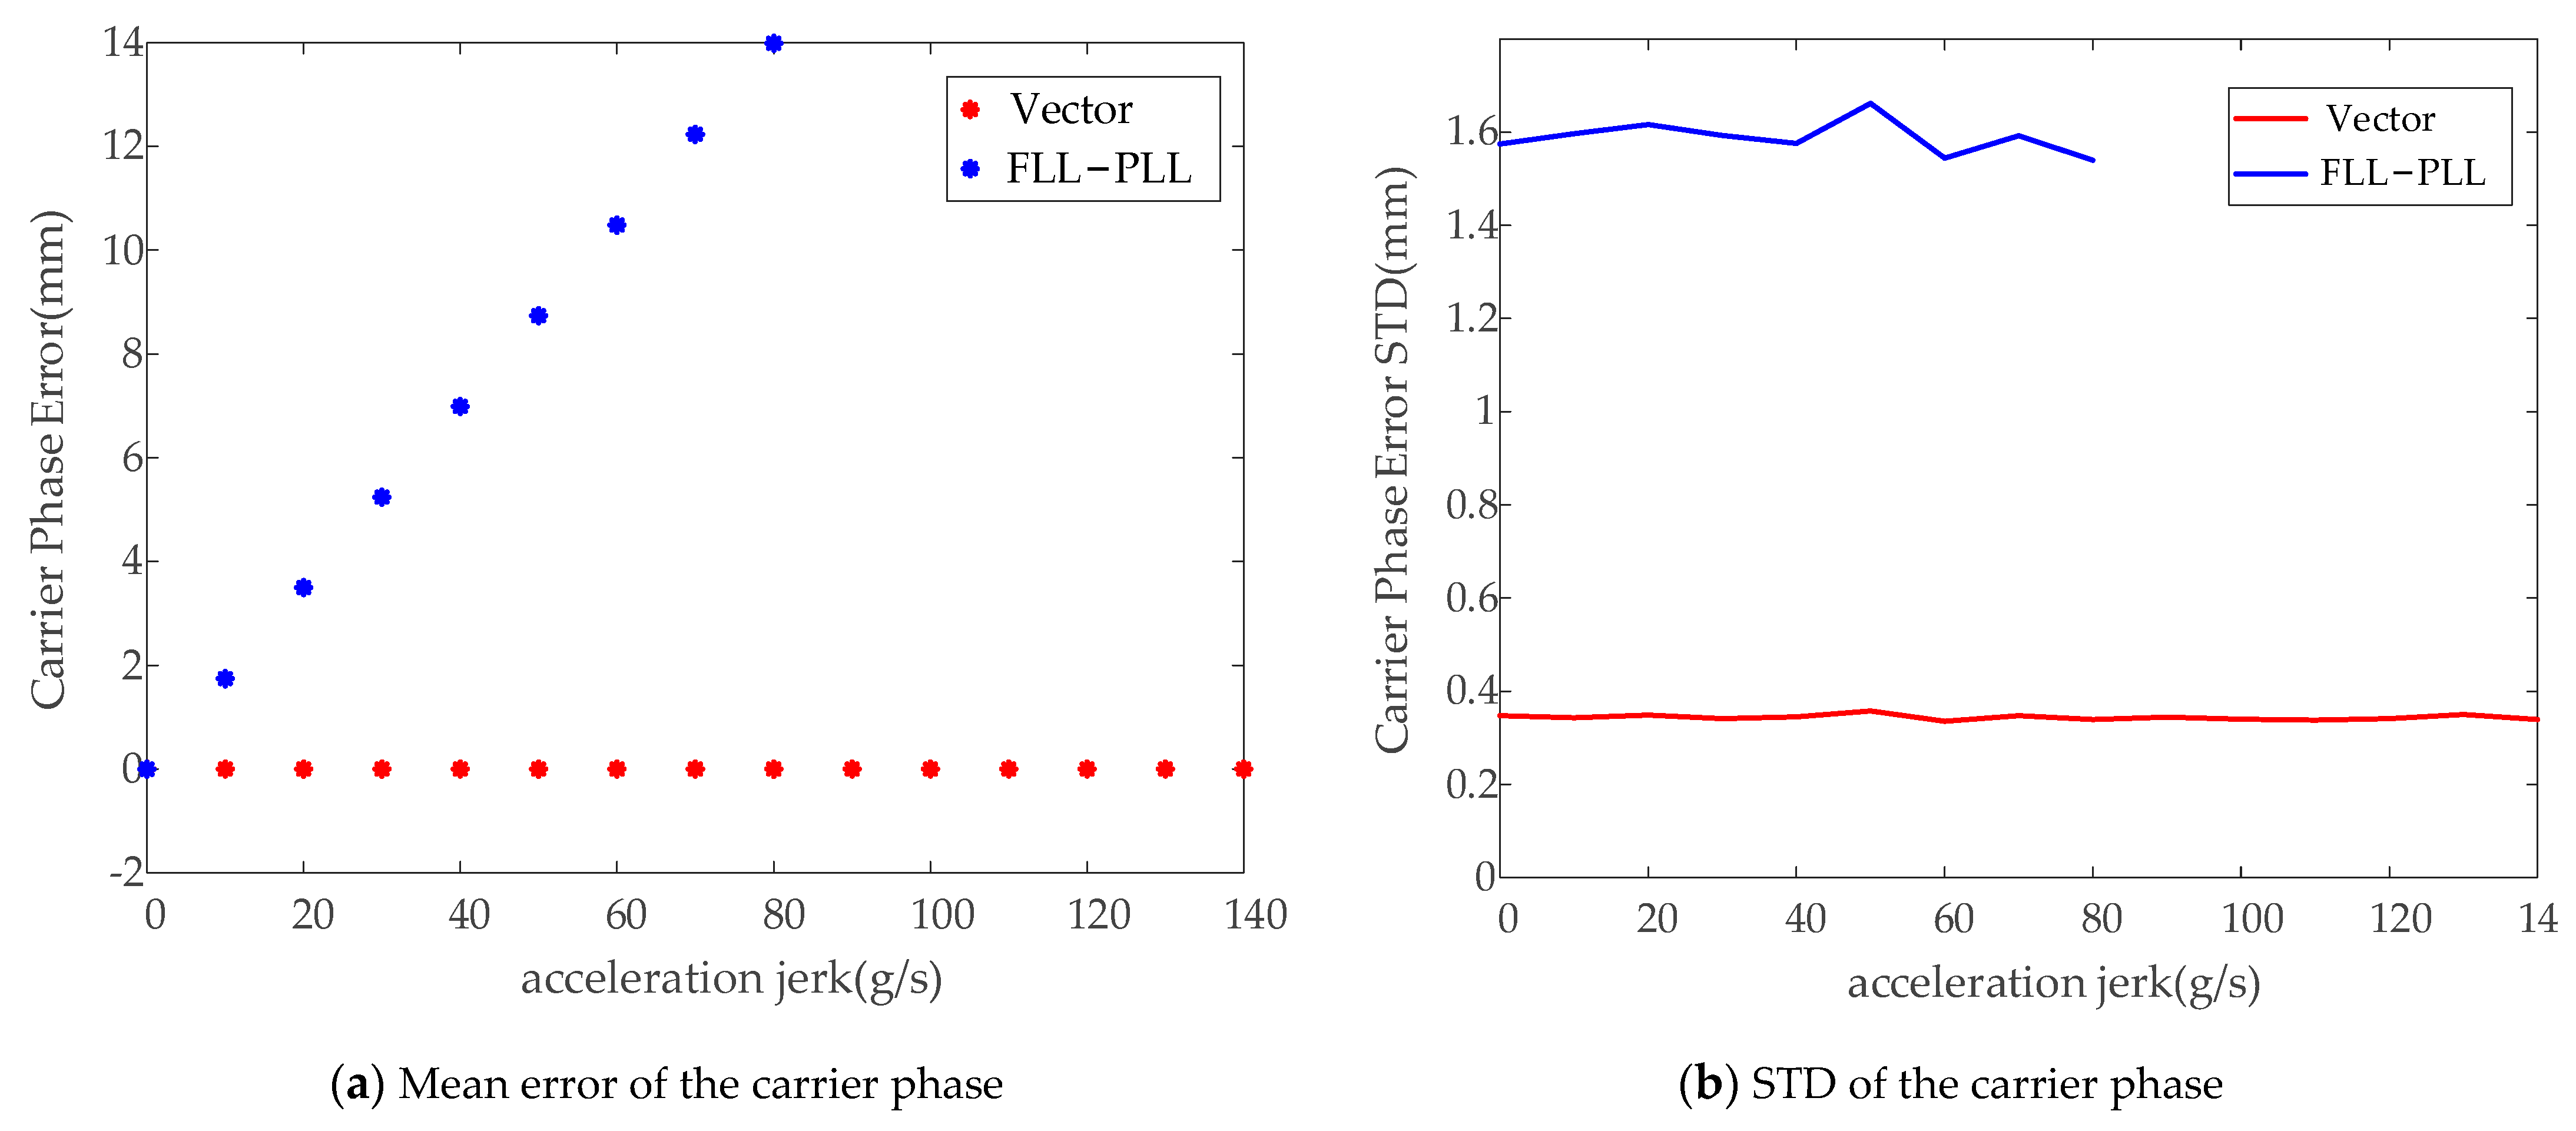
In Figure 7, the meanings of different colors are the same as those in Figure 6. The Y coordinates represent the mean error of the carrier phase and the STD of the carrier phase, respectively. All the blue ones are approximately 80 g/s because the judgment threshold selected is not the theoretical steady-state tracking error threshold but the energy distribution of the IQ value. When the energy of the Q branch reaches half that of the I branch, considering the ephemeris calculation, we regard the subsequent results as having poor tracking accuracy and discard them. According to Figure 6 and Figure 7, we prove that the vector tracking structure based on the UKF has better tracking accuracy and wider tracking range than the FLL-PLL.
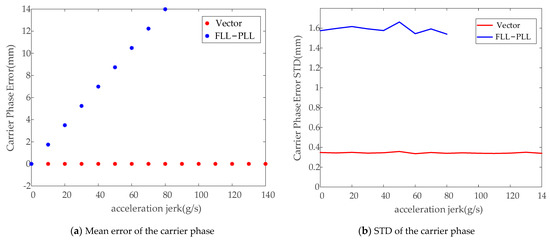
Figure 7.
Stable tracking results of carrier phase under different acceleration jerks.
Then, we designed a special scene to verify the tracking capability of the vector loop. The signal’s dynamic situation is shown in Table 1.

Table 1.
Comparison of two tracking structures under different dynamics.
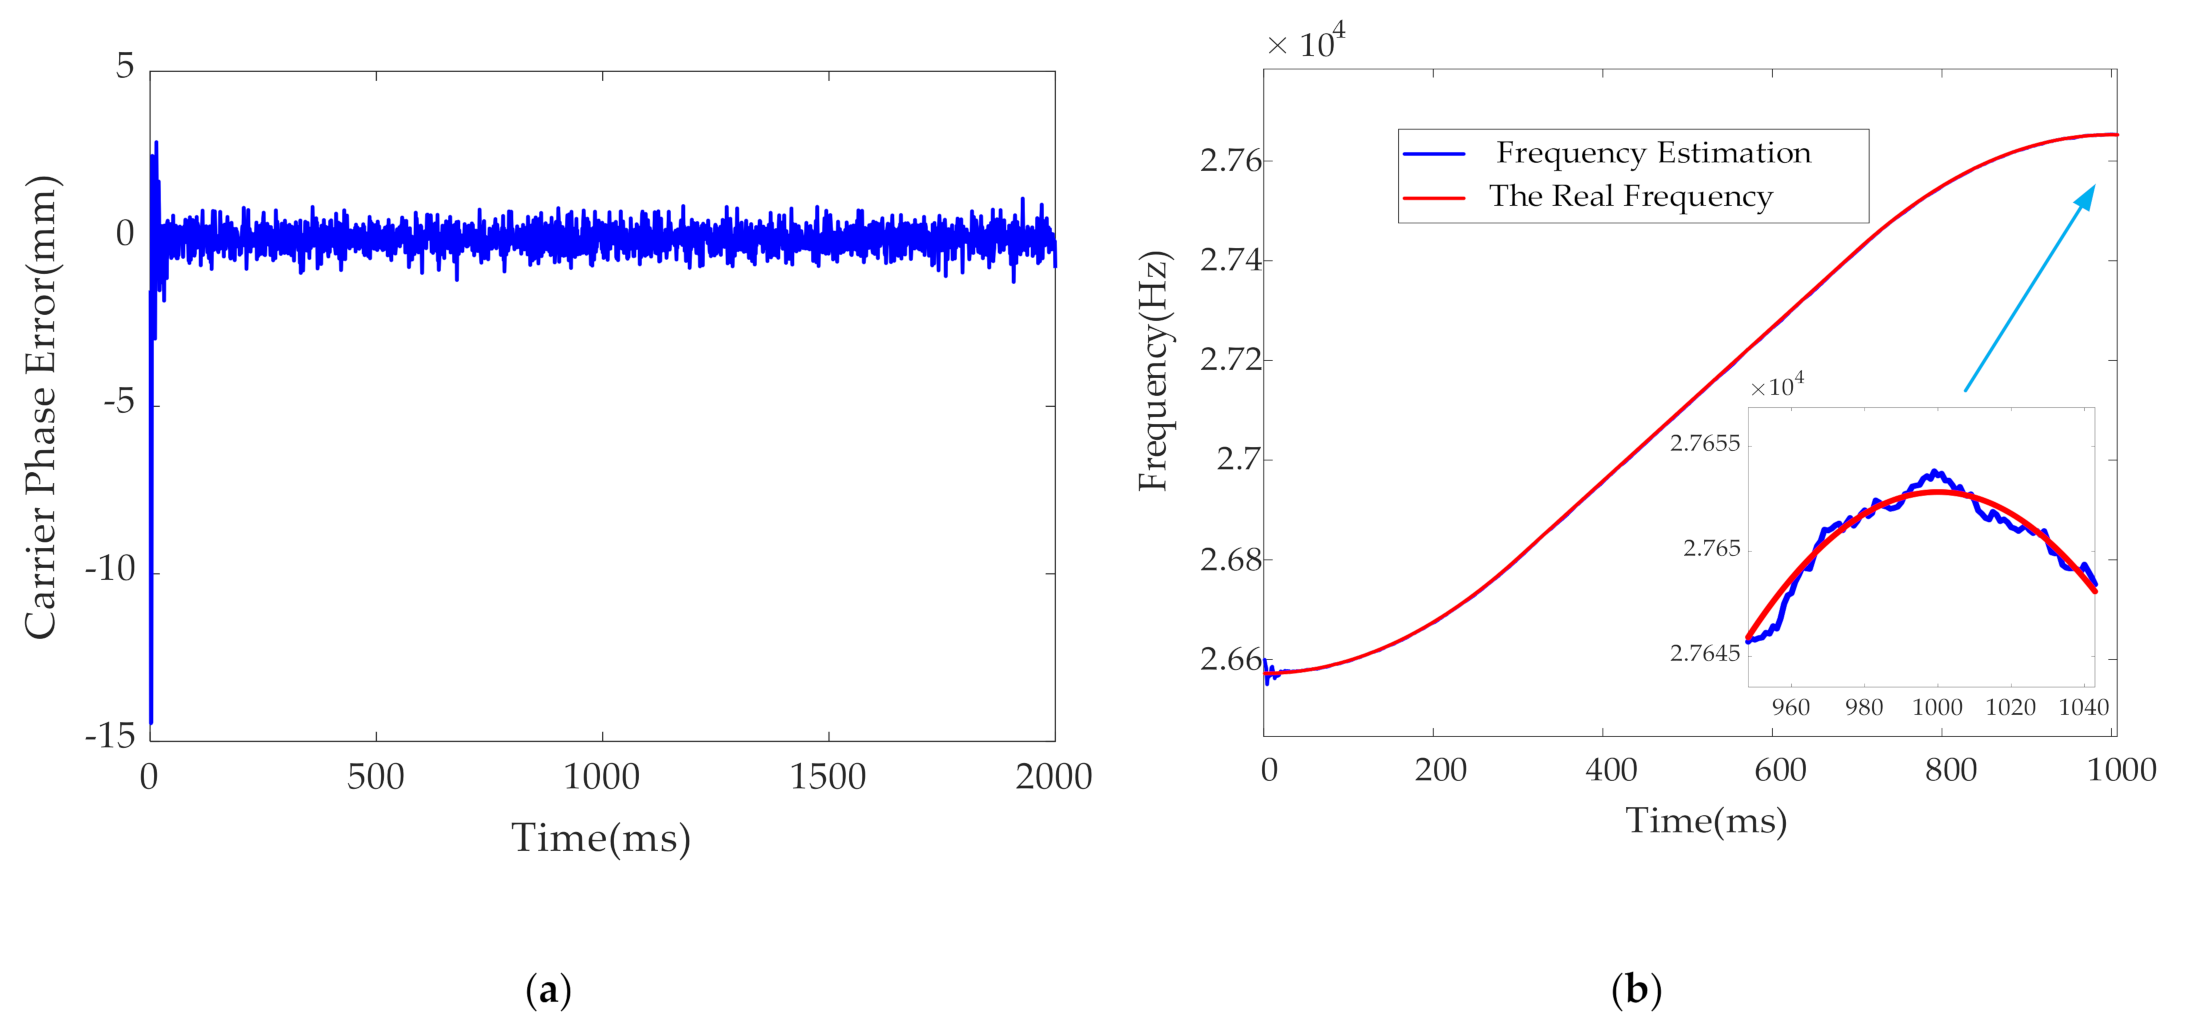
In Figure 8a, Tracking error results of carrier phase under varying acceleration jerks (a), the Y coordinate represents the carrier phase error of the vector loop. Unlike the tracking result of FLL-PLL, carrier phase tracking is very stable regardless of the magnitude and direction of the acceleration jerk change. Figure 8a Tracking error results of carrier phase under varying acceleration jerks (b) shows the carrier frequency tracking results of the vector tracking under the dynamic condition in Table 1. The X-axis is the time of signal tracking, and the Y-axis is the carrier Doppler frequency. The red and blue curves represent the real carrier and estimated Doppler frequencies, respectively. The results of the frequency tracking are also stable enough.
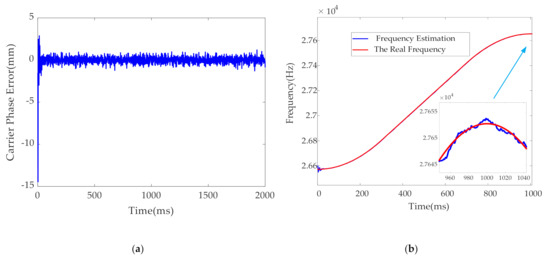
Figure 8.
(a) Tracking error results of carrier phase under varying acceleration jerks, (b) Contrast of carrier frequency under varying acceleration jerk.
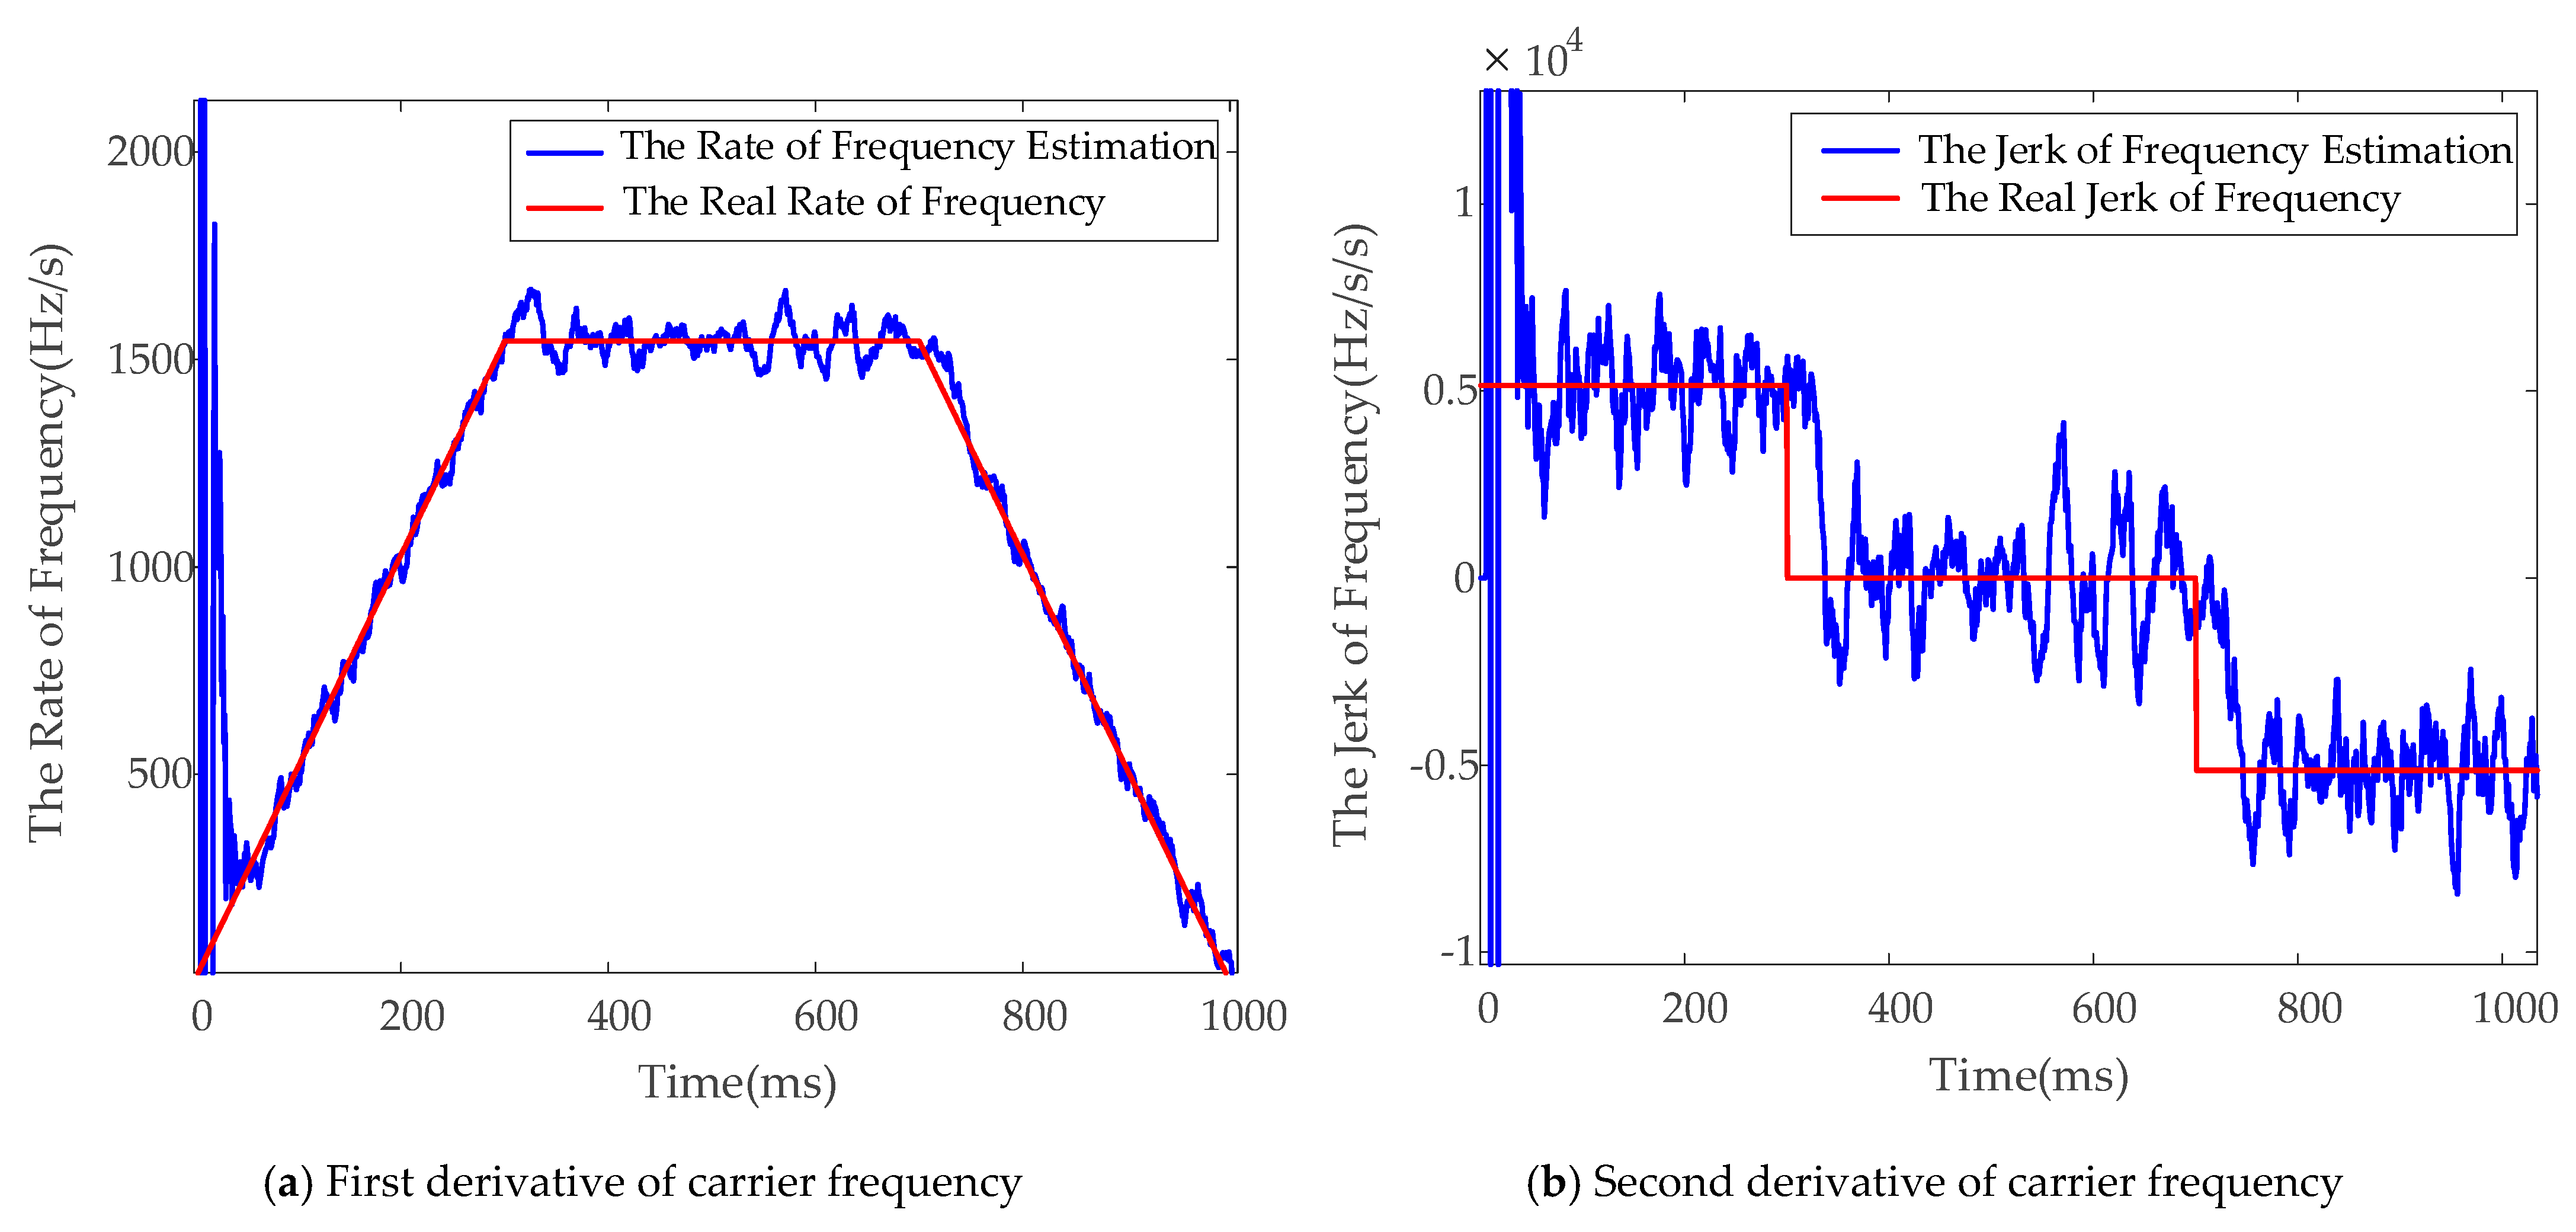
Figure 9a,b provide the comparison results between the first derivative, the second derivative of the carrier Doppler frequency, and the true value, respectively. Both red curves are the true first derivative and the second derivative of the carrier Doppler frequency. The higher the derivative order is, the worse the jitter and the slower the convergence are because of the weak constraint of the observation equation. Despite this, the cascading vector loop can still stably track the dynamic signals with the acceleration jerk changes.
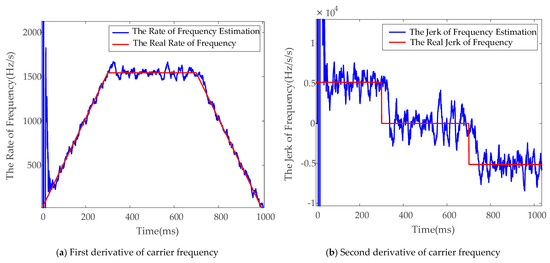
Figure 9.
Contrasts of the first and second derivatives of carrier frequency with varying acceleration jerks.
3.2.2. Signal Analysis Based on the Simulator
To test the vector tracking mode, the initial user state must be provided, so the data generated by the simulator is first positioned by the scalar mode and then converted to the vector tracking mode (see detail in Table 2). In the high dynamics environment test, the signal is unblocked, and the signal electricity is better than −130 dbm on average.

Table 2.
Setting the dynamic changes in experiments.
Testing in high dynamics with the signal simulator Spirent GSS8000, the initial position was set to the point of WGS84 coordinates (6378050, −7200, 0), with only the positive speed (5000 m/s) of the Y-axis at the beginning of at the signal initial moment. Only acceleration exists on the Y-axis. Five sets of dynamic data under the accelerations of −20, −40, −60, −80, and −100g were collected, and the different accelerations were obtained through the variable acceleration movement for 1 s. The motion mode of the carrier in the signal source was set as shown in Table 2 (in the navigation signal simulator, g was set as 10 m/s2).
In highly dynamic environments, the mature solution is to adopt the second-order frequency locked loop assisted third-order phase locked loop (FLL-PLL). To ensure a good dynamic performance, the noise bandwidth of the FLL-PLL loop was large enough. Although the noise bandwidth was big enough. Table 3 shows that the dynamic range of the vector loop is much higher than that of the FLL-PLL loop, indicating that our vector loop is more robust than the FLL-PLL loop. The initial values must be provided by scalar loops, so the stability of the loop is important when different pre-filters are switched. Thus, the FLL-PLL loop is clearly unfit for this job. Finally, in this case, the increased noise will affect the accuracy of the tracking loop. Table 3 shows that under the same dynamic condition, the carrier phase tracking error of the vector structure is much lower than that of the FLL-PLL loop when the tracking is stable.

Table 3.
Tracking result between FLL-PLL loop and vector loop.
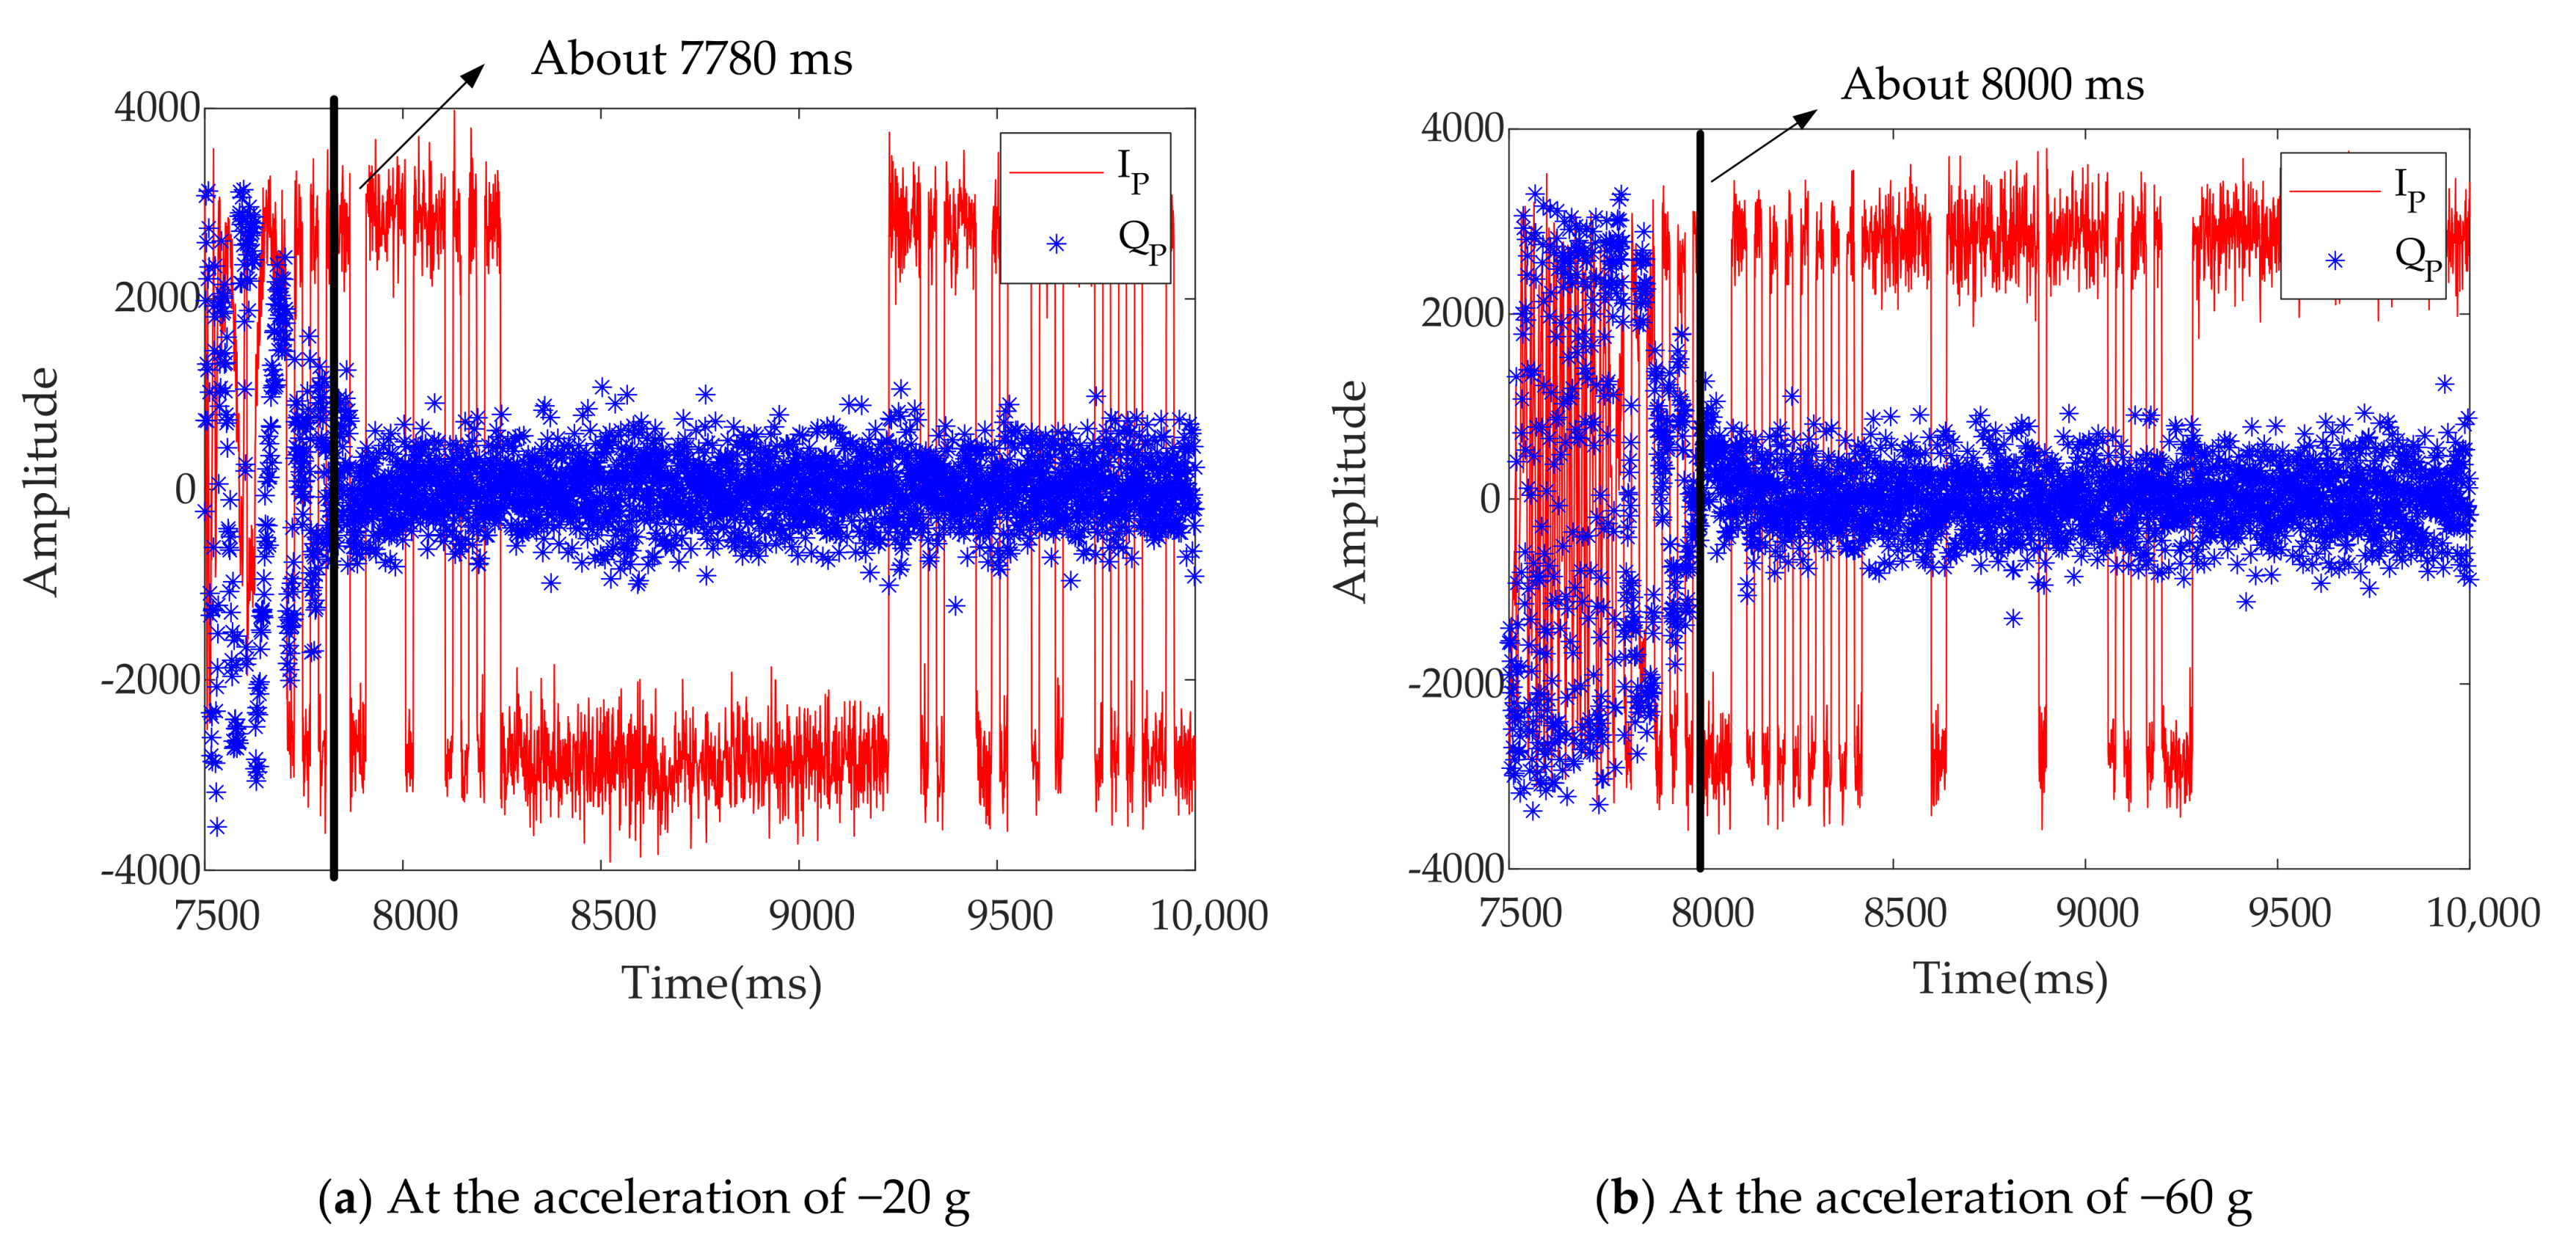
Figure 10 shows the IQ demodulation graph after the tracking signal of the FLL-PLL loop. The red curve is the amplitude of instant code branch I, and the blue discrete point set is the amplitude of instant code branch Q. The black vertical lines in the figures show the moments when the IQ values converge steadily.
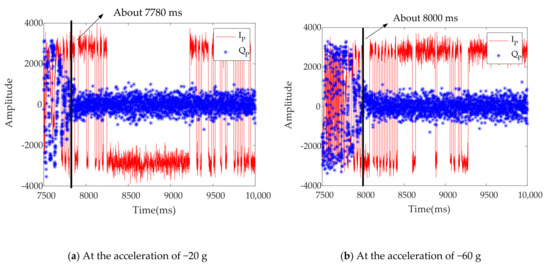
Figure 10.
IQ demodulations of the FLL-PLL loop under different dynamics.
Figure 10a shows the IQ demodulations of the −20 g carrier acceleration, and Figure 10b shows the IQ demodulations of the −60 g carrier acceleration. To clarify the influence of different dynamic environments on convergence time, the pictures show the tracking results from the loop switches to stable tracking. In (a), the time consumed by signal tracking from traction to stabilization is approximately 280 ms. However, in (b), the convergence time of signal tracking is approximately 500 ms, indicating that the convergence time of this frequency locked loop assisted phase locked loop increases with the dynamic increase of the carrier until signal loss (Table 3).
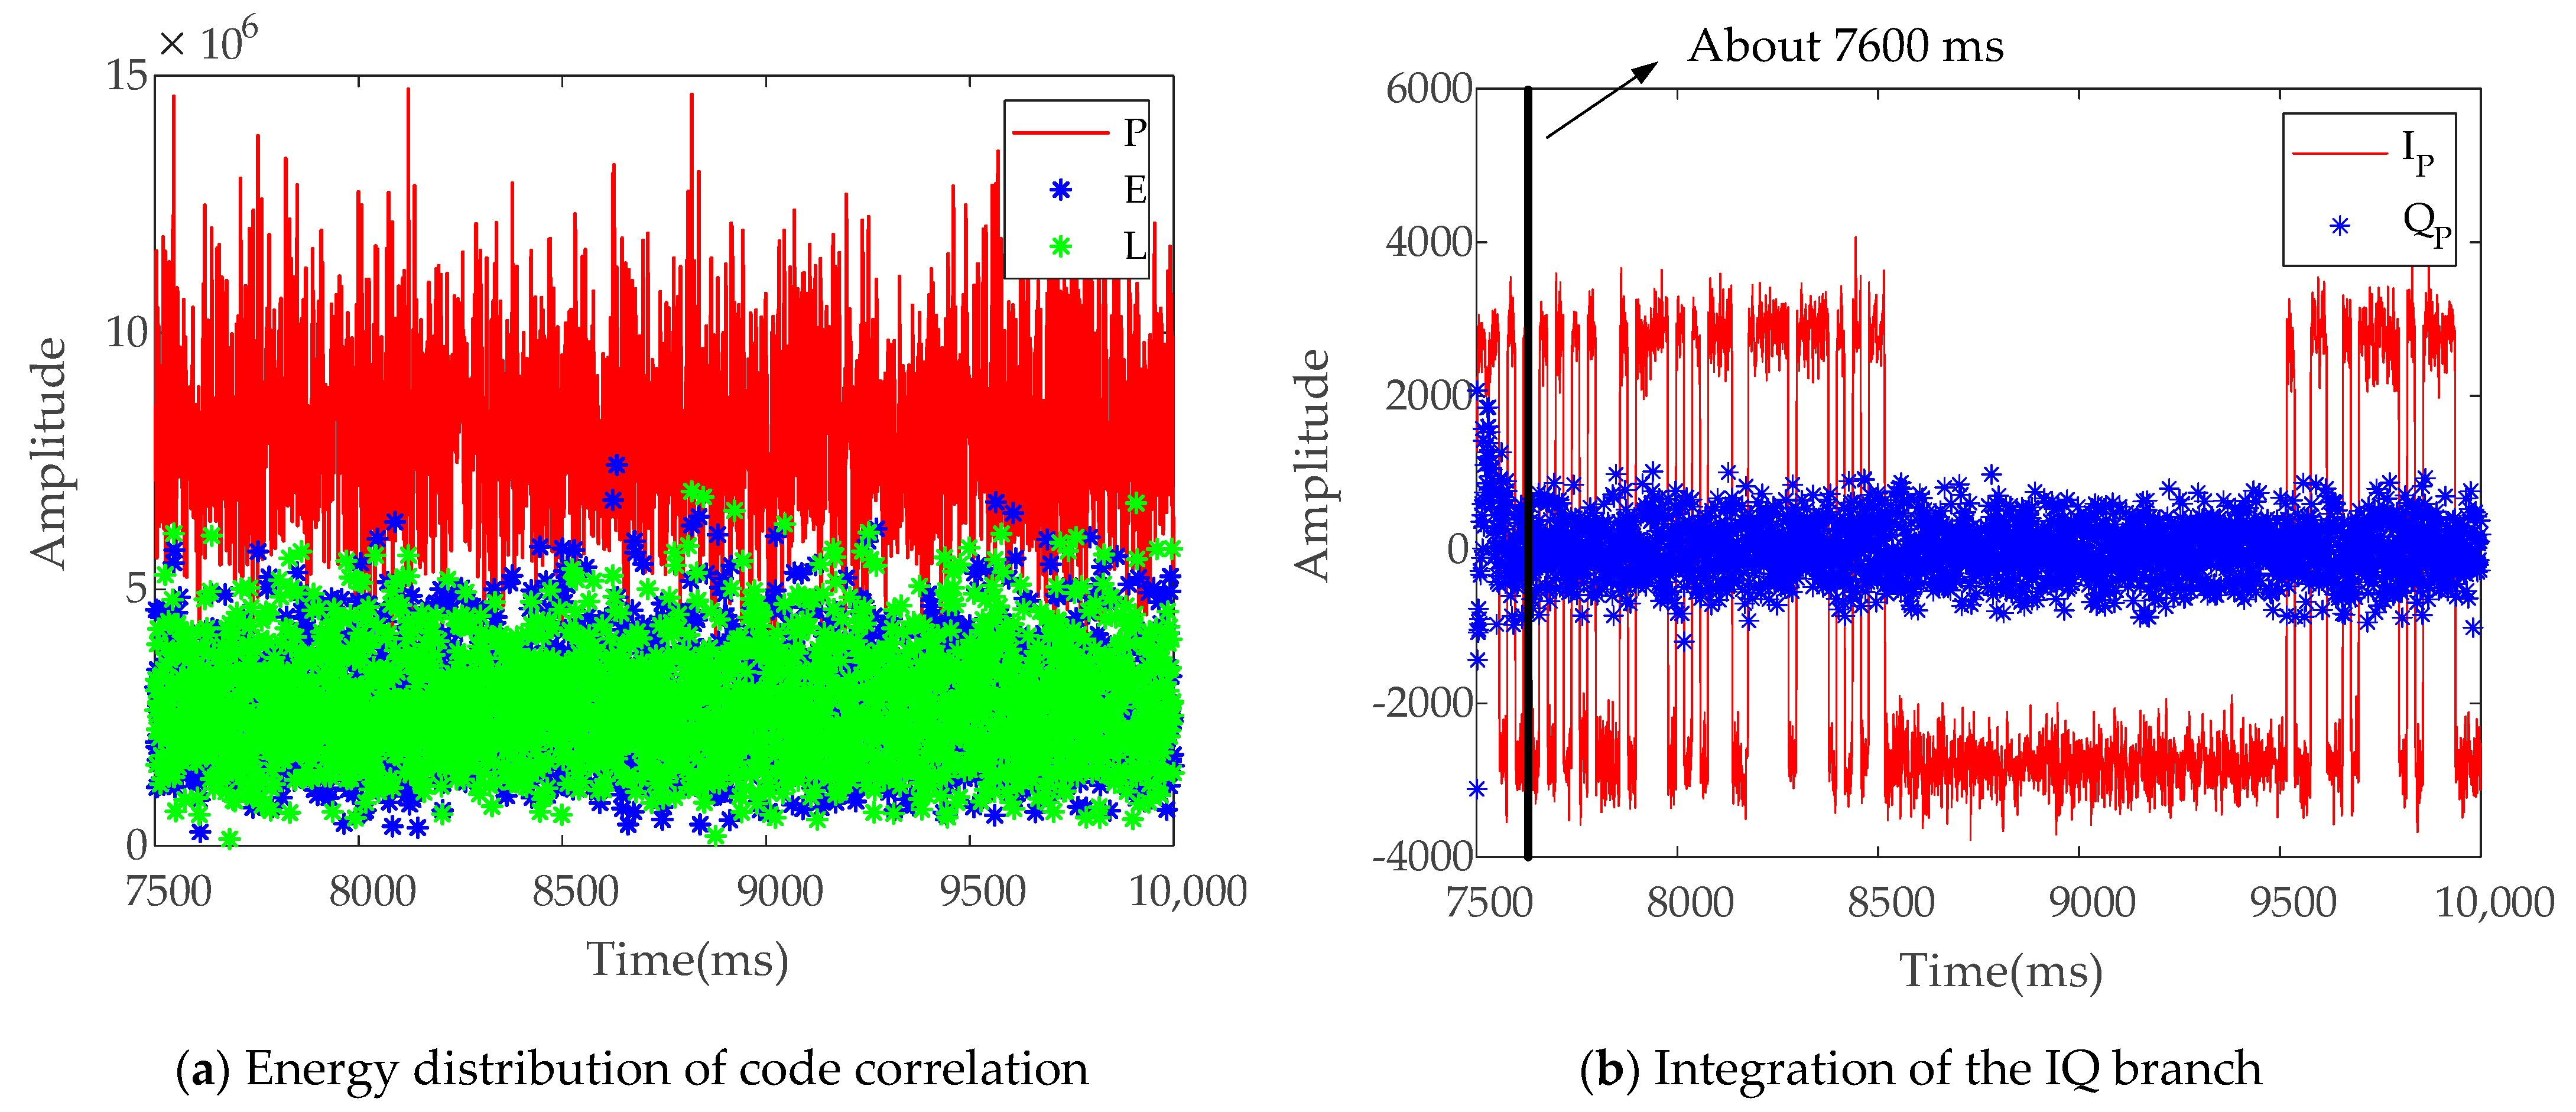
Testing for the vector tracking structure, when the acceleration of the carrier is −100 g, the corresponding results of the cascading vector tracking loop are shown in Figure 10b. The black vertical line similarly shows the moment when the IQ values converge steadily.
Figure 11a provides the energy distribution of the I branch when the code shifts are leading, real time, and lagging. The red curve represents the energy of the instant code, and the blue and green discrete points are the energies of the leading and lagging codes, respectively. When the energy of a real-time code branch exceeds those of the other two branches stably, the correctness of navigation message demodulation of the vector tracking mode is proven. The results of the two branches in Figure 11b indicate that the I and Q values can be completely separated after nearly 100 ms of convergence. Compared with Figure 10 and Figure 11 shows that the vector tracking mode is still stable for carrier and pseudo-code tracking under the current dynamic condition of −100 g, and the vector loop converges quickly.
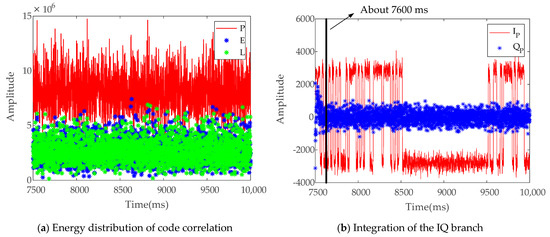
Figure 11.
Vector loop tracking results at the acceleration of −100 g.
The results in Table 3, Figure 10a,b, and Figure 11b are used to compare FLL-PLL and the vector loop. In view of vector tracking, the dynamic range is larger, the convergence time from traction to locking is shorter during loop switching, and the influence of the carrier’s dynamic change on the loop is smaller.
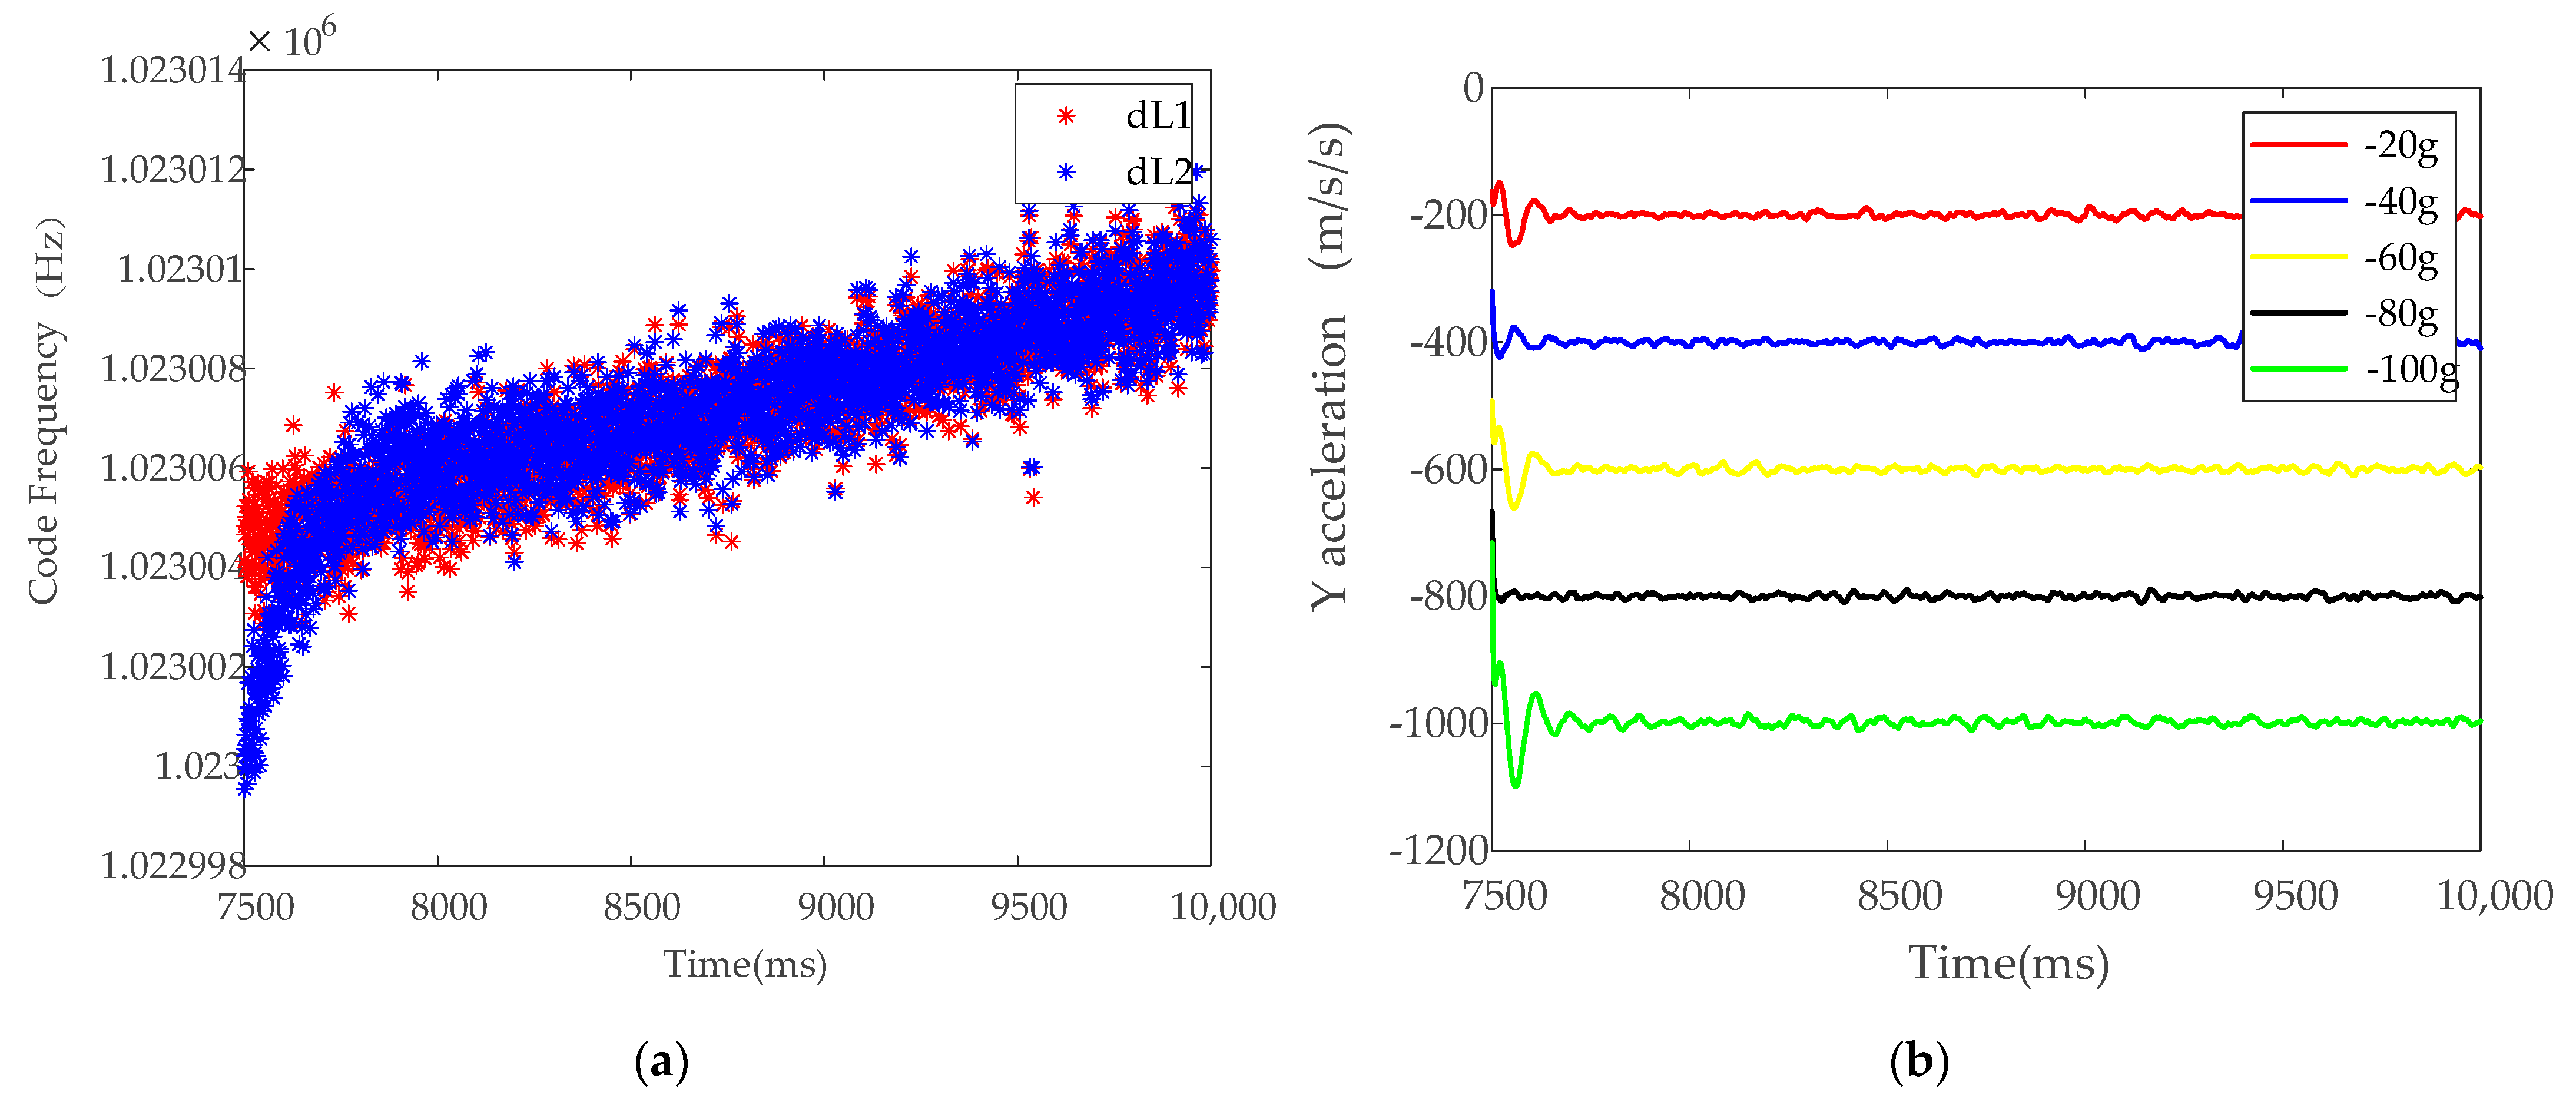
Again, taking the highly dynamic environment of −100 g for example, Figure 12a shows the feedback input from the code loop assisted by the vector tracking structure to the code NCO (dL2, red scatter) and that from the independent code loop to the code NCO (dL1, blue scatter). The x-coordinate is the time, and the y-coordinate is the frequency of the ranging code in the current tracking loop. The blue scatters stabilize after a period of convergence, which, compared with Figure 10 and Table 3, indicates that the independent code loop is robust during carrier loop switching and insensitive to dynamic changes when the carrier loop can be stably tracked. The comparison between the red and blue scatters indicates that the period of code loop stabilization can be greatly reduced with the help of the vector carrier tracking loop, and the tracking performance can be improved.
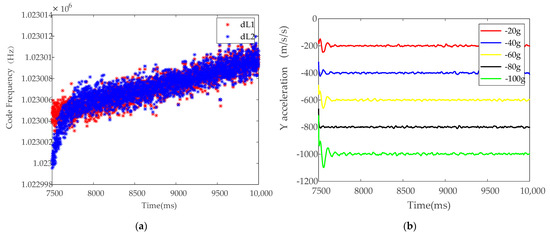
Figure 12.
(a) Code frequencies of the feedback input, (b) Y axis acceleration under different dynamics.
In Figure 12b, the abscissa is time, and the ordinate represents acceleration existing only on the Y-axis. As a supplement to the dynamic scene, the red, blue, yellow, black, and green curves represent the resolving results of the carrier under different dynamic circumstances (initial velocity is 5000 m/s in the Y-axis direction, with different acceleration, from top to bottom, namely, −20, −40, −60, −80, and −100 g). Clearly, the current dynamic environment is far from reaching the dynamic limit of this loop.
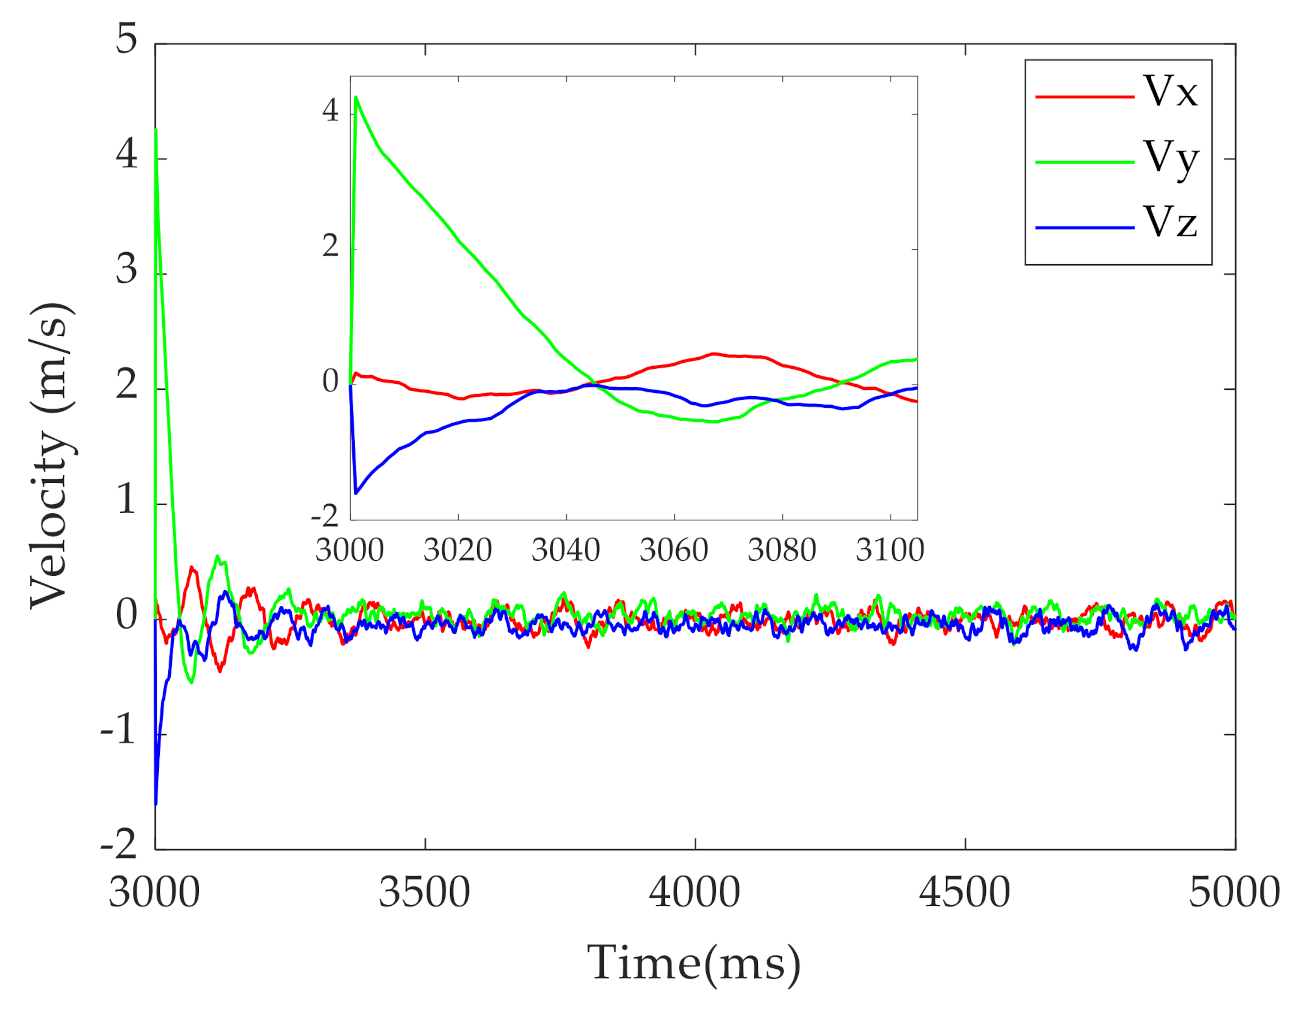
Finally, we provide the velocity and acceleration results of the vector loop at the static state and the −100 g scenario. In Figure 13 (the static state), the red, green, and blue curves represent the velocities of the three axes, which are near zero and conform to the static positioning scene. The thumbnail represents the entire picture of the convergence process.
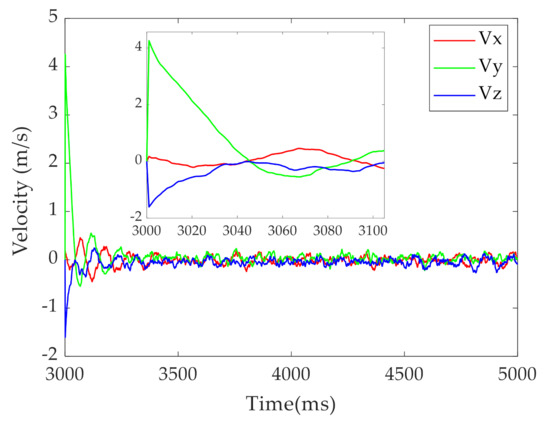
Figure 13.
Velocity results in static environment.
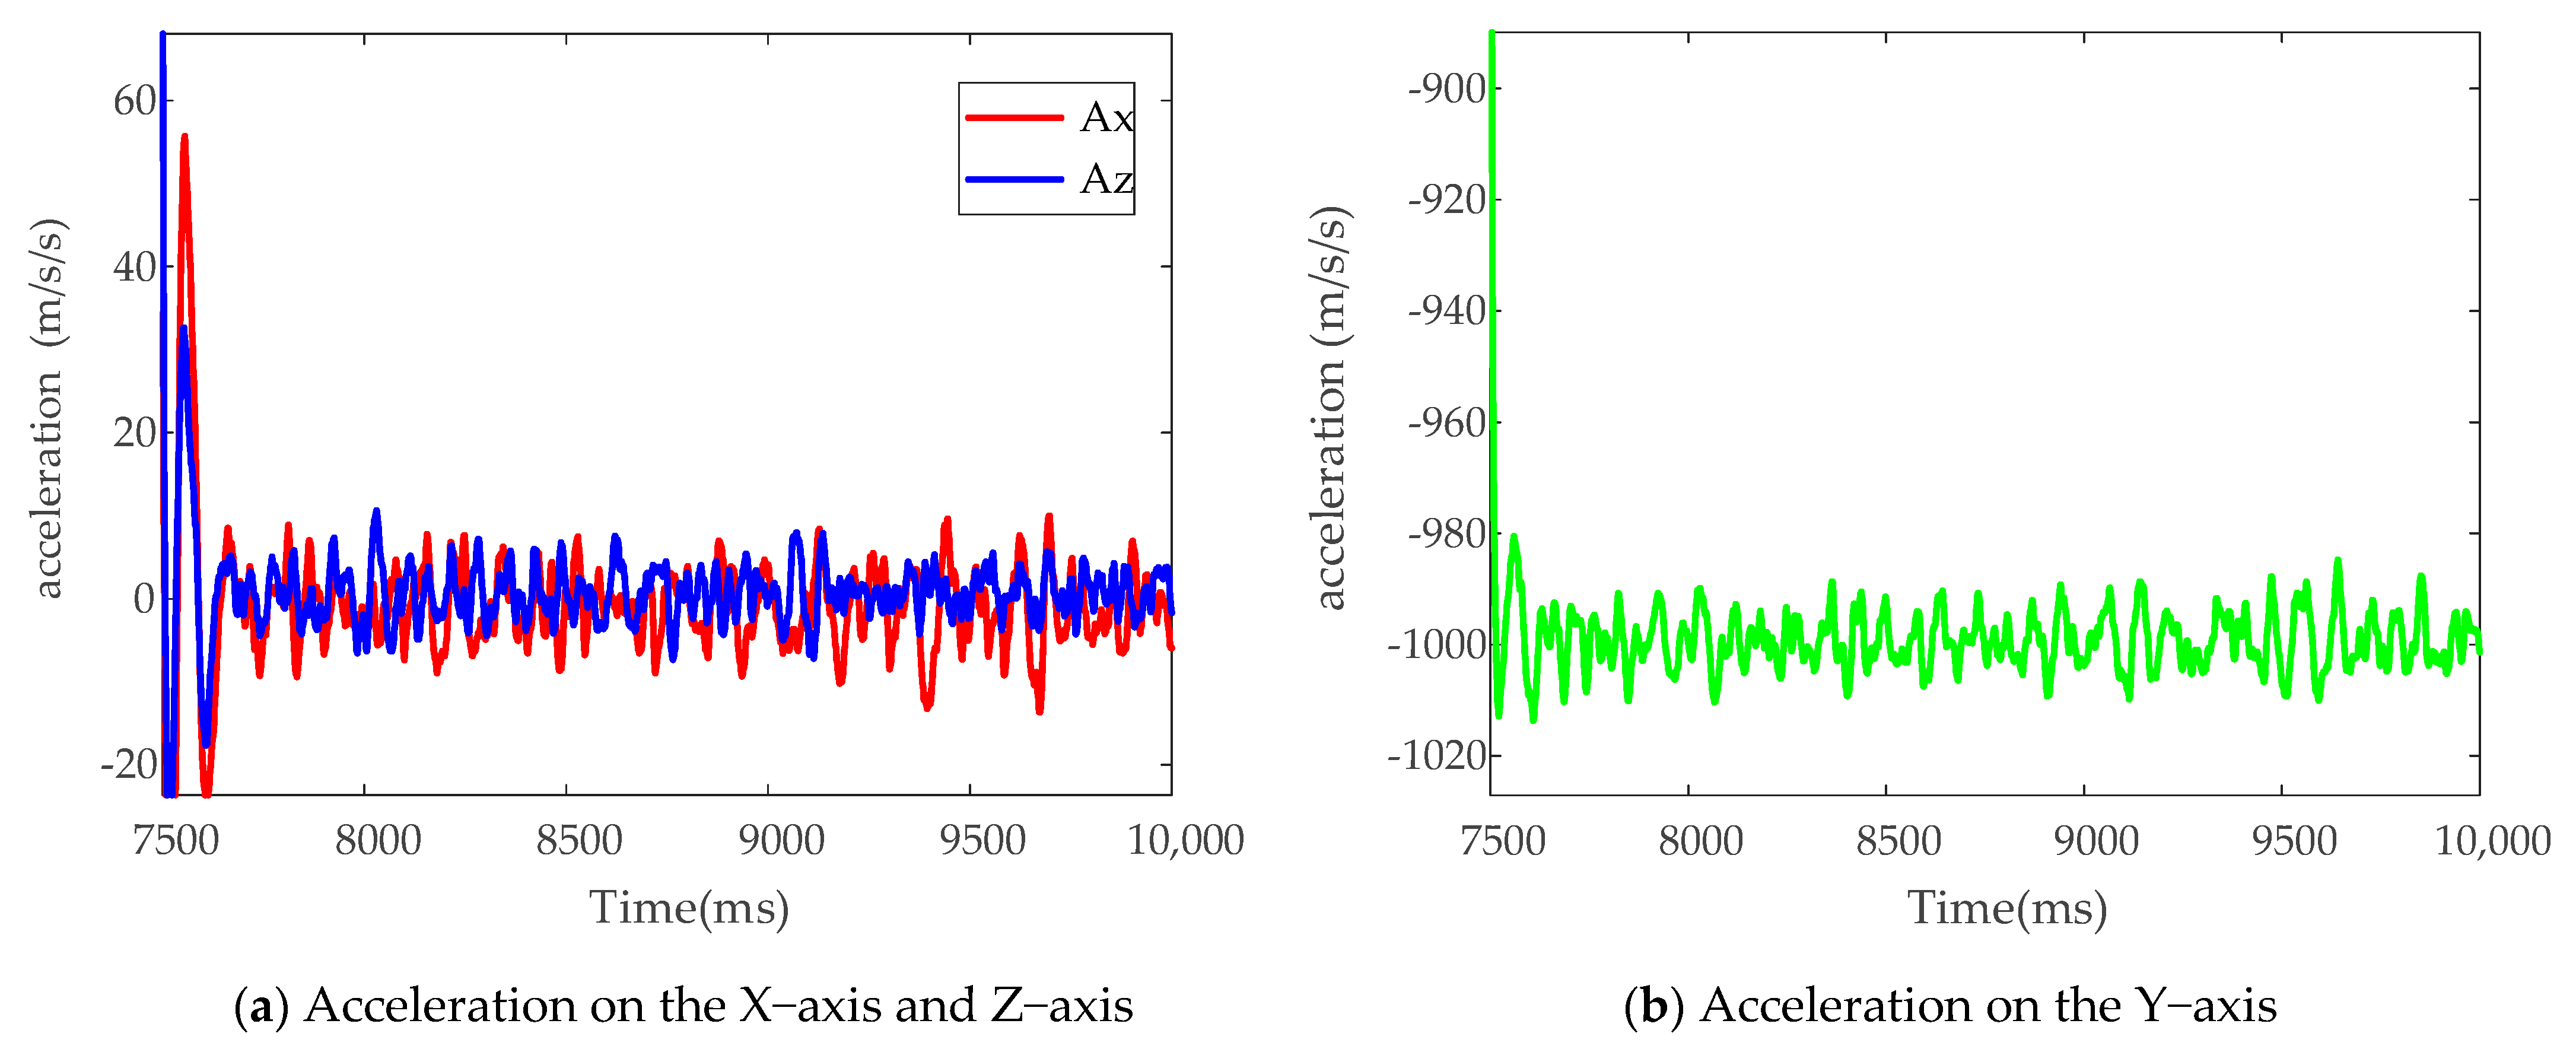
After the static testing, Figure 14a shows the acceleration changes of the X-axis and Z-axis with time under the −100 g highly dynamic environment. Given the constant acceleration, the graphs of the acceleration results are intuitive. After the initial oscillation of approximately 100 ms (the same as the result in Figure 11b), the accelerations of both axes rapidly converge to 0 m/s2. Figure 14b shows the changes in Y-axis acceleration with time under the current dynamic condition. With an acceleration of −100 g in the Y-axis direction, the final convergence of acceleration in Figure 14b is approximately −1000 m/s2 (in the navigation signal simulator, g is 10 m/s2).
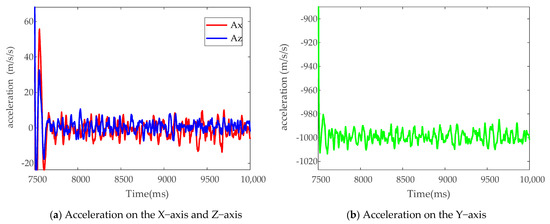
Figure 14.
Vector loop tracking results at the acceleration of −100 g.
Figure 11, Figure 13 and Figure 14 indicates that the convergence process of the entire vector tracking loop is completed within approximately 100 ms, which is not significantly different from the convergence time in the static environment. Therefore, no obvious linear relationship exists between the time required for the vector tracking mode to stabilize and the current dynamic change of the aircraft.
4. Discussion
For the traditional FLL-PLL, the different dynamic components of the signal are tracked by different orders, the high-order loop (more than third order) is unstable, and the noise bandwidth limits the dynamic tracking range. However, for a sequential filter, the current state is based on the last moment, so locking can be completed within the local range. Thus, the dynamic range and accuracy will be greatly improved. Furthermore, if the adaptive noise matrix adjustment strategy is adopted, the performance can be further improved. The vector loop is not the end goal but a good platform for deep combination with inertial navigation, and a high degree of integration and robust tracking is very advantageous in certain environments.
We find that the vector tracking loop can work perfectly in highly dynamic conditions, and the vector carrier loop with a carrier-assisting pseudo-code method is sufficient for this signal tracking, indicating that we can achieve vector tracking with as few loop changes as possible. However, we notice that a switching relationship exists between the FLL-PLL and the vector loop because the vector and scalar loops are not completely separated. To realize vector tracking under high dynamics, the preprocessing part of the vector loop and the scalar tracking must be unified, as in this study, to reduce the transient disturbance caused by loop switching.
In the future, in addition to the applications in weak signal tracking, real-time vector tracking and the research on vector deep integration navigation, we must focus on combining vector tracking and unlocked recapture. The theory is that after the loss of tracking loop lock, if we can obtain the corresponding almanac and vehicle state information, the carrier and code loop can still work. However, when the number of obscured satellites is more than or equal to one, how long the vector loop can maintain the high level of confidence of the local carrier and pseudo code is unknown, and considering the potential channel contamination, the problem of satellites selection on this kind of vector structure is worth exploring.
5. Conclusions
In this study, a cascading vector tracking loop for highly dynamic environments was designed and verified. First, two-stage filters were used to reduce the strong nonlinearity and the computation cost. Second, the original observations were re-organized to eliminate the impact of unknown parameters on the I-Q values. Finally, this paper proposes a feasible feedback method, which combines with pre-filter estimation, and the main filter ensures fast and stable loop convergence from both phase and frequency.
Testing with the high dynamic signals generated by navigation signal generators, the results of this vector loop show that the high tracking accuracy is the same as that in the static environment. The vector carrier loop assisting code loop in this study can work normally at highly dynamic conditions in which the FLL-PLL loop cannot track stably. In the test of acceleration (i.e., −100 g), the convergence time of this cascading vector loop can be decreased to approximately 100 ms, and this convergence time has been shown to have no obvious relationship with dynamic change through comparing with the static test. After stable loop tracking, the STD of the carrier phase estimation is below 0.6 mm, and this STD is only 20% that of the FLL-PLL with a large noise bandwidth. That is, the proposed vector structure is low in complexity and can be applied to highly dynamic environments.
Author Contributions
Conceptualization, Z.T.; methodology, Z.T.; software, Z.T.; validation, Z.T. and W.G.; formal analysis, Z.T. and W.G.; investigation, Z.T. and W.S.; resources, Y.W., Y.L. and Y.W.; data curation, Z.T. and Y.L.; writing—original draft preparation, Z.T.; writing—review and editing, W.G., Y.L. and Y.W.; visualization, Z.T.; supervision, Y.L.; project administration, Y.L.; funding acquisition, W.S. and Y.L. All authors have read and agreed to the published version of the manuscript.
Funding
This research was funded by the Joint Foundation for Ministry of Education of China, grant number 6141A02011907, the National Key Research and Development Project of China, grant number 2017YFB0503401-01, and the Joint Foundation for Ministry of Education of China, grant number MCM20200J01.
Institutional Review Board Statement
Not applicable.
Informed Consent Statement
Not applicable.
Data Availability Statement
The data presented in this study are available on request from the corresponding author. The data are not publicly available due to project regulations.
Acknowledgments
We thank the China Academy of Launch Vehicle Technology and the Beijing Hoyateq Co., Ltd. for the data and equipment supports.
Conflicts of Interest
The authors declare no conflict of interest.
References
- Krasner, N.F. GPS Receiver and Method for Processing GPS Signals. U.S. Patent 56,637,34A, 14 July 1998. Available online: https://patentimages.storage.googleapis.com/9a/19/7f/30ba615e98c917/US5663734.pdf (accessed on 15 May 2021).
- Hu, H.; Xu, L. GPS Carrier Tracking Research and Simulation. In Proceedings of the 2008 International Symposium on Information Science and Engineering, Shanghai, China, 20–22 December 2008; Volume 1, pp. 414–416. [Google Scholar]
- Hurd, W.J.; Statman, J.I.; Vilnrotter, V.A. High Dynamic GPS Receiver Using Maximum Likelihood Estimationand Frequency Tracking. IEEE Trans. Aerosp. Electron. Syst. 1987, AES-23, 425–437. [Google Scholar] [CrossRef]
- Won, J.-H.; Pany, T.; Eissfeller, B. Iterative Maximum Likelihood Estimators for High-Dynamic GNSS Signal Tracking. IEEE Trans. Aerosp. Electron. Syst. 2012, 48, 2875–2893. [Google Scholar] [CrossRef]
- Yan, K.; Ziedan, N.I.; Zhang, H.; Guo, W.; Niu, X.; Liu, J. Weak GPS Signal Tracking Using FFT Discriminator in Open Loop Receiver. GPS Solut. 2016, 20, 225–237. [Google Scholar] [CrossRef]
- Mosavi, M.; Shokhmzan, Z. Spoofing Mitigation of GPS Receiver Using Least Mean Squares-Based Adaptive Filter. Iran. J. Electr. Electron. Eng. 2015, 11, 1–11. [Google Scholar]
- Miao, Z.; Lv, Y.; Xu, D.; Shen, F.; Pang, S. Analysis of a Variational Bayesian Adaptive Cubature Kalman Filter Tracking Loop for High Dynamic Conditions. GPS Solut. 2017, 21, 111–122. [Google Scholar] [CrossRef]
- Zeng, C.; Li, W. Application of Extended Kalman Filter for Tracking High Dynamic GPS Signal. In Proceedings of the 2016 IEEE International Conference on Signal and Image Processing (ICSIP), Beijing, China, 13–15 August 2016; pp. 503–507. [Google Scholar]
- Spilker, J.J., Jr.; Axelrad, P.; Parkinson, B.W.; Enge, P. (Eds.) Global Positioning System: Theory and Applications, Volume I; American Institute of Aeronautics and Astronautics: Washington, DC, USA, 1996. [Google Scholar]
- Zhao, S.; Akos, D. An Open Source GPS/GNSS Vector Tracking Loop—Implementation, Filter Tuning, and Results. In Proceedings of the 2011 International Technical Meeting of The Institute of Navigation, San Diego, CA, USA, 24–26 January 2011; pp. 1293–1305. [Google Scholar]
- Amani, E. Scalar and Vector Tracking Algorithms with Fault Detection and Exclusion for GNSS Receivers: Design and Performance Evaluation. Ph.D. Thesis, Université Paris-Est, Paris, France, 2017. [Google Scholar]
- Lashley, M.; Bevly, D.M. Performance Comparison of Deep Integration and Tight Coupling. Navig. J. Inst. Navig. 2013, 60, 159–178. [Google Scholar] [CrossRef]
- Bye, C.T.; Schipper, B.W.; Vallot, L.C. GPS/IMU Clock Synchronization Particularly for Deep Integration Vector Tracking Loop. U.S. Patent 711,708,6B2 9 September 2003. Available online: https://patentimages.storage.googleapis.com/79/ab/b8/56fa2ac5af7274/US7117086.pdf (accessed on 3 October 2006).
- Lashley, M.; Bevly, D.M.; Hung, J.Y. Performance Analysis of Vector Tracking Algorithms for Weak GPS Signals in High Dynamics. IEEE J. Sel. Top. Signal Process. 2009, 3, 661–673. [Google Scholar] [CrossRef]
- Benson, D. Interference Benefits of a Vector Delay Lock Loop (VDLL) GPS Receiver. In Proceedings of the 63rd Annual Meeting of The Institute of Navigation, Cambridge, MA, USA, 25 April 2007; pp. 749–756. [Google Scholar]
- Petovello, M.G.; Lachapelle, G. Comparison of Vector-Based Software Receiver Implementations With Application to Ultra-Tight GPS/INS Integration. In Proceedings of the 19th International Technical Meeting of the Satellite Division of The Institute of Navigation, Fort Worth, TX, USA, 29 September 2006; pp. 1790–1799. [Google Scholar]
- Marcal, J.; Nunes, F.; Sousa, F.M.G. Performance of a Scintillation Robust Vector Tracking for Gnss Carrier Phase Signals. In Proceedings of the 2016 8th ESA Workshop on Satellite Navigation Technologies and European Workshop on GNSS Signals and Signal Processing (NAVITEC), Noordwijk, The Netherlands, 14–16 December 2016; pp. 1–8. [Google Scholar]
- Lin, T.; O’Driscoll, C.; Lachapelle, G. Development of a Context-Aware Vector-Based High-Sensitivity GNSS Software Receiver. In Proceedings of the 2011 International Technical Meeting of the Institute of Navigation, San Diego, CA, USA, 24–26 January 2011; pp. 1043–1055. [Google Scholar]
- Hsu, L.-T.; Jan, S.-S.; Groves, P.D.; Kubo, N. Multipath Mitigation and NLOS Detection Using Vector Tracking in Urban Environments. GPS Solut. 2015, 19, 249–262. [Google Scholar] [CrossRef]
- Chen, X.; Wang, W.; Meng, W.; Zhang, Z. A Novel UKF Based Scheme for GPS Signal Tracking in High Dynamic Environment. In Proceedings of the 2010 3rd International Symposium on Systems and Control in Aeronautics and Astronautics, Harbin, China, 8–10 June 2010; pp. 202–206. [Google Scholar]
- Tu, Z.; Lu, T.; Chen, Q. A Novel Carrier Loop Based on Unscented Kalman Filter Methods for Tracking High Dynamic GPS Signals. In Proceedings of the 2018 IEEE 18th International Conference on Communication Technology (ICCT), Chongqing, China, 8–11 October 2018; pp. 1007–1012. [Google Scholar]
- Zhu, Z. Research on Key Techniques of Vector Tracking for Satellite Navigation. Ph.D. Thesis, National University of Defense Technology, Changsha, China, 2011. [Google Scholar]
Publisher’s Note: MDPI stays neutral with regard to jurisdictional claims in published maps and institutional affiliations. |
© 2021 by the authors. Licensee MDPI, Basel, Switzerland. This article is an open access article distributed under the terms and conditions of the Creative Commons Attribution (CC BY) license (https://creativecommons.org/licenses/by/4.0/).

