1. Introduction
Wetlands, known as the kidneys of the Earth, cover approximately 6% of the terrestrial area and provide numerous ecosystem services, such as maintaining water balance, sequestrating carbon, regulating climate, and providing habitat [
1,
2]. However, since the eighteenth century, up to 87% of wetlands have been lost globally, and severe degradation has happened in Asia as well as many high- and mid-latitude regions [
3,
4]. Tracking historical changes of wetlands is fundamental for wetland conservation and restoration, and serves as a key role in related decision-making processes.
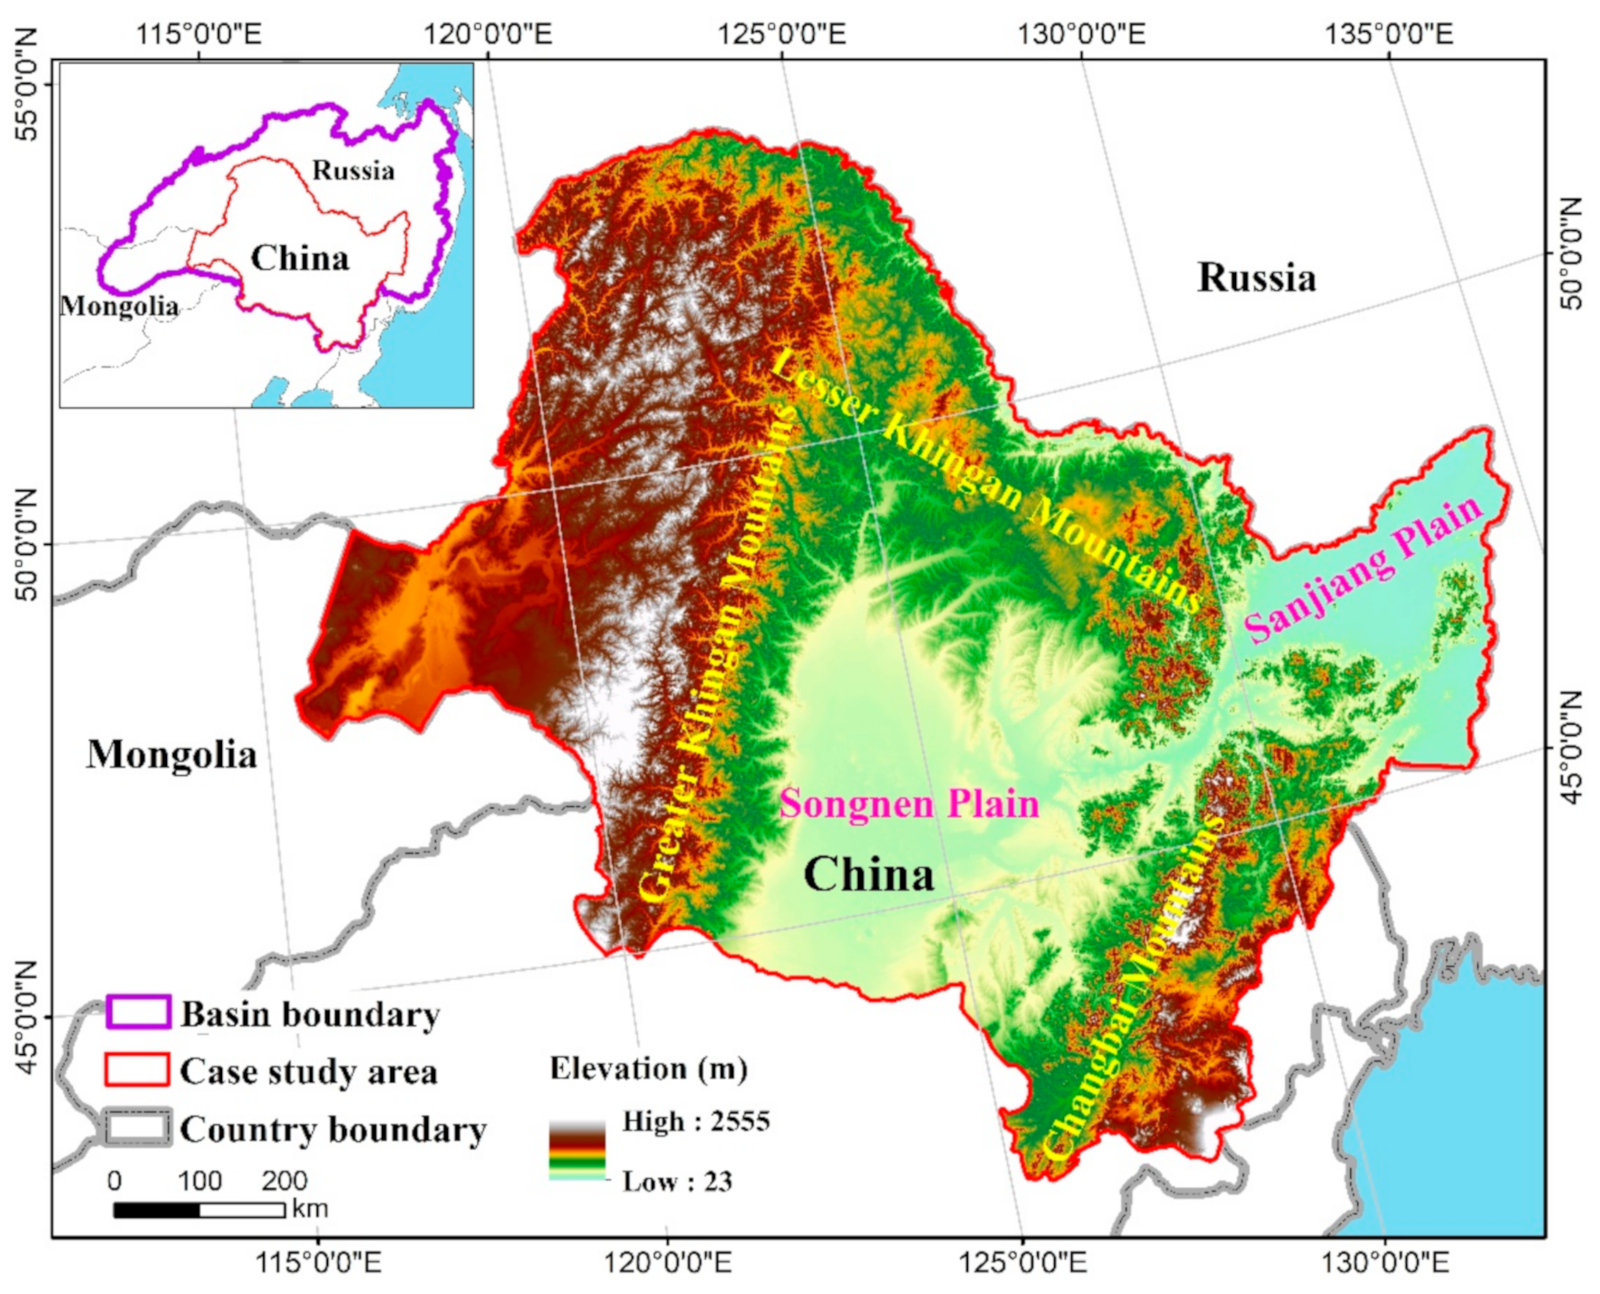
The Amur River Basin, spans Russia, China, and Mongolia, and is one of the world’s top ten largest river basins [
5]. The wetlands in it provide abundant breeding habitats for migratory waterfowl on the East Asia–Australasia Flyway (EAAF) [
4]. However, compared with Europe and North America at the same latitudes, this basin has a unique landscape pattern [
6] but less focus. Nowadays, population in the China side account more than 93% of the total population in the whole Basin. Since the early 1950s, human settlement and agricultural development in the China side of the Amur River Basin (CARB) have severely affected local natural wetlands [
7,
8]. Thus, the ecosystem services of wetlands on the CARB have been largely degraded. A holistic view of spatio-temporal variations of the wetlands on the CARB is essential for evaluating ecosystem services and supporting sustainable conservation of wetlands in this region.
Remote sensing, which could provide historical and current patterns of natural resources, has long been used to track wetland changes [
9,
10,
11]. Among varieties of remote sensing data, Landsat-5, which afforded the first image obtained in the year of 1984, was widely applied to historical wetland mapping [
12]. To date, numerous classification methods were employed to map wetland changes [
13,
14,
15]. Traditionally, accurate mapping of the complex wetland landscape depended on manually interpreting, empirical thresholds, or post-processing. However, such approaches are usually laborious and costly in large-scale applications. In recent years, to address the limitations brought by traditional methods, machine learning algorithms (MLAs) have been adopted in mapping wetlands. Due to the robustness and accuracy, random forest (RF) classifier is the widest used of the MLAs [
16,
17,
18], which has also been adopted to wetland mapping processes [
19].
Lack of suitable training samples is the greatest challenge hindering the progress of MLAs-based wetland mapping across broad scales [
20]. In general, the accuracy of supervised classification is significantly influenced by the quality of training samples. In many classification processes, errors could be caused by inappropriate or unrepresentative training samples, no matter what algorithms were being used [
21,
22,
23]. However, for large scale applications, problems associated with the sample collection, such as cost and practicality, have been the limiting factors for acquiring consistent and high-quality samples. Moreover, due to the unavailability of historical field samples, the historical imagery can hardly be classified by the MLAs. Recently, Huang et al. [
20] developed a training sample migration method which could identify the changing state of training sample pixels and form historical training samples automatically. This sample migration method provides opportunities to map historical land cover based on MLAs. However, more attempts need to be explored on broader scales.
In recent years, individual geoscientists who are interested in geospatial analysis have benefited from the Google Earth Engine (GEE) platform [
24,
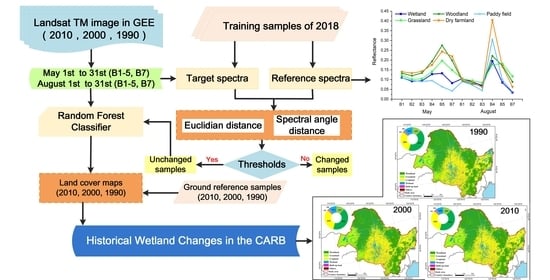
25]. This cloud-based platform has introduced possibilities for automatic training sample migration and supports RF-based wetland mapping. Thus, the aim of this study was to track historical changes of wetlands on the CARB based on Landsat images. To achieve this goal, we sought to (1) operate an automatic training sample migration method which could form historical training sample collections of the CARB for the time periods of 2010, 2000, and 1990; (2) based on the historical training sample collections, we applied RF classifier to map wetlands and other land cover; and (3) analyzed dynamics and conversions of wetland on the CARB. The methods and discussion will contribute to remote sensing and management of the wetlands around the world.
4. Discussion
4.1. Advantages and Uncertainties of the Migrated Training Samples
We adopted a robust methodology to migrate 2018′s training samples to historical time periods (the years of 2010, 2000, and 1990). The method used spectral similarity and spectral distance to determine whether a training sample of a reference year can be migrated to a target year. The accuracy assessments confirmed that the training sample migration method was successfully implemented in mapping historical land covers of the CARB. To our knowledge, the successful implementations could be attributed to two aspects, namely, the good performance of spectral similarity and spectral distance and the powerful computing abilities of the GEE platform. Firstly, this study chose images from the same seasons of different time periods (year of 2010, 2000, and 1990), and calculated both similarity and distance of the spectra to ensure unchanged samples. Secondly, the GEE platform provides full-storage dataset, meanwhile it offers online code editor and shares super computing power. For this study, over 20,000 training samples were migrated to the year of 2010, 2000, and 1990 by the GEE platform. The processes were rapid and robust.
Errors and limitations of the migrated training samples were caused mainly by the uncertainties of the image conditions. For example, if the image was captured after heavy rain, the spectra of grassland and woodland could be simple to wetlands, which, thus, led to further misclassifications. By building two season spectral curves, we tried to reduce such uncertainties as much as possible. However, for a broad scale such as the CARB, uncertainties could not be avoided completely.
4.2. Lost and Conservation of Wetlands on the CARB
As shown in
Figure 7 and
Table 6, conversions of wetland and other land covers, both direct and indirect factors caused the serious losses of wetlands on the CARB during the historical time periods (1990–2010). As is known, the study area is one of the major grain producing areas in China. Therefore, for a long time, two primary threats to wetlands on the CARB were agricultural development and population increase [
7,
8,
43]. According to
Table 4, dry farmland and paddy fields exploitations have occupied a large area of wetlands. Mao et al. [
44] pointed out that 86% of the natural wetland losses in North-east China from 1990 to 2010 arose from agricultural encroachment. It has also been shown by previous studies that in the Songnen and Sanjiang Plain, most farmlands were developed by reclaimed natural wetlands [
7,
45]. Particularly during the implementation of the “Comprehensive Agricultural Development Project” by the Chinese government (from the mid-1980s to 2000), large areas of swamps had been converted into farmland [
46,
47]. From the mid-1980s to 2000, for instance, in the Sanjiang Plain, cropland added up to 10,400 km
2 and most of these new cropland emerged from wetland conversion [
7,
48].
The construction of the project has also significantly affected the wetlands on the CARB [
45]. As regions being faced with flood disaster on the CARB, a lot of embankments and reservoirs have been constructed. Fragmentation of wetlands were also caused by built-up land development.
Moreover, some indirect factors could also lead to significant wetland degradation, such as climate change and agricultural irrigation from wetland water [
2,
49], which would contribute to a decrease in the amount of wetland water and further degradation of marsh into grassland [
49].
According to our results, between 1990 and 2010, the net loss of wetlands in the whole basin was 16%. Some previous studies of wetlands on the CARB also indicated the same trend of wetland losses. Liu et al. [
50] showed that wetlands in the Heilongjiang province reduced over 13,000 km
2 from 1990 to 2014, accounting for one quarter of 1990’s total wetlands. As Chen et al. [
46] reported, from 1990 to 2015, Sanjiang Plain lost approximately 30% of wetlands, and at the same time, in the Songnen Plain saw 12% of wetlands lost. As Tian et al. [
51] reported between 2000 and 2015, about 10% of wetlands in the Songnen Plain had disappeared. Jia et al. [
2] indicated that floodplain wetland on the CARB had losses of 25% from 1990 to 2018.
As is shown in
Table 5,
Figure 6 and
Figure 7, from 1990 to 2010, the tendency of wetland loss has slowed down. In the meantime, wetland rehabilitation from cropland, (i.e., dry farmland and paddy field) was enhanced. From 1990 to 2000 and 2000 to 2010, there were 330.43 km
2 and 528.86 km
2 of wetlands rehabilitated from croplands, respectively. A series of projects promoted these positive effects, which relied on Chinese and local governments’ efforts, even transnational cooperation. For example, the 2002–2030 National Wetland Conservation Program was approved in 2003 by the central government. This program aimed to establish natural reserves and restore wetlands [
52]. To date, on the CARB there are more than 40 national wetland reserves, these reserves strengthen wetland conservation projects [
53]. On another positive aspect, in 2011 Russia and China adopted the “Russian–Chinese Strategy for Development of Transboundary Network of Protected Areas in the Amur River Basin for the period till 2020”, which stressed the inventory and protection of wetlands as the first priority. The strategy also provided a basis for improving cooperation between different conservation agencies and the establishment of transboundary nature reserves [
54]. However, the areal extent is still shrinking in the CARB, even though numerous conservation and restoration measures have been taken. Anthropogenic factors including population increase and socioeconomic development become main reasons for these shrinkages [
46]. Therefore, further sustainable managements are still necessary to promote conservation and rehabilitation efforts for wetland on the CARB [
44].
5. Conclusions
In this study, we adopted a convenient and robust training sample migration method along with the RF classifier to classify wetland and other land cover types on the CARB using two seasons’ worth of Landsat image collections. Resultantly, a 30-m resolution dataset for the CARB containing historical spatial distribution information of wetlands and other land covers in 1990, 2000, and 2010 was produced. The basic idea of the training sample migration is to compare the spectral similarity and spectral distance to determine whether a reference sample could be used as a training sample in a target year. Accuracy assessments showed high producer’s and user’s accuracies for all maps in the dataset. This success owed to the robustness and sufficiency of the training sample migration and RF classification, combined with super computing power and the complete storage of Landsat data of the GEE platform. According to the dynamics and conversions reflected by the resultant dataset, the area of wetland reduced from 89,432 km2 to 75,061 km2 from 1990 to 2010, with a net loss of 16%. At the same time, a majority of these reduced wetlands were converted into dry farmland and paddy field, especially in the Songnen and Sanjiang plains, which suggested that agricultural activities are the main cause of wetland loss. The dataset obtained by this study can provide reliable information for wetland management and socio-economic sustainable development in the CARB, and could be a reference for other related research.


