Article

Patterns, Trends and Drivers of Water Transparency in Sri Lanka Using Landsat 8 Observations and Google Earth Engine

1
Key Laboratory of Digital Earth Science, Aerospace Information Research Institute, Chinese Academy of Sciences, Beijing 100094, China
2
University of Chinese Academy of Sciences, Beijing 100049, China
3
Department of Science and Technology, Faculty of Applied Sciences, Uva Wellassa University, Badulla 90000, Sri Lanka
*
Author to whom correspondence should be addressed.
Remote Sens. 2021, 13(11), 2193; https://doi.org/10.3390/rs13112193
Submission received: 14 May 2021 / Revised: 30 May 2021 / Accepted: 2 June 2021 / Published: 4 June 2021
(This article belongs to the Special Issue Estimating Inland Water Quality from Remote Sensing Data)

Abstract

:
Addressing inland water transparency and driver effects to ensure the sustainability and provision of good quality water in Sri Lanka has been a timely prerequisite, especially under the Sustainable Development Goals 2030 agenda. Natural and anthropogenic changes lead to significant variations in water quality in the country. Therefore, an urgent need has emerged to understand the variability, spatiotemporal patterns, changing trends and impact of drivers on transparency, which are unclear to date. This study used all available Landsat 8 images from 2013 to 2020 and a quasi-analytical approach to assess the spatiotemporal Secchi disk depth (ZSD) variability of 550 reservoirs and its relationship with natural (precipitation, wind and temperature) and anthropogenic (human activity and population density) drivers. ZSD varied from 9.68 cm to 199.47 with an average of 64.71 cm and 93% of reservoirs had transparency below 100 cm. Overall, slightly increasing trends were shown in the annual mean ZSD. Notable intra-annual variations were also indicating the highest and lowest ZSD during the north-east monsoon and south-west monsoon, respectively. The highest ZSD was found in wet zone reservoirs, while dry zone showed the least. All of the drivers were significantly affecting the water transparency in the entire island. The combined impact of natural factors on ZSD changes was more significant (77.70%) than anthropogenic variables, whereas, specifically, human activity accounted for the highest variability across all climatic zones. The findings of this study provide the first comprehensive estimation of the ZSD of entire reservoirs and driver contribution and also provides essential information for future sustainable water management and conservation strategies.

1. Introduction

Inland water is one of the most crucial and limited natural resources that plays a pivotal role in sustaining biodiversity and human society [1,2]. However, regional environmental conditions, such as climatic and anthropogenic factors, threaten their ecological functions [3,4]. Regular observations are vital to assess the impact of surface water variation on the environment. Inland water deterioration is recognised as an emerging issue in Sri Lanka by the National Action Plan for Haritha (Green) Lanka Programme of 2009–2016 [5].
Water transparency is one of the most common indicators of water quality impairment, and the Secchi disk depth (ZSD) is a direct representation of the water clarity, often referred to as a proxy for the overall water quality of the waterbody. ZSD indicates water transparency as observed by the human eye and also represents the light availability for the benthic ecosystem [6]. Over centuries, limnologists have widely and regularly used the Secchi disk to measure water transparency, and clarity has been explained in terms of its attenuation in the vertical direction of water [7]. ZSD is still widely in use locally [8,9,10] and globally [11,12]. In Sri Lanka, there have been a limited number of in-situ ZSD based studies reported at reservoirs or river basin scale [13,14,15,16,17]. However, so far, an island wide comprehensive investigation of water transparency distribution and its dynamics has not been executed and remains unknown.
Generally, on the reservoir scale, catchment characteristics and morphometric factors are primary determinants of ZSD that regulate nutrient runoff, transport and prolonged retention of light attenuating sediments and nutrients [14,18]. In addition, various substantial natural and anthropogenic contributory factors of water transparency changes have been identified in Sri Lanka. Most of the studies aim to explain influencing factors at the reservoir scale [19,20]. Nevertheless, the roles of them were not systematically obtained to date. The country also identified the importance of water resource planning and conservation, and the provision of adequate good quality water has been a timely requirement, especially under the United Nations Sustainable Development Goals (SDGs) 2030 Agenda. A proper understanding of the historical ZSD dynamics and its drivers as a source for drinking water, food production, irrigation, hydro power generation and aquatic ecosystem services is vital. Additionally, it might be helpful to attain these global targets.
Particularly over recent decades, remote sensing techniques have extensively used in the applications of a range of inland water quality monitoring and have demonstrated their strong capabilities with certain limitations [21,22]. The onboard mounted satellite sensors capture reflectance from the water surface at various wavelengths. These observations are mainly imaging with the visible portion of the electromagnetic spectrum and can be used to extract the water quality parameters, such as ZSD, from their spectral responses. Many studies have widely established the relation between water-leaving reflectance and its optically active constituents. Organic and inorganic suspended solids, phytoplankton, and coloured dissolved organic matter are the optically active contributing parameters for the water-leaving reflectance [23,24].
In the recent past, ZSD estimations have been widely derived semi-analytically [25]. Optically active water quality constituents derive by utilizing the relationship between water quality parameters and inherent optical properties (IOP) [26,27]. Due to the entire dependence on water-leaving radiance rather than in-situ measurements, these models depicted more applicability and reliable results [28]. According to the new underwater visibility theory [29], the ZSD derivation model consisted of a combination of the quasi-analytical algorithm (QAA) [30,31] and a mechanistic model for the derivation of the absorption coefficient and backscattering. This algorithm was implemented for Landsat 8 OLI (Operational Land Imager) multispectral data and was shown to be well performed with a large number of in-situ ZSD validation samples across inland, coastal and oceanic water environments with a range of 0.1–30 m [32,33,34]. The latest updated version of QAA (QAA_v6) also improved the performance in turbid water in specific [35].
However, uses of remotely sensed data for water turbidity or clarity assessments, especially on reservoir ZSD retrieval and monitoring, is rare in Sri Lanka. Water quality deterioration is an emerging issue in a country suffering from water scarcity, where sufficient information is not available for investigation. Given the scarcity and lack of consistent data on water transparency changes, variability, and drivers, an urgent need has emerged to understand the spatiotemporal dynamics and impacts of drivers. In this study, we investigate the spatial and temporal patterns of surface water transparency in Sri Lanka, and their relations to natural and anthropogenic driving forces from 2013 to 2020 by quasi-analytically derived Secchi depth using Landsat 8 OLI data and GEE.

2. Materials and Methods

2.1. Study Area

We study all 550 inland reservoirs in Sri Lanka with a permanent water area (retained water over 80% of the entire study period) greater than 1 ha, demarcated from all available Landsat images. Their spatial distribution is shown in Figure 1a. Permanent water areas were considered to exclude shallow areas or regions covered by floating or submerged aquatic vegetation or islands. These reservoirs include several kinds of inland water features other than reservoirs, such as lakes, wetlands, rainwater retention ponds and other waterbodies. General catchment characteristics of studied reservoirs in three climatic zones are summarized in Table 1.

2.2. Data Used

2.2.1. Landsat 8 Data

A total of 1369 Landsat 8 OLI level 2 surface reflectance images between May 2013 and November 2020 were acquired along paths 140 to 142, and rows 53 to 56. The Tier 1 collection was used for this study (Table 2). Level 2 surface reflectance is atmospherically corrected data at a 30 m resolution.

2.2.2. In-Situ Data

Sixty-five ZSD in-situ samples were measured from five reservoirs from dry (3) and wet (2) zones from 2015 to 2019, and a summary of the sampling stations are given in Table 3 with the time window between the in-situ measurement and Landsat 8 OLI overpass. Observations obtained by the previous studies were also collected [13]. Coordinates of water sampling stations were recorded using a handheld global positioning system device. A standard Secchi disk with 25 cm diameter and alternating black and white quadrants was used to determine the in-situ field observations. The Secchi depth was determined as the vertically downward depth when the disk disappears from human eyesight through the water with a suitable sunshade. Reservoirs were sampled between 10 a.m. and 3 p.m. from the shaded side of the boat to avoid the solar altitudinal effects.
Five Landsat 8 OLI images only were corresponded to the date of the in-situ field measurements, resulting in 34 appropriate cloud-free observations for validation of the ZSD model employed in this study. The closest pixel to the in-situ observation was obtained for the matchup pairs. Only suitable water pixels excluding cloud, shadow, land and other potential noises were considered for the validation. Previous studies reported that the time window within ±23 days between the in-situ sampling and satellite overpass could produce acceptable results. For example, a time window of ±7 days used to assess water transparency of waterbody by ZSD using Landsat TM (Thematic Mapper) and Multispectral Scanner [36], a time window of ±10 days used to validate ZSD models of 10,000 lakes in Minnesota using Landsat TM and Enhanced Thematic Mapper Plus (ETM+) [11], a time window of ±11 days used to estimate suspended solids concentration in the Indus Delta region using Landsat 7 ETM+ [25], time window between ±23 days used for the classification of water quality types in Pearl River estuary and adjacent area using Landsat 5 TM [37]. We used a matchup time window of ±0–12 days to collocate in-situ measurements and Landsat 8 OLI images. In addition to ZSD, for 37 sampling stations, Total Suspended Solids (TSS) were also collected.

2.2.3. Geographical, Climatic and Anthropogenic Data

The water quality variation in Sri Lanka was driven by several natural (geographical and climatic) and anthropogenic factors [14,17,19,20,38]. We categorized them two-fold: precipitation, temperature, wind speed, average water depth, elevation as natural drivers, and population density and Normalized Difference Vegetation Index (NDVI) as anthropogenic factors. These datasets were obtained in the Google Earth Engine (GEE) platform, and the information of the GEE datasets are summarized in Table 4 with their resolution and GEE assets. A preliminary investigation on the influence of these potential drivers on water transparency over climatic zones over the study period was conducted.
The catchment areas of all studied reservoirs were derived from the Shuttle Radar Topography Mission (SRTM) Digital Elevation Model (DEM) provided by the National Aeronautics and Space Administration (NASA). Elevation of each reservoir was also extracted from this SRTM DEM. The average water depth of reservoirs was also derived using the geostatistical method described in [39] from the SRTM DEM. By adopting this approach, an average water depth of 336 reservoirs was successfully retrieved.
Monthly cumulative precipitations were calculated from the Tropical Rainfall Measuring Mission (TRMM) product 3B43 V7 from Goddard Earth Science Data and Information Services from 2013–2019. Monthly precipitations collected from 25 meteorological stations were used for 2020 [40]. Monthly mean 2 m temperature, u_component_of_wind_10m and v_component_of_wind_10m were collected from the European Centre for Medium-Range Weather Forecasts (ECMWF). We used these u and v component wind vectors to calculate the monthly mean wind speed (W) using Equation (1). Population density data were obtained from the gridded population of the world (GPW) dataset from the NASA Socioeconomic Data and Applications Centre (SEDAC) at the Centre for International Earth Science Information Network (CIESIN) in 2010, 2015 and 2020. Annual population densities were obtained by interpolating these data.
W = u 2 + v 2 ,
Annual average precipitation, temperature, wind speed, NDVI and population density were calculated for each catchment area from 2013 to 2020. Average water depth and elevation data remained constant throughout the study period due to the lack of continuous data availability.

2.3. Image Processing and Water Extraction

The Landsat 8 OLI Level 2 data were obtained through the GEE platform. Level 2 surface reflectance is atmospherically corrected data by the Landsat Surface Reflectance Code (LaSRC) algorithm [41]. LaSRC algorithm was based on the Second Simulation of the Satellite Signal in the Solar Spectrum Vectorial (6SV) model. Level 2 products are reliable in the derivation of ZSD using the QAA approach [33,34].
We estimated remote sensing reflectance (Rrs) from surface reflectance and transformed this to the range of 0 to 1 by using the following Equation (2) [42,43]:
R r s =   Surface   reflectance × 0.0001 π
Suitable water pixels were only selected for analysis by masking cloud and cloud shadow pixels using the quality attributes of a particular pixel determined by the CFMask algorithm and removing reflectance values out of the range of 0 and 1. All suitable observations were then cumulated to obtain monthly and annual mean ZSD (Figure 2).
This study employed the Support Vector Machine (SVM) approach to perform supervised surface water classification in the GEE platform with a manually created training sample set [44]. The first seven bands of Landsat 8 OLI and NDVI image were used for water classification. These input variables were identified as ideal for efficient water detection by excluding particular objects, such as floating and submerged vegetation and shadows, in machine learning approaches [45].

2.4. Modelling of ZSD Using QAA

The quasi-analytical algorithm [29,30] is precisely interpreting the sighting of a Secchi disk by combined empirical and analytical approaches using radiative transfer equations. This algorithm was applied to Landsat 8 OLI observations to derive water transparency [32]. QAA based ZSD derivation model mainly consists of:
  • Estimation of IOPs,
  • Estimation of Kd,
  • Estimation of ZSD.

2.4.1. Estimation of IOPs

Time series Landsat remote sensing reflectance was processed with the QAA_v6 [29,32] algorithm in order to obtain the total absorption a(λ) and backscattering bb(λ) coefficients. This algorithm consists of seven steps, including three semi-analytical models and two models per empirical and analytical approaches [30]. The variables and the main steps are summarized in Table 5. The first four bands of the Landsat 8 OLI sensor, centred at wavelengths 443,483,555, and 670, were used for the ZSD model.
At first, Landsat remote sensing reflectance Rrs observed in the nadir direction were converted to the subsurface remote sensing reflectance (rrs). In the second step, according to the radiative transfer function based on [46], u(λλ), a ratio, is expressed in terms of rrs, g0 and g1, where g0 and g1 are 0.089 and 0.125 sr−1, respectively. Then, the total absorption coefficient (a) estimated at the reference wavelength (λo) in the next step where, aw is the absorption coefficient of pure water and assumed as a constant, Δa(λo) is the contributions from non-water constituents and empirically assessed from rrs spectra by considering λo as 670 nm. In step four, the backscattering coefficients of suspended particles (bbp) calculated from the analytical equation where bbw is the backscattering coefficients of pure seawater. Further, in steps five and six, bbp values at the other three wavelengths were estimated by the widely used power expression where, power coefficient, η was empirically estimated from rrs [47]. Finally, the total absorption coefficient was derived in the last step.

2.4.2. Estimation of Kd

Kd was calculated by the following the radiative transfer equation [48] by using the estimated IOPs:
K d ( λ ) = ( 1 + m 0   × θ s )   a ( λ ) + ( 1 γ   b b w ( λ )   b b ( λ ) ) × m 1   × ( 1 m 2 × e m 3   × a ( λ ) )   b b ( λ ) ,
where, m0, m1, m2, m3 and γ are model parameters, and their values are 0.005, 4.26, 0.52, 10.8, and 0.265, respectively. θs is the solar zenith angle in degrees. bbw(λ) refers to the backscattering coefficient of pure water based on [49]. a(λ) and bb(λ) are the absorption and backscattering coefficients estimated by QAA_v6.

2.4.3. Estimation of ZSD

The new underwater visibility theory stated that the ZSD is inversely proportional to the minimum value of the diffuse attenuation coefficient Kd in the maximum transparent spectral window of the water body within the visible range of 443–670 nm [29]:
Z s d = 1 2.5   K d t r m i n     l n ( | 0.14 R r s t r |   0.013 )
where, R r s t r is the remote sensing reflectance that corresponds to the wavelength with minimum Kd. Landsat 8 OLI has four spectral bands (443, 483, 555, and 670 nm) within the visible domain.

2.5. Accuracy Assessment of ZSD Model

In-situ ZSD sample dataset was used to validate the model. The statistical indicators used for validation were root mean square error (RMSE), the mean absolute difference (MAD), the mean absolute percentage error (MAPE), and determination coefficient (R2).
M A D = 1 N 1 N | X e s t , i X o b s , i |
M A P E = 1 N 1 N ( | X e s t , i X o b s , i X o b s , i | ) × 100 %
where, Xest and Xobs are the ZSD derived from Landsat 8 OLI, and in-situ measurements, respectively; N is the number of the matching observations.

2.6. Evaluating ZSD Trends and the Effects of Driving Factors

For each studied reservoir, mean annual and mean monthly ZSD were calculated from all available observations. Mean annual ZSD values were estimated from 2013 to 2020 and subsequently averaged to obtain the mean ZSD value during the entire study period. In order to obtain the annual rate of change in ZSD during the study period, linear regressions were performed with all mean annual ZSD values per reservoir. A non-parametric Mann–Kendall trend test identified the significance level of these resultant trends [50]. A k-means feature-based clustering method was employed in MATLAB to categorize reservoirs according to their mean monthly ZSD values.
To investigate the long-term influence of driving factors on the inter-annual variation in the ZSD, a multiple linear model (MLM) regression analysis was conducted. All these statistical analyses were performed in the RStudio.

3. Results

3.1. Observation Frequency of Reservoirs

Landsat 8 OLI sensor is capturing ground as segments of 185 × 180 km and has a forward overlap of 8.5 km and a side overlap of 18 km between its paths in Sri Lanka. Repeated observations are generally possible every 16 days, and eight-day frequencies in certain regions fall under path overlapping. Hence, a maximum annual observation frequency of 23 to 46 epochs is probable for each reservoir subject to the location.
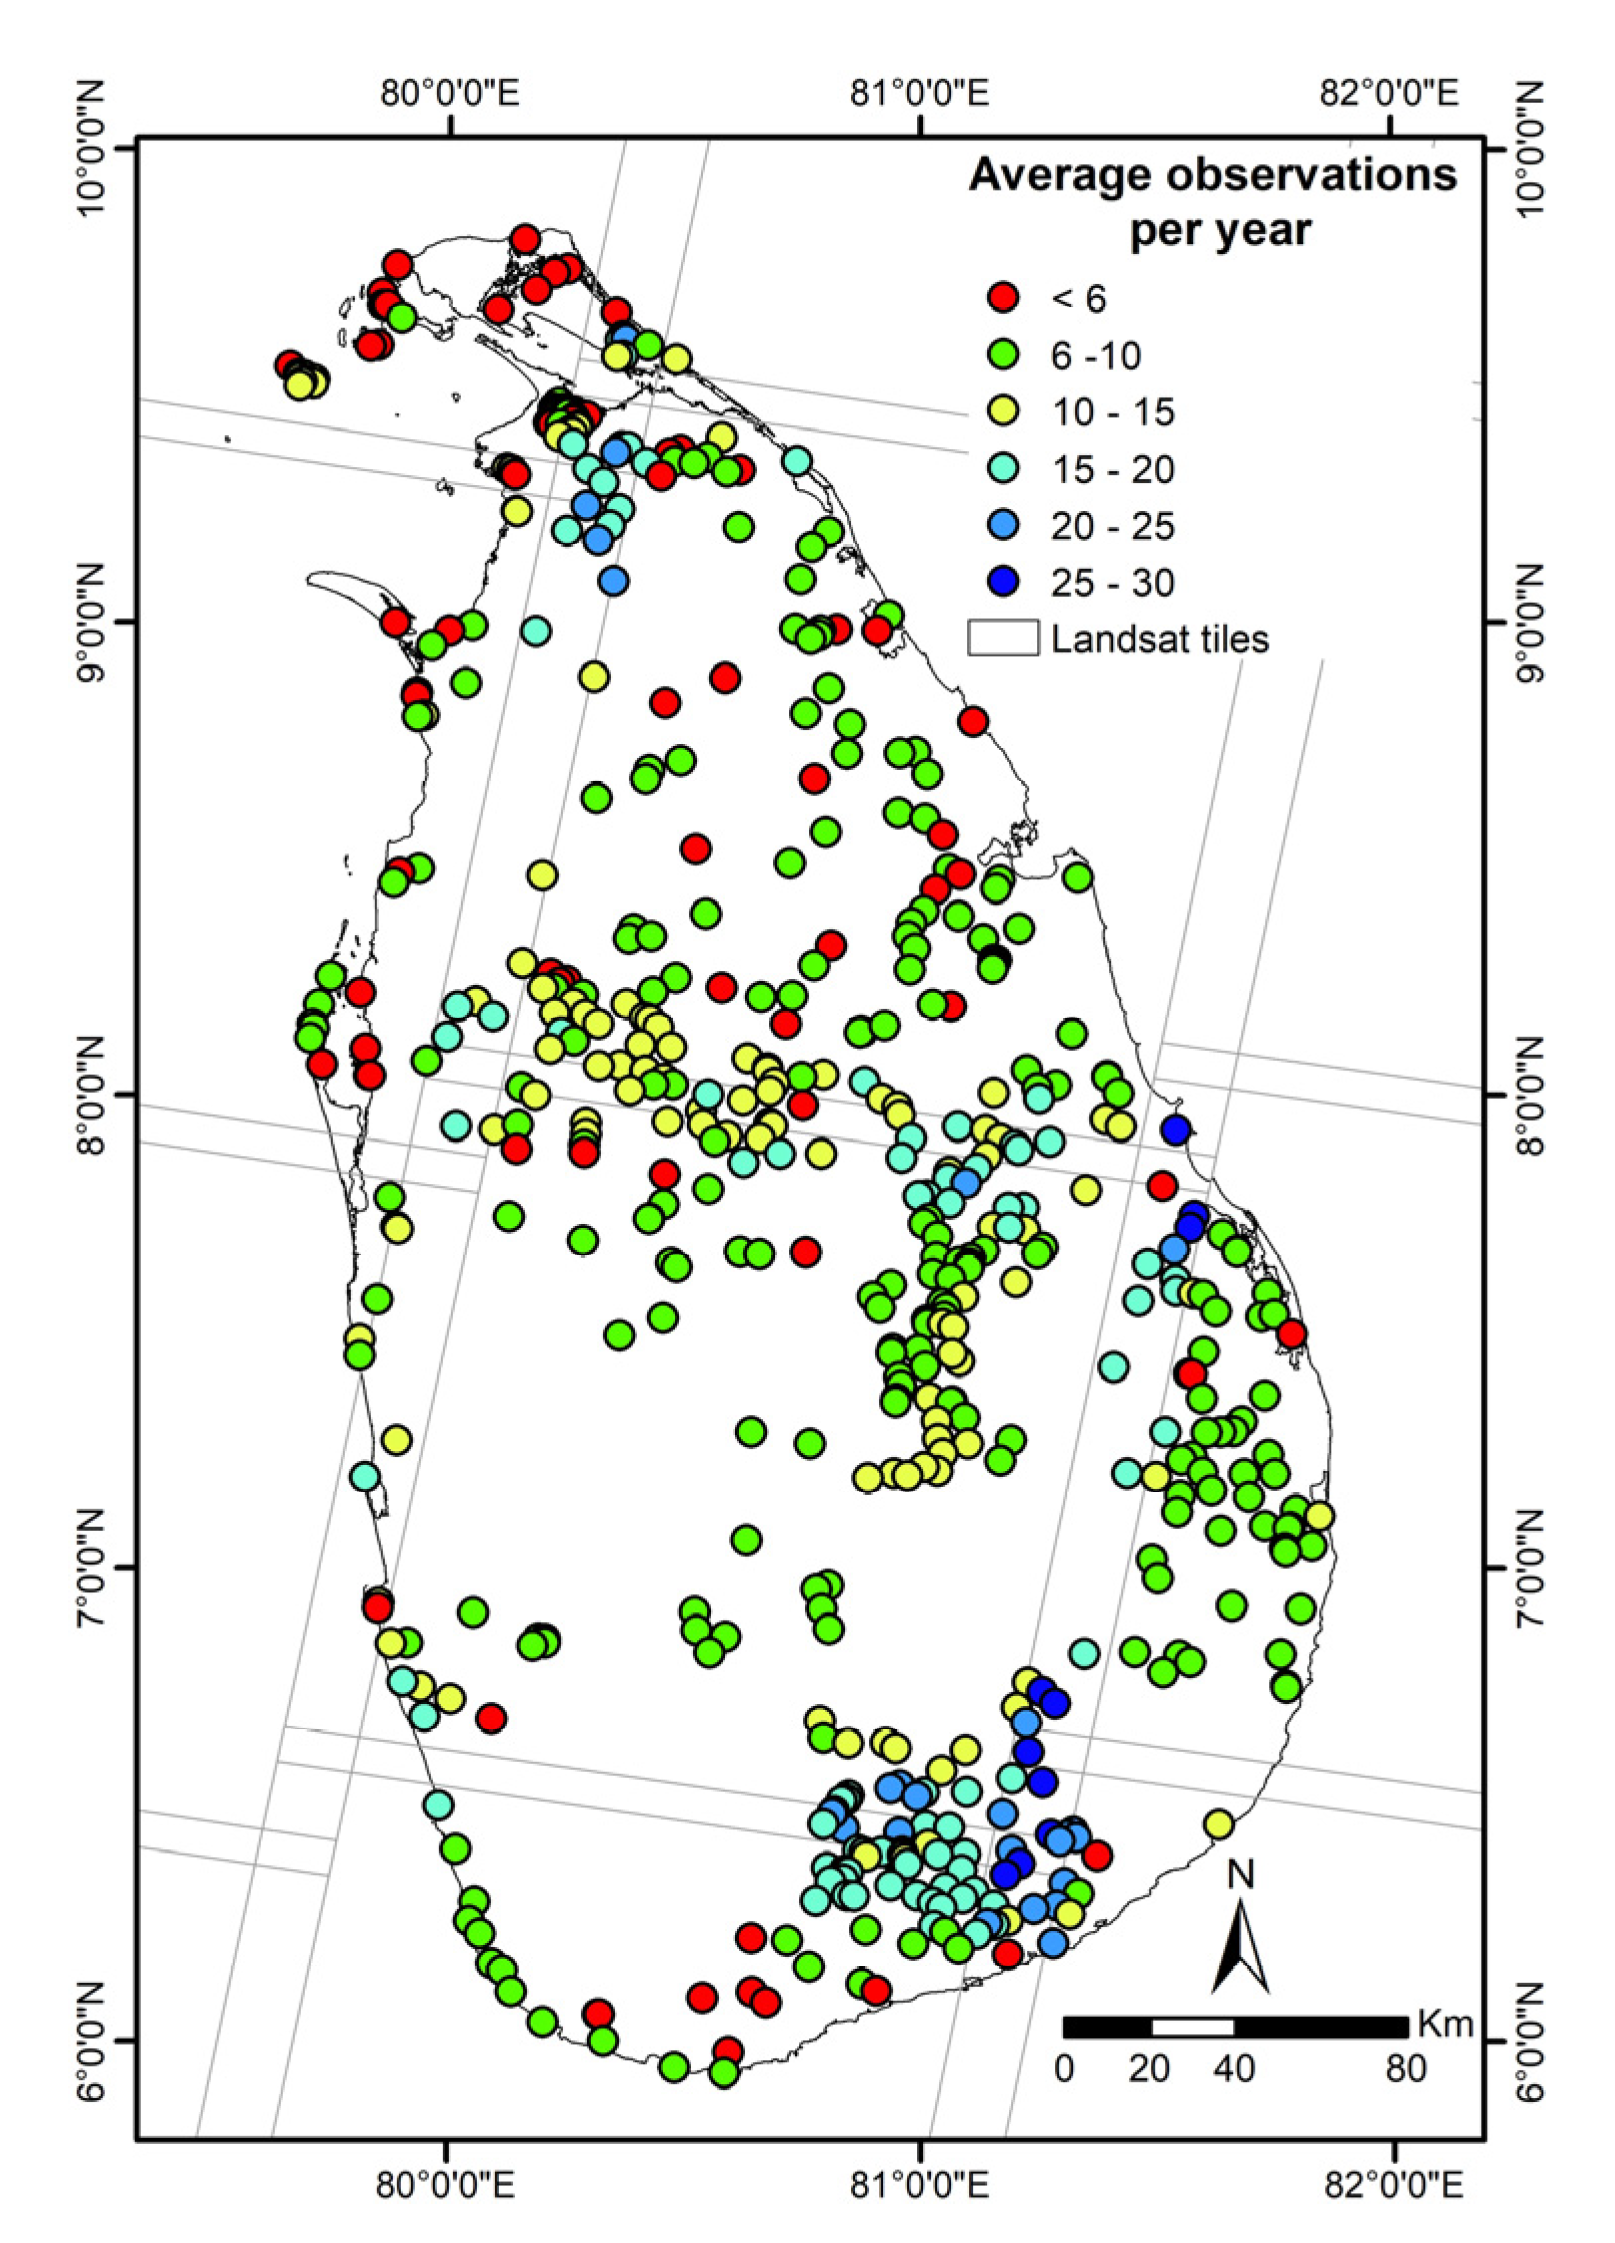
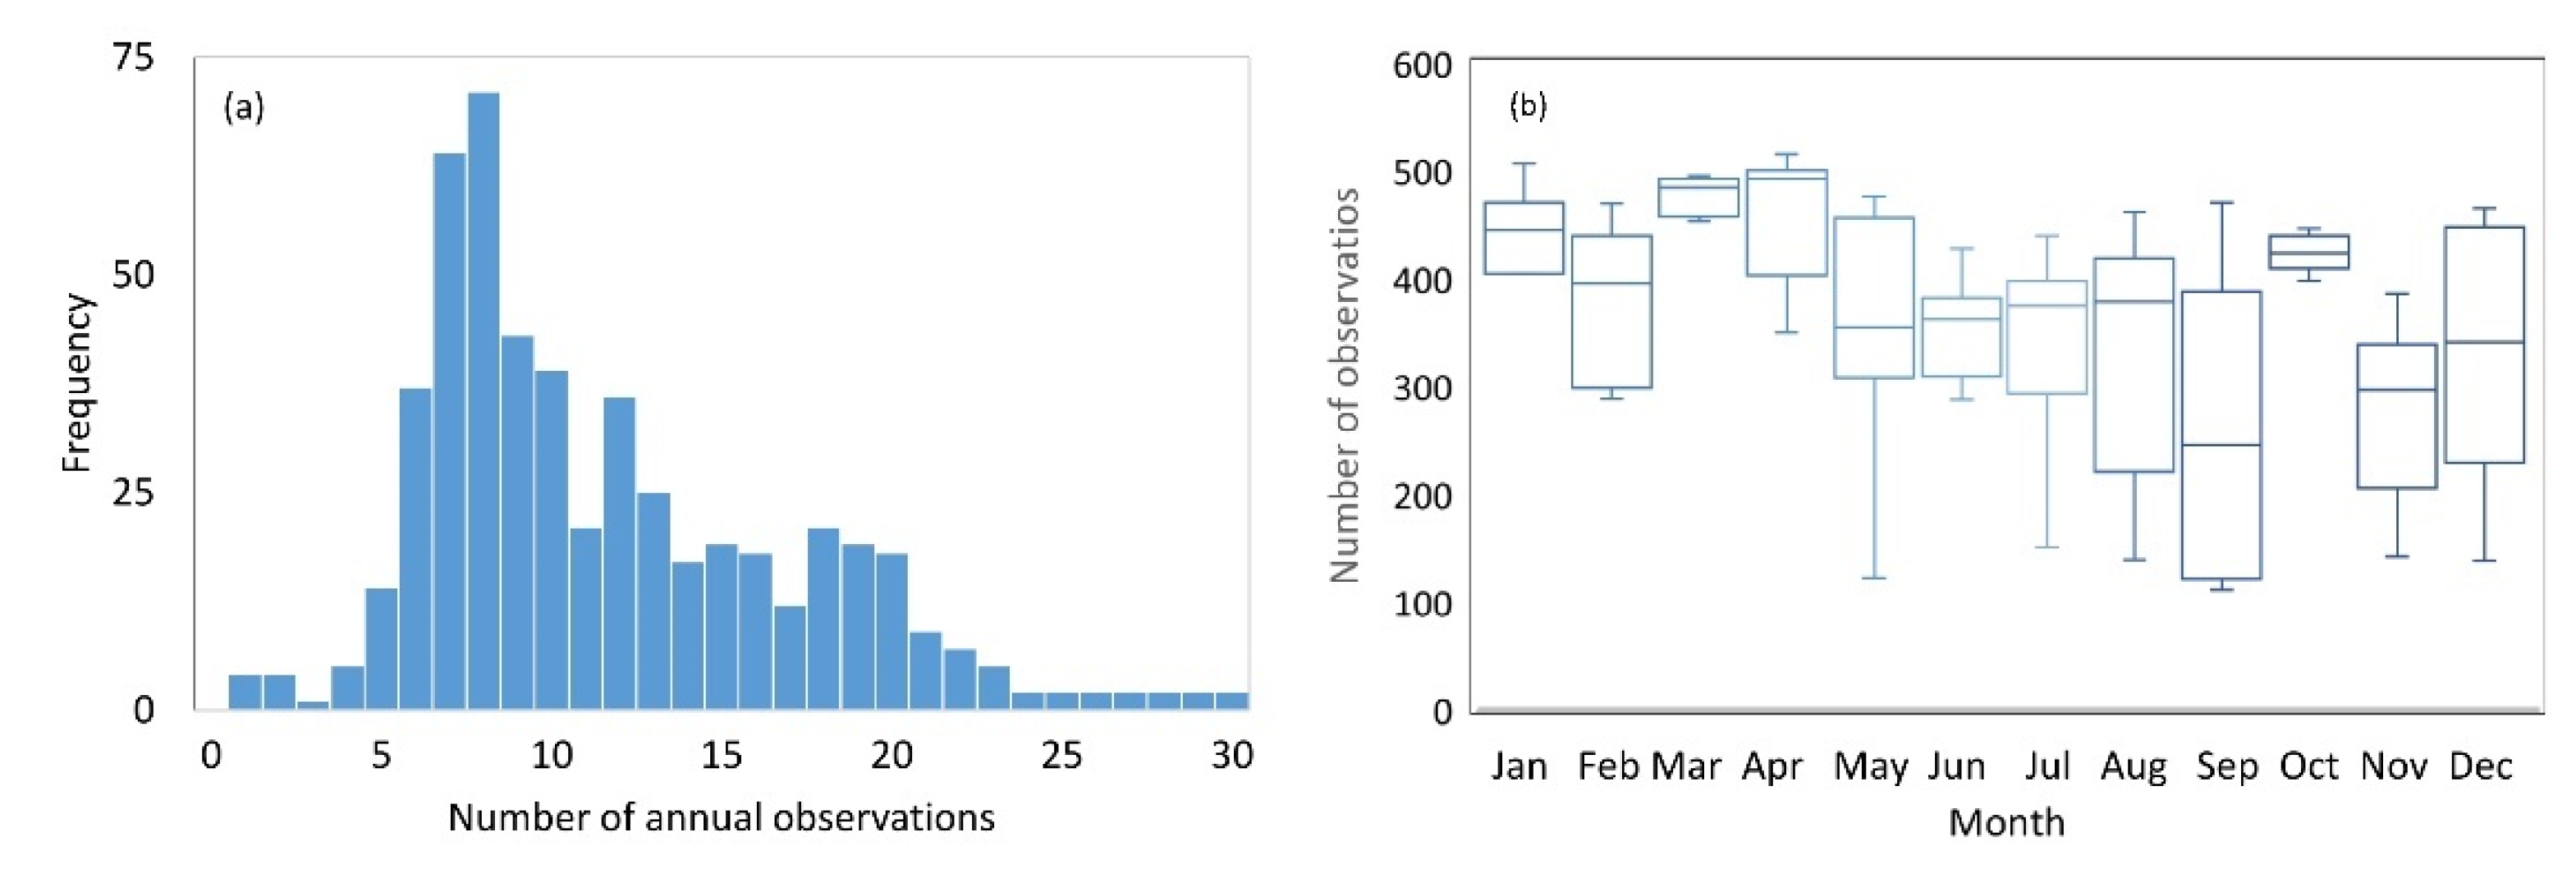
The number of clear observations of reservoirs is influenced by both cloudiness and shadowiness. Likewise, data quality is subjective to the atmospheric conditions. Cloud coverage is highly abundant around Sri Lanka and exerts great significance on the availability of suitable, good quality images [51]. After removing cloud and shadow and selecting good quality observations within reflectance range of zero and one, narrowed down the annual average observation frequency from 1 to 30 (Figure 3). Overall, reservoirs were mostly captured eight times annually, with a mean of 10.96 observations per year (Figure 4a). The median of successful observations per month ranged between 246 and 492 for the entire study period across the country (Figure 4b). Figure 4b indicates that the highest number of valid observations that occured during January, March, April and October; however, the least happened in September and November. The number of annual average observations was calculated by dividing the valid observations of each reservoir by 7.5, which is the number of years of the study period. Figure 3 shows the annual average number of successful observations for each reservoir during the entire study period with ground paths of the OLI sensor. Reservoirs located in the path overlapping regions clearly indicated a higher frequency concerning other areas. Cloud coverage peaked along the northern and north-western coastal areas of the island, exhibiting a significantly smaller number of observations per year (fewer than six).

3.2. Accuracy Assessment

The accuracy of Landsat 8 OLI derived ZSD was assessed from a total of 34 matched up pairs of in-situ field measurements and modelled values (Figure 5). The model estimated values were highly consistent (R2 = 0.67) with in-situ ZSD within a range of 70 to 190 cm with resulting in the RMSE of only 32.60 cm, the MAD of 28.44 cm and the MAPE of 36.08%.

3.3. Spatial Distribution of Water Transparency

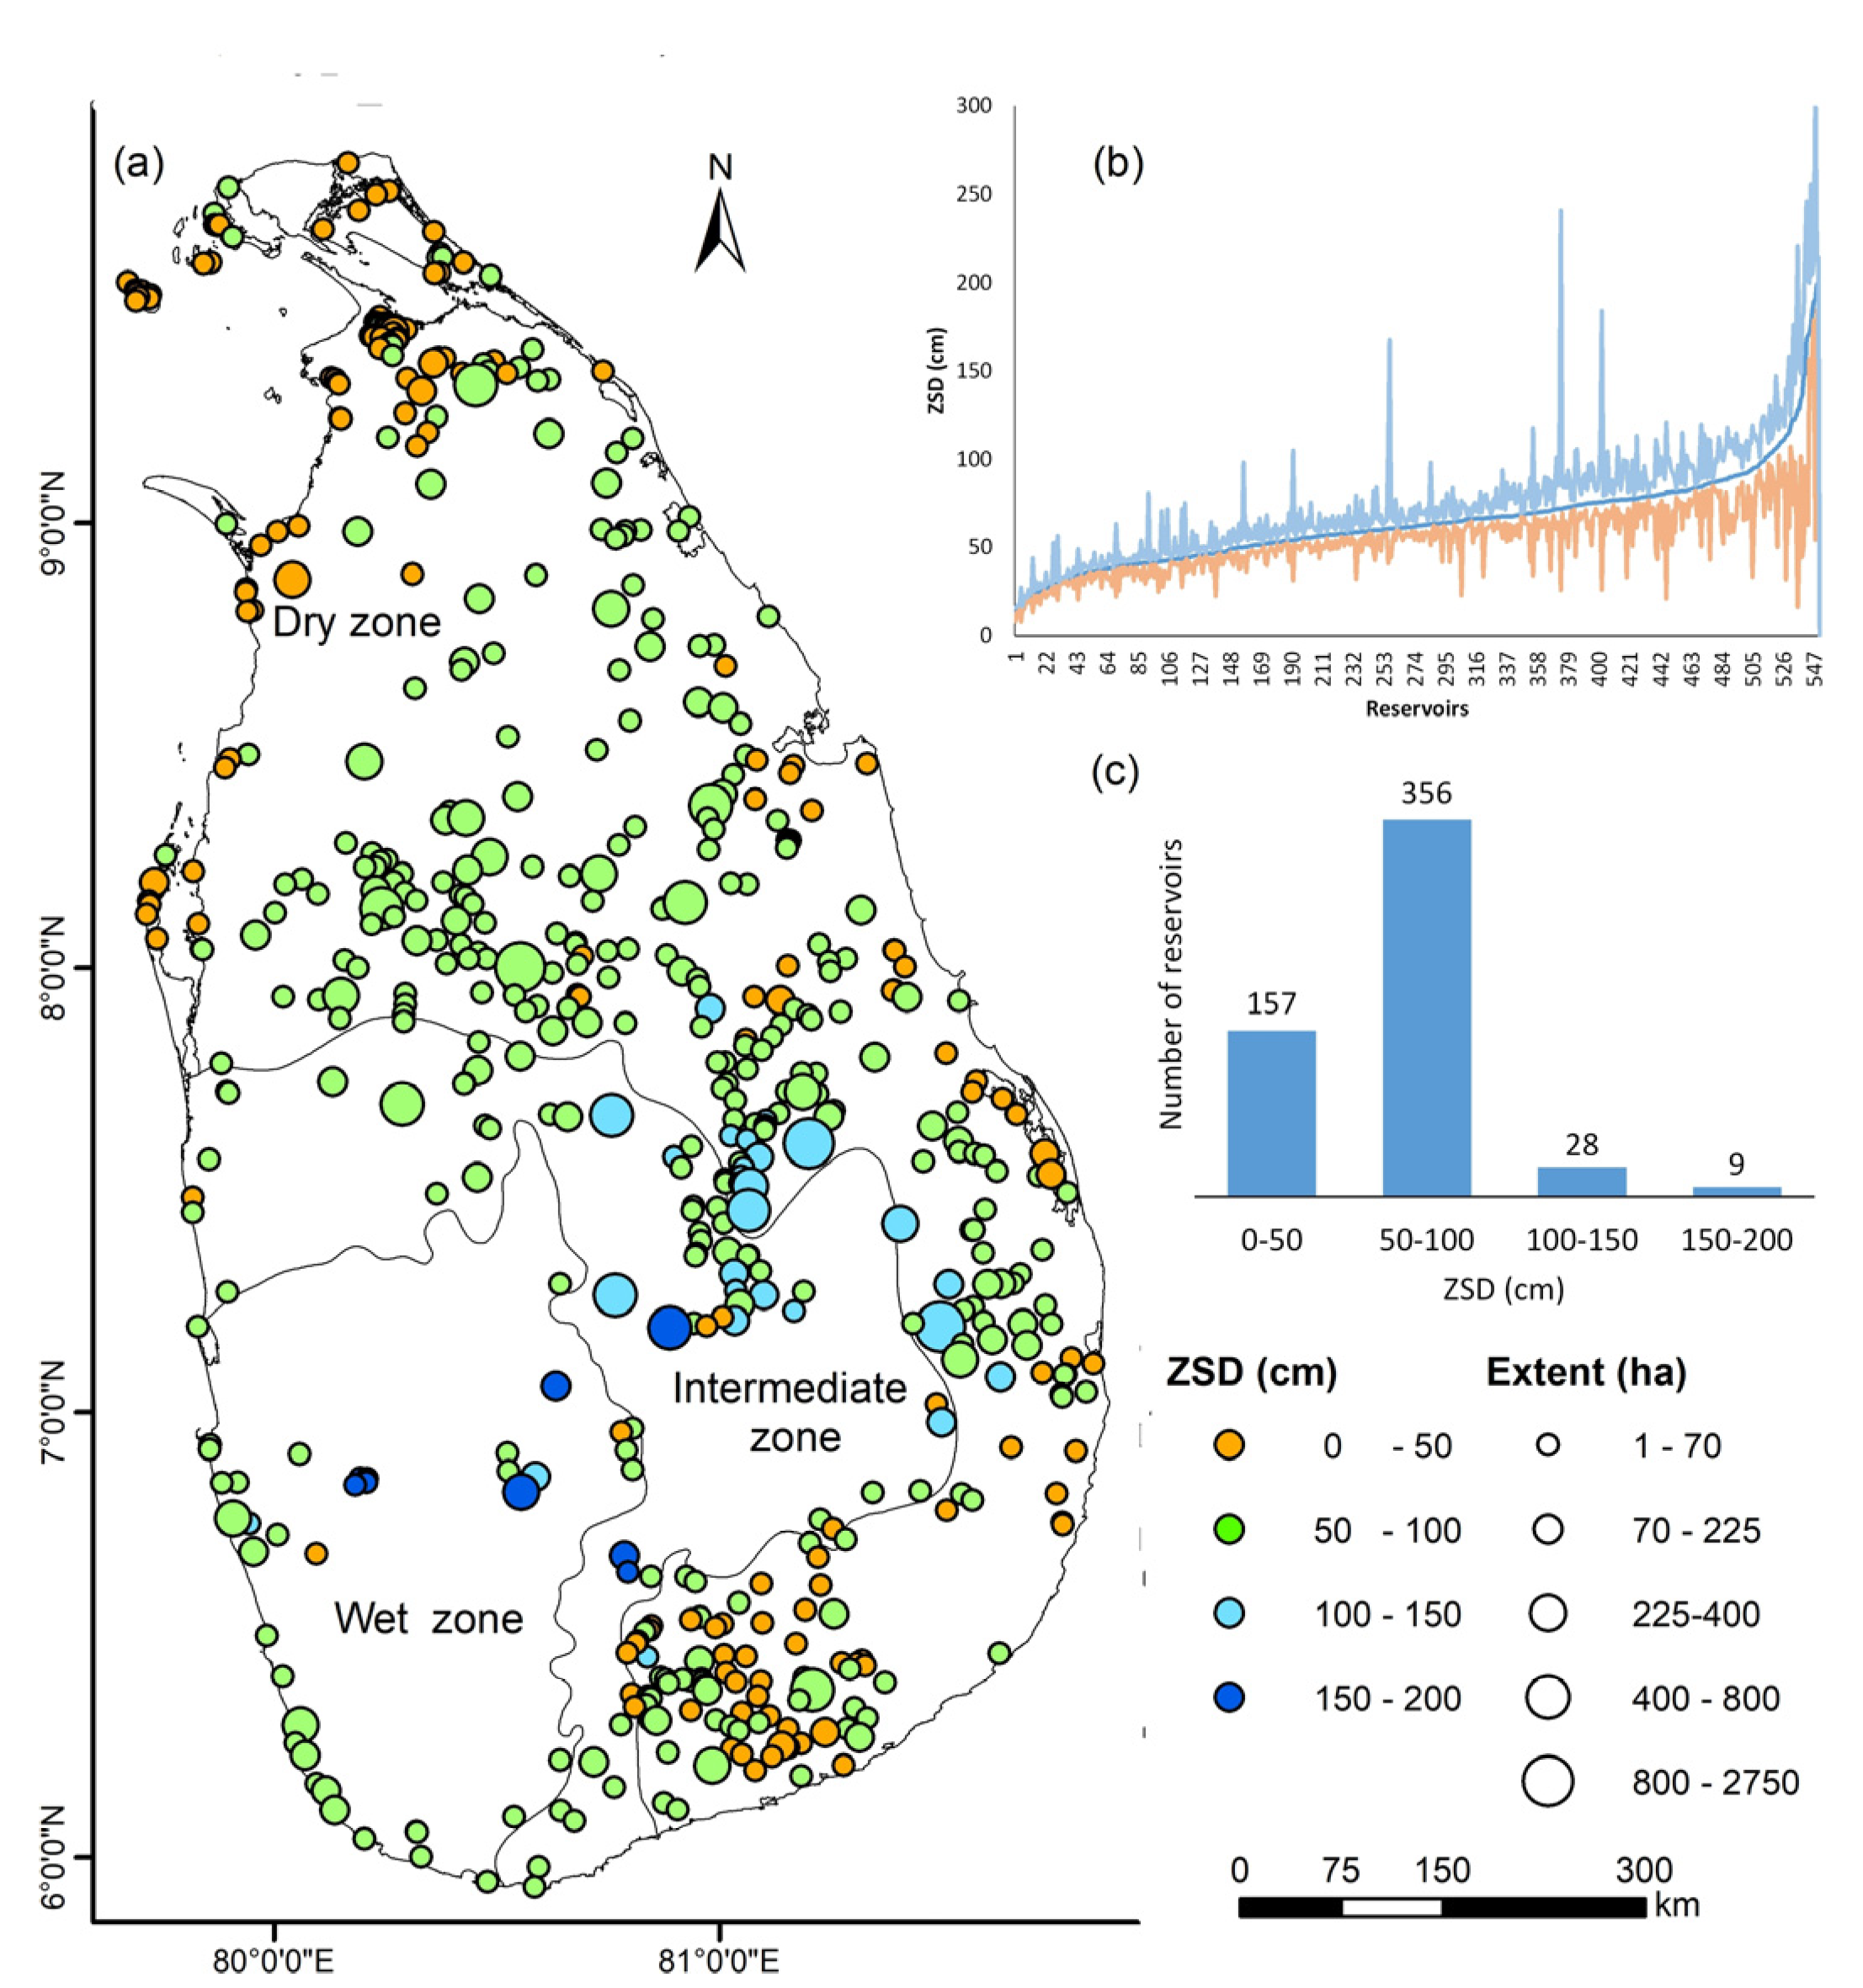
Water transparency varied spatially across the whole country from 2013 to 2020. We computed water transparency over the last eight years using Landsat 8 OLI images. Figure 6 shows the distribution of the mean ZSD of all 550 reservoirs studied with the lowest value of 9.68 cm, the highest of 199.47 cm, and an average of 64.71 cm. This result indicated that the mean water transparency was relatively lower in Sri Lanka within a short range. During the study years, the highest ZSD observed in the country was 312.36 cm (Figure 6b), and great variation between their highest and lowest ZSD was obvious among several reservoirs. Notably, about 93 % of the reservoirs showed relatively lower water transparency than 100 cm, and only 37 reservoirs were shown as more transparent than that (Figure 6c).
The distribution of mean ZSD showed several spatial patterns across the climatic zones. Mean ZSD was higher in the wet zone 91.05 ± 43.22 cm, then followed by the intermediate zone at 81.82 ± 29.79 cm, with the lowest in the dry zone with 59.81 ± 21.06 cm. Wet and intermediate zones had most of the reservoirs with a ZSD range of above 50 cm. Most reservoirs have the highest transparency (i.e., ZSD > 100 cm) located in these two zones. Reservoirs with the lowest transparency of ZSD < 50 cm were generally distributed along the coastal regions of the dry zone. Additionally, most reservoirs in this zone were shown a ZSD between 50 and 100 cm, while very few large reservoirs had a ZSD above 100 cm.

3.4. Inter- and Intra-Annual Variations in ZSD

The spatial distribution of the annual mean ZSD rate of change of all reservoirs studied from 2013 to 2020 is shown below in Figure 7a. Overall, the water transparency trend of Sri Lanka has indicated an increasing tendency at a rate of 1.02 ± 2.33 cm/year over the last eight years. ZSD of reservoirs increased at a maximum rate of 13 cm/year while they decreased up to -15 cm/year. The rate of changes in all 550 reservoirs are presented in Figure 7c. There was an increase in the mean annual ZSD in 68% of the study reservoirs, and 8% showed a significant rise (p-value < 0.05). The remaining 174 (32%) reservoirs decreased in their water transparency during the entire study period. Reservoirs with a decreasing tendency were shown to be prominent along the coastal regions and in the south-eastern part of the dry zone.
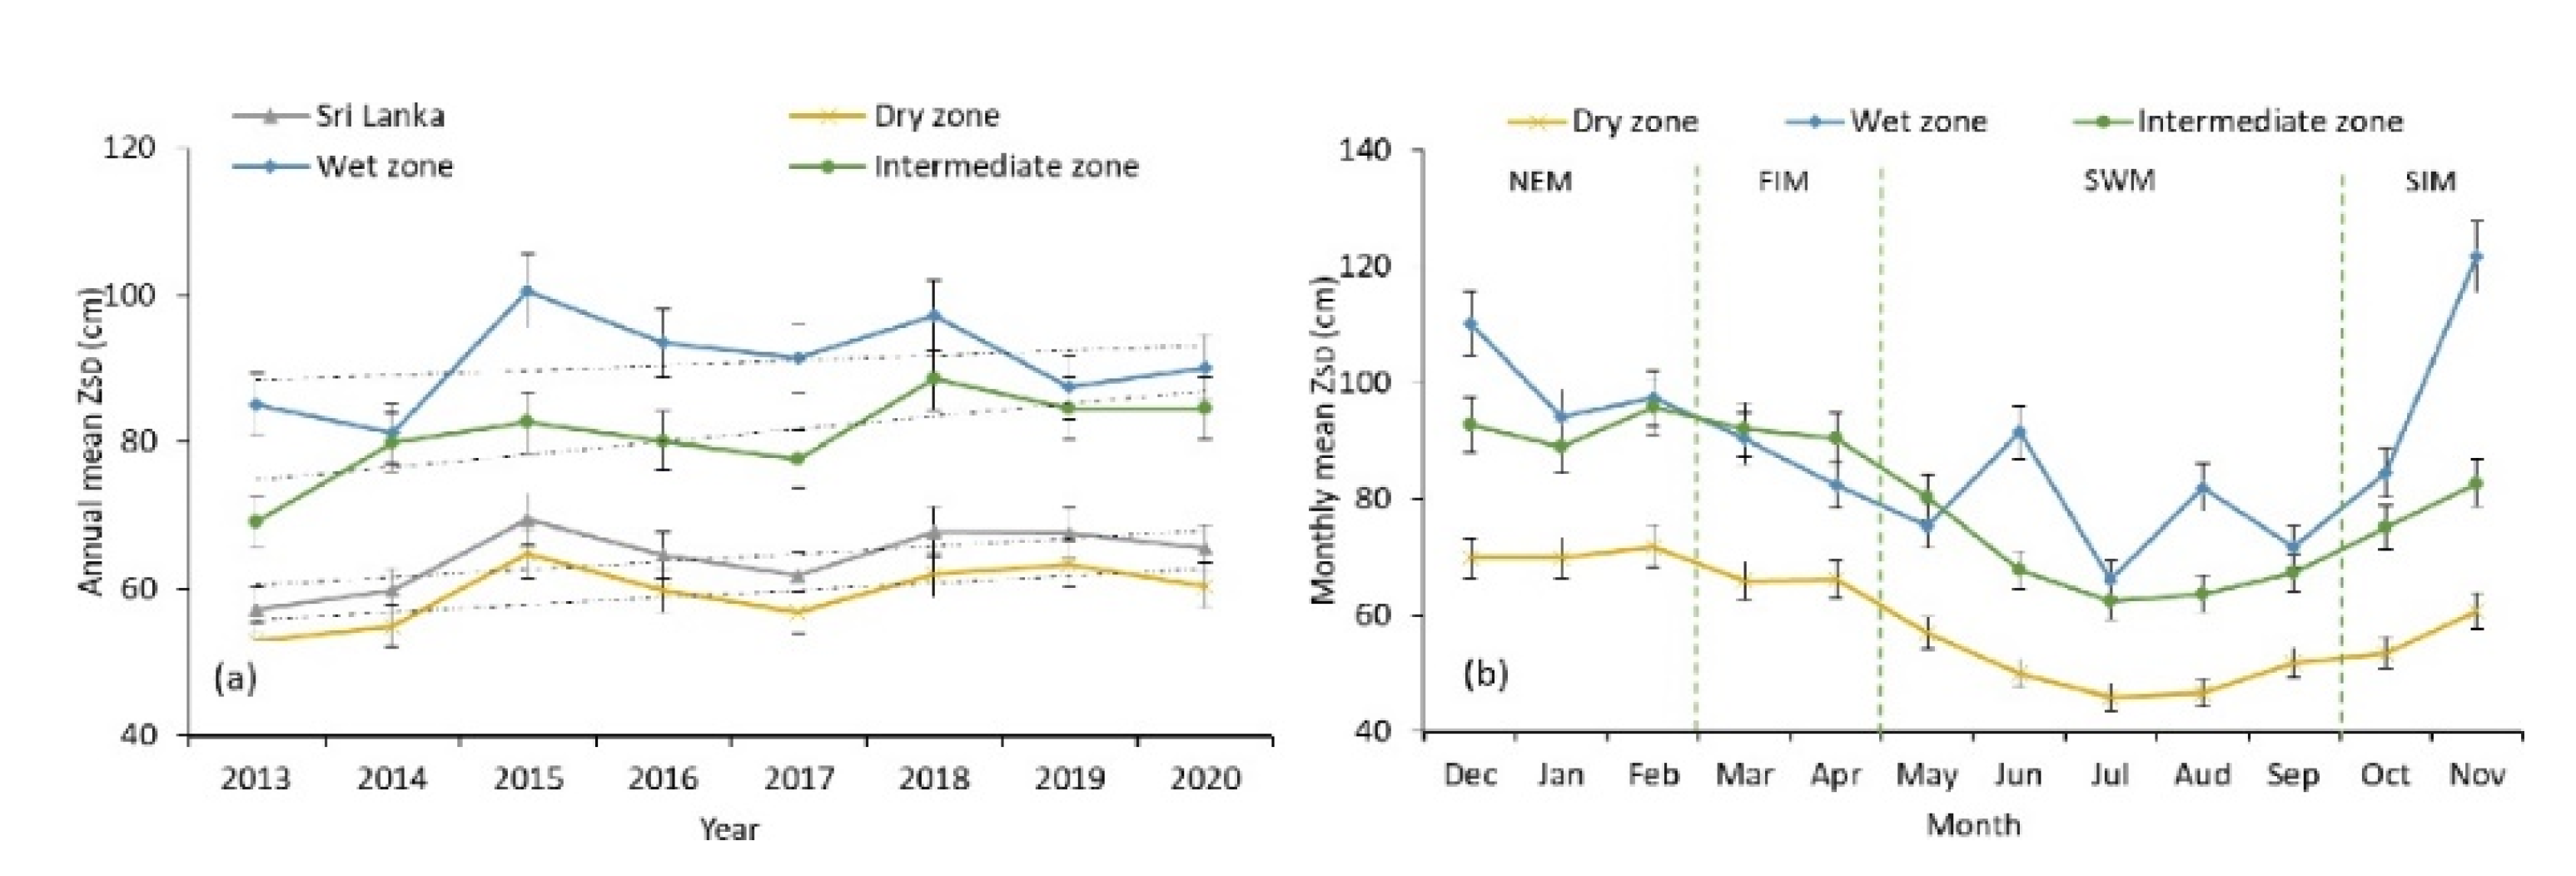
The inter-annual variations of the entire country and three climatic zones from 2013 to 2020 are plotted in Figure 8a. The overall trend of ZSD showed a slight fluctuating growth. ZSD has increased from 57.20 cm to 65.46 cm during the study years. The reservoirs in the wet zone showed the highest transparency ranging from 79.96–100.62 cm. Transparency was then followed by the intermediate zone, which increased from 69.02 cm to 84.55 cm. The dry zone had the lowest ZSD range of 52.91–64.70 cm. On the other hand, the intermediate zone was shown to have the highest increasing rate in transparency at 1.39 cm/year, followed by the dry zone with 1.00 cm/year and the lowest rate was observed in the wet zone, a rate of 0.65 cm/year.
The mean monthly ZSD of the three zones are plotted in Figure 8b along with four monsoon seasons in Sri Lanka: the north-east monsoon (NEM), the first inter monsoon season (FIM), the south-west monsoon (SWM) and the second inter monsoon (SIM). Overall, all zones showed the lowest ZSD values during the SWM. Dry and intermediate zones were highest in ZSD during the NEM, whereas the wet zone had during the NEM and SIM. Except for the wet zone in the SWM, all zones exhibited a gradual decrease in ZSD from their highest occurrence season to the lowest, and vice versa. The wet zone had a fluctuation pattern during the SWM and peaked in November. Dry and intermediate zones had the highest and lowest transparency during February and July, respectively.

3.5. Categorization of Reservoirs by Intra-Annual Variation

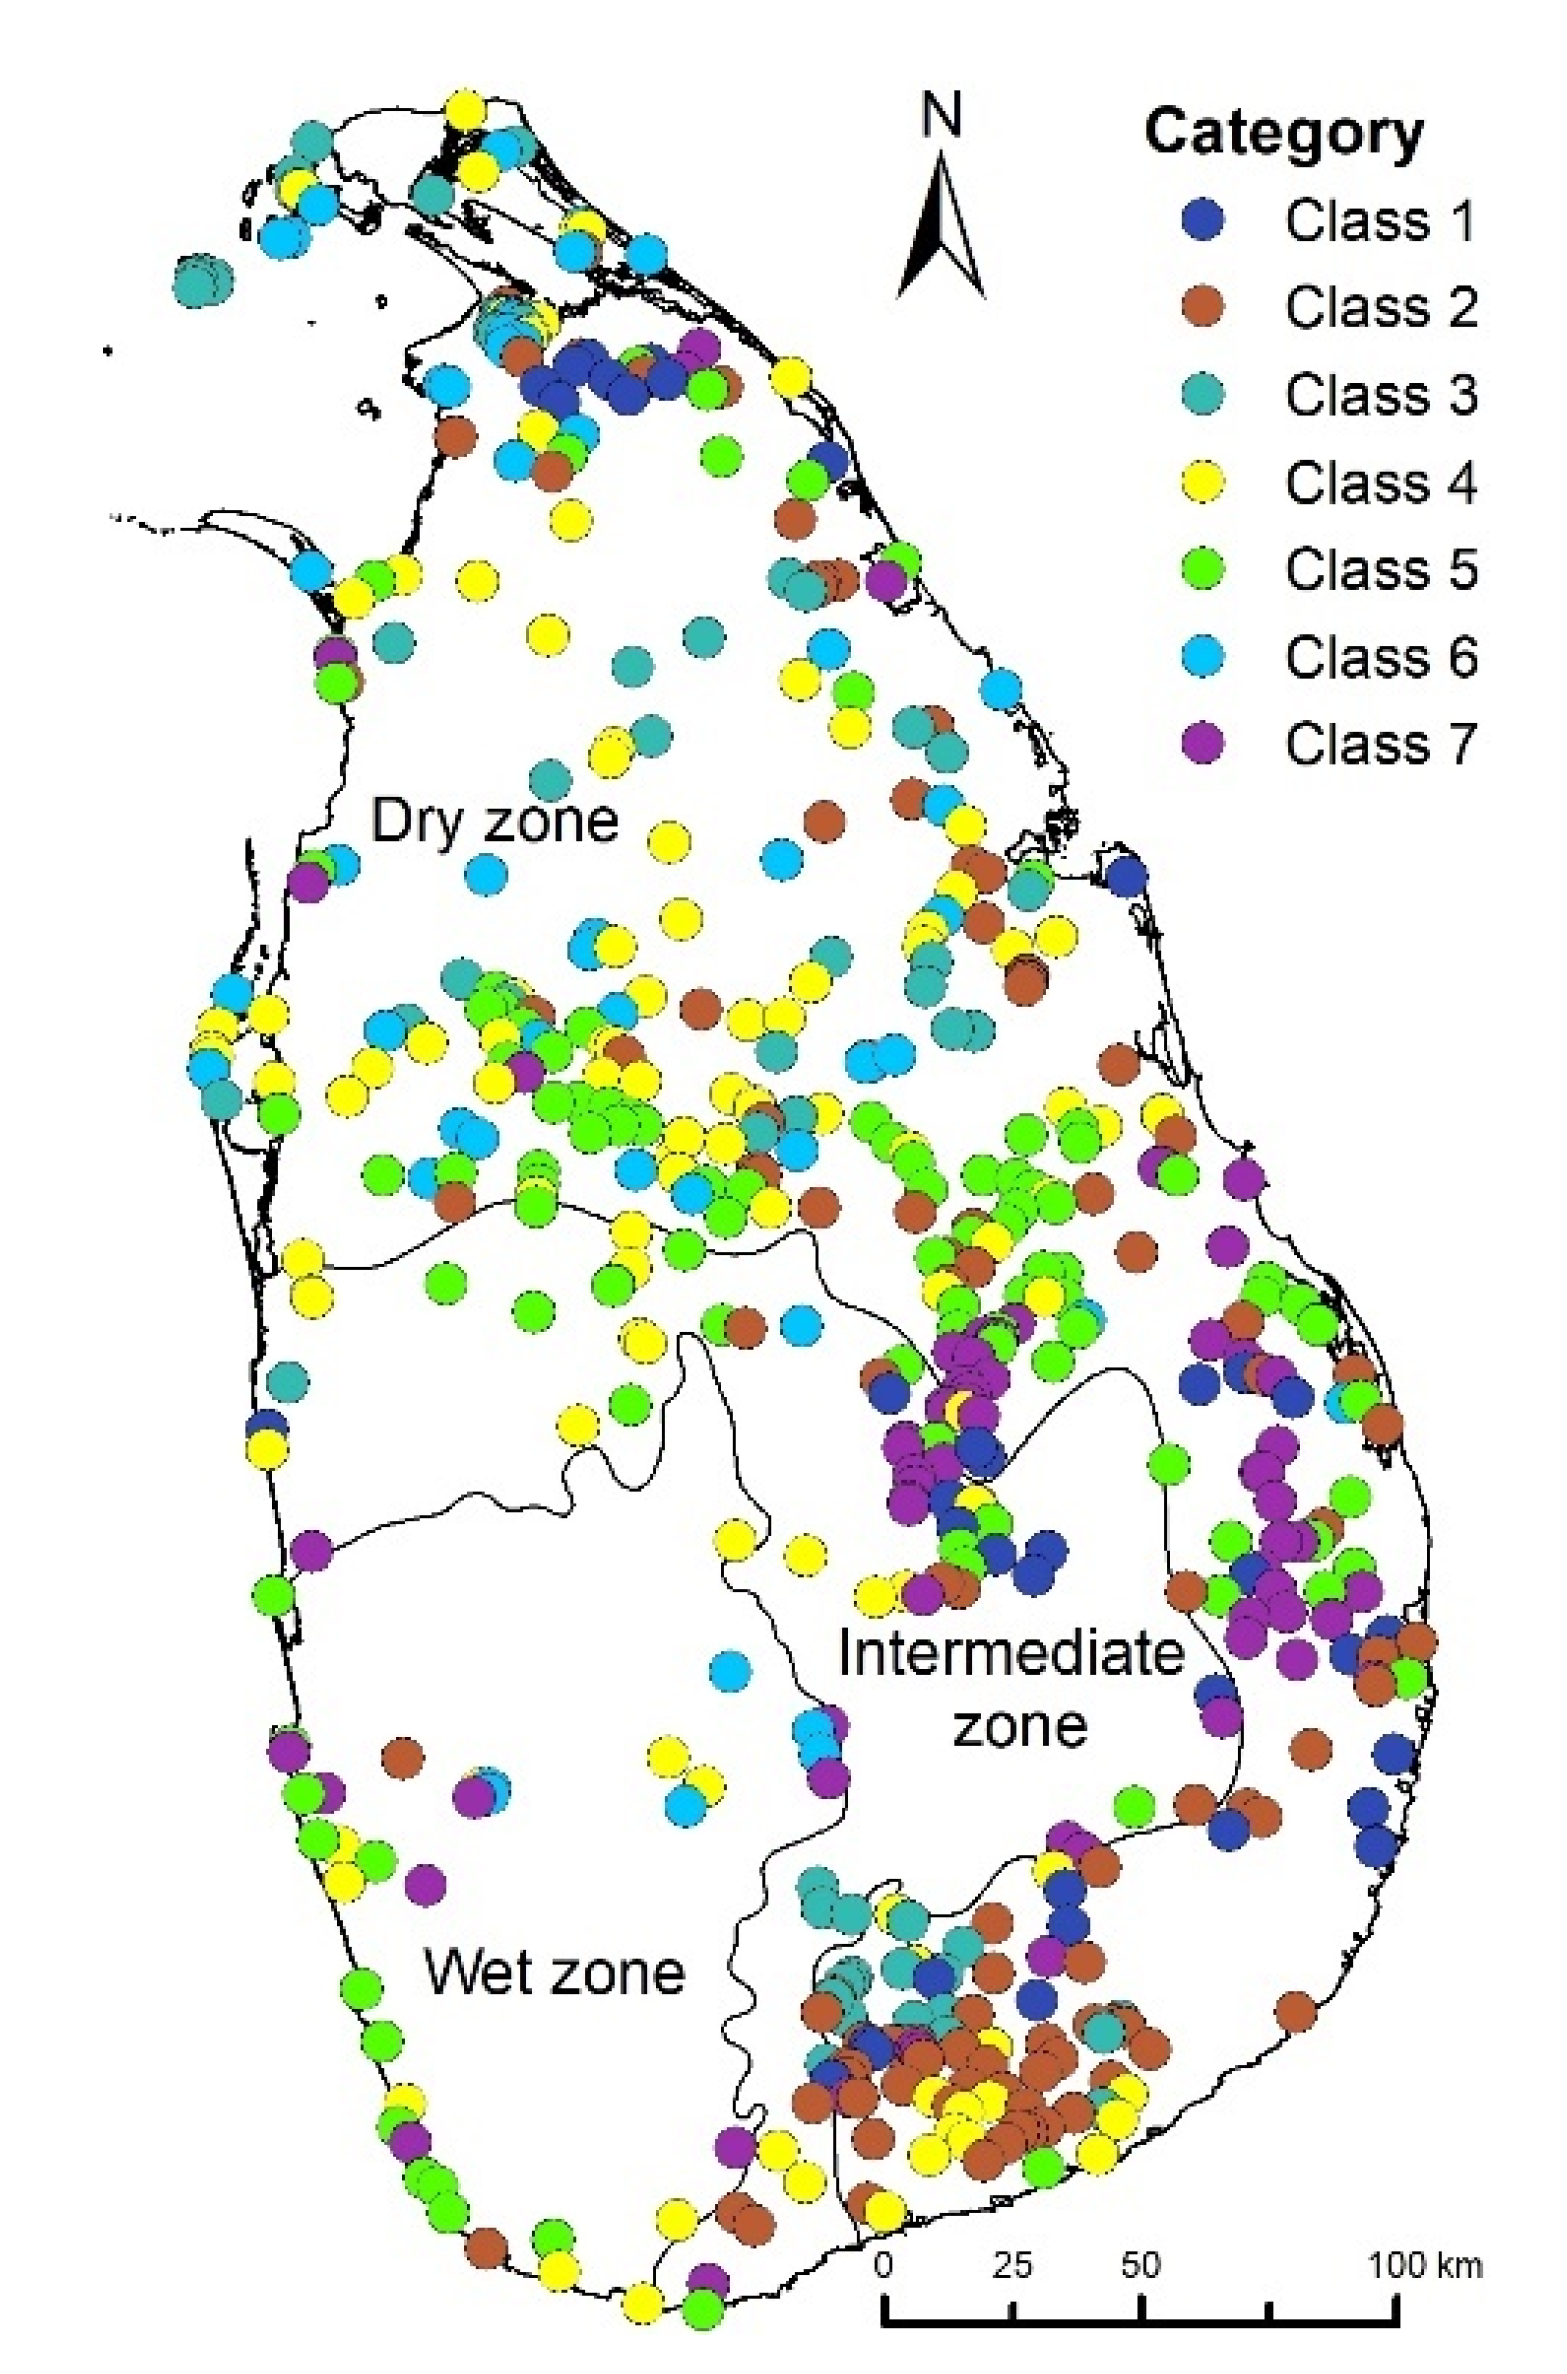
We calculated the mean monthly ZSD from all available images over the study period. A total number of 549 water bodies with more than ten valid monthly observations were selected for this analysis. All reservoirs were classified into seven different groups by a feature-based clustering with percentages (Figure 9). The spatial distribution of these seven ZSD trends across Sri Lanka is presented in Figure A1 (Appendix A).
Class 1 (N = 40) reservoirs had a peaked mean ZSD in April with a gradual increase since January which was subsequently followed by a decreased water transparency trend until the end of the year. This type of reservoir is available only in the dry and intermediate climatic zones. Class 2 (N = 109) reservoirs showed a gradual decline in mean ZSD until November, with the highest transparency in February, then again followed a sharp increase in mean ZSD in December. Class 3 (N = 61) reservoirs showed a gradual decrease in mean ZSD values from January to September and continued to reach the highest mean value in December. Class 4 (N = 115) reservoirs had the lowest water transparency from July to September in the year, with a peak in December. This type of reservoir is highest in number. Class 5 (N = 104) reservoirs showed the highest water transparency during December with a sharp increase during September. Class 6 (N = 50) indicated a mean peak in November and then continued to drop to their lowest transparency in June. In contrast to all other categories, Class 7 (N = 70) reservoirs showed a concave pattern with slight fluctuations in the mean ZSD values. ZSD remained almost the same across the entire year except for November.

3.6. Natural and Anthropogenic Drivers

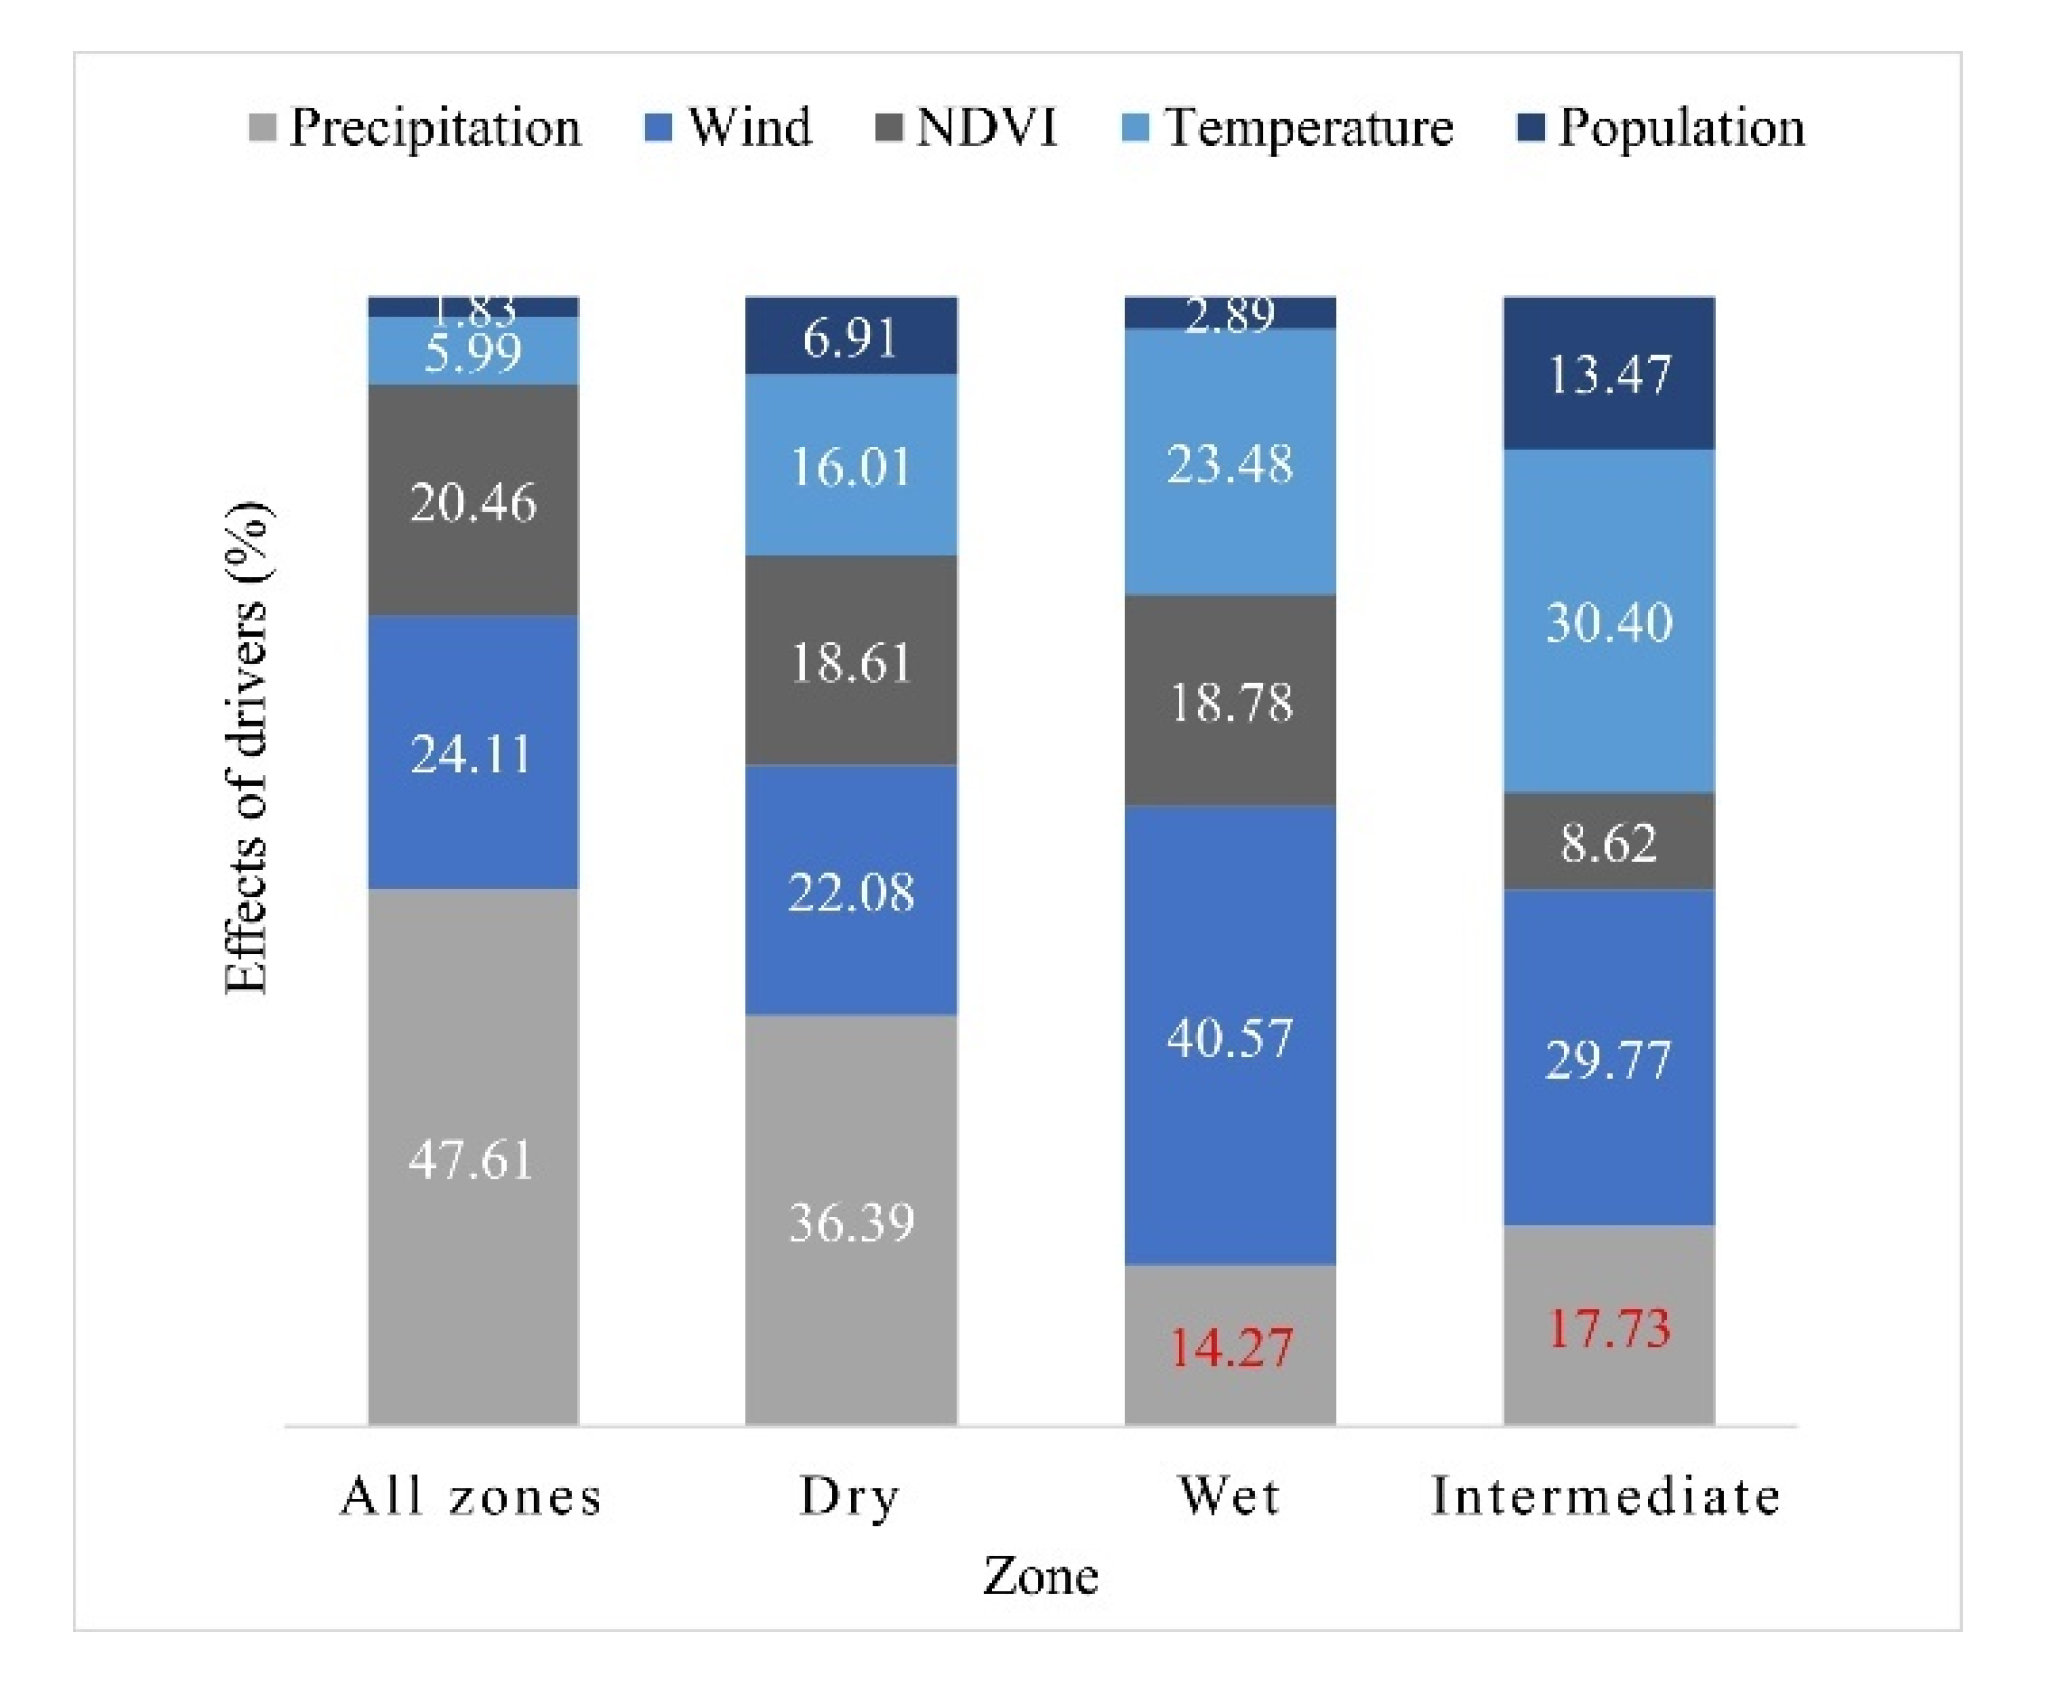
We included natural and anthropogenic induced environmental changes as drivers. Precipitation, temperature and wind speed were considered natural effects, and population density and NDVI were an indication of anthropogenic activities. MLMs were fitted over the annual mean values of ZSD and drivers of each catchment to quantify the overall effect of drivers on the spatial distribution of ZSD from May 2013 to November 2020 in the entire country and three climatic zones. When natural and anthropogenic scenarios are combined, the overall effects on inland water transparency were noticeable, as illustrated in Figure 10. Each of the factors included in the MLM (R2 = 0.30) were indicated a significant effect (p-value < 0.05) on the water transparency of Sri Lanka. Overall, interannual ZSD variations were significantly related to natural activities (precipitation and wind), whereas anthropogenic activities (NDVI and population) have about 27% of the effect in the entire country. ZSD distribution was shown to be negatively correlated with the wind in all zones (Table 6).
The influences imposed by the driving factors on spatial water transparency distribution differ per zone. All of the drivers, except precipitation, significantly influenced water transparency in wet and intermediate zones. In dry zone, precipitation and wind were shown to be the most significant influences. On the contrary, wind (40.57%) and temperature (23.48%) among the climate variables had significant negative and positive influences on water transparency changes in the wet zone. The population also had a negative effect in this zone. In the intermediate zone, temperature and wind had a similarly strong effect on water transparency as in the wet zone, whereas temperature had a negative association. In all climatic zones, climate factors played the leading roles in regulating the ZSD variations. Figure 10 also indicates that the impact of human population and human-induced land-use alterations on the inter-annual variations was about 26% in all three zones.
In addition to the aforementioned contributing factors, the relation of two geographical factors: elevation and water depth, on transparency distribution was analyzed and were not included in the MLM models due to the unavailability of continuous data. Figure 11 shows the partial influence of both elevation and water depth of reservoirs on transparency distribution patterns of Sri Lanka. Satellite-derived ZSD of the Sri Lankan reservoirs studied were depicted moderate linear relationships with both elevation (N = 536, R2 = 0.32, p-value < 0.001) and water depth (N = 336, R2 = 0.41, p-value < 0.001).

4. Discussion

4.1. Surface Water Transparency and Driving Forces

Studies have investigated climatic, catchment, and anthropogenic drivers of water transparency at local to regional scales and found that the combined effect of these factors on water transparency was much higher than their individual impact [52,53]. Generally, reservoir water quality dynamics are mainly influenced by characteristics of catchment, such as elevation, landscape, climatic conditions, vegetation and soil, population density, and the land use pattern in Sri Lanka [14]. Over the study years, the entire country showed a slight increase of 10 cm in its annual transparency with little fluctuations, which was mainly due to changes in precipitation and its spatiotemporal patterns, increasing temperature, surface runoff sediments, nutrients from excessive agrochemical runoff, excessive sand mining, domestic sewage, industrial waste discharge, rapid urbanization and land use pattern changes [15,20,38,54,55]. Understanding the effects of such factors responsible for transparency variation is vital for the management of these dynamic reservoir systems.
Among the climate factors studied, we have shown that precipitation had the highest significant impact on ZSD variation in the entire country, and that effect was more prevalent in the dry zone reservoirs. Results also revealed that the ZSD was generally highest during the SIM and NEM (October to February) seasons, which could reflect the occurrence of the highest precipitation, and on the contrarywise lowest during the driest SWM (May to September) season. These findings were similar to what other researchers have found at the reservoir scale [14,16]. Many studies reported that wind-driven sediment resuspension negatively impacts water transparency and is generally more prevalent among shallow reservoirs of Sri Lanka [14,56,57]. This significant contribution of wind can be explained by its overall 24% negative impact on the temporal distribution of ZSD in the entire island during the study years (Table 6). Here, we also showed that temperature was negatively associated with ZSD in intermediate zone reservoirs. This was probably due to the availability of favorable temperature conditions for the growth of phytoplankton in these reservoirs [17,58].
Human activities are always highlighted as one of the main contributory factors for contamination, and we counted in direct and indirect anthropogenic activities in the catchments. Direct influences are determined according to the population density [59], while indirect impacts are in the form of human-induced land-use changes, which influence sediment delivery, algal production, and vegetation cover [60,61]. According to the previous findings, population density has a significant influence on the rapid deterioration and degradation of the quality of surface water in Sri Lanka as the transparency is directly affected by the rate of sewage collection within the catchment [16,38]. This study also showed that the influence of the population was a significant factor in all zones. Indeed, it was negatively related to the changes in wet zone (Table 6), where urbanization, industrialization and the associated growth in population density have been prevalent in the island [62].
Generally, the human-induced impact of land-use type on water transparency was produced by socioeconomic and policy activities. Transparency showed a decreasing trend with the rising land-use alterations in the catchment [11,60]. In this study, NDVI was used as a measure for the human-induced alterations in vegetation cover due to the importance given to the effect of landcover change and agricultural activities on water quality in Sri Lanka [63,64]. Our results revealed that NDVI was one of the significant contributors which affects about 20% of water transparency changes in the entire country and more prevalent among the reservoirs located in dry and wet zones. Significantly, NDVI had a positive association with ZSD and was accounted for the highest variability of water transparency among the drivers in all three zones (Table 6), which was consistent with the recent study which reported that high catchment vegetation cover positively impacts the water quality of the reservoir [20]. This might be related to continuous variation in catchment vegetation cover, which typically resulted from intensified human activities such as cultivation, intensification, irrigated agricultural expansion, deforestation, emergence and expansion of urban regions, infrastructural projects, agricultural plantations and shifting cultivation from forest to pioneer farmland in the country [63,64]. This finding further suggested that efficient land use management could be one of the crucial water management factors in Sri Lanka.

4.2. The Relation between ZSD Variation and Total Suspended Solids

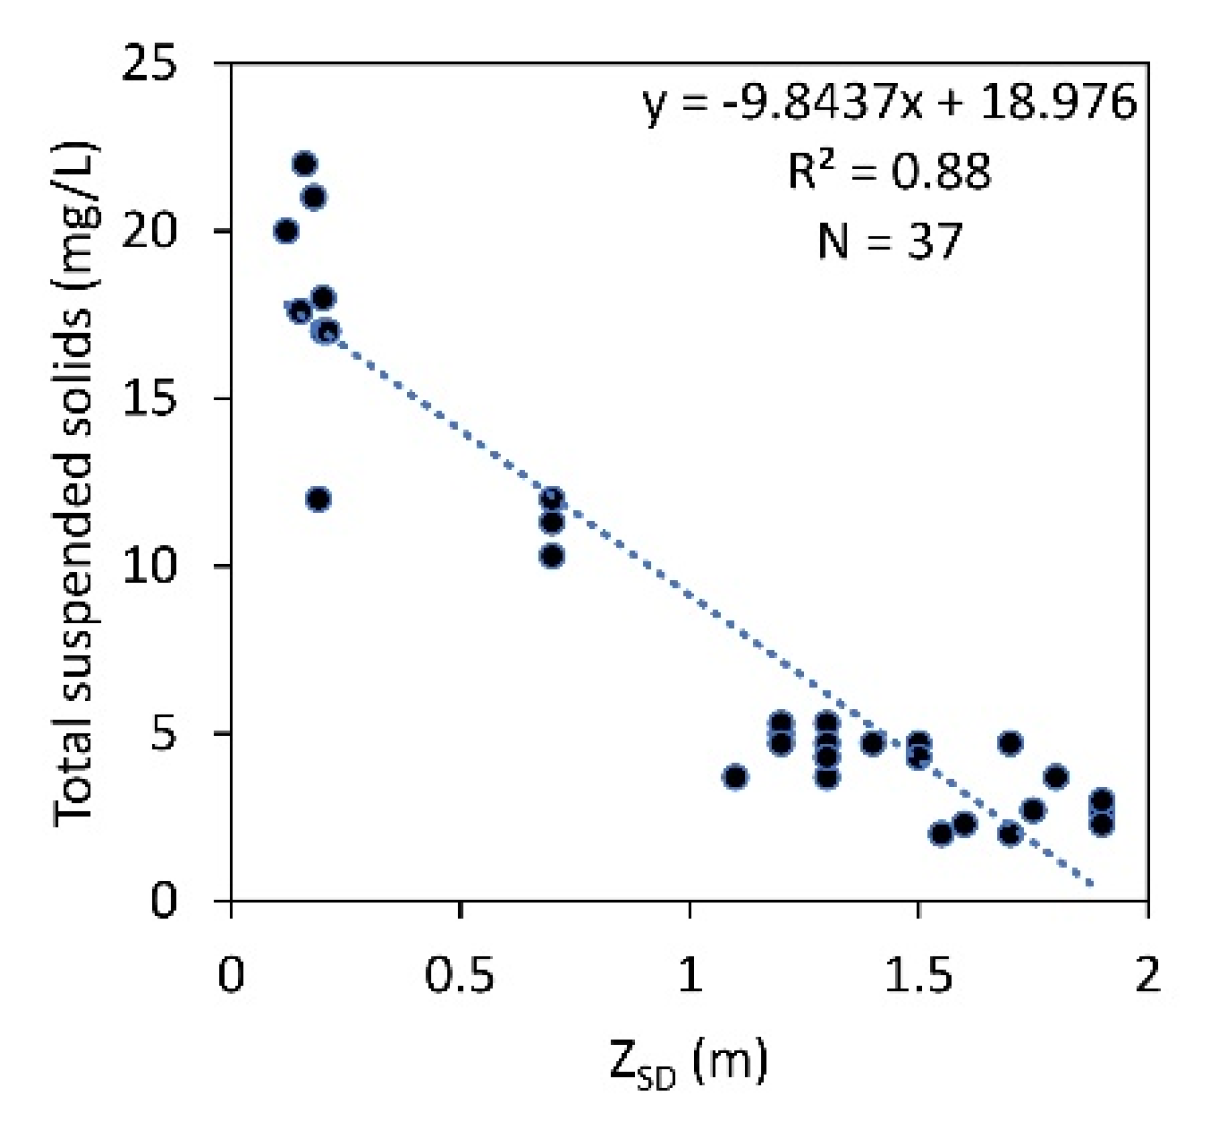
Total Suspended Solids mainly contributed to the ZSD of reservoirs in Sri Lanka. This is due to the fact that wind-driven sediment resuspension was observed as a more prominent contributing factor in shallow reservoirs in dry and intermediate zones [14,57]. In-situ TSS observations were collected from Beira, Kandy, Parakrama Samudra and Dambulla reservoirs (Table 3). TSS concentrations of collected water samples were analyzed in the laboratory using the standard method [65]. A solid negative correlation was found between in-situ ZSD and TSS (R2 = 0.88, N = 37, p-value = 2.20 × 10⁻⁶) in these reservoirs and is shown in Figure A2 (Appendix A). ZSD varied with the fluctuating water level during dry and wet periods in dry and intermediate zone reservoirs [14,16]. Soil erosion declines the transparency and improves with catchment vegetation cover in intermediate and wet zone catchments [20]. A significant contribution of temperature on phytoplankton growth was reported in several reservoirs across the intermediate zone with the reduction of ZSD [17].

4.3. Limitations and Future Improvements

Since the ZSD model entirely relies on surface reflectance, this technique prerequisites several considerations to achieve accurate outcomes, including reliable image pre-processing and atmospheric correction. An accurate atmospheric correction, therefore remains a challenge [41]. Therefore, the applied atmospheric correction method may have an impact on the results derived. Although the QAA is widely in use, there is an uncertainty due to the power coefficient η, which was originally derived based on oceanic or coastal water data that might affect the performance of this ZSD model over inland water [66]. Further, an underestimation of QAA was observed in highly turbid inland water [67,68]. Therefore, there is a possibility for uncertainties in the resultant trends in highly turbid water bodies.
Sensors with only a few broad bands do not provide sufficient data for accurate retrieval of optically active water quality parameters across a wide range of inland water conditions. Landsat 8 OLI sensor can be an effective monitoring tool for water transparency. However, they have a limitation in receiving signals in the 400–450 nm in order to capture some clear water, which generally included for ocean colour space sensors, and restricted their usage for the quasi-analytical derivation of ZSD and other optically active water quality parameters [32]. By including such feasible, virtually estimated reflectance bands at these missing wavelengths we can further improve the accuracy of the analytical derivation approach [69].
Surface water bodies in Sri Lanka are dynamic [51], and their transparency is driven by several factors. In this study, we focused only on the quantitative analysis of the selected major factors driving variation in transparency. Further consideration of all significant driver activities together might improve our understanding of how much each factor contributes to the transparency variation across the country, such as excessive application of agrochemicals, industrial wastewater discharge and sediments transportation [15,19,70]. However, quantification of actual driving factors is challenging as they differ at the catchment scale and may influence each other. The lack of data on drivers at the catchment or large scale has so far offered a challenge over time.
Since the spatial resolution of the satellite is limited to 30 m and revisit time interval limited to 16 days, these issues might be challenging. These limitations can be potentially addressed by supplementing with additional very high-resolution satellite images. Similarly, local areas or individual reservoirs can be supplemented with drone images with a meter or submeter resolution. Overall, the good performance of QAA over this tropical island suggests that this approach can accurately capture ZSD dynamics of waterbodies in areas with similar climatic or geographical conditions.

5. Conclusions

For the first time, this study provided water transparency trends of 550 reservoirs across Sri Lanka from 2013 to 2020 using Landsat 8 OLI images in a semi-analytical approach in the GEE platform, and the following conclusions could be drawn through the comprehensive analyses of ZSD distribution, trends, and effect of environmental variables at catchment scale of climatic zones (dry, wet and intermediate) of Sri Lanka:
  • The mean ZSD of all reservoirs ranged from 9.68 cm to 199.47 cm with an average of 64.71 cm, and among them, about 93.30% (N = 513) of the reservoirs showed a ZSD lower than 100 cm.
  • The wet zone was highest in water transparency (91.05 ± 43.22 cm), followed by the intermediate zone with 81.82 ± 29.79 cm, and the lowest among the dry zone reservoirs (59.81 ± 21.06 cm).
  • All reservoirs in Sri Lanka exhibited a mean annual growth rate of change 1.02 ± 2.33 cm with increasing tendencies observed in 68% (N = 374) of the reservoirs. Statistically significant changes (increasing/decreasing) were observed in 9.45% of reservoirs.
  • The transparency was generally highest in NEM (December to February) season, and at its lowest during SWM (May to September) season.
  • Both natural and anthropogenic drivers were significantly affecting water transparency. The impact of natural factors (precipitation, wind and temperature) on ZSD changes was more significant (77.70%) when compared to anthropogenic variables as a whole. In contrast, human activity (NDVI) accounted for the highest variability in all zones. The entire country and dry zone were significantly influenced by all five drivers (precipitation, wind, temperature, NDVI and population density). Except for precipitation, all other drivers studied exhibited statistically significant effects in wet and intermediate zones.

Author Contributions

Conceptualization, D.S.; methodology, D.S. and F.Z.; software, D.S.; validation, D.S.; formal analysis, D.S.; investigation, D.S.; data curation, D.S.; writing—original draft preparation, D.S.; writing—review and editing, D.S., F.Z., S.E., S.W., Z.Y., J.L.; visualization, D.S.; supervision, J.L., B.Z.; funding acquisition, J.L., F.Z. All authors have read and agreed to the published version of the manuscript.

Funding

This research was funded by Focused Special Project of Major Scientific Research Programs of the Henan Academy of Sciences, grant number 210101007, Science and Technology Service Network Initiative, Chinese Academy of Sciences, grant number KFJ-STS-ZDTP-077, Strategic Priority Research Program of the Chinese Academy of Sciences, grant number XDA19080304, National Natural Science Foundation of China, grant number 419713184, and Dragon 5 Cooperation, grant number 59193.

Acknowledgments

The authors are grateful to the U.S. Geological Survey for providing the Landsat 8 data. The first author would like to acknowledge CAS-TWAS President’s Fellowship Program for the support during the study. The authors express thanks to Zhang Zhongke, UCAS and the Irrigation Department of Sri Lanka for their support to carry out the fieldwork. The authors would also like to thank L. N. Wijewardene for providing in-situ data for validation. The authors would like to thank the reviewers for their helpful and constructive comments and suggestions, which have improved the manuscript.

Conflicts of Interest

The authors declare no conflict of interest.

Appendix A

Figure A1. The spatial distribution of seven ZSD trend classes.
Remotesensing 13 02193 g0a1
Figure A2. Field observed relationship between ZSD and total suspended solids.
Remotesensing 13 02193 g0a2

References

  1. Fekete, B.M.; Wisser, D.; Kroeze, C.; Mayorga, E.; Bouwman, L.; Wollheim, W.M.; Vörösmarty, C. Millennium Ecosystem Assessment scenario drivers (1970–2050): Climate and hydrological alterations. Glob. Biogeochem. Cycles 2010, 24. [Google Scholar] [CrossRef] [Green Version]
  2. Karpatne, A.; Khandelwal, A.; Chen, X.; Mithal, V.; Faghmous, J.; Kumar, V. Global Monitoring of Inland Water Dynamics: State-of-the-Art, Challenges, and Opportunities. In Studies in Computational Intelligence; Lässig, J., Kersting, K., Morik, K., Eds.; Springer International Publishing: Cham, Switzerland, 2016; Volume 645, pp. 121–147. ISBN 978-3-319-31856-1. [Google Scholar]
  3. Martins, V.S.; Kaleita, A.; Barbosa, C.C.F.; Fassoni-Andrade, A.C.; de Lucia Lobo, L.; Novo, E.M.L.M. Remote sensing of large reservoir in the drought years: Implications on surface water change and turbidity variability of Sobradinho reservoir (Northeast Brazil). Remote Sens. Appl. Soc. Environ. 2019, 13, 275–288. [Google Scholar] [CrossRef]
  4. Wilson, C.O. Land use/land cover water quality nexus: Quantifying anthropogenic influences on surface water quality. Environ. Monit. Assess. 2015, 187, 424. [Google Scholar] [CrossRef]
  5. Ministry of Environment, Sri Lanka. Available online: http://mmde.gov.lk/web/index.php?lang=en (accessed on 12 January 2021).
  6. Yentsch, C.S.; Yentsch, C.M.; Cullen, J.J.; Lapointe, B.; Phinney, D.A.; Yentsch, S.W. Sunlight and water transparency: Cornerstones in coral research. J. Exp. Mar. Biol. Ecol. 2002, 268, 171–183. [Google Scholar] [CrossRef]
  7. Tyler, J.E. The secchi disc. Limnol. Oceanogr. 1968, 13, 1–6. [Google Scholar] [CrossRef]
  8. Irwin, J. Water clarity records from twenty-two New Zealand lakes. N. Z. J. Mar. Freshw. Res. 1974, 8, 223–227. [Google Scholar] [CrossRef]
  9. Khorram, S.; Cheshire, H.; Geraci, A.L.; Rosa, G. LA Water quality mapping of Augusta Bay, Italy from Landsat-TM data. Int. J. Remote Sens. 1991, 12, 803–808. [Google Scholar] [CrossRef]
  10. Bonansea, M.; Ledesma, M.; Rodriguez, C.; Pinotti, L. Using new remote sensing satellites for assessing water quality in a reservoir. Hydrol. Sci. J. 2019, 64, 34–44. [Google Scholar] [CrossRef]
  11. Olmanson, L.G.; Bauer, M.E.; Brezonik, P.L. A 20-year Landsat water clarity census of Minnesota’s 10,000 lakes. Remote Sens. Environ. 2008, 112, 4086–4097. [Google Scholar] [CrossRef]
  12. Arnone, R.A.; Tucker, S.P.; Hilder, F.A. Secchi Depth Atlas Of The World Coastlines. In Proceedings of the Ocean Optics VII; Blizard, M.A., Ed.; SPIE: Monterey, CA, USA, 1984; Volume 0489, p. 195. [Google Scholar]
  13. Wijewardene, L.N.; Asanthi, H.B.; Rajapaksha, S.W. Assessment of water quality and trophic state in Sooriyawewa reservoir in the Southern province of Sri Lanka. Sri Lanka J. Aquat. Sci. 2017, 22, 9. [Google Scholar] [CrossRef] [Green Version]
  14. Silva, E.I.L.; Simon, D.; Schiemer, F. Catchment characteristics, hydrology, limnology and socio-economic features of three reservoirs in Sri Lanka. In Aquatic Ecosystems and Development: Comparative Asian Perspectives; Schiemer, F., Simon, D., Amarasinghe, U., Moreau, J., Eds.; Backhuys Publishers: Leiden, The Netherlands, 2008; Chapter 2; pp. 19–44. [Google Scholar]
  15. Weerasinghe, V.P.A.; Handapangoda, K. Surface water quality analysis of an urban lake; East Beira, Colombo, Sri Lanka. Environ. Nanotechnol. Monit. Manag. 2019, 12, 100249. [Google Scholar] [CrossRef]
  16. Nadarajah, S.; Wijenayake, W.M.H.K.; Amarasinghe, U.S. Influence of hydrology on water quality and trophic state of irrigation reservoirs in Sri Lanka. Lakes Reserv. Res. Manag. 2019, 24, 287–298. [Google Scholar] [CrossRef]
  17. Senanayake, P.A.A.P.K.; Yatigammana, S.K. Quantitative observations of Cyanobacteria and Dinoflagellata in reservoirs of Sri Lanka. Ceylon J. Sci. 2017, 46, 55. [Google Scholar] [CrossRef]
  18. Jones, J.R.; Knowlton, M.F. Suspended solids in Missouri reservoirs in relation to catchment features and internal processes. Water Res. 2005, 39, 3629–3635. [Google Scholar] [CrossRef]
  19. Pathiratne, K.A.S.; De Silva, O.C.P.; Hehemann, D.; Atkinson, I.; Wei, R. Occurrence and Distribution of Polycyclic Aromatic Hydrocarbons (PAHs) in Bolgoda and Beira Lakes, Sri Lanka. Bull. Environ. Contam. Toxicol. 2007, 79, 135–140. [Google Scholar] [CrossRef] [PubMed]
  20. Kumarasiri, A.D.T.N.; Udayakumara, E.P.N.; Jayawardana, J.M.C.K. Impacts of soil erosion and forest quality on water quality in Samanalawewa watershed, Sri Lanka. Model. Earth Syst. Environ. 2021, 1–16. [Google Scholar] [CrossRef]
  21. Giardino, C.; Brando, V.E.; Gege, P.; Pinnel, N.; Hochberg, E.; Knaeps, E.; Reusen, I.; Doerffer, R.; Bresciani, M.; Braga, F.; et al. Imaging Spectrometry of Inland and Coastal Waters: State of the Art, Achievements and Perspectives. Surv. Geophys. 2019, 40, 401–429. [Google Scholar] [CrossRef] [Green Version]
  22. IOCCG. Earth Observations in Support of Global Water Quality Monitoring; Greb, S., Dekker, A., Binding, C., Eds.; IOCCG Report Series, No. 18; International Ocean Colour Coordinating Group: Dartmouth, NS, Canada, 2018. [Google Scholar]
  23. Minu, P.; Lotliker, A.A.; Shaju, S.S.; SanthoshKumar, B.; Ashraf, P.M.; Meenakumari, B. Effect of optically active substances and atmospheric correction schemes on remote-sensing reflectance at a coastal site off Kochi. Int. J. Remote Sens. 2014, 35, 5434–5447. [Google Scholar] [CrossRef]
  24. Preisendorfer, R.W. Secchi disk science: Visual optics of natural waters1. Limnol. Oceanogr. 1986, 31, 909–926. [Google Scholar] [CrossRef] [Green Version]
  25. Shahzad, M.I.; Meraj, M.; Nazeer, M.; Zia, I.; Inam, A.; Mehmood, K.; Zafar, H. Empirical estimation of suspended solids concentration in the Indus Delta Region using Landsat-7 ETM+ imagery. J. Environ. Manag. 2018, 209, 254–261. [Google Scholar] [CrossRef]
  26. Philpot, W.D. Radiative transfer in stratified waters: A single-scattering approximation for irradiance. Appl. Opt. 1987, 26, 4123. [Google Scholar] [CrossRef]
  27. Lymburner, L.; Botha, E.; Hestir, E.; Anstee, J.; Sagar, S.; Dekker, A.; Malthus, T. Landsat 8: Providing continuity and increased precision for measuring multi-decadal time series of total suspended matter. Remote Sens. Environ. 2016, 185, 108–118. [Google Scholar] [CrossRef]
  28. IOCCG. Remote Sensing of Inherent Optical Properties: Fundamentals, Tests of Algorithms, and Applications; Lee, Z., Ed.; Reports of the International Ocean-Colour Coordinating Group, No. 5; IOCCG: Dartmouth, NS, Canada, 2006; ISBN 9781896246567. [Google Scholar]
  29. Lee, Z.; Shang, S.; Hu, C.; Du, K.; Weidemann, A.; Hou, W.; Lin, J.; Lin, G. Secchi disk depth: A new theory and mechanistic model for underwater visibility. Remote Sens. Environ. 2015, 169, 139–149. [Google Scholar] [CrossRef] [Green Version]
  30. Lee, Z.; Carder, K.L.; Arnone, R.A. Deriving inherent optical properties from water color: A multiband quasi-analytical algorithm for optically deep waters. Appl. Opt. 2002, 41, 5755. [Google Scholar] [CrossRef]
  31. Lee, Z. Diffuse attenuation coefficient of downwelling irradiance: An evaluation of remote sensing methods. J. Geophys. Res. 2005, 110, C02017. [Google Scholar] [CrossRef]
  32. Lee, Z.; Shang, S.; Qi, L.; Yan, J.; Lin, G. A semi-analytical scheme to estimate Secchi-disk depth from Landsat-8 measurements. Remote Sens. Environ. 2016, 177, 101–106. [Google Scholar] [CrossRef]
  33. Rodrigues, T.; Alcântara, E.; Watanabe, F.; Imai, N. Retrieval of Secchi disk depth from a reservoir using a semi-analytical scheme. Remote Sens. Environ. 2017, 198, 213–228. [Google Scholar] [CrossRef] [Green Version]
  34. Luis, K.M.A.; Rheuban, J.E.; Kavanaugh, M.T.; Glover, D.M.; Wei, J.; Lee, Z.; Doney, S.C. Capturing coastal water clarity variability with Landsat 8. Mar. Pollut. Bull. 2019, 145, 96–104. [Google Scholar] [CrossRef]
  35. IOCCG. An Update of the Quasi-Analytical Algorithm (QAA_v6). Available online: http://www.ioccg.org/groups/Software_OCA/QAA_v6_2014209.pdf (accessed on 5 February 2021).
  36. Kloiber, S.M.; Brezonik, P.L.; Olmanson, L.G.; Bauer, M.E. A procedure for regional lake water clarity assessment using Landsat multispectral data. Remote Sens. Environ. 2002, 82, 38–47. [Google Scholar] [CrossRef]
  37. Chen, X.; Li, Y.S.; Liu, Z.; Yin, K.; Li, Z.; Wai, O.W.H.; King, B. Integration of multi-source data for water quality classification in the Pearl River estuary and its adjacent coastal waters of Hong Kong. Cont. Shelf Res. 2004, 24, 1827–1843. [Google Scholar] [CrossRef]
  38. Liyanage, C.P.; Yamada, K. Impact of Population Growth on the Water Quality of Natural Water Bodies. Sustainability 2017, 9, 1405. [Google Scholar] [CrossRef] [Green Version]
  39. Messager, M.L.; Lehner, B.; Grill, G.; Nedeva, I.; Schmitt, O. Estimating the volume and age of water stored in global lakes using a geo-statistical approach. Nat. Commun. 2016, 7, 13603. [Google Scholar] [CrossRef]
  40. Department of Meteorology, Sri Lanka. Available online: http://www.meteo.gov.lk (accessed on 21 February 2020).
  41. Vermote, E.; Justice, C.; Claverie, M.; Franch, B. Preliminary analysis of the performance of the Landsat 8/OLI land surface reflectance product. Remote Sens. Environ. 2016, 185, 46–56. [Google Scholar] [CrossRef]
  42. Schmidt, G.; Jenkerson, C.; Masek, J.; Vermote, E.; Gao, F. Landsat Ecosystem Disturbance Adaptive Processing System (LEDAPS) Algorithm Description; U.S. Geological Survey Open-File Report 2013-1057; U.S. Geological Survey: Reston, VA, USA, 2013. [Google Scholar]
  43. Ogashawara, I.; Jechow, A.; Kiel, C.; Kohnert, K.; Berger, S.A.; Wollrab, S. Performance of the Landsat 8 Provisional Aquatic Reflectance Product for Inland Waters. Remote Sens. 2020, 12, 2410. [Google Scholar] [CrossRef]
  44. Liu, Q.; Huang, C.; Shi, Z.; Zhang, S. Probabilistic River Water Mapping from Landsat-8 Using the Support Vector Machine Method. Remote Sens. 2020, 12, 1374. [Google Scholar] [CrossRef]
  45. Somasundaram, D.; Zhang, F.; Wang, S.; Ye, H.; Zhang, Z.; Zhang, B. Learning vector quantization neural network for surface water extraction from Landsat OLI images. J. Appl. Remote Sens. 2020, 14, 1. [Google Scholar] [CrossRef] [Green Version]
  46. Gordon, H.R.; Brown, O.B.; Evans, R.H.; Brown, J.W.; Smith, R.C.; Baker, K.S.; Clark, D.K. A semianalytic radiance model of ocean color. J. Geophys. Res. 1988, 93, 10909. [Google Scholar] [CrossRef]
  47. Gordon, H.R.; Morel, A.Y. Remote Assessment of Ocean Color for Interpretation of Satellite Visible Imagery; Lecture Notes on Coastal and Estuarine Studies; Springer: New York, NY, USA, 1983; Volume 4, ISBN 978-0-387-90923-3. [Google Scholar]
  48. Lee, Z.; Hu, C.; Shang, S.; Du, K.; Lewis, M.; Arnone, R.; Brewin, R. Penetration of UV-visible solar radiation in the global oceans: Insights from ocean color remote sensing. J. Geophys. Res. Ocean. 2013, 118, 4241–4255. [Google Scholar] [CrossRef] [Green Version]
  49. Smith, R.C.; Baker, K.S. Optical properties of the clearest natural waters (200–800 nm). Appl. Opt. 1981, 20, 177. [Google Scholar] [CrossRef]
  50. Valipour, M.; Bateni, S.M.; Gholami Sefidkouhi, M.A.; Raeini-Sarjaz, M.; Singh, V.P. Complexity of Forces Driving Trend of Reference Evapotranspiration and Signals of Climate Change. Atmosphere 2020, 11, 1081. [Google Scholar] [CrossRef]
  51. Somasundaram, D.; Zhang, F.; Ediriweera, S.; Wang, S.; Li, J.; Zhang, B. Spatial and Temporal Changes in Surface Water Area of Sri Lanka over a 30-Year Period. Remote Sens. 2020, 12, 3701. [Google Scholar] [CrossRef]
  52. Cui, L.; Qiu, Y.; Fei, T.; Liu, Y.; Wu, G. Using remotely sensed suspended sediment concentration variation to improve management of Poyang Lake, China. Lake Reserv. Manag. 2013, 29, 47–60. [Google Scholar] [CrossRef] [Green Version]
  53. McCullough, I.M.; Loftin, C.S.; Sader, S.A. Combining lake and watershed characteristics with Landsat TM data for remote estimation of regional lake clarity. Remote Sens. Environ. 2012, 123, 109–115. [Google Scholar] [CrossRef]
  54. Wimalawansa, S.A.; Wimalawansa, S.J. Protection of Watersheds, and Control and Responsible use of Fertiliser to Prevent Phosphate Eutrophication of Reservoirs. Int. J. Res. Environ. Sci. 2015, 1, 1–18. [Google Scholar]
  55. Bandara, N.J.G.J. Water and wastewater related issues in Sri Lanka. Water Sci. Technol. 2003, 47, 305–312. [Google Scholar] [CrossRef] [PubMed]
  56. Peduzzi, P.; Schiemer, F. Bacterial dynamics, nutrients and organic matter in the water column of tropical freshwater reservoirs of Sri Lanka. In Aquatic Ecosystems and Development: Comparative Asian Perspectives; Schiemer, F., Simon, D., Amarasinghe, U.M.J., Eds.; Bakhuysen Publishers: Leiden, The Netherlands, 2008; pp. 135–152. [Google Scholar]
  57. Newrkla, P. Sediment characteristics and benthic community oxygen uptake rates of Parakrama Samudra, an ancient man-made lake in Sri Lanka. Limnol. Parakrama Samudra-Sri Lanka 1983, 127–133. [Google Scholar] [CrossRef]
  58. Richardson, D.; Melles, S.; Pilla, R.; Hetherington, A.; Knoll, L.; Williamson, C.; Kraemer, B.; Jackson, J.; Long, E.; Moore, K.; et al. Transparency, Geomorphology and Mixing Regime Explain Variability in Trends in Lake Temperature and Stratification across Northeastern North America (1975–2014). Water 2017, 9, 442. [Google Scholar] [CrossRef]
  59. Braga, F.; Scarpa, G.M.; Brando, V.E.; Manfè, G.; Zaggia, L. COVID-19 lockdown measures reveal human impact on water transparency in the Venice Lagoon. Sci. Total Environ. 2020, 736, 139612. [Google Scholar] [CrossRef] [PubMed]
  60. Lee, R.M.; Biggs, T.W. Impacts of land use, climate variability, and management on thermal structure, anoxia, and transparency in hypereutrophic urban water supply reservoirs. Hydrobiologia 2015, 745, 263–284. [Google Scholar] [CrossRef]
  61. Mukherjee, F.; Singh, D. Assessing Land Use–Land Cover Change and Its Impact on Land Surface Temperature Using LANDSAT Data: A Comparison of Two Urban Areas in India. Earth Syst. Environ. 2020, 4, 385–407. [Google Scholar] [CrossRef]
  62. Eriyagama, N.; Thilakarathne, M.; Tharuka, P.; Munaweera, T.; Muthuwatta, L.; Smakhtin, V.; Premachandra, W.W.; Pindeniya, D.; Wijayarathne, N.S.; Udamulla, L. Actual and perceived causes of flood risk: Climate versus anthropogenic effects in a wet zone catchment in Sri Lanka. Water Int. 2017, 42, 874–892. [Google Scholar] [CrossRef]
  63. Gunawardhana, W.D.T.M.; Jayawardhana, J.M.C.K.; Udayakumara, E.P.N. Impacts of Agricultural Practices on Water Quality in Uma Oya Catchment Area in Sri Lanka. Procedia Food Sci. 2016, 6, 339–343. [Google Scholar] [CrossRef] [Green Version]
  64. Jayawardana, J.M.C.K.; Gunawardana, W.D.T.; Udayakumara, E.P.N.; Westbrooke, M. Land use impacts on river health of Uma Oya, Sri Lanka: Implications of spatial scales. Environ. Monit. Assess. 2017, 189, 192. [Google Scholar] [CrossRef] [PubMed]
  65. APHA. Standard Methods for the Examination of Water and Wasterwater, 22th ed.; Rice, E.W., Baird, R.B., Eaton, A.D., Clesceri, L.S., Eds.; American Public Health Association (APHA): Washington, DC, USA, 2012. [Google Scholar]
  66. Wang, Y.; Shen, F.; Sokoletsky, L.; Sun, X. Validation and Calibration of QAA Algorithm for CDOM Absorption Retrieval in the Changjiang (Yangtze) Estuarine and Coastal Waters. Remote Sens. 2017, 9, 1192. [Google Scholar] [CrossRef] [Green Version]
  67. Watanabe, F.; Mishra, D.R.; Astuti, I.; Rodrigues, T.; Alcântara, E.; Imai, N.N.; Barbosa, C. Parametrization and calibration of a quasi-analytical algorithm for tropical eutrophic waters. ISPRS J. Photogramm. Remote Sens. 2016, 121, 28–47. [Google Scholar] [CrossRef] [Green Version]
  68. Jiang, D.; Matsushita, B.; Setiawan, F.; Vundo, A. An improved algorithm for estimating the Secchi disk depth from remote sensing data based on the new underwater visibility theory. ISPRS J. Photogramm. Remote Sens. 2019, 152, 13–23. [Google Scholar] [CrossRef]
  69. Wei, J.; Lee, Z.; Shang, S.; Yu, X. Semianalytical Derivation of Phytoplankton, CDOM, and Detritus Absorption Coefficients From the Landsat 8/OLI Reflectance in Coastal Waters. J. Geophys. Res. Ocean. 2019, 124, 3682–3699. [Google Scholar] [CrossRef] [Green Version]
  70. Imbulana, K.A.U.S.; Wijesekera, N.T.S.; Neupane, B.; Sri Lanka Ministry of Agriculture. Sri Lanka National Water Development Report: April 2006; Ministry of Agriculture, Irrigation, and Mahaweli Development: Colombo, Sri Lanka, 2006; ISBN 9558395013. [Google Scholar]
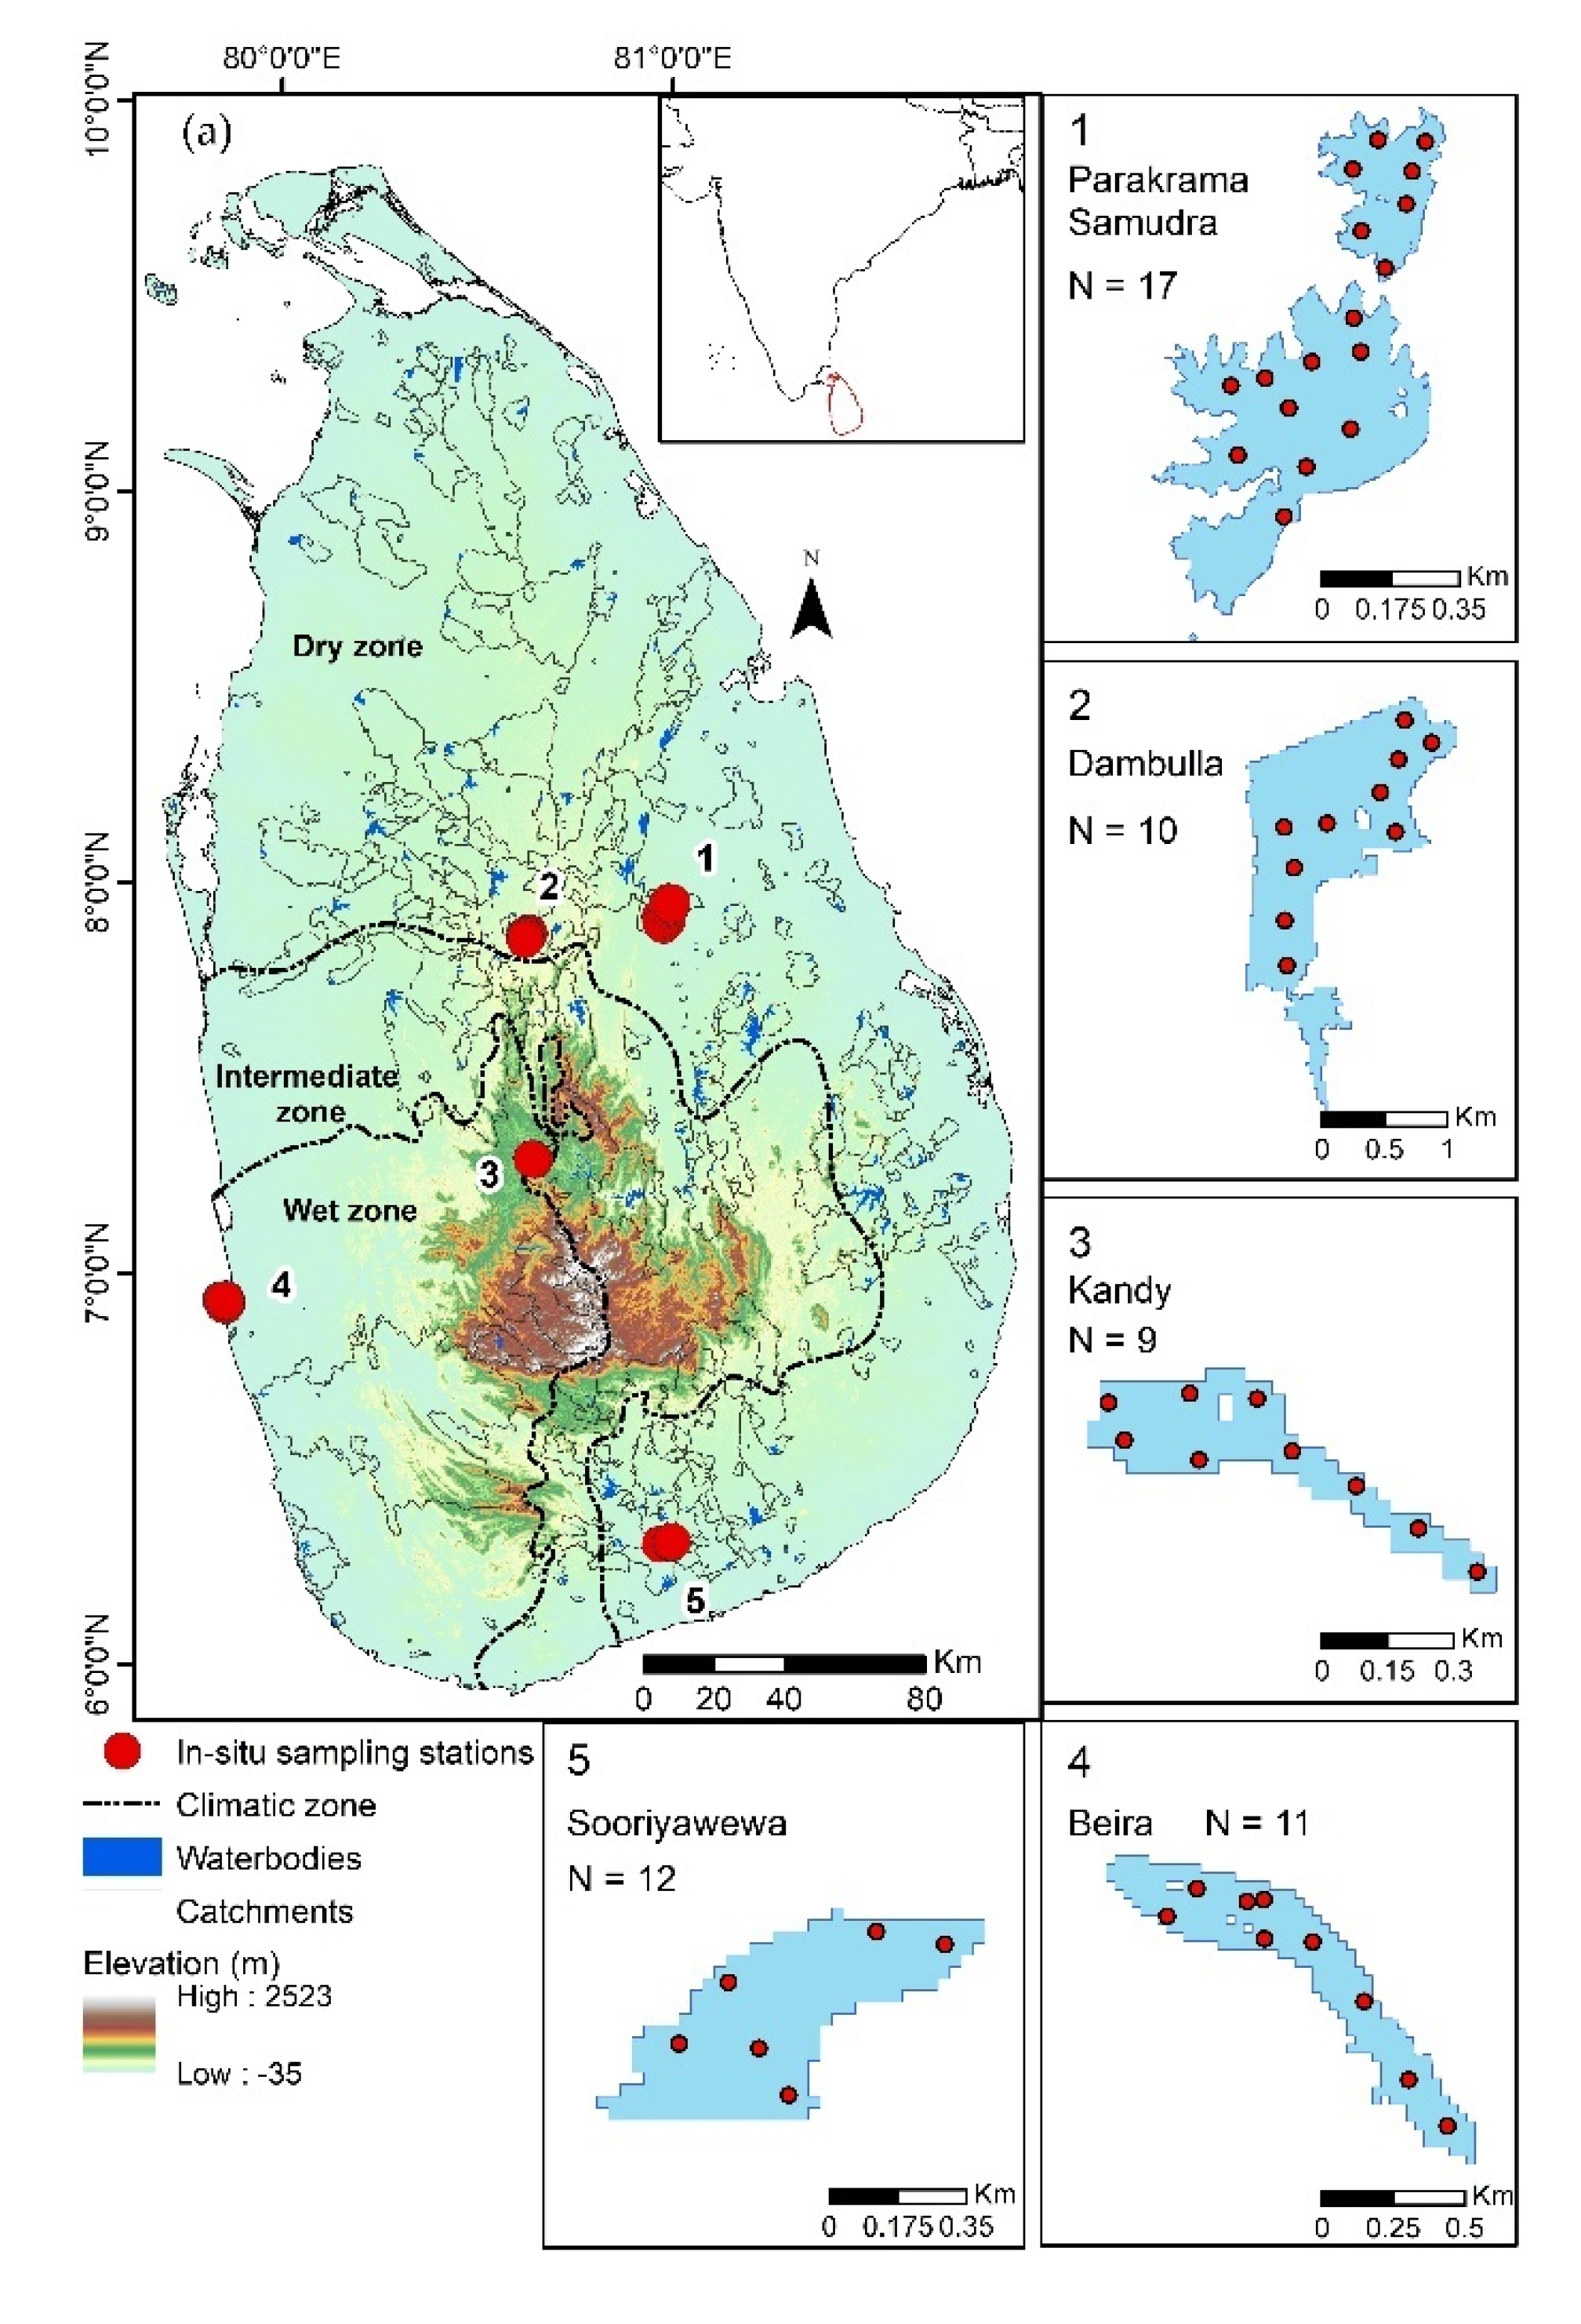
Figure 1. Spatial distribution of studied reservoirs in Sri Lanka; (a) reservoirs with a permanent water area larger than 1 ha (N = 550) with catchments and (1–5) sampling stations.
Remotesensing 13 02193 g001
Figure 2. Flowchart of the applied methodology in this study.
Remotesensing 13 02193 g002
Figure 3. The average number of annual observations of reservoirs studied (N = 550).
Remotesensing 13 02193 g003
Figure 4. (a) Frequency distribution of the annual average observations of the reservoirs; (b) Box plot of the monthly average observations of the reservoirs with the median at the central mark.
Remotesensing 13 02193 g004
Figure 5. Accuracy assessment of in-situ and Landsat 8 OLI derived ZSD.
Remotesensing 13 02193 g005
Figure 6. Spatial distribution of mean ZSD from 2013 to 2020 (a) Satellite–derived mean ZSD of reservoirs; (b) ZSD variability of all reservoirs, and (c) Distribution of reservoirs according to mean ZSD. Reservoirs are ordered by ascending ZSD values.
Remotesensing 13 02193 g006
Figure 7. (a) The rate of change of annual mean ZSD from 2013 to 2020; (b) The number of reservoirs with significant (p-value ≤ 0.05) and non-significant change; (c) Rate of changes of all reservoirs. Reservoirs are numbered according to longitudinal values.
Remotesensing 13 02193 g007
Figure 8. (a) Annual mean ZSD of reservoirs in different zones from 2013 to 2020; (b) Monthly mean ZSD. The dotted lines indicate four monsoon periods: the north-east monsoon (NEM), the first inter monsoon season (FIM), the south-west monsoon (SWM) and the second inter monsoon (SIM).
Remotesensing 13 02193 g008
Figure 9. Seven classes of reservoirs according to their monthly mean ZSD. The average of all reservoirs in that class indicates in red; (a) Percentages of reservoirs in each class.
Remotesensing 13 02193 g009
Figure 10. The effect of driving factors on the water transparency of Sri Lanka and its climatic zones from May 2013 to November 2020. Statistically significant (p-value < 0.05) effects are indicated in white.
Remotesensing 13 02193 g010
Figure 11. (a) The linear relationship between elevation of reservoirs and their ZSD; (b) The linear relationship between water depth and ZSD of reservoirs.
Remotesensing 13 02193 g011
Table 1. General characteristics and number of water bodies studied in three climatic zones during the study period (2013–2020). Mean values are given in brackets.
Parameter Zone
DryWetIntermediate
Elevation (m)−6.00–277.00 (53.50)−10.00–503.00 (342.68)−6–1885.00 (135.51)
Permanent water area (ha)1.08–2719.44 (81.37)1.08–696.69 (79.54)1.08–1489.86 (119.04)
Catchment area (ha)0.09–54,111.80 (2113.27)0.09–221,707.00 (7590.01)0.09–51,046.90 (3414.36)
Water depth (m)1.03–14.90 (3.06)0.98–13.40 (8.54)1.3–15.80 (6.75)
Number of water bodies4444066
Table 2. The number of Landsat 8 OLI images (2013–2020) used per path/row in this study.
Year20132014201520162017201820192020Total
Number of images1061801821951881861771551369
Table 3. Information on in-situ ZSD samples collected during the study period.
ReservoirNumber of Total SamplesNumber of Validation SamplesSampling DateIn-Situ ZSD (cm)Image Acquisition DateTime Window 2
MaxMinMeanStd. Dev.
Sooriyawewa 16620-10-2014705862.673.7320-10-20140
Sooriyawewa 16116-12-201414090110.0017.3007-12-20149
Sooriyawewa 16126-02-20151127998.0011.2525-02-20151
Kandy9204-11-2018170110142.7818.4316-11-201812
Parakrama Samudra171407-11-2018190120156.7627.6016-11-20189
Dambulla101005-11-2018807075.504.1516-11-201811
Beira11-03-12-2019211217.732.49--
1 In-situ ZSD data were acquired from [13]. 2 Time window between in-situ measurement and Landsat 8 OLI overpass.
Table 4. Google Earth Engine datasets used in this study.
Data/ProductVariableResolutionGEE Asset Address
SpatialTemporal
Landsat 8 OLISurface reflectance30 m16 daysLANDSAT/LC08/C01/T1_SR
SRTM DEM V3 Elevation (m)30 mstaticUSGS/SRTMGL1_003
TRMM 3B43 V7 Precipitation rate (mm/h)0.25°1 monthTRMM/3B43V7
ECMWF ERA5 U component of wind (ms−1)0.25°1 monthECMWF/ERA5/MONTHLY
ECMWF ERA5 V component of wind (ms−1)0.25°1 monthECMWF/ERA5/MONTHLY
ECMWF ERA5 2m Temperature (K)0.25°1 monthECMWF/ERA5/MONTHLY
NASA SEDAC GPWv411Population density30′5 yearsCIESIN/GPWv411/GPW_ Population_Density
Table 5. Main steps of the QAA_v6.
StepVariableQAA_v6Approach
1 r r s ( λ ) = R r s 0.52 + 1.7 R r s Semi-analytical
2 u   ( λ ) = b b ( λ ) a ( λ ) + b b ( λ ) = g 0 ± g 0 2 + 4 g 1 r r s ( λ ) 2 g 1 Semi-analytical
3 a ( λ 0 ) a ( λ 0 ) = a w ( λ 0 ) + Δ a ( λ 0 )
a ( 670 ) = a w ( 670 ) + 0.39 ( r r s ( 670 ) r r s ( 443 ) + r r s ( 490 ) ) 1.14 , λ 0 = 670
Empirical
4 b b p ( λ 0 ) b b p ( 670 ) = u ( λ 0 )   a ( λ 0 ) 1 u ( λ 0 ) b b w ( λ 0 ) Analytical
5 η = 2.0 ( 1.0 1.2   e x p ( 0.9   r r s ( 443 )   r r s ( 555 ) ) ) Empirical
6 b b p ( λ ) = b b p ( λ 0 )   ( λ 0 λ   ) η Semi-analytical
7 a ( λ ) = ( 1 u   ( λ ) )   ( b b w ( λ ) + b b p ( λ ) ) u   ( λ )   Analytical
Table 6. Results from multiple linear models with driving factors on the zonal water transparency from May 2013 to November 2020.
ZoneFactorEstimateStandard Errort-Valuep-Value
DryPrecipitation 0.004930.000825.978<0.001
DryWind −6.003390.31672−18.955<0.001
DryNDVI32.648172.5367312.87<0.001
DryTemperature4.006760.3380111.854<0.001
DryPopulation0.004930.000825.978<0.001
WetPrecipitation 0.002850.005470.5210.602
WetWind −20.960003.46900−6.043<0.001
WetNDVI96.5600021.350004.523<0.001
WetTemperature8.406001.292006.505<0.001
WetPopulation−0.0000000290.0000000128−2.2760.024
Intermediate Precipitation −0.001210.00326−0.370.711
Intermediate Wind −6.683421.52244−4.39<0.001
Intermediate NDVI27.9136810.364722.6930.007
Intermediate Temperature−4.222361.01604−4.156<0.001
Intermediate Population0.0000000630.000000023.2070.001
Publisher’s Note: MDPI stays neutral with regard to jurisdictional claims in published maps and institutional affiliations.