Quantitative Remote Sensing of Metallic Elements for the Qishitan Gold Polymetallic Mining Area, NW China
Abstract
:1. Introduction
2. Geological Background
3. Data Sources and Methodology
3.1. Data Acquisition and Processing
3.1.1. Acquisition and Processing of Geochemical Data
3.1.2. Satellite Remote Sensing Data
3.1.3. Remote Sensing Data Pre-Processing
3.2. Feature Band Selection
3.3. Remote Sensing Modeling and Inversion Methods
3.3.1. Multiple Linear Regression Modeling
3.3.2. Model Accuracy Test
3.3.3. Interpolation of Geochemical Anomalies
4. Results and Analysis
4.1. Remote Sensing Modeling and Inversion Methods
4.2. ASTER Data Modeling Accuracy Test
5. Discussion
5.1. Test Method Based on Geochemical Anomaly Contrast
5.2. The Modeling Precision Is Improved by Scaling Transformation
5.2.1. The Experimental Idea and Process of Scaling Transformation
5.2.2. Modeling Results of Scaling Transformation and Inversion
5.3. Research on Downscaling Transformation
5.3.1. Downscaling Study Based on Worldview-2 Data
5.3.2. Inverse Modeling Results
5.3.3. ASTER and WorldView-2 Data Modeling Accuracy Comparison Results
5.4. The Inversion Experiment Is Supplemented by Adding New Modeling Methods
6. Conclusions
Author Contributions
Funding
Institutional Review Board Statement
Informed Consent Statement
Data Availability Statement
Acknowledgments
Conflicts of Interest
References
- Wambo, J.D.T.; Ganno, S.; Lahe, Y.S.D.; Nono, G.D.K.; Fossi, D.H.; Tchouatcha, M.S.; Nzenti, J.P. Geostatistical and GIS analysis of the spatial variability of alluvial gold content in Ngoura-Colomines area, Eastern Cameroon: Implications for the exploration of primary gold deposit. J. Afr. Earth Sci. 2018, 142, 138–157. [Google Scholar] [CrossRef]
- Caruso, A.S.; Clarke, K.D.; Tiddy, C.J.; Lewis, M.M. Integrating hyperspectral and radiometric remote sensing, spatial topographic analysis and surface geochemistry to assist mineral exploration. ASEG Ext. Abstr. 2019, 2019, 1–3. [Google Scholar]
- Kazimoto, E.O.; Mshiu, E.E. Reconnaissance assessment of the Stenian-Tonian granitoids of southern Tanzania for metal resources by using geological remote sensing and geochemical techniques. Geochemistry 2020, 80, 125533. [Google Scholar] [CrossRef]
- Wu, Y.Z.; Tian, J.Q.; Chen, J.; Ji, J.F.; Chen, J. Study on the remote-sensing geochemistry (in Chinese with English abstract). Adv. Earth Sci. 2003, 18, 228–235. [Google Scholar]
- Gabr, S.S.; Hassan, S.M.; Sadek, M.F. Prospecting for new gold-bearing alteration zones at El-Hoteib area, South Eastern Desert, Egypt, using remote sensing data analysis. Ore Geol. Rev. 2015, 71, 1–13. [Google Scholar] [CrossRef]
- Pour, A.B.; Hashim, M.; Hong, J.K.; Park, Y. Lithological and alteration mineral mapping in poorly exposed lithologies using Landsat-8 and ASTER satellite data: North-eastern Graham Land, Antarctic Peninsula. Ore Geol. Rev. 2019. [Google Scholar] [CrossRef]
- Pirouei, M.; Kolo, K.; Kalaitzidis, S.P. Hydrothermal listvenitization and associated mineralizations in Zagros Ophiolites: Implications for mineral exploration in Iraqi Kurdistan. J. Geochem. Explor. 2020, 208, 106404. [Google Scholar] [CrossRef]
- Wambo, J.D.T.; Pour, A.B.; Ganno, S.; Asimow, P.D.; Zoheir, B.; dos Reis Salles, R.; Nzenti, J.P.; Pradhan, B.; Muslim, A.M. Identifying high potential zones of gold mineralization in a sub-tropical region using Landsat-8 and ASTER remote sensing data: A case study of the Ngoura-Colomines goldfield, eastern Cameroon. Ore Geol. Rev. 2020, 122, 103530. [Google Scholar] [CrossRef]
- Chen, Y.G.; Liu, G.G.; Lu, Y.M.; Wang, M.J.; Hang, X.J.; Zhang, H.Y.; Chang, C.J. Remote sensing geochemical anomaly information extraction research. Procedia Earth Planet. Sci. 2010, 3, 103–112. [Google Scholar]
- Paarma, H.; Vartiainen, H. Utilization of remote snsing methods in prospecting of alkaline rocks in Finland. Bull. Soc. Finl. 1996, 68, 25–33. [Google Scholar] [CrossRef]
- Yao, F.J.; Fu, B.H. Application of remote sensing information related to mineralization alteration and new discovery in geological prospecting work. In IOP Conference Series: Earth and Environmental Science; IOP Publishing: Bristol, UK, 2017; Volume 74, p. 12014. [Google Scholar]
- Feizi, F.; Mansouri, E.; Ramezanali, A.K. Prospecting of Au by remote sensing and geochemical data processing using fractal modelling in Shishe-Botagh, Area (NW Iran). J. Indian Soc. Remote Sens. 2016, 44, 539–552. [Google Scholar] [CrossRef]
- Ren, Y.; Deng, L.Y.; Zuo, S.D.; Song, X.D.; Liao, Y.L.; Xu, C.D.; Chen, Q.; Hua, L.Z.; Li, Z.W. Quantifying the influences of various ecological factors on land surface temperature of urban forests. Environ. Pollut. 2016. [Google Scholar] [CrossRef] [Green Version]
- Zhang, S.; Wang, H.; Fan, Y.; Hu, N.; Liu, H.; Yang, C.; Liao, Y. Application of high resolution remote sensing image in the exploration of skarn-type iron deposit in Hutouya area of East Kunlun. In IOP Conference Series: Earth and Environmental Science; IOP Publishing: Bristol, UK, 2018; Volume 170, p. 22094. [Google Scholar]
- Wu, X.; Xiao, Q.; Wen, J.; You, D.; Hueni, A. Advances in quantitative remote sensing product validation: Overview and current status. Earth Sci. Rev. 2019, 196, 102875. [Google Scholar] [CrossRef]
- Zhang, Z.; Zhang, J.; Wang, G.; Carranza, E.J.M.; Pang, Z.; Wang, H. From 2D to 3D modeling of mineral prospectivity using multi-source geoscience datasets, Wulong Gold District, China. Nat. Resour. Res. 2020, 29, 345–364. [Google Scholar] [CrossRef]
- Wang, G.H.; Zhang, H.; Wei, Y.S. Implementation of Partial Least Squares Regression in SPSS Soft-ware (in Chinese with English abstract). Stat. Decis. 2017, 7, 67–71. [Google Scholar] [CrossRef]
- Xu, H.; Chen, C.; Zheng, H.; Luo, G.; Yang, L.; Wang, W.; Wu, S.; Ding, J. AGA-SVR-based selection of feature subsets and optimization of parameter in regional soil salinization monitoring. Int. J. Remote Sens. 2020, 41, 4470–4495. [Google Scholar] [CrossRef]
- Wan, C.J.; Wu, X.D.; Lin, X.W. The influence of remote sensing data space-time scale on the analysis of space-time changes in geographical features. Int. J. Geo-Inform. 2019, 8, 72. [Google Scholar] [CrossRef] [Green Version]
- Jong, R.D.; Verbesselt, J.; Schaepman, M.; Bruin, S.D. Trend changes in global greening and browning: Contribution of short-term trends to longer-term change. Environ. Sci. Glob. Chang. Biol. 2012, 18, 642–655. [Google Scholar] [CrossRef]
- Coppin, P.R.; Bauer, M.E. Digital change detection in forest ecosystems with remote sensing imagery. Remote Sens. Rev. 1996, 13, 207–234. [Google Scholar] [CrossRef]
- Pan, Y.Q. Analysis of the geological characteristics and mineralization conditions of Qishitan gold deposit in Yanshan County, Xinjiang. Minerals 2009, 28, 100–104. [Google Scholar]
- Wen, C.G.; Qiao, H.; Xue, W.L. The geological features and prospecting direction of jin polymetallic deposits in Qishitan, Xinjiang. Minerals 2015, 9, 249. [Google Scholar]
- Sun, Z.; Jingbin, W.; Wang, Y.; Long, L.; Luo, Z.; Deng, X.; Hu, Q.; Wang, M. Sodium-rich volcanic rocks and their relationships with iron deposits in the Aqishan-Yamansu belt of Eastern Tianshan, NW China. Geosci. Front. 2020, 11, 697–713. [Google Scholar] [CrossRef]
- Zhao, L.; Chen, H.; Hollings, P.; Han, J. Late Paleozoic magmatism and metallogenesis in the Aqishan-Yamansu belt, Eastern Tianshan: Constraints from the Bailingshan intrusive complex. Gondwana Res. 2018, 65, 68–85. [Google Scholar] [CrossRef]
- Han, J.; Chen, H.; Jiang, H.; Zhao, L.; Zhang, W.; Lai, C. Genesis of the Paleozoic Aqishan-Yamansu Arc-Basin System and Fe (-Cu) Mineralization in the Eastern Tianshan, NW China. Ore Geol. Rev. 2019, 105, 55–70. [Google Scholar] [CrossRef]
- Du, L.; Zhang, Y.; Huang, Z.; Li, X.; Yuan, C.; Wu, B.; Long, X. Devonian to Carboniferous Tectonic Evolution of the Kangguer Ocean in the Eastern Tianshan, NW China: Insights from Three Episodes of Granitoids. Lithos 2019, 350, 105243. [Google Scholar] [CrossRef]
- Jahn, B.; Wu, F.; Chen, B. Granitoids of the Central Asian Orogenic Belt and continental growth in the Phanerozoic. Earth Environ. Sci. Trans. R. Soc. Edinb. 2000, 91, 181–193. [Google Scholar]
- Liu, B.; Wu, J.-H.; Li, H.; Mathur, R.; Wu, Q.-H.; Han, Z.; Jiang, J.-B. Late Paleozoic Tectonic Evolution of the Kangguer Shear Zone and Yamansu Arc Belt. Lithos 2021, 380, 105821. [Google Scholar] [CrossRef]
- Morris, R.V.; Lauer, H.V., Jr.; Lawson, C.A.; Gibson, E.K., Jr.; Nace, G.A.; Stewart, C. Spectral and other physicochemical properties of submicron powders of hematite (α-Fe2O3), maghemite (γ-Fe2O3), magnetite (Fe3O4), goethite (α-FeOOH), and lepidocrocite (γ-FeOOH). J. Geophys. Res. Solid Earth 1985, 90, 3126–3144. [Google Scholar] [CrossRef]
- Sherman, D.M.; Waite, T.D. Electronic spectra of Fe3+ oxides and oxide hydroxides in the near IR to near UV. Am. Miner. 1985, 70, 1262–1269. [Google Scholar]
- Drusch, M.; Del Bello, U.; Carlier, S.; Colin, O.; Fernandez, V.; Gascon, F.; Hoersch, B.; Isola, C.; Laberinti, P.; Martimort, P.; et al. Sentinel-2: ESA’s Optical High-Resolution Mission for GMES Operational Services. Remote Sens. Environ. 2012. [Google Scholar] [CrossRef]
- Abrams, M.; Tsu, H.; Hulley, G.; Iwao, K.; Pieri, D.; Cudahy, T.; Kargel, J. The Advanced Spaceborne Thermal Emission and Reflection Radiometer (ASTER) after fifteen years: Review of global products. Int. J. Appl. Earth Obs. Geoinform. 2015. [Google Scholar] [CrossRef]
- Segal-Rozenhaimer, M.; Li, A.; Das, K.; Chirayath, V. Cloud detection algorithm for multi-modal satellite imagery using convolutional neural-networks (CNN). Remote Sens. Environ. 2020, 237, 111446. [Google Scholar] [CrossRef]
- van der Meer, F.D.; van der Werff, H.M.A.; van Ruitenbeek, F.J.A.; Hecker, C.A.; Bakker, W.H.; Noomen, M.F.; van der Meijde, M.; Carranza, E.J.M.; de Smeth, J.B.; Woldai, T. Multi- and hyperspectral geologic remote sensing: A review. Int. J. Appl. Earth Obs. Geoinform. 2012, 14, 112–128. [Google Scholar] [CrossRef]
- Roy, D.P.; Wulder, M.A.; Loveland, T.R.; Woodcock, C.E.; Allen, R.G.; Anderson, M.C.; Helder, D.; Irons, J.R.; Johnson, D.M.; Kennedy, R.; et al. Landsat-8: Science and product vision for terrestrial global change research. Remote Sens. Environ. 2014. [Google Scholar] [CrossRef] [Green Version]
- Cooley, T.; Anderson, G.P.; Felde, G.W.; Hoke, M.L.; Ratkowski, A.J.; Chetwynd, J.H.; Gardner, J.A.; Adler-Golden, S.M.; Matthew, M.W.; Berk, A. FLAASH, a MODTRAN4-based atmospheric correction algorithm, its application and validation. In Proceedings of the IEEE International Geoscience and Remote Sensing Symposium, Toronto, ON, Canada, 24–28 June 2002; Volume 3, pp. 1414–1418. [Google Scholar]
- Yuan, Z.H. MODIS Image Based Estimation of Zhejiang Provincial Forest Carbon Storage (in Chinese with English Abstract). Master’s Thesis, Zhejiang Agriculture & Forestry University, Lin’an, China, 2016; pp. 1–74. [Google Scholar]
- Charlie, K.; Mark, C.; David, B.; Stephen, G.; Antonio, F.A. Machine learning approach to geochemical mapping. J. Geochem. Explor. 2016, 167, 49–61. [Google Scholar]
- Hao, D.L.; Xiao, Q.; Wen, J.G.; You, D.Q.; Wu, X.D.; Lin, X.W.; Wu, S.B. Advances in upscaling methods of quantitative remote sensing. Phys. Rev. 2018, 54, 5. [Google Scholar]
- Yao, Y.; Chen, X.; Qian, J. A review on the methodology of scale issues in quantitative remote sensing. Renew. Sustain. Energy Rev. 2019, 103, 140–150. [Google Scholar]




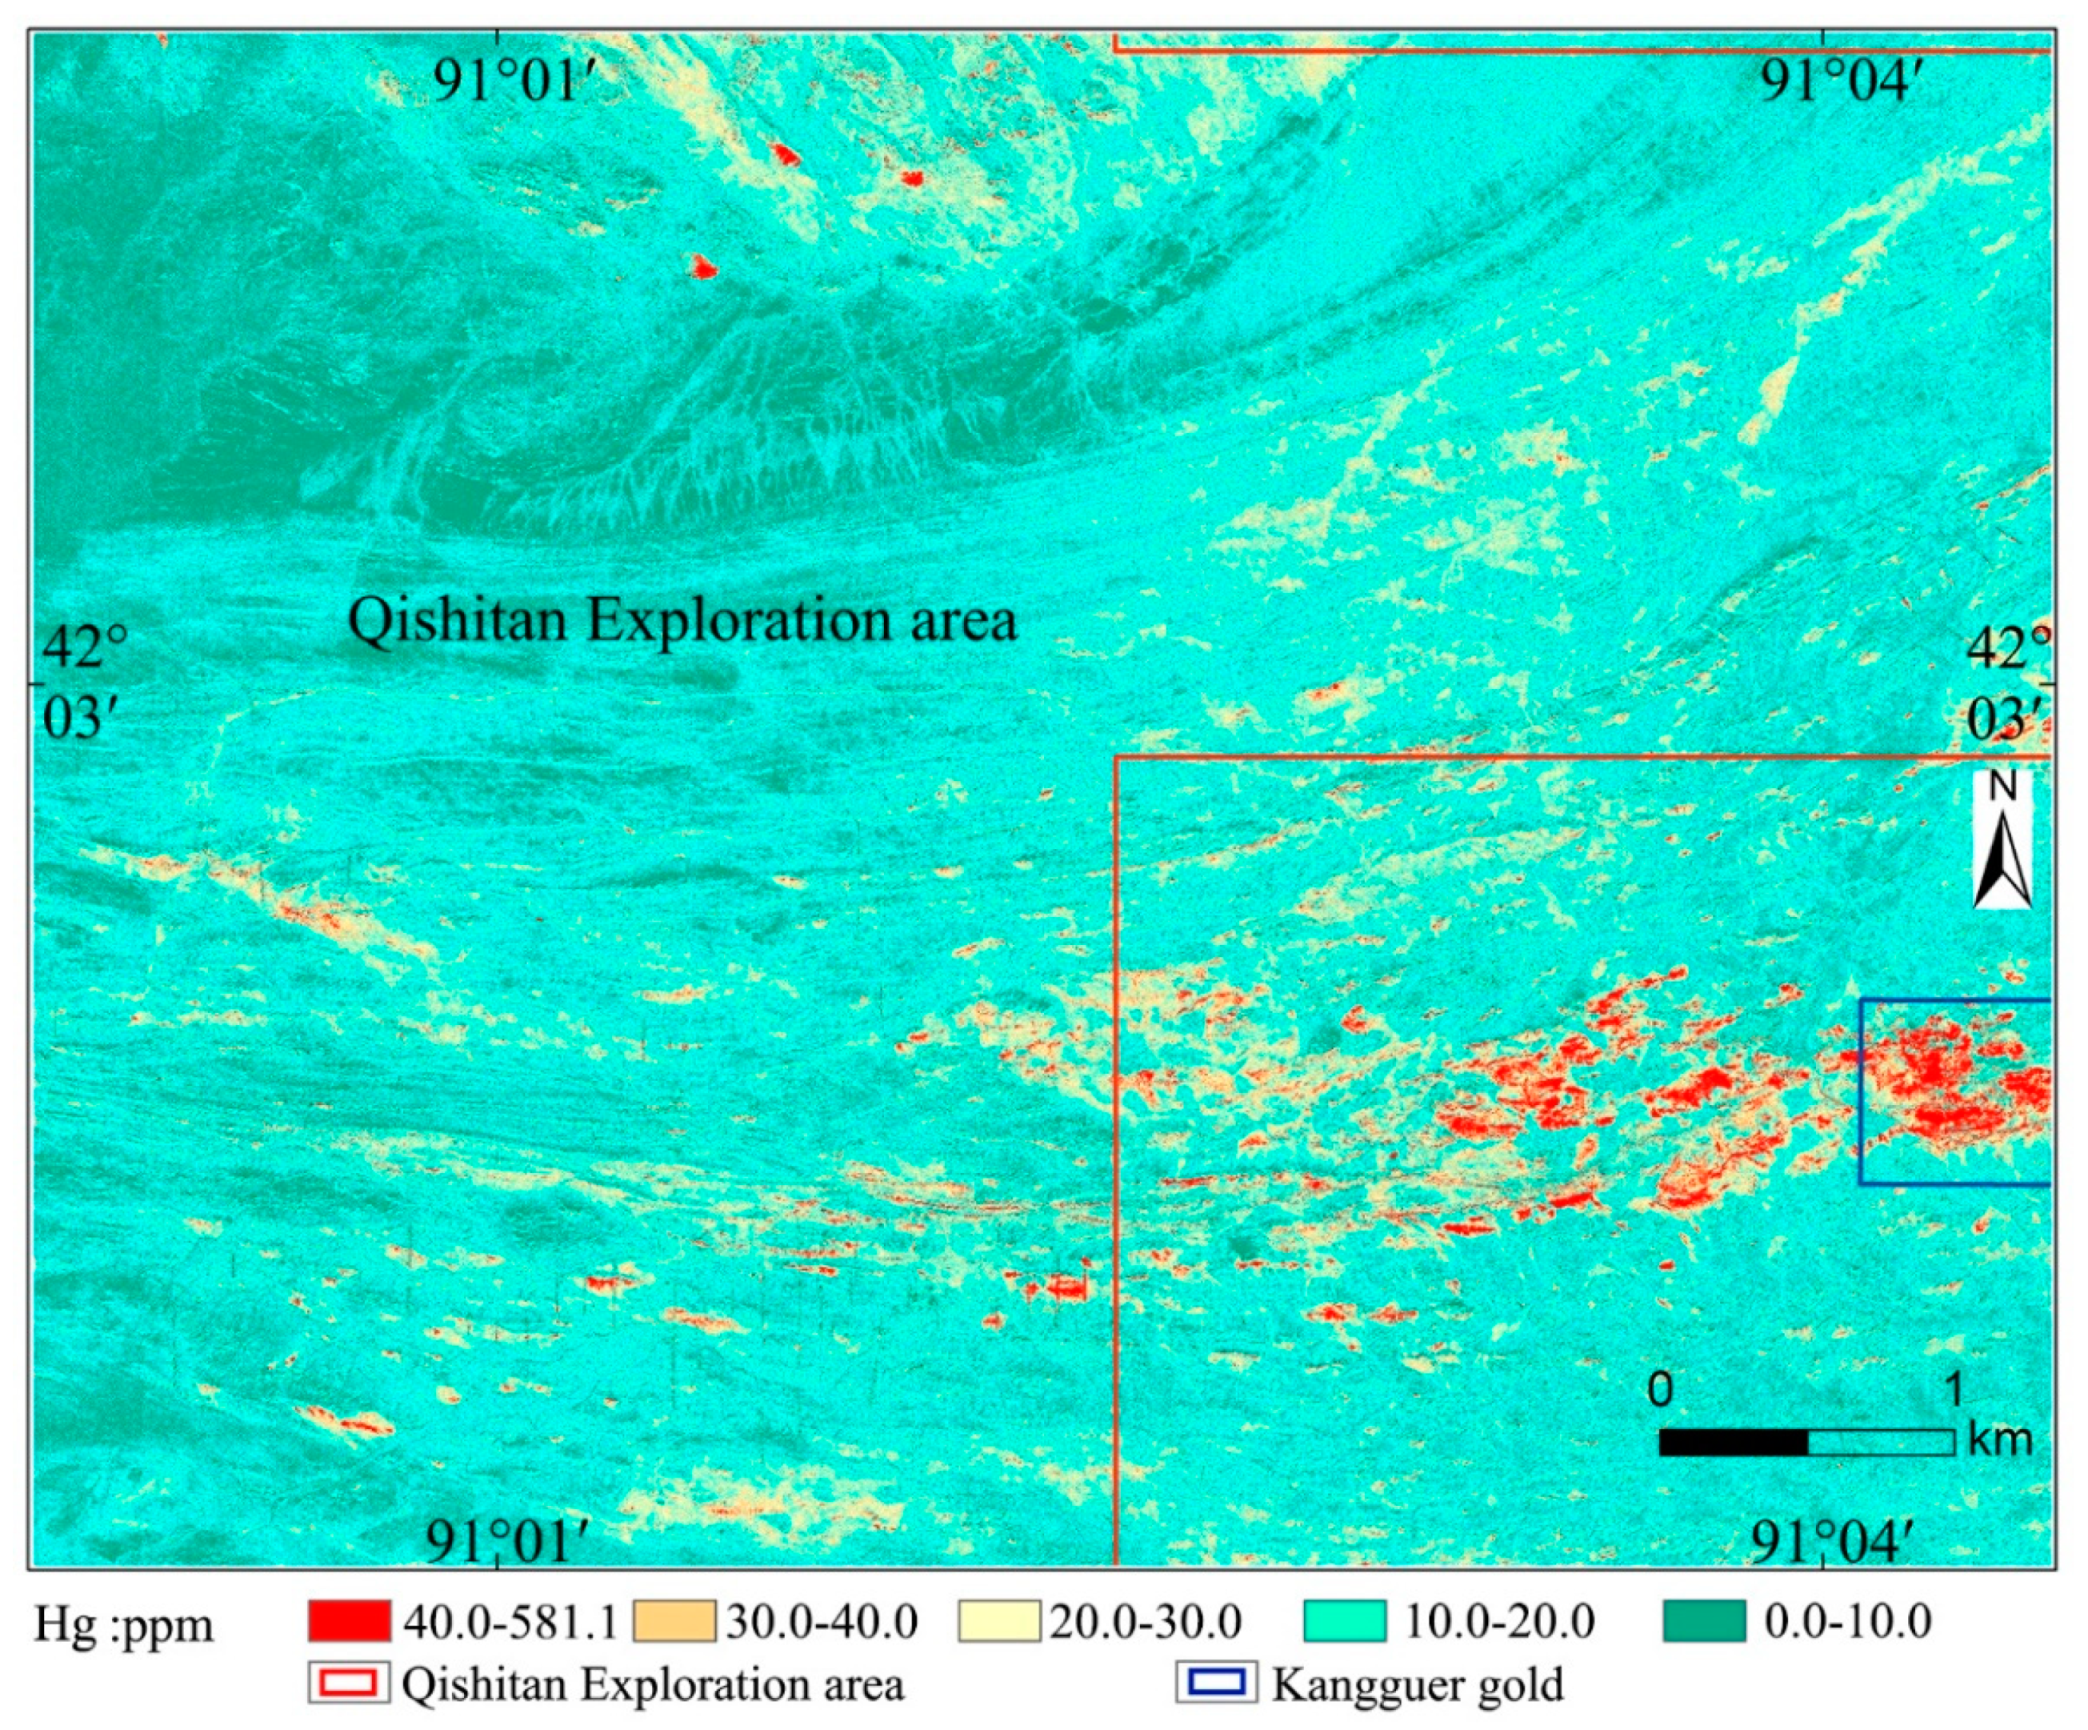
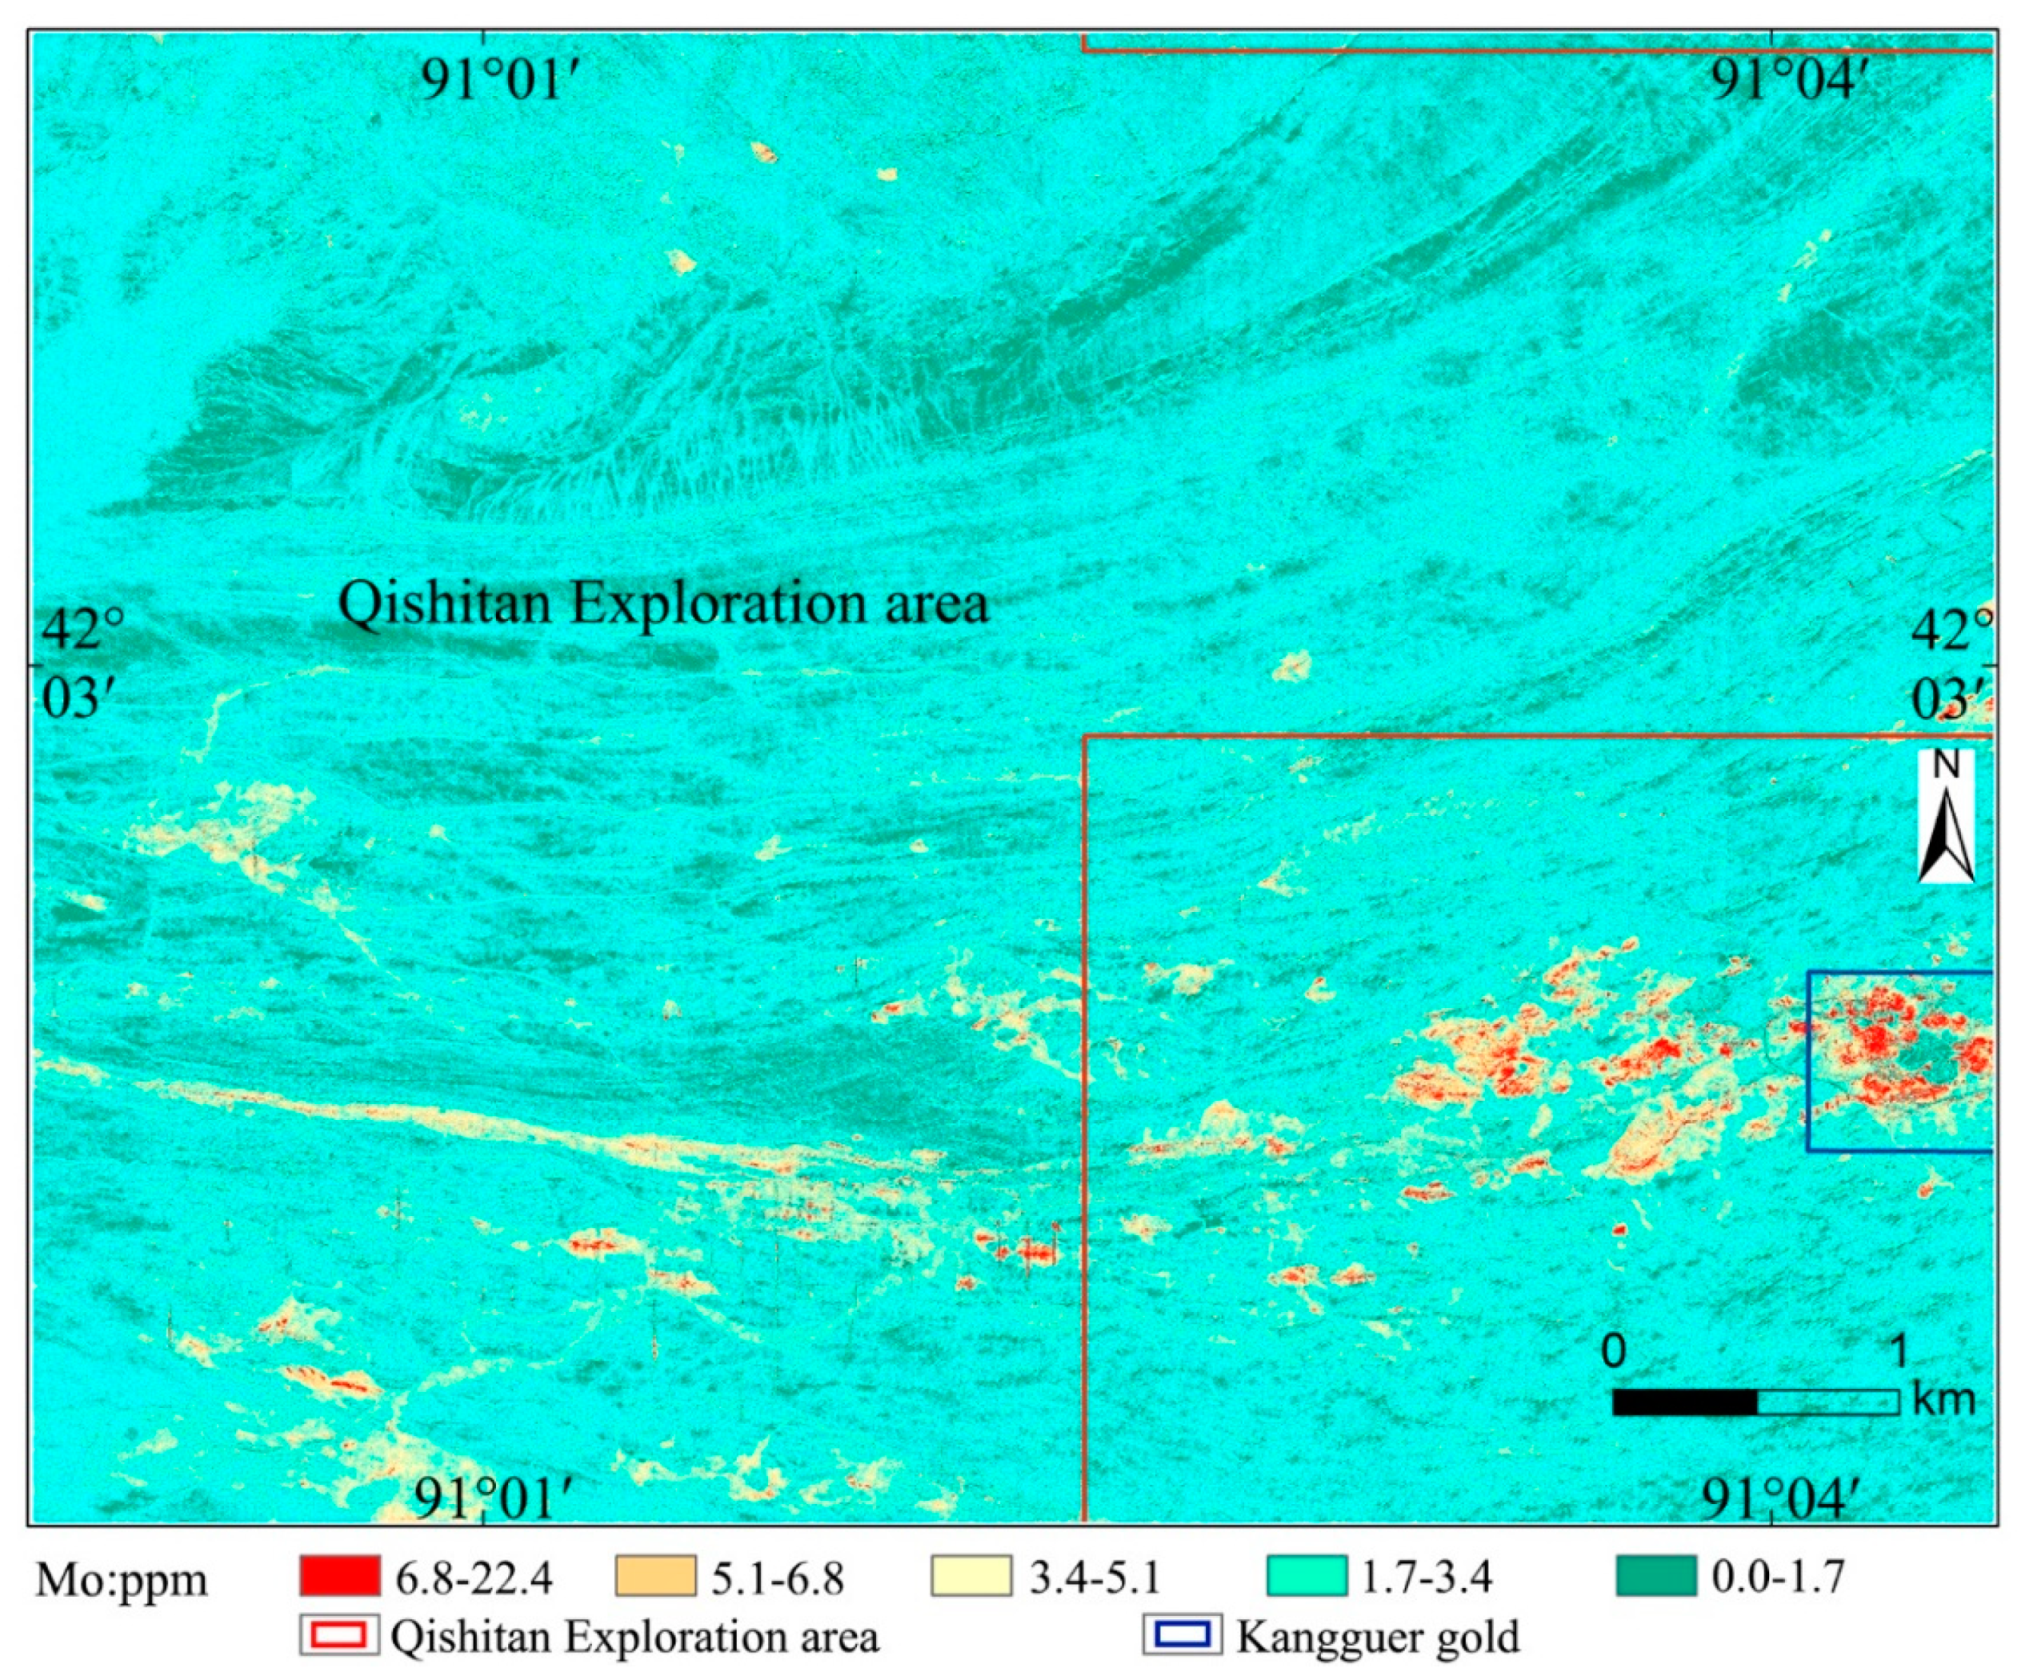
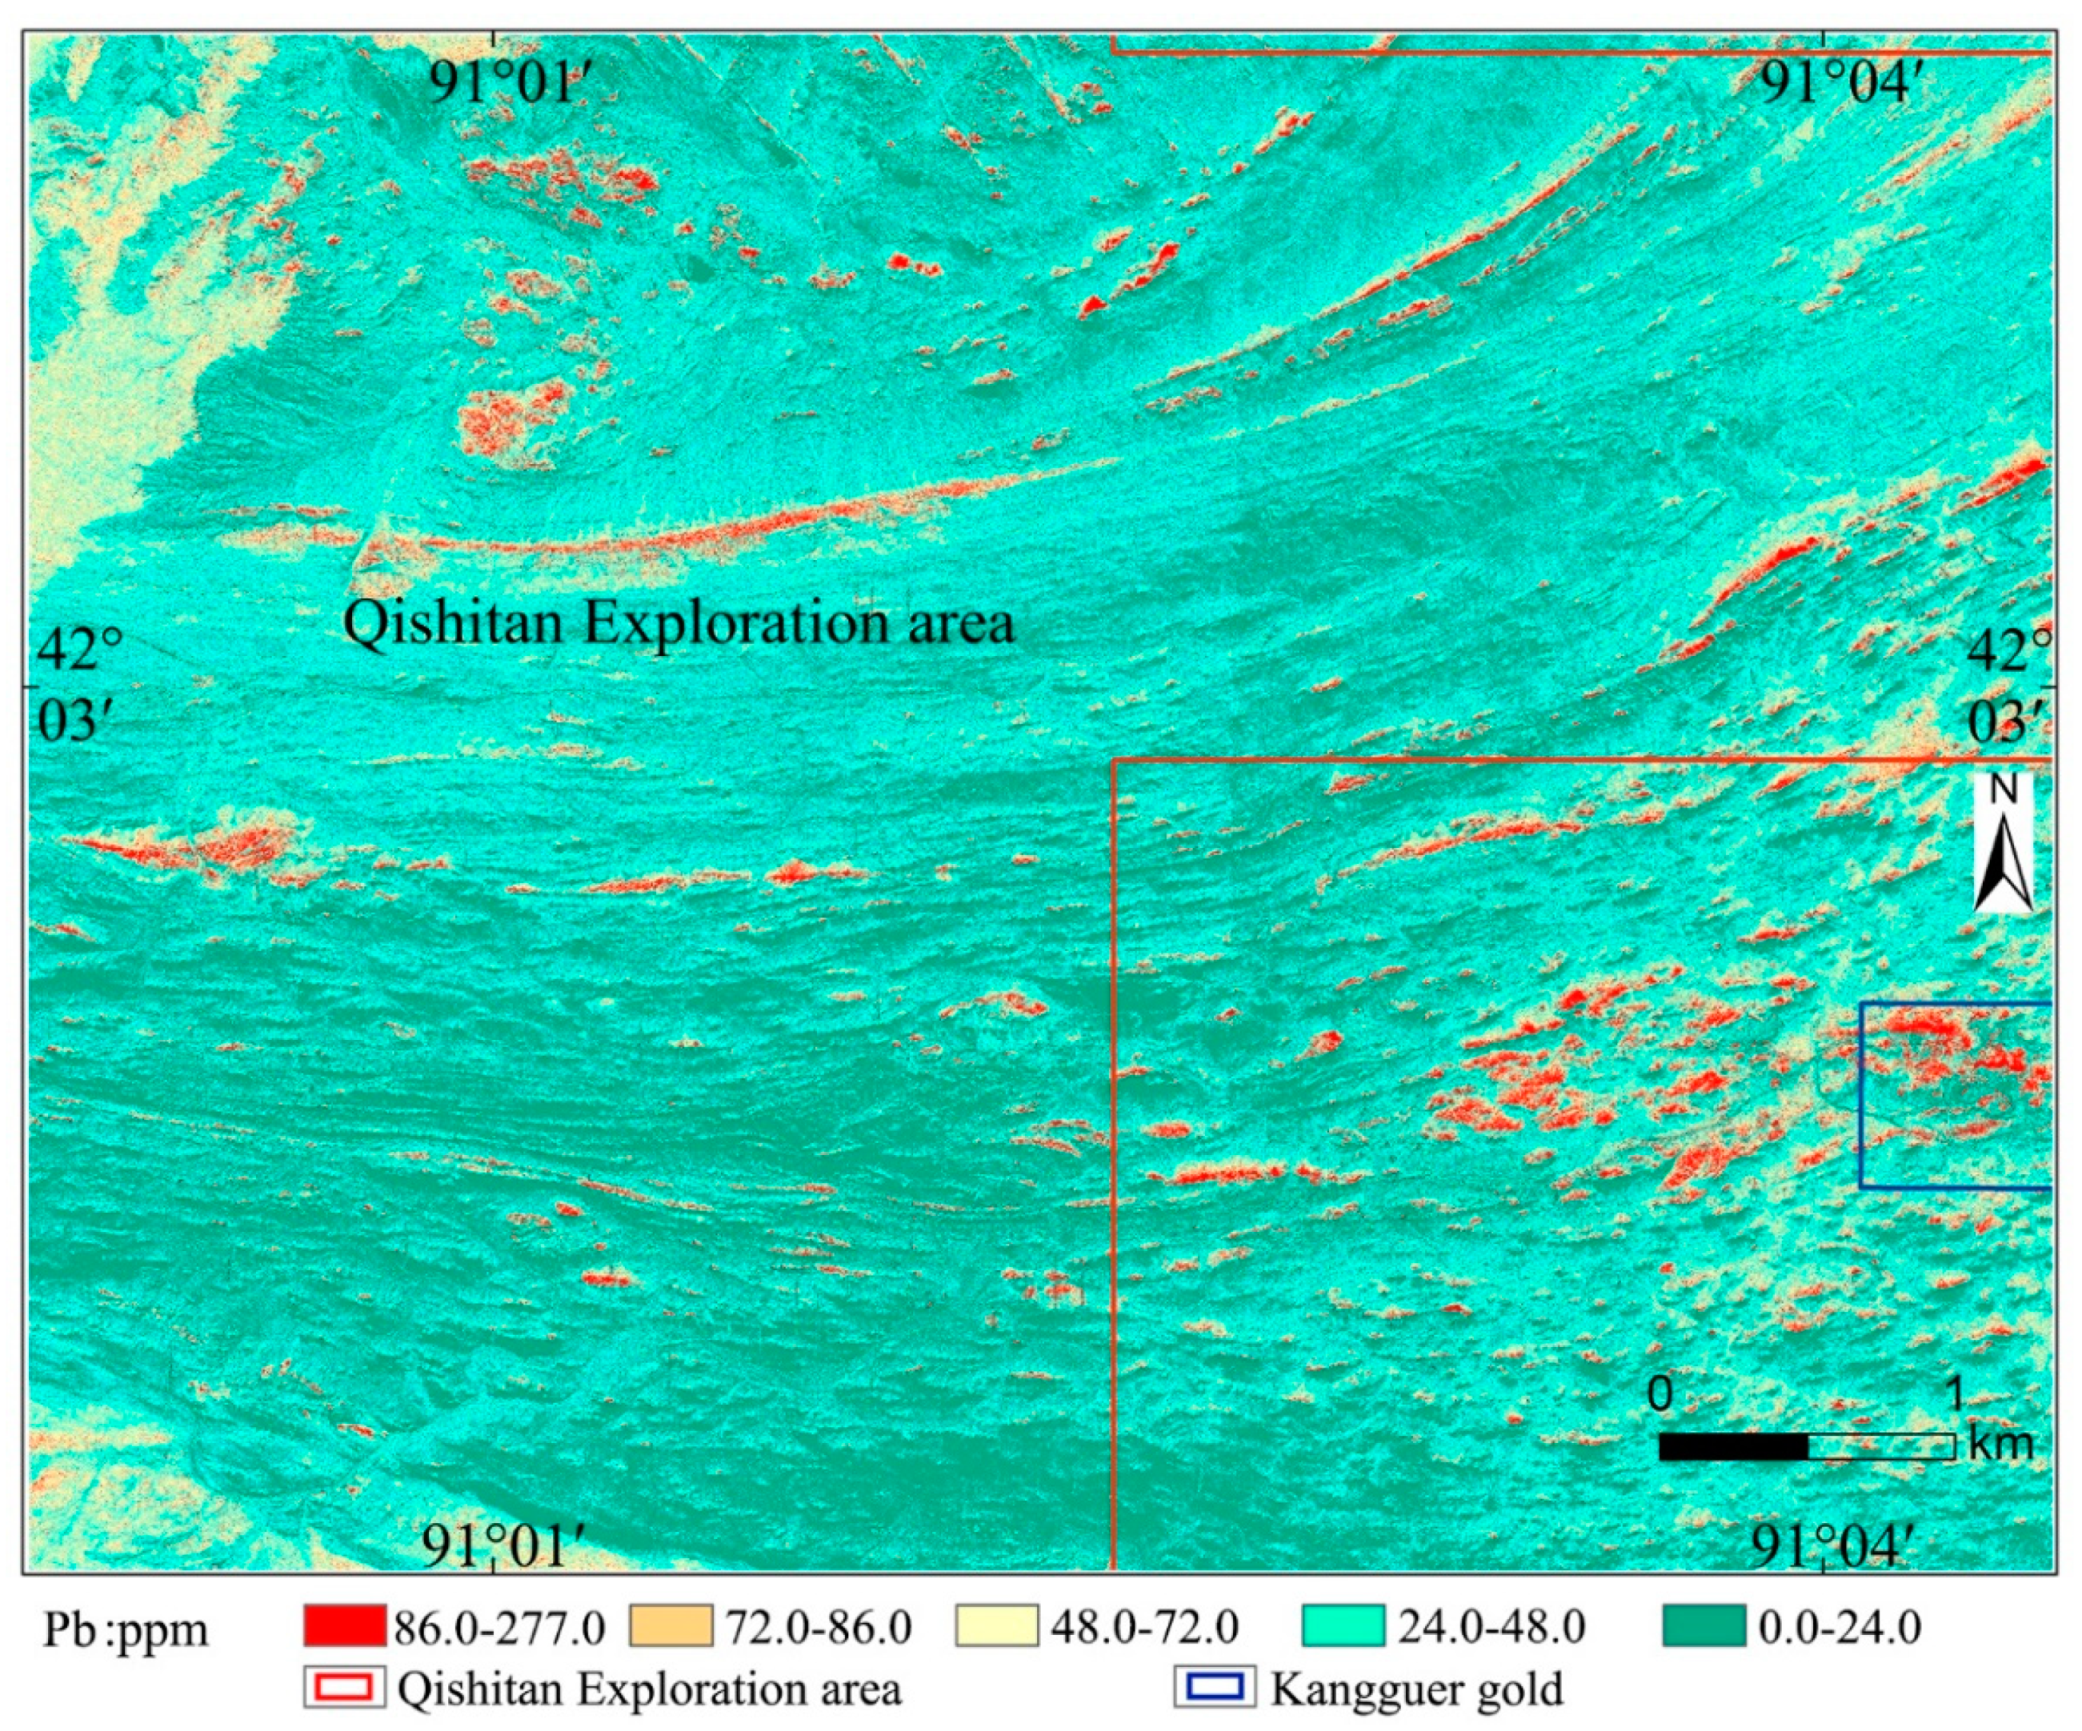

| Elements | Au | Cu | Pb | Zn | Mo | As | Hg |
|---|---|---|---|---|---|---|---|
| Number of samples | 200 | 200 | 200 | 200 | 200 | 200 | 200 |
| Mean value | 3.495 | 14.858 | 25.922 | 31.044 | 2.705 | 12.574 | 15.620 |
| Standard error of the mean | 0.284 | 1.374 | 7.563 | 9.694 | 0.306 | 0.821 | 1.260 |
| Mid-value | 1.700 | 8.850 | 6.600 | 15.050 | 1.495 | 8.800 | 10.000 |
| Mode | 1.000 | 5.000 | 5.000 | 5.000 | 1.160 | 4.200 * | 10.000 |
| Standard deviation | 4.018 | 19.430 | 106.952 | 137.097 | 4.332 | 11.612 | 17.825 |
| Variance | 16.148 | 377.529 | 11,438.798 | 18,795.615 | 18.766 | 134.829 | 317.724 |
| Overall spread | 23.00 | 207.00 | 1361.50 | 1813.50 | 44.99 | 75.60 | 169.00 |
| ASTER | WorldView-2 | ||||
|---|---|---|---|---|---|
| No. of Bands | Wavelength (μm) | Resolution (m) | No. of Bands | Wavelength (μm) | Resolution (m) |
| B1 | 0.52–0.60 | 15 | Pan | 0.450–1.040 | 0.5 |
| B2 | 0.63–0.69 | 15 | B1 | 0.450–0.510 | 1.8 |
| B3 | 0.76–0.86 | 15 | B2 | 0.510–0.580 | 1.8 |
| B4 | 1.600–1.700 | 30 | B3 | 0.630–0.690 | 1.8 |
| B5 | 2.145–2.185 | 30 | B4 | 0.770–0.895 | 1.8 |
| B6 | 2.185–2.225 | 30 | B5 | 0.585–0.625 | 1.8 |
| B7 | 2.235–2.285 | 30 | B6 | 0.400–0.450 | 1.8 |
| B8 | 2.295–2.365 | 30 | B7 | 0.705–0.745 | 1.8 |
| B9 | 2.360–2.430 | 30 | B8 | 0.860–1.040 | 1.8 |
| B10 | 8.125–8.475 | 90 | |||
| B11 | 8.475–8.825 | 90 | |||
| B12 | 8.925–9.275 | 90 | |||
| B13 | 10.25–10.95 | 90 | |||
| B14 | 10.95–11.65 | 90 | |||
| Predicted Elements | Models | Annotation |
|---|---|---|
| Au | YAu = 2.454 − 0.004 * b1 − 0.001 * b3 + 0.004 * b4 − 0.009 * b5 + 0.012 * b6 − 0.006 * b7 + 0.1 * b8 − 0.006 * b9 | Among them, b1, b2, b3, b4, b5, b6, b7, b8, and b9 correspond to the reflectivity of the first, second, third, fourth, fifth, sixth, seventh, eighth, and ninth bands of the ASTER image. |
| Cu | YCu = 23.404 + 0.036 * b1 − 0.118 * b2 + 0.096 * b3 − 0.008 * b4 − 0.011 * b5 + 0.113 * b6 − 0.045 * b7 | |
| Pb | YPb = 87.989 + 0.271 * b2 − 0.02 * b3 + 0.08 * b4 − 0.069 * b5 + 0.087 * b6 − 0.134 * b7 + 0.115 * b8 − 0.102 * b9 | |
| Zn | YZn = −6.27 − 0.133 * b1 − 0.112 * b3 − 0.012 * b4 + 0.087 * b5 − 0.013 * b6 − 0.162 * b7 + 0.141 * b8 − 0.008 * b9 | |
| Mo | YMo = 21.286 − 0.011 * b1 + 0.024 * b2 − 0.015 * b3 + 0.003 * b4 − 0.009 * b5 + 0.013 * b6 − 0.007 * b7 − 0.018 * b9 | |
| As | YAs = 53.34 − 0.029 * b1 + 0.05 * b3 + 0.035 * b4 − 0.066 * b5 + 0.023 * b6 − 0.014 * b7 + 0.007 * b8 − 0.003 * b9 | |
| Hg | YHg = 34.608 + 0.016 * b1 − 0.072 * b2 + 0.047 * b3 + 0.04 * b4 − 0.082 * b6 + 0.025 * b7 + 0.127 * b8 − 0.118 * b9. |
| Metallic Element | Remote Sensing Data | Correlation Coefficient (R) | Root Mean Square Error (RMSE) |
|---|---|---|---|
| As | ASTER | 0.4970 | 9.7049 |
| WorldView-2 | 0.3178 | 11.7641 | |
| Au | ASTER | 0.3688 | 3.7060 |
| WorldView-2 | 0.2898 | 4.1520 | |
| Cu | ASTER | 0.4359 | 15.3130 |
| WorldView-2 | 0.4290 | 15.0366 | |
| Hg | ASTER | 0.4472 | 19.2390 |
| WorldView-2 | 0.3000 | 32.7280 | |
| Mo | ASTER | 0.2881 | 4.2876 |
| WorldView-2 | 0.3332 | 3.3931 | |
| Pb | ASTER | 0.4450 | 65.9341 |
| WorldView-2 | 0.4848 | 18.8064 | |
| Zn | ASTER | 0.5477 | 7.4552 |
| WorldView-2 | 0.3178 | 23.7206 |
| Modeling Type | R | R2 | Adjustment of R2 | Standard Estimate Error | RMSE (Modeling Samples) | RMSE (Test Samples) |
|---|---|---|---|---|---|---|
| Original | 0.2427 | 0.0593 | 0.0007 | 13.8601 | 17.4291 | 11.1798 |
| 15 m Modeling | 0.4853 | 0.2423 | 0.1373 | 11.5146 | 10.7196 | 12.2857 |
| 30 m Modeling | 0.4303 | 0.1877 | 0.0750 | 12.8802 | 11.9906 | 12.0169 |
| 45 m Modeling | 0.4673 | 0.2200 | 0.1120 | 10.7719 | 10.0278 | 11.6456 |
| 60 m Modeling | 0.4397 | 0.2060 | 0.0960 | 11.4800 | 10.6875 | 10.0813 |
| 75 m Modeling | 0.3627 | 0.1317 | 0.0117 | 13.1094 | 12.2041 | 10.6881 |
| 90 m Modeling | 0.4683 | 0.2267 | 0.1197 | 12.6265 | 11.7546 | 14.0108 |
| Predicted Elements | Models | Annotation |
|---|---|---|
| Au | YAu = −0.49582 + 0.00396 * b1 + 0.00253 * b2 − 0.01642 * b3 + 0.01081 * b4 + 0.01059 * b5 − 0.00596 * b6 − 0.00688 * b7 + 0.00395 * b8 | Among them, b1, b2, b3, b4, b5, b6, b7, and b8 correspond to the reflectivity of the first, second, third, fourth, fifth, sixth, seventh, and eighth bands of the WordView-2image. |
| Cu | YCu = 29.37829 − 0.00836 * b1 − 0.07866 * b2 + 0.05617 * b3 + 0.08459 * b4 − 0.01616 * b5 − 0.01923 * b6 − 0.06784 * b7 + 0.02992 * b8 | |
| Pb | YPb = 44.57155 − 0.09794 * b2 + 0.20719 * b3 − 0.21651 * b4 + 0.05417 * b5 + 0.24541 * b6 − 0.10542 * b7 − 0.06244 * b8 | |
| Zn | YZn = 36.57033 + 0.02811 * b1 + 0.18157 * b3 + 0.09715 * b4 − 0.17465 * b5 + 0.02874 * b6 + 0.06305 * b7 − 0.03995 * b8 | |
| Mo | YMo = 7.25795 − 0.00484 * b1 + 0.00060 * b2 − 0.00308 * b3 − 0.00797 * b4 − 0.01103 * b8 | |
| As | YAs = 19.46359 − 0.04767 * b3 − 0.04955 * b4 + 0.02080 * b5 + 0.07710 * b6 − 0.01323 * b7 − 0.01897 * b8 | |
| Hg | YHg = 2.31494 + 0.01885 * b1 + 0.00425 * b2 − 0.08809 * b3 − 0.00980 * b4 + 0.06119 * b5 + 0.10195 * b6 − 0.03692 * b7 − 0.04869 * b8 |
Publisher’s Note: MDPI stays neutral with regard to jurisdictional claims in published maps and institutional affiliations. |
© 2021 by the authors. Licensee MDPI, Basel, Switzerland. This article is an open access article distributed under the terms and conditions of the Creative Commons Attribution (CC BY) license (https://creativecommons.org/licenses/by/4.0/).
Share and Cite
Cheng, G.; Huang, H.; Li, H.; Deng, X.; Khan, R.; SohTamehe, L.; Atta, A.; Lang, X.; Guo, X. Quantitative Remote Sensing of Metallic Elements for the Qishitan Gold Polymetallic Mining Area, NW China. Remote Sens. 2021, 13, 2519. https://doi.org/10.3390/rs13132519
Cheng G, Huang H, Li H, Deng X, Khan R, SohTamehe L, Atta A, Lang X, Guo X. Quantitative Remote Sensing of Metallic Elements for the Qishitan Gold Polymetallic Mining Area, NW China. Remote Sensing. 2021; 13(13):2519. https://doi.org/10.3390/rs13132519
Chicago/Turabian StyleCheng, Gong, Huikun Huang, Huan Li, Xiaoqing Deng, Rehan Khan, Landry SohTamehe, Asad Atta, Xuechong Lang, and Xiaodong Guo. 2021. "Quantitative Remote Sensing of Metallic Elements for the Qishitan Gold Polymetallic Mining Area, NW China" Remote Sensing 13, no. 13: 2519. https://doi.org/10.3390/rs13132519
APA StyleCheng, G., Huang, H., Li, H., Deng, X., Khan, R., SohTamehe, L., Atta, A., Lang, X., & Guo, X. (2021). Quantitative Remote Sensing of Metallic Elements for the Qishitan Gold Polymetallic Mining Area, NW China. Remote Sensing, 13(13), 2519. https://doi.org/10.3390/rs13132519


