Next Article in Journal
Fast SAR Autofocus Based on Ensemble Convolutional Extreme Learning Machine
Previous Article in Journal
Direction-of-Arrival Estimation over Sea Surface from Radar Scattering Based on Convolutional Neural Network
 
 
Correction published on 10 February 2023, see Remote Sens. 2023, 15(4), 980.
Article

Spatio-Temporal Variability of Aerosol Components, Their Optical and Microphysical Properties over North China during Winter Haze in 2012, as Derived from POLDER/PARASOL Satellite Observations

1
State Environmental Protection Key Laboratory of Satellite Remote Sensing, Aerospace Information Research Institute, Chinese Academy of Sciences, Beijing 100101, China
2
University of Chinese Academy of Sciences, Beijing 100049, China
3
Key Laboratory of Atmospheric Chemistry, Chinese Academy of Meteorological Sciences, CMA, Beijing 100081, China
4
LOA—Laboratoire d’Optique Atmosphérique, CNRS, UMR 8518, University of Lille, 59000 Lille, France
5
GRASP-SAS, Remote Sensing Developments, Cite Scientifique, University of Lille, 59655 Villeneuve d’Ascq, France
*
Author to whom correspondence should be addressed.
Remote Sens. 2021, 13(14), 2682; https://doi.org/10.3390/rs13142682
Submission received: 17 May 2021 / Revised: 4 July 2021 / Accepted: 5 July 2021 / Published: 7 July 2021 / Corrected: 10 February 2023

Abstract

:
Pollution haze is a frequent phenomenon in the North China Plain (NCP) appearing during winter when the aerosol is affected by various pollutant sources and has complex distribution of the aerosol properties, while different aerosol components may have various critical effects on air quality, human health and radiative balance. Therefore, large-scale and accurate aerosol components characterization is urgently and highly desirable but hardly achievable at the regional scale. In this respect, directional and polarimetric remote sensing observations have great potential for providing information about the aerosol components. In this study, a state-of-the-art GRASP/Component approach was employed for attempting to characterize aerosol components in the NCP using POLDER/PARASOL satellite observations. The analysis was done for January 2012 in Beijing (BJ) and Shanxi (SX). The results indicate a peak of the BC mass concentration in an atmospheric column of 82.8 mg/m2 in the SX region, with a mean of 29.2 mg/m2 that is about four times higher than one in BJ (8.9 mg/m2). The mean BrC mass concentrations are, however, higher in BJ (up to ca. 271 mg/m2) than that in SX, which can be attributed to a higher anthropogenic emission. The mean amount of fine ammonium sulfate-like particles observed in the BJ region was three times lower than in SX (131 mg/m2). The study also analyzes meteorological and air quality data for characterizing the pollution event in BJ. During the haze episode, the results suggest a rapid increase in the fine mode aerosol volume concentration associated with a decrease of a scale height of aerosol down to 1500 m. As expected, the values of aerosol optical depth (AOD), absorbing aerosol optical depth (AAOD) and fine mode aerosol optical depth (AODf) are much higher on hazy days. The mass fraction of ammonium sulfate-like aerosol increases from about 13% to 29% and mass concentration increases from 300 mg/m2 to 500 mg/m2. The daily mean PM2.5 concentration and RH independently measured during these reported pollution episodes reach up to 425 g/m3 and 80% correspondingly. The monthly mean mass concentrations of other aerosol components in the BJ are found to be in agreement with the results of previous research works. Finally, a preliminary comparison of these remote sensing derived results with literature and in situ PM2.5 measurements is also presented.

Graphical Abstract

1. Introduction

In recent years, haze pollution has drawn growing worldwide concerns, especially in developing countries. Haze pollution is frequently observed during winter in North China Plain (NCP) because of both the enhanced emissions from heating, traffic and industry and the unfavorable meteorological conditions for diffusion [1]. An increasing number of studies focused on haze events associated with significant impacts on air quality, human health and global climate change [2,3,4]. It is well known that secondary inorganic aerosols, such as SO42−, NO33−, NH44+ and organic aerosol (OA) are the dominant air pollutants in hazes [5,6]. The primary aerosol or precursor can react to form a secondary aerosol which is the main component of PM2.5 under certain environmental conditions [7]. Therefore, the research on aerosol components is the key to revealing the forming mechanism of haze [2].
Currently, most of the existing studies focused on aerosol components are based on the chemical sampling method [2,5,7,8,9]. For instance, Cao et al. [8] collected the atmospheric organic and elemental carbon (OC and EC) during the high-pollution fall and winter in Xi’an city, Shaanxi Province, from September 2003 to February 2004 using Battery-powered mini-volume samplers to collect PM2.5 and PM10 samples. Their study reported that the average EC content of PM2.5 in Xi’an in the winter of 2003 was (12.3 ± 3) μg/m3 and OC and EC levels at Xi’an are higher than most urban cities in Asia. Sun et al. [7] conducted synchronous aerosol particle measurements with two aerosol mass spectrometers in Beijing to investigate the variations in particulate composition. Their study indicated that secondary organic aerosol is the dominant pollutant and that reducing the precursors of secondary aerosol over regional scales is crucial and effective in suppressing the formation of secondary particulates and in mitigating PM pollution.
In-depth analysis of chemical components of aerosol from remote sensing data is very challenging and practically impossible. At the same time, many studies in recent years have demonstrated significant potential in providing information about aerosol composition by identifying and characterizing main aerosol components (types) using ground-based remote sensing observations [10,11,12,13,14,15,16,17]. For instance, Li et al. [11,18] applied the five-aerosol-component model (relying on the differences of the complex refractive indices (CRI) of different components) for analyzing the ground-based observations during the heavy haze pollution events in Beijing in January 2013. Similarly, Li et al. [12] investigated the microphysical, optical, and chemical properties of atmospheric aerosols using the CRI acquired in Beijing and Kanpur sites of AERONET (Aerosol Robotic NETwork). Furthermore, Zhang et al. [17] proposed an algorithm that can distinguish the organic matter components (water-soluble organic matter and water-insoluble organic matter) from other aerosol components during the haze in Beijing. Nevertheless, the studies mentioned above use ground-based observations and therefore face a common limitation in spatial coverage of aerosol components distribution.
In these regards, satellite remote sensing provides an opportunity to provide aerosol observations. However, there have only been a few successful attempts to use satellite remote sensing for characterizing the component distribution of aerosol. In these regards, multi-angular polarimetric (MAP) data seem to have sufficient information content for detailed characterization of aerosol [19]. For example, the algorithms of new generation can derive information about not only total aerosol optical depth (AOD) at 550 nm characterizing total aerosol amount but also AOD spectral dependence of, and even information about such detailed properties as spectral absorption aerosol optical depth (AAOD), complex refractive index and particle nonsphericity [20,21]. As discussed by Russell et al. [22], the possibilities of retrieving these extended aerosol properties (CRI and volume particles size distribution, etc.) from satellite polarimetry could be raised once new prospects of monitoring of aerosol components from space are realized. Chen et al. [23,24] used aerosol AOD and AAOD products retrieved from POLDER-3/PARASOL polarimetric data for constraining global emissions of aerosols. Moreover, Li et al. [18] developed in the frame of GRASP algorithm [21,25] an approach designed for direct retrieval of main aerosol components from directional polarimetric satellite observations. The successful applicability of this approach was illustrated in several studies [26,27]. In this study, we explore the utilization of this approach in conjunction with analysis of the air quality and meteorological data.
Specifically, we derive accurate spatial distribution of aerosol optical, microphysical properties and aerosol components from POLDER/PARASOL satellite observations over NCP. We also focus on the pollution haze events that occurred over Beijing in January 2012. We analyzed the simultaneously derived aerosol components, aerosol optical depth (AOD), particle size distribution, scale height and the observed meteorological and PM2.5 data in Beijing during the haze events. A comparison with non-haze cases was also performed. The data and methods of this study are described in Section 2 and Section 3. We show the spatial distribution of aerosol properties and the relationship between the aerosol components and meteorological data in Section 4. The analysis and discussion are presented in Section 5. Section 6 presents the conclusions.

2. Data and Study Area

2.1. POLDER/PARASOL Satellite Observations

The spaceborne multi-directional, multi-spectral polarized POLDER-3 (Polarization and Directionality of the Earth’s Reflectance) imager on board PARASOL (Polarization and Anisotropy of Reflectance for Atmospheric Sciences coupled with Observations from a Lidar) can measure the global angular distribution of intensity and polarization of solar radiation reflected into space by the earth-atmosphere system [28,29,30]. In January 2012, the revisit observation period of the POLDER satellite over the NCP was two days. PARASOL was in a sun-synchronous orbit with ascending node at 13:30 [31], with two-day revisiting period. The imager’s channels are centered at 443, 490, 565, 670, 763, 765, 865, 910 and 1020 nm and polarization observations are at 490, 670 and 865 nm. The spatial resolution at nadir is 5.3 km × 6.2 km. POLDER-3 can observe up to 16 view angles for each pixel. The POLDER-3 mission was accomplished in 2013 and it has provided about nine years of valuable data, which can be downloaded from http://www.icare.univ-lille1.fr/archive?dir=PARASOL/ (accessed on 25 May 2020). The full archive of the POLDER-3 data was processed by GRASP algorithms and several extended aerosol products were generated [19]. The extended validation and analysis of Chen et al. [32] demonstrated several advantages of MAP 10 km products compared to the conventional products provided by single viewing images. Schutgens et al. [33] analyzed the consistency and difference of different satellite aerosol degree products and demonstrated the reliability and unique value of MAP aerosol products especially in regard to such property as aerosol absorption.
In this study, GRASP aerosol component retrieval methodology is used to retrieve information about aerosol components on North China Plain from POLDER-3 multi-angle and multi-spectral polarized observations [18]. As shown in Figure 1, over this region, on average about 10 times a month POLDER-3 data were available after the cloud screening. We average all available pixels for BJ and SX in January 2012, respectively. However, it should be noted that the number of observations in BJ and SX regions in a month is not the same, which may have a slight impact on the comparison of aerosol component.

2.2. The Validation Ground—Based Data
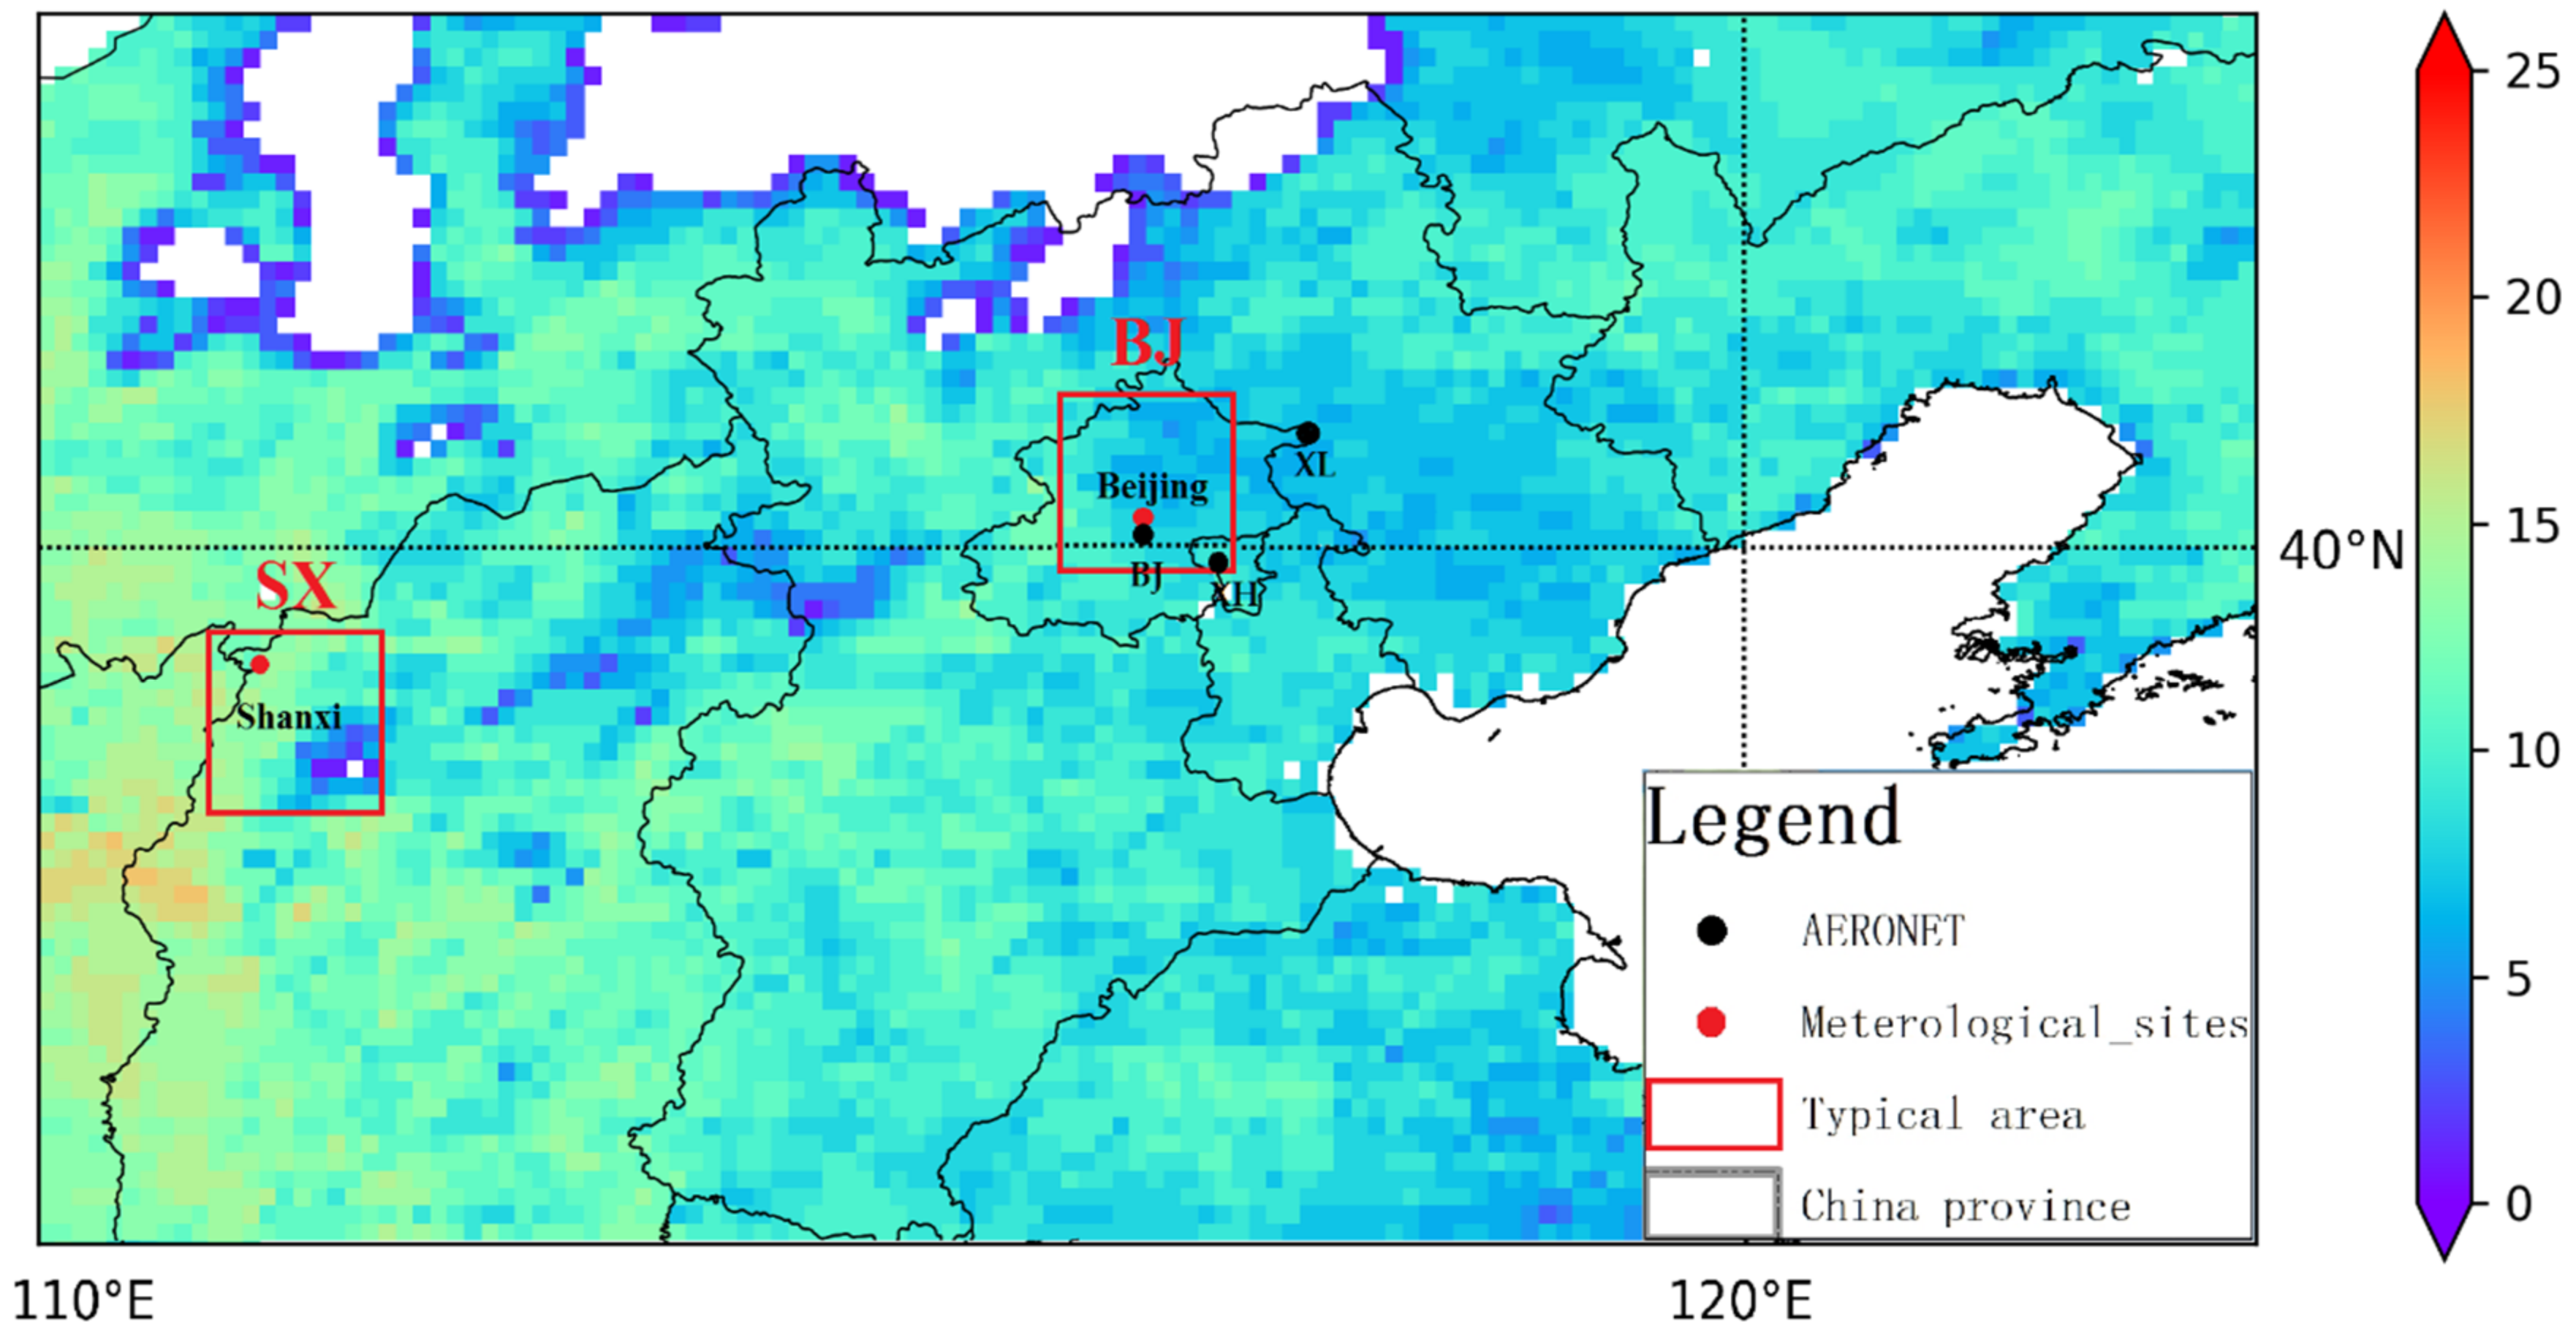
The ground-based data used in this study for validation include aerosol optical depth (AOD), absorbing aerosol optical depth (AAOD) and fine aerosol optical depth (AODf) from three AERONET stations (Beijing (BJ), Xianghe (XH) and Xinglong (XL)) during January 2012. AERONET is a ground observation network comprised of a group of ground-based remote-sensing aerosol sites established by NASA to detect the global atmospheric aerosol (http://aeronet.gsfc.nasa.gov (accessed on 25 December 2020)) [34]. The direct Sun AOD and extended retrieved aerosol properties of level 1.5 data cloud screened and level 2.0 passed additional quality control, including quality checks, stability criterion check and standard deviation check were used for validation purposes [35,36]. If there were no level 2.0 data available, the level 1.5 data were used. The uncertainty of AOD in the visible and near-infrared bands is ~0.01 [37]. The direct Sun AOD observations are conducted every 15 min according to the AERONET operational protocol. The angular sky radiance scanning, which is collected less frequently (~once per hour) and only at low sun elevation angles, is used to derive aerosol microphysical and absorption characteristics, including AAOD [35]. Thus, the number of derived AOD substantially exceeds that of AAOD.
In addition to AERONET data, the ambient relative humidity (RH), temperature, wind direction and wind speed, which were collected by the automatic meteorological stations (NO.54398 Beijing (40.08°N 116.37°E)) of the China Meteorological Administration (CMA) were used in order to analyze the ground surface observations. Only data from manned stations, which are maintained regularly, were used to ensure the possible data quality. The CMA stations close to the three AERONET sites mentioned in the last paragraph were selected. The temporal windows of observation are the same as AERONET. The hourly atmospheric fine particulate matter (PM2.5 aerodynamic diameter less than 2.5 m) mass concentrations observed over the US Embassy of Beijing to identify pollution events were also used (https://china.usembassy-china.org.cn/ (accessed on 16 June 2010)) [38].

2.3. Study Area

NCP is a densely populated region in China and is polluted due to high emissions of pollutants and precursors associated with the economic development [39]. The spatial distribution of aerosol components in NCP is in the lack of further research. NCP shows the typical characteristics of a temperate continental climate with four distinctive seasons. In this region, there are many diversified and fast-developing cities, such as Beijing which has a dense population and serious atmospheric pollution. The vast number of atmospheric pollutants primarily originates from major pollution sources, such as air discharged from vehicles and coal-burning [40,41,42,43,44].
In this study, we have chosen the square regions BJ and SX with 1° × 1° in Beijing and Shanxi, as shown in Figure 1, to ensure the existence of valid data. Beijing is the capital of China with a high population density [45]. Shanxi is a province with a rich storage of coal resources in China [8,46]. These two regions present different environmental characteristics and anthropogenic activities. Therefore, BJ and SX are chosen as typical cases to discuss the difference of aerosol optical properties, microphysical properties and aerosol components’ spatial distributions in NCP. The central longitude and latitude of the BJ and SX are 116.5°E, 40°N and 108.5°E, 36.5°N, respectively.

3. Methods

3.1. GRASP/Component Retrieval

GRASP (Generalized Retrieval of Aerosol and Surface Properties) is a highly rigorous and versatile aerosol and surface reflectance retrieval algorithm which is available at (https://www.grasp-open.com (accessed on 1 July 2020)) [21,25]. The algorithm can equally be applied (with minimal changes) to inverting observations from different satellite sensors and ground-based instruments [47,48,49,50]. A full description of the main “Forward Model” and “Numerical Retrieval” algorithm modules is provided by Dubovik et al. [51]. The schematic flowchart of the GRASP retrieval algorithm is shown in Figure 2. The aerosol properties in the forward model of GRASP rely on a spheroid kernel data base for the calculation of single scattering properties [50]. The multiple scattering effects are accounted for using the successive order of scattering (SOS) radiative transfer approach [52]. The inversion is designed as statistically fitting using the multi-term least square method (LSM) [53].
Recently a module for aerosol component retrieval was incorporated into the GRASP algorithm, called the GRASP/Components algorithm, in order to directly infer information about aerosol components from measured radiances together with size distribution that allows for retrieving also all optical properties such as aerosol optical depth in fine and coarse mode, single scattering albedo, etc. [26,27]. The main specifics of GRASP/Components relate to the modeling of aerosol optical properties. As shown in Figure 2 the aerosol is modeled as an internal mixture of several aerosol components with known spectral dependencies of the CRI of the aerosol components that are fixed a priori. Correspondingly, the aerosol optical properties are driven by size distribution and CRI that is computed using Maxwell-Garnett mixing rules from the volume fractions of the components. As shown in Figure 2, the volume fractions of the components are included in the state vector of retrieved unknowns. Maxwell–Garnett effective medium approximation should be used for the case of insoluble impurities suspended in solution, which can be modeled as insoluble inclusions embedded within a matrix [54]. Thus, the algorithm derives the volume fractions of these components that drive spectral dependence of the complex refractive index, which are used together with size distribution to calculate the mass column concentrations of each aerosol component and total aerosols.
Figure 2 illustrates the main logic of the GRASP/Components algorithm iterative solution. The forward model module simulates satellite observation and measurement based on state vector that includes parameters describing the particles size distribution, aerosol vertical profile, fractions of aerosol components and surface reflectance as the following. The CRI of all aerosol components are known parameters from previous research [55]. The CRI is calculated by the aerosol internal mixing model, by assuming that the aerosol particles are regular particles (such as spherical or ellipsoidal) or nonspherical. Once the real and imaginary parts of aerosol complex refractive indices are computed based on the fractions of aerosol components, the aerosol single scattering properties are calculated using the spheroid kernel data base by Dubovik et al., (2006). Then the radiative transfer module accounts for multiple scattering interactions of light scattered by particles of aerosol, molecules of gases and reflected by the surface to generate the observations. In this study, all the radiances in six wavelengths and polarized radiances in three wavelengths of POLDER-3 are used for calculation. These calculations are used in iterative numerical inversion realized as statistically optimized fitting. Then the optimal solution of the cost function of algorithm are the retrieval results. For each individual pixel, GRASP uses multiple a priori constraints such as smoothness limitations on the retrieved continuous functions including aerosol size distribution and surface parameters. Thus, it could bring additional possibilities for improving the accuracy of retrieved parameters. The details of the approach are provided by Dubovik et al., (2011) and Li et al., (2019). Once the iterations stop and the solution is found, output aerosol properties are calculated that include additional characteristics such as AODf, AODc, AAOD, etc.

3.2. Aerosol Mass to Volume Conversion

As discussed by Li et al. [18], the aerosol components provided by the GRASP/Component approach of are BC (black carbon); BrC (brown carbon); CAI (coarse-mode absorbing insoluble); CNAI (coarse-mode non-absorbing insoluble); FNAI (fine-mode non-absorbing insoluble); FNAS (fine-mode non-absorbing soluble); CNAS (coarse-mode non-absorbing soluble); AWF (aerosol water of fine-mode); AWC (aerosol water of coarse-mode) (Table 1).
In order to calculate the mass concentration of these aerosol components, the densities of various aerosol components are found in previous literature (BC = 2.0 g/cm3, BrC = 1.8 g/cm3, FNAI and CNAI = 2.6 g/cm3, CAI = 4.77 g/cm3, FNAS = 1.76 g/cm3, CNAS = 2.24 g/cm3, AWF and AWC = 1.0 g/cm3) [15,56]. With these parameters, the aerosol mass concentration over NCP for January 2012 can be calculated by the following formula:
C m , i = ρ m , i · f i · V t o t a l = ρ m , i · f i · r m i n r m a x d V d l n r d l n r
where C m , i is the column mass concentration of the i-th component, which is the mass concentration of the aerosol component in the total atmosphere per unit area (unit: mg/m2), ρ m , i is the mass density of the i-th component [15], ρ m , i is the total aerosol volume, f i is the volume fraction of the i-th component. r m a x and r m i n represent the maximum and minimum radius of aerosol volume size distribution, respectively.

4. Results

4.1. GRASP/Component Retrieval

Thus, GRASP/Component approach was applied to processing POLDER-3 data over the selected studied regions. Figure 3 demonstrates the spatial inhomogeneities and the spectral behavior of different aerosol characteristics including AOD, AAOD and AODf in different time periods. It should be noted that considering optical characteristics such as AODf and AAOD is for the air pollution characterization. Figure 3 shows the spatial distribution of monthly AOD over NCP during January 2012. The high AOD and AODf were observed in the Hebei and eastern Shandong provinces. The results suggest that the fine mode is the main part of the aerosol. It is also consistent with the results obtained by Li et al. [26]. The AAOD of Hebei and Shandong province are also higher than those in the Shanxi (110°15′E—114°32′E; 34°36′N—40°44′N), especially at 670, 865 and 1020 nm. Moreover, the spectral behavior of AOD in the 440–1020 nm range manifests itself in monotonic decrease as the wavelength increases, which is consistent with the results obtained by Chen et al. [32]. A similar spectral dependency was observed for AODf and AAOD. This tendency is typically expected for fine-mode dominated aerosols [57]. Thus, in most of the analyzed areas the fine mode aerosol is a principal contributor to the extinction of radiation and the largest spatial inhomogeneities of AODf are caused by aerosol particle size distribution.

4.2. Spatial Distribution of Volume Size Distribution Properties

The aerosol size distribution is commonly approximated by log-normal distribution as discussed by [58,59,60,61]. The retrieved aerosol volume size distributions are usually considered bi-modal composed by fine and coarse mode of aerosol particles. Correspondingly, the fine-mode fraction by volume (FMFv) is often used for analyzing the main features of spatial variability aerosol sizes. The FMFv can be defined as [62]:
F M F v = C v f C v f + C v c = r f m i n r f m a x d V l n r d l n r d l n r r f m i n r f m a x d V l n r d l n r d l n r + r c m i n r c m a x d V l n r d l n r d l n r
where Cvf and Cvc denote the volume concentration of fine and coarse mode aerosol; rf and rc are the radii of fine and coarse mode; the subscripts min and max denote the minimum and maximum radius of each mode, respectively and dV(lnr)/dlnr denotes the volume size distribution. The FMFv of the north of Hebei and Shandong province is obviously higher than in other regions approximately by value 0.2 as shown in Figure 4. This spatial distribution feature is similar to AODf. It indicates that the fine mode aerosol represents the main part of the aerosol concentration related to the pollutant’s accumulation. At the same time, some high values of FMFv are also observed over the Inner Mongolia of north China where AOD is not high. In addition, the reliability of FMFv in the low aerosol conditions is low. The uncertainty of FMFv is larger when the AOD is lower than 0.05. The FMFv could be used as a reference.

4.3. Spatial Distribution of Complex Refractive Index

The complex refractive index (CRI) of aerosol defines the ability of material composing aerosol particles to scatter and absorb the radiation. The distribution of CRI over NCP in January 2012 is shown in Figure 5. Based on the retrieval result for the imaginary and real part of CRI for fine and coarse modes (kf, kc and nf, nc, respectively), the distinctive regional features can be identified in the aerosol characteristics over NCP. The high kf values mainly occurred in Shanxi province. The monthly kc have higher values mainly in Hebei region in a difference from the values of kf. On the contrary, the spatial distribution characteristics of monthly nc are basically uniform with slight fluctuation.
The nc and nf of NCP exhibit relatively similar spectral behaviors in 440–1020 nm, with its monthly mean varying between 1.45 and 1.55 with the monthly mean at six wavelengths. Particularly, compared to the real parts, the imaginary parts kc show obvious spectral variation, with the values in the 443 nm and 490 nm values being significantly higher than that of other bands, which is in accordance with Li et al. [11].

4.4. Spatial Distribution of Aerosol Components

The retrieved monthly mean of total aerosol column mass concentration is about 2000 mg/m2 based on the POLDER-3 observation data in January 2012. Figure 6 shows the spatial distribution of black carbon, and it can be seen from the figure that the mass concentration of BC is mainly centered in northwestern Shanxi. It is about four times higher compared to Beijing (8.9 mg/m2) as shown in Table 1. In addition, it is worth noting that the high values of BrC are mainly stored in Beijing, Tianjin, southern Hebei and northern Shandong. The high mass concentration of BrC (127.4 mg/m2) possibly indicates that the primary air pollution sources are the fine particles produced by anthropogenic activities in Beijing. Moreover, the FNAS mainly spatially distributed in coastal regions such as Bohai Bay in Figure 6. The mean FNAS (381.2 mg/m2) in Beijing is three times higher compared with Shanxi (130.1 mg/m2). In these regions, the high relative humidity is favorable to the growth of ammonium sulfate aerosol particles. The high mass concentration of FNAS (381.2 mg/m2) implies that the vehicle and industrial emissions are the dominant factors, for the inorganic salts of emissions are the major components of the FNAS. However, the spatial distributions of monthly mean CNAI, FNAI, CAI, AWF and AWC are uniform with slight fluctuation over NCP as shown in Figure 6. The peak of BC mass concentration in January 2012 is 82.8 mg/m2 in Shanxi of NCP. The mean BrC mass concentrations with the maximum at 271.2 mg/m2 in Hebei and Beijing are higher than those in Shanxi because of the enormous anthropogenic emissions. The FNAS is centralized in the Bohai Bay due to the high relative humidity, with its mass concentration around 737.4 mg/m2. In addition, the high values of CNAS are shown in Figure 6, due to coarse mode soluble carbonaceous particles shown in previous retrievals [15,18]. At the same time, OC (organic carbon) is the fine mode non-absorbing insoluble component, which has a significant presence in the aerosol during the haze [63,64]. In this study, the OC are mixed in the FNAI, which is the possible reason for the high value concentrated in the southern of NCP in the spatial distribution of FNAI.

5. Validation and Intercomparison

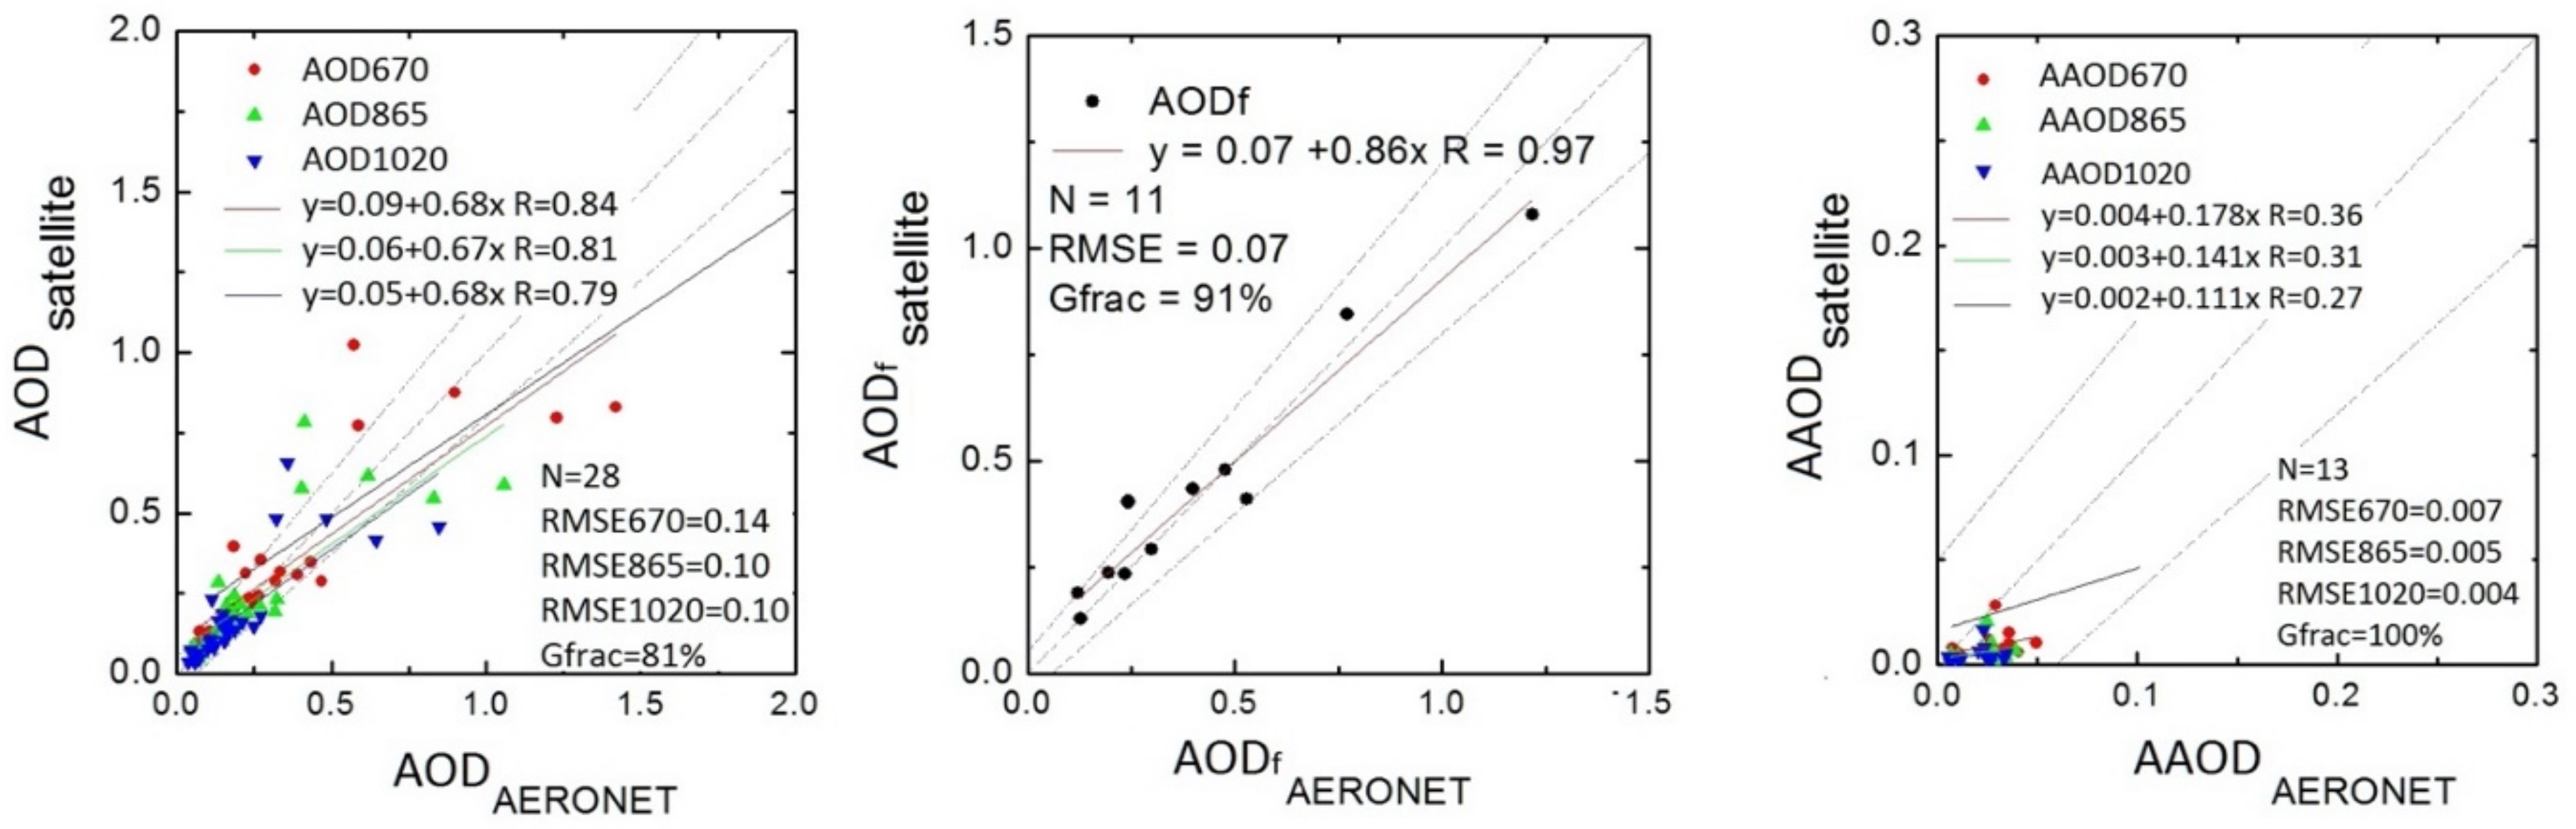
5.1. Validation of Aerosol Optical Properties

Figure 7 shows the validation of AOD, AODf and AAOD results with AERONET measurements. For the temporal window, we used a time interval of ±1 h of satellite overpass time. The spatial window is a 3 × 3 pixels centered on the AERONET site for validating the AOD, AODf and AAOD [65]. The accuracies of these properties are evaluated using the Pearson correlation coefficient (R), Root Mean Square Error (RMSE) and expected error (EE). Good fraction (Gfrac), the percentage of scatter points that fall in EE, is often used to evaluate the quality of inversion.
The AOD validation results show the correlation coefficient (R) at 670 nm is 0.84, which is the best, the R of 865 nm (0.81) inferior to that at 670 nm, and R of 1020 nm is the lowest (0.79). The RMSE of AOD is 0.13 and the Gfrac of 81%. The AODf is compared with the ground-based AERONET data available only at 500nm. Therefore, we utilized AODf at 490 nm to validate with AODf at 500 nm [66]. The validation of AODf showed a high R of 0.97 and a low RMSE of 0.07, the Gfrac of 91%, respectively. However, the R of AAOD is the highest (0.36) at 670 nm among all bands, and the R of 865 nm is only 0.31. Thus, the correlation coefficient (R) of AAOD is significantly lower than for the AOD and AODf. This is expected since retrieval aerosol absorption is challenging from satellites especially when AOD is low [32].

5.2. Complex Refractive Index

CRI of fine and coarse modes may differ significantly due to different components and source. In our study, the observed spectral behavior of the kf, kc and nf, nc values are consistent with the results obtained by Zhang et al. [17]. As shown in Figure 8, we find the mean nf and nc (1.46 and 1.50) in January 2012 calculated by Zhang et al. [17] based on ground-based data are close to the values (nf = 1.45 and nc = 1.50) retrieved by satellite observations in this study. The difference in nf is 0.1, but the values of nc are the same. Moreover, the kf and kc of Zhang et al. [17] can be presented using four distinct values kf 440, kf and kc 440, kc (0.036, 0.021, 0.0018 and 0.0009, respectively). The mean kf and kc of all bands in this study are 0.008 and 0.0015, respectively. On the whole, the values of kf in this study are generally lower than Zhang et al. [17], the nf, nc and kc show great agreement with Zhang et al. [17]. In addition, the SD of kc given by Zhang et al., 2020 is larger, which means that the aerosol absorption has changed a lot during the observation period. The SD is relatively small in this study, which may be related to the spectral smoothing constraint on the CRI of the GRASP inversion algorithm.

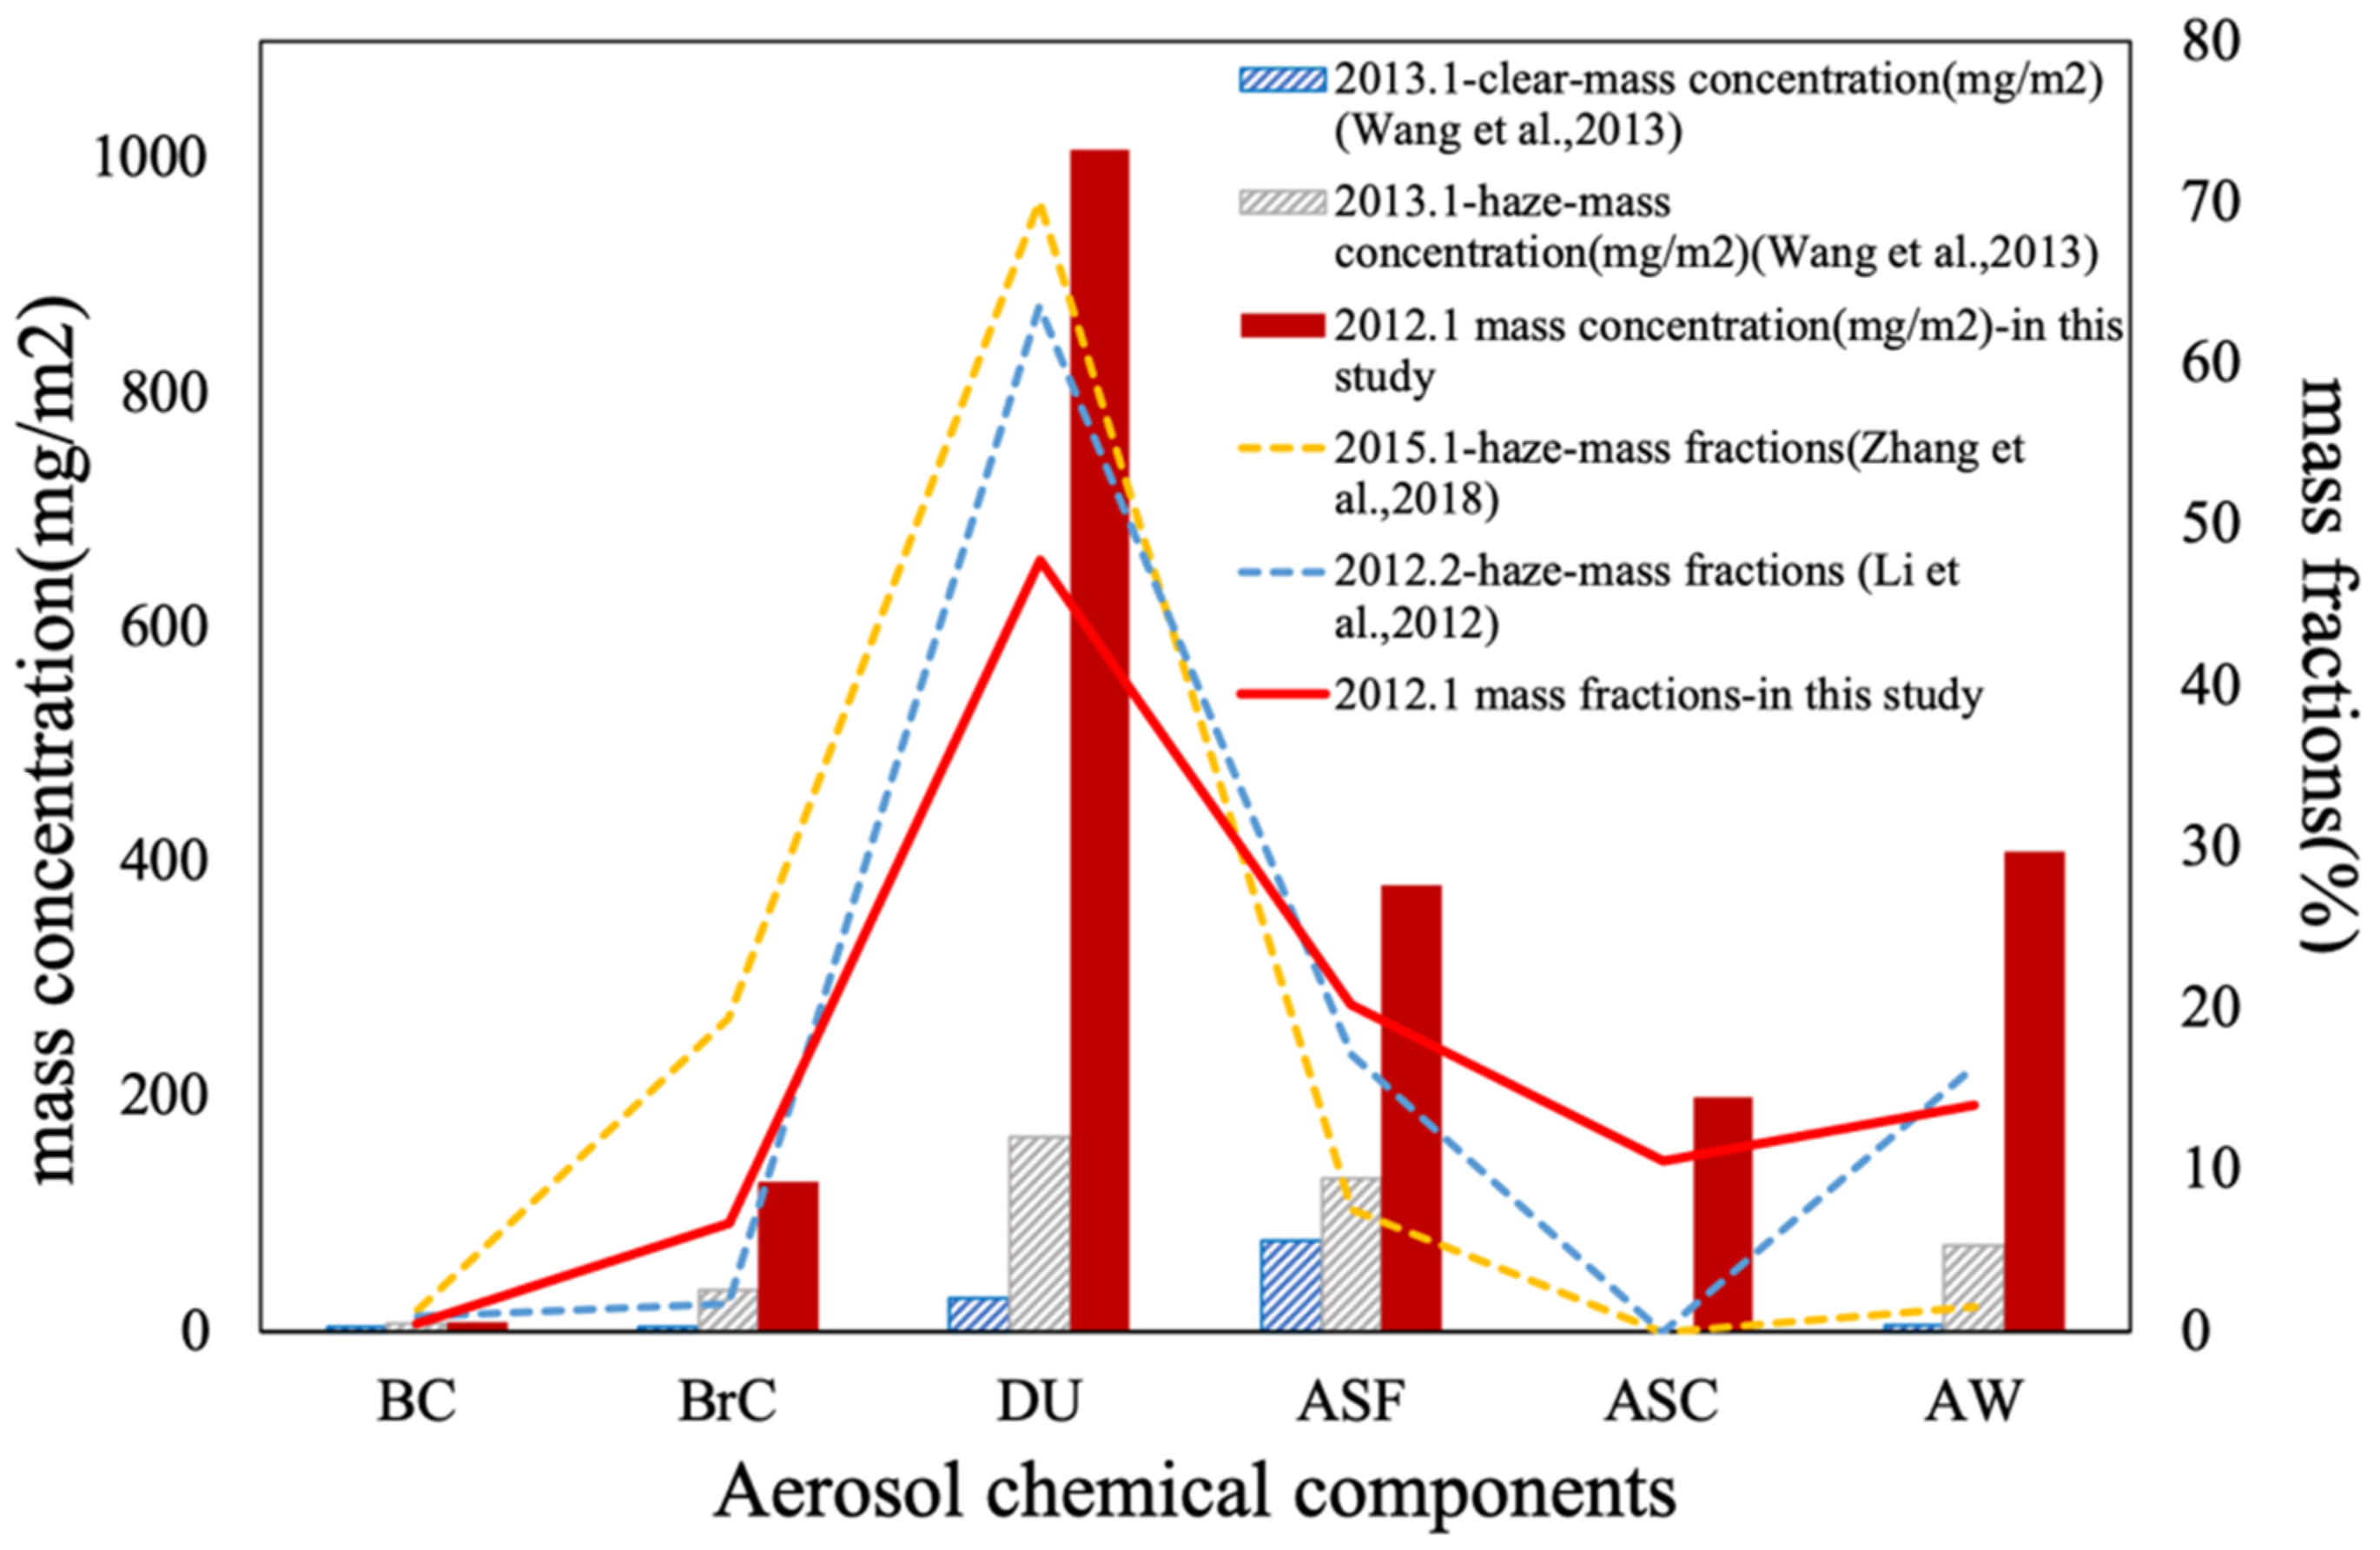
5.3. Intercomparison of Aerosol Component Distribution

In order to compare the aerosol component characterization using results given by the GRASP/Component approach with the ones of ground-based, a reformulation components approximation using a six-aerosol-component model is suggested [11,16,18,56]. This representation includes black carbon (BC), brown carbon (BrC), dust-like (DU), fine ammonium sulfate-like (ASF), coarse ammonium sulfate-like (ASC) and aerosol water content (AW). To this end, we sum up the CAI, CNAI and FNAI as the DU. The sum of the FAWC and CAWC was defined as AW. The FNAS is renamed as ASF and the CNAS is renamed as the ASC in this study.
Thus, in this study, we mainly discussed the spatial distribution of aerosol component presence under different air quality conditions and their relationship with meteorological conditions, especially haze. We used the six-aerosol-component model including the following components black carbon (BC), brown carbon (BrC), dust-like (DU), fine ammonium sulfate-like (ASF), coarse ammonium sulfate-like (ASC) and aerosol water content (AW). Black carbon (BC) is universally known as soot carbon and the strongest light-absorbing carbon found in the atmosphere [67,68]. Brown carbon (BrC) relates with organic matter that contains some absorbing organic species and generally has much greater absorptivity at near-ultraviolet and blue wavelengths than at red wavelengths [69]. Dust-like (DU) particles are regarded as a substance with strong absorption at the UV and blue wavelengths. DU particles usually come from natural sources, when iron oxides are present, but they can also be generated by the anthropogenic aerosol particles and mixed with some organic carbon (OC) [70]. The ammonium sulfate-like (ASF) are mainly generated from the secondary photochemical reaction by such as vehicle exhaust and oxygen [71]. Coarse ammonium sulfate-like (ASC) component mainly composed of ammonium sulfate-like and few sodium chlorides has the most significant contribution to light scattering [72]. ASC is dominated by coarse aerosol particles coming from natural sources and it has similar light scattering properties as the ASF component. Water content (AW) is primarily a host, which is related to hygroscopic components ASF and ASC, as well as ambient RH, especially at high-humidity situations [16].
Figure 9 shows the comparison of aerosol component mass fractions and mass concentration obtained in this study with the values reported in the literature for January 2012 in Beijing [11,16,18,56]. Their difference shown in Figure 9 can be partly explained by the fact that the other studies do not consider sea salt. In general, the concentration of BC is the lowest among aerosol components, the mass concentration is less than 10 mg/m2, and the mass fraction is less than 1%. The mass concentration and mass fraction of BrC are higher than that of BC. The mass concentration of BrC is about 100 mg/m2 in Beijing during the same period, which is in accordance with the results of Wang et al. [56]. Additionally, the DU is the dominant aerosol component with concentration higher than those of ASF and AW in all studies, about 50%. Moreover, the mass concentration and mass fraction of ASF and AW are similar. Thus, these results show that the proportions of various aerosol components are in line with the conclusions drawn by previous studies.

6. Discussion

6.1. Aerosol Properties in Typical Regions

Table 2 shows the monthly mean values of aerosol optical, microphysical and compositional properties in typical regions (BJ and SX in Figure 1) derived for comparing the differences in their spatial distributions. The highest value of AOD has occurred in BJ region, up to 1.1. The mean AOD of BJ is also the highest. The apparently highest value of AODf of up to 0.9 is also observed in BJ. The lowest AODf value of 0.21 was observed in SX region. The difference between the mean AODf in BJ and SX is about 0.37. In contrast, the spatial difference of AAOD is small, and the mean values in the two cases are similar (mean values 0.012 and 0.010, respectively) as shown in Table 1. Moreover, the highest value of FMFv was observed at 0.8 in BJ region. The high imaginary part (k) of the fine mode values mainly occurred in SX region (maximum is 0.046) indicating the strong absorption of fine-mode particles in this region, due to high black carbon mass concentration up to 29.2 mg/m2. Meanwhile, the substation level of mass concentration of BC was mainly observed in SX (29 mg/m2), which is in good agreement with Li et al. [11]. The peak of BrC is 271 mg/m2 in BJ, due to the complex organic pollutant. However, the spatial distributions of monthly mean DU, SS and AW are uniform, and their concentrations are 1008 mg/m2, 200 mg/m2, 410 mg/m2 in BJ region and 1608 mg/m2,167 mg/m2, 230 mg/m2 in SX region, respectively.
Figure 10 shows the percentage in the mean monthly column mass concentrations for six aerosol components presenting in two regions with the known high level of pollution (BJ and SX). It can be seen that the DU is the dominating component in both regions in January 2012 accounting for 47.84% and 59.34% respectively. BC fraction is only around 1% in both regions. The BC in SX (1.31%) is three times higher than that in BJ (0.47%), with a difference of 0.88%. The BrC aerosol component fraction is at the level of 6.77% at the BJ regions, which possibly reflects high level of emissions caused by industrial and anthropogenic activities. An obvious difference can be noted between the contribution of BrC of BJ and SX regions that reaches 5.18%. Meanwhile, the AW and ASC contributed at the levels of 14% and 10% to the aerosol components. Whereas the ASC observed in SX likely can be attributed to coarse mode soluble non-absorbing organic carbon. Another possible reason for the high value of DU is OC amounts are mixed in the DU. That could explain that a higher fraction of aerosol components DU (including OC) are found in SX than BJ due to the burning of biomass such as agricultural straw. The higher percentage of BrC component in BJ than SX can probably be explained by the higher presence of fossil fuels combustion products in BJ than in SX.

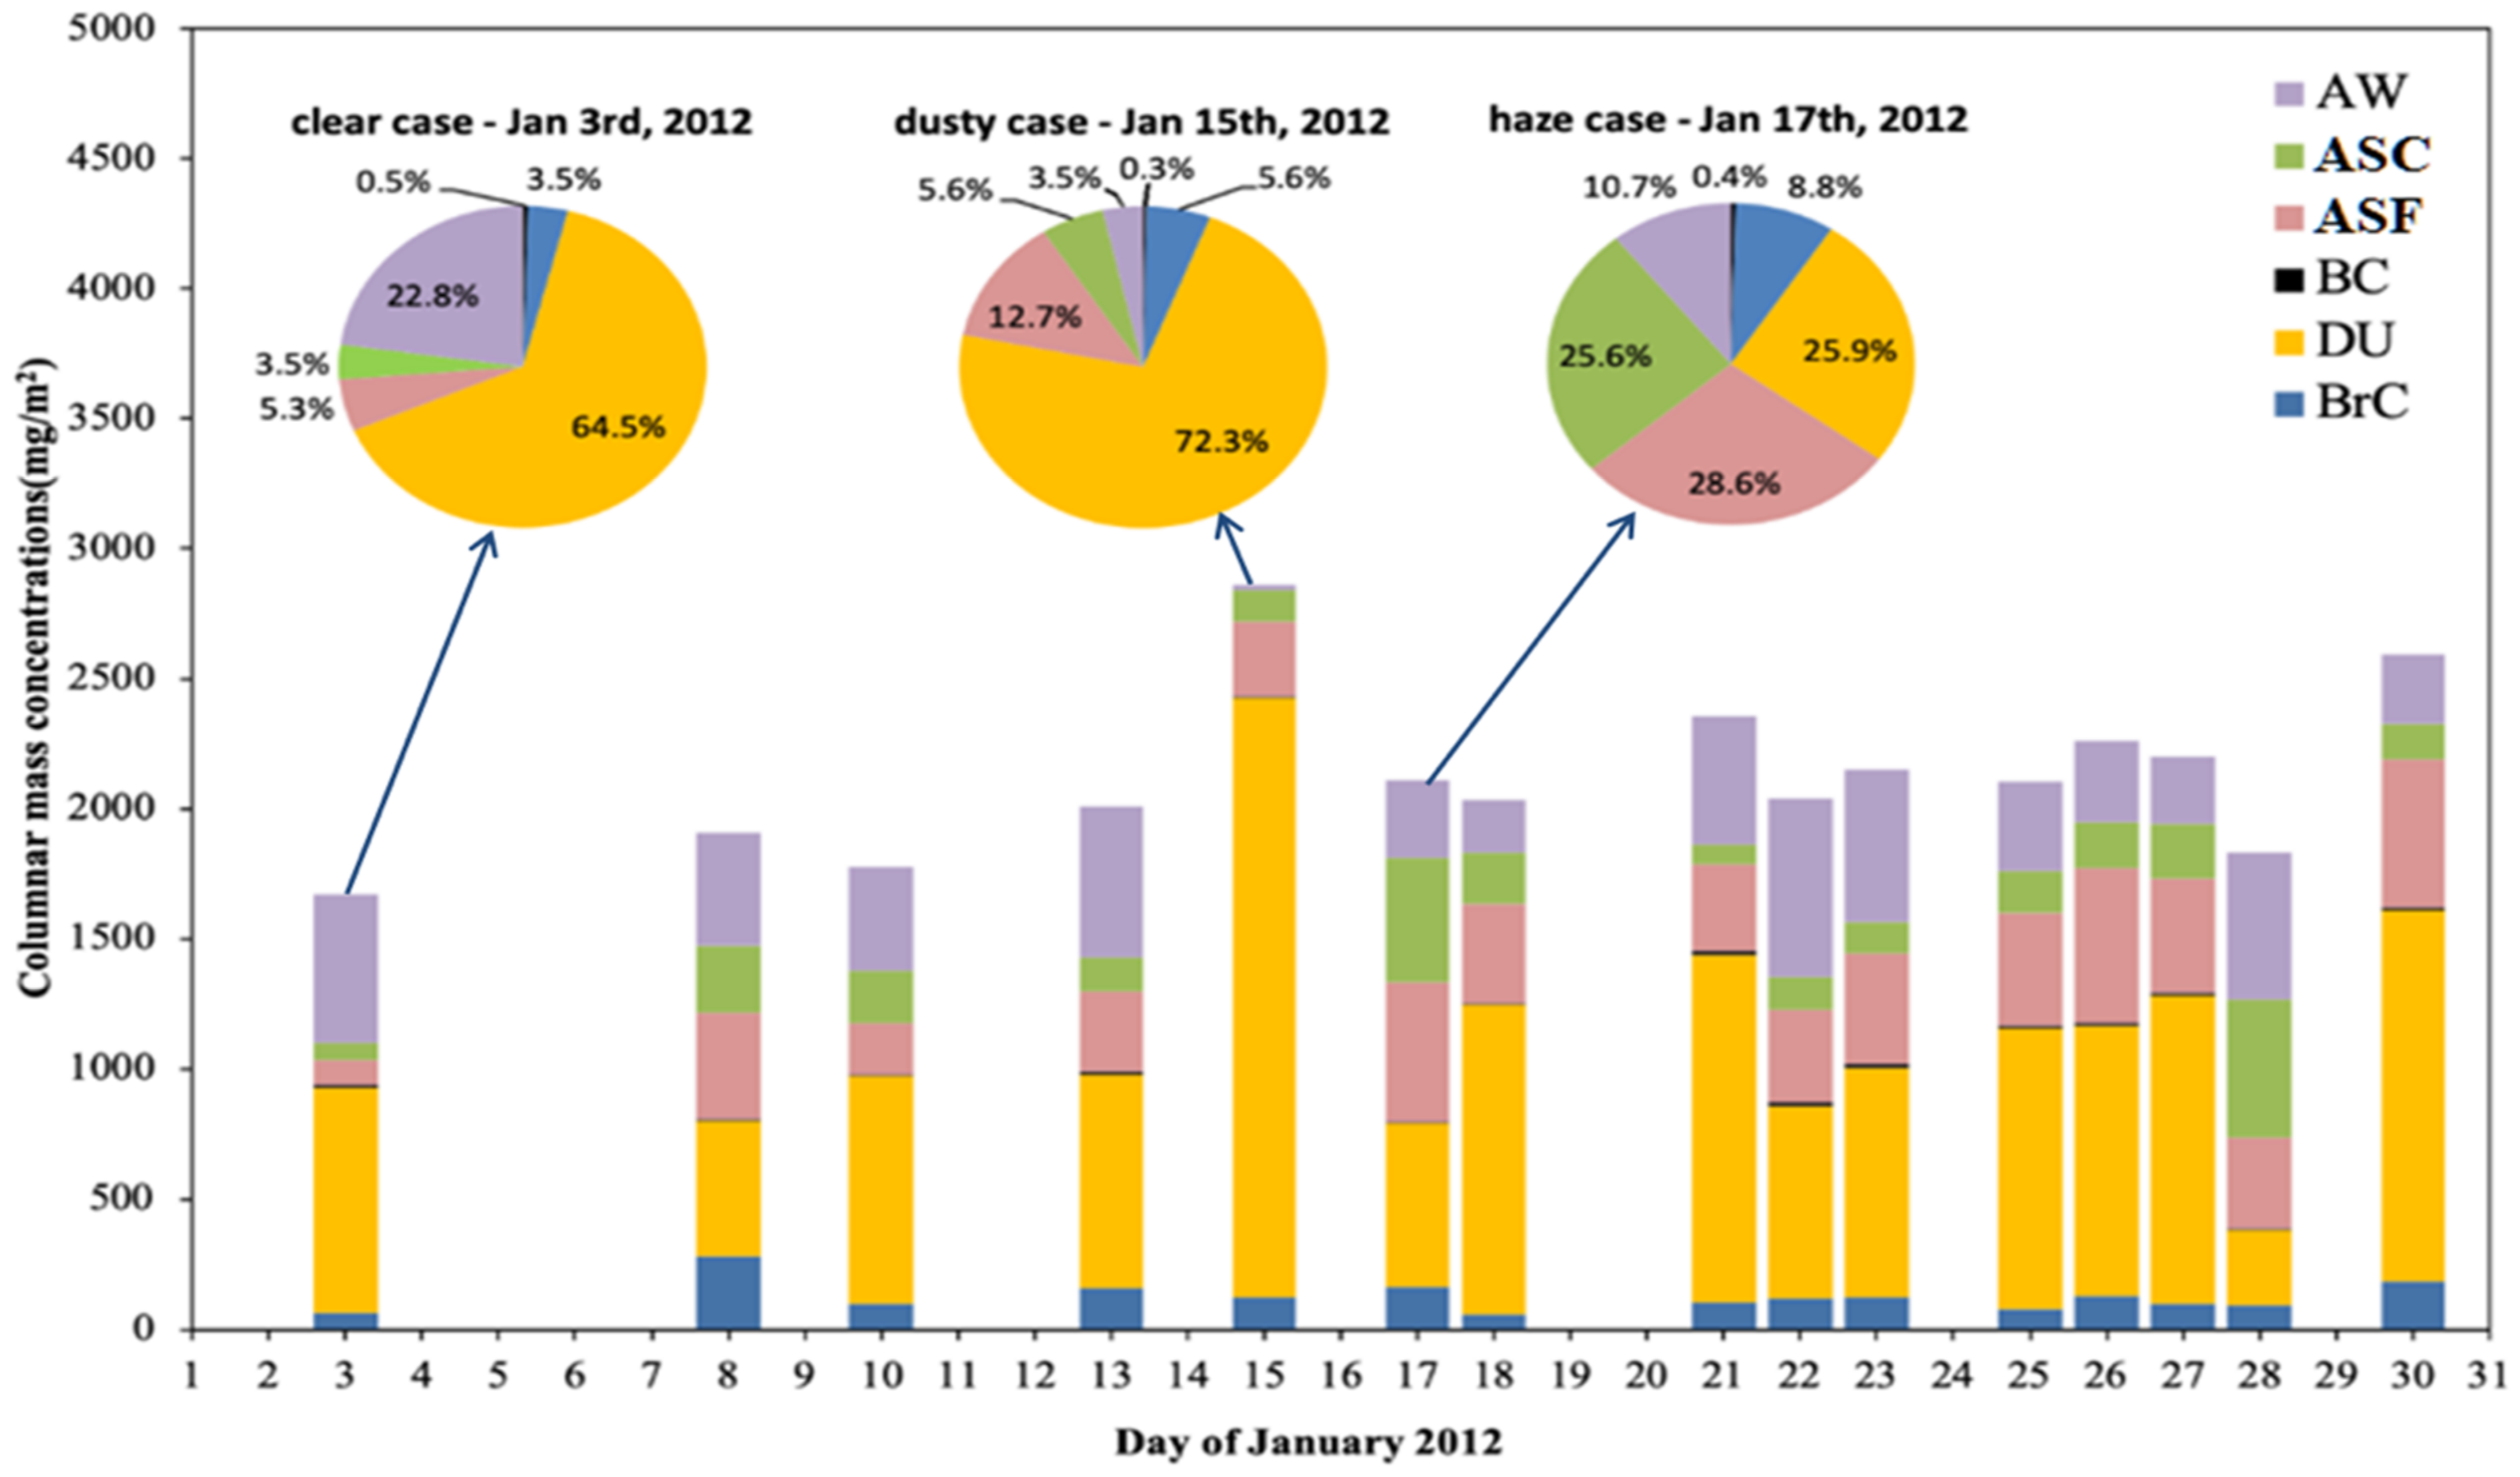
6.2. Temporal Variations of Aerosol Properties in Beijing Region

This section discusses aerosol components results for the BJ region shown in Figure 1, which is a part of Beijing. Based on the results presented above, we analyzed the evolution of the aerosol size distribution and aerosol component combination during January 2012. For a comprehensive analysis we utilized meteorological data of PM2.5 data in Beijing. The daily distribution of the available ground-based meteorological and PM2.5 data is shown in Figure 11. For comparison of aerosol component values retrieved from satellites, we have chosen the closest measurements within 10 min before and after satellite overpass time. It is worth noting that there was a high air pollution event according to PM2.5 on 15–18 January 2012. According to the China’s Environmental Policy, it is a serious pollution (haze case) when the concentration of PM2.5 is greater than 100 m. The standard of PM2.5 light pollution is 100 m~150 m, and the standard of heavy pollution is 200 m~300 m. Non-haze case is when the PM2.5 concentration is less than 100 m. When the weather condition is calm or the average wind speed is less than or equal to 3.0 m for 4 s, dust and sand are floating in the air, making the horizontal visibility less than 10 km. Figure 11 shows the statistics of the relative humidity (RH), temperature, wind speed and wind direction observations at the Beijing site. The highest RH occurs on the 17–18 January 2012, and the lowest value occurs on the 20–24th. During this haze period, the relative humidity and the temperature are higher and the wind speed is lower than non-haze days.
Figure 11 also shows the evolution of aerosol volume particle size distribution, scale height and AOD in the Beijing region in January. It can be seen that there is an obvious process of fine particle generation during the 15–18th marked with yellow and gray bands in the figure, and the fine mode can rapidly increase during haze pollution events, reaching the maximum value of 0.2 μm3/μm2. Meanwhile, the scale height of aerosol decreases from 2100 m to 1500 m. The values of AOD, AAOD and AODf also show an apparent increasing trend with the maximum value of AOD reaching 1.09 in Beijing. It can also be noted that the mass fraction of ASF aerosol increases from 12.67% to 28.62% and the mass concentration of ASF aerosol increases from 300 mg/m2 to 500 mg/m2 which could be partly explained by the increase in water uptake during the haze event and also likely by an accumulation of particle matters due to static and stagnant atmospheric conditions, corresponding to daily PM2.5 concentration up to 425 g/m3 and RH up to 80%. Meanwhile, the increase of RH, which is also associated with the high AW mass concentration, seemed to contribute significantly to haze evolution (Figure 12). It is illustrated that meteorological condition has a very important influence on the variation of aerosol components. The higher the relative humidity, the more pronounced the formation of the secondary aerosols [17].
In order to investigate the evolution of aerosol component mixture during the haze pollution, we have chosen the non-haze case (on 3 January 2012) and dusty case (on 15 January 2012) and haze case (on 17 January 2012) have been chosen to analyze the relationship between different air quality situation and the presence of different aerosol components shown in Figure 12. The dates of analyzed satellite observations are the same as in Figure 11. It is clear that satellite observation data are not available every day. One can see that the DU component is dominant in all aerosol events with the mean percentage of 60% on 15–16 January 2012, which agrees with the weather conditions usually associated with the high presence of dust. The results show a slight increase in BrC and AS during haze cases compare to non-haze case. However, the concentration of BrC and ASF demonstrate an obvious increase during the haze case (17–18 January 2012) accounting for 8.83% and 28.62%, respectively.
The results showed that the mass concentration of BrC can be two times greater and the mass concentration of ASF can be five times higher on haze day than on non-haze days. Corresponding daily PM2.5 concentration reached up to 425 g/m3 and RH up to 80%. In particular, the amplitude of ASF values in variation between the maximum during the haze cases and the minimum during the non-haze case reaches 400 mg/m2. Similarly, the amplitude of RH variations reaches ~50% in the same period. Thus, the increase of ASF in fine mode seems to be mainly influenced by RH. In addition, Figure 11C,D shows a rapid drop of PM2.5 caused by strong northwest wind on 19 January. As can be seen in Figure 12, DU increases from ~1000 mg/m2 to ~1200 mg/m2 from 18 to 21 in January. Meanwhile, evidently a rapid decrease in ASF and BrC seems to be associated with the penetration of clean air mass in the area.
The results of the study suggest that the deterioration of air quality near the surface in hazy days in the analyzed period is mainly caused by the increase of fine mode aerosol due to particle hygroscopic growth triggered by high RH. Moreover, the analyzed satellite observations demonstrate the evident impact of meteorological changes on the variation in aerosol components during air pollution. However, satellite observations were missing on the 19th and 20th due to cloudy conditions and a two-day revisit period of the satellite. Indeed, satellites can get continuous data for a large area, but the revisit time of the satellites is limited (e.g., it is once in 2 days for PARASOL). In addition, the presence of clouds greatly reduces the availability of effective data. In this study, cloudy pixel percentage is about 30% over NCP in January 2012. At the same time, in other studies, the cloud is also an important influence on the amount of effective data.
Figure 13 presents comparisons of fine mode aerosol component mass concentrations retrieved from satellite and from surface measurements of PM2.5 over Beijing in January 2012. The values of aerosol component values retrieved for fine mode (BC, BrC FNAS and FNAI) represent the mass concentration in the entire atmosphere, while the PM2.5 measured represents the surface level. Nonetheless, the concentrations of fine mode aerosol components and the PM2.5 demonstrate a consistent variation trend, with the correlation coefficients (R) of 0.84 except for one outlier. This suggests that fine-mode aerosol components have a significant and possibly dominant impact on PM2.5 [63].
Thus, this study illustrated that the GRASP/Component approach can effectively distinguish various aerosol components. The retrieval results are especially promising for identifying strongly absorbing components. For example, the derived spatial distribution of BC and BrC reasonably agrees with physical expectations and is consistent with the results of previous research works. In addition, the study showed that the concentration of ASC over a few desert areas is higher than in a coastal area. However, due to the lack of ground-based and in situ measurements required for reliable validations of the result, the accuracy of the ASC component remains to be further investigated. Furthermore, climate assessments generally rely on the Global Climate Model (GCM) which provides aerosol component including organic matter. For the moment, this component is not retrieved separately by the GRASP/component approach or other satellite retrievals. Therefore, in the future for aligning satellite components characterization with GCM forecasts, it is desirable to derive the organic aerosol as a separate aerosol component in an inversion of satellite observations.

7. Conclusions

The GRASP/component retrieval was applied to POLDER-3/PARASOL satellite remote sensing observations for characterizing the distribution of aerosol components over the NCP region during January 2012. The retrieved AOD, AAOD, AODf and kf, kc, nf, nc, FMFv were analyzed in the study. The aerosol characteristics retrieved by GRASP/component were then regripped to a new set of the components for convenience and clarity of the intercomparison. The new set of aerosol components is comprised of six main components: black carbon (BC), brown carbon (BrC), dust-like (DU), fine ammonium sulfate (ASF), coarse ammonium sulfate (ASC) and aerosol water content (AW).
The derived spatial distributions of AOD and AODf showed the domination of fine particles dominate during polluted haze events in Hebei. The regional distributions of kf, kc, nf and nc, were related to a variation of the water content and absorbing ability of aerosol particles, respectively. In addition, the retrieval results exhibited clear spectrally decreasing tendency for aerosol optical properties such as AOD, AAOD and AODf. The results of aerosol component retrieval showed a pronounced BC burden in Shanxi, reaching 2%. The highest values of BrC fraction of up to 7% occurred in Hebei. ASF were mainly detected in the Bohai Bay area. The significant presence of dust aerosol was observed mainly over the North China Plain during the winter season. The conducted validation of AOD, AAOD, AODf had fairly good agreement with ground-based measurements. The comparison of kf, kc, nf, nc values showed convincing agreement with conclusions by Zhang et al. [17]. Similarly, the following results of obtained aerosol component distribution are generally consistent with the conclusion drawn by previous research. For example, analysis of the spatial distributions of aerosol components suggested that the BC is mainly present in northwestern Shanxi. In these regards, it is noteworthy to mention that the Shanxi province disposes a rich storage of coal resources in China. The elevated concentrations of BrC are mainly detected over Beijing, Tianjin, southern Hebei and northern Shandong. The high values of BrC mass concentration (up to 127 mg/m2) can be an indication of the specificity of the primary air pollution sources in these areas.
The relationships between air quality, meteorological data and derived aerosol components were analyzed by comparing the situations during the non-haze (on 3 January 2012) and haze (on 17 January 2012) cases in the BJ region (see Figure 1). The observations showed that the mass concentrations of BrC can be two times and of ASF four times larger on a haze than non-haze day accordingly. The high values of BrC and ASF concentration corresponded to daily PM2.5 concentration values reaching up to 425 g/m3 and RH values reaching up to 80%. These values likely can be attributed to the high presence of anthropogenic pollution. Finally, the obtained results suggested that the stagnant meteorological conditions are favorable to the generation and accumulation of secondary aerosol components. The reported results are expected to be of high value for the research of climatic and atmospheric environment tendencies and patterns.

Author Contributions

Y.O. performed the inversion and prepared the paper. Z.L. conceived on the paper. Y.Z. designed the study and modification. O.D. developed the GRASP algorithm and revised the logic and expression of the paper. Y.D. gave the corrections and comments of the paper. L.L. improved the GRASP/components algorithm and gave some comments. C.C. provided the parameter information of GRASP software and provided advice on validation. D.F. provided the GRASP software. Y.X. gave advice on the design of the figures. A.L. and F.D. provided the suggestions on configuring MPI of GRASP software. Z.P. revised the language of the article. All authors have read and agreed to the published version of the manuscript.

Funding

This work was supported by the National Outstanding Youth Foundation of China (Grant No. 41925019). This work was also supported by the National Key B&R Program of China (Grant No. 2016YFE0201400). This work was also supported by the Hainan Provincial Natural Science Foundation of China (Grant NO. 418QN302). The GRASP/components algorithm was supported by the CaPPA project (Chemical and Physical Properties of the Atmosphere), funded by the French National Research Agency through the Programmed’Investissement d’Avenir under contract ”ANR-11- LABX-0005-01” and by the Regional Council Nord Pas de Calais—Picardie and the European Funds for Regional Economic Development.

Institutional Review Board Statement

Not applicable.

Informed Consent Statement

Informed consent was obtained from all subjects involved in the study.

Data Availability Statement

The data presented in this study are available on request from the corresponding author.

Acknowledgments

Thanks to the entire GRASP-OPEN (https://www.grasp-open.com/, (accessed on 4 July 2021)) team for the algorithm development. We would also like to express our thankfulness to CNES and ICARE data distribution center for POLDER/PARASOL data. We are grateful to Beijing, Xianghe, Xinglong AERONET sites for ground-based data and to the US Embassy of Beijing for providing PM2.5 observation data (https://china.usembassy-china.org.cn/, (accessed on 4 July 2021)) and meteorological stations of China Meteorological Administration (CMA).

Conflicts of Interest

The authors declare no conflict of interest. The funders had no role in the design of the study; in the collection, analyses, or interpretation of data; in the writing of the manuscript, or in the decision to publish the results.

References

  1. Richter, A.; Burrows, J.P.; Nüß, H.; Granier, C.; Niemeier, U. Increase in tropospheric nitrogen dioxide over China observed from space. Nature 2005, 437, 129–132. [Google Scholar] [CrossRef] [PubMed]
  2. Huang, R.J.; Zhang, Y.; Bozzetti, C.; Ho, K.F.; Cao, J.J.; Han, Y.; Daellenbach, K.R.; Slowik, J.G.; Platt, S.M.; Canonaco, F.; et al. High secondary aerosol contribution to particulate pollution during haze events in China. Nature 2014, 514, 218–222. [Google Scholar] [CrossRef] [PubMed]
  3. Li, W.J.; Shao, L.Y.; Buseck, P.R. Haze types in Beijing and the influence of agricultural biomass burning. Atmos. Chem. Phys. 2010, 10, 8119–8130. [Google Scholar] [CrossRef]
  4. Wang, Y.; Zhuang, G.; Sun, Y.; An, Z. The variation of characteristics and formation mechanisms of aerosols in dust, haze, and clear days in Beijing. Atmos. Environ. 2006, 40, 6579–6591. [Google Scholar] [CrossRef]
  5. Tang, L.; Zhang, Y.; Sun, Y.; Yu, H.; Jiang, R. Components and optical properties of submicron aerosol during the lasting haze period in Nanjing. Chin. Sci. Bull. 2014, 59, 1955. [Google Scholar]
  6. Han, T.; Liu, X.; Zhang, Y.; Qu, Y.; Zeng, L.; Hu, M.; Zhu, T. Role of secondary aerosols in haze formation in summer in the Megacity Beijing. J. Environ. Sci. Engl. 2015, 31, 51–60. [Google Scholar] [CrossRef]
  7. Sun, C.; Zhao, W.; Zhang, Q.; Yu, X.; Zheng, X.; Zhao, J.; Lv, M. Spatial Distribution, Sources Apportionment and Health Risk of Metals in Topsoil in Beijing, China. Int. J. Environ. Res. Public Health 2016, 13, 727. [Google Scholar] [CrossRef]
  8. Cao, J.J.; Wu, F.; Chow, J.C.; Lee, S.C.; Li, Y.; Chen, S.W.; An, Z.S.; Fung, K.K.; Watson, J.G.; Zhu, C.S. Characterization and source apportionment of atmospheric organic and elemental carbon during fall and winter of 2003 in Xi’an, China. Atmos. Chem. Phys. 2005, 5, 3127–3137. [Google Scholar] [CrossRef]
  9. Cao, J.; Lee, S.; Ho, K.F.; Zhang, X.; Zou, S.; Fung, K.; Chow, J.; Watson, J. Characteristics of carbonaceous aerosol in Pearl River Delta Region, China during 2001 winter period. Atmos. Environ. 2003, 37, 1451–1460. [Google Scholar] [CrossRef]
  10. Arola, A.; Schuster, G.; Myhre, G.; Kazadzis, S.; Dey, S.; Tripathi, S.N. Inferring absorbing organic carbon content from AERONET data. Atmos. Chem. Phys. Discuss. 2010, 10, 215–225. [Google Scholar]
  11. Li, Z.; Gu, X.; Wang, L.; Li, D.; Xie, Y.; Li, K.; Dubovik, O.; Schuster, G.; Goloub, P.; Zhang, Y.; et al. Aerosol physical and chemical properties retrieved from ground-based remote sensing measurements during heavy haze days in Beijing winter. Atmos. Chem. Phys. 2013, 13, 10171–10183. [Google Scholar] [CrossRef]
  12. Li, Z.; Li, L.; Zhang, F.; Li, D.; Xie, Y.; Xu, H. Comparison of aerosol properties over Beijing and Kanpur: Optical, physical properties and aerosol component composition retrieved from 12 years ground-based Sun-sky radiometer remote sensing data. J. Geophys. Res. Atmos. 2015, 120, 1520–1535. [Google Scholar] [CrossRef]
  13. Schuster, G.L. Inferring black carbon content and specific absorption from Aerosol Robotic Network (AERONET) aerosol retrievals. J. Geophys. Res. 2005, 110. [Google Scholar] [CrossRef]
  14. Schuster, G.L.; Bing, L.; Dubovik, O. Remote sensing of aerosol water uptake. Geophys. Res. Lett. 2009, 36. [Google Scholar] [CrossRef]
  15. Schuster, G.L.; Dubovik, O.; Arola, A. Remote sensing of soot carbon—Part 1: Distinguishing different absorbing aerosol species. Atmos. Chem. Phys. 2016, 16, 1565–1585. [Google Scholar] [CrossRef]
  16. Zhang, Y.; Li, Z.; Sun, Y.; Lv, Y.; Xie, Y. Estimation of atmospheric columnar organic matter (OM) mass concentration from remote sensing measurements of aerosol spectral refractive. Atmos. Environ. 2018, 179, 107–117. [Google Scholar] [CrossRef]
  17. Zhang, Y.; Li, Z.; Chen, Y.; de Leeuw, G.; Zhang, C.; Xie, Y.; Li, K. Improved inversion of aerosol components in the atmospheric column from remote sensing data. Atmos. Chem. Phys. 2020, 20, 12795–12811. [Google Scholar] [CrossRef]
  18. Li, L.; Dubovik, O.; Derimian, Y.; Schuster, G.L.; Lapyonok, T.; Litvinov, P.; Ducos, F.; Fuertes, D.; Chen, C.; Li, Z.; et al. Retrieval of aerosol components directly from satellite and ground-based measurements. Atmos. Chem. Phys. 2019, 19, 13409–13443. [Google Scholar] [CrossRef]
  19. Dubovik, O.; Li, Z.; Mishchenko, M.I.; Tanré, D.; Karol, Y.; Bojkov, B.; Cairns, B.; Diner, D.J.; Espinosa, W.R.; Goloub, P.; et al. Polarimetric remote sensing of atmospheric aerosols: Instruments, methodologies, results, and perspectives. J. Quant. Spectrosc. Radiat. Transf. 2019, 224, 474–511. [Google Scholar] [CrossRef]
  20. Hasekamp, O.P.; Litvinov, P.; Butz, A. Aerosol properties over the ocean from PARASOL multiangle photopolarimetric measurements. J. Geophys. Res. 2011. [Google Scholar] [CrossRef]
  21. Dubovik, O.; Herman, M.; Holdak, A.; Lapyonok, T.; Tanré, D.; Deuzé, J.L.; Ducos, F.; Sinyuk, A.; Lopatin, A. Statistically optimized inversion algorithm for enhanced retrieval of aerosol properties from spectral multi-angle polarimetric satellite observations. Atmos. Meas. Tech. 2011, 4, 975–1018. [Google Scholar] [CrossRef]
  22. Russell, P.B.; Hamill, P.; Livingston, J.M.; Shinozuka, Y.; Strawa, A.W.; Redemann, J.; Omar, A.H.; Clarke, A.D.; Bergstrom, R.W.; Holben, B. Identifying Aerosol Type from Space: Absorption Angstrom Exponent as a Foundation for Multidimensional Supervised Clustering and Mahalanobis Classification. In AGU Fall Meeting Abstracts; NASA: Washington, DC, USA, 2010. [Google Scholar]
  23. Chen, C.; Dubovik, O.; Henze, D.K.; Lapyonak, T.; Chin, M.; Ducos, F.; Litvinov, P.; Huang, X.; Li, L. Retrieval of desert dust and carbonaceous aerosol emissions over Africa from POLDER/PARASOL products generated by the GRASP algorithm. Atmos. Chem. Phys. 2018, 18, 12551–12580. [Google Scholar] [CrossRef]
  24. Chen, C.; Dubovik, O.; Henze, D.K.; Chin, M.; Lapyonok, T.; Schuster, G.L.; Ducos, F.; Fuertes, D.; Litvinov, P.; Li, L.; et al. Constraining global aerosol emissions using POLDER/PARASOL satellite remote sensing observations. Atmos. Chem. Phys. 2019, 19, 14585–14606. [Google Scholar] [CrossRef]
  25. Dubovik, O.; Lapyonok, T.; Litvinov, P.; Herman, M.; Federspiel, C. GRASP: A versatile algorithm for characterizing the atmosphere. Spienewsroom 2014, 25, 2-1201408. [Google Scholar] [CrossRef]
  26. Li, L.; Che, H.; Derimian, Y.; Dubovik, O.; Luan, Q.; Li, Q.; Huang, X.; Zhao, H.; Gui, K.; Zheng, Y. Climatology of Fine and Coarse Mode Aerosol Optical Thickness Over East and South Asia Derived From POLDER/PARASOL Satellite. J. Geophys. Res. Atmos. 2020, 125, e2020JD032665. [Google Scholar] [CrossRef]
  27. Li, L.; Che, H.; Derimian, Y.; Dubovik, O.; Zhang, X. Retrievals of fine mode light-absorbing carbonaceous aerosols from POLDER/PARASOL observations over East and South Asia. Remote Sens. Environ. 2020, 247, 111913. [Google Scholar] [CrossRef]
  28. Deschamps, P.Y.; Breon, F.M.; Leroy, M.; Podaire, A.; Bricaud, A.; Buriez, J.C.; Seze, G. The POLDER mission: Instrument characteristics and scientific objectives. IEEE Trans. Geosci. Remote Sens. 1994, 32, 598–615. [Google Scholar] [CrossRef]
  29. Deuzé, J.L.; Bréon, F.M.; Devaux, C.; Goloub, P.; Herman, M.; Lafrance, B.; Maignan, F.; Marchand, A.; Nadal, F.; Perry, G.; et al. Remote sensing of aerosols over land surfaces from POLDER-ADEOS-1 polarized measurements. J. Geophys. Res. Atmos. 2001, 106, 4913–4926. [Google Scholar] [CrossRef]
  30. Deuzé, J.L.; Goloub, P.; Herman, M.; Marchand, A.; Perry, G.; Susana, S.; Tanré, D. Estimate of the aerosol properties over the ocean with POLDER. J. Geophys. Res. Atmos. 2000, 105, 15329–15346. [Google Scholar] [CrossRef]
  31. Tanré, D.; Bréon, F.M.; Deuzé, J.L.; Dubovik, O.; Ducos, F.; François, P.; Goloub, P.; Herman, M.; Lifermann, A.; Waquet, F. Remote sensing of aerosols by using polarized, directional and spectral measurements within the A-Train: The PARASOL mission. Atmos. Meas. Tech. 2011, 4, 1383–1395. [Google Scholar] [CrossRef]
  32. Chen, C.; Dubovik, O.; Fuertes, D.; Litvinov, P.; Lapyonok, T.; Lopatin, A.; Ducos, F.; Derimian, Y.; Herman, M.; Tanré, D.; et al. Validation of GRASP algorithm product from POLDER/PARASOL data and assessment of multi-angular polarimetry potential for aerosol monitoring. Earth Syst. Sci. Data 2020, 12, 3573–3620. [Google Scholar] [CrossRef]
  33. Schutgens, N.; Dubovik, O.; Hasekamp, O.; Torres, O.; Jethva, H.; Leonard, P.J.T.; Litvinov, P.; Redemann, J.; Shinozuka, Y.; de Leeuw, G.; et al. AEROCOM and AEROSAT AAOD and SSA study—Part 1: Evaluation and intercomparison of satellite measurements. Atmos. Chem. Phys. 2021, 21, 6895–6917. [Google Scholar] [CrossRef]
  34. Holben, B.N.; Eck, T.F.; Slutsker, I.; Tanré, D.; Buis, J.P.; Setzer, A.; Vermote, E.; Reagan, J.A.; Kaufman, Y.J.; Nakajima, T. AERONET—A Federated Instrument Network and Data Archive for Aerosol Characterization. Remote Sens. Environ. 1998, 66, 1–16. [Google Scholar] [CrossRef]
  35. Lee, J.; Kim, J.; Song, C.H.; Kim, S.B.; Chun, Y.; Sohn, B.J.; Holben, B.N. Characteristics of aerosol types from AERONET sunphotometer measurements. Atmos. Environ. 2010, 44, 3110–3117. [Google Scholar] [CrossRef]
  36. Giles, D.M.; Holben, B.N.; Eck, T.F.; Sinyuk, A.; Smirnov, A.; Slutsker, I.; Dickerson, R.; Thompson, A.; Schafer, J. An analysis of AERONET aerosol absorption properties and classifications representative of aerosol source regions. J. Geophys. Res. Atmos. 2012, 117. [Google Scholar] [CrossRef]
  37. Eck, T.F.; Holben, B.N.; Reid, J.S.; Dubovik, O.; Smirnov, A.; O’Neill, N.T.; Slutsker, I.; Kinne, S. Wavelength dependence of the optical depth of biomass burning, urban, and desert dust aerosols. J. Geophys. Res. Atmos. 1999, 104, 31333–31349. [Google Scholar] [CrossRef]
  38. Yang, H.A.; Vokla, B.; Jckla, B.; Mp, B. How BLUE is the Sky? Estimating air qualities in Beijing during the Blue Sky Day period (2008–2012) by Bayesian Multi-task LSTM—ScienceDirect. Environ. Sci. Policy 2021, 116, 69–77. [Google Scholar]
  39. Guo, J.; Niu, T.; Wang, F.; Deng, M.; Wang, Y. Integration of multi-source measurements to monitor sand-dust storms over North China: A case study. Acta Meteorol. Sin. 2013, 27, 566–576. [Google Scholar] [CrossRef]
  40. Hu, X.M.; Ma, Z.Q.; Lin, W.; Zhang, H.; Hu, J.; Wang, Y.; Xu, X.; Fuentes, J.D.; Xue, M. Impact of the Loess Plateau on the atmospheric boundary layer structure and air quality in the North China Plain: A case study. Sci. Total Environ. 2014, 499, 228–237. [Google Scholar] [CrossRef]
  41. Sun, Y.; Wang, Z.; Fu, P.; Jiang, Q.; Yang, T.; Li, J.; Ge, X. The impact of relative humidity on aerosol composition and evolution processes during wintertime in Beijing, China. Atmos. Environ. 2013, 77, 927–934. [Google Scholar] [CrossRef]
  42. Wang, L.; Xin, J.; Li, X.; Wang, Y. The variability of biomass burning and its influence on regional aerosol properties during the wheat harvest season in North China. Atmos. Res. 2015, 157, 153–163. [Google Scholar] [CrossRef]
  43. Xia, X.A.; Chen, H.B.; Wang, P.C.; Zong, X.M.; Qiu, J.H.; Gouloub, P. Aerosol properties and their spatial and temporal variations over North China in spring 2001. Tellus Ser. B Chem. Phys. Meteorol. 2005, 57, 28–39. [Google Scholar]
  44. Zhao, X.J.; Zhao, P.S.; Xu, J.; Meng, W.; Pu, W.W.; Dong, F.; He, D.; Shi, Q.F. Analysis of a winter regional haze event and its formation mechanism in the North China Plain. Atmos. Chem. Phys. 2013, 13, 5685–5696. [Google Scholar] [CrossRef]
  45. Zhang, H.; Wang, Z.; Zhang, W. Exploring spatiotemporal patterns of PM2.5 in China based on ground-level observations for 190 cities. Environ. Pollut. 2016, 216, 559–567. [Google Scholar] [CrossRef]
  46. Li, J.; Wang, G.; Ren, Y.; Wang, J.; Wu, C.; Han, Y.; Zhang, L.; Cheng, C.; Meng, J. Identification of chemical compositions and sources of atmospheric aerosols in Xi’an, inland China during two types of haze events. Sci. Total Environ. 2016, 566–567, 230–237. [Google Scholar] [CrossRef]
  47. Benavent-Oltra, J.A.; Román, R.; Granados-Muñoz, M.J.; Pérez-Ramírez, D.; Ortiz-Amezcua, P.; Denjean, C.; Lopatin, A.; Lyamani, H.; Torres, B.; Guerrero-Rascado, J.L.; et al. Comparative assessment of GRASP algorithm for a dust event over Granada (Spain) during ChArMEx-ADRIMED 2013 campaign. Atmos. Meas. Tech. 2017, 10, 4439–4457. [Google Scholar] [CrossRef]
  48. Román, R.; Torres, B.; Fuertes, D.; Cachorro, V.E.; Dubovik, O.; Toledano, C.; Cazorla, A.; Barreto, A.; Bosch, J.L.; Lapyonok, T. Remote sensing of lunar aureole with a sky camera: Adding information in the nocturnal retrieval of aerosol properties with GRASP code. Remote Sens. Environ. 2017, 196, 238–252. [Google Scholar] [CrossRef]
  49. Lopatin, A.; Dubovik, O.; Fuertes, D.; Stenchikov, G.; Parajuli, S. Synergy processing of diverse ground-based remote sensing and in situ data using GRASP algorithm: Applications to radiometer, lidar and radiosonde observations. Atmos. Meas. Tech. 2020, 14, 2575–2614. [Google Scholar] [CrossRef]
  50. Espinosa, W.R.; Remer, L.A.; Dubovik, O.; Ziemba, L.; Beyersdorf, A.; Orozco, D.; Schuster, G.; Lapyonok, T.; Fuertes, D.; Martins, J.V. Retrievals of aerosol optical and microphysical properties from Imaging Polar Nephelometer scattering measurements. Atmos. Meas. Tech. 2017, 10, 811–824. [Google Scholar] [CrossRef]
  51. Dubovik, O.; Sinyuk, A.; Lapyonok, T.; Holben, B.N.; Mishchenko, M.; Yang, P.; Eck, T.F.; Volten, H.; Muñoz, O.; Veihelmann, B.; et al. Application of spheroid models to account for aerosol particle nonsphericity in remote sensing of desert dust. J. Geophys. Res. Atmos. 2006, 111. [Google Scholar] [CrossRef]
  52. Lenoble, J.; Herman, M.; Deuzé, J.L.; Lafrance, B.; Santer, R.; Tanré, D. A successive order of scattering code for solving the vector equation of transfer in the earth’s atmosphere with aerosols. J. Quant. Spectrosc. Radiat. Transf. 2007, 107, 479–507. [Google Scholar] [CrossRef]
  53. Dubovik, O. Optimization of Numerical Inversion in Photopolarimetric Remote Sensing. In Photopolarimetry in Remote Sensing; Springer: Dordrecht, The Netherlands, 2004. [Google Scholar]
  54. Choi, Y.; Ghim, Y.S. Estimation of columnar concentrations of absorbing and scattering fine mode aerosol components using AERONET data. J. Geophys. Res. Atmos. 2016, 121, 13628–13640. [Google Scholar] [CrossRef]
  55. Bohren, C.F.; Huffman, D.R. Absorption and Scattering of Light by Small Particles; John Wiley & Sons: Hoboken, NJ, USA, 2008. [Google Scholar]
  56. Wang, L.; Li, Z.; Tian, Q.; Ma, Y.; Zhang, F.; Zhang, Y.; Li, D.; Li, K.; Li, L. Estimate of aerosol absorbing components of black carbon, brown carbon, and dust from ground-based remote sensing data of sun-sky radiometers. J. Geophys. Res. Atmos. 2013, 118, 6534–6543. [Google Scholar] [CrossRef]
  57. Dubovik, O.; Holben, B.; Eck, T.F.; Smirnov, A.; Kaufman, Y.J.; King, M.D.; Tanré, D.; Slutsker, I. Variability of Absorption and Optical Properties of Key Aerosol Types Observed in Worldwide Locations. J. Atmos. Sci. 2002, 59, 590–608. [Google Scholar] [CrossRef]
  58. Davies, C.N. Size distribution of atmospheric particles. J. Aerosol. Sci. 1974, 5, 293–300. [Google Scholar] [CrossRef]
  59. Raabe, O.G. Particle size analysis utilizing grouped data and the log-normal distribution. J. Aerosol. Sci. 1971, 2, 289–303. [Google Scholar] [CrossRef]
  60. Whitey, K.T. The physical characteristics of sulfur aerosols. Atmos. Environ. 1978, 12, 135–159. [Google Scholar] [CrossRef]
  61. Aitchison, J.; Brown, J.A.C. The lognormal distribution with special reference to its uses in economics. J. Polit. Econ. 1957, 25, 142–143. [Google Scholar]
  62. Hou, W.; Li, Z.; Wang, J.; Xu, X.; Goloub, P.; Qie, L. Improving Remote Sensing of Aerosol Microphysical Properties by Near—Infrared Polarimetric Measurements Over Vegetated Land: Information Content Analysis. J. Geophys. Res. Atmos. 2018, 123, 2215–2243. [Google Scholar] [CrossRef]
  63. Zhang, X.Y.; Wang, Y.Q.; Niu, T.; Zhang, X.C.; Gong, S.L.; Zhang, Y.M.; Sun, J.Y. Atmospheric aerosol compositions in China: Spatial/temporal variability, chemical signature, regional haze distribution and comparisons with global aerosols. Atmos. Chem. Phys. 2012, 12, 779–799. [Google Scholar] [CrossRef]
  64. Zhang, X.Y.; Wang, Y.Q.; Zhang, X.C.; Guo, W.; Gong, S.L. Carbonaceous aerosol composition over various regions of China during 2006. J. Geophys. Res. Atmos. 2008, 113. [Google Scholar] [CrossRef]
  65. Ge, B.; Mei, X.; Li, Z.; Hou, W.; Xie, Y.; Zhang, Y.; Xu, H.; Li, K.; Wei, Y. An improved algorithm for retrieving high resolution fine-mode aerosol based on polarized satellite data: Application and validation for POLDER-3. Remote Sens. Environ. 2020, 247. [Google Scholar] [CrossRef]
  66. Wei, Y.; Li, Z.; Zhang, Y.; Chen, C.; Dubovik, O.; Zhang, Y.; Xu, H.; Li, K.; Chen, J.; Wang, H.; et al. Validation of POLDER GRASP aerosol optical retrieval over China using SONET observations. J. Quant. Spectrosc. Radiat. Transf. 2020, 246. [Google Scholar] [CrossRef]
  67. Streets, D.G.; Gupta, S.; Waldhoff, S.T.; Wang, M.Q.; Bond, T.C.; Bo, Y. Black carbon emissions in China. Atmos. Environ. 2002, 35, 4281–4296. [Google Scholar] [CrossRef]
  68. Wang, S.; Crumeyrolle, S.; Zhao, W.; Xu, X.; Tong, Y. Real-time retrieval of aerosol chemical composition using effective density and the imaginary part of complex refractive index. Atmos. Environ. 2021, 245, 117959. [Google Scholar] [CrossRef]
  69. Sun, H.; Biedermann, L.; Bond, T.C. Color of brown carbon: A model for ultraviolet and visible light absorption by organic carbon aerosol. Geophys. Res. Lett. 2007, 34. [Google Scholar] [CrossRef]
  70. Koven, C.D.; Fung, I. Inferring dust composition from wavelength-dependent absorption in Aerosol Robotic Network (AERONET) data. J. Geophys. Res. Atmos. 2006, 111. [Google Scholar] [CrossRef]
  71. Van Beelen, A.J.; Roelofs, G.J.H.; Hasekamp, O.P.; Henzing, J.S.; Röckmann, T. Estimation of aerosol water and chemical composition from AERONET Sun–sky radiometer measurements at Cabauw, the Netherlands. Atmos. Chem. Phys. 2014, 14, 5969–5987. [Google Scholar] [CrossRef]
  72. Xie, Y.S.; Li, Z.Q.; Zhang, Y.X.; Zhang, Y.; Li, D.H.; Li, K.T.; Xu, H.; Zhang, Y.; Wang, Y.Q.; Chen, X.F.; et al. Estimation of atmospheric aerosol composition from ground-based remote sensing measurements of Sun-sky radiometer. J. Geophys. Res. Atmos. 2017, 122, 498–518. [Google Scholar] [CrossRef]
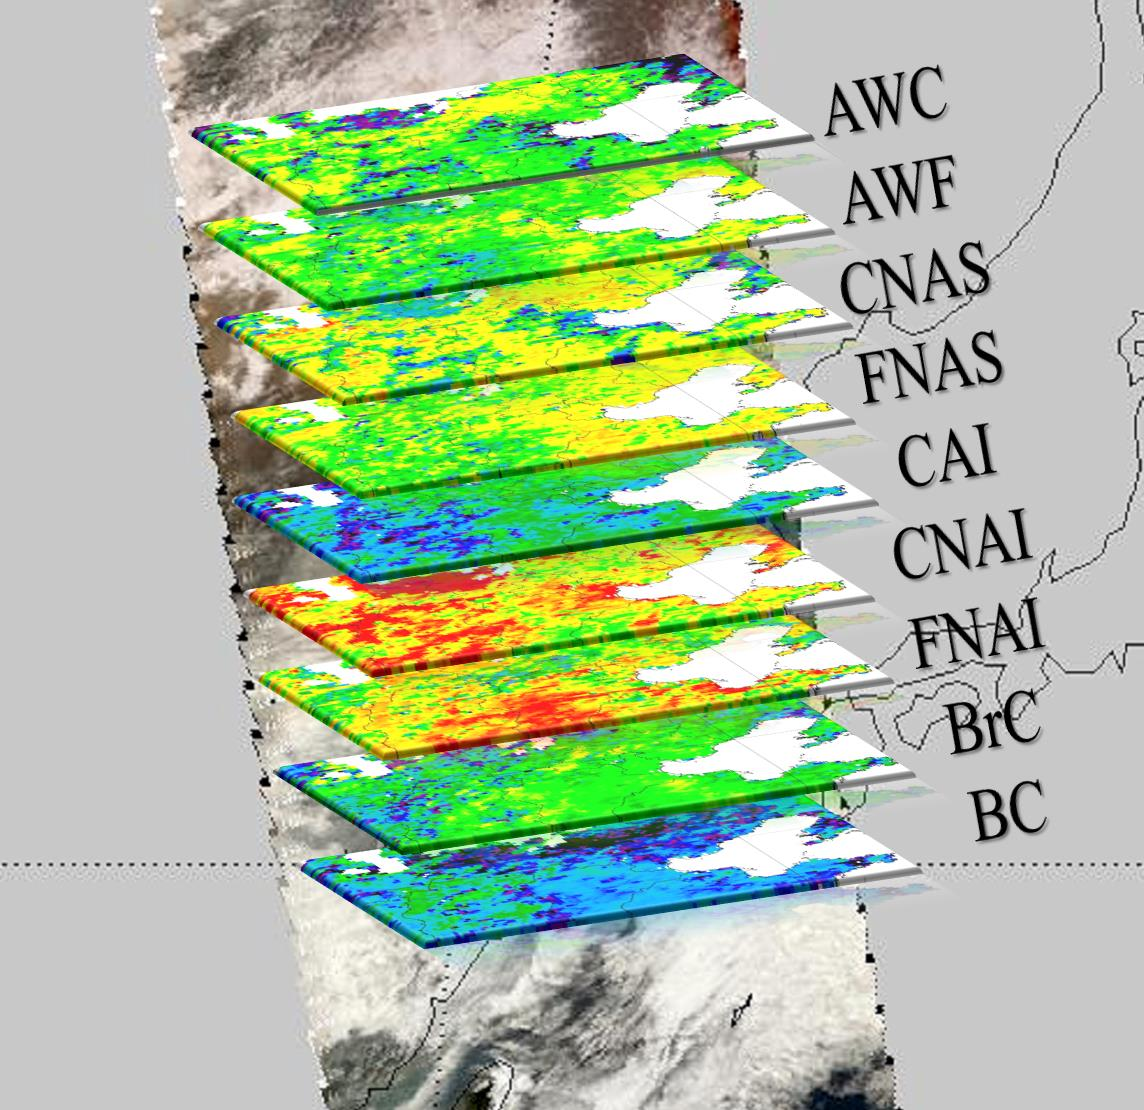
Figure 1. Number of pixels in 0.1° × 0.1° resolution observed by POLDER/PARASOL satellite over the North China Plain in January 2012. (Black points represent the AERONET sites (Beijing, Xianghe and Xinglong); red points represent the meteorological stations (Beijing and Shanxi); red square frames show the two selected regions BJ and SX, respectively.)
Remotesensing 13 02682 g001
Figure 2. Flowchart of the main retrieval steps in GRASP algorithm. (achem—fractions of components; asd—size distribution parameters; anonsph—fraction of nonsperical particles; avert—parameters of vert. profile; aBRDF—parameters of BRDF; aBPDF—parameters of BPDF).
Remotesensing 13 02682 g002
Figure 3. Monthly mean AOD, AODf, AAOD at 443, 490, 565, 670, 865, 1020 nm in January 2012 as retrieved from POLDER-3/PARASOL satellite observations.
Remotesensing 13 02682 g003
Figure 4. Monthly mean fine-mode fraction by volume in January 2012 as retrieved from POLDER-3/PARASOL satellite observations.
Remotesensing 13 02682 g004
Figure 5. Monthly imaginary refractive index of fine mode (kf) and coarse mode (kc), real refractive index of fine mode (nf) and coarse mode (nc) at 443, 490, 565, 670, 865, 1020 nm in January 2012 as retrieved from POLDER-3/PARASOL satellite observations.
Remotesensing 13 02682 g005
Figure 6. Monthly mean aerosol components mass concentrations (mg/m2) in January 2012 retrieved from POLDER-3/PARASOL satellite observations.
Remotesensing 13 02682 g006
Figure 7. The comparison of aerosol optical properties AOD retrieved in this study from POLDER-3/PARASOL and AOD provided by AERONET for three AERONET sites located in North China Plain during the period January 2012. Red points represent the 670 nm, green points represent the 865 nm and blue points represent the 1020 nm. N is the total number of results. The dotted lines are the expected error lines (EE = ±(0.05 + 15%)).
Remotesensing 13 02682 g007
Figure 8. Comparison complex refractive index derived by Zhang et al. [17] for January 2012 in Beijing and the values retrieved in present study from POLDER-3/PARASOL satellite observations. Adapted with permission from ref. [17], Copyright 2020 Atmospheric Chemistry and Physics.
Remotesensing 13 02682 g008
Figure 9. Comparison of aerosol component values reported in the literature and results of the present study for January 2012 in Beijing. The red line represents the mass fractions in this study, the yellow dash line represents the haze mass fractions of Zhang et al. [16], the blue dash line represents the haze mass fractions of Li et al. [11]. The red bar represents the mass concentration in this study, the gray bar represents the haze mass concentration of Wang et al. [56], the blue bar represents the clear mass concentration of Wang et al. [56]. Adapted with permission from ref. [11,16,56], Copyright 2013 Atmospheric Chemistry and Physics; 2018 Atmospheric Environment; 2013 Journal of Geophysical Research.
Remotesensing 13 02682 g009
Figure 10. Monthly mean mass fractions of aerosol components for typical regions in January 2012 as retrieved from POLDER/PARASOL satellite observations in BJ (A) and SX (B) region (as Figure 1).
Remotesensing 13 02682 g010
Figure 11. Evolution of meteorological parameters, PM2.5 and results of aerosol retrievals during January 2012. Time series of (A) relative humidity and (B) temperature, (C) wind speed and wind direction (D) PM2.5 (E) scale height and (F) AOD, AODf, AAOD, (G) aerosol volume size distribution.
Remotesensing 13 02682 g011
Figure 12. Time series of the daily mean of observed aerosol component mixtures, including BC, BrC, DU, ASF, SS, AW in Beijing region. The pie charts present the average aerosol component mixings for three episodes (clear, dusty and hazy) as marked in the figure.
Remotesensing 13 02682 g012
Figure 13. (A) Daily average of integral BC, BrC, FNAS, FNAI mass concentrations obtained from remote sensing retrieval compared with in situ PM2.5 measurements during January 2012 in Beijing. (B) Correlation of PM2.5 value with integral BC, BrC, FNAS, FNAI mass concentration during January 2012 in Beijing.
Remotesensing 13 02682 g013
Table 1. Abbreviations of aerosol components and optical and microphysical parameters.
AbbreviationsComponentDensities
BCblack carbonBC = 2.0 g/cm3
BrCbrown carbonBrC = 1.8 g/cm3
CAIcoarse-mode absorbing insolubleCAI = 4.77 g/cm3
CNAIcoarse-mode non-absorbing insolubleCNAI = 2.6 g/cm3
FNAIfine-mode non-absorbing insolubleFNAI = 2.6 g/cm3
FNASfine-mode non-absorbing solubleFNAS = 1.76 g/cm3
CNAScoarse-mode non-absorbing insolubleCNAS = 2.24 g/cm3
AWFaerosol water of fine-modeFAWC = 1.0 g/cm3
AWCaerosol water of coarse-modeCAWC = 1.0 g/cm3
AODaerosol optical depth
AODffine aerosol optical depth
AAODabsorbing aerosol optical depth
CRIcomplex refractive indices
nfreal part of CRI for fine mode
ncreal part of CRI for coarse mode
kfimaginary part of CRI for fine mode
kcimaginary part of CRI for coarse mode
FMFvfine-mode fraction by volume
Table 2. Monthly mean aerosol optical microphysical properties and components of BJ and SX case study (BJ and SX regions in Figure 1). Max is the maximum, min is the minimum, SD is the standard error deviation.
BJ SX
MaxMeanMinSDMaxMeanMinSD
AOD (670 nm)1.090.960.411.560.940.910.460.77
AODf (670 nm)0.940.820.321.410.500.450.210.43
AAOD (670 nm)0.010.010.010.010.010.010.000.01
kf (670 nm)0.0140.0060.0020.000.0460.0220.0040.02
kc (670 nm)0.0010.0000.0000.000.0000.0000.0000.00
nf (670 nm)1.521.451.400.031.561.501.400.02
nc (670 nm)1.561.511.430.031.541.501.410.00
FMFv0.790.780.600.080.640.620.380.20
Scale height (m)4316415730571168479144642710980
BC (mg/m2)259228329324
BrC (mg/m2)271127345311333318
DU (mg/m2)3277100817523334231608399299
ASF (mg/m2)737381531284101301153
ASC (mg/m2)664200301297611676126
AW (mg/m2)9664106583858230764
Publisher’s Note: MDPI stays neutral with regard to jurisdictional claims in published maps and institutional affiliations.

