Abstract
An improved semantic segmentation method based on object contextual representations network (OCRNet) is proposed to accurately identify zucchinis intercropped with sunflowers from unmanned aerial vehicle (UAV) visible images taken over Hetao Irrigation District, Inner Mongolia, China. The proposed method improves on the performance of OCRNet in two respects. First, based on the object region context extraction structure of the OCRNet, a branch that uses the channel attention module was added in parallel to rationally use channel feature maps with different weights and reduce the noise of invalid channel features. Secondly, Lovász-Softmax loss was introduced to improve the accuracy of the object region representation in the OCRNet and optimize the final segmentation result at the object level. We compared the proposed method with extant advanced semantic segmentation methods (PSPNet, DeepLabV3+, DNLNet, and OCRNet) in two test areas to test its effectiveness. The results showed that the proposed method achieved the best semantic segmentation effect in the two test areas. More specifically, our method performed better in processing image details, segmenting field edges, and identifying intercropping fields. The proposed method has significant advantages for crop classification and intercropping recognition based on UAV visible images, and these advantages are more substantive in object-level evaluation metrics (mIoU and intercropping IoU).
1. Introduction
Intercropping is an agronomic method that aims to make full use of the growing space and environmental resources of farmland by planting two or more crops in the same field for a long growing season [1,2,3,4]. Zucchini and sunflower are the two main crops in the Hetao Irrigation District of Inner Mongolia, China. Intercropping of these two crops is also a new planting mode that the region has been promoting in recent years. Zucchinis intercropped with sunflowers have many advantages in agricultural production practice. The sowing date of zucchinis is about 30 days earlier than that of sunflowers. The marginal effect of zucchinis is obvious in the early stage, which is conducive to promoting root development and seedling robustness in zucchinis, increasing the rate of single plant setting and laying the foundation for high yield. Sunflowers are sown in early June and are as tall as zucchinis from July 10 to July 15. During this period, zucchinis are in the fruit-setting period, and the growth of the two crops does not affect each other. Sunflowers mature around 20 September, and the real symbiotic period of the two crops is 65–70 days. Benefitting from this intercropping system, the grain yield of sunflowers increases significantly. In addition, the intercropping of these two crops can reduce the occurrence of powdery mildew, viruses, and aphids in zucchinis, and verticillium wilt and sclerotinia disease in sunflowers [5]. With the continuous expansion of the intercropping scale of zucchinis and sunflowers in the Hetao Irrigation District, the automatic and accurate acquisition of the distribution and proportion of intercropping fields will help to estimate the yield of the intercropping area and provide a basis for the adjustment of agricultural planting structure.
The rapid acquisition of data concerning crop category and distribution is an important domain of remote sensing technology applied to agricultural monitoring [6,7]. The use of remote sensing technology to monitor crops mainly includes satellite remote sensing and UAV remote sensing [8]. Satellite remote sensing covers a large area and has a short revisit period. It is often used for regular monitoring in large areas [9]. Liu et al. [10] estimated the area of intercropping tobacco in the mountainous area of Linyi Yishui County based on a Ziyuan-3 satellite remote sensing image. Wang et al. [11] extracted information concerning intercropped cotton in Kashgar, Xinjiang based on Quick Bird and GF-1 remote sensing images. These studies tended to use object-based analysis methods. This type of method usually requires manual and repeated adjustment of the segmentation threshold to achieve a better segmentation effect; otherwise, it would cause over- or under-segmentation [12,13,14]. At the same time, satellite remote sensing is easily affected by weather (clouds), and the effectiveness of data acquisition cannot be guaranteed. In addition, due to the low spatial resolution of remote sensing images, it is difficult for satellite remote sensing to meet the requirements of agricultural applications in terms of monitoring accuracy. UAV remote sensing has the advantages of good mobility, little environmental impact, and high spatial resolution; it has been widely used in precision agricultural information acquisition [15,16,17]. However, there are few reports about intercropping recognition based on UAV remote sensing. Although the object-based analysis method can also be used for UAV remote sensing images with high spatial resolution [18], when the segmentation threshold cannot be determined automatically and accurately, this type of method is significantly affected by human subjectivity and has the problem of low degree of automation.
The data-driven deep learning algorithm has the advantages of a high degree of automation, stability, and strong generalization [19] that has been applied to many aspects, such as lost persons search and rescue [20], tourist identification [21], road extraction [22], and animal behavior monitoring [23]. It can thus solve the above problems well. In the past five years, semantic segmentation algorithms have developed rapidly in the field of deep learning. At the same time, they have gradually spread to the field of remote sensing. Fully Convolutional Networks (FCN) [24] is a pioneering work where a deep convolutional neural network is applied to semantic segmentation. It changes the fully connected layer of the deep neural network used for image classification to a convolutional layer, and it proposes an end-to-end semantic segmentation network model. Huang et al. [25] applied FCN and object-based analysis to UAV image weed recognition. The results showed that the mIoU of FCN on the test set was 13.6% higher than that of the object-based analysis method. However, the FCN method ignored high-resolution low-level semantic features and lost the edge information of the object, so there is a problem of poor edge segmentation [26,27]. UNet [28] and SegNet [29] are the two earliest typical encoder–decoder structure networks. They fuse low-level semantic features with high-level semantic features through skip connection structures, and they improve the edge segmentation. Yang et al. [30] applied SegNet, FCN, and SVM to the recognition of UAV images of plastic mulched farmland, and the results showed that SegNet achieved the highest average accuracy among the three methods. However, some research [31] has proposed that the fusion method of skip connection destroys high-level semantic information and causes over-segmentation. Additionally, the above networks do not take into account the relationships between pixels, namely context information, and there are issues in terms of space consistency.
At present, research on constructing context information is mainly divided into two categories. The first category is multi-scale context networks. Taking PSPNet [32] and Deeplabv3+ [33] as examples, they extract features at different scales through a feature pyramid module and a pyramid pooling module with dilated convolution, respectively, and they obtain context information by means of multi-scale feature fusion. Zhang et al. [34] used the improved PSPNet to identify farmland in remote sensing images, and the overall accuracy reached 92.31%. Yang et al. [35] used DeeplabV3+ to obtain the crop area of remote sensing images, and the overall accuracy and Kappa reached 95% and 0.90, respectively. The second type is relational context networks. NLNet [36], GCNet [37], and DNLNet [38], for example, establish global context relationships by paying attention to all pixels in the image and taking their weighted average value in the embedded space to represent the response at a certain position in the image. OCRNet [39] represents the latest research on relational context networks. When it constructs context information, it considers pixels as the basis of a region, and enhances the representation of pixels through the relationship between pixels and regions. Compared with multi-scale context networks and relational context networks, OCRNet explicitly enhances the contribution of pixels from the same type of object, and the context information obtained is more targeted.
However, OCRNet ignores the correlation of channel features, and different channel features have different effects on the semantic segmentation results [40]. Therefore, we calculated the weights of different channel features by adding channel attention modules on the OCRNet, which helps to improve the accuracy of semantic segmentation. In addition, semantic segmentation only focuses on pixel-level classification, but lacks the optimization of object-level classification [31]. Thus, we used a mixed loss function composed of cross-entropy loss and Lovász-Softmax loss to supervise the training process at the pixel and object levels, respectively. In this work, we propose an improved OCRNet semantic segmentation method to accurately identify the intercropping fields of zucchinis and sunflowers in UAV images.
2. Materials and Methods
The overall technical scheme of this research is shown in Figure 1. It includes five main steps. The first step is collecting UAV remote sensing images in the study area. The second step is splicing the remote sensing images to obtain the orthoimages covering the study area. The third step is labeling (background, intercropping field, sunflower, zucchini, and corn) and cropping the UAV orthoimages to obtain the sample images of 256 × 256 pixels, which are used to generate training and test datasets. The fourth step is building the semantic segmentation network, including HRNet and the improved OCRNet, and training the network by using the training dataset. Finally, the fifth step is evaluating the segmentation results by using the ground truth labels and classification results of the test region. The classification results are spliced by the prediction results of the test dataset.
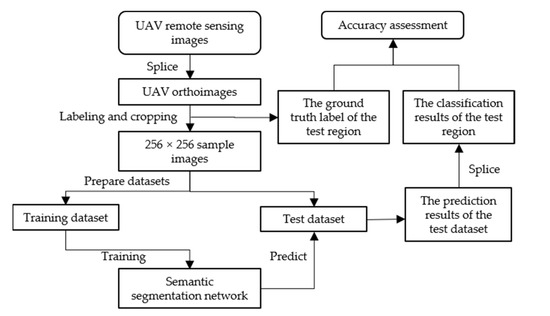
Figure 1.
Flowchart of intercropping recognition by improved OCRNet using UAV visible images.
2.1. Study Area and Data Collection
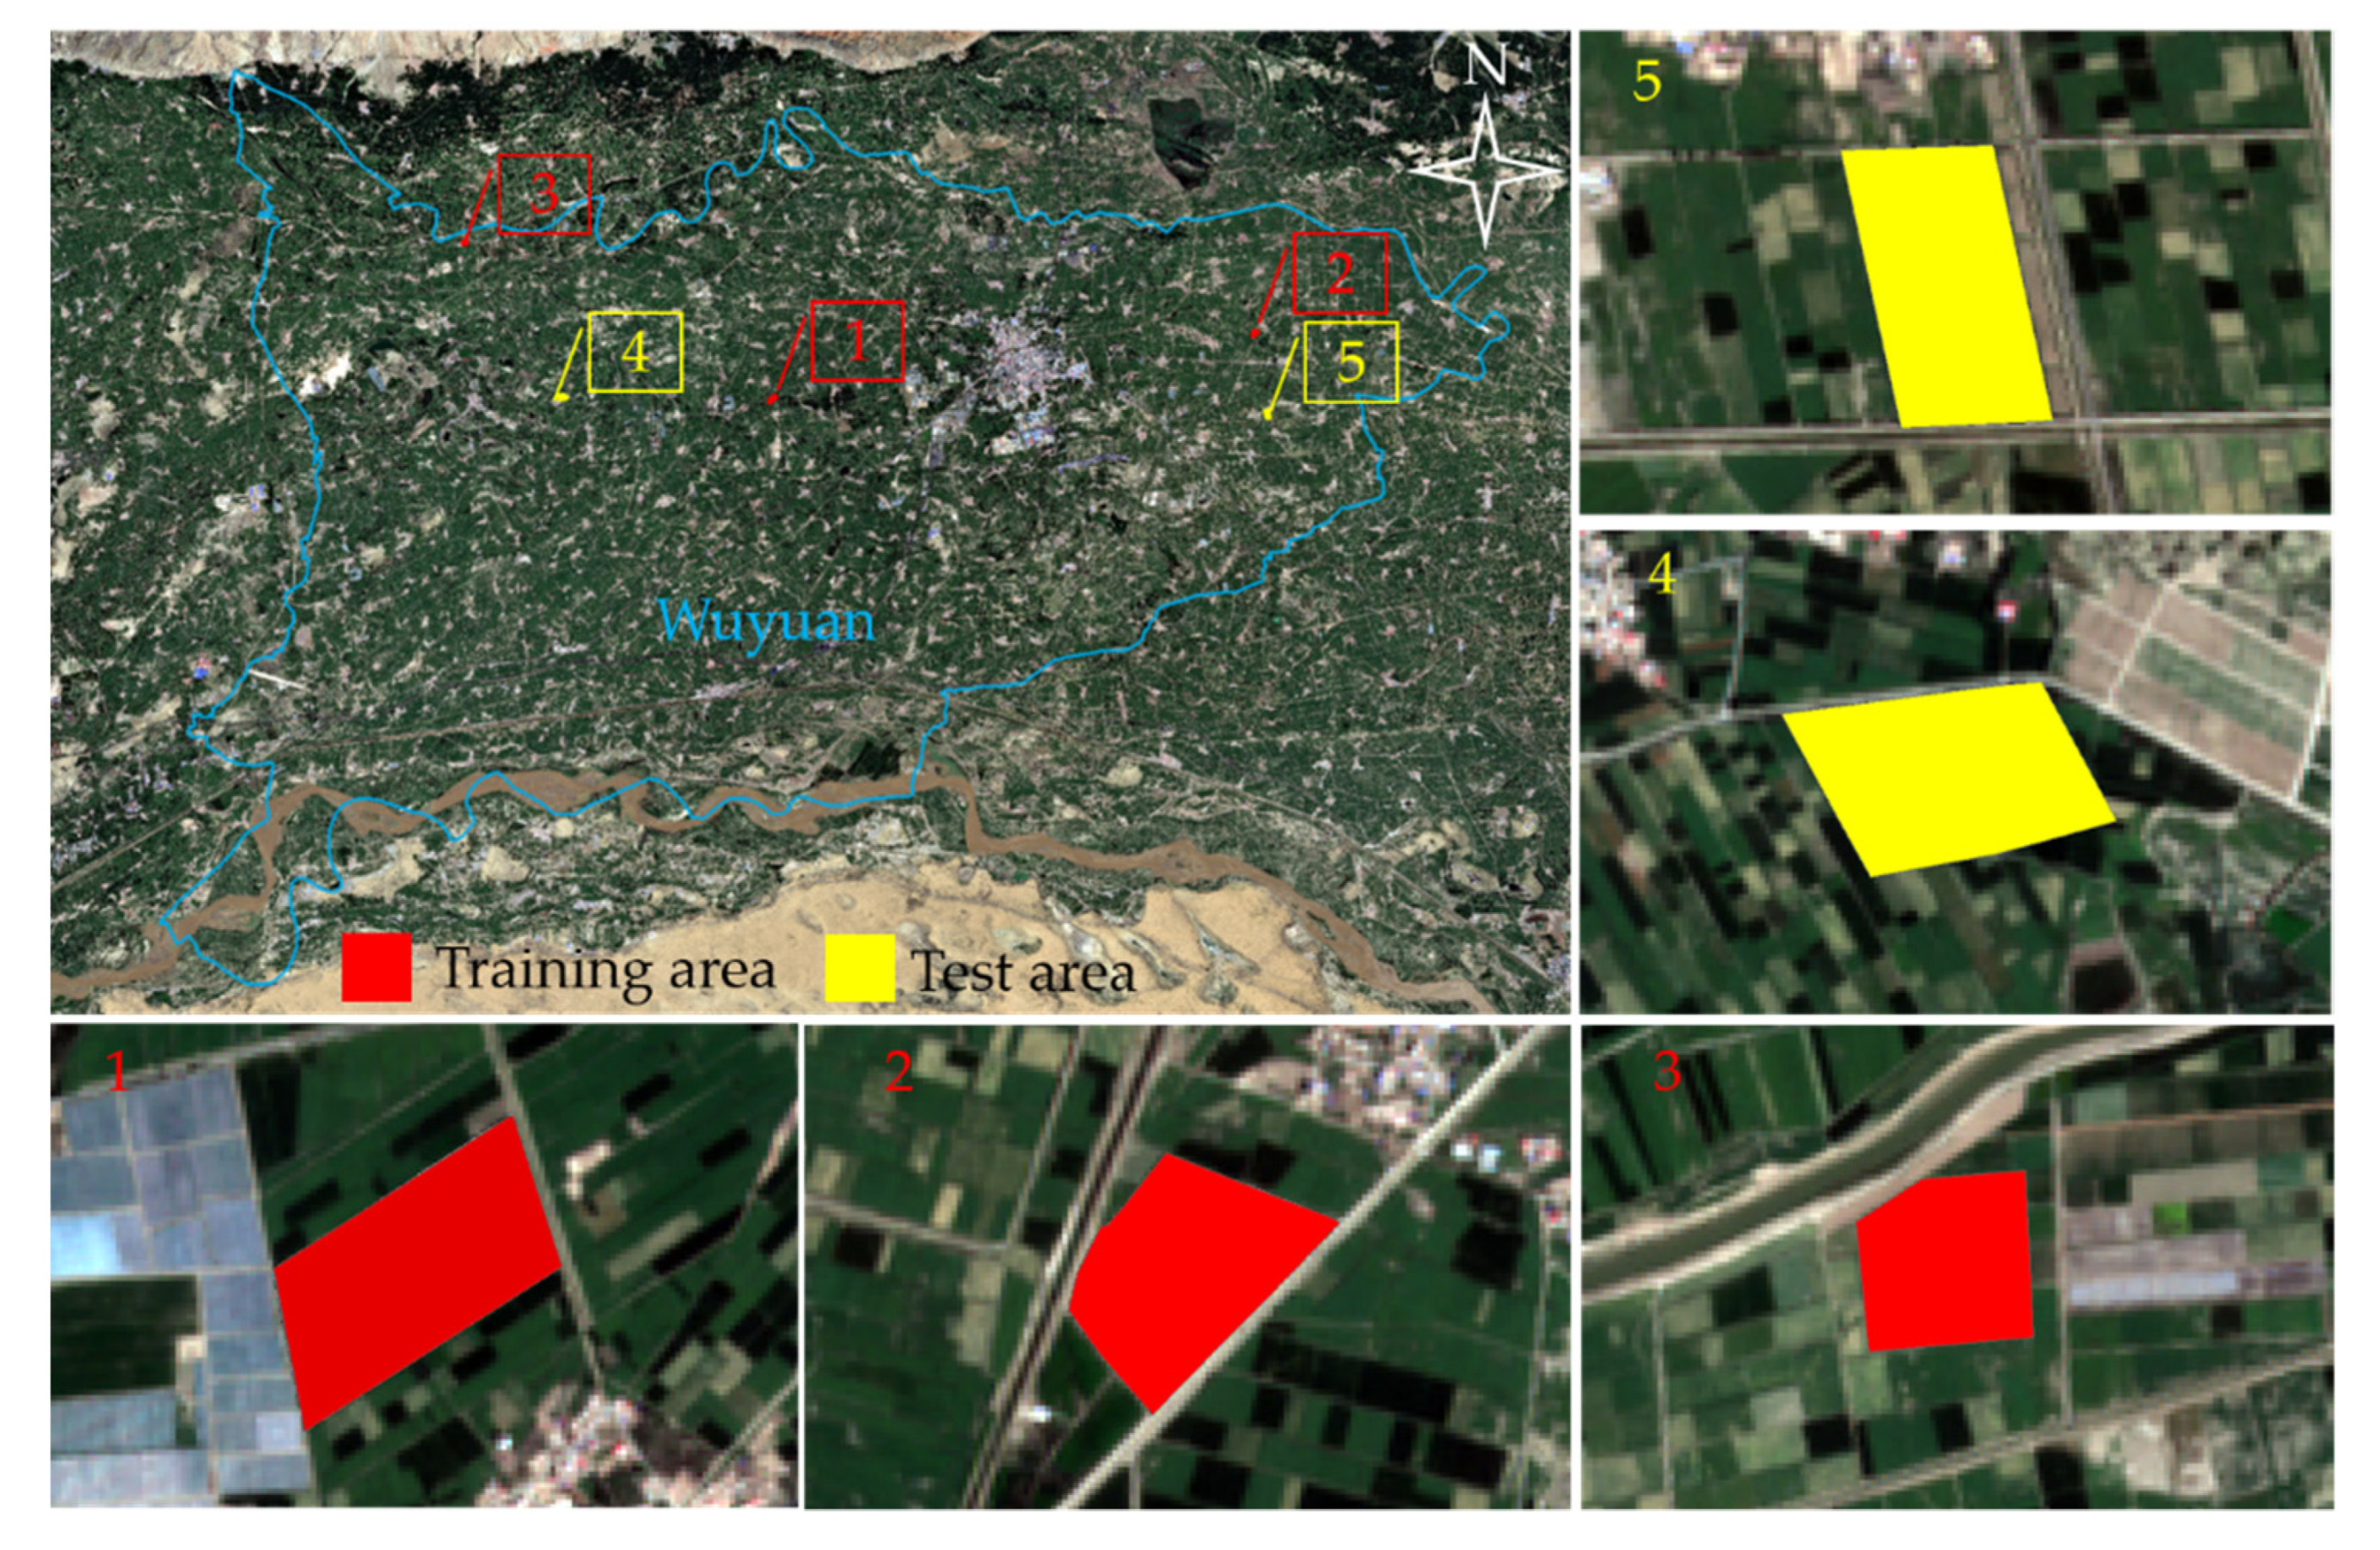
The study area is located in Wuyuan County, Bayannur City, Inner Mongolia Autonomous Region, China (40°46′30″~41°16′45″N, 107°35′70″~108°37′50″E). It is a typical large agricultural county in China. The total land area of Wuyuan County is 249,300 hectares, including 109,700 hectares of arable land, 87,320 hectares of cultivated land, 66,700 hectares of removable medium-low yield land, 66,700 hectares of pre-development wasteland, 2780 hectares of orchards, 12,000 hectares of woodland, and 20,000 hectares of grassland. The per capita arable land area is 0.408 hectares. Zucchinis and sunflowers are the main crops planted in Wuyuan County. Zucchini intercropping sunflower cultivation technology has been widely promoted in Wuyuan County in recent years. We selected 5 cultivated land regions with intercropping mode in Wuyuan County as the UAV remote sensing operation areas (Figure 2).
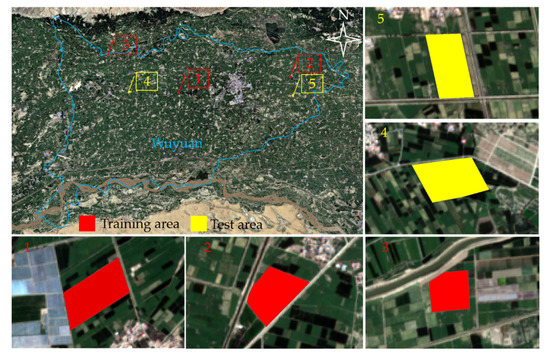
Figure 2.
Remote sensing data acquisition area of UAV.
The multi-sensor UAV remote sensing monitoring system independently developed by our laboratory was used for image acquisition. The multi-sensor UAV remote sensing system consists of a DJI S900 framework, a DJI A3 flight control system, MOY brushless pan-tilt, a RedEdge multi-spectral camera, and other components. The flight control system ensures that the UAV flies safely and stably. The brushless pan-tilt ensures camera stability during flight, avoiding geometric distortion and large fluctuations in imaging angle. The pixel size of the multispectral camera is 1280 960, the focal length is 5.5 mm fixed lens, and the field of view is 47.2° HFOV. In one shot, 5 bands of remote sensing images can be obtained: B (475 nm), G (560 nm), R (668 nm), Red Edge (717 nm), and NIR (840 nm). Images were obtained on 26 July 2020, 27 July 2020, 28 July 2020, 2 August 2020, and 9 August 2020. During the experiment, the UAV’s flying height was set to 100 m, the heading overlap was set to 88%, the side overlap was set to 84%, and shots were taken at equal intervals according to the pre-planned area and route. These settings were used in DJI GS Pro. To reduce the influence of solar altitude, the flight mission was completed between 11:00 and 13:00 to obtain remote sensing images.
2.2. UAV Image Processing
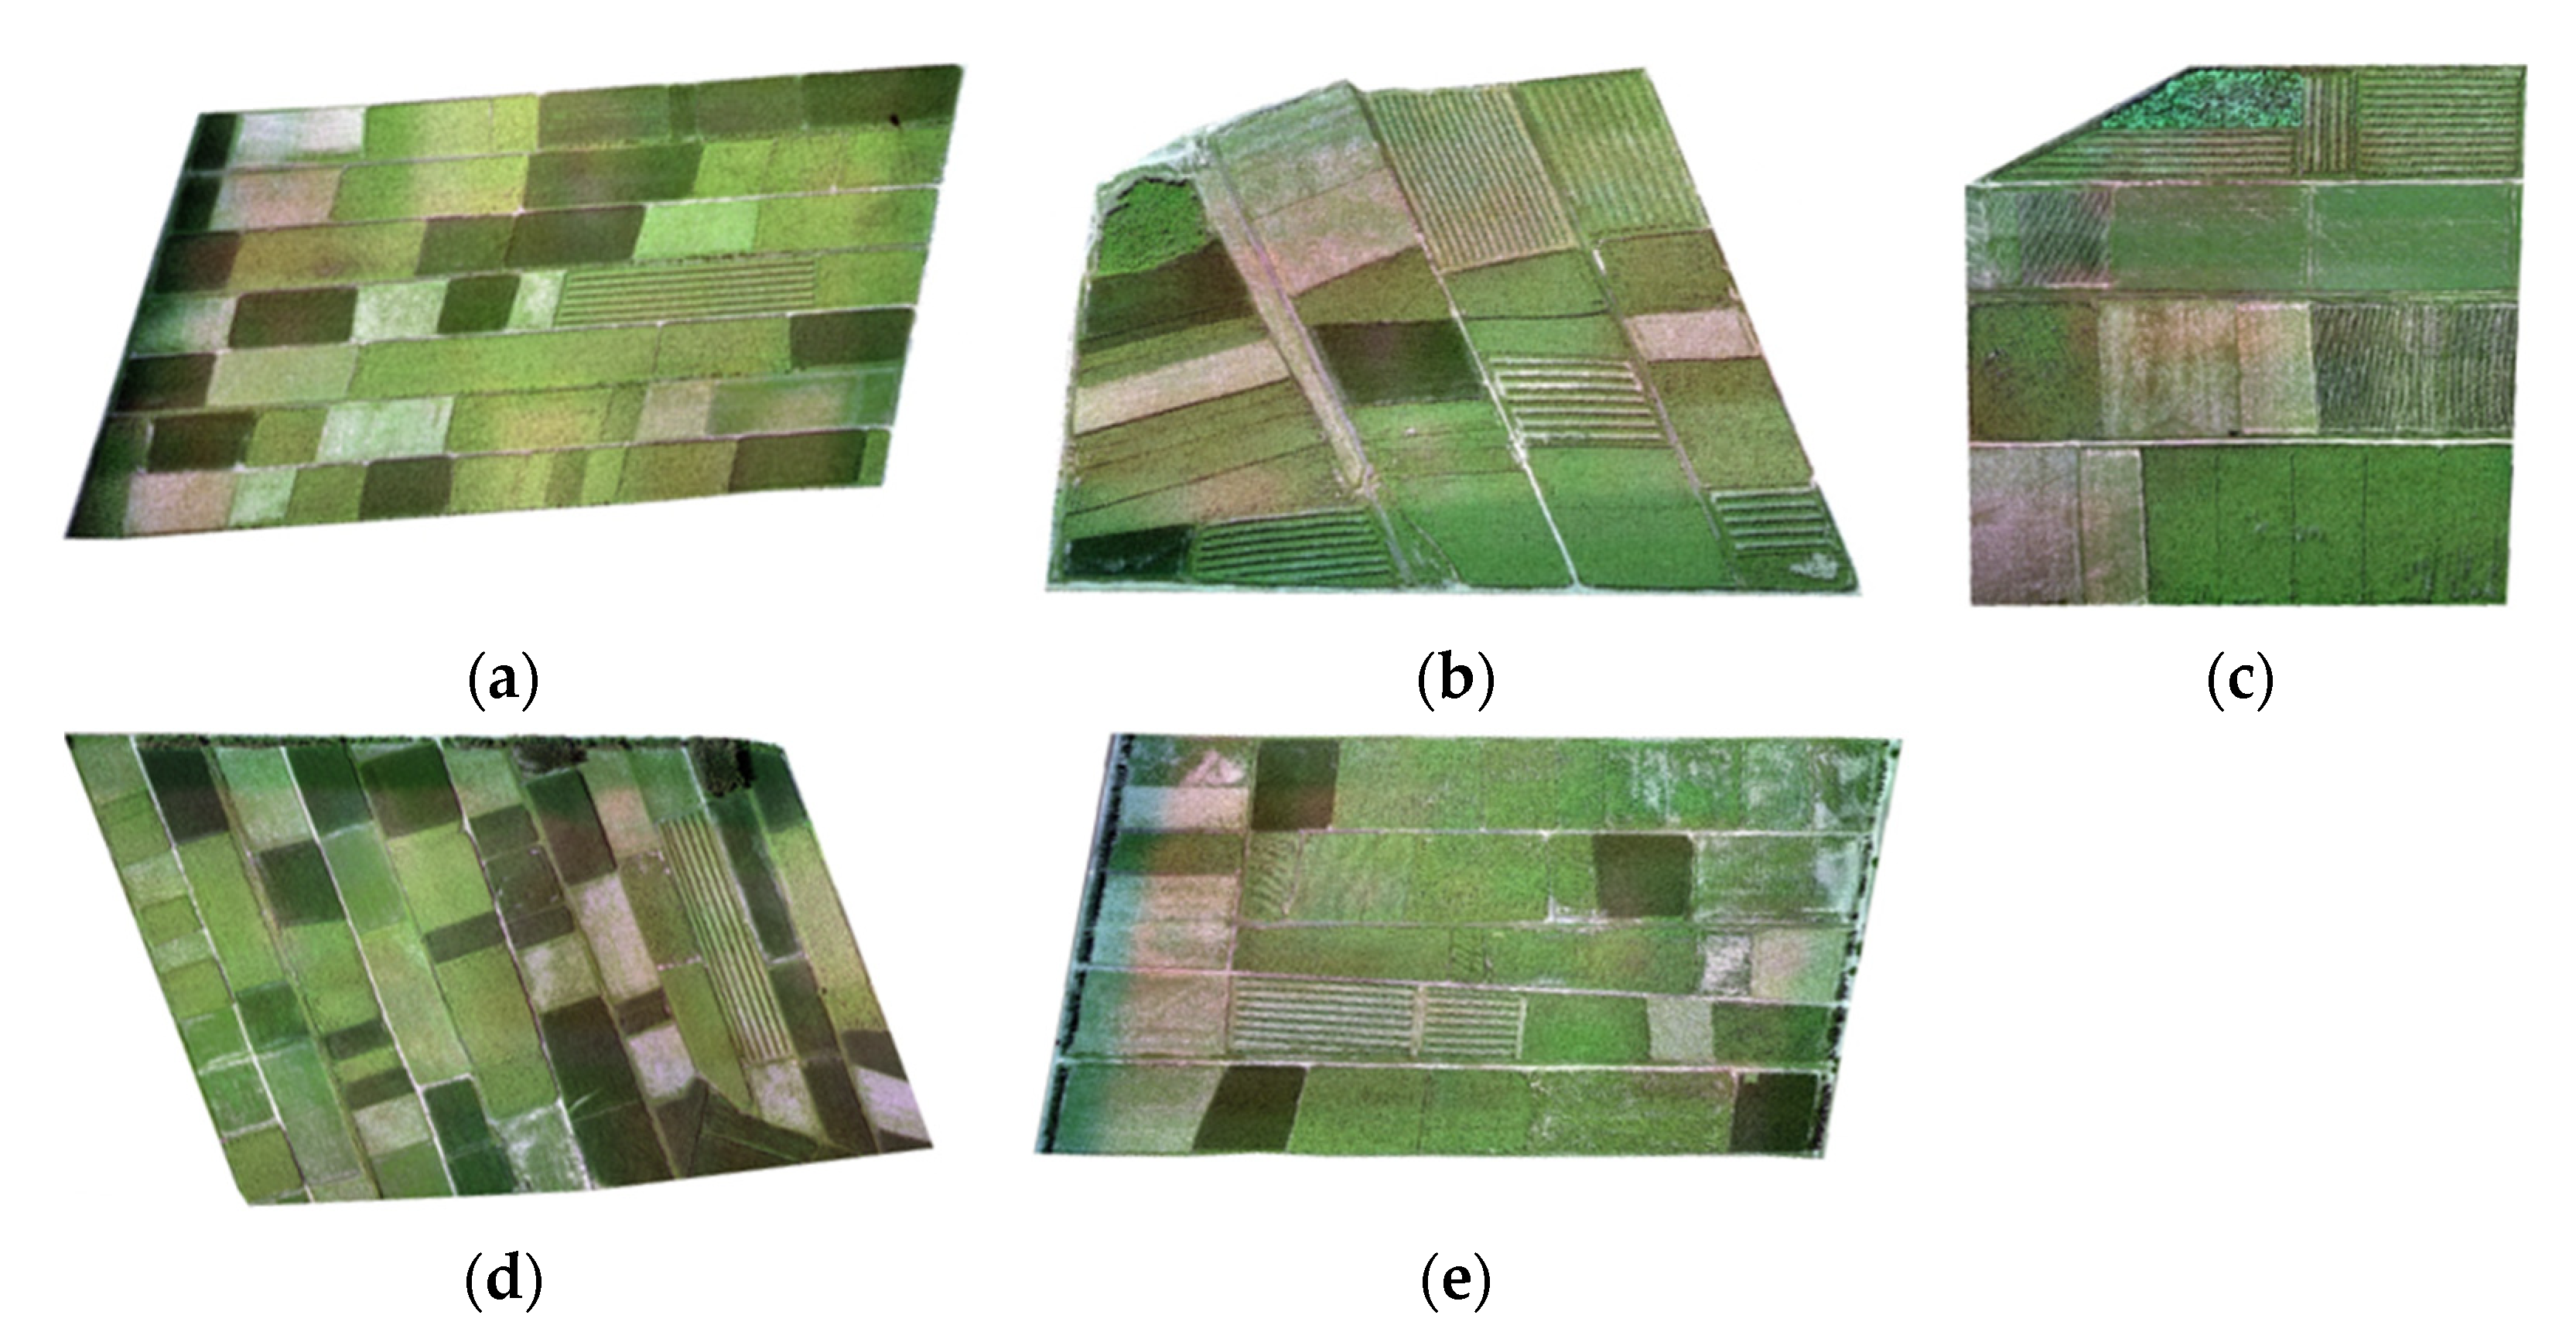
Pix4Dmapper was used to splice the original image to obtain orthoimages of these 5 regions. First, the original image was imported into Pix4Dmapper, the output coordinate system was set to China 2000, and the camera mode was set to RedEdge. The wizard was completed to generate agricultural multispectral orthoimages. Before the start of the splicing program, the picture of the reflectance correction board before the UAV flight was imported and the reflectance correction coefficient was set. After the first stage of the splicing program, geometric correction of the multi-spectral image is required. First, the ground control point coordinates are imported into Pix4Dmapper; then, the corresponding position of the ground control point coordinates are found in the original image and finally marked. After the splicing program is completed, the UAV orthoimage, 3D point cloud, DSM, and DTM can be obtained. This study mainly used RGB orthoimages with a spatial resolution of 7.5 cm to identify zucchinis intercropped with sunflowers. Considering the limited number of orthoimages collected in this paper, three orthoimages were randomly selected to generate the training dataset, and the remaining two were used for the test dataset, as shown in Figure 3, where Figure 3a–c were used as training data and Figure 3d,e were used as test data. The dataset splitting strategy refers to references [30,41].

Figure 3.
The UAV orthoimages collected on different dates. (a) 27 July 2020, (b) 28 July 2020, (c) 9 August 2020, (d) 26 July 2020, and (e) 2 August 2020.
2.3. Training and Test Datasets
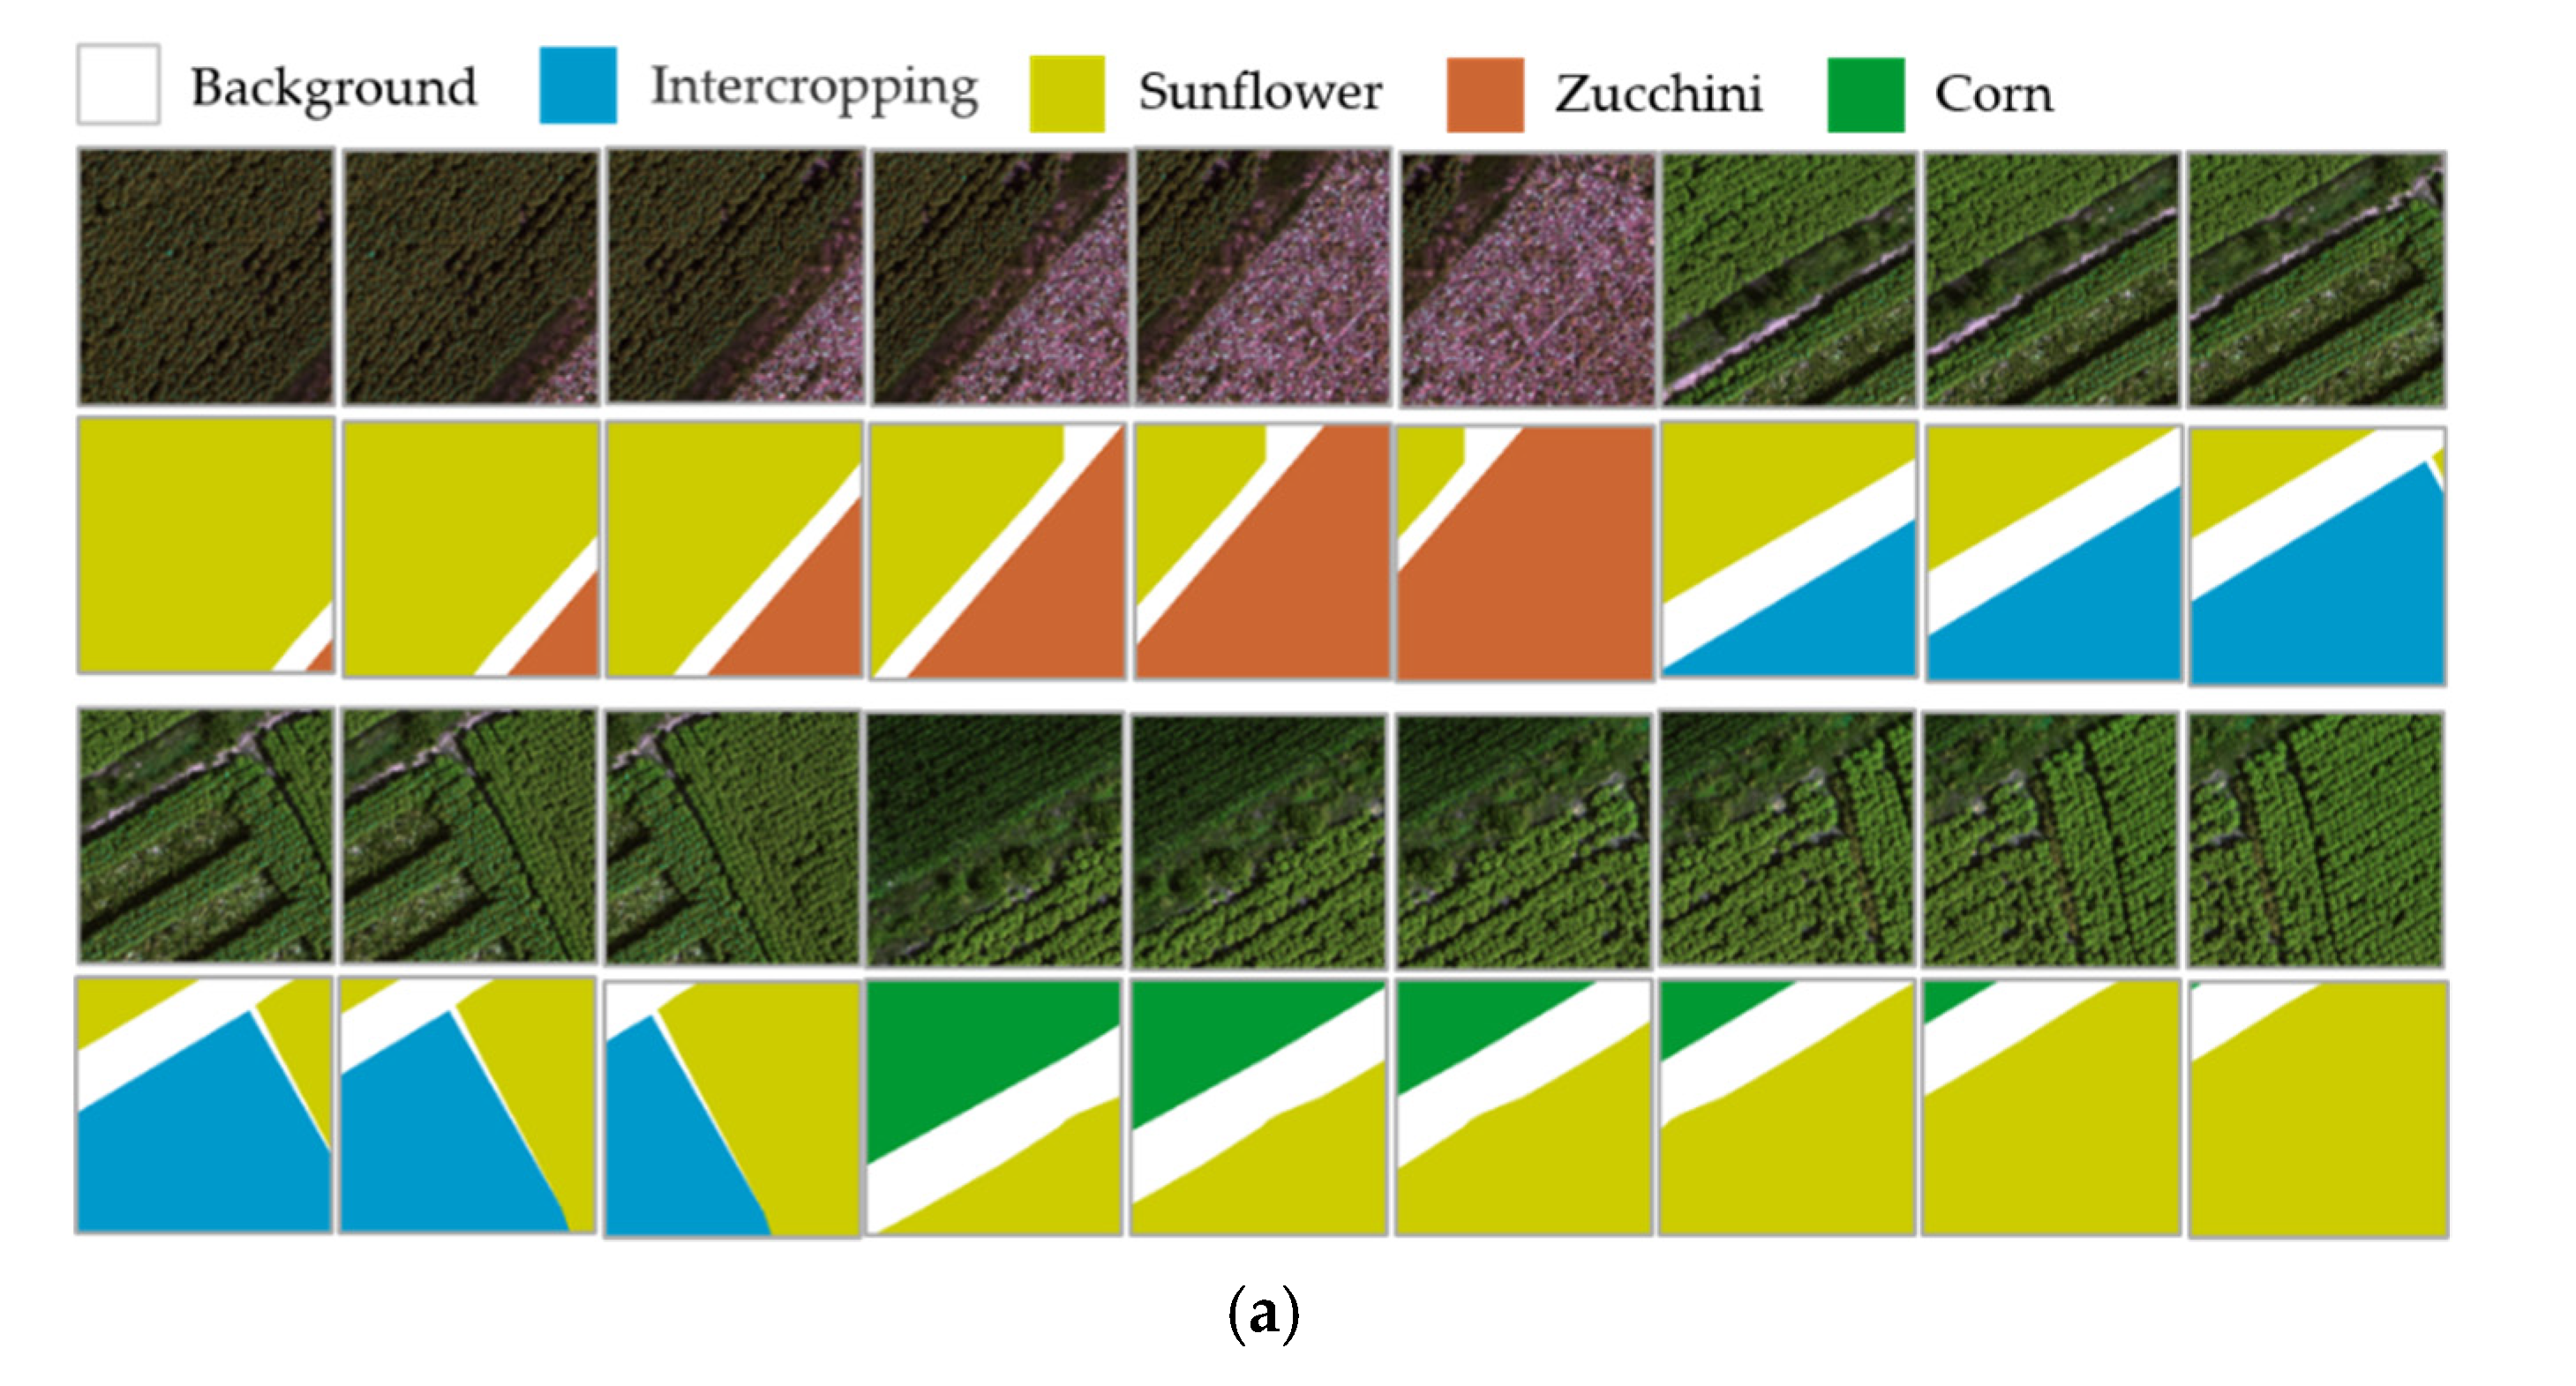
The production process of the dataset is shown in Figure 4. First, the orthoimage should be labeled before constructing the semantic segmentation dataset. The reference basis for labeling was field surveys using a handheld GPS and visual interpretation of UAV high-resolution visible images. Secondly, the ground truth label and orthoimage were used to make the dataset at the same time. Though the semantic segmentation network can train any sized images, the size of the orthoimage far exceeds the load capacity of the GPU memory, so it is necessary to crop the orthoimage when making the dataset. The cropped images had a 256 × 256 pixel size. However, the cropped images make features on the image boundary incomplete, which reduces the accuracy of the image boundary, and the same crop in two adjacent images may be identified as two different crops. Therefore, the training dataset was generated by cropping the orthoimage line by line with a certain overlap rate. The way of making a dataset is also an effective data augmentation technique [42,43]. When cropping the orthoimage of the training area, an overlap area of 75% was set. In other words, there was a 192-pixel overlap between two adjacent images, as shown in Figure 5a. Similarly, to reduce the boundary splicing effect, when cropping the orthoimage of the test area, the overlap area of 75% was also set, as shown in Figure 5b. Finally, the test dataset was predicted by the network model, and the prediction results were spliced into the classification results of the test region, which were used for accuracy evaluation. The splicing algorithm of prediction results with a certain overlap was described in reference [44]. The total number of samples of the training dataset and the test dataset were 27,130 and 16,800, respectively. The specific information is shown in Table 1.
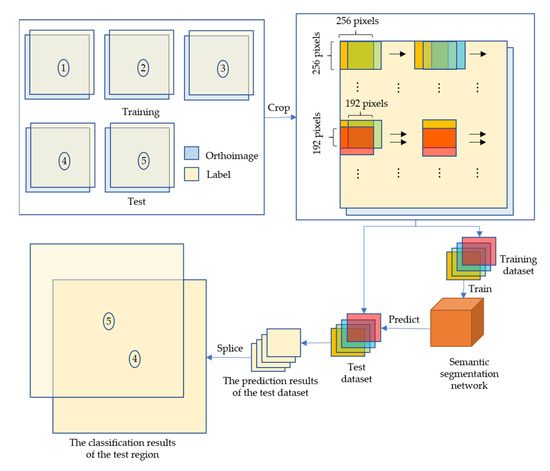
Figure 4.
Flowchart of production datasets.

Figure 5.
Sample images of cropping ground truth and orthoimage images into 256 × 256 pixels. (a) Training dataset and (b) test dataset.

Table 1.
Details of training and test datasets.
2.4. Methods
2.4.1. Backbone
OCRNet uses ResNet-101 (with output stripe 8) or HRNet-W48 (with output stripe 4) as the backbone network. To avoid the problem of feature map resolution reduction and spatial information loss due to network deepening, HRNet-W48 [45] was employed as the backbone of the semantic segmentation model. As shown in Figure 6, the key characteristic of HRNet is the parallel connection structure. It starts from a high-resolution subnet and gradually increases the number of subnets from high resolution to low resolution, to form a parallel network in which high- and low-resolution features can be fully integrated. The network structure of HRNet includes n stages and n branches (here, n was set to 4). After the images are input, two 3 × 3 convolution operations with a step size of 2 reduce the resolution to 1/4 and increase the number of channels of the convolutional layer to 64 (see Stem section in Figure 6). The channel number C in Figure 6 has multiple choices (18, 30, 32, 40, 44, and 48). For example, when C is 48, it means that HRNet is HRNet-W48. In different branches, the number of channels is set to C, 2C, 4C, and 8C, and the corresponding resolution is set to H/4 × W/4, H/8 × W/8, H/16 × W/16, and H /32 × W/32. The resolution decreases with the number of channels, which is helpful for reducing the computation and memory load of the GPU. Between the two stages, HRNet has performed the feature fusion of the high-resolution subnet and low-resolution subnet many times. This multiple multi-scale feature fusion method enables each high-resolution to low-resolution representation to repeatedly receive information from other parallel representations to obtain rich high-resolution representations. Importantly, it does not directly fuse the high-level semantic features with the low-level semantic features through a skip connection method; doing so would destroy the semantic information of the high-level semantic features and cause over-segmentation. At the end of the HRNet network, the feature maps output by different branch subnets are sampled to the same size as the output of the first branch subnet (H/4 × W/4), and they are fused through channel connection, as the backbone output result.
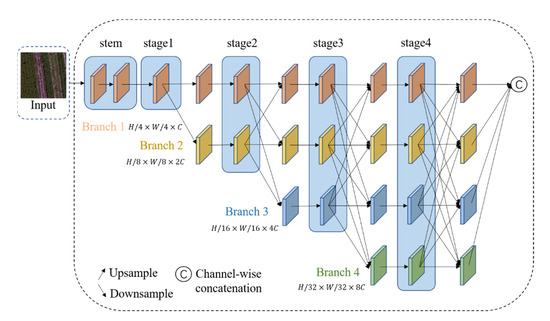
Figure 6.
The backbone network of the semantic segmentation model: HRNet.
2.4.2. Improved OCR Method
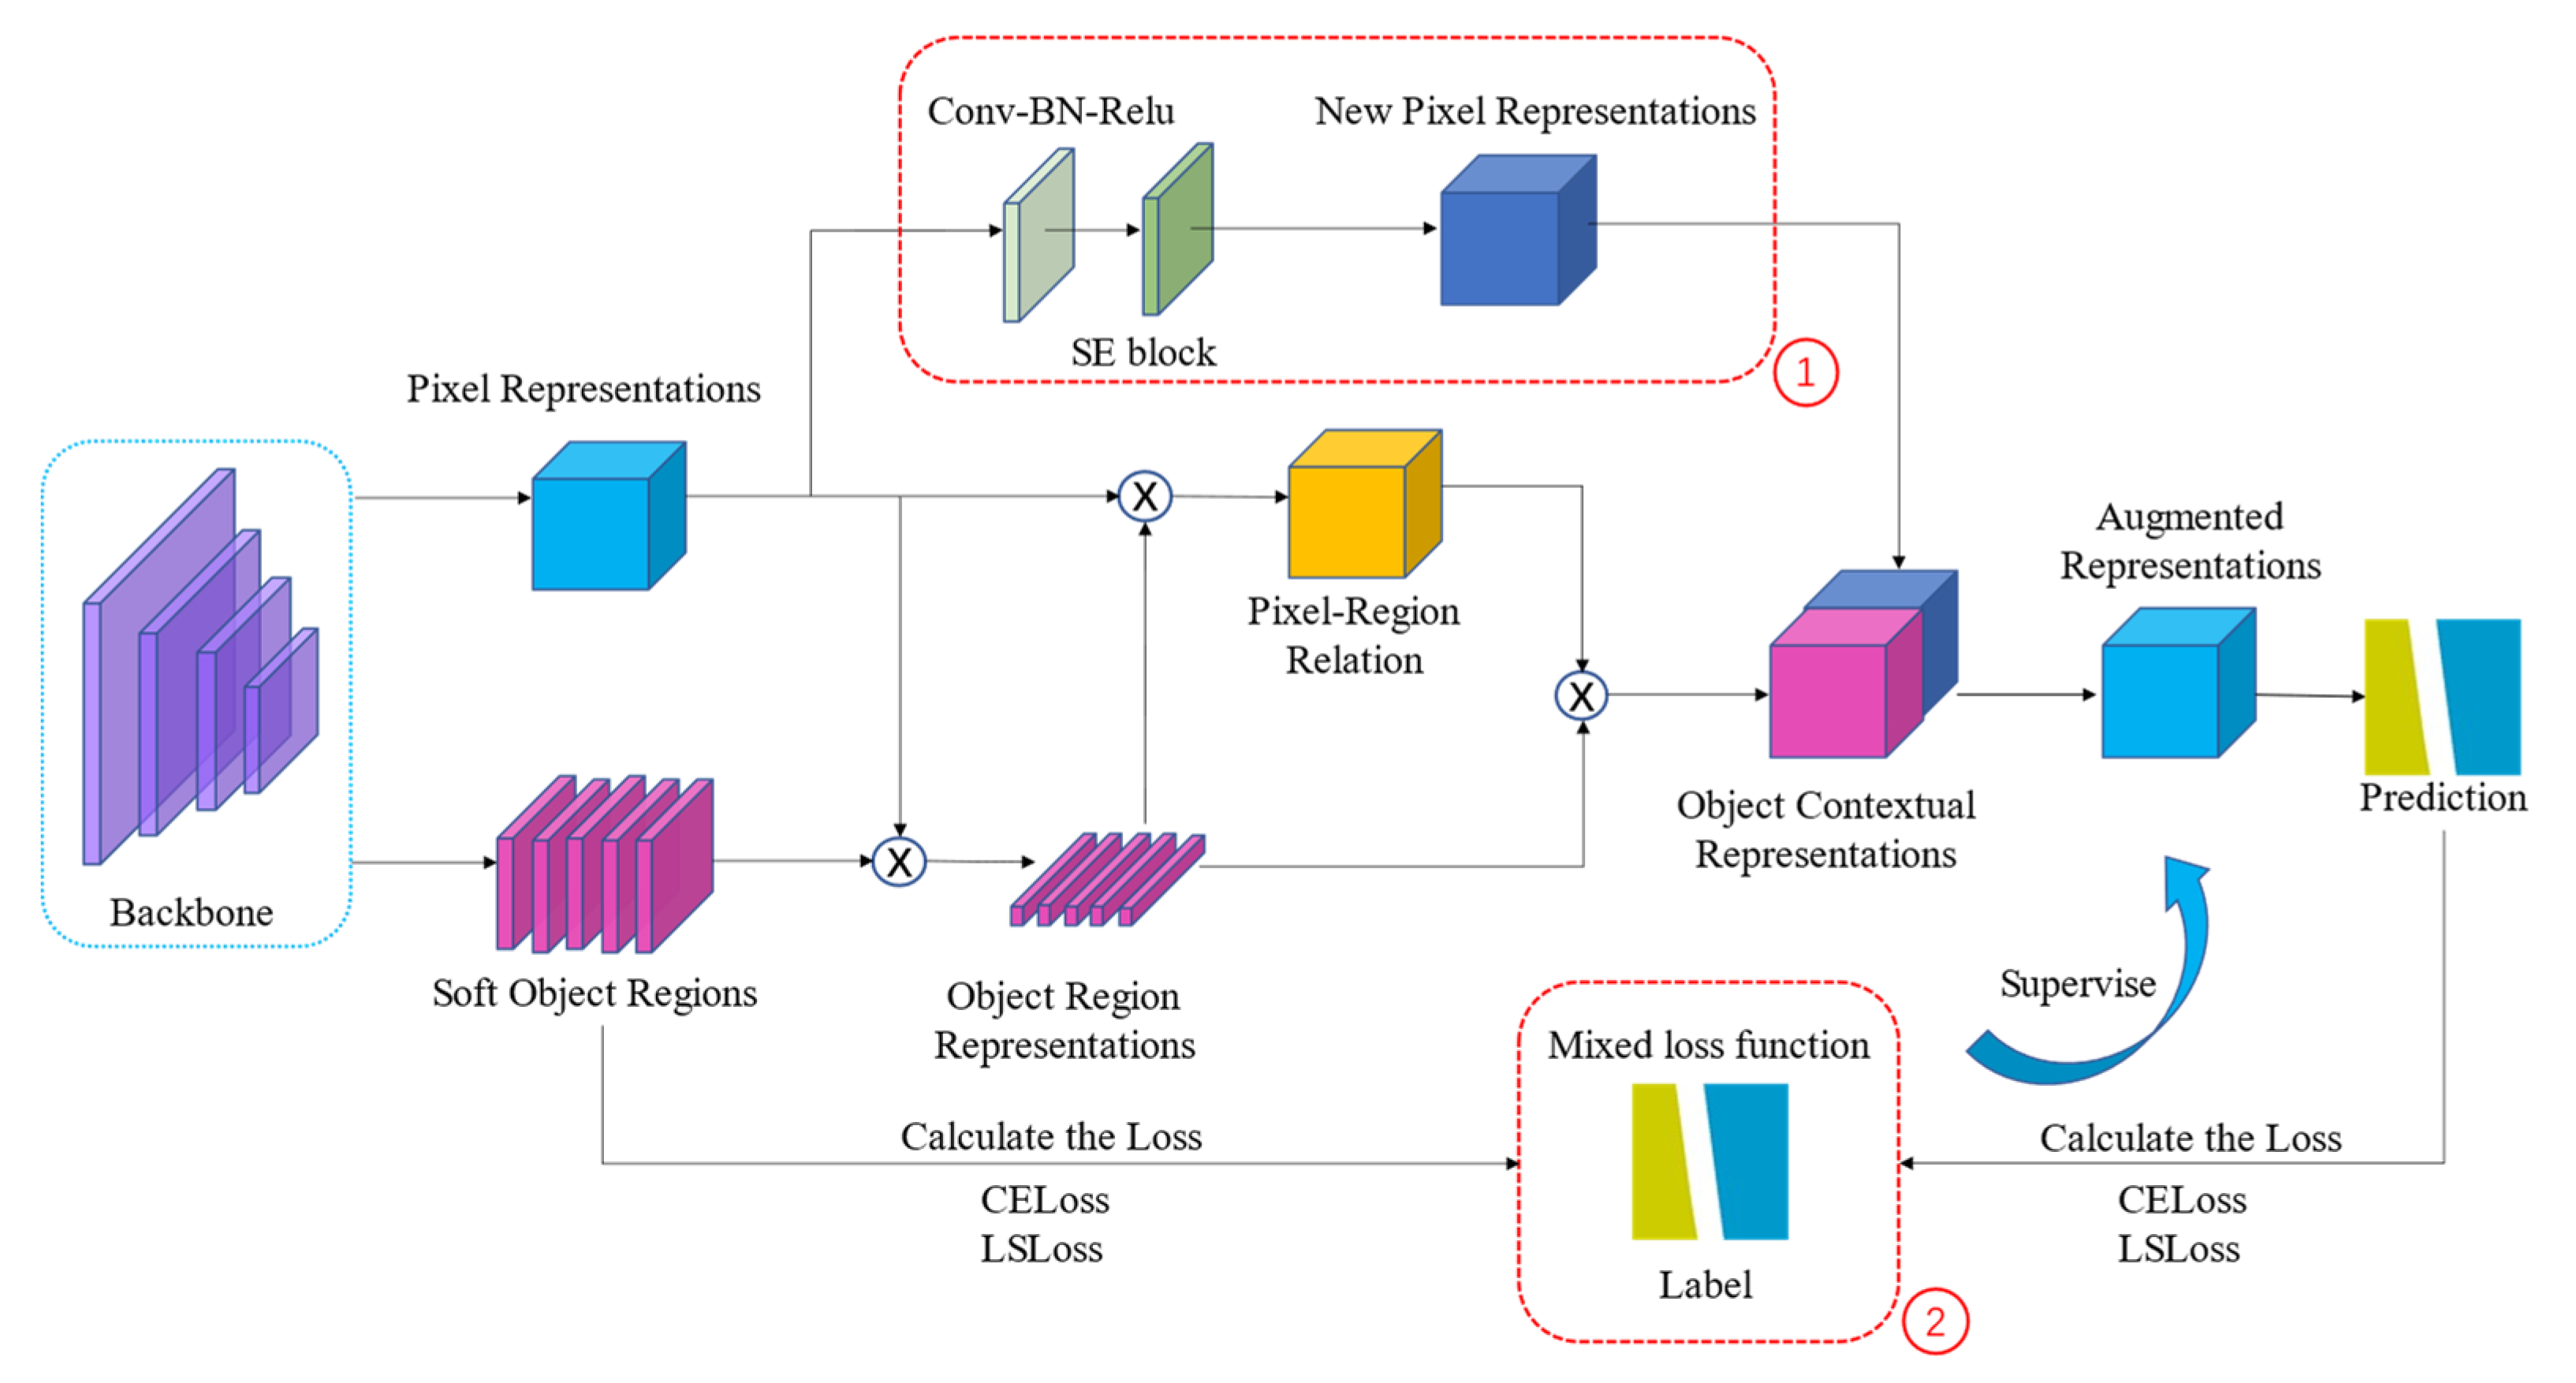
The main idea of OCR is that the category label of a pixel is determined by the category label of its object, and the object region representation is used to enhance its pixel representation. The network structure of OCR is shown in Figure 7; red boxes 1 and 2 show a parallel branch with a channel attention module and a mixed loss function composed of CELoss and LSLoss, respectively.
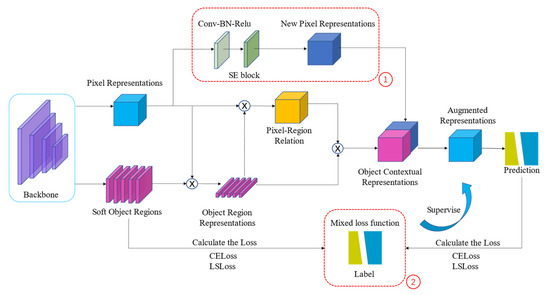
Figure 7.
The network structure of the improved OCRNet.
The network structure can mainly be divided into 3 stages. First, the context pixels are divided into a set of soft object regions and each soft object region corresponds to a class. The soft object region is the rough semantic segmentation result output by the backbone. It is learned under the supervision of ground truth and used as an input in OCR. Secondly, according to the rough semantic segmentation results and the pixel representations of the network, K sets of vectors are calculated, namely object region representations, where each vector corresponds to a certain feature representation of a semantic category. Finally, the relationship matrix is calculated between the pixel representations and the object region representation; then, weighted summation is used to obtain the object contextual representation according to the value of each pixel and the object region features expressed in the relationship matrix. At the end of the OCR network, the object context representation and the pixel representations are channel-connected as the context information-augmented representation, and the augmented representation is used to predict the semantic category of each pixel.
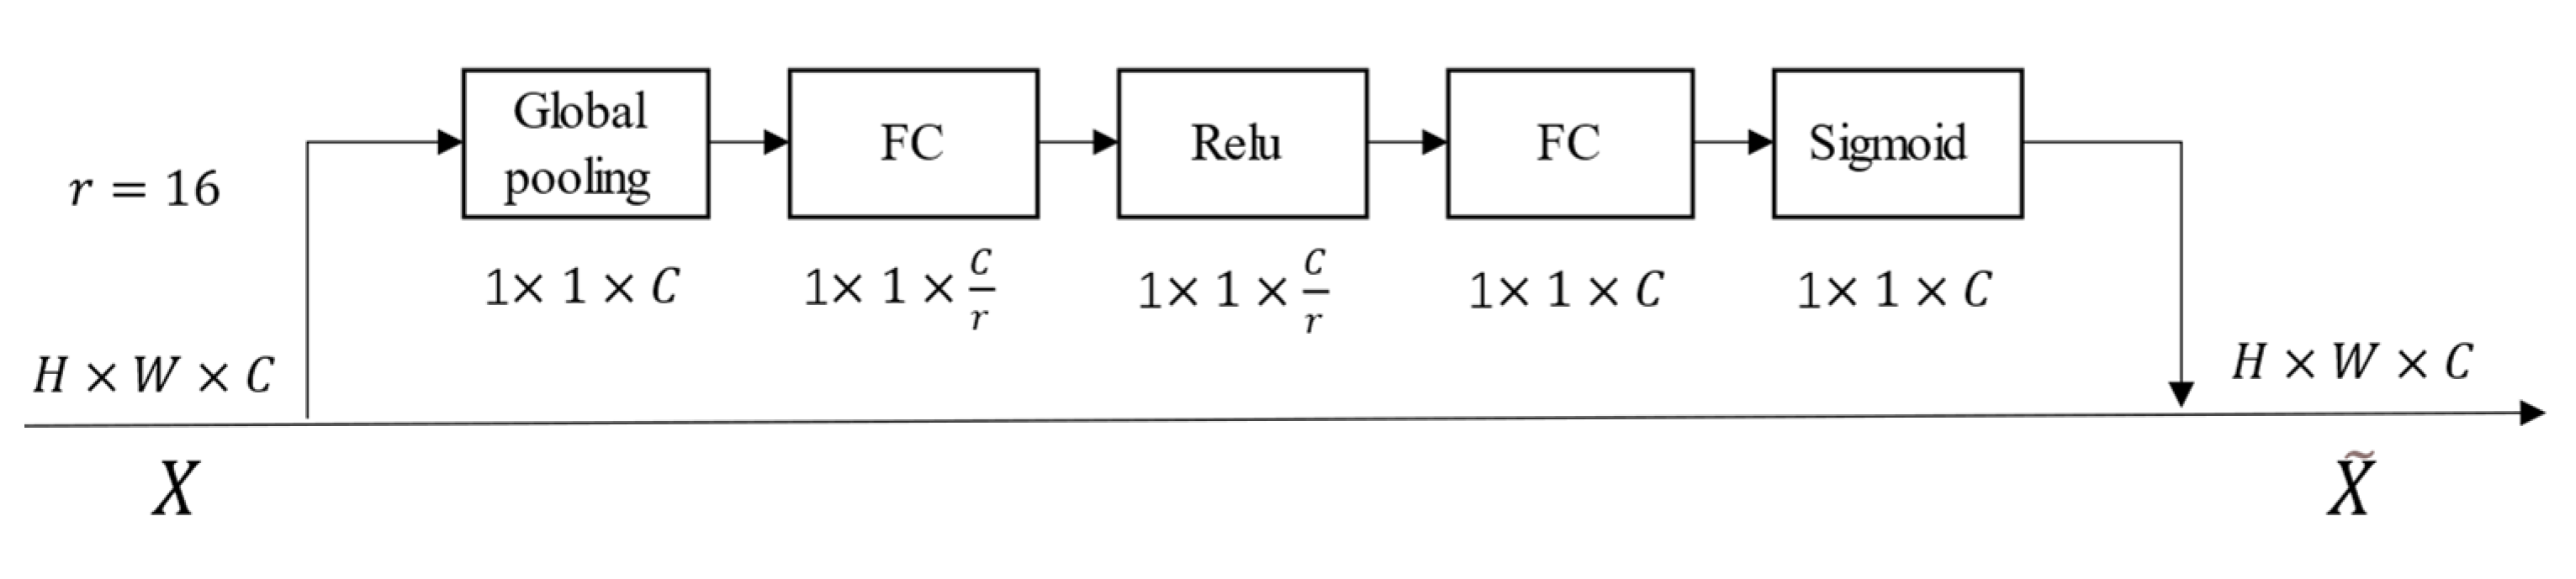
The OCR method has strong context modeling capabilities; it can calculate the object representation and then apply it to the pixel representation. Compared with the context modeling method, OCR performance is better because it not only considers the correlation between pixels. However, the OCR network structure only reflects the idea of visual attention, without considering the importance of channels. Channel features have a substantive influence on the results of semantic segmentation, and this influence is not uniform. The output channel number of the backbone network is 15C. When C is equal to 48, 720 channel features can be generated. Where there is a large number of channel features, it ignores the importance of the channel, which has implications for the accuracy of semantic segmentation. Therefore, to solve the above problems, we introduced a channel attention module (SE block) [40] into the OCR network. The structure of the SE block is shown in Figure 8. This module can learn the feature weight according to loss through the network, so that the weight of the effective feature map is large and the weight of the invalid feature map is small. On the basis of the original OCR network, we added the channel attention module behind the pixel representation, and we used the Conv-BN-Relu layer to connect in the middle. The channel attention module was used to calculate the weight of each channel feature, and then the weight was applied to the corresponding channel. The weighted feature map was used as a new pixel representation, which was connected to the object context representation. The design of this parallel dual attention (space-channel)-combined structure was inspired by reference [31].
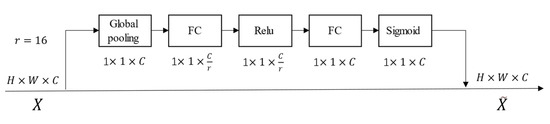
Figure 8.
The channel attention mechanism structure: SE block.
In addition to adding the SE block, we also used a mixed loss function to calculate the deviation in the soft object region (rough semantic segmentation result) and the final semantic segmentation result from the ground truth. The original OCR method uses cross-entropy loss (CELoss). CELoss is a common pixel-level loss function in the field of semantic segmentation, which is used to calculate the average loss of each pixel. To enhance the object region representation, the semantic segmentation is optimized at the object level and the integrity and accuracy of each object are improved in the semantic segmentation results. On the basis of CELoss, we added Lovász-Softmax loss (LSLoss) [46] at the object level. LSLoss is a loss function optimized for mIoU. IoU is also called the Jaccard index :
where is the ground truth category, is the vector of ground truth labels, and is the vector of predicted labels. The loss function defined by the deviation value of the Jaccard index is Jaccard loss:
These equations can be changed to:
Jaccard loss is only applicable to the calculation of discrete cases. If the network prediction result is continuous, discretization will lead to nonconduction, so Jaccard loss cannot be directly connected to the back of the network. Taking into account the fact that the Jaccard loss satisfies the properties of the submodule function and employing the Lovász extension [47] to make it derivable, the input space changes from discrete to continuous . The output value of Jaccard loss is equal to that of the original function on . Further, it is convex and the optimization direction is consistent. The Lovász extension expression of Jaccard loss is:
When all categories need to be evaluated, the average value is used. Lovász-Softmax loss is expressed as:
We used a mixed loss function composed of CELoss and LSLoss to supervise the soft object region and the final semantic segmentation result at the pixel level and object level, respectively. Multiple segmentation experiments showed that when the weights of CELoss and LSLoss are 0.8 and 0.2, respectively, the segmentation effect is best.
2.4.3. Hyperparameter Settings
The development environment, programming language, and deep learning framework used in this study were Anaconda 3, Python 3.7, and PaddlePaddle 2.0, respectively. All experiments were run on the high-performance computing resource NVIDIA RTX3090 GPU (24 GB RAM). According to the GPU’s computing power, video memory size, image pixel size, and sample number, the experimental data batch size and number of iterations were set to 32 and 20,000, respectively. In the training process, the stochastic gradient descent (SGD) algorithm was used for optimization. The momentum parameter and weight attenuation parameter of the SGD algorithm were set to 0.9 and 4.0 × 10⁻⁵, respectively. To keep the training process running smoothly, a multiple learning rate strategy was adopted, and its expression is as follows:
The was set to 0.001, represents the number of current iterations, represents the maximum number of iterations (20,000), and the parameter was set to 0.9.
2.5. Evaluation Metrics
In research of deep learning semantic segmentation, commonly used evaluation metrics are accuracy (Acc) [48], intersection over union (IoU) [49], mean accuracy (mAcc) [48], Kappa [50], mean intersection over union (mIoU) [49], and so on. Acc refers to the ratio of the number of pixels correctly predicted for a category to the total number of pixels in that category. The mAcc is the average of the accuracy of all categories. It can indicate the approximate accuracy of the classification results, but it does not consider the situation of a specific category. Using the Kappa can solve this problem and lead to a more comprehensive and objective analysis of the classification results. The IoU is a concept used in target detection that refers to the overlap rate of the generated candidate frame and the original labeled frame, that is, the ratio of their intersection and union. The best case is complete overlap where the ratio is 1. This kind of evaluation metric is also highly pertinent in semantic segmentation, and it can describe well the difference between the prediction result and the ground truth. The mIoU is the average of the intersection over union of all categories, which can indicate the overall classification effect, and it is also the most widely used metric in multi-category semantic segmentation. In this study, all the above evaluation metrics were utilized and the performance of the semantic segmentation network model was evaluated using the test data set. More specifically, Acc, mAcc, and Kappa were used for pixel-level evaluation, and IoU and mIoU were used for object-level evaluation. The five evaluation metrics are defined as follows:
where is the total number of pixels of class and is the number of classes. is the number of pixels of class predicted to belong to class .
where is the ratio of the sum of the number of samples correctly classified in each category to the total number of samples. , where the number of real samples in each category are , ,…, , the predicted number of samples in each category are , ,…,, and the total number of samples is .
2.6. Experimental Design
For the purpose of method inter-comparison, we conducted two experiments. Experiment 1 applied the proposed method to the UAV image collected on 26 July 2020 (test area 1), and Experiment 2 applied the same method to the UAV image collected on 2 August 2020 (test area 2). In the two experiments, in addition to using the proposed method, we also applied PSPNet, DeeplabV3+, DNLNet, and OCRNet to these two test areas, and compared and analyzed the semantic segmentation results of all methods at the same time. For fair comparison, all methods used the same dataset and data preprocessing operations.
3. Results
3.1. Experiment 1: Test Area 1 Segmentation Results
The evaluation results for test area 1 are shown in Table 2. Among the five methods, DeepLabV3+ performed worst. Its mIoU, mAcc, Kappa, and intercropping IoU were all lower than those of the other four methods: 92.77%, 96.28%, 0.946, and 92.69%, respectively. Among these evaluation metrics, our proposed method performed best, reaching 94.44%, 96.78%, 0.9534, and 96.57%, respectively. The accuracy of PSPNet, DNLNet, and OCRNet was between the above two methods. The main difference between these three methods is intercropping Acc. PSPNet was the same as our proposed method, reaching 99.59%, while OCRNet was only 99%. In general, among all the evaluation metrics, the difference in intercropping IoU and mIoU in the five methods was largest, reaching 3.88% and 1.67%, respectively. Therefore, these two metrics can better evaluate the semantic segmentation effect of test region 1. Compared with PSPNet, DeepLabV3+, DNLNet, and OCRNet, the proposed method improved by 0.72%, 3.88%, 0.17%, and 0.67% on Intercropping IoU and 0.60%, 1.67%, 0.72%, and 0.48% on mIoU, respectively. The results show that the proposed method had more advantages in the semantic segmentation results of test area 1, and these advantages were more prominent in the evaluation metrics (intercropping IoU and mIoU) at the object level.
Table 2.
Semantic segmentation accuracy results for test area 1.
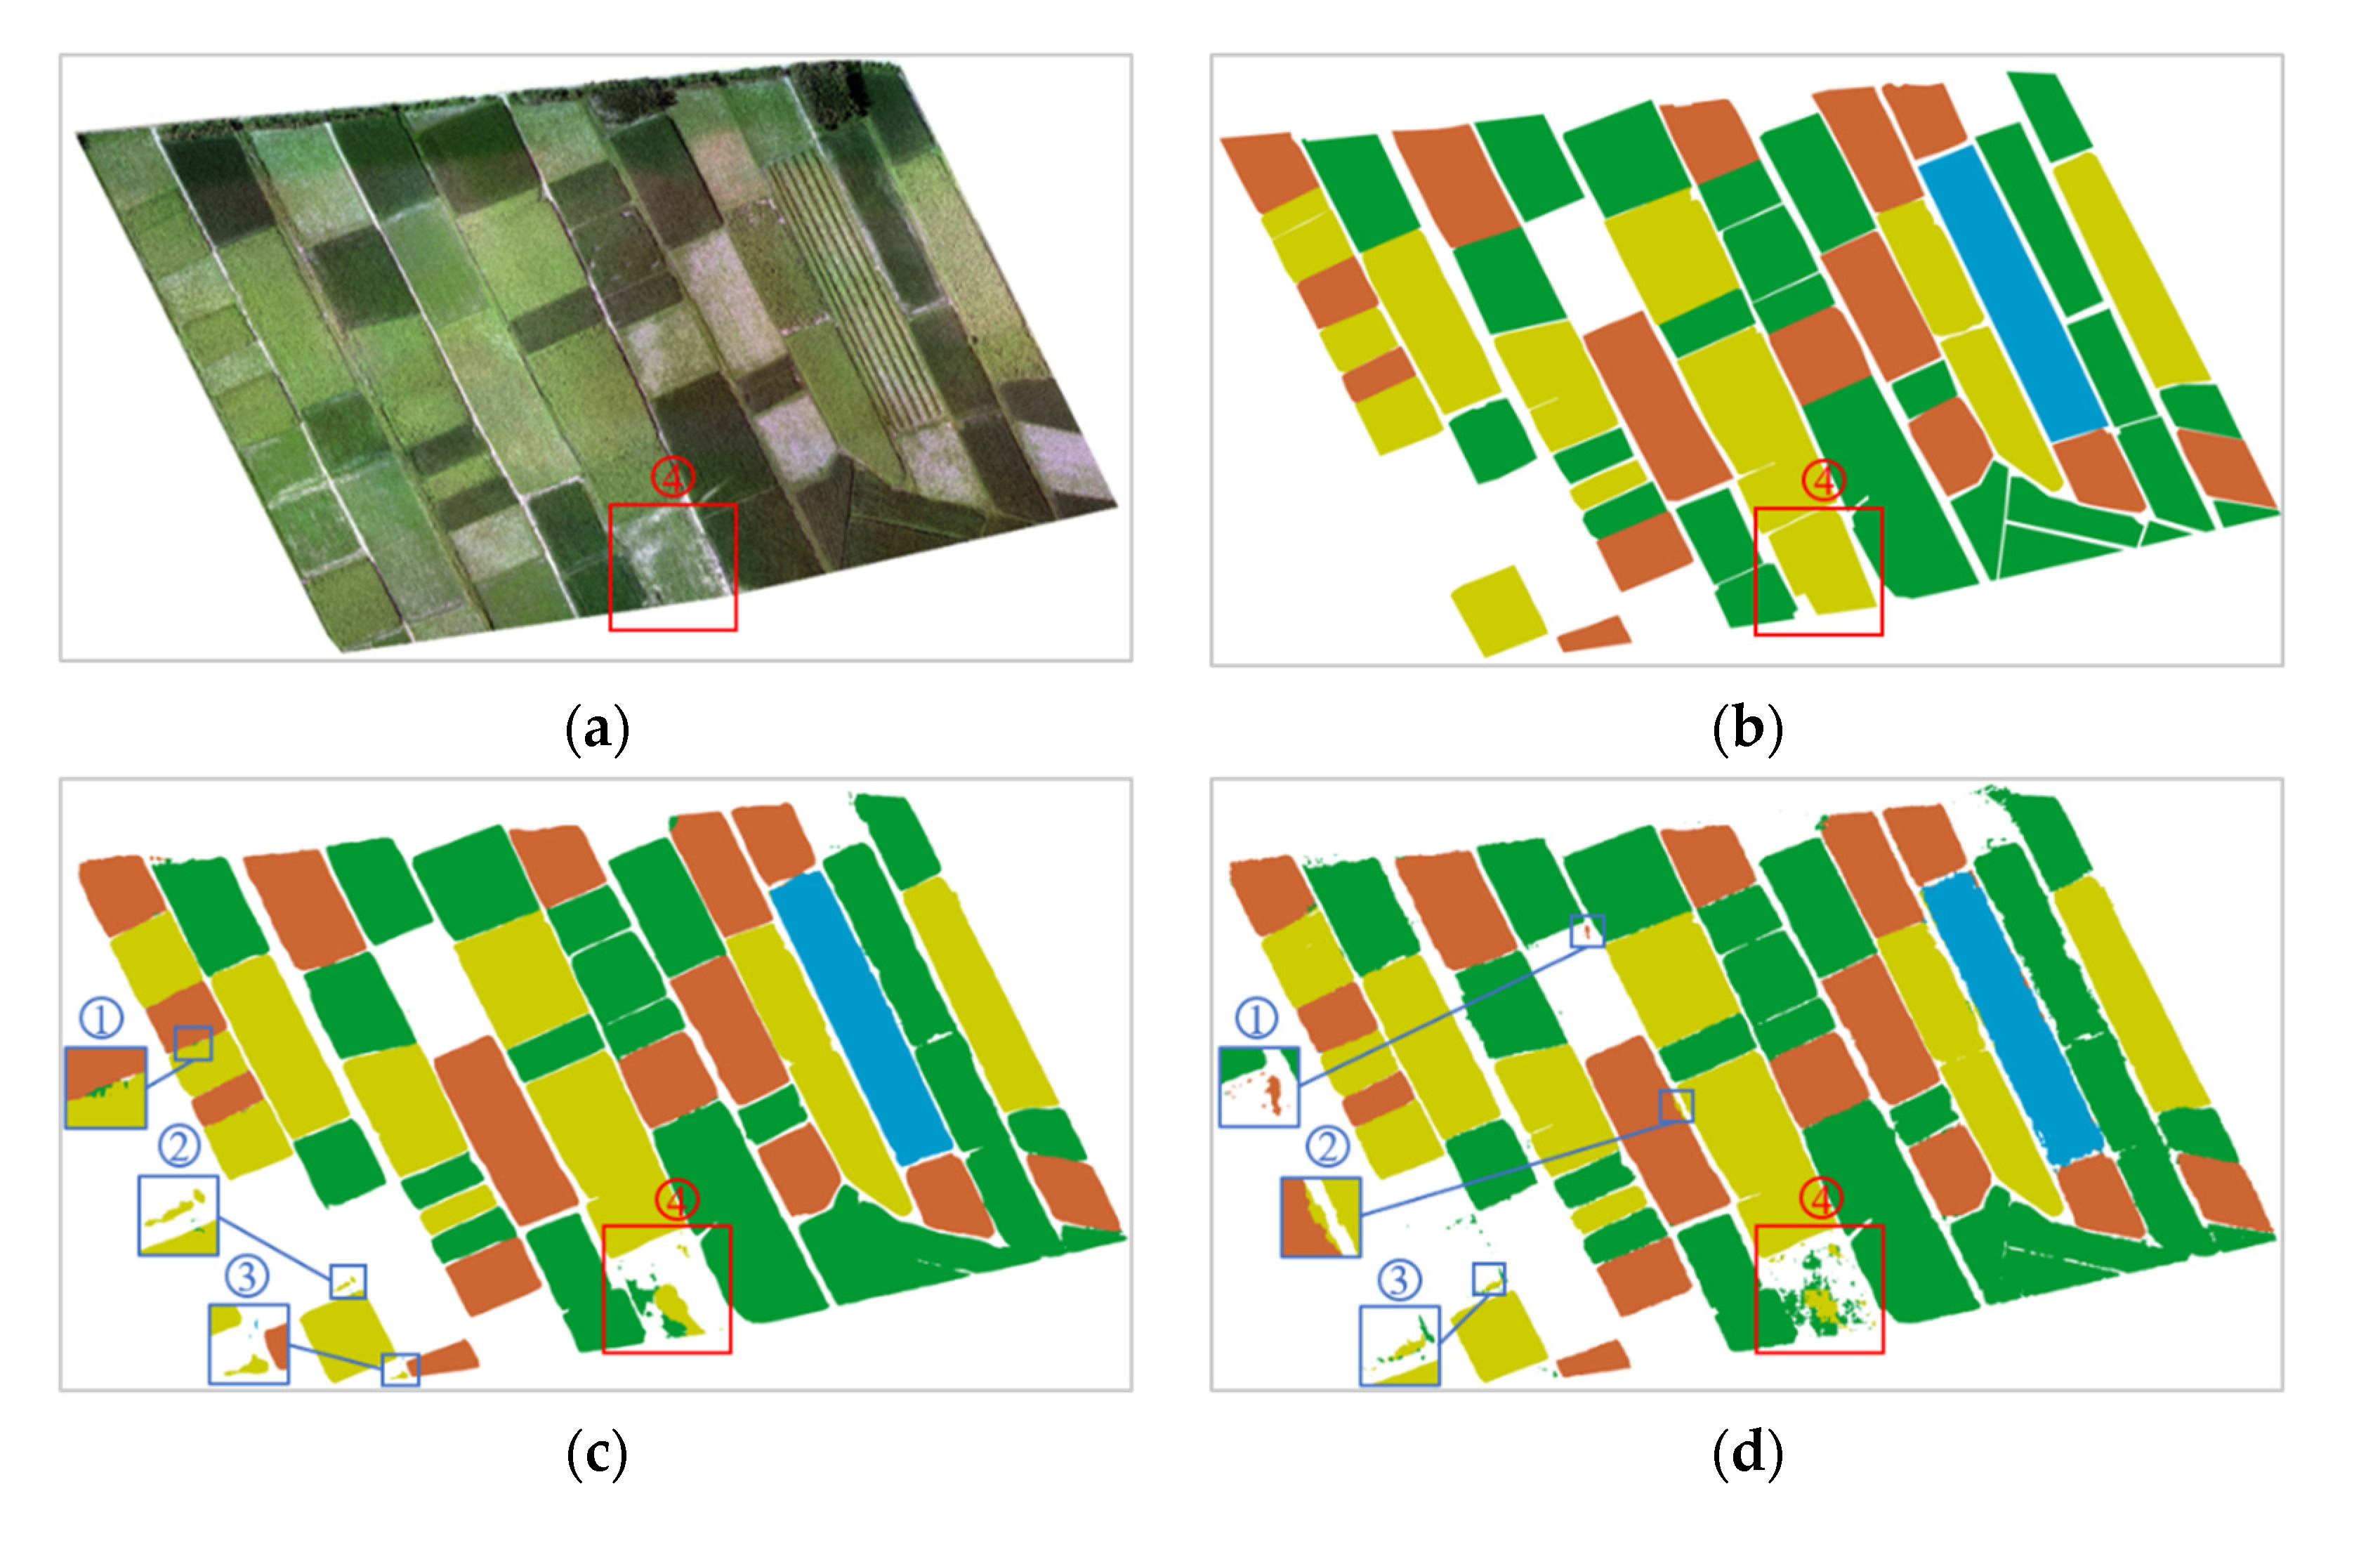
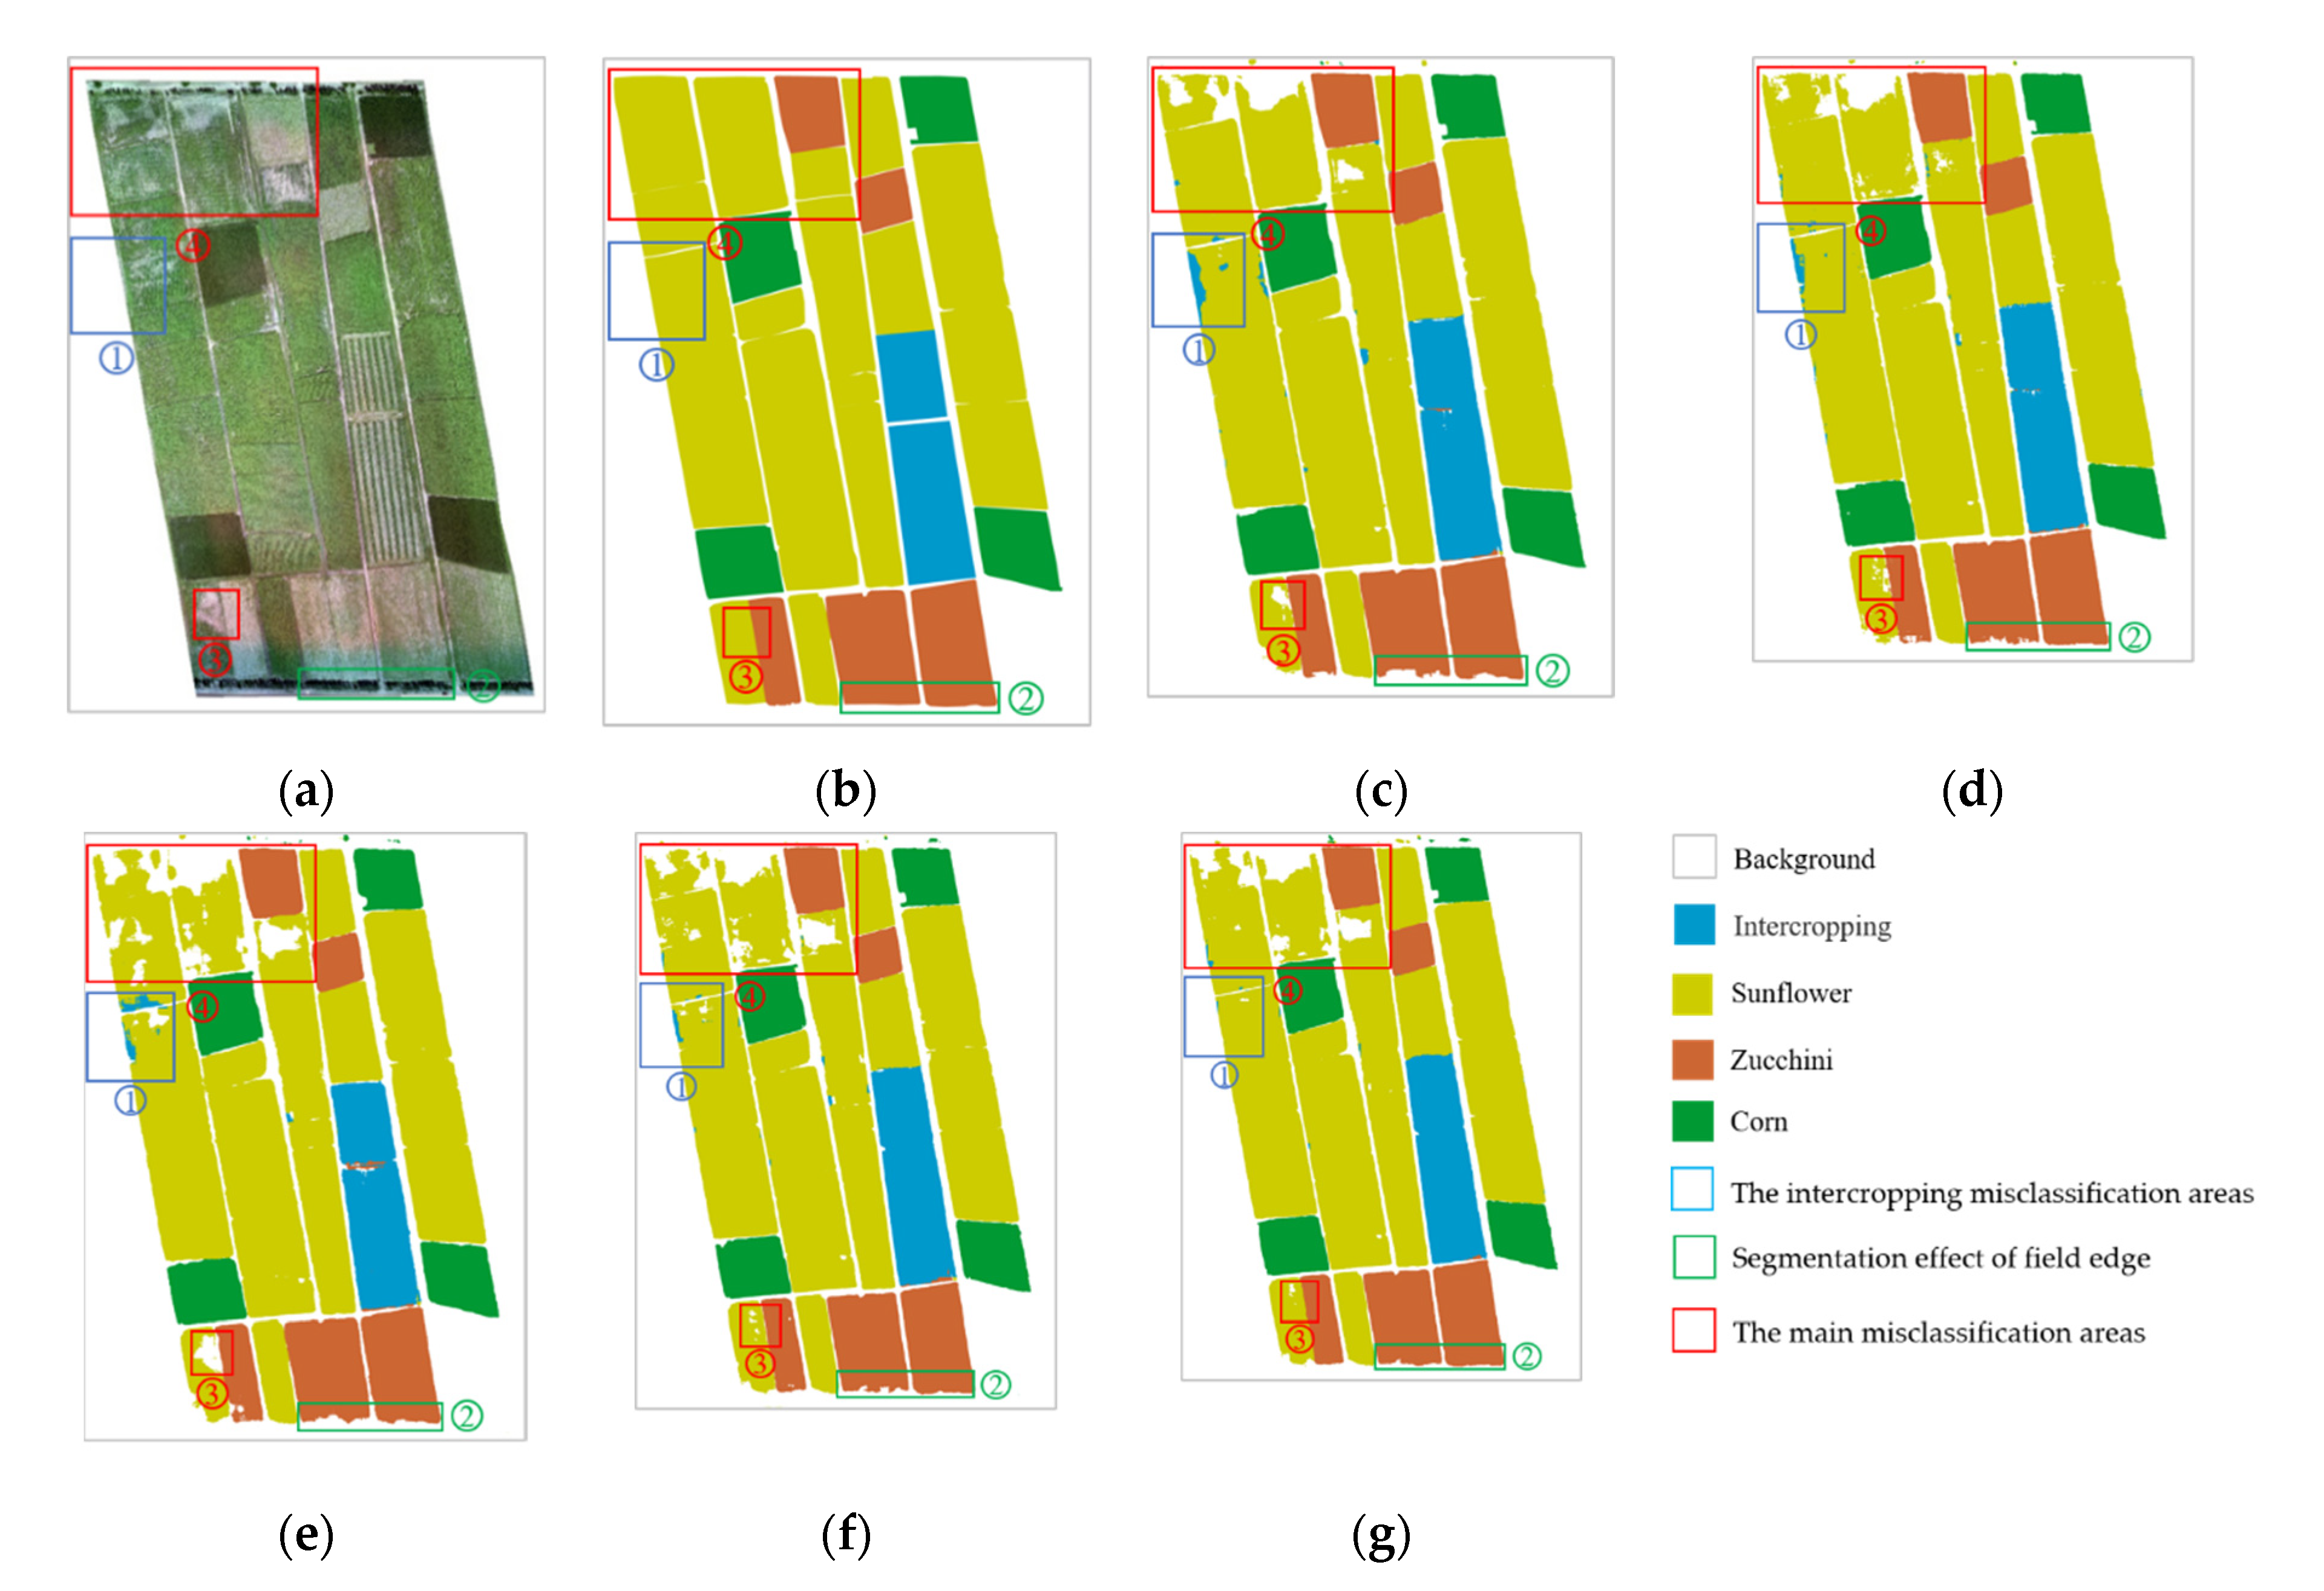
Figure 9 shows the classification results of the five methods in test area 1. Judging from the recognition effect of the intercropping field and the segmentation effect of the whole region, the classification results of these five methods were very close to the ground truth, and they were all satisfactory. The difference was that the method we proposed handled the details better. PSPNet, DeepLabV3+, DNLNet, and OCRNet slightly misclassified the edges of fields where different crops are grown and the ridges between fields (marked as background). In Figure 9c–f, we focused on selecting three regions (①, ②, and ③, marked with blue boxes) for display. This situation basically did not exist in the classification results of our proposed method. The main impact on the classification result of test area 1 was the sunflower field in area ④ (marked by the red box), as shown in Figure 9a–g. PSPNet and DeepLabV3+ mistakenly divided sunflowers in area ④ into corn or background. DNLNet, OCRNet, and our proposed method also mistakenly divided sunflowers in this area into background. The main reason for the misclassification was that the density of sunflower plots in this area was relatively sparse, and the sunflower growth was uneven. The sunflowers in the middle of the field grow better than the sunflowers on the edge of the field, and the areas near the edges of the field contained exposed white soil. Sunflower fields with such characteristics are quite different from average sunflower fields. Therefore, these methods did not perform well when identifying sunflowers in area ④. However, in terms of the area of sunflowers that were correctly classified, OCRNet and our proposed method performed slightly better than the other three methods did.


Figure 9.
Comparison of classification results of different methods on test area 1. (a) Orthoimage, (b) ground truth, (c) PSPNet, (d) DeepLabV3+, (e) DNLNet, (f) OCRNet, and (g) the proposed method.
3.2. Experiment 2: Test Area 2 Segmentation Results
The evaluation results for test area 2 are shown in Table 3. Among the five methods, DNLNet performed worst in terms of overall classification effect. Its mIoU, mAcc, and Kappa were lower than those of the other four methods: 92.44%, 95.25%, and 0.9289, respectively. PSPNet performed worst in terms of intercropping recognition. Its intercropping IoU and intercropping Acc were lower than the other four methods: 89.39% and 91.72%, respectively. In terms of these evaluation metrics, DeepLabV3+ and the proposed method performed best. DeepLabV3+ had the highest mAcc and Kappa, reaching 97.23% and 0.9585, respectively. The mIoU, intercropping IoU, and intercropping Acc of our proposed method were highest, reaching 95.05%, 94.51%, and 96.19% respectively.
Table 3.
Semantic segmentation accuracy results for test area 2.
On the whole, there were obvious differences in mIoU, mAcc, Kappa, intercropping IoU, and intercropping Acc between the different methods, and the maximum deviations among them were 2.61%, 1.98%, 0.0296%, 5.13%, and 4.47% respectively. Therefore, these metrics can better evaluate the semantic segmentation effect of test area 2. Compared with DeepLabV3+, the mIoU, intercropping IoU, and intercropping Acc of our proposed method increased by 0.32%, 3.09%, and 2.68%, respectively, but mAcc and Kappa decreased by 0.34% and 0.0051, respectively. In terms of the overall classification effect, the method we proposed was not much different from DeepLabV3+. In terms of the evaluation metrics at the pixel level (mAcc and Kappa) and object level (mIoU), the two methods had their own advantages. However, the proposed method was obviously superior to DeepLabV3+ in terms of the intercropping recognition effect. Similar to the conclusion obtained in Experiment 1, the proposed method still had certain advantages in the semantic segmentation results of test region 2, which was more reflected in the object-level evaluation metric (mIoU) and the recognition effect of intercropping.
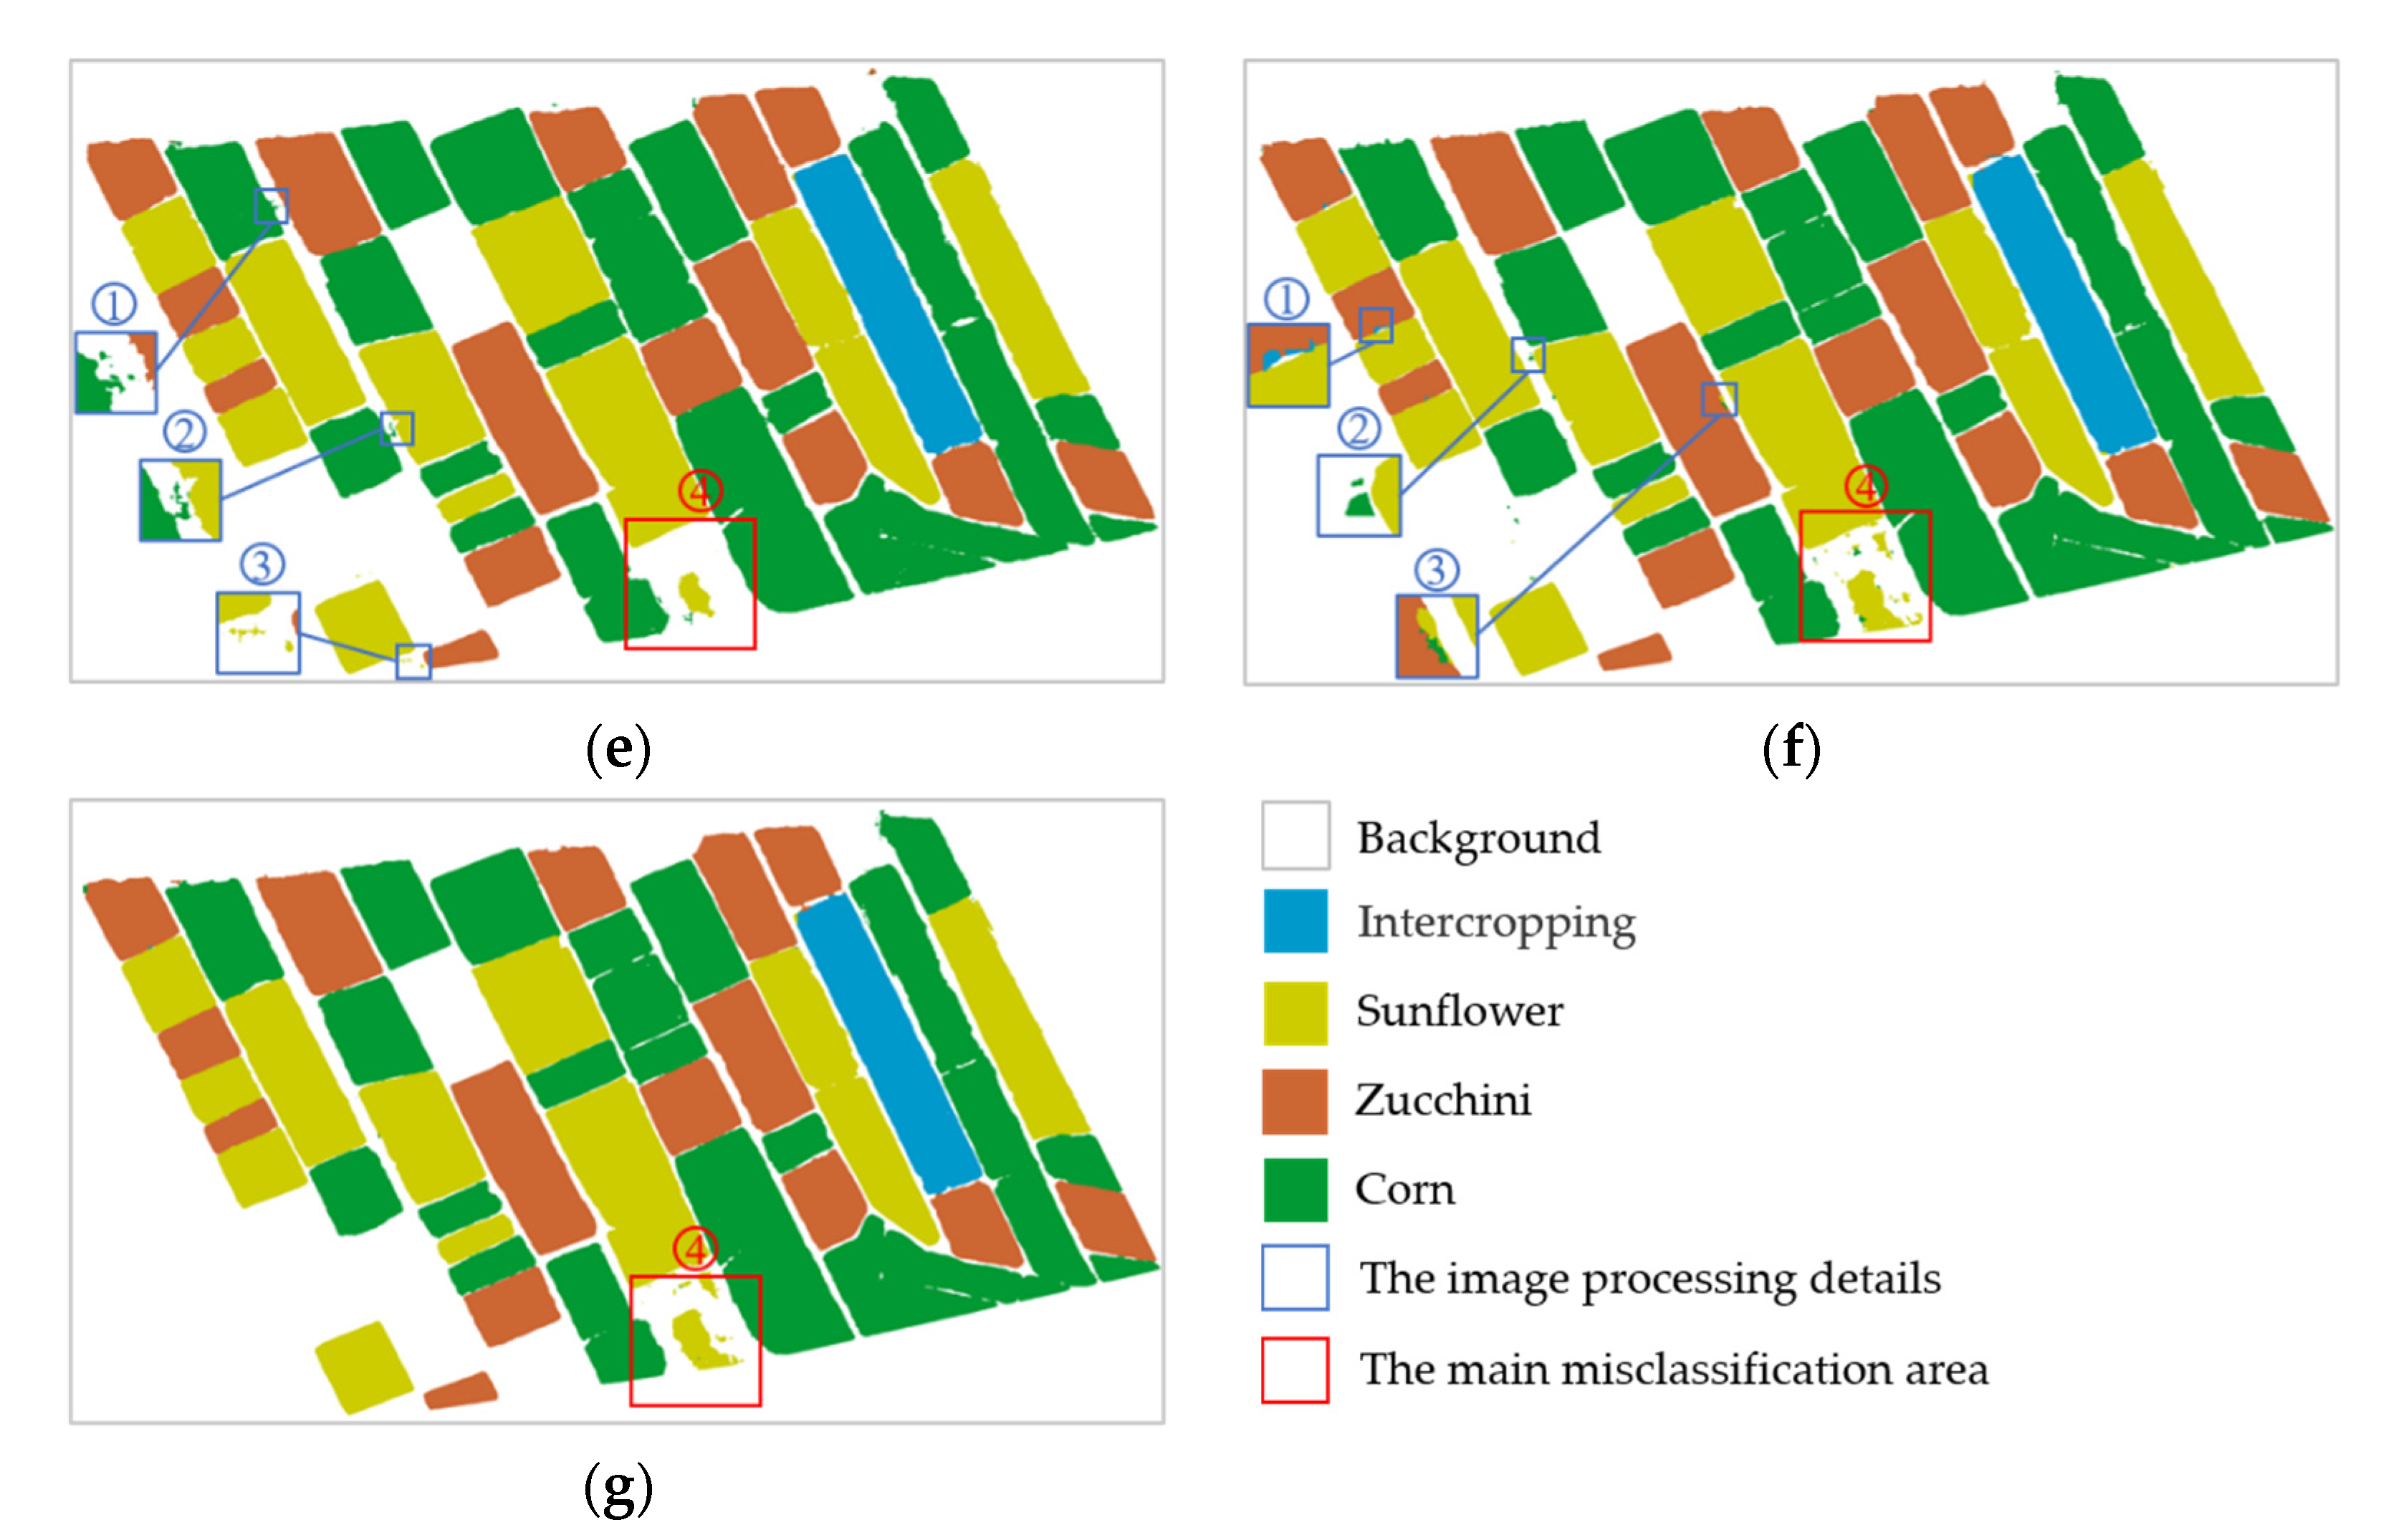
Figure 10 shows the classification results of the five methods in test area 2. We divided the worst performance areas of test area 2 into four areas (①, ②, ③, and ④), where area ① and area ② are marked with blue and green boxes, respectively, and area ③ and area ④ are marked with red boxes, as shown in Figure 10.
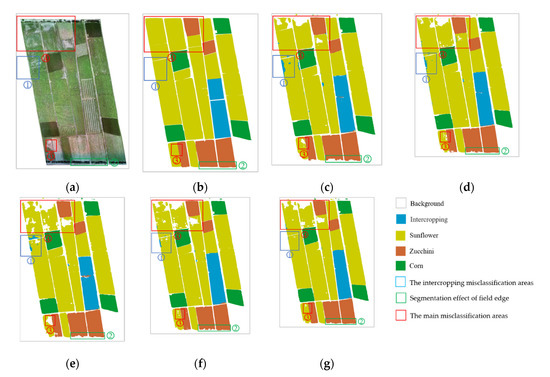
Figure 10.
Comparison of classification results of different methods on test area 2. (a) Orthoimage, (b) ground truth, (c) PSPNet, (d) DeepLabV3+, (e) DNLNet, (f) OCRNet, and (g) the proposed method.
Area ① mainly shows the misclassification of intercropping fields. PSPNet, DeeplabV3+, DNLNet, and OCRNet misclassified the edge of sunflower fields into the intercropping category. This error was particularly prominent in the first three methods. However, the method we proposed was very accurate in terms of identifying intercropped fields. Area ② was the junction area between the zucchini field and the street trees (marked as the background) to show the segmentation effect of these methods on the edge of the field. It can be seen that PSPNet and DNLNet had large errors in terms of segmenting the junction area. These two methods erroneously recognized the zucchinis at the edge of the junction area as the background. DeeplabV3+, OCRNet, and our proposed method could segment the edge of the field more accurately. However, the edge segmentation results of the first two methods had an obvious sawtooth shape. Relatively speaking, the segmentation effect of our proposed method was flatter and could better fit the edge of the field.
The main influences on the classification results of test area 2 were the sunflower fields in area ③ and area ④. In area ③, our proposed method performed best, and only a few pixels were mistakenly divided into background. In area ④, the best performers were PSPNet and DeeplabV3+. Despite this, many pixels were still erroneously classified as background. In these two areas, the worst performer was DNLNet. This is also the main reason why DNLNet’s mIoU, mAcc, and Kappa were lowest among all methods. We believe that the main influence on the misclassification was the relatively pronounced soil salinization in area ③ and area ④, which caused an uneven growth of sunflowers in these two areas, and individual differences were very obvious. Sunflowers with good growth conditions were generally above 2 m in height, with large leaves, and they were in the flowering period. The poorly growing sunflower plants were short and showed a seedling state. The methods compared in this article tended to attribute poorly growing sunflowers as background.
4. Discussion
In this section, two sets of comparative experiments are first used to verify the effectiveness of the modifications to OCRNet (adding a channel attention module and using a mixed loss function). The reasons for the improved accuracy are then explored. Then, we discuss the adaptability and limitations of the proposed method in intercropping identification.
4.1. Comparison Experiments
To prove the effectiveness of the modifications to OCRNet, we used different backbone networks (HRNet_W18, HRNet_W48, ResNet_50, and ResNet_101) in test area 1 and test area 2, and we carried out comparative experiments on OCRNet, OCRNet with SE Block (SE_OCRNet), OCRNet with mixed loss function (MIX_OCRNet), and OCRNet with two improvement measures (SE_MIX_OCRNet). The purpose was to clearly see the effect of adding the SE Block and using a mixed loss function on the semantic segmentation effect of OCRNet. These experiments were multi-class semantic segmentation experiments, so only mIoU, mAcc, and Kappa were used to evaluate the overall classification effect of these two test areas.
From the lowest and highest accuracy of the experimental results (Table 4), it can be seen that OCRNet performed worst in most cases, which, in turn, proves that the two changes we proposed were effective. First, it is noteworthy that, compared with SE_OCRNet and MIX_OCRNet, SE_MIX_OCRNet can still further improve mIoU. Among the four selected backbone networks, the mIoU of SE_MIX_OCRNet were 0.80%, 0.28%, 0.25%, 0.28% (test area 1), 0.05%, 0.17%, 1.00%, and 0.72% (test area 2) higher than those of SE_OCRNet, respectively. Similarly, the mIoU of SE_MIX_OCRNet were 0.44%, 0.41%, 0.39%, 0.13% (test area 1), 1.11%, 0.09%, 0.07%, and 0.13% (test area 2) higher than those of MIX_OCRNet, respectively. The promotion effect in mIoU was not affected by the test data and backbone network, and it had strong stability.
Table 4.
Comparison of accuracy results of different changes to OCRNet in test area 1 and test area 2 by using HRNet_W18, HRNet_W48, ResNet_50, and ResNet_101.
However, in terms of improving mAcc and Kappa, the performance of the two test areas was not consistent. In test area 1, SE_MIX_OCRNet still performed best in different backbone networks. However, this was not the case in test area 2. When the backbone network was HRNet_W18 and HRNet_W48, SE_OCRNet performed best. Probably because HRNet retained high-resolution feature maps [45], reasonable use of the channel features with different weights was more helpful for improving the accuracy of semantic segmentation, compared with using a mixed loss function to aggravate object-level supervision loss. When the backbone network was ResNet_50, MIX_OCRNet performed best. It is also possible that ResNet has a tandem structure. As the number of network layers deepens, the size of the feature map after convolution continues to decrease, resulting in the loss of more image detail information in its output results [51]. At this time, it was necessary to increase the image-level supervision loss to improve the effect of semantic segmentation. The above situation, on the one hand, showed that different changes to OCRNet led to different improvements in terms of mAcc and Kappa, and this difference varied according to the changes in the test data and the backbone network. However, even so, SE_MIX_OCRNet was still significantly better than OCRNet in terms of mAcc and Kappa. On the other hand, it also showed that the contribution of these two improvements to the improvement of mIoU was higher than the mAcc and Kappa.
Based on all the experimental results, we believe that, on the basis of OCRNet, reasonable use of the channel features with different weights and increasing the supervision loss at the object level can improve the semantic segmentation effect, and the two changes led to a more substantive improvement in terms of the object-level evaluation metric (mIoU).
4.2. Adaptabilities and Limitations
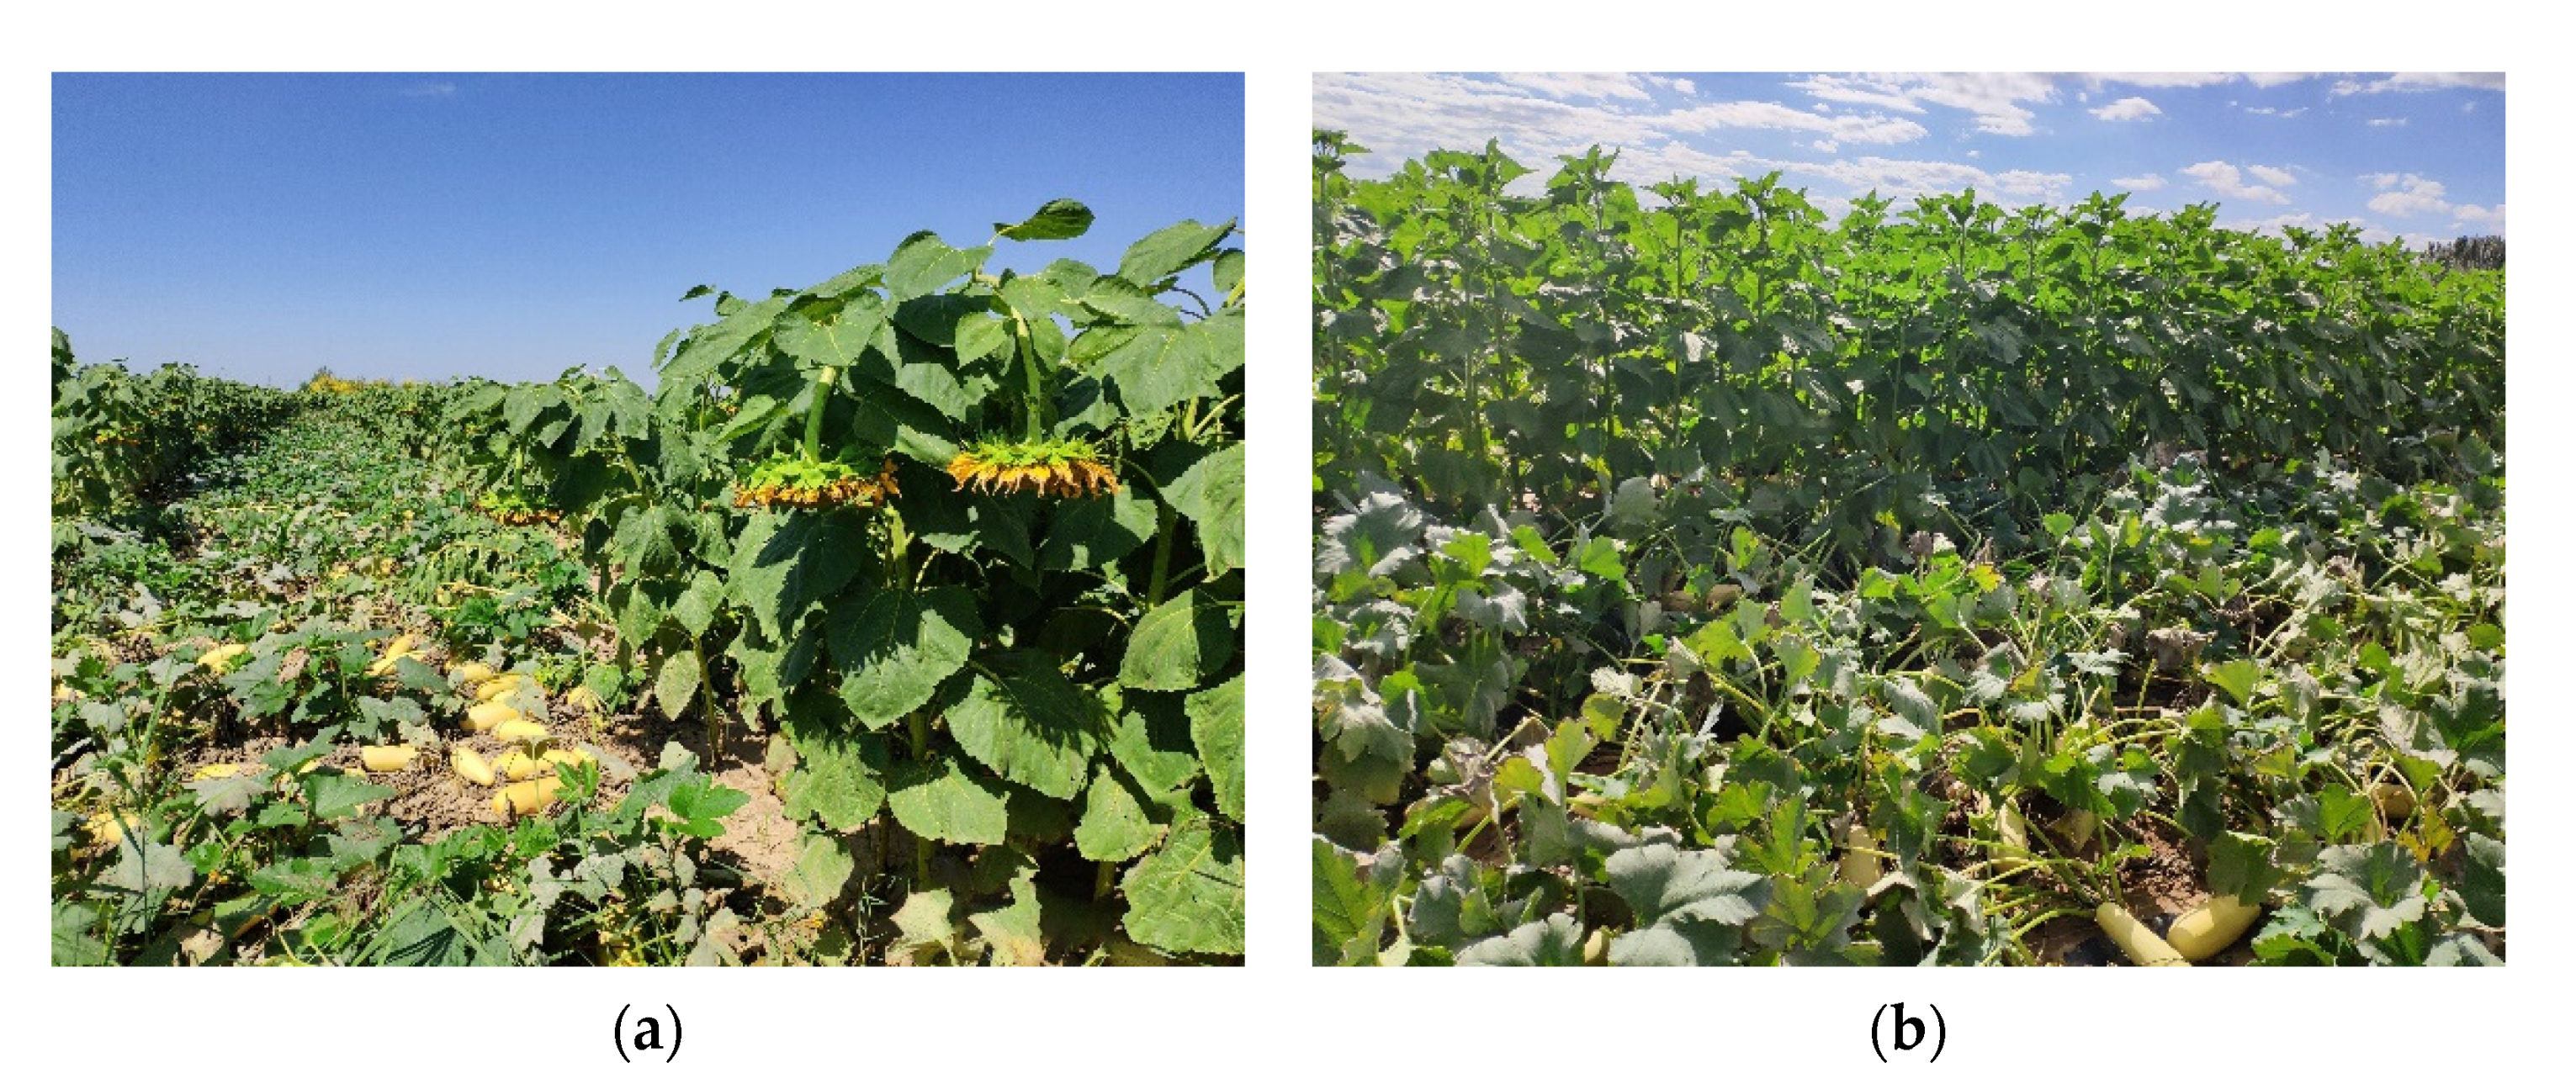
Zucchinis and sunflowers are short-stalked crops and tall-stalked crops, respectively. This means that, when intercropped, there is a height difference [5], as shown in Figure 11. The intercropping plots appear as strips in the UAV image. There are obvious differences in texture characteristics between single-planted zucchinis or sunflowers and intercropping. From the classification accuracy of the methods compared in this paper, it can be seen that the semantic segmentation method can learn the difference in texture characteristics between ordinary fields and intercropped fields, and it can achieve satisfactory classification results. Compared with object-based analysis methods [10,11], the semantic segmentation method did not require a large number of segmentation experiments to determine the appropriate segmentation parameters, and it did not require manual design of the excellent classification features. Compared with advanced semantic segmentation methods such as PSPNet, DeepLabV3+, DNLNet, and OCRNet, the proposed method performed object-level optimization and performed better in processing image details, segmenting field edges, and identifying intercropped crops. Therefore, we believe that the proposed method could be leveraged in other intercropping research contexts (such as green pepper with corn, watermelon with wheat, and black beans with sorghum).
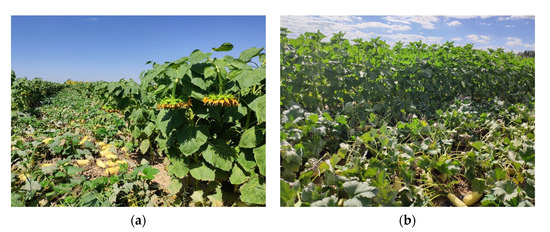
Figure 11.
The on-site images of zucchinis intercropped with sunflowers: (a) the angle from the front; (b) the angle from the side.
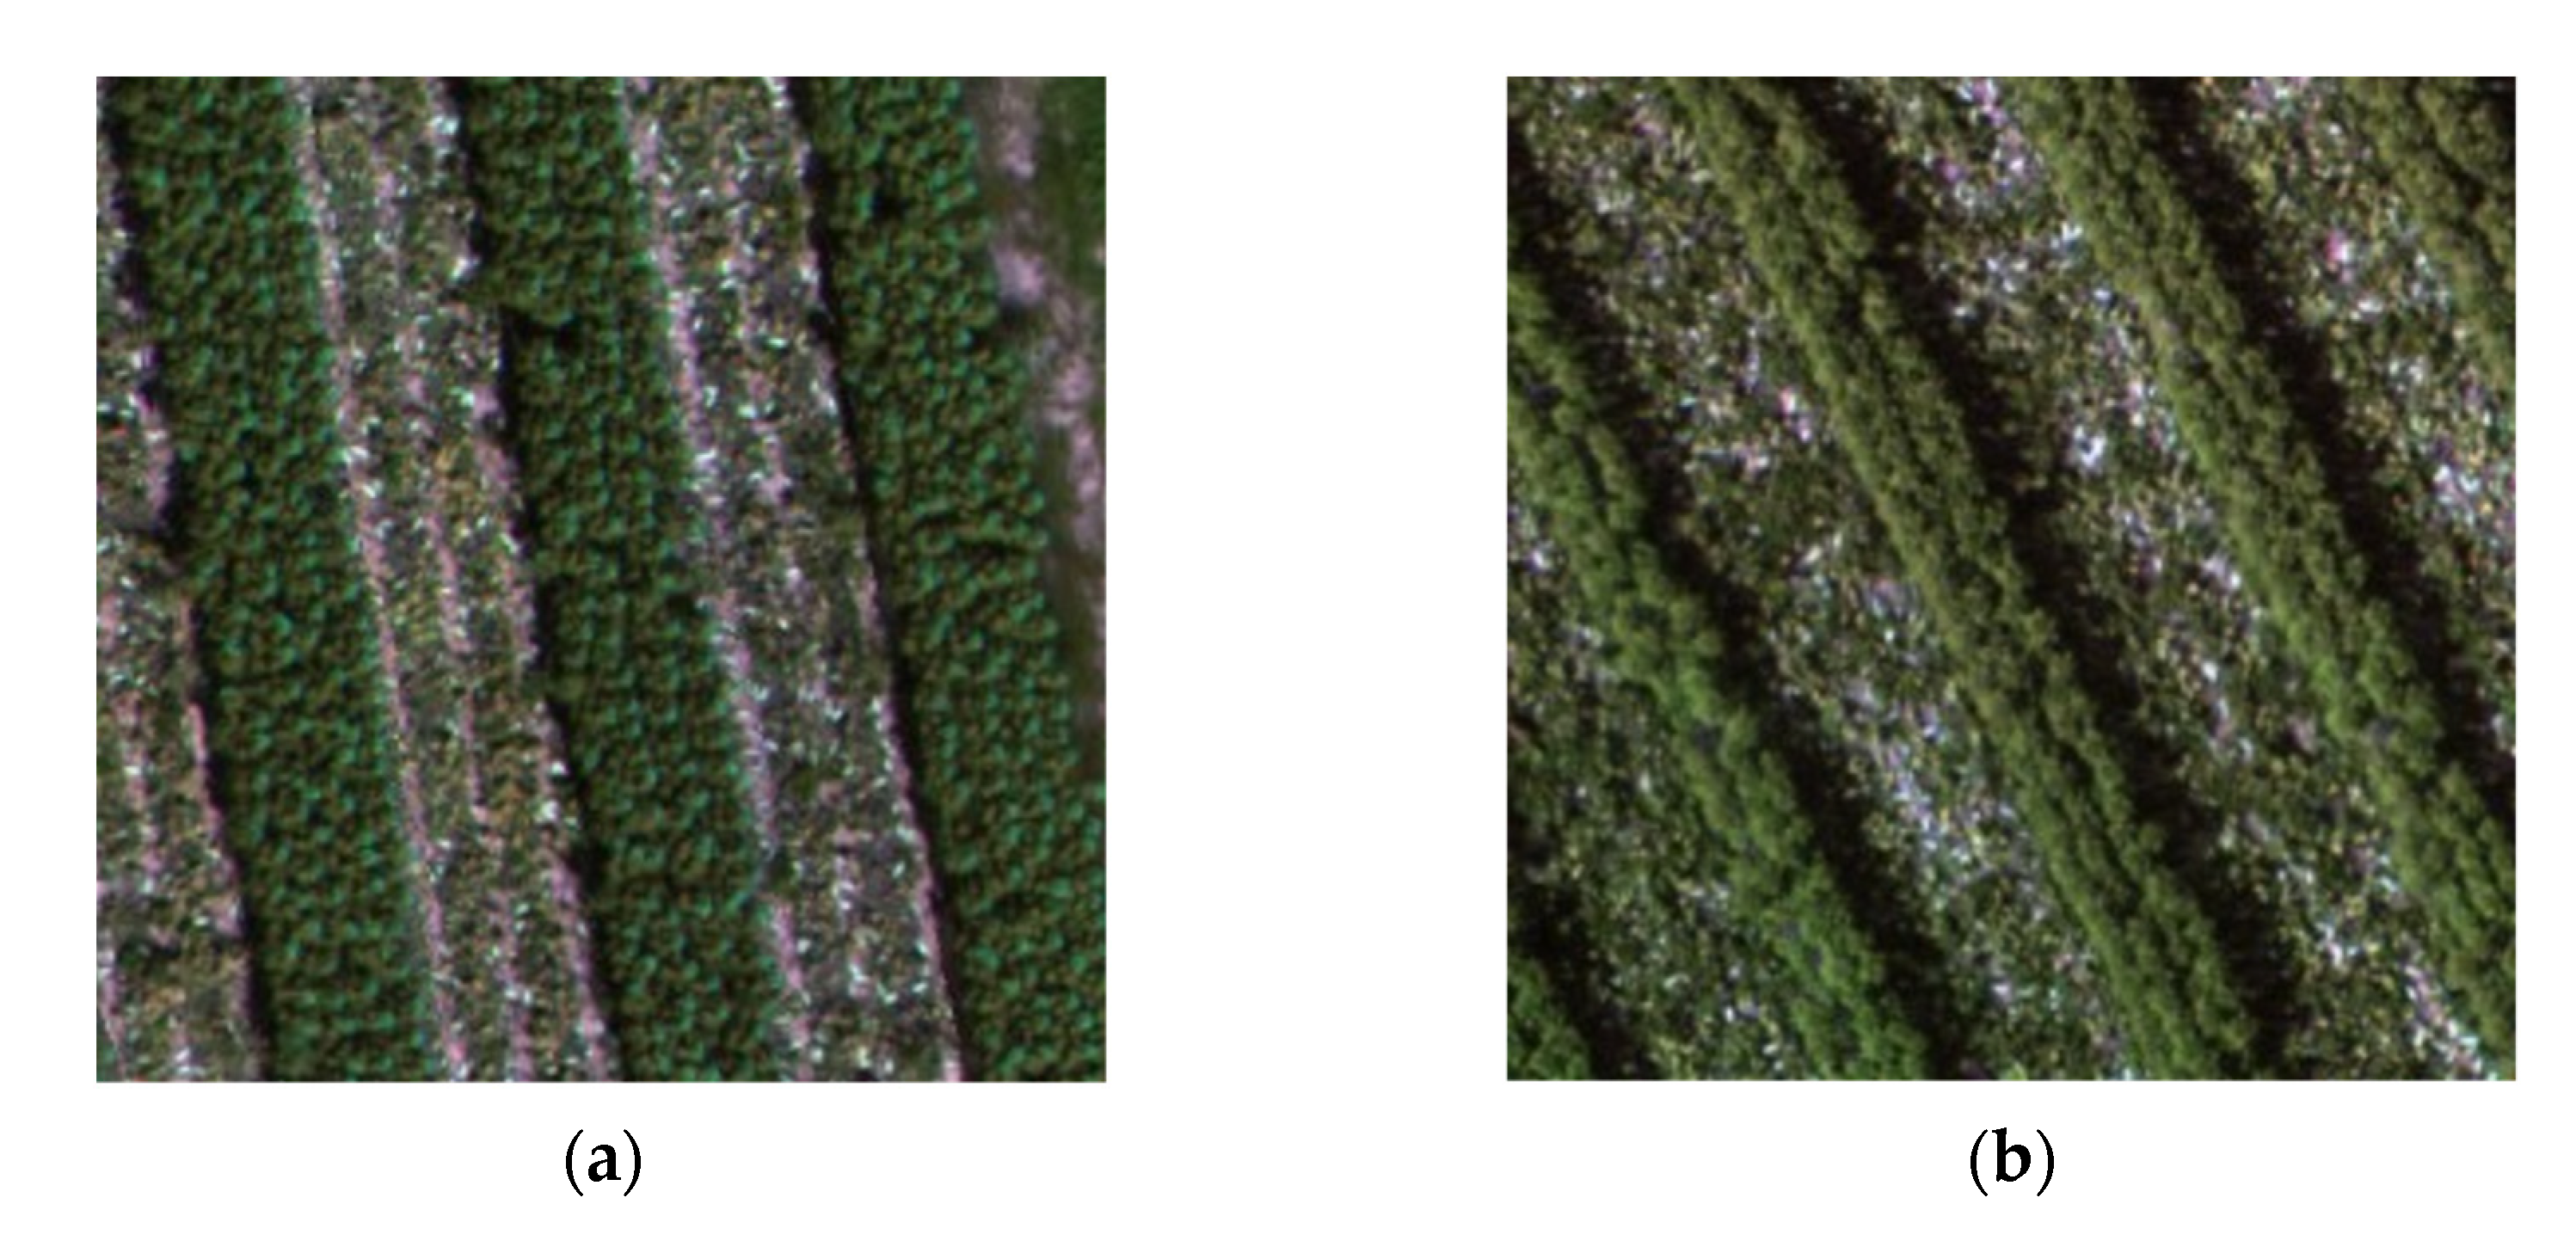
The planting pattern of zucchinis intercropped with sunflowers is usually four rows of zucchinis and four rows of sunflowers or six rows of zucchinis and four rows of sunflowers [5]. This is reflected in test area 1 and test area 2 of this study, as shown in Figure 12. The method we proposed showed high accuracy in the identification of zucchinis intercropped with sunflowers. However, in test area 1 and test area 2, only three fields were interplanted with zucchinis and sunflowers. Compared with single-planted crops, the area of intercropped crops was relatively small. Affected by the small amount of experimental data, it was difficult to prove that the method we proposed can identify well zucchinis intercropped with sunflowers under a broad array of conditions. For example, the sunflowers in the intercropping field are growing unevenly. From our experimental results, we can see that neither the most advanced semantic segmentation method nor the method we proposed can identify uneven sunflowers well. For the intercropping fields where the above-mentioned situation occurs, these methods may all have the same problems.
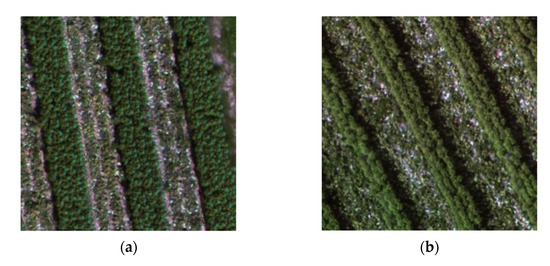
Figure 12.
Planting pattern of zucchinis intercropped with sunflowers: (a) four rows of zucchinis and four rows of sunflowers; (b) six rows of zucchinis and four rows of sunflowers.
In addition, some research has shown that crops have higher reflectivity in the near-infrared band, and the spectral characteristics at this band can reflect well the physiological growth changes in crops [52]. At the same time, the relevant vegetation index can also widen the difference between different crops and provide powerful help for crop identification [53,54]. The experimental results in this article were all based on RGB visible images. Although this data acquisition is very convenient, it still limits the accuracy of our identification of intercropping crops to a certain extent. In future research, it would be prudent to add some sensitive vegetation features on the basis of the RGB three-channel image to assist the identification of intercropping crops. By increasing the diversity and pertinence of training data, the generalization ability of the model for intercropping crop recognition in different situations may be improved.
5. Conclusions
Intercropping is used widely in agricultural practice. Therefore, the automatic and accurate identification of intercropping plots will help estimate the yield results of intercropping areas and provide a basis for the adjustment of agricultural planting structure. Taking zucchinis intercropped with sunflowers in the Hetao Irrigation Area of Inner Mongolia, China as an example, this paper proposed an identification method for zucchinis intercropped with sunflowers in UAV visible images based on improved OCRNet. The proposed method was compared with PSPNet, Deeplabv3+, DNLNet, and OCRNet in two test areas.
The mIoU and intercropping IoU of our proposed method in test area 1 reached 94.44% and 96.57%, respectively, and the mIoU and Intercropping IoU in test area 2 reached 95.05% and 94.51%, respectively. In terms of object-level evaluation metrics (mIoU and intercropping IoU), our proposed method had more advantages than other semantic segmentation methods did.
Moreover, the semantic segmentation method used in this paper can learn well the differences in texture features between ordinary fields and intercropping fields, and it can achieve satisfactory segmentation results for crop classification and intercropping recognition in the two test areas. Compared with other advanced semantic segmentation methods, our method was better in processing image details, segmenting field edges, and identifying intercropping crops.
Finally, we proved that two changes to OCRNet led to performance improvements: using channel features with different weights reasonably and increasing object-level supervision loss. On the basis of OCRNet, increasing the channel attention mechanism and using the mixed loss function were helpful for improving the crop classification and intercropping recognition accuracy of UAV visible images, particularly in terms of object-level evaluation metrics (mIoU and intercropping IoU).
Author Contributions
Conceptualization, S.H. and W.H.; methodology, S.H.; investigation, S.H., G.L. and J.T.; data curation, S.H., G.L. and H.C.; writing—original draft preparation, S.H.; writing—review and editing, W.H., G.L., J.T. and H.C. All authors have read and agreed to the published version of the manuscript.
Funding
This study was supported by the National Natural Science Foundation of China (51979233), Technology of the People’s Republic of China (2017YFC0403203), and the 111 Project (No. B12007).
Data Availability Statement
Not applicable.
Acknowledgments
We would like to thank Qian Ma, Mengfei Zhang, Weitong Ma and Xin Cui for their work on field data collection.
Conflicts of Interest
The authors declare no conflict of interest.
References
- Willey, R.W. Intercropping: Its importance and research needs. Part 2, agronomy and research approaches. Field Crop. Abstr. 1979, 32, 73–85. [Google Scholar]
- Ofori, F.; Stern, W.R. Cereal-Legume Intercropping Systems. Adv. Agron. 1987, 41, 41–90. [Google Scholar]
- Stomph, T.J.; Dordas, C.; Baranger, A.; Rijk, J.D.; Werf, W. Designing intercrops for high yield, yield stability and efficient use of resources: Are there principles? Adv. Agron. 2020, 160, 1–50. [Google Scholar]
- Lv, W.; Zhao, X.; Wu, P.; Lv, J.; He, H. A Scientometric Analysis of Worldwide Intercropping Research Based on Web of Science Database between 1992 and 2020. Sustainability 2021, 13, 2430. [Google Scholar] [CrossRef]
- Zhong, S.; Wang, R.; Jin, C.; Gao, X. Study on the Cultivation Techniques of Drip Irrigation under Film for Intercropping Zucchini and Sunflower. Xiandai Nongye/Mod. Agric. 2019, 09, 49–50. [Google Scholar]
- Yang, Z.; Wen-Bin, W.U.; Di, L.; Üstündağ, B. Remote sensing for agricultural applications. J. Integr. Agric. 2017, 16, 239–241. [Google Scholar] [CrossRef]
- Hatfield, J.L.; Cryder, M.; Basso, B. Remote Sensing: Advancing the Science and the Applications to Transform Agriculture. IT Prof. 2020, 22, 42–45. [Google Scholar] [CrossRef]
- Sishodia, R.P.; Ray, R.L.; Singh, S.K. Applications of Remote Sensing in Precision Agriculture: A Review. Remote Sens. 2020, 12, 3136. [Google Scholar] [CrossRef]
- Hao, P.; Löw, F.; Biradar, C. Annual Cropland Mapping Using Reference Landsat Time Series—A Case Study in Central Asia. Remote Sens. 2018, 10, 2057. [Google Scholar] [CrossRef] [Green Version]
- Liu, M.; Li, X.; Yang, Y.; Niu, J.; Xu, D. Estimation of the Intercropped Tobacco Area Based on ZY-3 Remote Sensing Images. Anhui Nongye Kexue/Anhui Agric. Sci. 2016, 44, 291–293, 297. [Google Scholar]
- Wang, Y.; Fu, M.; Wang, L.; Wang, C. Tree-cotton intercropping land extraction based on multi-source high resolution satellite imagery. Guotu Ziyuan Yaogan/Remote Sens. Land Resour. 2017, 29, 152–159. [Google Scholar]
- Luo, H.X.; Dai, S.P.; Mao-Fen, L.I.; Liu, E.P.; Zheng, Q.; Ying-Ying, H.U.; Xiao-Ping, Y.I. Comparison of machine learning algorithms for mapping mango plantations based on Gaofen-1 imagery. J. Integr. Agric. 2020, 19, 2815–2828. [Google Scholar] [CrossRef]
- Su, T.; Zhang, S. Object-based crop classification in Hetao plain using random forest. Earth Sci. Inform. 2020, 1–13. [Google Scholar] [CrossRef]
- Han, W.; Guo, C.; Zhang, L.; Yang, J.; Lei, Y.; Wang, Z. Classification Method of Land Cover and Irrigated Farm Land Use Based on UAV Remote Sensing in Irrigation. Nongye Jixie Xuebao/Trans. Chin. Soc. Agric. Mach. 2016, 47, 270–277. [Google Scholar]
- Zhang, L.; Niu, Y.; Zhang, H.; Han, W.; Peng, X. Maize Canopy Temperature Extracted From UAV Thermal and RGB Imagery and Its Application in Water Stress Monitoring. Front. Plant Sci. 2019, 10, 1270. [Google Scholar] [CrossRef]
- Maes, W.H.; Steppe, K. Perspectives for Remote Sensing with Unmanned Aerial Vehicles in Precision Agriculture. Trends Plant Sci. 2018, 24, 152–164. [Google Scholar] [CrossRef]
- Rasmussen, J.; Azim, S.; Jensen, S.M.; Nielsen, J.; Christensen, S. The challenge of reproducing remote sensing data from satellites and unmanned aerial vehicles (UAVs) in the context of management zones and precision agriculture. Precis. Agric. 2020, 1–18. [Google Scholar] [CrossRef]
- Ma, Q.; Han, W.; Huang, S.; Dong, S.; Chen, H. Distinguishing Planting Structures of Different Complexity from UAV Multispectral Images. Sensors 2021, 21, 1994. [Google Scholar] [CrossRef]
- Yuan, X.; Shi, J.; Gu, L. A review of deep learning methods for semantic segmentation of remote sensing imagery. Expert Syst. Appl. 2021, 169, 114417. [Google Scholar] [CrossRef]
- Šerić, L.; Pinjušić, T.; Topić, K.; Blažević, T. Lost Person Search Area Prediction Based on Regression and Transfer Learning Models. ISPRS Int. J. Geo-Inf. 2021, 10, 80. [Google Scholar] [CrossRef]
- Kang, Y.; Cho, N.; Yoon, J.; Park, S.; Kim, J. Transfer Learning of a Deep Learning Model for Exploring Tourists’ Urban Image Using Geotagged Photos. ISPRS Int. J. Geo-Inf. 2021, 10, 137. [Google Scholar] [CrossRef]
- Cira, C.; Alcarria, R.; Manso-Callejo, M.; Serradilla, F. A Deep Learning-Based Solution for Large-Scale Extraction of the Secondary Road Network from High-Resolution Aerial Orthoimagery. Appl. Sci. 2020, 10, 7272. [Google Scholar] [CrossRef]
- Wu, D.; Wu, Q.; Yin, X.; Jiang, B.; Song, H. Lameness detection of dairy cows based on the YOLOv3 deep learning algorithm and a relative step size characteristic vector. Biosyst. Eng. 2020, 189, 150–163. [Google Scholar] [CrossRef]
- Long, J.; Shelhamer, E.; Darrell, T. Fully Convolutional Networks for Semantic Segmentation. In Proceedings of the IEEE Conference on Computer Vision and Pattern Recognition (CVPR), Boston, MA, USA, 7–12 June 2015. [Google Scholar]
- Huang, H.; Lan, Y.; Yang, A.; Zhang, Y.; Deng, J. Deep learning versus Object-based Image Analysis (OBIA) in weed mapping of UAV imagery. Int. J. Remote Sens. 2020, 41, 3446–3479. [Google Scholar] [CrossRef]
- Chen, B.; Xia, M.; Huang, J. MFANet: A Multi-Level Feature Aggregation Network for Semantic Segmentation of Land Cover. Remote Sens. 2021, 13, 731. [Google Scholar] [CrossRef]
- Tan, X.; Xiao, Z.; Wan, Q.; Shao, W. Scale Sensitive Neural Network for Road Segmentation in High-Resolution Remote Sensing Images. IEEE Geosci. Remote Sens. 2020, 1–5. [Google Scholar] [CrossRef]
- Ronneberger, O.; Fischer, P.; Brox, T. U-net: Convolutional Networks for Biomedical Image Segmentation. In Proceedings of the International Conference on Medical Image Computing and Computer-Assisted Intervention, Munich, Germany, 5–9 October 2015; pp. 234–241. [Google Scholar]
- Badrinarayanan, V.; Kendall, A.; Cipolla, R. SegNet: A Deep Convolutional Encoder-Decoder Architecture for Image Segmentation. IEEE Trans. Pattern Anal. Mach. Intell. 2017, 39, 2481–2495. [Google Scholar] [CrossRef]
- Yang, Q.; Liu, M.; Zhang, Z.; Yang, S.; Han, W. Mapping Plastic Mulched Farmland for High Resolution Images of Unmanned Aerial Vehicle Using Deep Semantic Segmentation. Remote Sens. 2019, 11, 2008. [Google Scholar] [CrossRef] [Green Version]
- Xu, Z.; Zhang, W.; Zhang, T.; Li, J. HRCNet: High-Resolution Context Extraction Network for Semantic Segmentation of Remote Sensing Images. Remote Sens. 2021, 13, 71. [Google Scholar] [CrossRef]
- Zhao, H.; Shi, J.; Qi, X.; Wang, X.; Jia, J. Pyramid scene parsing network. In Proceedings of the IEEE Conference on Computer Vision and Pattern Recognition, Honolulu, HI, USA, 21–26 July 2017; pp. 2881–2890. [Google Scholar]
- Chen, L.C.; Zhu, Y.; Papandreou, G.; Schroff, F.; Adam, H. Encoder-decoder with atrous separable convolution for semantic image segmentation. In Proceedings of the European Conference on Computer Vision (ECCV), Munich, Germany, 8–14 September 2018; pp. 801–818. [Google Scholar]
- Zhang, D.; Pan, Y.; Zhang, J.; Hu, T.; Chen, Q. A generalized approach based on convolutional neural networks for large area cropland mapping at very high resolution. Remote Sens. Environ. 2020, 247, 111912. [Google Scholar] [CrossRef]
- Du, Z.; Yang, J.; Ou, C.; Zhang, T. Smallholder Crop Area Mapped with a Semantic Segmentation Deep Learning Method. Remote Sens. 2019, 11, 888. [Google Scholar] [CrossRef] [Green Version]
- Wang, X.; Girshick, R.; Gupta, A.; He, K. Non-local neural networks. In Proceedings of the IEEE Conference on Computer Vision and Pattern Recognition, Salt Lake City, UT, USA, 18–22 June 2018; pp. 7794–7803. [Google Scholar]
- Cao, Y.; Xu, J.; Lin, S.; Wei, F.; Hu, H. Gcnet: Non-local networks meet squeeze-excitation networks and beyond. In Proceedings of the IEEE International Conference on Computer Vision Workshops, Seoul, Korea, 27 October–2 November 2019. [Google Scholar]
- Yin, M.; Yao, Z.; Cao, Y.; Li, X.; Zhang, Z.; Lin, S.; Hu, H. Disentangled non-local neural networks. In European Conference on Computer Vision; Springer: Cham, Switzerland, 2020; pp. 191–207. [Google Scholar]
- Yuan, Y.; Chen, X.; Wang, J. Object-contextual representations for semantic segmentation. arXiv 2019, arXiv:1909.11065. [Google Scholar]
- Hu, J.; Shen, L.; Sun, G. Squeeze-and-excitation networks. In Proceedings of the IEEE Conference on Computer Vision and Pattern Recognition, Salt Lake City, UT, USA, 18–22 June 2018; pp. 7132–7141. [Google Scholar]
- López, J.; Torres, D.; Santos, S.; Atzberger, C. Spectral Imagery Tensor Decomposition for Semantic Segmentation of Remote Sensing Data through Fully Convolutional Networks. Remote Sens. 2020, 12, 517. [Google Scholar] [CrossRef] [Green Version]
- Yang, X.; Chen, Z.; Li, B.; Peng, D.; Chen, P.; Zhang, B. A Fast and Precise Method for Large-Scale Land-Use Mapping Based on Deep Learning. In Proceedings of the IGARSS 2019-2019 IEEE International Geoscience and Remote Sensing Symposium, Yokohama, Japan, 28 July–2 August 2019; pp. 5913–5916. [Google Scholar]
- Lee, D.G.; Shin, Y.H.; Lee, D.C. Land Cover Classification Using SegNet with Slope, Aspect, and Multidirectional Shaded Relief Images Derived from Digital Surface Model. J. Sens. 2020, 2020, 1–21. [Google Scholar] [CrossRef]
- Wang, Z.; Zhou, Y.; Wang, S.; Wang, F.; Xu, Z. House building extraction from high resolution remote sensing image based on IEU-Net. J. Remote Sens. 2021. [Google Scholar] [CrossRef]
- Sun, K.; Xiao, B.; Liu, D.; Wang, J. Deep high-resolution representation learning for human pose estimation. In Proceedings of the IEEE Conference on Computer Vision and Pattern Recognition, Long Beach, CA, USA, 16–20 June 2019; pp. 5693–5703. [Google Scholar]
- Berman, M.; Triki, A.R.; Blaschko, M.B. The lovász-softmax loss: A tractable surrogate for the optimization of the intersection-over-union measure in neural networks. In Proceedings of the IEEE Conference on Computer Vision and Pattern Recognition, Salt Lake City, UT, USA, 18–22 June 2018; pp. 4413–4421. [Google Scholar]
- Lovász, L. Submodular functions and convexity. In Mathematical Programming the State of the Art; Springer: Berlin/Heidelberg, Germany, 1983; pp. 235–257. [Google Scholar]
- He, C.; Li, S.; Xiong, D.; Fang, P.; Liao, M. Remote Sensing Image Semantic Segmentation Based on Edge Information Guidance. Remote Sens. 2020, 12, 1501. [Google Scholar] [CrossRef]
- Kong, Y.; Zhang, B.; Yan, B.; Liu, Y.; Peng, X. Affiliated Fusion Conditional Random Field for Urban UAV Image Semantic Segmentation. Sensors 2020, 20, 993. [Google Scholar] [CrossRef] [Green Version]
- Zhang, C.; Chen, Y.; Yang, X.; Gao, S.; Sun, L. Improved Remote Sensing Image Classification Based on Multi-Scale Feature Fusion. Remote Sens. 2020, 12, 213. [Google Scholar] [CrossRef] [Green Version]
- He, K.; Zhang, X.; Ren, S.; Sun, J. Deep residual learning for image recognition. In Proceedings of the IEEE Conference on Computer Vision and Pattern Recognition, Seattle, WA, USA, 27–30 June 2016; pp. 770–778. [Google Scholar]
- Zhang, L.; Zhang, H.; Niu, Y.; Han, W. Mapping Maize Water Stress Based on UAV Multispectral Remote Sensing. Remote Sens. 2019, 11, 605. [Google Scholar] [CrossRef] [Green Version]
- Yeom, J.; Jung, J.; Chang, A.; Ashapure, A.; Landivar, J. Comparison of Vegetation Indices Derived from UAV Data for Differentiation of Tillage Effects in Agriculture. Remote Sens. 2019, 11, 1548. [Google Scholar] [CrossRef] [Green Version]
- Torres-Sánchez, J.; Pe, J.M.; De Castro, A.I.; López-Granados, F. Multi-temporal mapping of the vegetation fraction in early-season wheat fields using images from UAV. Comput. Electron. Agric. 2014, 103, 104–113. [Google Scholar] [CrossRef]


Publisher’s Note: MDPI stays neutral with regard to jurisdictional claims in published maps and institutional affiliations. |
© 2021 by the authors. Licensee MDPI, Basel, Switzerland. This article is an open access article distributed under the terms and conditions of the Creative Commons Attribution (CC BY) license (https://creativecommons.org/licenses/by/4.0/).