Article

Retrieving Doppler Frequency via Local Correlation Method of Segmented Modeling

1
Xinjiang Astronomical Observatory, Chinese Academy of Sciences, Urumqi 830011, China
2
National Astronomical Observatories, Chinese Academy of Sciences, Beijing 100101, China
3
University of Chinese Academy of Sciences, Beijing 100049, China
4
Beijing Aerospace Control Center, Beijing 100094, China
5
Royal Observatory of Belgium, 1180 Brussels, Belgium
6
Beijing Institute of Tracking and Telecommunications Technology, Beijing 100094, China
*
Author to whom correspondence should be addressed.
Remote Sens. 2021, 13(14), 2846; https://doi.org/10.3390/rs13142846
Submission received: 8 June 2021 / Revised: 14 July 2021 / Accepted: 16 July 2021 / Published: 20 July 2021

Abstract

:
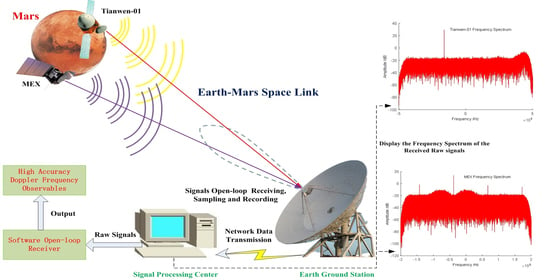
The high accuracy radio Doppler frequency is critical for navigating a deep space probe and for planetary radio science experiments. In this paper, we propose a novel method based on the local correlation of segmented modeling to retrieve Doppler frequency by processing an open-loop radio link signal from one single ground station. Simulations are implemented, which prove the validity of this method. Mars Express (MEX) and Tianwen-1 observation experiments were carried out by Chinese Deep Space Stations (CDSS). X-band Doppler frequency observables were retrieved by the proposed method to participate in orbit determination. The results show that the accuracy of velocity residuals of orbit determination in open-loop mode is from 0.043 mm/s to 0.061 mm/s in 1 s integration; the average accuracy of Doppler frequency is about 3.3 mHz in 1 s integration and about 0.73 mHz in 60 s integration. The Doppler accuracy here is better than that of the digital baseband receiver at CDSS. The algorithm is efficient and flexible when the deep space probe is in a high dynamic mode and in low signal to noise ratio (SNR). This will benefit Chinese deep space exploration missions and planetary radio science experiments.

Graphical Abstract

1. Introduction

High accuracy radio Doppler frequency, being retrieved from a carrier wave of space probe detected at a deep space station, is important for deep space probe navigation and for planetary radio science applications. Dedicated deep space tracking systems, for instance, NASA’s Deep Space Network (DSN), ESA’s tracking station network (Estrack), and Chinese Deep Space Network (CDSN), normally utilize the closed-loop mode to obtain the real-time Doppler observables to carry out navigation and telemetry measurements missions [1,2,3,4,5]. The precise Doppler measurements could be derived with the digital phase-lock loop (PLL) technique by using the closed-loop tracking receiver. Low signal-to-noise ratio (SNR) or large frequency dynamic range would lead to the phase loss-of-lock on the desired signal [6,7,8]. Specifically, some abrupt changes of frequency would cause the phase loss-of-lock in closed-loop tracking measurement mode, for instance, in planetary atmospheric occultation and ring occultation [9,10] an open-loop Doppler measurement is preferable [11,12,13,14,15]. In this case, no real-time signal detection mechanism is typically present; the carrier signal or tone signal of the deep space probe is down converted, digitized, recorded, and analyzed to extract high accuracy open-loop Doppler observables.
Many post-processing algorithms have been used to retrieve the ground-space link open-loop Doppler for both deep space navigation and planetary radio science experiments. Each open-loop algorithm has its own characteristic technique for obtaining Doppler observables for special applications. For instance, the Planetary Radio Interferometry and Doppler Experiment (PRIDE) technique could simultaneously provide Doppler and VLBI observables [9,10,16,17,18]. PRIDE contains three packages, SWSpec, SCtracker, and digital PLL to extract the carrier frequency of the deep space probe; direct Fourier transform (DFT), frequency band filtering, and PLL method are utilized. Although PRIDE has been successfully and effectively utilized in several radio science experiments, the algorithm requires massive scale computing, due to PRIDE being designed to process the large wideband VLBI signal received by VLBI telescope. Currently, among the existing open-loop algorithms, some have the disadvantages of complicated algorithms and a huge amount of calculation [6,8], some require special hardware platforms for signal processing [19,20], and others utilize the PLL technique such as real-time PLL in closed-loop mode [10,12], in which the risk of loss-of-lock exists. The post-processing techniques of the open-loop Doppler may differ because different radio science or engineer teams develop their own software for signal processing and application. In these low SNR and large frequency dynamics range circumstances, whether the precise Doppler frequency can be derived is the most important objective in the open-loop algorithm.
In this paper, we propose an improved method which utilizes the algorithm of local correlation with segmentation modeling. Compared with traditional methods, this improved method is realizable and effective, which has been successfully applied to the received signal based on one single ground station to provide high accuracy open-loop Doppler observables. Fast Fourier transform (FFT) and chirp-Z transform (CZT) algorithms are initially utilized to construct the preliminary carrier frequency fitting model of the received signal, and then the algorithm of local correlation with segmentation modeling is utilized to reconstruct the residual frequency. The final estimated carrier frequency is obtained by adding the fitting model frequency with the residual frequency. The PLL technique is not utilized in this method to avoid the loss-of-lock condition frequently occurring under high dynamics and low SNR conditions. This innovative method could provide high accuracy Doppler observables for deep space navigation and radio science applications.

2. Methods

This section describes the algorithm flow of the local correlation method of segmented modeling to estimate the Doppler frequency of the deep space probe. All the physical quantities utilize international standard units in this paper. For example, the unit of frequency is Hz, the unit of phase is rad, the unit of time is s, the unit of distance is m, and the unit of velocity is m/s. The probe’s downlink carrier signal y ( t ) could be expressed as:
y ( t ) = exp j [ 2 π ( f s k y + f d o p ) t + φ 0 ]
where f s k y denotes sky frequency of the probe, φ 0 denotes initial phase, t denotes time scale, and f d o p denotes Doppler frequency between the probe and the ground station.
The downlink signal of the probe propagates through interplanetary space, which is received by ground telescope and converted to intermediate frequency, then sampled and recorded by the acquisition equipment of the ground station.
In order to conveniently describe the procedure of signal processing, the following equation utilizes the discrete format of the signal. Thus, the probe’s carrier digital signal y ( t i ) sampled by acquisition equipment could be expressed as:
y ( t i ) = exp j [ 2 π f s k y ( t i L i c ) + 2 π f d o p t i 2 π f l o c t i + φ 0 ] , i = 1 , 2 , , N
where t i denotes discrete time scale, N denotes the number of the analyzed signal points, L i denotes the distance between the probe and ground station at t i , c denotes the speed of the light in vacuum, which is 299,792,458 m/s, f d o p denotes Doppler frequency between the probe and ground station at t i , and f l o c denotes local oscillator frequency at ground station. The sampling frequency is written as f s ; thus, the time scale interval of the sampling is Δ t = 1 f s .
Then, the signal processing procedure is introduced as follows.
Firstly, the carrier frequency of the probe is preliminarily estimated by FFT. The estimated results of the probe’s carrier frequency are expressed as f f f t _ i   , i = 1 , 2 , , P , where P denotes the discrete number, P = N n f f t , and n f f t denotes the number of FFT calculation points. The frequency resolution of FFT is expressed as d f = f s n f f t .
Secondly, the carrier frequency is further estimated by CZT [21]. The CZT is applied to the peak value of each discrete point estimated by FFT in step one. The purpose of CZT is to zoom in on the narrow-band in the frequency domain to obtain the higher- frequency resolution of the analyzed signal. The algorithm of CZT is mature. The parameter settings of using CZT include the narrow frequency bandwidth, the starting frequency, the length of the CZT transform, and the sampling frequency. The narrow frequency bandwidth is recommended to be [ f f f t _ i d f , f f f t _ i + d f ] in each CZT calculation, which means the bandwidth is 2 d f . The starting frequency is f f f t _ i d f . The length of the CZT transform is recommended to be 2000 d f , and thus the frequency resolution of CZT will be improved by 1000 times than that of FFT. The CZT method improves frequency resolution of the analyzed signal to obtain more accurate carrier frequency written as f c z t _ i   , i = 1 , 2 , , P .
Thirdly, the segmented modeling method is introduced into the post signal processing procedure, and the signal of the probe is reprocessed via the local correlation method of segmented modeling.
The estimated frequencies f c z t _ i   , i = 1 , 2 , , P are divided into several segments with the same fixed length K , where K denotes the settings length number in one segmented modeling, and Q denotes the total segmented number, P = K × Q . The parameters including N , n f f t , P , K , and Q are positive integers in this paper. The relationship of these parameters is described as N = n f f t × P = n f f t × K × Q .
In this local correlation method of segmented modeling, K and n f f t are two of the important parameters which are required to be set. The setting of K and n f f t will sensitively affect the accuracy of the retrieving Doppler frequency. There are two influencing factors for selection of K and n f f t as follows: one is the SNR of the received signal and the other is the dynamic variation feature of the received signal. In general, when the SNR is low, K is recommended to be large; when frequency dynamic variation feature is appropriately small, K is recommended to be large, and vice versa. Furthermore, when the SNR is low, n f f t is recommended to be large; when frequency dynamic variation feature is small, n f f t is recommended to be large, and vice versa. The selection of K and n f f t will be comprehensively considered in the other situations. There is an empirical selection of K and n f f t for reference: 0.005 n f f t f s 0.5 and 10 K 50 in practical signal processing procedure.
Then, each f c z t _ i   , i = 1 , 2 , , K is utilized to obtain the fitting model of the carrier frequency by least squares polynomial fitting:
i = 1 K [ f ( t m i d _ i ) f c z t _ i ] 2 = min
f ( t ) = q 1 t n + q 2 t n 1 + + q n t + q n + 1
where n denotes the order of the polynomial fitting, q 1 , q 2 , , q n + 1 denotes the coefficient of the polynomial fitting, and t m i d _ i denotes the time mid-value of the discrete samples of the segment with n f f t points. The value of n can be set with the integer; however, it is recommended to fix n in one observation scan. In practical cases, n is normally set to 1 for calculation because linear segmentation is suitable to obtain good performance.
Then, the differential frequency Δ f i is written as:
Δ f i = f c z t _ i f s k y , i = 1 , 2 , , K
Since Doppler phenomenon exists, Δ f i = f c z t _ i f s k y , i = 1 , 2 , , K will not be always equal to 0, except for the relatively static velocity between the probe and the ground station that exist during the entire observation time.
The fitting model of the delay rate is obtained by least squares polynomial fitting in the same way, written as:
i = 1 K [ τ ˙ ( t m i d _ i ) Δ f i f s k y ] 2 = min
τ ˙ ( t ) = p 1 t n + p 2 t n 1 + + p n t + p n + 1  
where n denotes the order of the polynomial fitting and p 1 , p 2 , , p n + 1 denotes the coefficient of the polynomial fitting. The unit of delay rate is s/s.
Since the delay could be obtained by the integration calculation of the delay rate, the delay model is written as Equation (8). The unit of the delay is s. There are two constraint conditions to obtain the delay model: Δ f i = f c z t _ i f s k y 0 (not always equal to 0) and t > 0 , which should be satisfied in practical signal processing procedure.
τ ( t ) = p 1 n + 1 t n + 1 + p 2 n t n + + p n 2 t 2 + p n + 1 t  
After obtaining the delay model, the local signal model y c o n s ( t i ) of the probe in each n f f t points could be reconstructed and written as Equation (9). Then, the local signal model in K segments can be easily obtained as y c o n s [ t i + ( j 1 ) × n f f t × Δ t ] ,   j = 1 , 2 , , K .
y c o n s ( t i ) = exp j [ 2 π f s k y ( t i τ ( t i ) ) 2 π f l o c t i ] , i = 1 , 2 , , n f f t
Then, the correlation calculation written as Equation (10) is implemented by the local signal model and the real received signal, where f f t denotes FFT calculation and denotes conjugate calculation.
Y ( j , i ) = f f t { y [ t i + ( j 1 ) × n f f t × Δ t ] } f f t { y c o n s [ t i + ( j 1 ) × n f f t × Δ t ] } , j = 1 , 2 , , K ; i = 1 , 2 , , n f f t
The correlation phase ϕ max _ j at the max frequency could be easily obtained in the correlation spectrum by Equation (10). Thus, the estimated residual frequency f r e s _ j could be obtained by least squares linear fitting written as Equation (11), where T = n f f t × Δ t denotes the time of each FFT calculation. Each segment f r e s _ k , k = 1 , 2 , , Q utilizes one set of coefficients. This is shown as Equation (12), where a k , b k denotes the coefficient of the linear fitting in one segment signal processing:
j = 1 K ( 2 π f r e s _ j T j ϕ max _ j ) 2 = min
f r e s _ k = a k t + b k
The estimated frequency of the segmented signal is obtained by adding the residual frequency and the model frequency, written as Equation (13). The model frequency is calculated as Equation (14), which is implemented by taking the middle time of each FFT calculation into Equation (4).
f e s t = f m o d e l + f r e s
f m o d e l = f ( T 2 )
Finally, the estimated frequency of the other segmented signal could be easily obtained by the local correlation method of segmented modeling in the same way. Thus, the estimated Doppler frequency of the probe could be easily obtained, shown as Equations (15) and (16).
f d = f e s t f T = ( c + v c v 1 ) f T v c f T p r o b e
f d = f e s t q f T = ( c + v 1 c v 1 c + v 2 c v 2 1 ) q f T 2 v c q f T s t a t i o n
Equation (15) shows that the velocity of the deep space probe relative to the ground station could be obtained from the estimated one way Doppler frequency. Where f T p r o b e denotes the transmitting frequency from the probe, v is the velocity of the probe relative to the ground station, and c is the velocity of light in a vacuum. In general, v c . Equation (16) shows that the velocity of the deep space probe relative to the ground station could be obtained from the estimated two or three-way Doppler frequency. Where f T s t a t i o n denotes the transmitting frequency from the probe, v is the velocity of the probe relative to the ground station in two-way mode, v 1 is the velocity of the probe relative to the uplink ground station, v 2 is the velocity of the probe relative to the downlink ground station, and q denotes the transponder turnaround ratio of the probe. In general, v c and the distance is very long in the flying mission of the deep space probe, thus v 1 = v 2 = v is approximately achieved. Therefore, the Doppler velocity of the probe could be obtained as Equations (17) and (18), respectively, for one-way mode and two/three mode.
v ( f e s t f T ) c f T p r o b e
v ( f e s t f T ) c 2 q f T p r o b e

3. Simulation

In order to evaluate the validity of the method before processing the real signal of the deep space probe, it is important to check whether the results obtained from the method in Section 2 are strictly identical with the theoretical ones. Numerous simulations are performed under the condition of no random noise. One example is selected to display the simulation procedure and the results are shown in Figure 1.
The signal expression is written just as Equation (1). The sky frequency of the probe is set to 1040 kHz, the Doppler frequency is set to 5.0 × t i , the initial phase is set to 0.2 rad, and the sampling frequency is set to 4 MHz. The time of the simulation signal lasts 10 s.
In the simulation signal processing procedure, which has no random noise, n f f t is set to 20 k, the number of segments K is set to 20. Figure 1a shows the FFT spectrum of the simulation signal. There is only one spectral line corresponding to the maximum amplitude, due to just one basic frequency being set in simulation. Figure 1b shows the correlation phase result by the cross correlation calculation of the local signal model and the real simulation signal. This correlation phase result is obtained by unwrapping 2 π ambiguities of the total correlation phases. Figure 1c shows the estimated frequency and the theoretical frequency, and Figure 1d shows the differential values between the estimated frequency and the theoretical frequency in 1 s integration. As is shown, the differential values are very small at just 1.25 × 10⁻³ mHz in 1 s integration, which may be caused by the truncation error of the computer. It proves the validity of the method of Section 2.
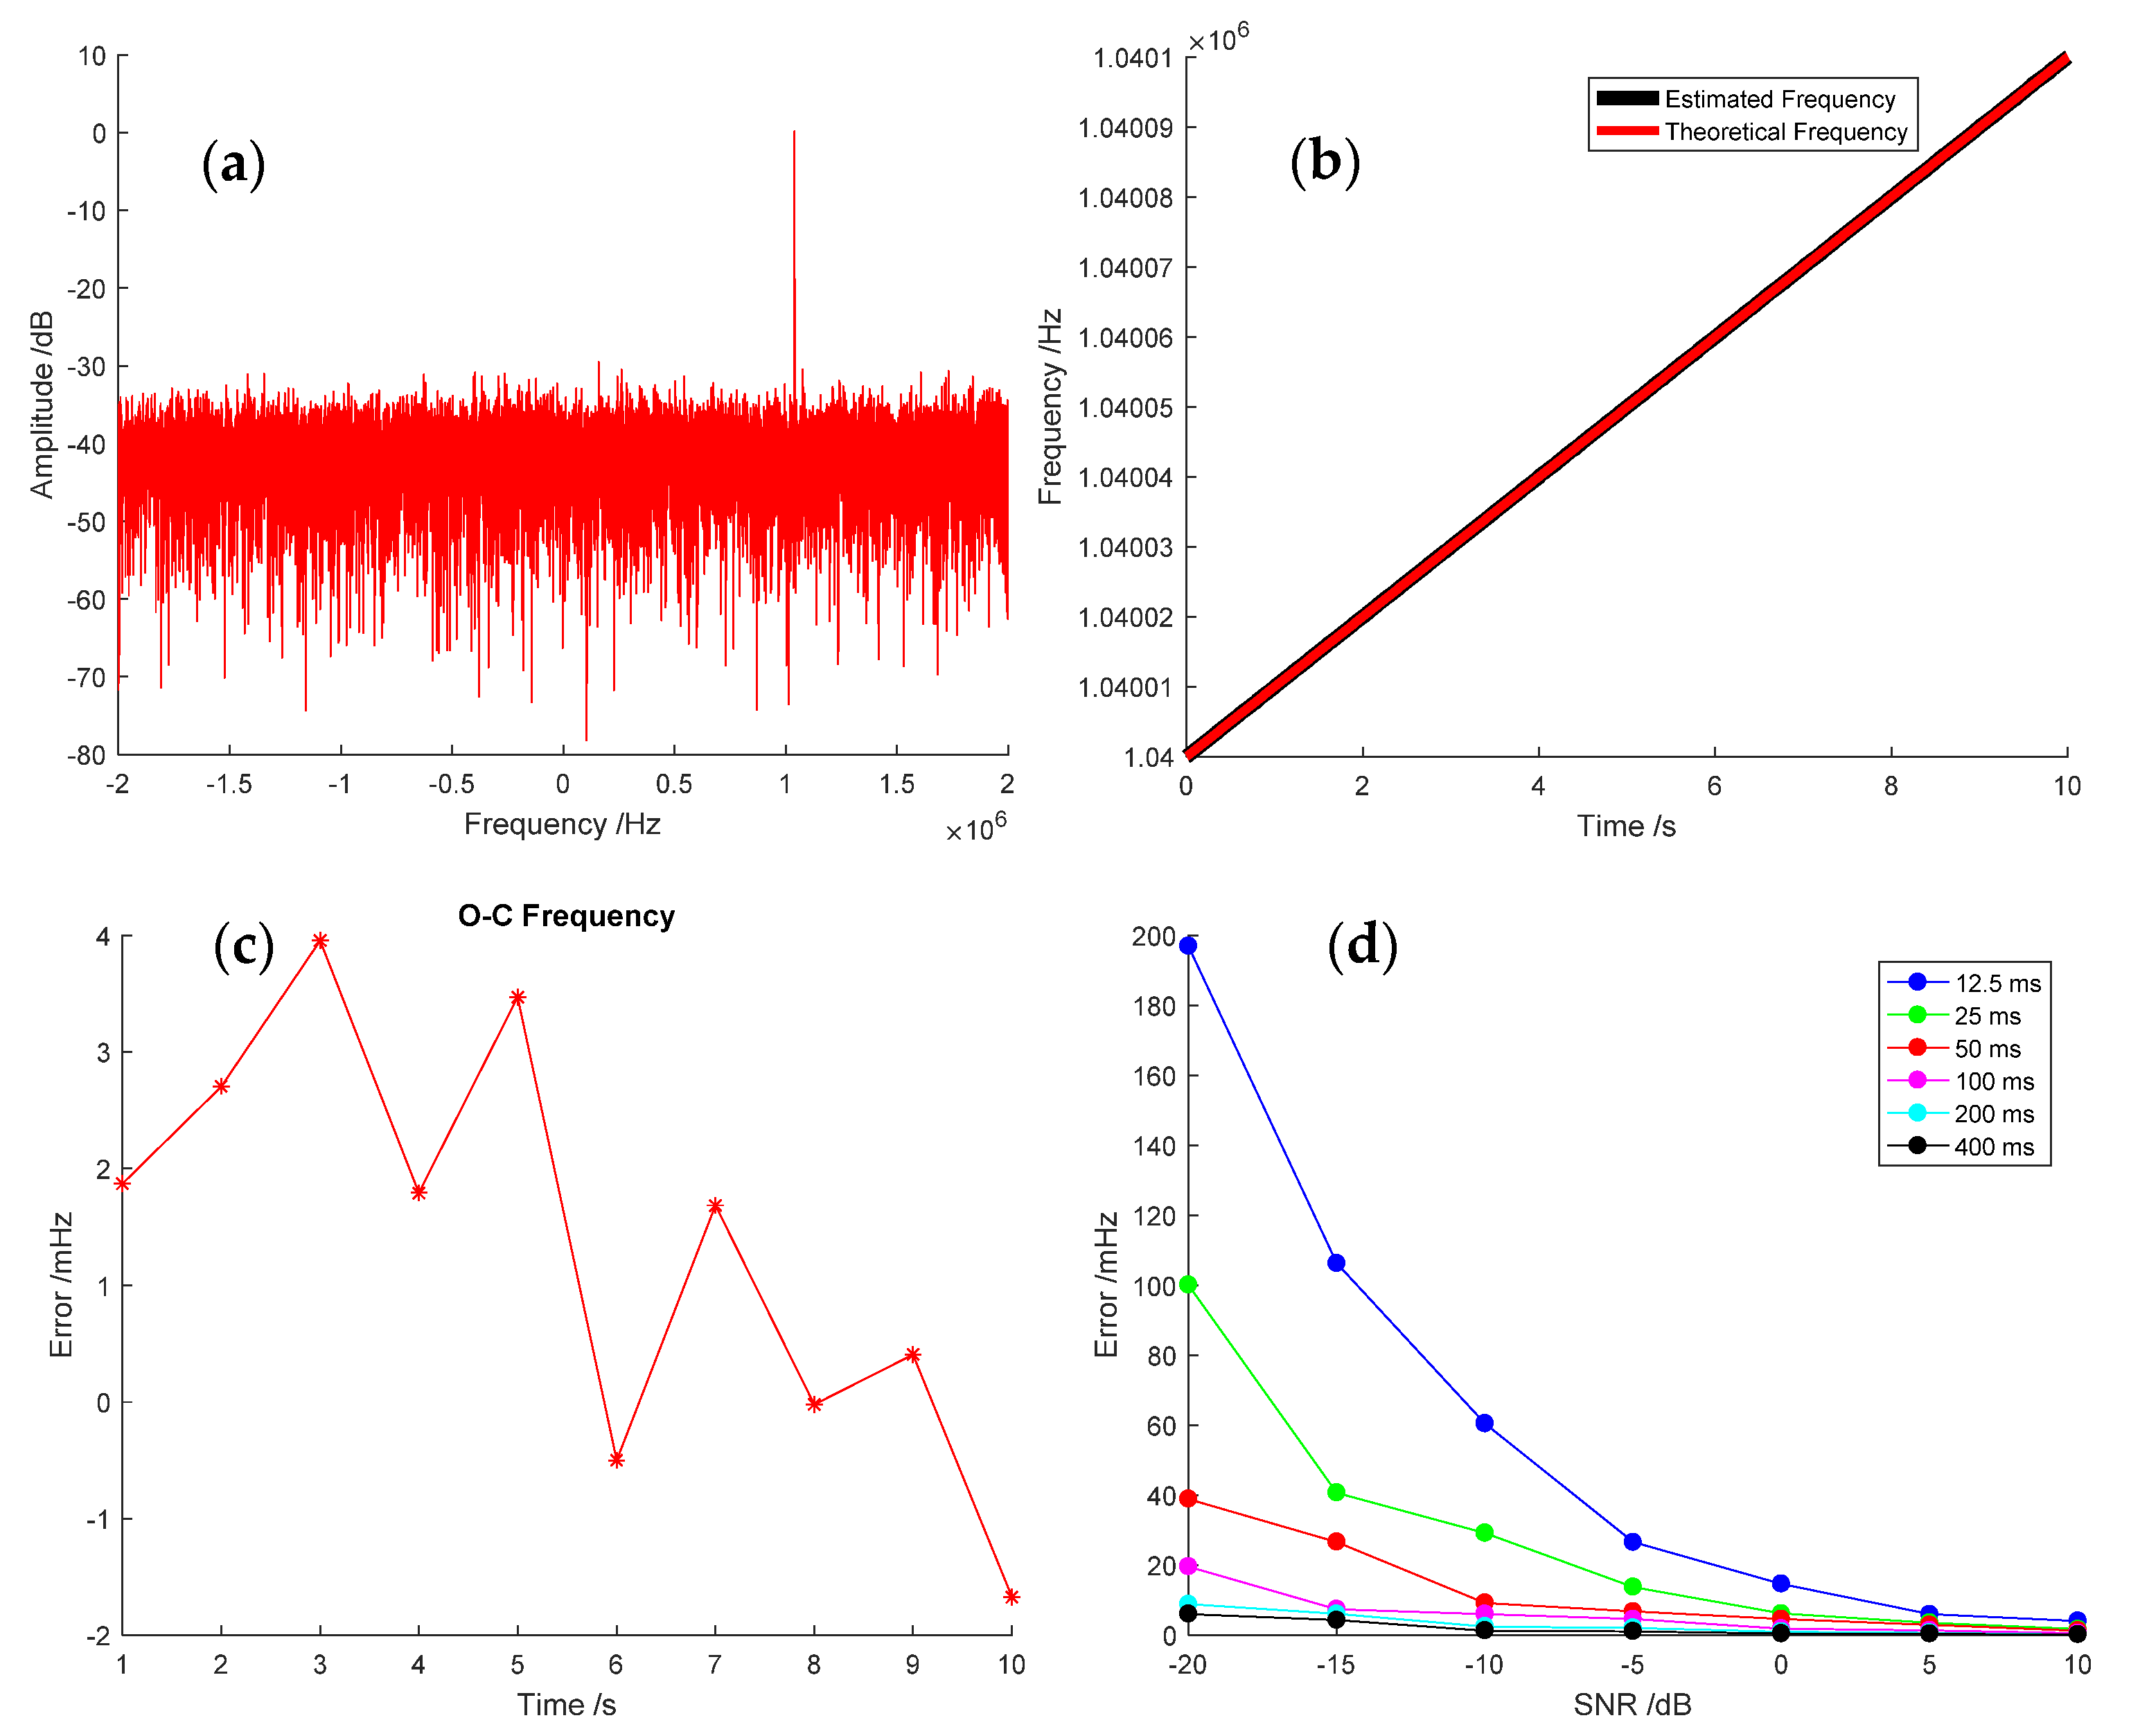
In practical application, the received signal of the probe always contains random noise. In order to evaluate the accuracy of the proposed algorithm under the condition of the random noise, we carry out the simulations in six situations. The random noise is added to the pure carrier of the cosine wave. The SNR is defined to compare the level of the desired signal with the level of background noise. In other words, the SNR is the ratio of signal power to the noise power, and its unit of expression is typically in decibels (dB). In six situations, SNRs are set from −20 dB to 10 dB. In addition, the sky frequency of the probe is set to 1040 kHz, the Doppler frequency is set to 5.0 × t i , the initial phase is set to 0.2 rad, and the sampling frequency f s is set to 4 MHz. Furthermore, we carried out many simulations under the condition of random noise. One of the simulations is shown in Figure 2: n f f t is set to 20 k and the number of segments K is set to 40. Figure 2a shows the FFT spectrum with the SNR of −10 dB. Figure 2b shows the estimated frequency and the theoretical frequency. As is shown, the estimated frequency is almost identical with the theoretical frequency. Figure 2c shows the differential values between the estimated frequency and the theoretical frequency in 1 s integration. The root-mean-square (RMS) of the residual frequency is 2.185 mHz.
Since n f f t and K are important, which may cause different accuracies in the estimated frequency, different parameters with six groups are set at different SNR conditions for simulation verification. The length of one signal processing is equal to n f f t × K , in simulation, n f f t is fixed to 20 k, and K is set from 5 to 100, thus the length of one signal processing is from 12.5 ms to 400 ms. All the results of the estimated frequencies are interpolated with the 1 s integration interval to conveniently compare the result of the RMS in the same scale. The frequency calculation errors at different SNR conditions are shown in Figure 2d. It is obvious that when the SNR is higher, the estimated error is smaller. The SNR is the most sensitive element to influence the estimated error in this simulation. The estimated accuracy would be improved by appropriately extending the length of one processing time of the signal. This validates the method in Section 2.

4. Results

In order to verify the proposed method, the raw signals obtained from the Mars Express and Tianwen-1 orbiter observation experiment were utilized to evaluate the estimated frequency accuracy when the two probes were both on the orbit of Mars. The observation experiments were implemented by CDSN. The CDSN consists of three Chinese deep space stations (CDSS), Jiamusi (JM) station, Kashi (KS) station, and Argentina (AG) station. The location of CDSS is shown in Figure 3. JM station is located in Northeast China with one telescope of 66 m, KS station is located in Northwest China with 4 telescopes of 35 m, and AG station is located in southwestern Argentina with one telescope of 35 m. The CDSS not only supported Chinese lunar exploration missions and Mars exploration missions, but also carried out some deep space navigation experiments and radio science experiments [22,23,24].

4.1. Mars Express Experiment

The MEX orbiter was launched on 2 June 2003 and has been orbiting the red planet since December 2003 [25]. Before the first Chinese Mars exploration mission of Tianwen-1 was carried out, the China National Space Administration (CNSA) cooperated with the European Space Agency (ESA) to test Mars’ probe navigation performance of CDSN in 2020. MEX was utilized to test and verify the feasibility of orbit measurement and orbit determination at the distance between Earth and Mars by CDSS.
On 3 April and 16 April 2020, MEX observation experiments were carried out by CDSS. MEX was in an elliptical orbit with periaerion of ~340 km, apoaerion of ~10,500 km, and an orbital period of ~7.0 h. An open-loop digital signal recorder assembly for interferometry signal sampling was utilized to record the signal of MEX, with 4 MHz sampling frequency and 4-bit quantification. The format of the recorded signal is Delta-DOR Raw Data Exchange Format (RDEF) [26]. The raw recorded signal could be used not only for the interferometry, but also for the open-loop Doppler extraction.
On 3 April, the KS station transmitted the uplink signal to MEX in X band (7.1 GHz), and received the coherent frequency from MEX in X band (8.4 GHz). This means that the observation of KS station utilized a two-way mode. The observation time of the KS station lasted about 2 h. Then, the AG station observed MEX for approximately 1.2 h. The AG station received the downlink signal in X band (8.4 GHz) by three-way mode, when the uplink station was the Cebreros (CB) deep space station in Spain.
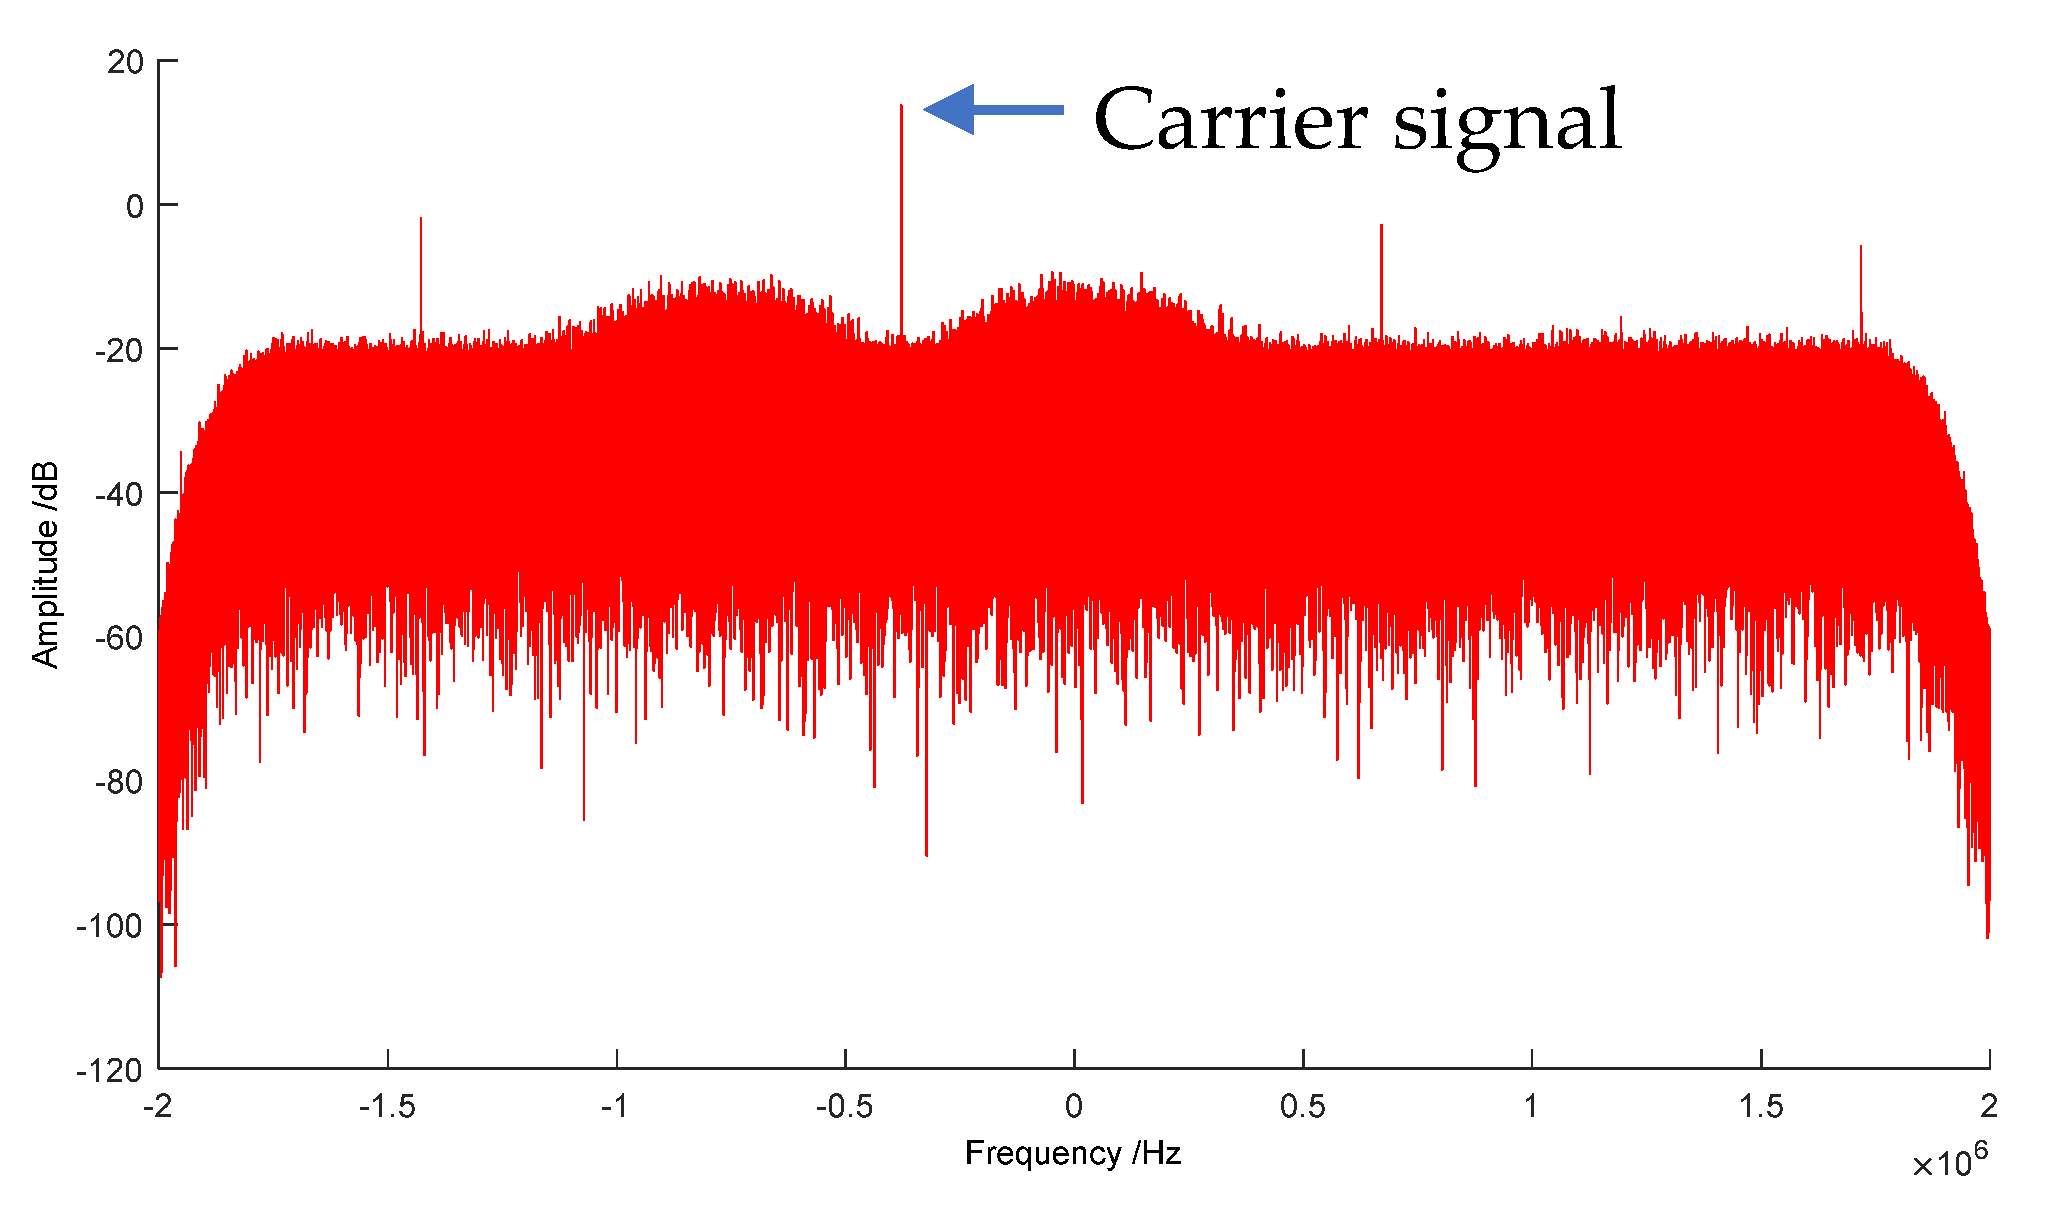
Figure 4 shows the FFT spectrum of MEX in the KS station on 3 April. The signal corresponding to the max amplitude in the FFT spectrum is the carrier signal of MEX in Figure 4. The carrier signal is utilized to extract the high accuracy Doppler frequency by the proposed method.
In the signal processing procedure of MEX, n f f t is set to 400 k, and K is set to 10. Open-loop Doppler observables were obtained by the local correlation method of segmented modeling. Meanwhile, the digital baseband receiver of the station provided real-time Doppler observables by digital PLL technique.
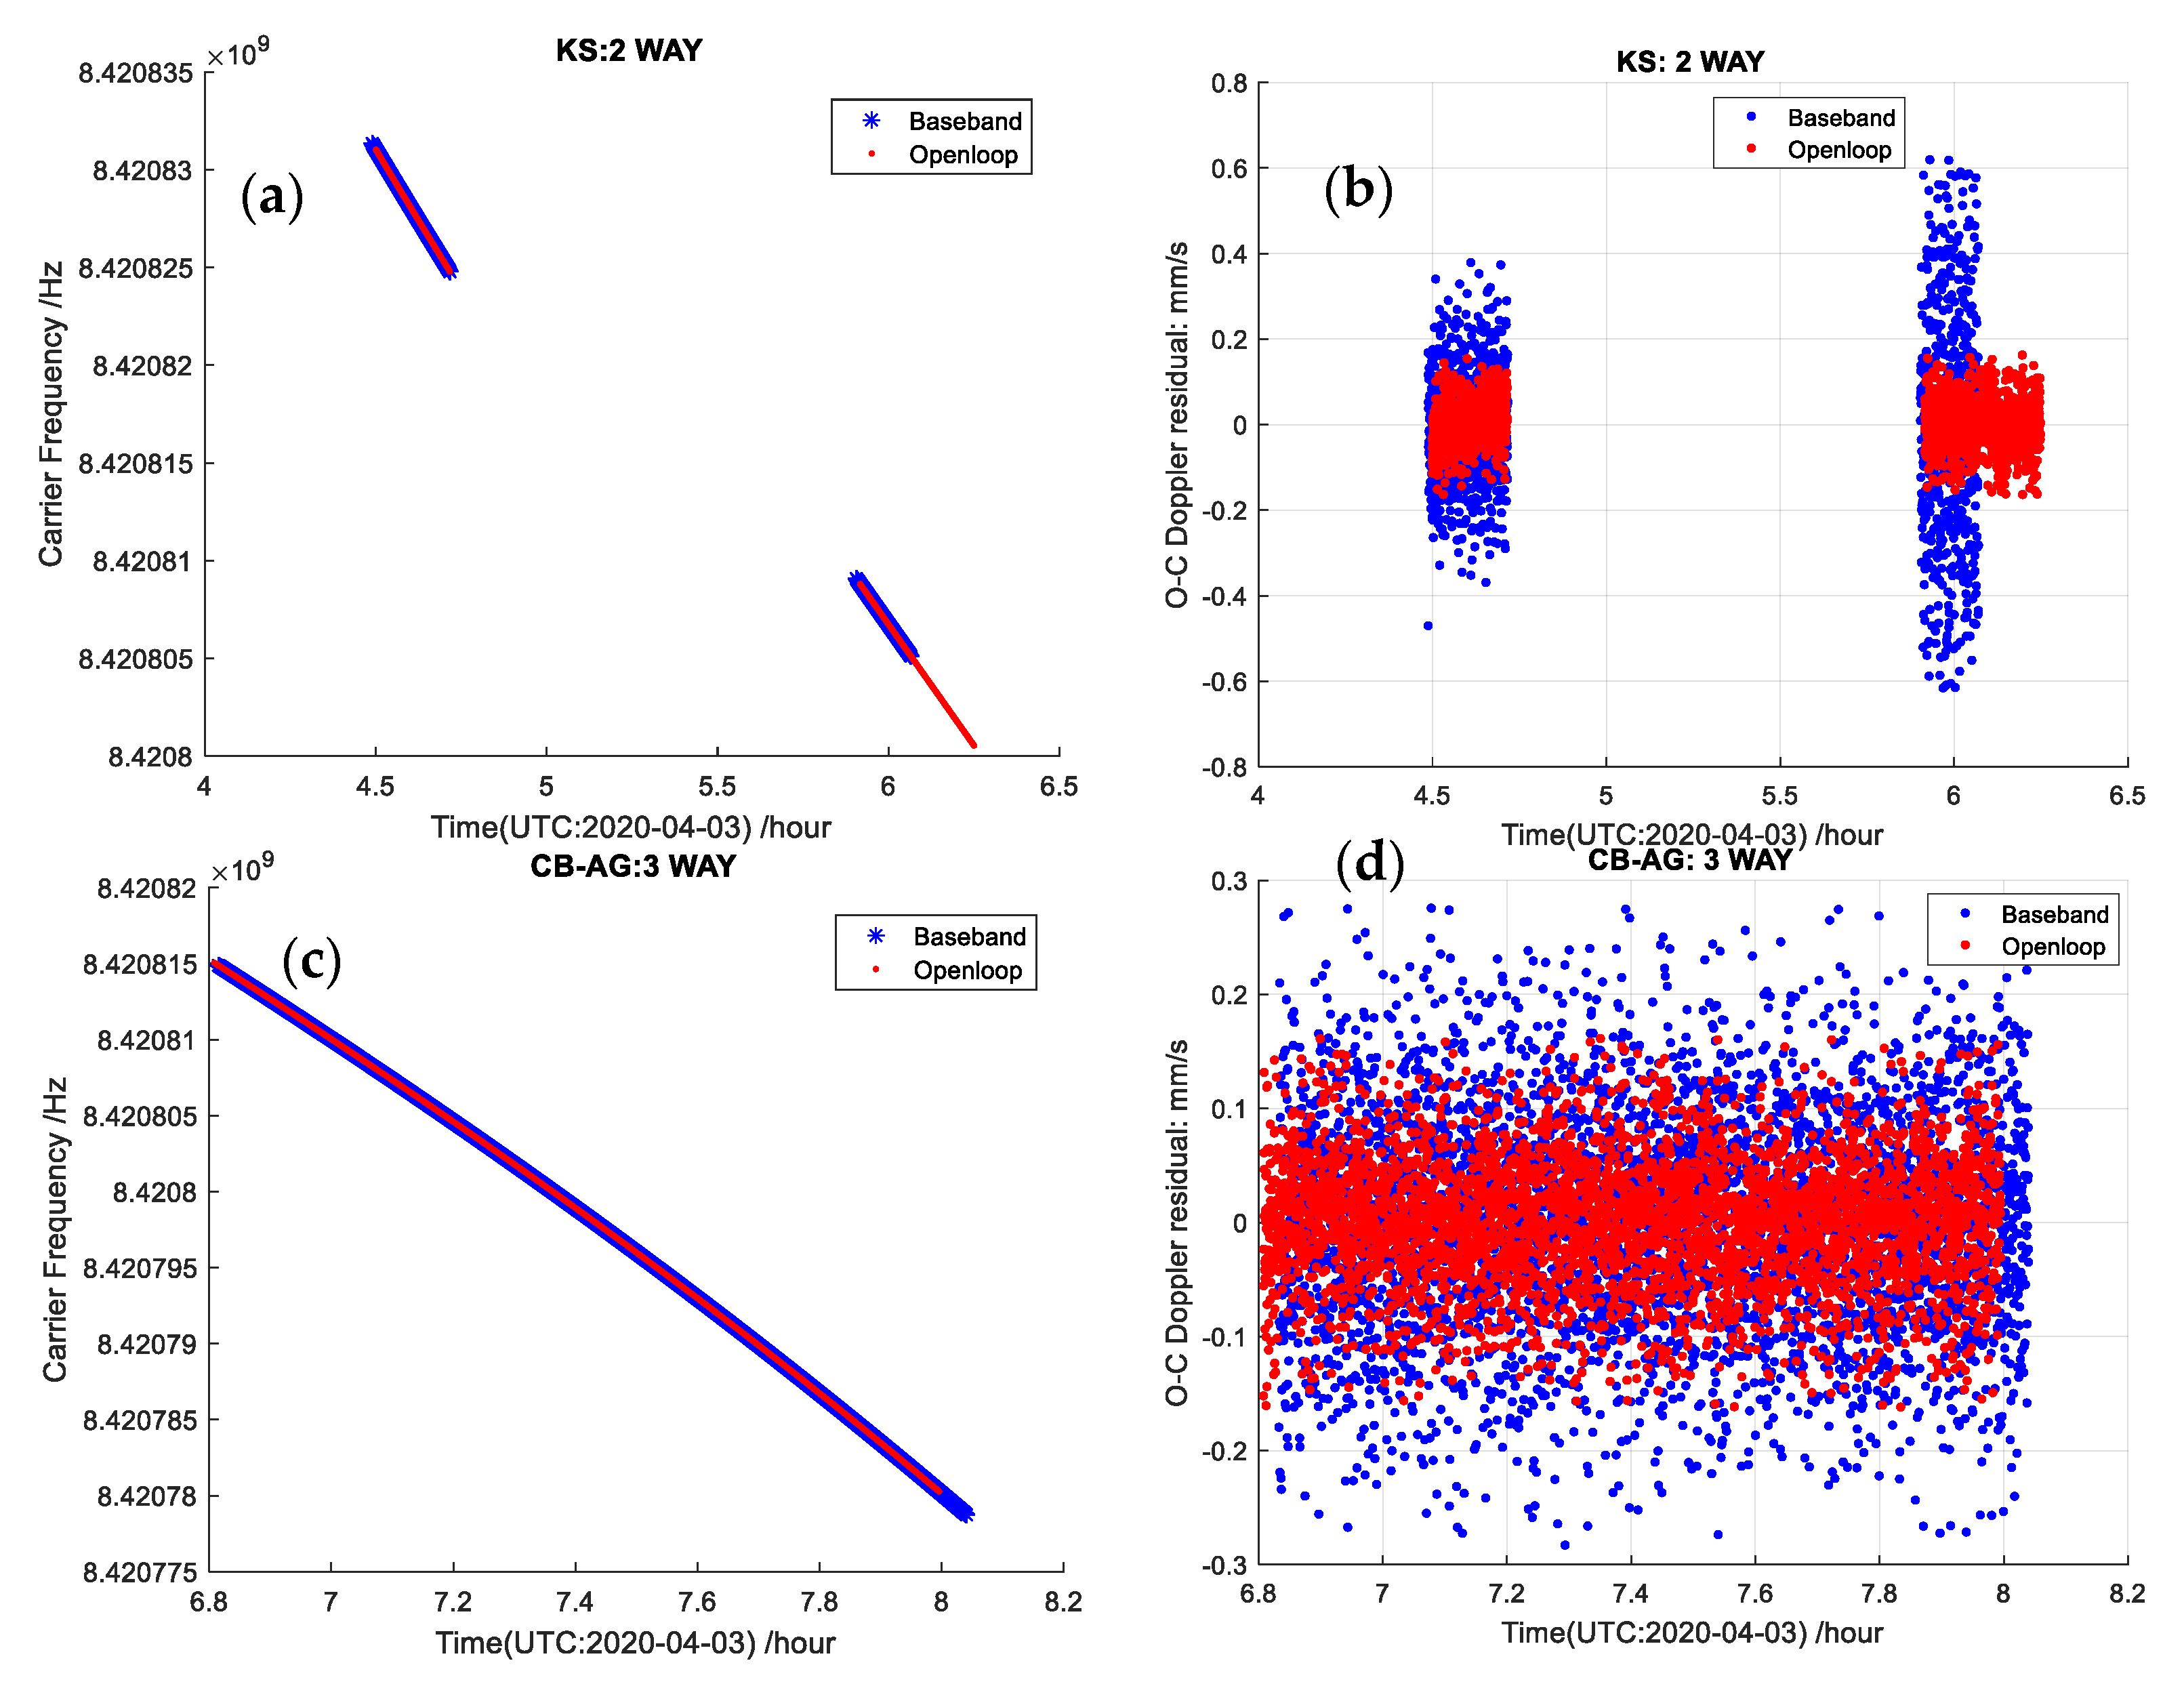
Figure 5 shows the measurement and orbit determination results of MEX on 3 April 2020. In Figure 5a, the estimated frequency is obtained by baseband receiver and open-loop receiver at the KS station, respectively. Here, the open-loop receiver means the software receiver utilizing the proposed local correlation method of segmented modeling. The experiment shows that the open-loop result is consistent with the baseband result, and the trend of frequency variety is similar. However, there are two sections of results in Figure 5a because some parameters did not select the optimal schemes when the KS station first carried out the two-way measurement of Mars’ probe. The KS station did not capture MEX’s downlink signal from 04:40 to 05:50 (UTC time) since some incorrect setting operations occurred at the station. In the first section of Figure 5a, the PLL loop bandwidth is fixed to 100 Hz; in the second section, the PLL loop bandwidth is fixed to 500 Hz. Both the open-loop and baseband Doppler observables were utilized for orbit determination of MEX. Figure 5b shows the residual velocity of orbit determination at the KS station. The RMS of baseband velocity is 0.21 mm/s in 1 s integration, and the RMS of open-loop velocity is 0.055 mm/s in 1 s integration.
Figure 5c shows that the estimated frequency is obtained by the baseband receiver and the open-loop receiver at the AG station, respectively. The PLL loop bandwidth is fixed to 50 Hz in the baseband receiver. Figure 5d shows the residual velocity of orbit determination at the AG station. The RMS of baseband velocity is 0.095 mm/s in 1 s integration and the RMS of open-loop velocity is 0.054 mm/s in 1 s integration. The RMS of baseband velocity at the AG station is better than that of the KS station, because the AG station utilized a narrower and more suitable PLL loop bandwidth to extract the Doppler frequency. It is apparent that the open-loop result is better than the baseband result.
On 16 April, the JM station and the KS station also observed MEX. There were two phases of the observation. In the first phase, the JM station carried out the measurement experiment by two-way mode; the KS station utilized three-way mode. In the second phase, the KS station carried out the measurement experiment by two-way mode. For the JM station, it was also the first time the two-way measurement of Mars’ probe was carried out and there were some errors in the baseband receiver at the JM station in the first phase, thus the baseband receiver was not successful in obtaining the correct Doppler frequency of MEX. The JM station did not participate in the second phase of observation due to MEX being located out of sight at that time. However, the open-loop Doppler frequency was successfully obtained by the proposed method. For the KS station, it carried out the measurement experiment by three-way mode in the first phase, when JM transmitted the uplink signal to MEX. The KS station carried out the measurement experiment in two-way mode in the second phase. Doppler frequency was successfully obtained both by the baseband receiver and the open-loop receiver at the KS station. The PLL loop bandwidth was fixed to 500 Hz in the baseband receiver when the KS station observed MEX in two-way mode.
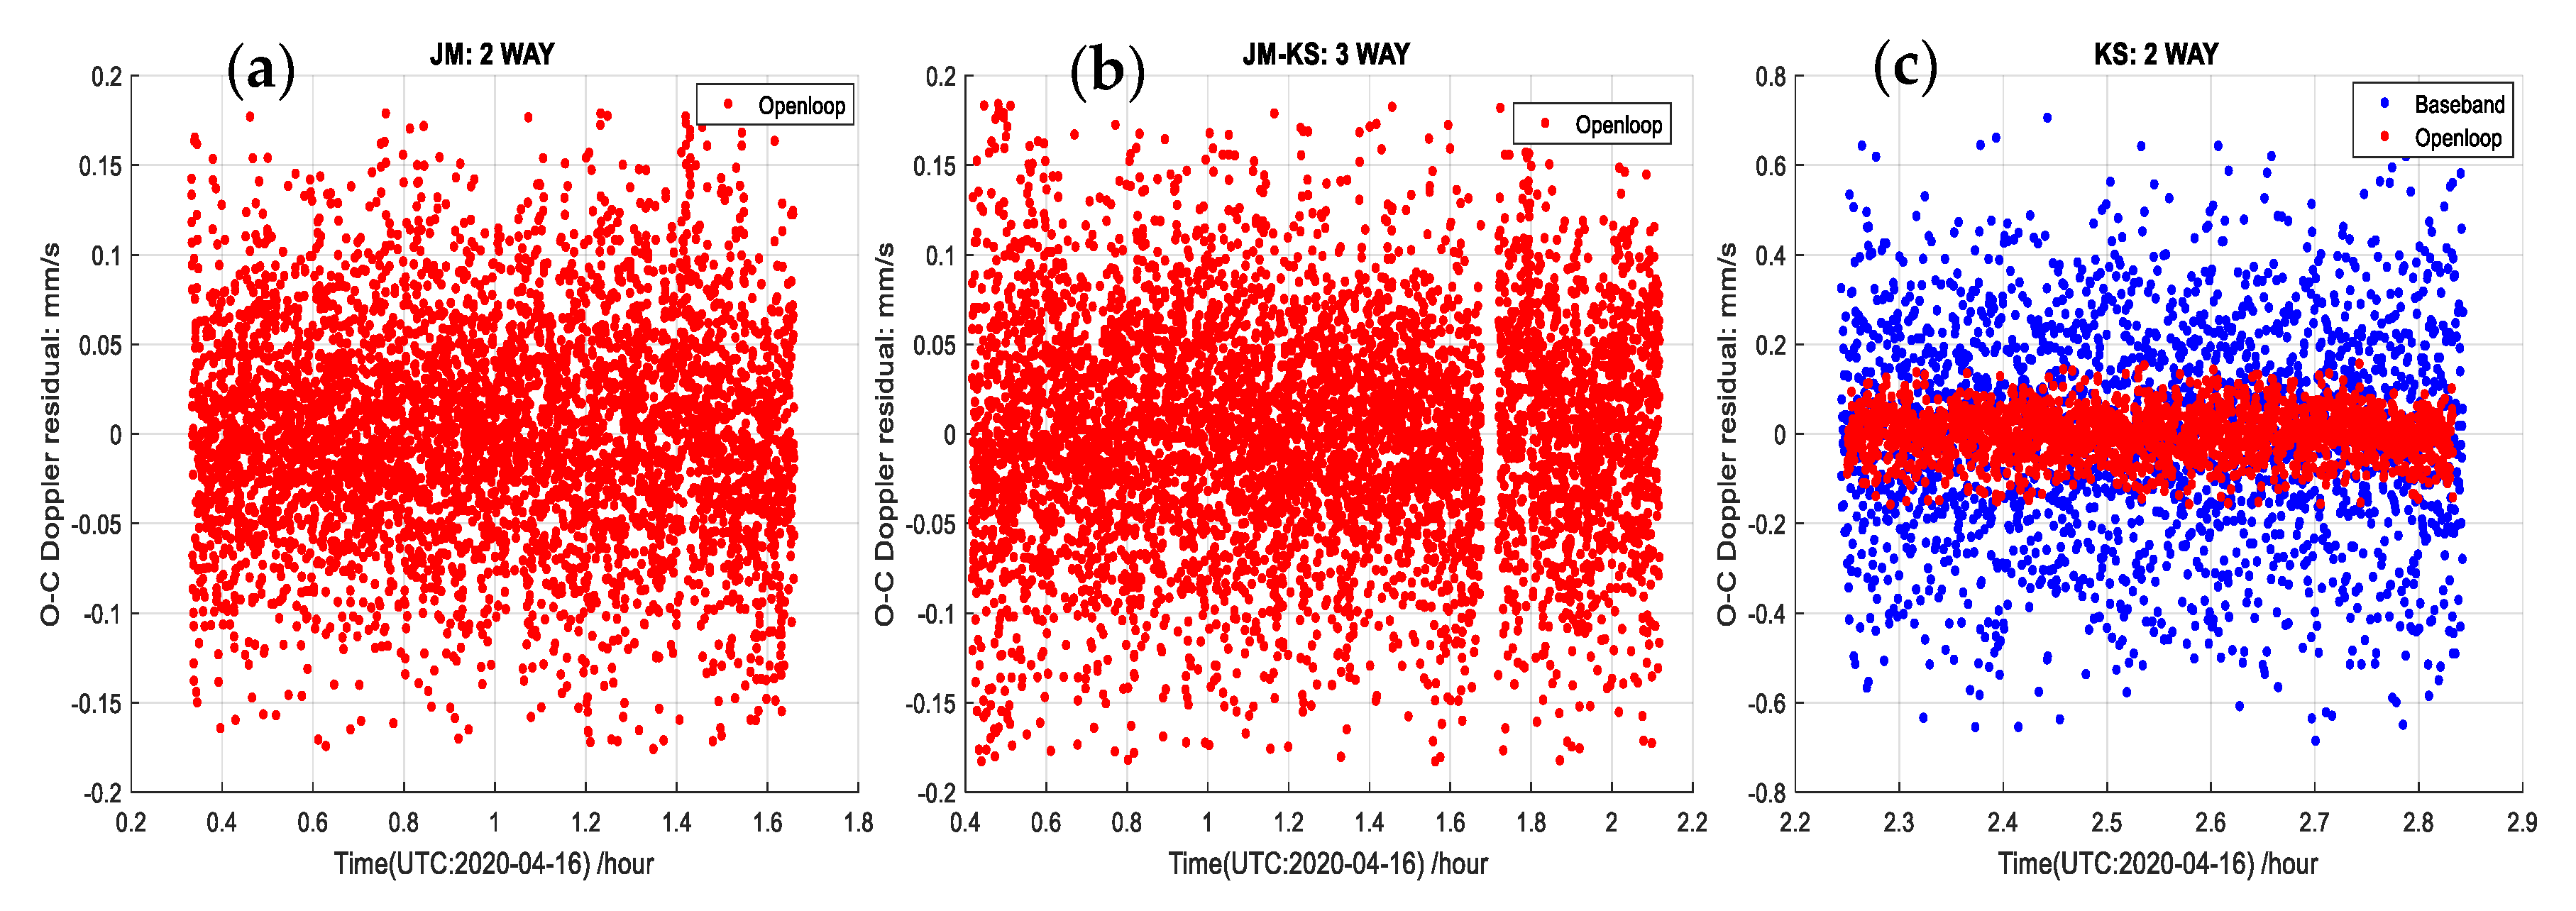
Figure 6 shows residual results of MEX orbit determination on 16 April 2020. In Figure 6a, the result shows the residual velocity of orbit determination at the JM station; the RMS of open-loop velocity is 0.06 mm/s in 1 s integration. In Figure 6b, the result shows the residual velocity of orbit determination in three-way mode at the KS station; the RMS of open-loop velocity is 0.061 mm/s in 1 s integration. In Figure 6c, the result shows the residual velocity of orbit determination in two-way mode at the KS station; the RMS of open-loop velocity is 0.053 mm/s in 1 s integration and the RMS of baseband velocity is 0.24 mm/s in 1 s integration. The results are shown in Table 1. In summary, the open-loop result is better than the baseband result. Although some errors occurred in the baseband receivers of CDSS during the MEX experiments, these experiments were very helpful to test and improve the performance of Doppler measurement at CDSS before they support the first Chinese Mars exploration mission called Tianwen-1.
From the above results, we can see that different PLL loop bandwidths will cause different levels of accuracy in Doppler velocity. When the SNR of the received signal is fixed, a narrower PLL loop bandwidth will obtain a higher accuracy in Doppler velocity. However, the phase of the downlink signal will lead to loss-of-lock, when the PLL loop bandwidth is too narrow and the frequency dynamics range of the probe is high. The best PLL loop bandwidth to select will depend on the circumstances [27]. In general, the value selected for the PLL loop bandwidth should be small in order to maximize the carrier loop signal-to-noise ratio, but a larger value for the PLL loop bandwidth is necessary when there is significant uncertainty in the downlink Doppler dynamics [27]. Thus, the CDSS selected different and appropriate PLL loop bandwidths for Doppler measurement in two-way mode to obtain the Doppler observables.
Furthermore, the Doppler measurement results of MEX obtained by the proposed method in this paper are compared with that of MEX obtained by ESA, NASA, Very Large Baseline Array (VLBA), European VLBI Network (EVN), and the Chinese VLBI network (CVN), respectively [4,10,17,19,28]. For quantitative comparison, the Doppler frequency results of MEX by the proposed method are obtained within 1 s, 5 s, 10 s, and 60 s integration respectively, as shown in Table 2. The average accuracy Doppler frequency is 3.30 mHz (0.059 mm/s) in 1 s integration, 1.82 mHz (0.033 mm/s) in 5 s integration, 1.38 mHz (0.025 mm/s) in 10 s integration, and 0.73 mHz (0.013 mm/s) in 60 s integration.
The study in [4] shows that the Doppler accuracy of MEX obtained by ESA and NASA was around 3.2 mHz in 1 s integration, and 1.2 mHz in 60 s integration [4]. These measurement results were obtained by the digital baseband receivers of ESA and NASA in closed-loop mode. The study in [10] shows that the median of the Doppler residuals for all the detections with the VLBI stations (EVN and VLBA) was found to be 2.0 mHz in 10 s integration [10], and the DSS63 and DSS14 of NASA is about 1.0 mHz in 10 s integration [10]. The study in [17] shows that 1.7 mHz precision (30 μm/s at a 10 s integration time) for radial three-way Doppler estimates for MEX was obtained by the PRIDE technique [17]. The study in [26] shows that the average 4.14 mHz precision of MEX in 5 s integration was obtained by CVN [28]; 7.0 mHz precision of MEX in 1 s integration was obtained by CVN [19]. The results are shown in Table 2. Since the raw signals in references [4,10,17,19,28] and in this paper were sampled and recorded by different ground station assemblies that do not have the same set of raw signals for processing, the comparison results are for reference. From the above results of the MEX Doppler accuracy and the results of Table 2, we can see that the accuracy of the open-loop Doppler by CDSS in this paper is approximately consistent with ESA and NASA, is a little better than EVN and VLBA, and is about two times better than CVN.

4.2. Signal Processing Results of Tianwen-1

Mars exploration is one of the main objectives of international space programs [29]. It is helpful to study Martian sciences such as Martian internal structure by radio measurements [30,31,32,33]. Tianwen-1 is the first Chinese deep probe to Mars for Martian science research, which was launched on 23 July 2020 [34]. The CDSS supports the navigation mission of Tianwen-1. We also utilized the received downlink signal of Tianwen-1 to verify the local correlation method of segmented modeling. The raw signal of Tianwen-1 was recorded by the open-loop digital signal recorder assembly of CDSS, with 200 kHz sampling frequency, and 8-bit quantification. We selected two observation dates to verify the proposed method: one was February 26 and the other was March 1, 2021. At that time, Tianwen-1 was on an elliptical orbit with periaerion of ~280 km, apoaerion of ~57,815 km, and an orbital period of ~49.0 h.
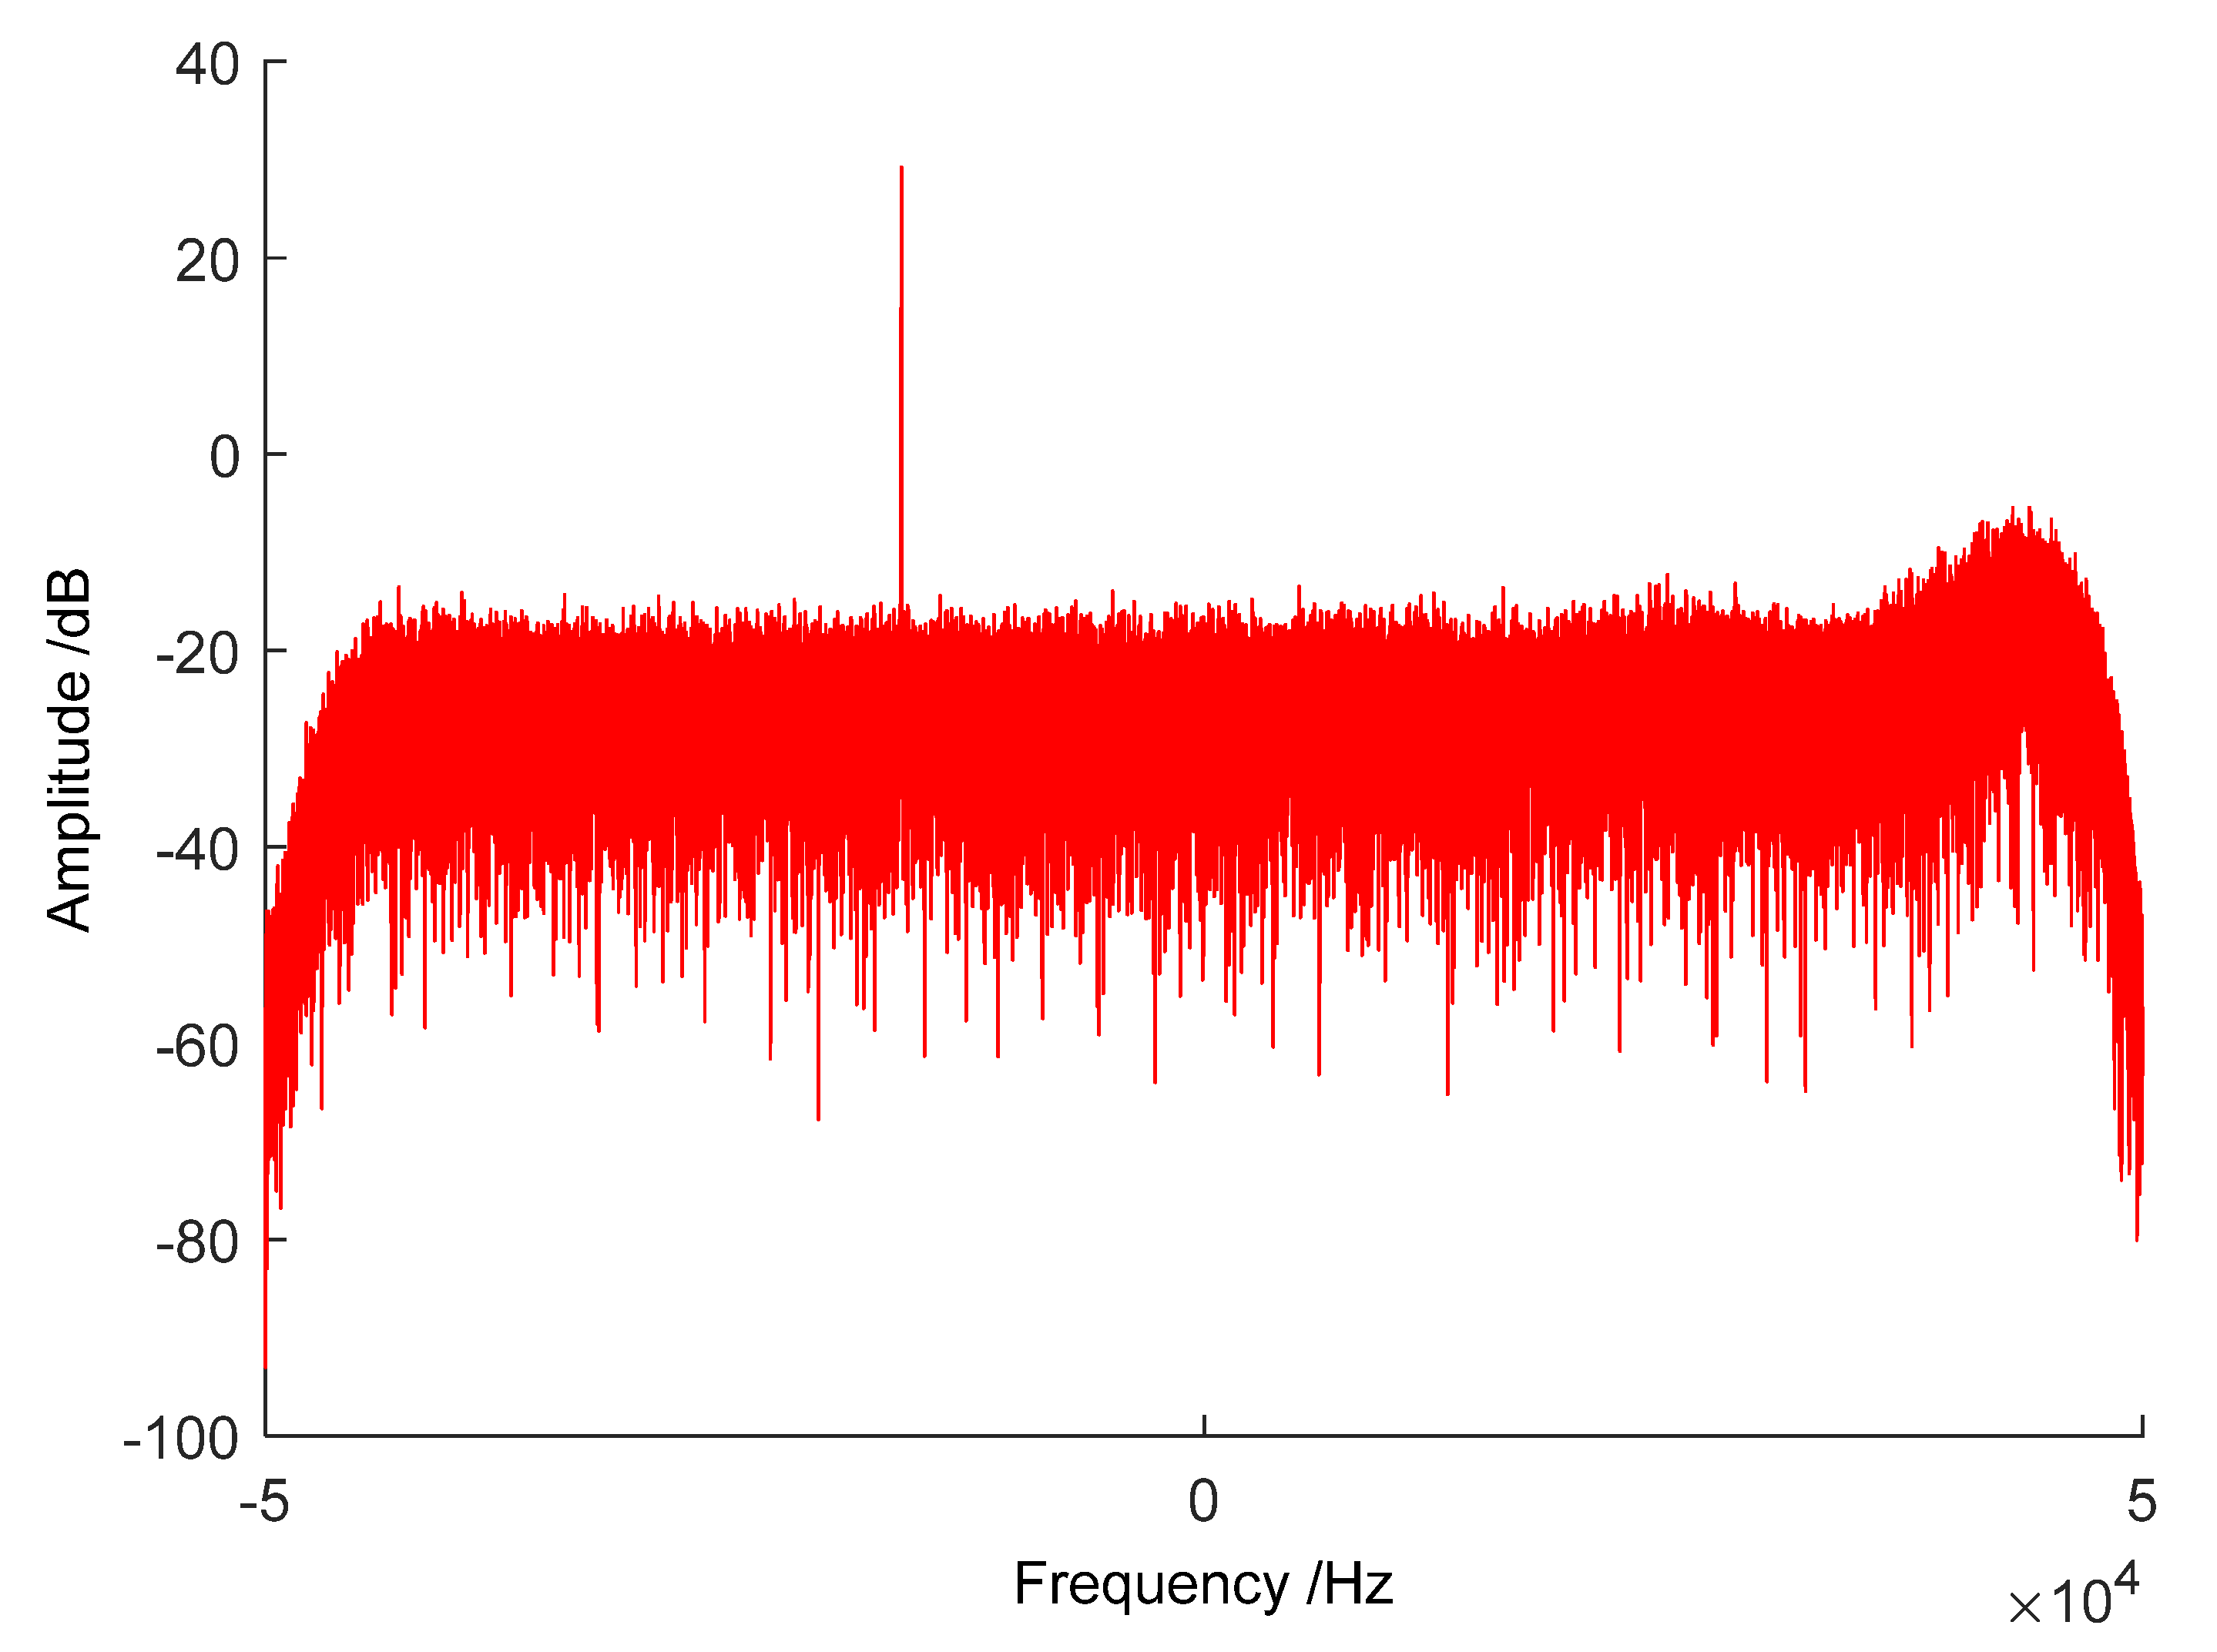
The FFT spectrum of Tianwen-1 is shown in Figure 7, which was observed by the JM station. The carrier signal in the FFT spectrum is apparent. Both the digital baseband receiver and the open-loop software receiver were simultaneously utilized to obtain Doppler observables of Tianwen-1 for orbit determination. For the digital baseband receiver, the PLL loop bandwidth was fixed to 500 Hz for the Doppler velocity measurement and the integration time was 10 s. For open-loop software receiver, n f f t was set to 100 k, and K was set to 20. Doppler observables were output in 1 s intervals.
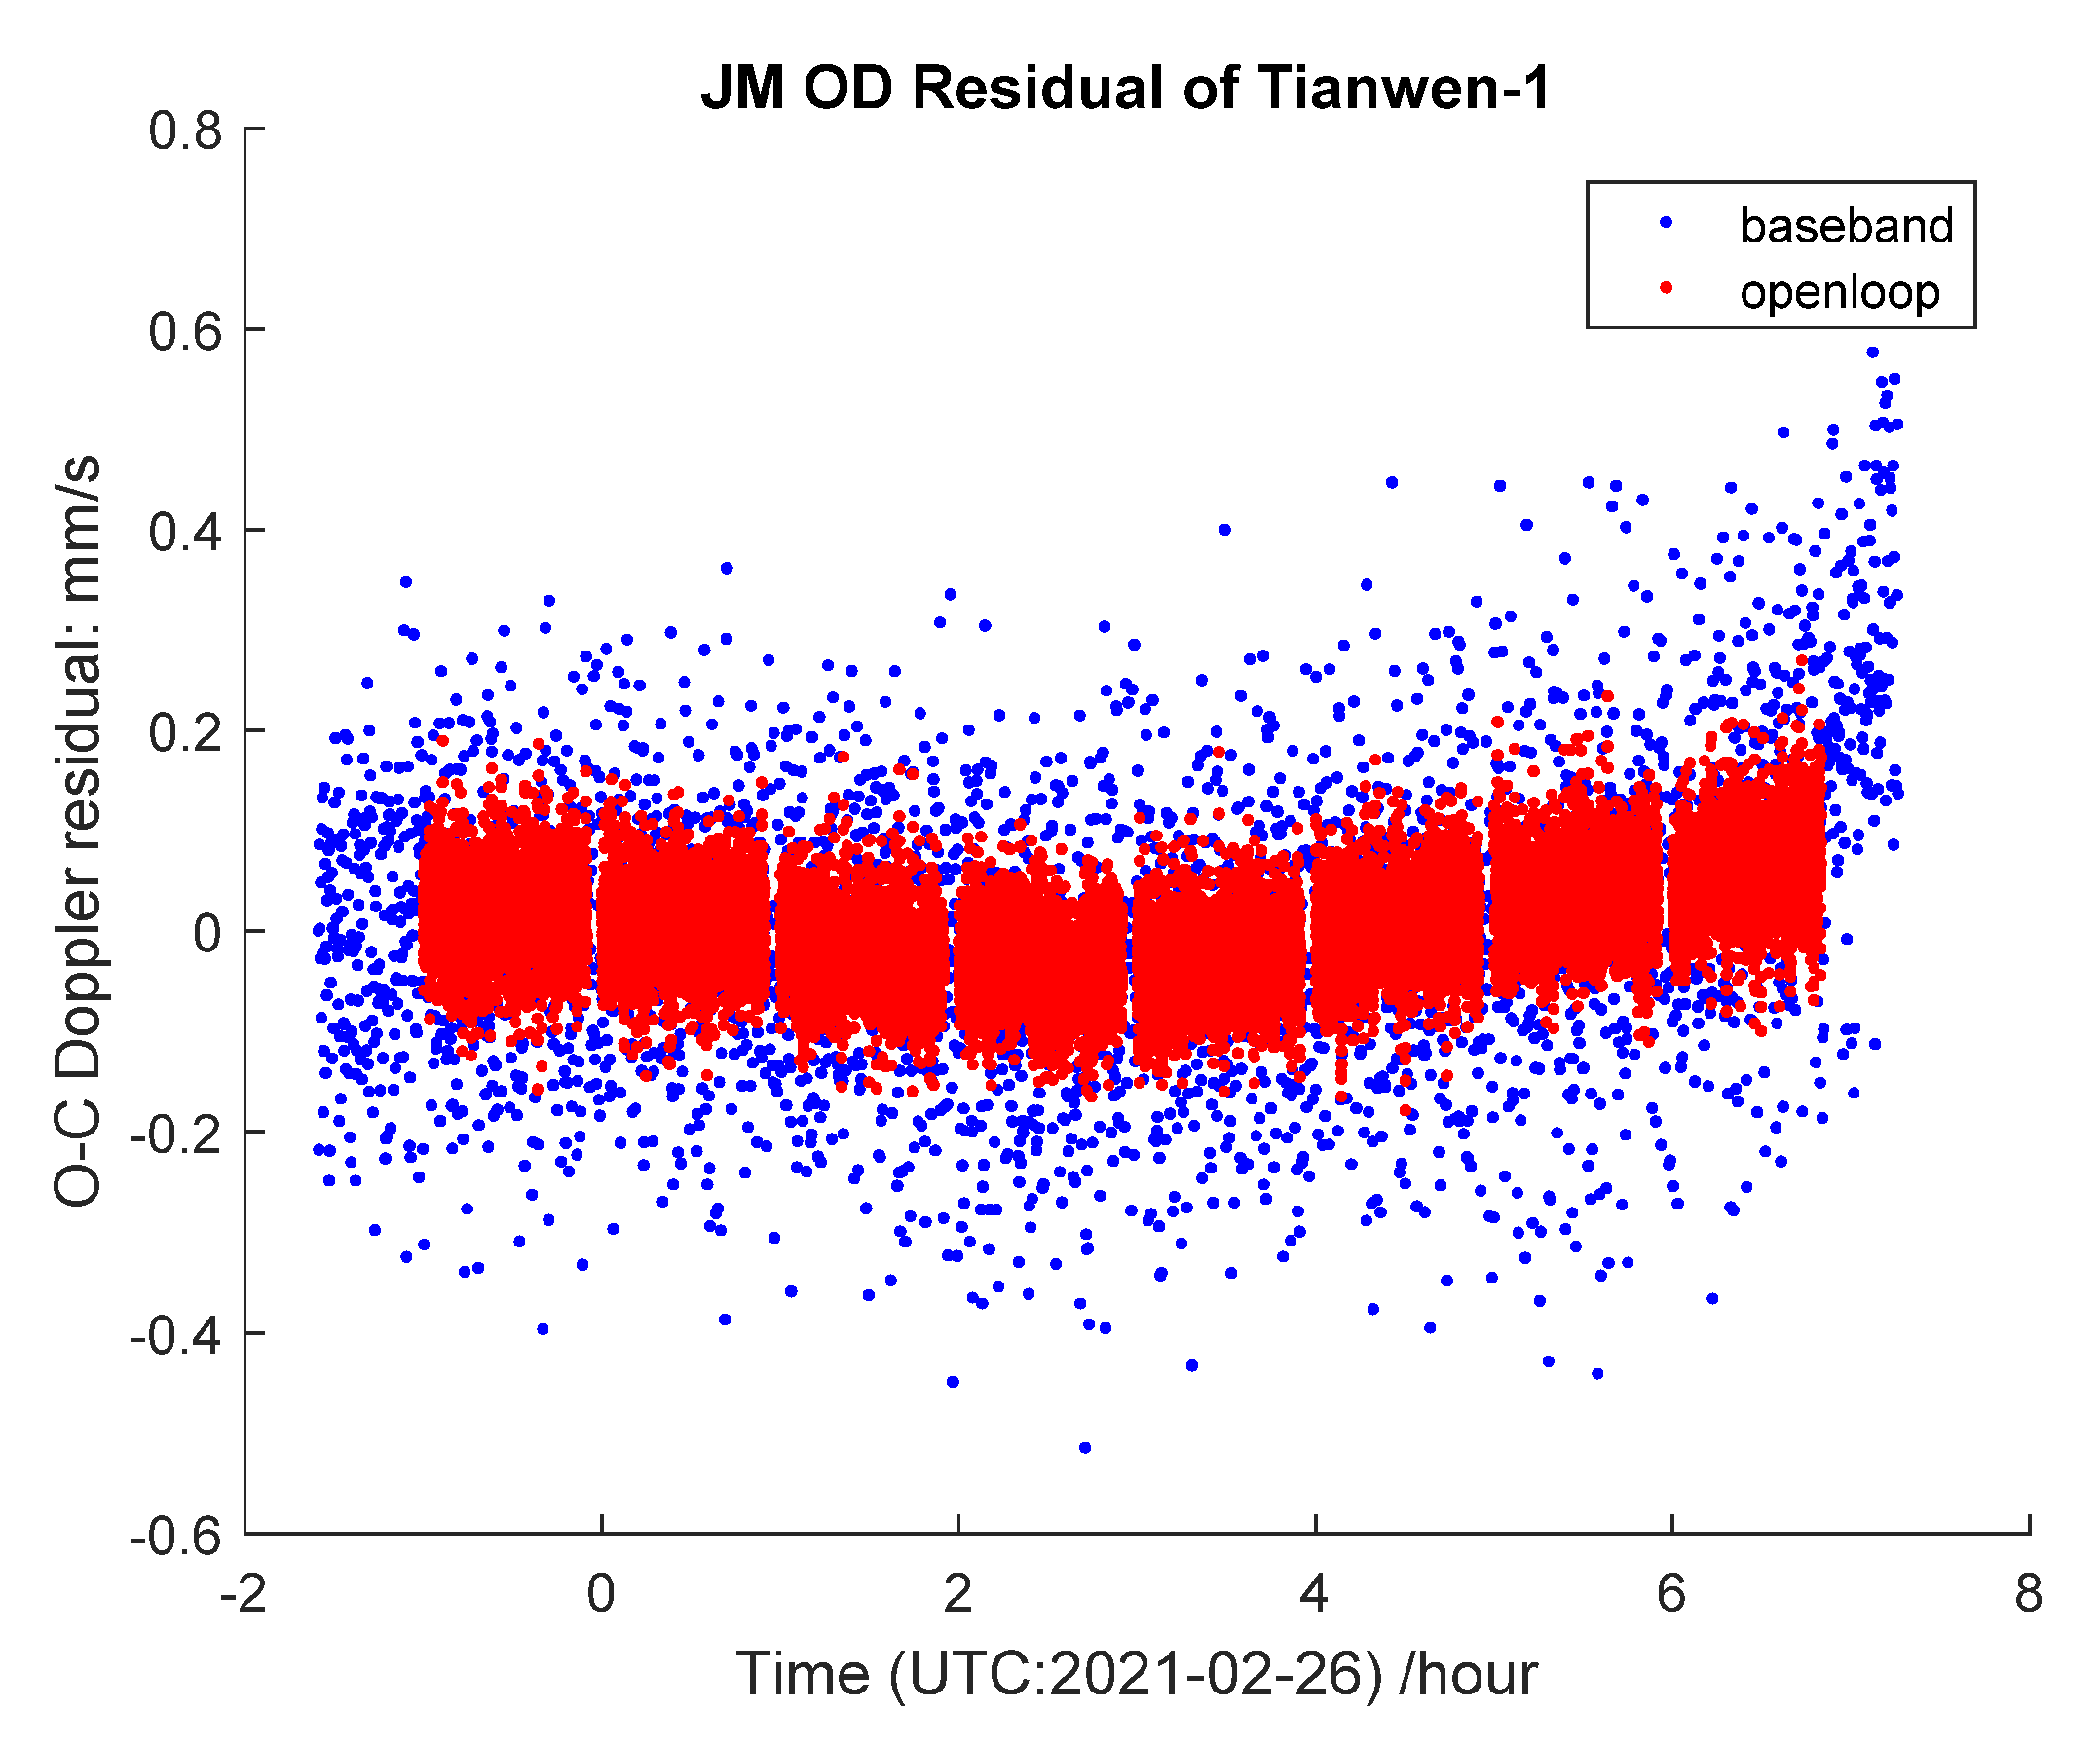
Figure 8 shows the residual velocity of orbit determination at the JM station on February 26. The blue dot line is the result of the baseband receiver, the red dot line is the result of the open-loop receiver. The RMS of the baseband velocity is 0.15 mm/s in 10 s integration. The RMS of the open-loop velocity is 0.049 mm/s in 1 s integration. Figure 9 shows the residual velocity of orbit determination at the KS station on March 1. The RMS of the baseband velocity is 0.13 mm/s in 10 s integration and the RMS of the open-loop velocity is 0.043 mm/s in 1 s integration. We can see that the two trends of the residual results are very similar, but the residual result of the open-loop has lower noise level. It is concluded that the accuracy of the open-loop result, which is at the level of 0.05 mm/s in 1 s integration for Tianwen-1 measurement, is better than that of the baseband result. The open-loop Doppler velocity observables could effectively support high accuracy orbit determination of Mars’ probe and these also will be helpful for future Chinese Mars radio science experiments.

5. Conclusions

In this paper, a method of Doppler frequency retrieved via local correlation of segmented modeling is proposed, which could obtain high accuracy results of velocity observables in open-loop mode. The theoretical algorithm and signal processing procedure are described which combined FFT, CZT, and correlation techniques. Simulations were implemented which verified the validity of the above method to retrieve the genuine Doppler frequency signal under frequency dynamic range and various SNR conditions. The observation experiments of MEX and Tianwen-1 were carried out by the CDSS, and the proposed method was utilized to process the received raw signal of MEX and Tianwen-1. The Doppler observables of the CDSS were utilized for orbit determination and the residual velocity was obtained. The results show that the RMS of the residual velocity of MEX is from 0.053 mm/s to 0.06 mm/s in 1 s integration by open-loop mode, and the RMS of the residual velocity of Tianwen-1 is at the level of 0.05 mm/s in 1 s integration by open-loop mode, respectively. The accuracy of the Doppler frequency retrieved by the proposed method in open-loop mode is about two times better than that of the digital baseband receiver in closed-loop mode at the CDSS, which utilize the PLL technique. Meanwhile, the accuracy of the Doppler frequency retrieving of MEX is compared with that of ESA, NASA, EVN, VLBA, and CVN. The compared results show that the accuracy of the open-loop Doppler frequency retrieved by the CDSS is consistent with ESA and NASA, is a little better than EVN and VLBA, and is about two times better than CVN. This method could be effectively utilized to apply to future Chinese deep space navigation missions and radio science experiments.

Author Contributions

Conceptualization, L.C. and J.P.; methodology, L.C., J.P., and J.C.; software, L.C.; validation, M.W., H.M., W.L., and S.H.; investigation, L.C., J.C., and Z.W.; data curation, M.W.; writing—original draft preparation, L.C. and J.P.; writing—review and editing, X.L., N.W., Z.W., P.Z., F.F., and J.S. All authors have read and agreed to the published version of the manuscript.

Funding

The authors thank the National Natural Science Foundation of China (NSFC) for funding projects 11603001, 41974207, 11833001, and 11973015, and the Chinese Academy of Sciences Foundation of the young scholars of western China (grant No. 2020-XBQNXZ-019).

Institutional Review Board Statement

Not applicable.

Informed Consent Statement

Not applicable.

Data Availability Statement

Not applicable.

Acknowledgments

This study made use of data collected through the CDSN from MEX and Tianwen-1. The authors wish to thank the probe team of MEX from ESA and the Tianwen-1 team from China, and the staffs of deep space telescopes and Beijing Aerospace Control Center for participating in the experiments, including Dongwen Niu, Guangming Chen, Tianpeng Ren, Zhijing Zhou, Jing Kong, Yu Zhang, Heshan Liu, Shilei Yue, Lei Zhang, and Yongqiang Chen.

Conflicts of Interest

The authors declare no conflict of interest. The funders had no role in the design of the study; in the collection, analyses, or interpretation of data; in the writing of the manuscript, or in the decision to publish the results.

References

  1. Thornton, C.L.; Border, J.S. Range and Doppler Tracking Observables. In Radiometric Tracking Techniques for Deep-Space Navigation; Yue, J.H., Ed.; The Deep-Space Communications and Navigation Systems Center of Excellence, Jet Propulsion Laboratory, California Institute of Technology: Pasadena, CA, USA, 2000; pp. 9–46. [Google Scholar]
  2. Chang, C.; Pham, T. DSN Telecommunications Link Design Handbook; DSN No. 810-005; Rev, F., Ed.; Jet Propulsion Laboratory: Pasadena, CA, USA. Available online: http://deepspace.jpl.nasa.gov/dsndocs/810-005/ (accessed on 7 June 2021).
  3. Iess, L.; Di Benedetto, M.; Marabucci, M.; Racioppa, P. Improved Doppler Tracking Systems for Deep Space Navigation. In Proceedings of the 23rd International Symposium on Space Flight Dynamics, Pasadena, CA, USA, 29 October–2 November 2012. [Google Scholar]
  4. Rosenblatt, P.; Lainey, V.; le Maistre, S.; Marty, J.C.; Dehant, V.; Patzold, M.; van Hoolst, T.; Hauslere, B. Accurate Mars Express orbits to improve the determination of the mass and ephemeris of the Martian moons. Planet. Space Sci. 2008, 56, 1043–1053. [Google Scholar] [CrossRef]
  5. Duan, J.; Wang, Z. Orbit determination of CE-40s relay satellite in Earth-Moon L2 libration point orbit. Adv. Space Res. 2019, 64, 2345–2355. [Google Scholar] [CrossRef]
  6. Paik, M.; Asmar, S.W. Detecting high dynamics signals from open-loop radio science investigations. Proc. IEEE 2011, 99, 881–888. [Google Scholar] [CrossRef]
  7. He, Q.; Yang, Y.; Li, F.; Yan, J.; Chen, Y. Using cross correlation to estimate Doppler frequency. Adv. Space Res. 2020, 65, 1772–1780. [Google Scholar] [CrossRef]
  8. Chen, W.; Huang, L. Research on Open-Loop Measurement Technique for Spacecraft. In Proceedings of the 27th Conference of Spacecraft TT&C Technology in China, Lecture Notes in Electrical Engineering 323, Guangzhou, China, 9–12 November 2005; Tsinghua University Press: Guangzhou, China, 2015; pp. 185–197. [Google Scholar]
  9. Bocanegra-Bahamón, T.M.; Calvés, G.M.; Gurvits, L.I.; Cimò, G.; Dirkx, D.; Duev, D.A.; Pogrebenko, S.V.; Rosenblatt, P.; Limaye, S.; Cui, L.; et al. Venus Express radio occultation observed by PRIDE. Astron. Astrophys. 2019, 624, A59. [Google Scholar] [CrossRef] [Green Version]
  10. Bocanegra-Bahamón, T.M.; Calvés, G.M.; Gurvits, L.I.; Duev, D.A.; Pogrebenko, S.V.; Cimò, G.; Dirkx, D.; Rosenblatt, P. Planetary Radio Interferometry and Doppler Experiment (PRIDE) technique: A test case of the Mars Express Phobos Flyby II. Doppler tracking: Formulation of observed and computed values, and noise budget. Astron. Astrophys. 2018, 609, A59. [Google Scholar] [CrossRef] [Green Version]
  11. Buccino, D.R.; Kahan, D.S.; Yang, O.; Oudrhiri, K. Extraction of Doppler Observables from Open-Loop Recordings for the Juno Radio Science Investigation. In Proceedings of the 2018 United States National Committee of URSI National Radio Science Meeting, Boulder, CO, USA, 4–7 January 2018; Available online: https://ieeexplore.ieee.org/document/8299690 (accessed on 7 June 2021).
  12. Jian, N.; Shang, K.; Zhang, S.; Wang, M.; Shi, X.; Ping, J.; Yan, J.; Tang, G.; Liu, J.; Qiu, S.; et al. A digital open-loop Doppler processing prototype for deep-space navigation. Sci. China Ser. G 2009, 52, 1–9. [Google Scholar] [CrossRef]
  13. Shang, K.; Ping, J.; Dai, C.; Jian, N. Open loop doppler tracking in Chinese forthcoming Mars mission. In Proceedings of the International Astronomical Union, IAU Symposium; Volume 261, pp. 209–211. Available online: https://ui.adsabs.harvard.edu/abs/2010IAUS..261..209S/abstract (accessed on 7 June 2021).
  14. Bedrossian, A. 209 Open-Loop Radio Science. DSN No. 810-005, 209, Rev. D.; Issue Date: 14 February 2019. JPL D-19379; URS CL#19-0898. Available online: https://deepspace.jpl.nasa.gov/dsndocs/810-005/209/209D.pdf (accessed on 7 June 2021).
  15. Bhaskaran, S. The Application of Noncoherent Doppler Data Types for Deep Space Navigation; TDA Progress Report 42-121; TDA: Putrajaya, Malaysia, 15 May 1995; pp. 54–66. Available online: https://ipnpr.jpl.nasa.gov/progress_report/42-121/121B.pdf (accessed on 7 June 2021).
  16. Duev, D.A.; Calvés, G.M.; Pogrebenko, S.V.; Gurvits, L.I.; Cimó, G.; Bahamon, T.B. Spacecraft VLBI and Doppler tracking: Algorithms and implementation. Astron. Astrophys. 2012, 541, A43. [Google Scholar] [CrossRef] [Green Version]
  17. Duev, D.A.; Pogrebenko, S.V.; Cimò, G.; Calvés, G.M.; Bahamón, T.M.B.; Gurvits, L.I.; Kettenis, M.M.; Kania, J.; Tudose, V.; Rosenblatt, P.; et al. Planetary Radio Interferometry and Doppler Experiment (PRIDE) technique: A test case of the Mars Express Phobos fly-by. Astron. Astrophys. 2016, 593, A34. [Google Scholar] [CrossRef] [Green Version]
  18. Bocanegra-Bahamón, T.M.; Gurvits, L.I.; Calvés, G.M.; Cimò, G.; Duev, D.A.; Pogrebenko, S. VLBI and Doppler tracking of spacecraft for planetary atmospheric studies. In Proceedings of the 14th European VLBI Network Symposium & Users Meeting, Granada, Spain, 8–11 October 2018; Science Press: Granada, Spain, 2018; pp. 1–5. [Google Scholar]
  19. Zhang, T.; Meng, Q.; Ping, J.; Chen, C.; Jian, N.; Liu, W.; Yao, S.; Yu, Q.; Wang, M.; Li, W.; et al. A real-time, high-accuracy, hardware-based integrated parameter estimator for deep space navigation and planetary radio science experiments. Meas. Sci. Technol. 2019, 30, 015007. [Google Scholar] [CrossRef]
  20. Tang, J.; Xia, L.; Mahapatra, R. An open-loop system design for deep space signal processing applications. Acta Astronaut. 2018, 147, 259–272. [Google Scholar] [CrossRef]
  21. Rabiner, L.R.; Schafer, R.W.; Rader, C.M. The chirp z-transform algorithm and its application. Bell Syst. Tech. J. 1969, 48, 1249–1292. [Google Scholar] [CrossRef]
  22. Han, S.; Zhang, Z.; Sun, J.; Cao, J.; Chen, L.; Lu, W.; Li, W. Lunar Radiometric Measurement Based on Observing China Chang’E-3 Lander with VLBI—First Insight. Adv. Astron. 2019, 10, 7018620. [Google Scholar] [CrossRef]
  23. Chen, L.; Ping, J.-S.; Liu, X.; Wang, N.; Cao, J.-F.; Chen, G.-M.; Wang, M.-Y.; Li, W.-X.; Zhang, J.-H.; Chen, Y.-Q.; et al. Preliminarily study of Saturn’s upper atmosphere density by observing Cassini plunging via China’s deep space station. Res. Astron. Astrophys. 2020, 20, 102. [Google Scholar] [CrossRef]
  24. Hao, W.; Lu, M.; Li, Z.; Wang, H.; Fan, M.; Zhu, Z.; Shi, S.; Cheng, C.; Han, S.; Li, H. The high dynamics tracking capability for power descending in Chinese Chang’E-3 mission. Adv. Space Res. 2017, 60, 82–89. [Google Scholar] [CrossRef]
  25. Chicarro, A.; Martin, P.; Trautner, R. The Mars Express Mission: An Overview. In Mars Express: The Scientific Payload; Wilson, A., Chicarro, A., Eds.; ESA SP-1240; ESA Publications Division: Noordwijk, The Netherlands, 2004; pp. 3–13. ISBN 92-9092-556-6. [Google Scholar]
  26. The Consultative Committee for Space Data Systems. Delta-DOR Raw Data Exchange Format; Recommended Standard; CCSDS 506.1-B-1; Blue Book: Bloomington, MN, USA, 2013; Available online: https://public.ccsds.org/Pubs/506x1b1.pdf (accessed on 7 June 2021).
  27. O’Dea, A. 202 Doppler Tracking; DSN No. 810-005, 202, Rev. C.; Issue Date: 22 January 2019. JPL D-19379; CL#19-0432. Available online: https://deepspace.jpl.nasa.gov/dsndocs/810-005/202/202C.pdf (accessed on 7 June 2021).
  28. Cao, J.; Huang, Y.; Hu, X.; Ma, M.; Zheng, W. Mars Express tracking and orbit determination trials with Chinese VLBI network. Chin. Sci. Bull. 2010, 55, 3654–3660. [Google Scholar] [CrossRef]
  29. Genova, A. ORACLE: A mission concept to study Mars’ climate, surface and interior. Acta Astronaut. 2020, 166, 317–329. [Google Scholar] [CrossRef]
  30. Pätzold, M.; Häusler, B.; Tyler, G.L.; Andert, T.; Asmar, S.W.; Bird, M.K.; Dehant, V.; Hinson, D.P.; Rosenblatt, P.; Simpson, R.A.; et al. Mars Express 10 years at Mars: Observations by the Mars Express Radio Science Experiment (MaRS). Planet. Space Sci. 2016, 127, 44–90. [Google Scholar] [CrossRef]
  31. Le Maistre, S.; Rosenblatt, P.; Dehant, V.; Marty, J.-C.; Yseboodt, M.; Le Maistre, S.; Rosenblatt, P.; Dehant, V.; Marty, J.-C.; Yseboodt, M. Mars rotation determination from a moving rover using Doppler tracking data: What could be done? Planet. Space Sci. 2018, 159, 17–27. [Google Scholar] [CrossRef]
  32. Dehant, V.; Le Maistre, S.; Baland, R.-M.; Bergeot, N.; Karatekin, O.; Peters, M.-J.; Rivoldini, A.; Lozano, L.R.; Temel, O.; Van Hoolst, T.; et al. The radioscience LaRa instrument onboard ExoMars 2020 to investigate the rotation and interior of mars. Planet. Space Sci. 2020, 180, 104776. [Google Scholar] [CrossRef]
  33. Kahan, D.S.; Folkner, W.M.; Buccino, D.R.; Dehant, V.; le Maistre, S.; Rivoldini, A.; van Hoolst, T.; Yseboodt, M.; Marty, J.C. Mars precession rate determined from radiometric tracking of the InSight Lander. Planet. Space Sci. 2021, 199, 105208. [Google Scholar] [CrossRef]
  34. Zou, Y.; Zhu, Y.; Bai, Y.; Wang, L.; Jia, Y.; Shen, W.; Fan, Y.; Liu, Y.; Wang, C.; Zhang, A.; et al. Scientific objectives and payloads of Tianwen-1, China’s first Mars exploration mission. Adv. Space Res. 2021, 67, 812–823. [Google Scholar] [CrossRef]
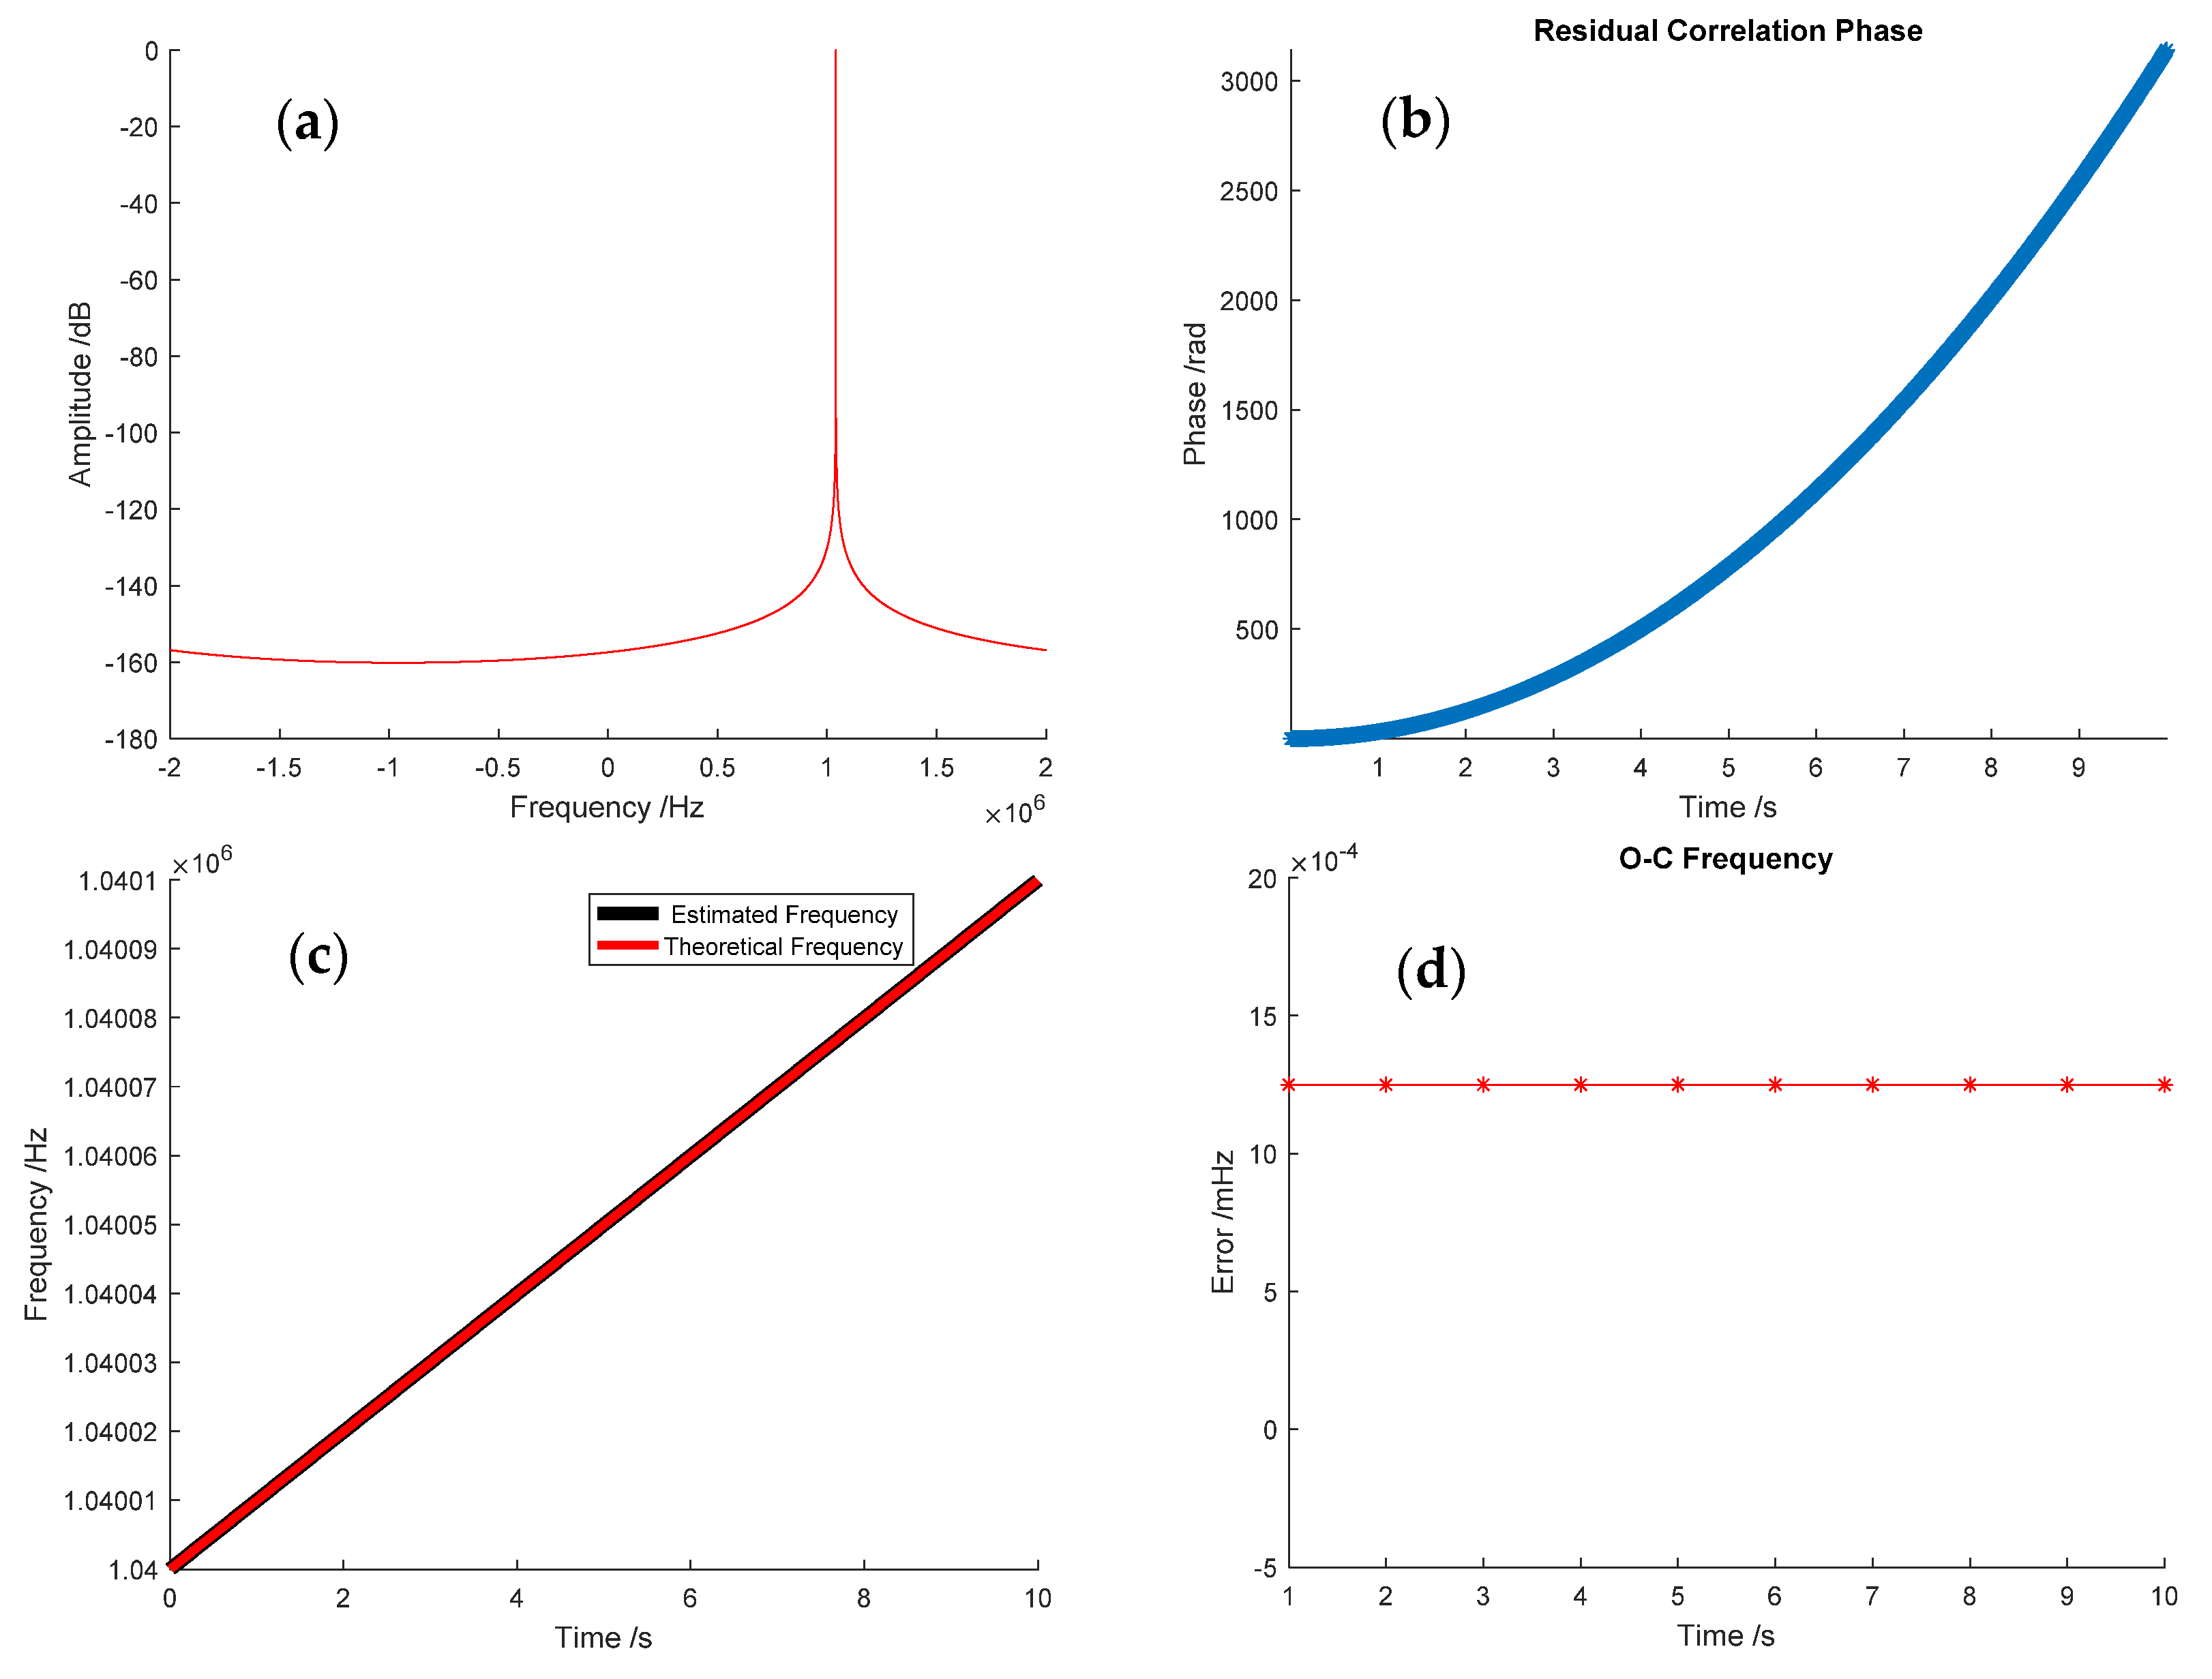
Figure 1. Simulation with no random noise. (a) FFT spectrum of the simulation signal; (b) the phase of cross correlation; (c) the theoretical frequency and the estimated frequency; and (d) differential values between the estimated frequency and the theoretical frequency.
Remotesensing 13 02846 g001
Figure 2. Simulation with random noise at different SNR values. (a) The FFT spectrum of the simulation signal; (b) the theoretical frequency and the estimated frequency; (c) differential values in 1 s integration; and (d) the frequency calculation errors at different SNR values.
Remotesensing 13 02846 g002
Figure 3. The locations of CDSS (JM/KS/AG stations).
Remotesensing 13 02846 g003
Figure 4. FFT spectrum of MEX observed at the KS station.
Remotesensing 13 02846 g004
Figure 5. The measurement and orbit determination results of MEX on 3 April 2020. (a) The measurement results of the carrier frequency by two-way mode at the KS station, (b) the residual of orbit determination at the KS station, (c) the measurement results of the carrier frequency by three-way mode at AG station, and (d) the residual of orbit determination at the AG station.
Remotesensing 13 02846 g005
Figure 6. The measurement and orbit determination results of MEX on 16 April 2020. (a) The residual of orbit determination in two-way mode at the JM station, (b) the residual of orbit determination in three-way mode at the KS station, and (c) the residual of orbit determination in two-way mode at the KS station.
Remotesensing 13 02846 g006
Figure 7. FFT spectrum of Tianwen-1 observed at the JM station.
Remotesensing 13 02846 g007
Figure 8. The orbit determination residual results of Tianwen-1 on 26 February 2021.
Remotesensing 13 02846 g008
Figure 9. The orbit determination residual results of Tianwen-1 on 1 March 2021.
Remotesensing 13 02846 g009
Table 1. The RMS of residual velocity of MEX orbit determination.
DateStationMeasurement WayRMS
(mm/s)
Remark
3 AprilKStwo-way0.055Open-loop
3 AprilKStwo-way0.21Baseband
3 AprilAGthree-way0.054Open-loop
3 AprilAGthree-way0.095Baseband
16 AprilJMtwo-way0.06Open-loop
16 AprilKSthree-way0.61Open-loop
16 AprilKStwo-way0.053Open-loop
16 AprilKStwo-way0.24Baseband
Table 2. The Doppler frequency accuracy of the open-loop measurement (mHz) of MEX.
StationMeasurement WayIntegration (1 s)Integration (5 s)Integration (10 s)Integration (60 s)Remark
KStwo-way2.991.701.180.453 April
three-way3.661.941.520.7316 April
AGthree-way3.181.511.201.03/
JMtwo-way3.382.131.630.72/
CDSS/3.31.821.380.73Average
EVN/VLBAthree-way//1.7/Ref. [17]
EVN/VLBAthree-way//2.0/Ref. [10]
NASA/ ESAtwo-way//1.0/Ref. [10]
NASA/ ESAtwo-way3.2//1.2Ref. [4]
CVNthree-way/4.14//Ref. [28]
CVNthree-way7.0///Ref. [19]
Publisher’s Note: MDPI stays neutral with regard to jurisdictional claims in published maps and institutional affiliations.