Abstract
This study investigated the land use and land cover changes in the state of São Paulo, Brazil, for the period of 2002 through 2017, to determine if forested areas were burned or converted to other land uses, to analyze the use of fire as a catalyst and mechanism for land cover change, and to determine if there was a relationship between land use changes and gross domestic product (GDP). MapBiomas classifications and MODIS data were analyzed using the Google Earth Engine. The results of the analysis found that there were minimal changes in the forested areas in São Paulo during the study period; however, there was a 5% increase in natural forest and a 75% increase in planted forest cover. On the other hand, there was a 128% increase in sugarcane, and nearly a 50% decrease in pasture land coverage, suggesting that land was converted from pasture to more profitable agricultural land. Finally, there was a strong positive correlation (r = 0.96) between the increase in sugarcane and the GDP, and a negative correlation between the frequency of fire events and economic production (r = −0.62). Overall, there was a decline in fire events in São Paulo, with fire events occurring in less than 2% of the total observed land area by 2017. This overall declining trend in fire events are likely the direct result of increases in green harvest methods, which prevent the need for pre-harvest burning.
1. Introduction
Brazil is the world’s most forested and most biodiverse country, yet its forested regions are constantly endangered by threats of deforestation [1,2,3,4,5,6,7,8,9]. While there are intense conservation efforts focused on Brazil’s Amazon Rainforest, the Atlantic Rainforest (i.e., Mata Atlântica), which lies along the Atlantic coast, is Brazil’s most endangered ecosystem [10,11]. The Atlantic Rainforest lies primarily in Brazil (92% of the forest) and is located along coastal and inland regions, and has coverage in 17 states, from Ceará to Rio Grande do Sul [9,12], over mountains and plateaus (Figure 1). The Atlantic Rainforest has been most affected by the development of the local population, as evidenced by a massive reduction in the size of the forest. It is estimated that nearly 90% of the original forest biome has been destroyed [5,13,14,15], and approximately 0.35% of the remaining forest is lost annually [14].

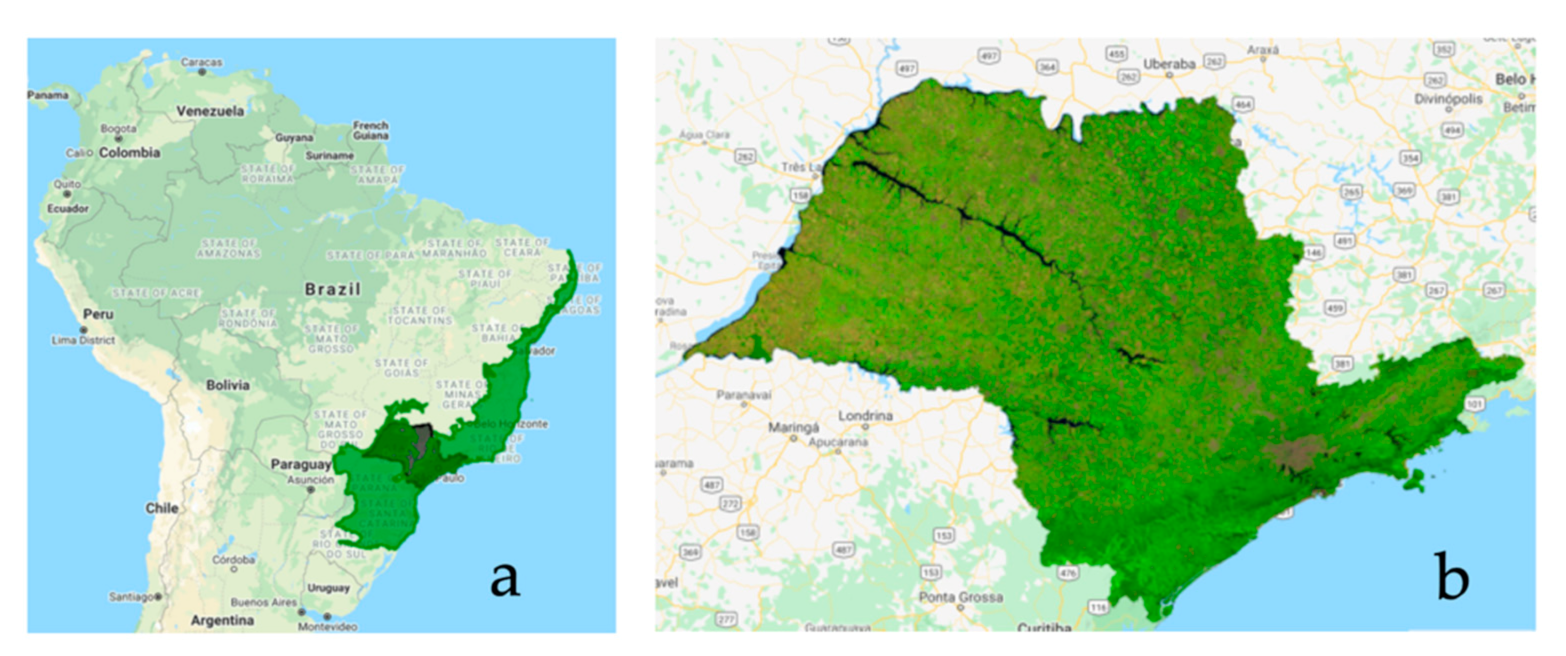
Figure 1.
Overview of the study area: (a) The span of the Atlantic Rainforest, which is located along coastal and inland regions, and has coverage in 17 states, from Ceará to Rio Grande do Sul, including mountainous regions and plateaus; (b) Region of São Paulo State, which has nearly 14% forest coverage. Image from the Landsat 8 Image Mosaic from Mapbiomas Collection 5 for 2019 [3].
Of the 17 states which contain fragments of the original Atlantic Rainforest, the state of São Paulo has the largest forest area. Studies estimate that 80% of the state was once covered by forest, and now only 16.6% of the territory is contains forest [15,16]. A major contributing factor to the loss of forested areas is land conversion for agricultural purposes. The conversion of range, pasture, and other shrubland to land used for agriculture such as sugarcane, coffee, and eucalyptus plantations, urban sprawl, and cattle ranching all account for major land use changes in the state of São Paulo and Brazil [4,17,18,19]. Additionally, unauthorized logging and clear cutting also contribute to the loss of forest areas [4,20]. In response to these known threats, there were recent conservation efforts aimed at preventing further loss of the natural forest and restoring the forested area through forest plantations (e.g., pine and eucalyptus) [4,7,8,9,13,21,22,23,24]. Despite these efforts, another long-practiced threat to the forested areas in this region is the slash-and-burn system [25], which is one of the world’s oldest agricultural practices. This system is often used in poor rural areas, as it can be a foundational practice that acts as the backbone of agriculture and economic stability. While São Paulo (SP) is the richest state in Brazil, it contains rural areas where the practice is implemented. Despite the value these practices add to the local economies, they are not sustainable and are deeply problematic, contributing to air pollution and respiratory health effects [26,27,28,29,30,31], deforestation [6], global warming, loss of biodiversity, physical deterioration of the land, and other damage to the land [1,2,3,4,5,6,7,8,9,20,32].
Because of the long-term presence of threats to the forest and the efforts to improve the conditions of the Atlantic Rainforest region in São Paulo, it is important to evaluate the area and determine if it is continuing to undergo loss of land cover. When considering the factors that contribute to land use change, it is also important to understand what the catalyst is that facilitates the change. Studies have discussed how fire is used in various ways in the process of land use conversion [7,33,34], especially focusing on Brazil’s Amazon Rainforest region [25,35,36]. In many cases, studies explore the relationship between fire events and agricultural land cover change, largely related to health outcomes of local communities which are impacted by agricultural pre-harvest burning, [26,27,28,29,30,31,37,38] to estimate the biomass and emissions produced during the burning process [38,39,40]. Several studies have used MODIS fire products to investigate the role of fire in land conversion, specifically related to deforestation and land conversion [41,42,43,44]. However, few studies have focused on examining the relationship between fire events and land use and land cover (LULC) change in the Atlantic Rainforest, nor have many looked at how that relationship might impact the economy [45].
It is important to note that in addition to being the area of Brazil with a large fragment of the Atlantic Rainforest remaining, São Paulo state is also the most economically productive state in Brazil [46,47]. While analyses on LULC generally reflect industries linked purely to forestry or agriculture, crop production in SP impacts industries outside of agriculture [48,49,50]. For example, sugarcane, one of the main agricultural products grown in SP.
Studies have modeled the relationship between sugarcane expansion and per capita gross domestic product [50,51,52,53,54,55], however they do not reflect the last five to ten years of growth, nor do they consider how harvesting methods (e.g., use of fire) may relate to economic gain. In a few cases, studies determined that remotely sensed satellite images could be used to relate to economic development and production, however they often used the presence of nighttime light energy as a metric to represent the increased wealth of countries, and used Landsat images to detect those lights [56,57,58]. Additionally, studies that incorporate economic gain into analyses of LULC are often focused on precision agriculture, product optimization, and yield estimations [59,60,61].
This study has three objectives: first, to investigate the relationship between fire events and land use and land cover changes in the state of São Paulo, to understand if forested areas were burned or converted to other land cover types; second, to determine if fire events were related to land conversion in non-forested areas; and finally, assess the correlation between fire events, land conversion, and economic profit. To achieve these goals, MODIS data and data from the project collaborative MapBiomas were evaluated to determine if specific land cover or land use types in the region were burned before being converted into other land uses. In addition, available gross domestic product data were analyzed.
2. Materials and Methods
2.1. Study Area and Economic Data
The state of São Paulo (SP), located in the southeast coastal region of Brazil (23.5505° S, 46.6333° W, Figure 1) was selected as the study area. SP is the most populous state in Brazil with over an estimated 46 million people in 2020, roughly 20 percent of Brazil’s total population, and the seventh largest built-up urban area in the world [62,63]. SP is composed of 645 municipalities which are divided into 63 microregions and 15 mesoregions [46,64].
Despite its high level of agricultural and urban development, SP contains the single largest remnant of the Atlantic Rainforest in Brazil, with estimates showing that 13.9% of the original Atlantic Rainforest exist in SP [18]. Furthermore, SP has the highest average gross domestic product (GDP) of any state in Brazil, although it represents less than 3% of Brazil’s total area (247,898 km2) [6,15,48,65,66].
According to the Brazilian Institute of Geography and Statistics (IBGE) and the State Data Analysis System Foundation (SEADE), agriculture and livestock farming are two of the most important economic activities in SP, and they contribute nearly 15% of the total gross agricultural production value and 12% of the total gross livestock product of Brazil, despite only representing 12% of Brazil’s total crop acreage [67,68]. Among the major agricultural products are sugarcane, oranges, tomatoes, peanuts, bananas, and coffee.
It is estimated that SP contributes 31% of the national GDP of Brazil [20,65]. The IBGE, in partnership with State Statistical Organizations, State Government Departments and the Superintendence of the Manaus Free Trade Zone (SUFRAMA), created a dashboard providing the estimates for the GDP and the gross agricultural product for each municipality in Brazil [21]. The complete breakdown of profit by industry sector and product type can be found on the IBGE Economic Statistics portal (https://www.ibge.gov.br/en/statistics/economic/national-accounts/19567-gross-domestic-product-of-municipalities.html?=&t=o-que-e (accessed on 20 October 2020)). The most recent (2018) report summarizes the economic activities from 2002 to 2017, breaking down the yearly GDP for each municipality, as well as the gross value added for several industry sectors including agriculture (which also reflects farming and pasture), industry (including mining and manufacturing), services (including retail, communication, and transportation), and administrative (defense, education, and social services) [65]. GDP is a monetary measure of the market value of all the final goods and services produced in a specific period, so it is an appropriate metric to measure the overall relationship between production and economic outcome. The gross added value of agriculture reflects the net dollar value added to the total GDP by the cultivation of crops and livestock production and other activities (e.g., forestry, hunting, and fishing). Gross added value is calculated by subtracting the cost of production within a sector from the overall production gains, so depending on the cost of labor, planting, harvesting, processing, and refinement in the agriculture segment, the gross added value reported may be a less accurate representation of the overall economic impact which may result from changes in land use. For the scope of this study, the yearly gross added value of agriculture (GVA) data and yearly total GDP data for all of São Paulo State were calculated as a sum of the values for all 645 municipalities. These data values were used as metrics to calculate economic growth (see Supplementary Material, Table S1). The annual GDP was inflation adjusted to reflect real annual growth.
Due to the limited availability of economic data from the IBGE Municipal Agricultural Production statistics portal [47], the analysis period of 2002–2017 was selected for this study.
2.2. Google Earth Engine
Google Earth Engine (GEE) was used as the primary tool for visualizing and analyzing the spatial relationships and changes within the study area, as well as extracting values for further statistical analysis. GEE is a valuable tool for remote sensing analysis as it allows for large scale data intensive analysis, over large areas [69,70]. To ensure that the boundaries for the various data layers were the same, a filter was created using the Global Administrative Unit Layers 2015, Country Boundaries, feature collection [71]. Each dataset was clipped to the boundary for SP so the region could be isolated for analysis.
2.2.1. MapBiomas
The Brazilian Annual Land Use and Land Cover Mapping Project (MapBiomas) was created in 2015 [72]. The project was developed to address the lack of timely land use, land cover data for the six biomes in Brazil. The project generated 35 annual LULC maps for Brazil using Landsat data from 1985 to 2019 at 30 m pixel resolution, processed using the Google Earth Engine. The project used three-level classification to collect data on land cover, land use, and various other changes throughout Brazil [3]. The first classification level primarily focused on distinguishing land cover vegetation types (e.g., vegetation, farmlands, non-vegetated areas, water, etc.). The second classification level broke down land use and land cover distinguishing between natural forest, newly planted forest, grasslands, wetlands, urban infrastructure, plantations, ranchlands, and livestock and agricultural farms. The third level was specifically focused on forest formation [3]. The classifications were developed using pre-existing classification data for the Amazon biome, which extrapolated to other areas, and the random forest classifier available in the Google Earth Engine. The inventory is updated yearly, with MapBiomas Collection 5 data showing the 35 years (1985 to 2019) of Brazil’s annual land cover and land use maps on a 30 m scale with improvements in accuracy in the biomes and new classes of agriculture. The most recent dataset, which was used in this study, was released on 28 August 2020. The overall accuracy of the entire project, based on a stratified random sample of 75,000 pixel locations, was 89%, with an accuracy range of 85.8–90.6% for the region of SP (CI 95%), across the three levels of classification data [3].
The collection of land use classification images, which are available in GEE (project identifier: ee.Image (‘projects/mapbiomas-workspace/public/collection5/mapbiomas_collection50_integration_v1’ (accessed on 3 October 2020)), was used to extract the total count of pixels per land cover type. The GEE built-in frequency histogram reducer was used to bin the frequency of pixels for each classification type. The calculated values were then used to determine the percentage of land represented by each classification type and the rate of change over the study period. This extraction process followed the simplified version of the methodological flow described in Section 2.2.2. The full code is provided (see Supplementary Material, Figure S1).
2.2.2. Fire Count Data
The NASA Moderate Resolution Imaging Spectrometer (MODIS) collection 6, version 6, burned area monthly global 500 m product (MCD64A1) provides a monthly, global product containing per-pixel burned area and quality information at a 500 m spatial resolution [73]. MODIS can detect both flaming and smoldering fires that are 50 m2 to 1000 m2 in size, depending on observing conditions [74]. The overall accuracy of the global collection 6 MODIS burned area product was assessed using confusion matrix-derived and regression-based metrics and was reported to be 99.7% and in each biome the overall accuracy is greater than 90% [75]. Also, previous studies have shown that MODIS can be used as a tool for monitoring agricultural fire practices [59,60,61]. As one of the major objectives of the study was to assess the impact of fire events on land use changes and domestic profit, the MODIS MCD64A1 product data were used to create a fire mask over the region of SP using GEE. A mask of daily burned pixels (1 January–31 December) was created for each study year, 2002–2017 (Figure 2). The masks were then used to observe the location of the fire events for each classification year and to calculate the total burned pixels per year. Using GEE, the mask layers were applied to each of the corresponding 16 study year MapBiomas classification layers, with the goal of isolating the pixels in each classification category that were burned. The data were extracted and exported as CSV files to be statistically analyzed. The individual mask creation was a necessary step, as the MODIS data and the MapBiomas layers have different spatial resolutions (500 m and 30 m, respectively), and without this step one of the features would need to be recalculated to a different resolution so they could be analyzed together. The MODIS collection was used in lieu of other higher resolution satellite products (e.g., Sentinel), because there are available data for the full study period (2002–2017).

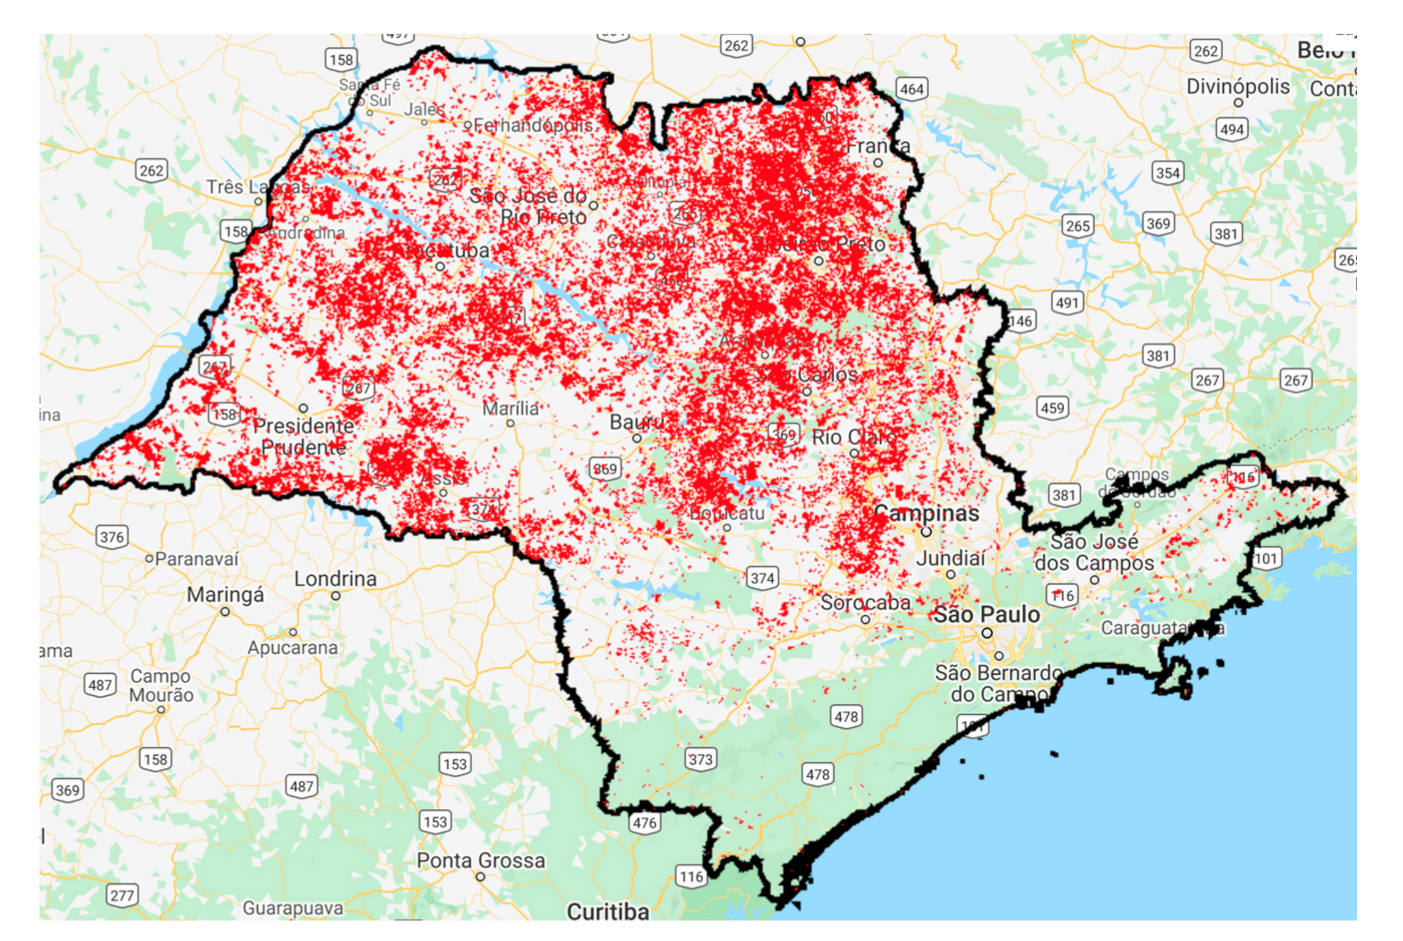
Figure 2.
Moderate Resolution Imaging Spectrometer (MODIS) collection 6, version 6 burned area monthly global 500 m product for 2002–2017 filtered by the borders of São Paulo State (black border). The red symbols indicate where fires were detected by the MODIS sensors. Throughout the course of the study period, 1,263,635,500 m pixels were burned, which were used to view corresponding MapBiomas land use types.
Figure 3 illustrates the complete methodological flow used to input and process the variables, create and apply the fire mask, and export data values. The full code used to calculate the number of burned pixels per classification category and to create the visualizations is available (see Supplementary Material, Figure S2).
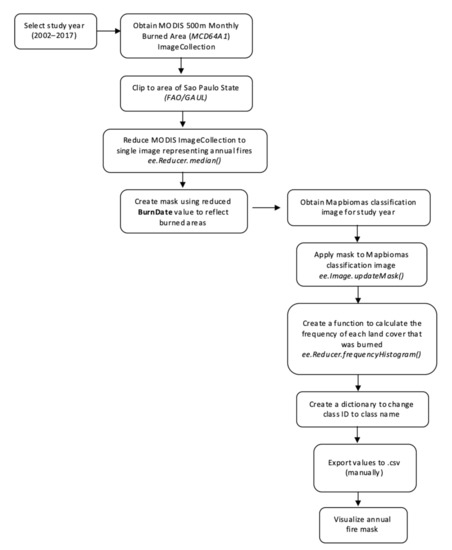
Figure 3.
Methodological flow chart used for calculating and extracting the count of pixels representing each type of land use and land cover classified in the study area.
2.3. Statistical Analysis
The CSV files from previous steps, reflecting the GEE derived yearly land cover type pixel counts for the total study area and for burned areas were exported to an IBM SPSS statistics package. The SPSS Correlation tool was used to create a Pearson correlation matrix showing in-group relationships between the land cover types and the correlation between select coverage types and GDP/GVA. Additionally, the Pearson correlation statistic was used to test the correlation between burned areas and GDP/GVA.
The SPSS correlation matrix returns the Pearson correlation statistic for each variable as well as the two-tailed significance. The correlation matrix was used to explore the strength and direction of the possible relationships between various LULC types and between LULC types and economic outcomes.
Additionally, the Agricultural Economics Institute (IEA) of the State of São Paulo Secretariat of Agriculture reports the annual area planted with sugarcane (1000 ha) (Table 1) [49,76,77,78]. Linear regression was used to investigate the strength of the relationship between the reported amount of sugarcane planted and the sugarcane coverage within the Mapbiomas classification.

Table 1.
Reported area harvested to sugarcane (1000 ha), 2002 and 2017. Data from the Agricultural Economics Institute (IEA) of the State of São Paulo Secretariat of Agriculture; Area Harvested to Sugarcane (1000 ha). Data from the 2005 (a), 2010 (b), 2016 (c), and 2019 (d) reports [49,76,77,78].
To determine the overall trend of growth or loss for the full study period, the annual percent change and 16-year percent change were calculated for both the total land cover data and the burned area data. The overall trend was calculated by subtracting the starting year (2002) value from final year (2017) value, then dividing by the starting year value to generate the overall percent change. The product was then multiplied by 100 to reflect percent change. Negative values indicated an overall decline in the presence of LULC types, and positive values indicated an overall increase in the presence of LULC types.
3. Results
3.1. Land Use Changes
There have been major changes to land use in the state of São Paulo over the study period, 2002 and 2017. Despite initial concerns that the land use changes would have major impacts on the forested areas, the analysis of the classification images over the 16-year period shows that there was not a significant observable change to the forested region (Figure 4).

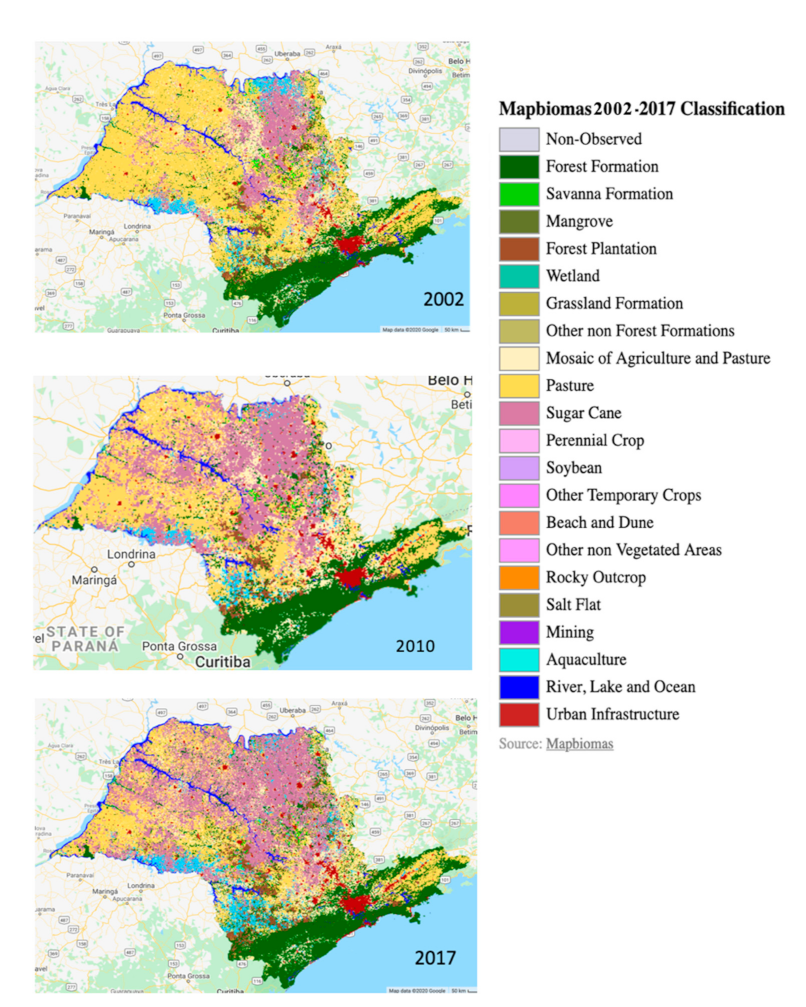
Figure 4.
Land use classification in São Paulo, Brazil, in 2002: (top), at the start of the study period, 2010 (middle), at the midpoint of the study period, and 2017 (bottom), at the end of the study period. Classes and palette are from the original MapBiomas data product.
The MapBiomas classification indicates that there are 21 primary land cover types, including a small percentage of land cover was not observed for the classification (<0.00001%). Examining the land cover classification image from 2002, it is clear that pasture was the overwhelming coverage type (Figure 4). By 2002, the classification shows that there are some regions where the land was converted to agricultural land, with sugarcane being the primary crop type. Following this trend, the 2017 image shows that there is an overwhelming presence of agriculture, mostly in the dark pink pixels that represent sugarcane.
Analysis of the pixel values allowed for a more thorough review of the changes to land use in the area. Overall, despite the 22 different land use types identified in the classification, approximately 99% of the land use coverage types fall into nine classification categories: pasture, sugarcane, mosaic of agriculture and pasture (i.e., mixed use land), soybean, temporary crops, river, lake and ocean, forest formation, savanna formation, forest plantation and urban infrastructure (Table 2). The complete data table including raw values is included in the supplementary materials (see Supplementary Material, Table S2).
Table 2.
Land use in São Paulo, by classification type between 2002 and 2017.
As the visual analysis suggests, the pixel analysis showed that both natural forest formation and forest plantation were not overly impacted by land transition. In fact, there was a very slight increase in coverage for both forest types over the study period. A much more dramatic change was observed in the transition of land use between pasture and sugarcane, which has an inverse relationship (Figure 5).
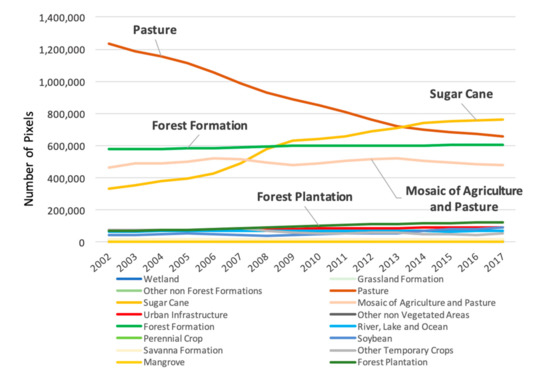
Figure 5.
Line chart of pixel counts for each land use type and each year. Shows that natural forest formation and mosaic of agriculture and pasture have been largely unchanged over the study period. Demonstrates the inverse relationship between pasture and sugarcane.
The relative and absolute change was calculated for each land cover type (see Supplementary Material, Table S3). Consistent with the literature [79,80], the most significant change within the 16-year study period of LULC was the rapid increase in sugarcane production, which corresponded to a net 128% increase in the percent of land used for sugarcane cultivation. The data evaluation showed that throughout more than half of the study period, from 2002 to 2014, pasture was the most represented land cover type in SP, although there was a steady yearly decline (net 43% decrease) over that period that coincided with the increase in sugarcane.
3.2. Fire Event Impact
Using the MODIS data fire mask (Figure 6), the analysis showed that there was a total of over 426,000,500 m burned pixels representing fire events in SP between 2002 and 2017, corresponding to approximately 126,393,030 m burned pixels on the classification layers. Despite the numbers of fire events, the total percentage of burned land per year, based on pixel count, is low. The count of burned pixels represented 5% or less of all the pixels in SP. There appeared to be a steady upward trend in the number of fire events observed from 2002 to 2008 (3–4%), followed by a brief dip in 2009. The next year, 2010, showed the highest number of burned pixels across all years of the study period (5%). Each of the years since 2010 showed a decline in the number of burned pixels, although there was a small spike in the 2017 (Figure 7). Throughout the entire study period, on average 2.6% of the total land cover was burned, and after 2011, the burned area was consistently less than 2% of the total area of SP.
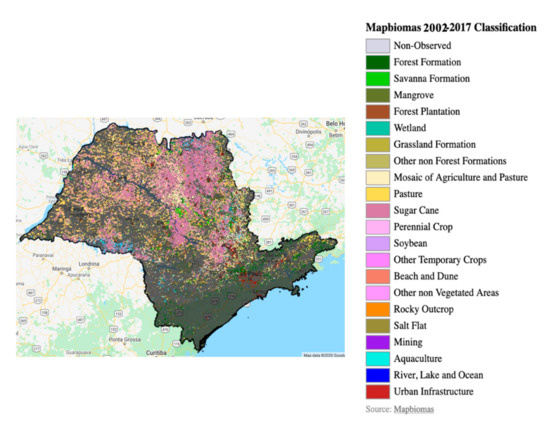
Figure 6.
Example of the fire mask layer of the burned pixels derived from the MODIS Burned Area Monthly Global 500 m product. A mask was created for each year of the study period, to compare the areas impacted by fire events during each year. The mask applied MODIS burned area pixels to Mapbiomas classifications, and pixel colors correspond land cover classification types. The above image reflects all areas which have had a fire event at any time between 2002 and 2017.
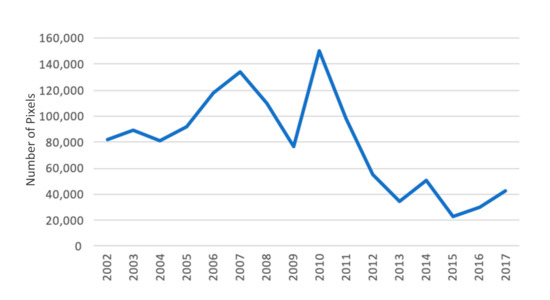
Figure 7.
Yearly count of burned pixels in São Paulo, from 2002 to 2017.
The majority of the pixels burned across all years were agricultural (~90%), although there were some small fire events in the urban and forested areas (~8%, Table 3). The complete data table including raw values is included in the supplementary materials (see Supplementary Material, Table S4). Supporting the findings of the land cover analysis, there is an inverse relationship between the burned pixel counts for pasture and sugarcane, where pasture lands were burned and repurposed into sugarcane plantations. This is supported by the results of the correlation analysis (Section 3.3).
Table 3.
Most commonly burned pixels by classification type between 2002 and 2017.
While sugarcane was found to be the most commonly burned land type during the study period, there was an overall trend of decline in the frequency of fires in SP (Figure 8), amounting to a 49% decrease in burned area in 2017 (see Supplementary Material, Table S5), compared to the start of the study period (2002). Moreover, while the fire events were most closely related to sugarcane, most sugarcane harvesting did not appear to involve fire. Over the course of the study period, while the presence of sugarcane more than doubled, there was a 41% decrease in the count of burned sugarcane between the beginning and end of the study period. Moreover, a comparison of the yearly total number of pixels representing sugarcane and the number of burned sugarcane showed that less than 20% of the area with sugarcane was burned at any point in the study period. During the study period, there was a 74% decrease in the burning of sugarcane crops, with the fewest fires observed in 2015.
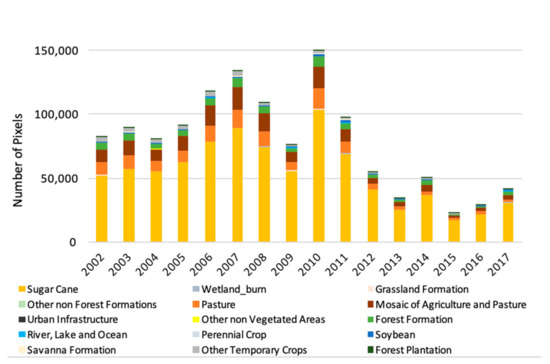
Figure 8.
Stacked bar chart of burned pixel counts for each land use type and each year, which highlights the decline in fire events during the study period.
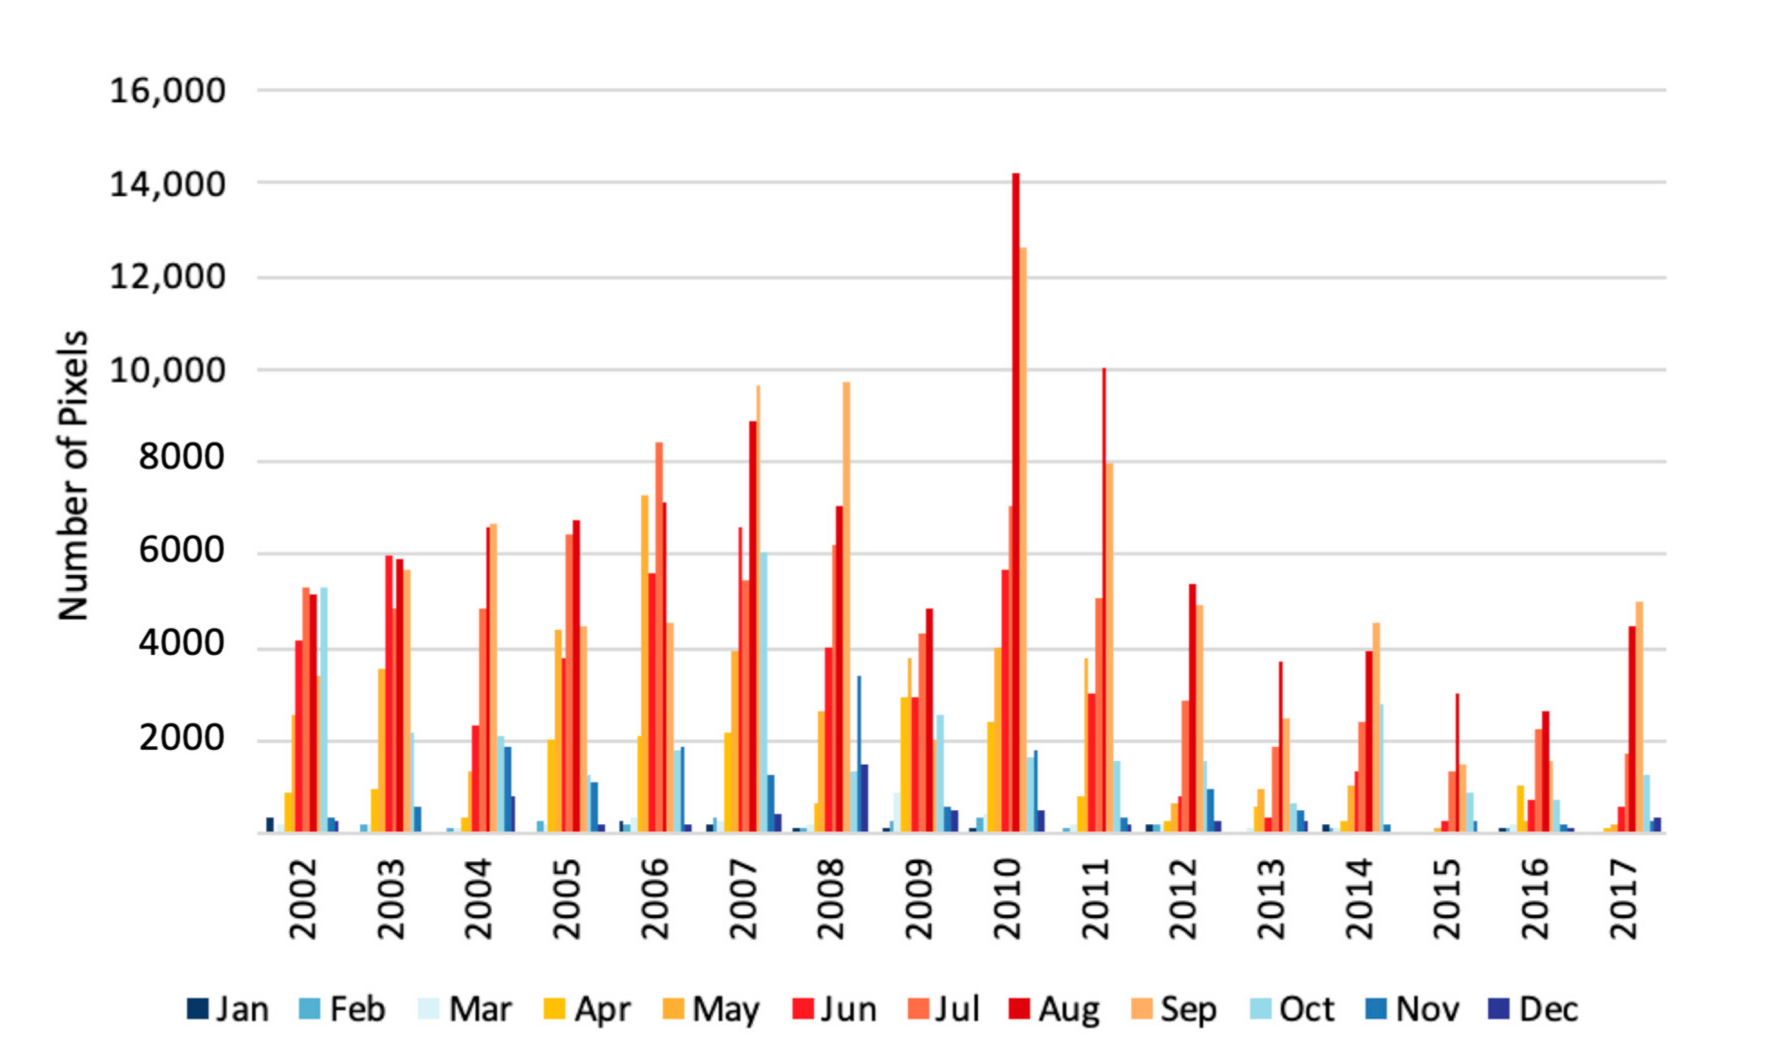
Another result of the analysis was the emergence of the pattern of seasonality (see Supplementary Material, Table S6). The analysis of the total count of annual MODIS burned pixels showed that there was generally a trend in which the frequency of fires tended to sharply increase in April, peak in August, and abruptly drop in October (Figure 9). This observed trend mirrors the documented sugarcane harvesting season in the São Paulo State [6,49,64,81]. The seasonal burn trend also demonstrates the general decline of fire events, excluding the spike in 2010.
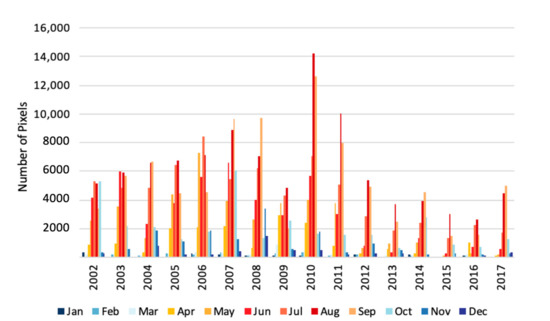
Figure 9.
Bar chart representing annual fire regime for SP, based on frequency of monthly fire events. It also demonstrates general decline in fire events in SP.
3.3. Statistical Analysis
As the land use change and fire event analyses show, the most critical changes occurred with sugarcane and pasture. As a result, these land cover types were prioritized in the statistical analysis. The correlation analysis of the yearly total land cover pixel counts showed a statistically significant, negative relationship between the presence of pasture and sugarcane in SP throughout the entire 16-year study period (r = −0.99, p ≤ 0.01; Table 4), an inverse relationship in which the growth of sugarcane is related to a near equivalent decline in the presence of pasture. During this same period, the correlation between sugarcane and both natural forest (i.e., forest formation) and forest plantations is positive, suggesting that areas with both sugarcane and forest increased. Likewise, the relationship between the increase in sugarcane coverage strongly correlated with both the GVA of agriculture (r = 0.88, p ≤ 0.01) and the total GDP (r = 0.96, p ≤ 0.01). The full correlation matrix included land cover types. The comparatively weaker relationship with the GVA may be caused by the difference in production costs.
Table 4.
Sugarcane correlation results for select variables. Correlation analysis between sugarcane land cover and select land cover types (i.e., pasture, forest), economic indicators for the study period, 2002–2017, and reported acreage of planted sugarcane quantities.
The regression analysis yields an adjusted R2 of 0.89 (p ≤ 0.01), indicating a strong relationship between the reported values of sugarcane planted and the sugarcane classified as sugarcane in the Mapbiomas yearly classification during the study period.
The analysis of the burned area impact (Section 3.2) showed three distinct periods where fire events in the area varied throughout the entire study period, so the statistical analysis was performed for the complete study period as well as each of the three periods observed in the fire analysis (Table 5). The analysis shows that for the entire 16-year study period there is a consistent positive relationship between fire events on land with sugarcane and land with pasture (r = 0.97, p ≤ 0.01) and a mosaic of agriculture and pasture (r = 0.96, p ≤ 0.01), indicating that these various land cover types shared the same relationship during fire events. Moreover, throughout the various periods there was very little variation in the strength of the relationships observed.
Table 5.
Most commonly burned pixels by classification type between 2002 and 2017. Correlation analysis highlighting the relationship between the frequency of burned sugarcane and other agricultural land (i.e., pasture and mosaic of pasture and agriculture), as well as economic indicators for the study period, 2002–2017.
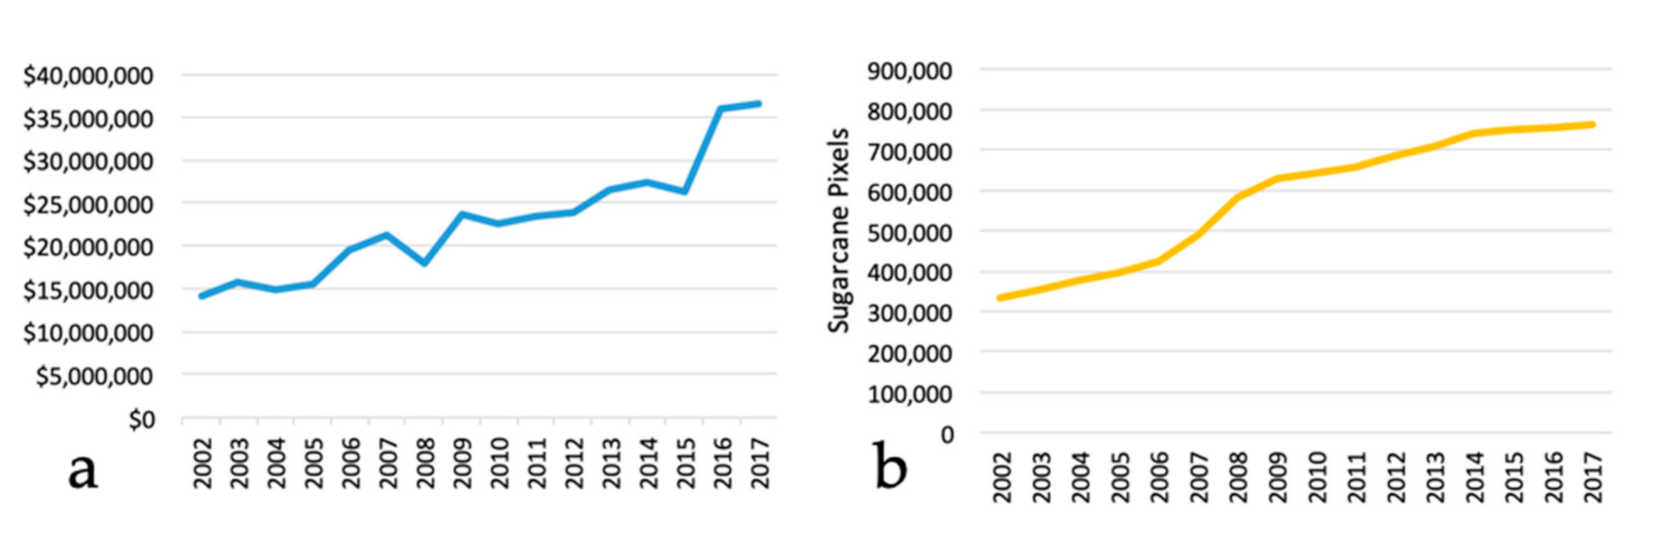
Related to economic production, the data shows throughout the study period, there is some fluctuation in agricultural product of SP, however the yearly trend is towards increased profit. Visual analysis of the GDP and yearly count of sugarcane pixels show a near identical trend line (Figure 10), while the analysis between GVA and the count of sugarcane pixels shows slightly more variation (Figure 11). The two major notes of irregularity can be seen in the decline in GVA for 2008 (15.1%) and 2015 (3.8%), which were not reflected in the burned pixel count. These drops were due to a decline in market pricing and periods of economic recession in Brazil [48,82,83,84], not a decline in crop production.
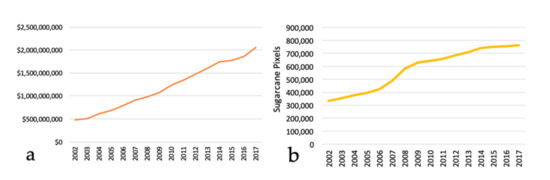
Figure 10.
Yearly growth trends for GDP (inflation adjusted) and sugarcane: (a) yearly GDP for São Paulo in Brazilian Real (R); (b) count of sugarcane pixels detected by year.

Figure 11.
Yearly growth trends for GVA of agriculture and sugarcane: (a) cumulative yearly gross value added (GVA) of agriculture for São Paulo in Brazilian Real (R); (b) count of sugarcane pixels detected by year.
As the above correlation matrix shows, unlike the similar relationships between the burning of various vegetation types, the relationship between burned sugarcane and economic product is mainly weak and fluctuated over the study period. For the 16-year period, the relationship between burned sugar area and both GVA of agriculture (r = −0.546, p ≤ 0.05) and the total GDP (r = −0.617, p ≤ 0.05) was negative. A more granular analysis of the three economic periods observed in the previous Section 3.2 shows more variation in the relationship between sugarcane related fire events and economic production. As Table 5 shows, the period between 2002 and 2008 was the only time during the study period that a positive relationship was observed between burned sugarcane and the GVA of agriculture (r = 0.989, p ≤ 0.01) or the total GDP (r = 0.851, p ≤ 0.05). After this period, between 2009 and 2011, the relationship between burned sugarcane and the GVA of agriculture shifts to strongly negative (r = −0.999, p ≤ 0.05), while the relationship between burned sugarcane and total GDP becomes weaker. Finally, in the 2012–2017 period, the relationships became weak and negative.
4. Discussion
The present study had three main objectives: to investigate if forested areas in SP were being burned or converted for other land uses, to analyze the use of fire as a catalyst and mechanism for land cover change, and to determine if there was a relationship between land use changes and GDP. The data showed that, despite initial concerns, there has been some increase in the forested areas in SP between 2002 and 2017, based on the increased presence of pixels representing natural forest regrowth (5% increase) and forest plantations (75% increase). At the same time, there is a 120% increase in land used for sugarcane, and nearly a 50% decrease in pasture land coverage.
As the results demonstrated, the primary land use change involved a decline in pasture and growth in agriculture. The practice of fluctuating between pasture and agricultural land use in Brazil is an established and documented technique, which is used by farmers to maintain the greatest gains from the land [45,85]. Newer and more sustainable techniques for cultivation, which result in less land degradation [86,87], and the increased profitability of agriculture compared to pasture lands [45,79,80,88] likely contributed to these land use changes. Additionally, of all the agricultural crops identified in the classification, sugarcane and soybeans are the most profitable [47].
The results of the burned pixel analysis showed that there were three distinct epochs in the uses of fire in SP. In the first period, 2002–2008, fire was used largely to convert land. This is evidenced by how rapidly the percentage of pixels representing pasture decreases during that period (41% to 31%), as well as decline in the rate of fires, based on the percent of burned pasture pixels (33% to 17%) during this period. The literature supports this finding, as cattle farming on pasture lands was main economic product in Brazil in the 1980s [85], and by the 1990s there was movement towards converting pasture land to agricultural land in some parts of Brazil [17,89]. IBGE reports also support this trend, indicating that between 1996 and 2006 pasture lands decreased by more than 40%, while sugarcane crops saw substantial increases [19,53]. During this same study period, each of the various agricultural crops showed an increase in coverage percentage, with sugarcane showing the largest annual increase. The highest frequency of burning for soybean and other types of agriculture could also be seen during the 2002–2008 period, although the land use percentages had very small changes. This suggests that land transition was not the only use of fire during this period. Slash-and-burn agriculture is often used for beans [32], which may suggest that the burning of soybean, temporary crops, and perhaps mosaics of agriculture and pasture are the result of slash-and-burn farming techniques.
The analysis of the burned pixel data shows that the highest number of fire events occurred in the period of 2009–2011 (Figure 6). In that time, there was a comparatively moderate decrease in the pasture land coverage, although there was a steady, demonstrated trend of decline. Likewise, pasture lands were burned at a much lower rate during this period than was observed in the previous period. Similarly, the land use percentage for sugarcane began to stabilize during this period, with sugarcane representing around 21% of the land use in SP. Despite the stabilization of land use, the number of burned pixels continued to increase, hitting its peak in 2010. This suggests that land transition began to taper off during this time, and fire was no longer used as a mechanism for land use transition. Instead, the focus of the burning was on sugarcane, which is the most profitable agricultural product grown in SP. Supporting this theory, there was a decrease in the percentage of non-sugarcane burned pixels during this four-year period, indicating that the possible slash-and-burn agriculture may have also displayed a decrease in this time.
The burning of sugarcane is a commonly used cultivation technique, used to strip off the tops and outer leaves from the stalk of the plant, as they have no profit potential and slows the harvesting process, and to begin the sugar crystallization process, reducing the amount of factory processing required [17,30]. Additionally, the fires are used as a safety measure as burning can protect manual harvesters from animals, such as poisonous snakes and other sources of injury [28]. In Brazil, sugarcane is an important agricultural product as a food product and a major source of ethanol alcohol, which has increasingly more uses including as a sustainable alternative fuel source. It is reported that conversion of cattle pasture and other land to cropland in Brazil is due not only to rising domestic and international food demand but also to rising ethanol production for fuel, food, and fibers, expanding demand for sugarcane [68,90], and was influenced by several government driven initiatives to increase engagement in sugarcane cultivation [64,79,88,91].
The final period, 2011 to 2017, showed a huge reduction in the number of fire events in SP, with a 65–85% decline in burned pixels, compared to the 2010 peak. During this period, the land use values were steady, and the burned pixels were mainly in areas where sugarcane was planted. The fire pixel values observed in this period indicate a discontinuation of the use of fire to catalyze change in land use and a decline in cultivation practices that use fire. This is likely due to conservation efforts and laws in SP that are aimed at protecting the environment and improving the health of those who harvest crops or live in areas where sugarcane and other crops are burned [26,27,28,29,30].
It was previously documented that pre-harvest sugarcane burning contributes to more asthma related hospital visits and produces air pollution levels similar to the burning of fossil fuels [25,26,27,28,29,30,31,32,37,38]. Since 2008, there have been efforts to mechanize the cultivation process for sugarcane, minimizing the use of fire for cultivation. State Law 11,241/2002 was approved in the state of São Paulo and signed into law in 2007. The law gradually bans the burning of sugarcane, seeking to end the practice by 2031 [20,90,91].
Many of the recent initiatives put in place were in support of the alternative cultivation method known as green harvesting [37,64,89,92]. This method is performed using a machine that separates the sugarcane leaves from the stems, so the remaining leaves and the unused tops of stalks are left in the soil, enriching it. This is considered preferable to the burning method, as it results in much less damage to the soil and the environment; it is less harmful to surrounding communities, and allows for the unused product to be returned to the soil, ideally improving the health and moisture levels of the land [40,41]. Due to the high cost of the machinery, adoption to this technique was not immediate. However, there were increased attempts to train and compensate landowners for using green harvesting methods in SP, resulting in increased adoption and the observed decrease in harvesting related fire events. Ambitiously, São Paulo state set a goal to end the burning of sugarcane by 2017 [20,64], and data showed that in 2008 and 2009, more than half (51%) of the sugarcane harvested in São Paulo state was harvested without burning [79,93]. Based on the results of the analysis, in 2017, approximately 98% of the sugarcane in SP was unburned. As of 2021, UNICA, the Brazilian Sugarcane Industry Association reported that the harvesting of sugarcane is almost fully mechanized (99%) and burning has been eliminated (98%) [94].
Throughout the study period there was a general trend of decline in the occurrence of MODIS detected fire events in São Paulo state. This is a positive change for the overall health of the environment, manual harvesters, and local communities living in areas where sugarcane is harvested. Additionally, as research suggests, the expansion of the sugarcane industry did not directly contribute to deforestation in SP [53]. As mentioned above, there were a number of conservation efforts aimed at restoring the native vegetation and increasing the overall forest area with forest plantations. This analysis shows that over the 16-year study period, there was growth in both native and planted forest vegetation.
While the analysis showed that the forested region is not being burned or lost in large quantities, there is a need to monitor the forested areas in SP. Although the analysis shows that agricultural growth is not coming at the cost of forest cover, the literature does show that forest fragments that are surrounded by sugarcane can be less biodiverse than those surrounded by pasture [4,6,7,22,66,95]. With this reality in mind, it is important that the maintenance and growth of the forested areas in SP are not superficial efforts that mask negative outcomes in the health of the forest ecosystem.
5. Conclusions
While there was continuous growth in the presence of sugarcane in SP [96], there was great success in the reduction in agriculture related fire events in the state, as evidenced by this study. Analysis of land use and land cover change is beneficial in understanding when and how deforestation and agricultural production change the landscape of an area. It is often important to monitor land cover and land use changes in areas where there is a documented history of destruction. This analysis ultimately shows that economically driven land use change can be identified and traced through the use and comparison of both economic and land use data.
Limitations and Future Work
Limitations of this study are inherently based on the fact that the data were extracted from datasets with varied accuracies, ranging from 30 m to 500 m. This means that it is possible and likely that some pixels were misclassified during one or both stages of the analysis. As the classification data are drawn from the MapBiomas initiative, there may be inaccuracies in the data, as well as known limitations in the vegetation types which were classified. Likewise, if there are errors in the MODIS data, this can impact the resulting analyses. To improve the accuracy of the analysis, it may be necessary to perform an independent analysis using ground truth data or by collecting harvesting data from farmers in the area.
Another limitation is the lack of availability of state level GDP data for Brazil. The IBGE derived data are only available for the period of 2002–2017, preventing an extension of this study’s scope beyond this 16-year period. Future work can benefit from more data relating to the GDP and agricultural product for SP over a longer period, which would allow for a more thorough analysis of the impact changes in land cover types and fire events on GDP.
Finally, as this study shows that there was a minor increase in fire events in 2017, compared to prior years, it would be beneficial to extend the scope of the study to the present and continue to monitor the area to see if that trend continues. This is meaningful as a way of measuring compliance with recent laws and local response to conservation efforts.
Future work can also involve analyzing the monthly land cover changes for the period of 2011 forward, to see how fire-related harvesting and green cultivation methods may impact the land differently. Expanding the timeline of the analysis may also be beneficial in gaining a more complete picture of the land use changes in SP. Additionally, future studies incorporating IBGE Municipal Agricultural Production (PAM) data, which report on annual production amounts, can be used to gauge the reliability of the Mapbiomas data and further analyze the impact of LULC change on GDP.
Supplementary Materials
The following are available online at https://www.mdpi.com/article/10.3390/rs13152853/s1, Figure S1: Google Earth Engine code used to extract total pixel count for each land cover/land use type, Figure S2: Google Earth Engine code used to create yearly burned area mask to calculate total number of pixel for each land cover/land use type in an area with a MODIS detected fire event, Table S1: Sum totals of the GVA of agriculture, total GVA, and GDP, Table S2: Yearly total number of by land use/land cover type, Table S3: Overall relative change and absolute change for land use/land cover types between 2002 and 2017, Table S4: Yearly total number of burned area pixels by land use/land cover type, Table S5: Overall percent change and absolute change in burn frequency for each LULC type between 2002 and 2017, Table S6: Total monthly number of MODIS detected burned area pixels.
Author Contributions
Conceptualization, S.P. and W.N.-M.; methodology, S.P.; software, S.P.; formal analysis, S.P.; investigation, S.P.; data curation, S.P.; writing—original draft preparation, S.P.; writing—review and editing, W.N.-M. and S.P.; supervision, W.N.-M. Both authors have read and agreed to the published version of the manuscript.
Funding
This research was partially funded by NASA, grant number 80NSSC21K0194.
Institutional Review Board Statement
Not applicable.
Informed Consent Statement
Not applicable.
Data Availability Statement
The data presented in this study are available in the article and supplementary materials.
Acknowledgments
The authors would like to express sincere appreciation to Emma Lee Yu, for sharing her time, knowledge, and insight, especially related to sugarcane growth and cultivation practices. We are also grateful of the three anonymous reviewers for their helpful and constructive feedback.
Conflicts of Interest
The authors declare no conflict of interest.
References
- Morton, D.C.; Defries, R.S.; Randerson, J.T.; Giglio, L.; Schroeder, W.; Van Der Werf, G.R. Agricultural intensification increases deforestation fire activity in Amazonia: Deforestation fires in Amazonia. Glob. Change Biol. 2008, 14, 2262–2275. [Google Scholar] [CrossRef] [Green Version]
- Simoes, R.; Picoli, M.C.A.; Camara, G.; Maciel, A.; Santos, L.; Andrade, P.R.; Sánchez, A.; Ferreira, K.; Carvalho, A. Land use and cover maps for Mato Grosso state in Brazil from 2001 to 2017. Sci. Data 2020, 7. [Google Scholar] [CrossRef] [PubMed] [Green Version]
- Souza, C.M.Z.; Shimbo, J.; Rosa, M.R.; Parente, L.L.A.; Alencar, A.; Rudorff, B.F.T.; Hasenack, H.; Matsumoto, M.G.; Ferreira, L.; Souza-Filho, P.W.M.; et al. Reconstructing three decades of land use and land cover changes in Brazilian biomes with Landsat archive and Earth Engine. Remote Sens. 2020, 12, 2735. [Google Scholar] [CrossRef]
- De Moraes, M.C.P.; de Mello, K.; Toppa, R.H. Protected areas and agricultural expansion: Biodiversity conservation versus economic growth in the southeast of Brazil. J. Environ. Manag. 2017, 188, 73–84. [Google Scholar] [CrossRef]
- Trindade, M.B.; Lins-e-Silva, A.C.B.; Silva, H.D.; Figueira, S.B.; Schessl, M. Fragmentation of the Atlantic Rainforest in the northern coastal region of Pernambuco, Brazil: Recent changes and implications for conservation. Biorem. Biodivers. Bioavailab. 2008, 2, 5–13. Available online: http://www.globalsciencebooks.info/Online/GSBOnline/images/0812/BBB_2(SI1)/BBB_2(SI1)5-13o.pdf (accessed on 30 June 2021).
- Teixeira, A.M.G.; Soares-Filho, B.S.; Freitas, S.R.; Metzger, J.P. Modeling landscape dynamics in an Atlantic Rainforest region: Implications for conservation. For. Ecol. Manag. 2009, 257, 1219–1230. [Google Scholar] [CrossRef]
- Lira, P.K.; Tambosi, L.R.; Ewers, R.M.; Metzger, J.P. Land-Use and land-cover change in Atlantic Forest landscapes. For. Ecol. Manag. 2012, 278, 80–89. [Google Scholar] [CrossRef]
- Ribeiro, M.C.; Metzger, J.P.; Martensen, A.C.; Ponzoni, F.J.; Hirota, M.M. The Brazilian Atlantic Forest: How much is left, and how is the remaining forest distributed? Implications for conservation. Biol. Conserv. 2009, 142, 1141–1153. [Google Scholar] [CrossRef]
- Tabarelli, M.; Pinto, L.P.; Silva, J.M.C.; Hirota, M.; Bede, L. Challenges and opportunities for biodiversity conservation in the Brazilian Atlantic Forest. Conserv. Biol. 2005, 19, 695–700. [Google Scholar] [CrossRef]
- Butler, R.A. Brazil’s Forests. Mongabay. 2020. Available online: https://rainforests.mongabay.com/brazil/ (accessed on 15 October 2020).
- Salemi, L.F.; Groppo, J.D.; Trevisan, R.; de Moraes, J.M.; de Barros Ferraz, S.F.; Villani, J.P.; Duarte-Neto, P.J.; Martinelli, L.A. Land-use change in the Atlantic rainforest region: Consequences for the hydrology of small catchments. J. Hydrol. 2013, 499, 100–109. [Google Scholar] [CrossRef]
- de Oliveira, G.; Moraes, E.C.; Brunsell, N.A.; Shimabukuro, Y.E.; Mataveli, G.A.V.; dos Santos, T.V. Analysis of precipitation and evapotranspiration in Atlantic Rainforest remnants in southeastern Brazil from remote sensing data. In Tropical Forests—The Challenges of Maintaining Ecosystem Services while Managing the Landscape; Blanco, J.A., Chang, S.-C., Lo, Y.-H., Eds.; IntechOpen: London, UK, 2016; pp. 93–112. [Google Scholar] [CrossRef] [Green Version]
- Ribeiro, M.C.; Martensen, A.C.; Metzger, J.P.; Tabarelli, M.; Scarano, F.; Fortin, M.-J. The Brazilian Atlantic forest: A shrinking biodiversity hotspot. In Biodiversity Hotspots; Zachos, F.E., Habel, J.C., Eds.; Springer: Berlin/Heidelberg, Germany, 2011; pp. 405–434. [Google Scholar] [CrossRef]
- Fundación Vida Silvestre Argentina & WWF. State of the Atlantic Forest: Three countries, 148 million people, one of the richest forests on earth. 2017. Available online: http://awsassets.panda.org/downloads/documento_fvs_baja.pdf (accessed on 8 April 2021).
- Government of the State of São Paulo Secretary of the Environment (SMA). Action Plan of the State of São Paulo—SMA Component Aichi Targets 2020 Implementation in the State of São Paulo. Strategic Plan for Biodiversity 2011–2020. Convention on Biological Diversity. 2013. Available online: smastr16.blob.core.windows.net/english/2015/04/Aichi_impressao_21_2_14_pdf_ENG_V.pdf (accessed on 28 June 2021).
- Santana, C.A.M.; Nascimento, J.R. Public policies and agricultural investment in Brazil (Final Report). Food and Agriculture Organization of the United Nations Policy Assistance Support. Service (TCSP). 2012. Available online: www.fao.org/fileadmin/templates/tci/pdf/InvestmentPolicy/Inv_in_Br_agriculture_-_20_08_2012.pdf (accessed on 29 June 2021).
- Alkimim, A.; Sparovek, G.; Clarke, K.C. Converting Brazil’s pastures to cropland: An alternative way to meet sugarcane demand and to spare forestlands. Appl. Geogr. 2015, 62, 75–84. [Google Scholar] [CrossRef]
- Kronka, F.J.N.; Nalon, M.A.; Matsukuma, C.K.; Kanashiro, M.M.; Ywane, M.S.S.; Pavão, M.; Durigan, G.; Lima, L.M.P.R.; Guillaumon, J.R.; Baitello, J.B.; et al. Forest Inventory of the Natural Vegetation in São Paulo State. [Inventário florestal da vegetação natural do estado de São Paulo.] Secretaria de Infraestrutura e Meio Ambiente|Instituto Florestal. 2005. Available online: www.infraestruturameioambiente.sp.gov.br/institutoflorestal/2005/03/inventario-florestal-da-vegetacao-natural-do-estado-de-sao-paulo/ (accessed on 20 September 2020).
- Vera, I.; Wicke, B.; van der Hilst, F. Spatial variation in environmental impacts of sugarcane expansion in Brazil. Land 2020, 9, 397. [Google Scholar] [CrossRef]
- Lucon, O.; Goldemberg, J. São Paulo—The “other” Brazil: Different pathways on climate change for state and federal governments. J. Environ. Dev. 2010, 19, 335–357. [Google Scholar] [CrossRef]
- Cláudio da Silva, M.; Scarano, F.R.; de Souza Cardel, F. Regeneration of an Atlantic Forest formation in the understorey of a eucalyptus grandis plantation in South-Eastern Brazil. J. Trop. Ecol. 1995, 11, 147–152. [Google Scholar] [CrossRef]
- Pachenco, R.; Silva, R.R.; Morini, M.S.D.C.; Brandão, C.R.F. A Comparison of the Leaf-Litter Ant Fauna in a Secondary Atlantic Forest with an Adjacent Pine Plantation in Southeastern Brazil. Neotrop. Entomol. 2009, 38, 55–65. Available online: www.scielo.br/j/ne/a/KFFnCvxtgjwVjfHLtDk9nxC/?lang=enformat=pdf (accessed on 20 September 2020). [CrossRef] [PubMed] [Green Version]
- Sansevero, J.B.B.; Prieto, P.V.; de Moraes, L.F.D.; Rodrigues, P.J.P. Natural regeneration in plantations of native trees in lowland Brazilian Atlantic forest: Community structure, diversity, and dispersal syndromes. Restor. Ecol. 2011, 19, 379–389. [Google Scholar] [CrossRef]
- Miccolis, M.; Teixeira de Andrade, R.M.; Pacheco, P. Land-use trends and environmental governance policies in Brazil: Paths forward for sustainability. Working paper. Center for International Forestry Research (CIFOR). 2014. Available online: https://www.cifor.org/publications/pdf_files/WPapers/WP171Pacheco.pdf (accessed on 30 June 2021).
- Fanin, T.; van der Werf, G.R. Relationships between burned area, forest cover loss, and land cover change in the Brazilian Amazon based on satellite data. Biogeosciences 2015, 12, 6033–6043. [Google Scholar] [CrossRef] [Green Version]
- Tsao, C.-C.; Campbell, J.E.; Mena-Carrasco, M.; Spak, S.N.; Carmichael, G.R.; Chen, Y. Increased estimates of air-pollution emissions from Brazilian sugar-cane Ethanol. Nat. Clim. Change 2012, 2, 53–57. [Google Scholar] [CrossRef]
- Arbex, M.A.; Martins, L.C.; de Oliveira, R.C.; Pereira, L.A.A.; Arbex, F.F.; Cancado, J.E.D.; Saldiva, P.H.N.; Braga, A.L.F. Air pollution from biomass burning and asthma hospital admissions in a sugar cane plantation area in Brazil. J. Epidemiol. Comm. Health 2007, 61, 395–400. [Google Scholar] [CrossRef] [Green Version]
- Arbex, M.A.; Böhm, G.M.; Saldiva, P.H.N.; Conceição, G.M.S.; Iii, A.C.P.; Braga, A.L.F. Assessment of the effects of sugar cane plantation burning on daily counts of inhalation therapy. J. Air Waste Manage. Assoc. 2000, 50, 1745–1749. [Google Scholar] [CrossRef]
- De, S. Paraiso, M.L.; Gouveia, N. Health risks due to pre-harvesting sugarcane burning in São Paulo State, Brazil. Rev. Bras. Epidemiol. 2015, 18, 691–701. [Google Scholar] [CrossRef] [Green Version]
- Uriarte, M.; Yackulic, C.B.; Cooper, T.; Flynn, D.; Cortes, M.; Crk, T.; Cullman, G.; McGinty, M.; Sircely, J. Expansion of sugarcane production in São Paulo, Brazil: Implications for fire occurrence and respiratory health. Agr. Ecosyst. Environ. 2009, 132, 48–56. [Google Scholar] [CrossRef]
- Nicolella, A.C.; Belluzzo, W. The effect of reducing the pre-harvest burning of sugar cane on respiratory health in Brazil. Environ. Dev. Econ. 2015, 20, 127–140. [Google Scholar] [CrossRef]
- Pedroso-Junior, N.; Adams, C.; Murrieta, R. Slash-and-burn agriculture: A system in transformation. In Current Trends in Human Ecology; Lopes, P., Begossi, A., Eds.; Cambridge Scholars Publishing: Newcastle upon Tyne, UK, 2009; pp. 12–34. Available online: www.researchgate.net/publication/280839609_Slash-and-Burn_Agriculture_A_System_in_Transformation (accessed on 30 November 2020).
- Sloan, S.; Locatelli, B.; Wooster, M.J.; Gaveau, D.L.A. Fire activity in Borneo driven by industrial land conversion and drought during El Niño periods, 1982–2010. Glob. Environ. Change 2017, 47, 95–109. [Google Scholar] [CrossRef] [Green Version]
- Suyanto, S.; Applegate, G.; Permana, R.P.; Khususiyah, N.; Kurniawan, I. The role of fire in changing land use and livelihoods in Riau-Sumatra. Ecol. Soc. 2004, 9, 15. [Google Scholar] [CrossRef]
- Cochrane, M.A.; Laurance, W.F. Synergisms among fire, land use, and climate change in the Amazon. Ambio 2008, 37, 522–527. Available online: https://www.jstor.org/stable/25547943 (accessed on 14 April 2021). [CrossRef] [PubMed]
- Lima, A.; Silva, T.S.F.; de Aragão, L.E.O.e.C.; de Feitas, R.M.; Adami, M.; Formaggio, A.R.; Shimabukuro, Y.E. Land use and land cover changes determine the spatial relationship between fire and deforestation in the Brazilian Amazon. Appl. Geogr. 2012, 34, 239–246. [Google Scholar] [CrossRef]
- Machado Pinheiro, É.F.; Lima, E.; Ceddia, M.B.; Urquiaga, S.; Alves, B.J.R.; Boddey, R.M. Impact of pre-harvest burning versus trash conservation on soil carbon and nitrogen stocks on a sugarcane plantation in the brazilian atlantic forest region. Plant. Soil 2010, 333, 71–80. [Google Scholar] [CrossRef]
- Venkataraman, C.; Habib, G.; Kadamba, D.; Shrivastava, M.; Leon, J.-F.; Crouzille, B.; Boucher, O.; Streets, D.G. Emissions from open biomass burning in India: Integrating the inventory approach with high-resolution Moderate Resolution Imaging Spectroradiometer (MODIS) active-fire and land cover data. Global Biogeochem. Cycles 2006, 20. [Google Scholar] [CrossRef]
- Baguant, J. Electricity production from the biomass of the sugarcane industry in Mauritius. Biomass 1984, 5, 283–297. [Google Scholar] [CrossRef]
- Sornpoon, W.; Bonnet, S.; Kasemsap, P.; Prasertsak, P.; Garivait, S. Estimation of emissions from sugarcane field burning in Thailand using bottom-up country-specific activity data. Atmosphere 2014, 5, 669–685. [Google Scholar] [CrossRef] [Green Version]
- Devineau, J.-L.; Fournier, A.; Nignan, S. Savanna fire regimes assessment with MODIS fire data: Their relationship to land cover and plant species distribution in Western Burkina Faso (West Africa). J. Arid Environ. 2010, 74, 1092–1101. [Google Scholar] [CrossRef] [Green Version]
- Langner, A.; Miettinen, J.; Siegert, F. Land cover change 2002–2005 in Borneo and the role of fire derived from MODIS imagery. Global Change Biol. 2007, 13, 2329–2340. [Google Scholar] [CrossRef]
- Zhan, X.; Sohlberg, R.A.; Townshend, J.R.G.; DiMiceli, C.; Carroll, M.L.; Eastman, J.C.; Hansen, M.C.; DeFries, R.S. Detection of land cover changes using MODIS 250 m data. Remote Sens. Environ. 2002, 83, 336–350. [Google Scholar] [CrossRef]
- Seydi, S.T.; Akhoondzadeh, M.; Amani, M.; Mahdavi, S. Wildfire damage assessment over Australia using Sentinel-2 imagery and MODIS land cover product within the Google Earth Engine cloud platform. Remote Sens. 2021, 13, 220. [Google Scholar] [CrossRef]
- Shock, C.C.; Williams, W.A. Pastures and their management in South-Central Brazil. Pesq. Agropec. Bras. 1977, 12, 105–118. Available online: https://ainfo.cnptia.embrapa.br/digital/bitstream/item/197556/1/Pastures-and-their-management.pdf (accessed on 11 December 2020).
- Brazilian Institute of Geography and Statistics (IBGE). Gross Domestic Product of Municipalities: Complete Tables Dataset. 2018. Available online: https://ftp.ibge.gov.br/Pib_Municipios/2018/xlsx/tabelas_completas.xlsx (accessed on 20 October 2020).
- Johnston, M. Fundamentals of how Brazil Makes its Money. Investopedia. 2019. Available online: www.investopedia.com/articles/investing/050815/fundamentals-how-brazil-makes-its-money.asp (accessed on 1 July 2021).
- Valdes, C. Brazil’s Ethanol Industry: Looking Forward. United States Department of Agriculture Bioenergy No. (BIO-02). Available online: www.ers.usda.gov/webdocs/outlooks/35828/7395_bio02.pdf?v=8420.6 (accessed on 1 July 2021).
- United States Department of Agriculture Foreign Agricultural Service—Global Agricultural Information Network (USDA-GAIN). Brazil: SUGAR ANNUAL. 2019. Available online: apps.fas.usda.gov/newgainapi/api/report/downloadreportbyfilename?filename=SugarAnnual_SaoPauloATO_Brazil_4-15-2019.pdf (accessed on 1 July 2021).
- Chagas, A.; Toneto, R., Jr.; Azzoni, C. The expansion of sugarcane cultivation and its impact on municipal revenues: An application of dynamic spatial panels to municipalities in the state of São Paulo, Brazil. In Energy, BioFuels and Development; Routledge: Abingdon-on-Thames, UK, 2011; pp. 316–338. [Google Scholar] [CrossRef]
- Sampaio, I.L.M.; Cardoso, T.F.; Souza, N.R.D.; Watanabe, M.D.B.; Carvalho, D.J.; Bonomi, A.; Junqueira, T.L. Electricity production from sugarcane straw recovered through bale system: Assessment of retrofit projects. Bioenerg. Res. 2019, 12, 865–877. [Google Scholar] [CrossRef] [Green Version]
- Investe São Paulo. Business Sector: Sugarcane. Available online: www.en.investe.sp.gov.br/business-sectors/agribusiness/sugar-cane/ (accessed on 3 July 2021).
- Sparovek, G.; Barretto, A.; Berndes, G.; Martins, S.; Maule, R. Environmental, land-use and economic implications of Brazilian sugarcane expansion 1996–2006. Mitig. Adapt. Strateg. Glob. Change 2009, 14, 285–298. [Google Scholar] [CrossRef]
- Satolo, L.; Bacchi, M. Impacts of the recent expansion of the sugarcane sector on municipal per capita income in São Paulo State. ISRN Econ. 2013, 2013, 1–14. [Google Scholar] [CrossRef] [Green Version]
- Caldarelli, C.E.; Moraes, M.A.F.D.D.; Paschoalino, P.A.T. Sugarcane ethanol industry effects on the GDP per capita in the center-south region of Brazil. REA 2017, 15, 183–200. [Google Scholar] [CrossRef]
- Chen, C.; He, X.; Liu, Z.; Sun, W.; Dong, H.; Chu, Y. Analysis of regional economic development based on land use and land cover change information derived from Landsat imagery. Sci. Rep. 2020, 10, 12721. [Google Scholar] [CrossRef]
- Sutton, P.C.; Costanza, R. Global estimates of market and non-market values derived from nighttime satellite imagery, land cover, and ecosystem service valuation. Ecol. Econ. 2002, 41, 509–527. [Google Scholar] [CrossRef]
- Henderson, J.V.; Storeygard, A.; Weil, D.N. Measuring economic growth from outer space. Am. Econ. Rev. 2012, 102, 994–1028. [Google Scholar] [CrossRef] [PubMed] [Green Version]
- Kavats, O.; Khramov, D.; Sergieieva, K.; Vasyliev, V. Monitoring of sugarcane harvest in Brazil based on Optical and SAR data. Remote Sens. 2020, 12, 4080. [Google Scholar] [CrossRef]
- Magalhães, P.S.G.; Cerri, D.G.P. Yield Monitoring of Sugar Cane. Biosyst. Eng. 2007, 96, 1–6. [Google Scholar] [CrossRef]
- McCarty, J.L.; Justice, C.O.; Korontzi, S. Agricultural burning in the Southeastern United States detected by MODIS. Remote Sens. Environ. 2007, 108, 151–162. [Google Scholar] [CrossRef]
- Brazilian Institute of Geography and Statistics (IBGE). Brazilian Government Cities@ [Cidades@] Portal: São Paulo—Code: 35 Dataset. Available online: www.ibge.gov.br/en/cities-and-states/sp/.html? (accessed on 14 April 2021).
- Demographia World Urban Areas, 16th ed.; 2021. Available online: http://www.demographia.com/db-worldua.pdf (accessed on 21 December 2020).
- Aguiar, D.A.; Rudorff, B.F.T.; Silva, W.F.; Adami, M.; Mello, M.P. Remote sensing images in support of environmental protocol: Monitoring the sugarcane harvest in São Paulo State, Brazil. Remote Sens. 2011, 3, 2682–2703. [Google Scholar] [CrossRef] [Green Version]
- Investe São Paulo. Diversified Economy: GDP. 2021. Available online: https://www.en.investe.sp.gov.br/why-sao-paulo/diversified-economy/gdp/ (accessed on 1 July 2021).
- Costa, S. São Paulo—Overview. 2021. Available online: https://www.deik.org.tr/uploads/sao-paulo-bilgi-notu.pdf (accessed on 1 July 2021).
- Brazilian Institute of Geography and Statistics (IBGE). GDP of Municipalities: Agriculture Represents More than Half of Economic Activity in 1135 Municipalities. 2016. Available online: https://censo2010.ibge.gov.br/en/noticias-censo.html?view=noticia&id=1&idnoticia=3343&busca=1&t=gdp-of-municipalities-agriculture-represents-more-than-half-economic-activity-in-1 (accessed on 20 October 2020).
- Alisson, E.; Arantes, J.T. Agricultural Output in São Paulo State Grew More than 90% in Last Two Decades. Agência FAPESP. 2016. Available online: https://agencia.fapesp.br/agricultural-output-in-São-paulo-state-grew-more-than-90-in-last-two-decades/24151/ (accessed on 19 October 2020).
- Hansen, M.C.; Potapov, P.V.; Moore, R.; Hancher, M.; Turubanova, S.A.; Tyukavina, A.; Thau, D.; Stehman, S.V.; Goetz, S.J.; Loveland, T.R.; et al. High-resolution global maps of 21st-century forest cover change. Science 2013, 342, 850–853. [Google Scholar] [CrossRef] [Green Version]
- Nyland, K.E.; Gunn, G.E.; Shiklomanov, N.I.; Engstrom, R.N.; Streletskiy, D.A. Land cover change in the lower Yenisei River using dense stacking of Landsat imagery in Google Earth Engine. Remote Sens. 2018, 10, 1226. [Google Scholar] [CrossRef] [Green Version]
- Food and Agriculture Organization of the United Nations (FAO). Global Administrative Unit Layers (GAUL). FAO Map Catalog. 2014. Available online: https://data.apps.fao.org:/map/catalog/srv/api/records/9c35ba10-5649-41c8-bdfc-eb78e9e65654 (accessed on 21 December 2020).
- Mapbiomas Brasil. Project. Available online: https://mapbiomas.org/en/project (accessed on 14 December 2020).
- Giglio, L.; Justice, C.; Boschetti, L.; Roy, D. MCD64A1 MODIS/Terra+Aqua Burned Area Monthly L3 global 500m SIN grid V006 [Dataset]. NASA EOSDIS Land Processes DAAC. 2015. Available online: https://doi:10.5067/MODIS/MCD64A1.006 (accessed on 18 October 2020). [CrossRef]
- Giglio, L.; Schroeder, W.; Hall, J.V.; Justice, C.O. MODIS Collection 6 Active Fire Product User’s Guide Revision C. 2020. Available online: https://modis-fire.umd.edu/files/MODIS_C6_Fire_User_Guide_C.pdf (accessed on 18 October 2020).
- Boschetti, L.; Roy, D.P.; Giglio, L.; Huang, H.; Zubkova, M.; Humber, M.L. Global validation of the collection 6 MODIS burned area product. Remote Sens. Environ. 2019, 235, 111490. [Google Scholar] [CrossRef]
- USDA—GAIN. Brazil: Sugar Annual 2005. Available online: https://apps.fas.usda.gov/newgainapi/api/Report/DownloadReportByFileName?fileName=Annual%20Report_Sao%20Paulo%20ATO_Brazil_04-28-2005 (accessed on 1 July 2021).
- USDA—GAIN. Brazil: Sugar Annual 2010. Available online: https://apps.fas.usda.gov/newgainapi/api/report/downloadreportbyfilename?filename=Sugar%20Annual_Sao%20Paulo%20ATO_Brazil_4-12-2010.pdf (accessed on 1 July 2021).
- USDA—GAIN. Brazil: Sugar Annual 2016. Available online: https://apps.fas.usda.gov/newgainapi/api/report/downloadreportbyfilename?filename=Sugar%20Annual_Sao%20Paulo%20ATO_Brazil_4-15-2016.pdf (accessed on 1 July 2021).
- Rudorff, B.F.T.; Aguiar, D.A.; Silva, W.F.; Sugawara, L.M.; Adami, M.; Moreira, M.A. Studies on the rapid expansion of sugarcane for ethanol production in São Paulo state (Brazil) using Landsat data. Remote Sens. 2010, 2, 1057–1076. [Google Scholar] [CrossRef] [Green Version]
- Oliveira, J.C.; Lamparelli, R.A.C.; Figueiredo, G.K.D.A.; Campbell, E.E.; Soares, J.R.; Monteiro, L.A.; Vianna, M.; Jaiswal, D.; Bonamigo, A.F.C.; Sheehan, J.J.; et al. Pasture land cover change in São Paulo state, Brazil. Int. Arch. Photogramm. Remote Sens. Spatial Inf. Sci. 2020, XLII-3/W12-2020, 321–326. [Google Scholar] [CrossRef]
- Observatório da Cana. Production and Milling History. Available online: https://observatoriodacana.com.br/historico-de-producao-e-moagem.php?idMn=31&tipoHistorico=2 (accessed on 3 July 2021).
- De Barros, J.R.M.; The Impact of the International Financial Crisis on Brazil (ARI). Area: International Cooperation & Development. 2010. Available online: www.realinstitutoelcano.org/wps/wcm/connect/657b82004218865b8c0cee8b6be8b54b/ARI38-2010_MendocadeBarros_Impact_International_Financial_Crisis_Brazil.pdf?CACHEID=657b82004218865b8c0cee8b6be8b54b&MOD=AJPERES (accessed on 14 April 2021).
- Cascione, S. Brazil’s Worst-Ever Recession Unexpectedly Deepens in Late 2016. Reuters. 2017. Available online: https://www.reuters.com/article/us-brazil-economy-gdp-idUSKBN16E1EL (accessed on 4 March 2021).
- Sobreira, R.; de Paula, L.F. The 2008 financial crisis and banking behavior in Brazil: The role of the prudential regulation. J. Innov. Econ. 2010, 6, 77–93. [Google Scholar] [CrossRef]
- De, O.; Bordonal, R.; Carvalho, J.L.N.; Lal, R.; de Figueiredo, E.B.; de Oliveira, B.G.; La Scala, N. Sustainability of sugarcane production in Brazil. A review. Agron. Sustain. Dev. 2018, 38, 13. [Google Scholar] [CrossRef] [Green Version]
- Parente, L.; Mesquita, V.; Miziara, F.; Baumann, L.; Ferreira, L. Assessing the pasturelands and livestock dynamics in Brazil, from 1985 to 2017: A novel approach based on high spatial resolution imagery and Google Earth Engine cloud computing. Remote Sens. Environ. 2019, 232, 111301. [Google Scholar] [CrossRef]
- Apex-Brasil. Brazil Leverages Breakthroughs in Technology, Productivity and Safety to Lead Global Agriculture and Livestock Market Amid COVID-19. Available online: https://www.prnewswire.com/news-releases/brazil-leverages-breakthroughs-in-technology-productivity-and-safety-to-lead-global-agriculture-and-livestock-market-amid-covid-19-301102477.html (accessed on 14 April 2021).
- Assunção, J.J.; Bragança, A.; Hemsley, P. High Productivity Agricultural Techniques in Brazil. Climate Policy Institute. 2013. Available online: https://www.climatepolicyinitiative.org/publication/high-productivity-agricultural-techniques-in-brazil-adoption-barriers-and-potential-solutions/ (accessed on 17 March 2021).
- CEPEA—Center for Advanced Studies on Applied Economics. Areas With Pasture Reduce, But Yield Increases. Available online: https://www.cepea.esalq.usp.br/en/brazilian-agribusiness-news/areas-with-pasture-reduce-but-yield-increases.aspx (accessed on 23 March 2021).
- Leite, M.R.; Zanetta, D.M.T.; Trevisan, I.B.; de, A.; Burdmann, E.; de P. Santos, U. Sugarcane cutting work, risks, and health effects: A literature review. Rev. Saúde Pública 2018, 52, 80. [Google Scholar] [CrossRef] [Green Version]
- Dos, S.; Costa, A.; Malhado, A.C.M.; Bragagnolo, C.; Correia, R.A.; Ladle, R.J. Ecological outcomes of Atlantic Forest restoration initiatives by sugar cane producers. Land Use Policy 2016, 52, 345–352. [Google Scholar] [CrossRef]
- Rachid, C.T.C.C.; Santos, A.L.; Piccolo, M.C.; Balieiro, F.C.; Coutinho, H.L.C.; Peixoto, R.S.; Tiedje, J.M.; Rosado, A.S. Effect of sugarcane burning or green harvest methods on the Brazilian Cerrado soil bacterial community structure. PLoS ONE 2013, 8, e59342. [Google Scholar] [CrossRef]
- Institute of Agricultural Economics (IEA). Ethanol in the State of São Paulo. 2007. Available online: http://www.iea.sp.gov.br/bioe/bio-english-1.pdf (accessed on 30 June 2021).
- UNICA (Brazilian Sugarcane Industry Association). Sustainability. Available online: https://observatoriodacana.com.br/ (accessed on 30 June 2021).
- D’Anunciação, P.E.R.; Silva, M.F.V.; Ferrante, L.; Assis, D.S.; Casagrande, T.; Coelho, A.Z.G.; Amâncio, B.C.S.; Pereira, T.R.; da Silva, V.X. Forest fragments surrounded by sugar cane are more inhospitable to terrestrial amphibian abundance than fragments surrounded by pasture. Int. J. Ecol. 2013, 2013, 1–8. [Google Scholar] [CrossRef]
- França, D.; Longo, K.; Rudorff, B.; Aguiar, D.; Freitas, S.; Stockler, R.; Pereira, G. Pre-harvest sugarcane burning emission inventories based on remote sensing data in the state of São Paulo, Brazil. Atmos. Environ. 2014, 99, 446–456. [Google Scholar] [CrossRef]


Publisher’s Note: MDPI stays neutral with regard to jurisdictional claims in published maps and institutional affiliations. |
© 2021 by the authors. Licensee MDPI, Basel, Switzerland. This article is an open access article distributed under the terms and conditions of the Creative Commons Attribution (CC BY) license (https://creativecommons.org/licenses/by/4.0/).