Article

Driving Factors of Land Surface Temperature in Urban Agglomerations: A Case Study in the Pearl River Delta, China

1
Aerospace Information Research Institute, Chinese Academy of Sciences, Beijing 100101, China
2
University of Chinese Academy of Sciences, Beijing 100101, China
3
Sanya Institute of Remote Sensing, Sanya 572029, China
4
Environment & Climate Changes Research Institute, National Water Research Center, El Qanater EI khairiya 13621/5, Egypt
5
Geosciences and Remote Sensing Department, Delft University of Technology, Stevinweg, 12628 CN Delft, The Netherlands
*
Author to whom correspondence should be addressed.
Remote Sens. 2021, 13(15), 2858; https://doi.org/10.3390/rs13152858
Submission received: 16 June 2021 / Revised: 17 July 2021 / Accepted: 18 July 2021 / Published: 21 July 2021
(This article belongs to the Special Issue Geographical Analysis and Modeling of Urban Heat Island Formation)

Abstract

:
Land surface temperature (LST) in urban agglomerations plays an important role for policymakers in urban planning. The Pearl River Delta (PRD) is one of the regions with the highest urban densities in the world. This study aims to explore the spatial patterns and the dominant drivers of LST in the PRD. MODIS LST (MYD11A2) data from 2005 and 2015 were used in this study. First, spatial analysis methods were applied in order to determine the spatial patterns of LST and to identity the hotspot areas (HSAs). Second, the hotspot ratio index (HRI), as a metric of thermal heterogeneity, was developed in order to identify the features of thermal environment across the nine cities in the PRD. Finally, the geo-detector (GD) metric was employed to explore the dominant drivers of LST, which included elevation, land use/land cover (LUCC), the normalized difference vegetation index (NDVI), impervious surface distribution density (ISDD), gross domestic product (GDP), population density (POP), and nighttime light index (NLI). The GD metric has the advantages of detecting the dominant drivers without assuming linear relationships and measuring the combined effects of the drivers. The results of Moran’s Index showed that the daytime and nighttime LST were close to the cluster pattern. Therefore, this process led to the identification of HSAs. The HSAs were concentrated in the central PRD and were distributed around the Pearl River estuary. The results of the HRI indicated that the spatial distribution of the HSAs was highly heterogeneous among the cities for both daytime and nighttime. The highest HRI values were recorded in the cities of Dongguan and Shenzhen during the daytime. The HRI values in the cities of Zhaoqing, Jiangmen, and Huizhou were relatively lower in both daytime and nighttime. The dominant drivers of LST varied from city to city. The influence of land cover and socio-economic factors on daytime LST was higher in the highly urbanized cities than in the cities with low urbanization rates. For the cities of Zhaoqing, Huizhou, and Jiangmen, elevation was the dominant driver of daytime LST during the study period, and for the other cities in the PRD, the main driver changed from land cover in 2005 to NLI in 2015. This study is expected to provide useful guidance for planning of the thermal environment in urban agglomerations.

Graphical Abstract

1. Introduction

The urban heat island (UHI) is a global phenomenon caused by urbanization [1]. UHI affects air quality [2], threatens the health of urban residents [3,4], influences building energy consumption, and leads to the risk of overheating in outdoor thermal environments [5]. Generally, UHI can be assessed by using the air temperature or land surface temperature (LST). Urban agglomerations, which represent groups of cities that have a compact spatial organization and close economic connections, have become the most prominent feature of global urbanization in recent decades [6,7]. Especially in China, urban agglomerations have become the major form of national urbanization [8]. Therefore, it is important to understand the spatial distribution patterns of LST and the main driving factors affecting LST in order to formulate informed urban policies for urban agglomerations in the future [9].
Most previous studies focused on the spatial distribution characteristics and driving factors of LST [10,11,12,13,14,15,16,17,18]. The spatial distribution of high LSTs is significant for understanding the landscape patterns of LST [19,20]. According to previous studies, the potential factors of LST can be divided into three types: (1) land cover factors, which include land use/land cover (LUCC) [21], the normalized difference vegetation index (NDVI) [22,23,24], and the normalized difference built-up index (NDBI) [25,26]. This type also includes the impervious surface area (ISA) and the impervious surface distribution density (ISDD), which indicate the urbanization intensity of an area from the perspective of impervious surfaces [27,28]. (2) Socio-economic factors, which include the gross domestic product (GDP) [29], population density (POP) [30,31], and industrial production activities [32]. In addition, the nighttime light index (NLI) can indicate the human density [33], energy consumption [34], built-up area [35], and socioeconomic dynamics [36]. However, few studies have explored the relationship between NLI and LST. (3) Physiographical factors, which include elevation and slope, have also been studied [37,38].
The correlations between LST and various factors should be clarified in order to determine the main drivers of LST. Several methods, including the use of Pearson correlation coefficient [39], linear regression analysis [8,30], and stepwise multiple-linear regression [40], have been widely used in previous studies. LST is usually affected by multiple factors, and their interactions are quite complex. However, the above-mentioned methods cannot adequately measure the non-linear correlations between LST and the various drivers [9], or they cannot deal with categorical data [41]. In addition, few studies have taken the combined effect of different factors into consideration when determining the dominant factors of LST. Therefore, this study applied the geo-detector (GD) metric [42] to explore the correlations between LST and three types of drivers in order to avoid the previous limitations. The GD metric is applicable to the non-linear relations between the drivers and LST, and can also measure the combined impact of different drivers on LST. Due to its good applicability, the GD metric has been widely used in studies of drivers, including air pollution [43,44,45], public health [41,46,47], land use [48,49], regional economies [50,51], and urban environment [9,52].
This study was conducted in the Pearl River Delta (PRD) urban agglomeration, China. The PRD is one of the most important economic centers in China, and is also one of the most highly urbanized and populous regions in the world [53]. The cities included in the PRD were merged into an urban agglomeration in 2005 [54]. The PRD contributed about 9.12% of the national gross domestic product in 2015 [55], and is known as an “economic miracle” and the “world factory”. Its rapid urbanization and industrialization led to significant land cover changes and brought a series of environmental problems, including urban flood risk, air pollution, and the UHI effect in the PRD [56,57,58]. The PRD has a subtropical climate and is located along the coast of the South China Sea. The dual effects of rapid urbanization and climate make the PRD highly susceptible to extreme heatwave events [20]. However, the current studies on the thermal environment in the PRD are still not adequate. Most previous studies focused solely on individual factors of LST, such as LUCC, ISA, or greenspace in the PRD [19,20,37,59,60,61,62]. In addition, more attention has been paid to the core cities, such as Guangzhou, Dongguan, Shenzhen, and Zhongshan cities [19,63,64,65,66], while the cities in the east and west of the PRD have received less attention.
To address the above problems, this study aimed to explore the spatial distribution characteristics of LST and to detect its main driving factors by using the GD metric in the PRD. First, we studied the spatial distribution of LST and used Moran’s Index to indicate the presence of hotspot areas (HSAs). Then, the HSAs were determined by using hotspot analysis in a GIS environment. Second, the Hotspot Ratio Index (HRI) was developed to evaluate and rank the thermal gradient of each city in the urban agglomeration. Finally, the GD metric was used to measure the influence of each factor and the combined influence of the different factors on LST. Seven factors were selected based on the literature review and available data. The effects of the seven factors on the LST in the nine cities were compared to reveal the complex mechanism of LST in the PRD. Our study contributes to a better understanding of the spatial distribution characteristics of LST and its main driving factors, which is helpful in providing insights into the optimization of the urban thermal environment.

2. Study Area and Data Sources
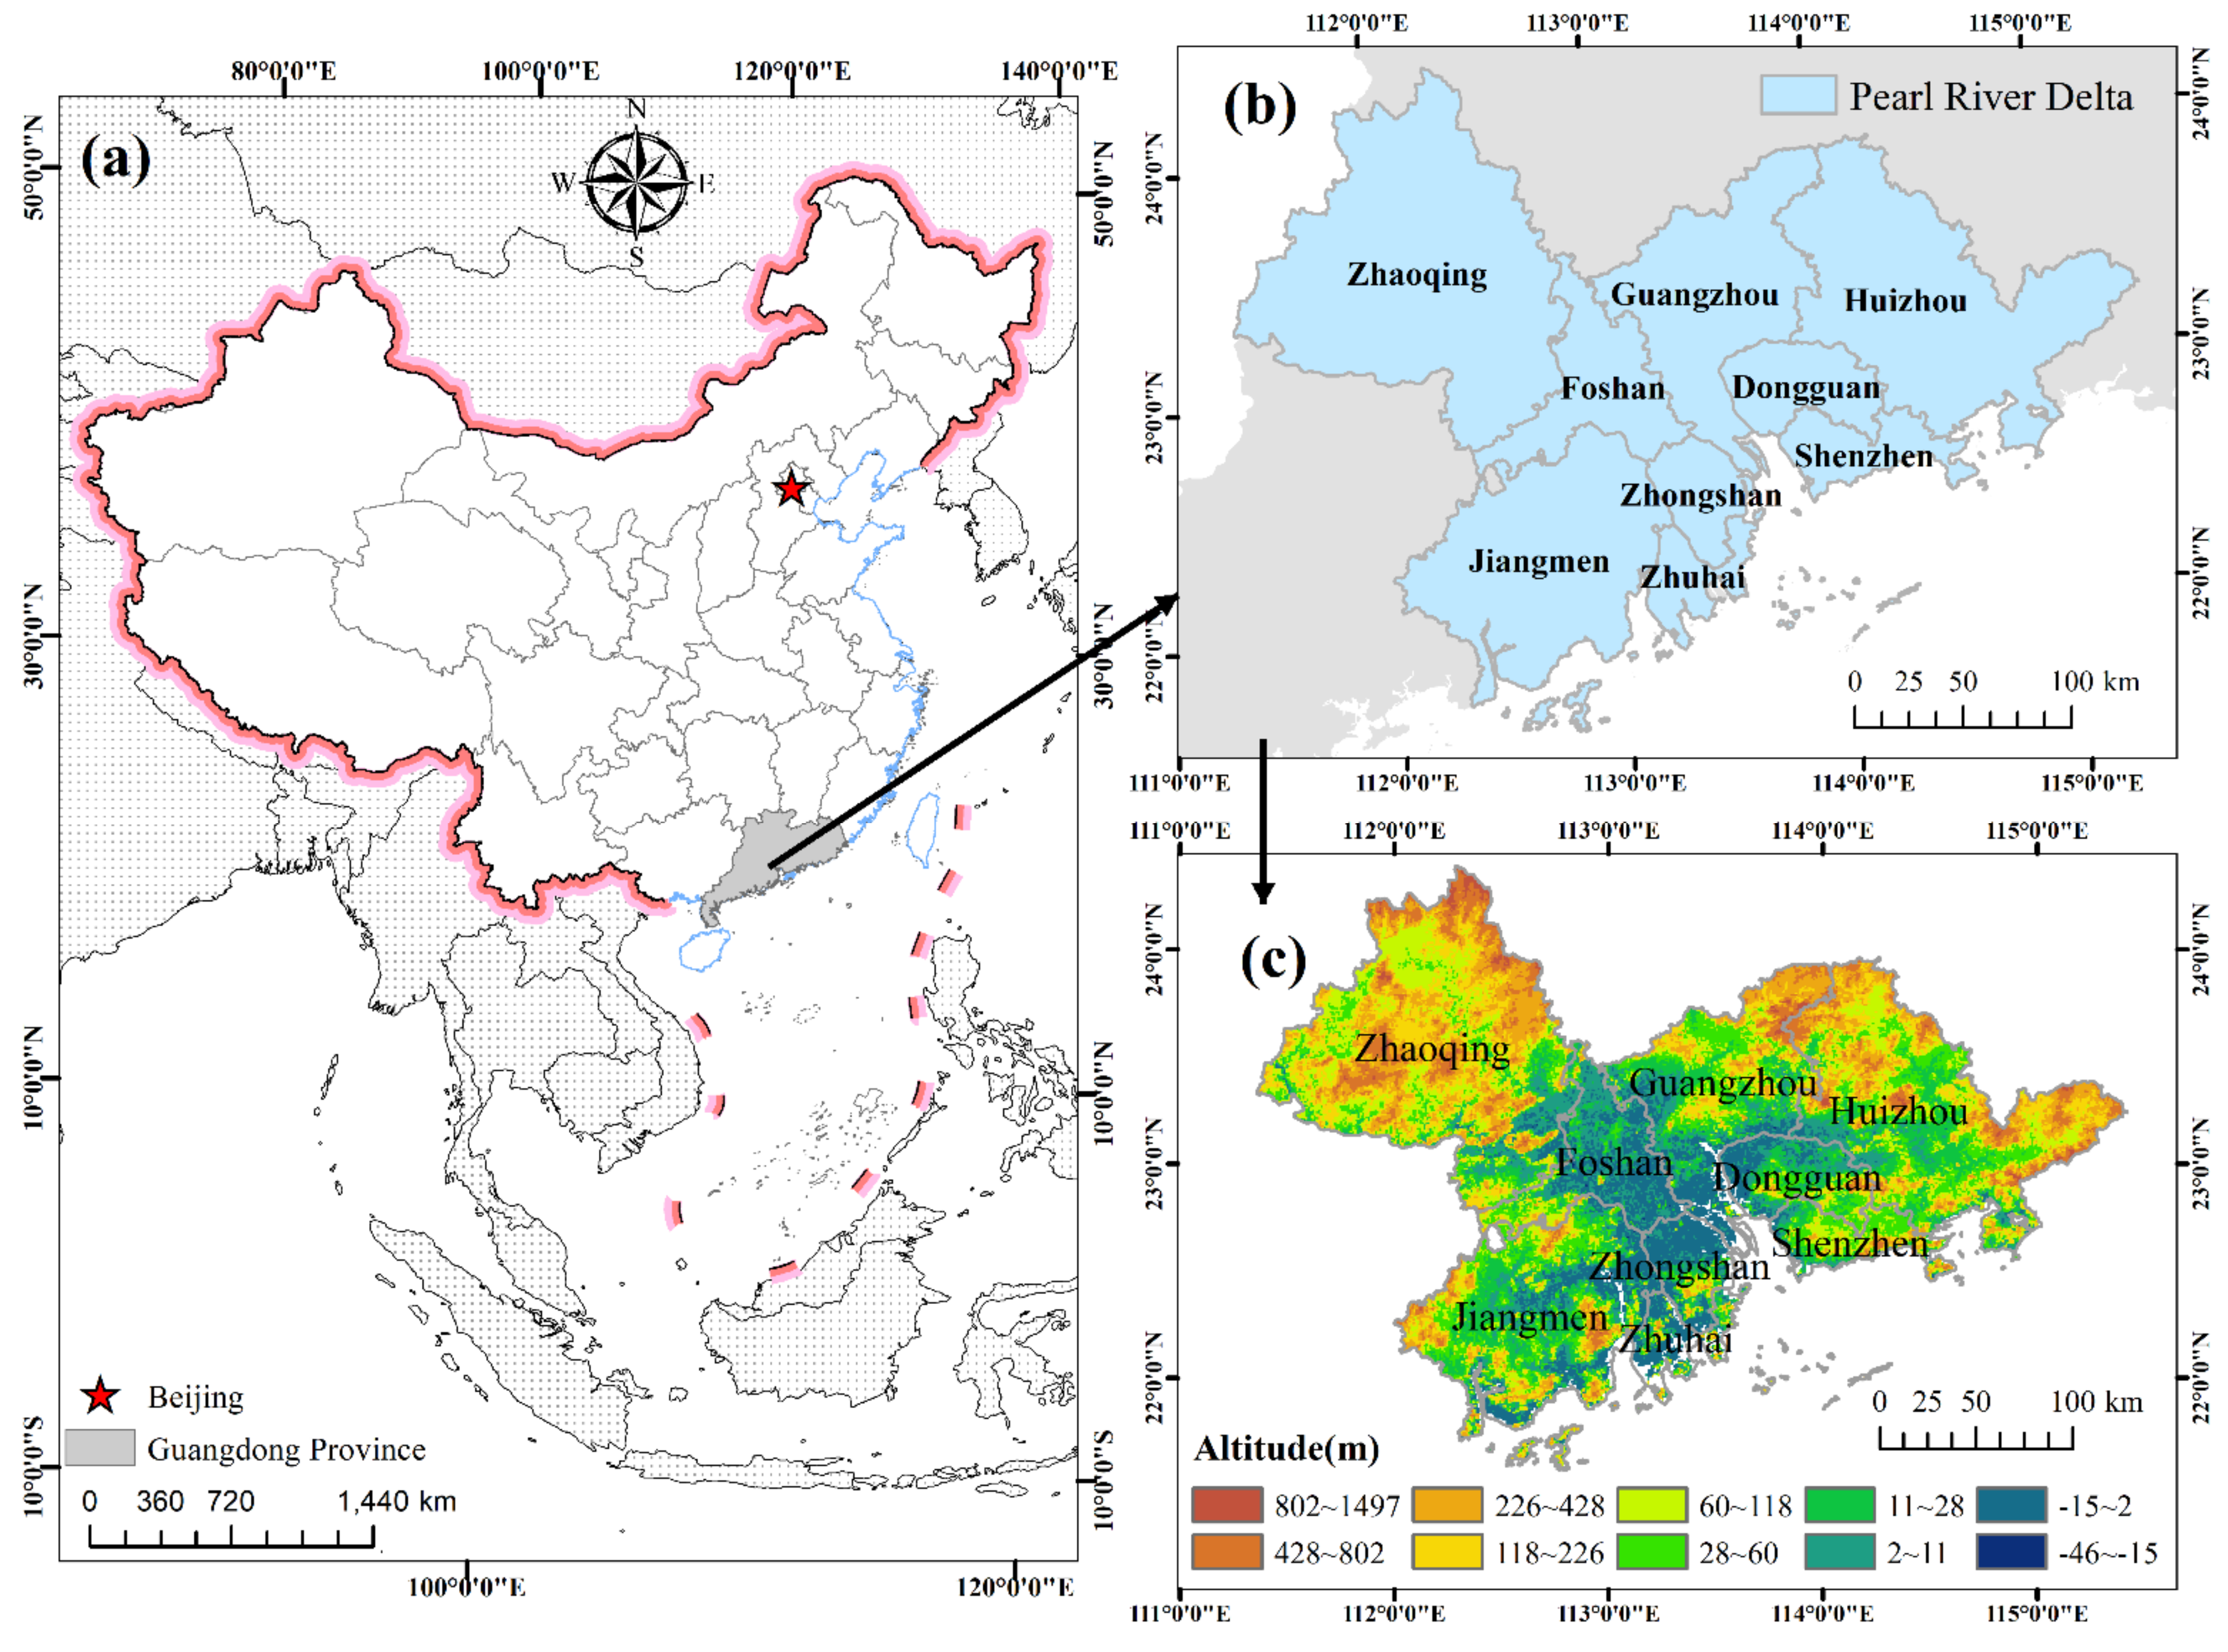
2.1. Study Area

The PRD urban agglomeration is one of the regions with the highest urban densities in the world and is one of the most developed regions in China. It is located in the south-central coastal region of Guangdong Province, and it includes nine cities: Guangzhou, Foshan, Dongguan, Shenzhen, Zhongshan, Zhuhai, Huizhou, Zhaoqing, and Jiangmen (Figure 1). The PRD is surrounded by hills and mountains to the north, west, and east. The total area of the PRD is 55,000 km2 [61]. The PRD experienced rapid population growth and economic growth from 2005 to 2015, with its population increasing by 13.27 million, and its GDP increased by about 3.8 trillion yuan (http://stats.gd.gov.cn, accessed on 15 September 2020). The PRD became the largest mega-region in the world according to the World Bank Group (2015). The average annual temperature ranges from 21 to 23 °C, and the average annual precipitation is over 1500 mm [60,67]. The PRD was selected for this study because its thermal environment became a serious problem due to the acceleration of its urbanization. Table 1 shows some key attributes of the nine cities in the PRD. The air temperature data were obtained from the National Meteorological Data Center (http://data.cma.cn, accessed on 10 April 2021). The permanent population and electricity consumption data were derived from the Statistical Yearbook of Guangdong Province.

2.2. Data Sources

In this study, the LST data for 2005 and 2015 were obtained from the 8-days (version 6) MODIS Aqua LST composite products (MYD11A2) (https://search.earthdata.nasa.gov, accessed on 6 June 2019). The MYD11A2 LST product was validated with in situ measurements to yield a bias of <0.5 K [68]. We used the annual mean LST observed in the daytime/nighttime at 13:30/01:30 local solar time [37]. The potential driving factors were selected according to previous research and available data, including the elevation, LUCC, NDVI, ISDD, GDP, POP, and NLI (Table 2). The elevation, LUCC, NDVI, POP, and GDP data were obtained from the Resource and Environment Science and Data Center (www.resdc.cn, accessed on 15 June 2019). The LUCC data included six types: cultivated land, woodland, grassland, water area, construction, and unused land. The NDVI product was computed from the continuous time series of the SPOT/VEGETATION NDVI remote sensing dataset. The GDP and POP were grid data with a 1 km resolution. In addition, the impervious surface data were obtained from published global urban datasets (https://doi.org/10.6084/m9.figshare.11513178.v1, accessed on 18 June 2020). The calculation of the ISDD is detailed in [27]. The NLI was obtained from nighttime light imageries, which were downloaded from the Resource and Environment Science and Data Center (www.resdc.cn, accessed on 15 June 2019) and the National Geophysical Data Center (http://ngdc.noaa.gov, accessed on 15 June 2019). All data were resampled to a 1 km resolution to keep the consistence of the spatial resolution of the data analyzed. The sources of the driver data are summarized in Table 2.

3. Methods

3.1. Spatial Variability of LST

The MYD11A2 LST products were used to get the annual average daytime LST and annual average nighttime LST for 2005 and 2015. The MODIS Reprojection tool was used to preprocess the MYD11A2 LST data, which included format conversion, re-projection, and clipping. The mask tool was used to remove cloud pixels; only pixels with a high quality (average LST error < = 1 K) were used to calculate the annual average LST for 2005 and 2015.

3.1.1. Global Moran’s Index

Spatial distribution analysis is often used to explore geographical phenomena. The Global Moran’s Index was used to analyze the spatial distribution of the LST. The value of the Global Moran’s Index is between −1.0 and 1.0, where 1 indicates perfect positive spatial autocorrelation, −1 indicates perfect negative spatial autocorrelation, and 0 indicates a perfect spatial randomness [69]. The Global Moran’s Index is calculated as follows:
I = n i = i n j = 1 n W i j x i x ¯ x j x ¯ i = 1 n j = 1 n W i j i = 1 n x i x ¯ 2
where n is the number of pixels; x i and x j are the LSTs at pixels i and j ; x ¯ is the mean LST; w i j is the spatial weight determined with the spatial correlation of the LSTs at pixels i and j .

3.1.2. Hotspot Analysis

Many previous methods for delineating high-temperature regions have applied numerical classification [70], Gaussian surface fitting [71,72,73], radial sampling [74,75], and hotspot analysis [76,77]. Hotspot analysis can be used to identify the spatial clusters of high LSTs (hotspots) and low LSTs (cold spots) by using only LST data, thus avoiding the subjective influence that may be caused by having too many parameter settings. Therefore, hotspot analysis was applied to identify the areas with high (hotspot) or low (cold spot) LSTs in this study. Based on the clustering patterns of the spatial distribution of the LST, the Getis–Ord Gi (Gi*) index was applied to measure the degree of clustering for each pixel [77]. For each pixel, the hotspot analysis returns a z-score. A higher positive z- score indicates a higher degree of clustering of high LSTs (hot spots) [78]. In this study, the areas with z-scores ≥ 2.58 (corresponding to the 99% confidence level) were defined as HSAs [76]. The Gi* is defined as:
G i * = j = 1 n ω i j x j X ¯ j = 1 n ω i j S [ n j = 1 n ω i j 2 j = 1 n ω i j 2 ] n 1
X ¯ = j = 1 n x j n
S = j = 1 n x j 2 n ( X ) ¯ 2
where, x j is the LST value of pixel j , ω i j represents the spatial weight between pixels i and j , and n is the total number of pixels; the spatial weight is determined according to the Queen’s adjacency connectivity matrix [76].

3.2. Hotspot Ratio Index

The urban-heat-island ratio index was applied in previous studies to evaluate and rank thermal environments [79,80]. It is effective in measuring the characteristics of a thermal environmental, but its calculation requires urban or rural boundary data [80,81]. In this study, the hotspot ratio index (HRI) was used to evaluate and rank the thermal environments of the nine cities. The HRI gives scores and ranks the areas according to the value of the LST. The HRI is calculated as the weighted sum of the percentage of HSAs with different classes in the selected region. The HRI reflects the thermal gradient in the selected region. A higher HRI indicates that a city has a higher thermal gradient, which implies that the city is more likely to experience greater thermal stress. The HRI is calculated as follows:
H R I = i = 1 n i * P i
where n is the total number of classes. To avoid skewed data, the quantile classification method was applied to classify the HSAs into 5 classes according to the LSTs. P i is the ratio of the area of class i to the total study area. i is the class index, i.e., i = 1, 2, 3, 4, and 5. A higher class index refers to a higher LST. To calculate the HRI, the areas of 1st, 2nd, 3rd, 4th, and 5th classes of HSAs were divided by the total study area, then multiplied by the class index.

3.3. Geo-Detector Metric

The geo-detector (GD) metric is an effective metric for revealing the drivers of geographical phenomena [42]. The main idea assumes that if an independent variable affects the dependent variable, then their spatial distributions should be similar. The GD metric includes four detectors: factor, interaction, risk, and ecological. We used the factor detector to measure the influence of each driver on the LST. We also used the interaction detector to measure the combined influence of the interactions between drivers on the LST. The GD metric is freely available from www.geodetector.cn, accessed on 18 July 2021.

3.3.1. Factor Detector

The factor detector signifies the effects of factors on the LST. The greater the probability distribution (q) value is, the greater the influence of the factors on the LST will be. The value of q is between 0 and 1; in extreme cases, the q value equals 1, indicating that factor X completely affects the spatial distribution of Y, and a q value of 0 indicates that factor X has nothing to do with Y. The value of q is calculated as follows [42]:
q = 1 1 N σ 2 h = 1 L N h σ h 2
where the LST (Y) and the drivers (X) are composed of L classes (h = 1, 2, …L); N and N h represent the numbers of cells in the entire area and the h class, and σ 2 and σ h 2 represent the variance in the LST.

3.3.2. Interaction Detector

The interaction detector was used to measure the influence of the interactions between different factors on the LST. It identifies whether the interactions between drivers (X1 and X2) have an effective influence on the LST or not. First, we separately calculate the influence of each driver (q(X1) and q(X2)) on the LST; then, the influence of the interaction between X1 and X2 (q(X1∩X2)) on the LST is calculated based on an overlay of the two drivers (X1 and X2). According to the values of q(X1), q(X2), and q(X1∩X2), the effect of the interaction between the two drivers on the LST can be determined (Table 3) [9].

3.3.3. Data Preparation

The GD metric captures the spatial heterogeneity of the attributes, and it requires the discretization of input data. Many methods have been applied for discretization [82]. The natural breaks method depends on the principle of the “maximum and minimum distance between classes“ that can allow the original characteristics of the data to be kept [83]. This method has provided good results [43,52]. Accordingly, we applied natural breaks classification in order to classify the drivers. Sample points were generated in ArcGIS according to the 1 km grids over the entire study area. Therefore, the numbers of sample points in each city depended on the area of the city. The values of each driver and mean LST were extracted for the sample points. The natural breaks method was applied to classify all drivers (except LUCC, as it was already classified into cultivated land, woodland, grassland, water areas, construction, and unused land). For the GD metric, LST was the dependent variable, while the classified drivers were independent variables (Table 2).

4. Results

4.1. Spatial Distribution of LST

As seen in Figure 2, in 2005, higher daytime LSTs were mostly concentrated in the central area of the PRD, including the cities of Dongguan, Shenzhen, Guangzhou, Foshan, and Huizhou. By contrast, in 2015, higher daytime LSTs were concentrated in Dongguan, Shenzhen, Foshan, Zhongshan, Jiangmen, and Guangzhou. The daytime LSTs decreased in the cities located in the northern part of the PRD, including the cities of Zhaoqing, Guangzhou, and Huizhou. For the nighttime LST, the higher LSTs were also concentrated in the central area of the PRD in 2005. In 2015, the highest nighttime LSTs increased in the cities of Dongguan, Shenzhen, Foshan, Zhongshan, Jiangmen, and Guangzhou.

4.1.1. General Spatial Pattern of LST

The spatial pattern of the LST was estimated by using the Global Moran’s Index. The Global Moran’s Indexes for the daytime LST were 0.903 and 0.915 at the 99% significance level in 2005 and 2015, respectively. For nighttime LST, the Global Moran’s Indexes were 0.940 and 0.941 at the 99% significance level in 2005 and 2015, respectively. The results for the Moran’s Index indicate that the LST distribution was a clustered pattern—areas had aggregations of high and low temperatures—and there was less than a 1% likelihood that the results were random, which indicates the presence of HSAs in the study area.

4.1.2. Spatial Distribution of Hotspot Areas (HSAs)

Hotspot analysis was applied to identify the HSAs in the PRD. For each LST pixel, the hotspot analysis returned a z-score. We defined areas with z-scores ≥ 2.58 as HSAs according to [78] (Table 4). For the daytime LST, the HSAs pattern was consistent with the pattern of the high-temperature regions (Figure 2 and Figure 3).
Three patterns of HSAs in the PRD were observed—stable, reduced, and expanded—by comparing the HSAs maps for 2015 with those for 2005 (Figure 4). For the daytime LST, the stable HSAs distribution indicates that the HSAs tended to be clustered in the center of the PRD. The HSAs expanded towards the central and southwestern parts of the PRD. A considerable growth of HSAs was observed in Jiangmen compared with Huizhou and Zhaoqing. In contrast, the HSAs were significantly reduced in the northwest and northeast of the PRD.
For the nighttime LST, the stable HSAs were bigger and more continuously distributed than those in daytime. Most of the stable HSAs were located near the coast and the Pearl River estuary, including in Zhuhai, Zhongshan, Foshan, Guangzhou, Shenzhen, and Dongguan.

4.2. Hotspot Ratio Index in the Nine Cities

The HSAs were classified according to [79] (Table 5 and Figure 5). The values of the HRI varied across cities in the daytime (Figure 6). Low HRI values were observed in Zhaoqing, Jiangmen, Zhuhai, and Huizhou (Figure 6). The HRI values of Dongguan, Shenzhen, Foshan, and Zhongshan were higher than those of the other cities.
The HRI also varied across cities in the nighttime. The highest HRI values were recorded in Zhongshan and Zhuhai. The HRI values of Zhaoqing and Huizhou were minimal. The higher HRI values were recorded in Dongguan, Shenzhen, Zhongshan, Zhuhai, and Foshan cities. These results indicate that the spatial distribution of HSAs was highly heterogeneous among the cities in both daytime and nighttime.

4.3. Dominant Drivers of LST in the PRD

The factor detector quantifies the influence of each driver on the LST by calculating the q values (Table 6). The q value shows that driver X explains (100*q) % of the LST. The q values at the 95% significance level are shown in Table 6. The results show the differences in the influence of each driver on the LST in 2005 and 2015.
For the daytime LST, in 2005, elevation had the greatest influence on LST (50%), followed by the NDVI (40%). In 2015, the NLI was the dominant driver of LST, which indicated the increase in the influence of socio-economic drivers on daytime LST due to the continuous development of the urban agglomeration [84]. For the nighttime LST, in 2005, the NLI (45%) and POP (45%) had the greatest influence, followed by the NDVI (44%) (Table 6). In 2015, the NLI (50%) also had the greatest influence, followed by the NDVI (45%) (Table 6). The results indicate that the NLI and NDVI were important factors for the nighttime LST.
The explanation rate of the NLI for the daytime LST increased from 36% in 2005 to 58% in 2015, and the explanation of the NLI for the nighttime LST increased from 45% in 2005 to 50% in 2015, which indicated the important influence of the NLI factor on LST in the PRD.

4.4. Dominant Drivers of LST in the Nine Cities

4.4.1. Factor Detector Analysis

The results for the factor detector for each city are presented in Figure 7 and Figure 8, where a color-coding scheme was applied to facilitate the interpretation. Lower q values are shown in a lighter red color, while darker red colors indicate higher q values. There are two ways to explain these results. When read from left to right, the differences in the influences of all drivers in one city are clear. When reading from top to bottom, the differences across cities can be explained for each driver. The results show that the influence of the selected drivers on LST varied from city to city (Figure 7 and Figure 8).
For Huizhou, Zhaoqing, and Jiangmen, the elevation had the greatest influence on daytime LST, as there are many mountains and forests in these three cities. Similarly, in Guangzhou, the elevation also exhibited the highest influence rate (61%) in 2005. Socio-economic factors also showed great influences on nighttime LST in the above four cities (Figure 8).
For Dongguan and Shenzhen, the NDVI had the greatest influence on daytime LST in 2005, while in 2015 the NLI was the dominant driver. The NLI was the most influential factor for nighttime LST in Dongguan and Shenzhen in 2015, which indicated the importance of socio-economic development in these areas and its effect on LST. The NDVI also had the high explanation rate for nighttime LST in these two cities during the study period.
For Foshan and Zhongshan, the NLI was the dominant driver of daytime LST during the study period (Figure 7). The NDVI showed the greatest influence on nighttime LST in these two cities (Figure 8). The influences of the drivers on the nighttime LST in Guangzhou and Zhuhai are shown in Figure 8. None of the seven drivers had a significant influence on nighttime LST in Zhuhai, but all seven drivers had a strong influence on nighttime LST in Guangzhou.
The socio-economic drivers (GDP, POP, and NLI) were highly correlated with daytime LST in the central cities in the PRD, including Dongguan, Shenzhen, Guangzhou, Foshan, and Zhongshan (Figure 7). The socio-economic drivers had a low level of correlation with the daytime LST in Huizhou, Zhaoqing, and Jiangmen, where elevation was the dominant driver of daytime LST (Figure 7). Similarly, the land cover drivers, i.e., the LUCC, ISDD, and NDVI, were highly correlated with daytime LST in Dongguan, Shenzhen, Guangzhou, Foshan, and Zhongshan, while the correlation was weaker in Huizhou, Zhaoqing, and Jiangmen. Due to topographical issues, urbanization is concentrated in the central region of the PRD [37]. For the nighttime LST, the NDVI showed a strong influence in most of the cities during the study period (Figure 8).

4.4.2. Interaction Detector Analysis

In this study, the interaction detector was calculated for certain drivers: elevation, LUCC, NDVI, ISDD, GDP, POP, and NLI. Strong interactions were observed among all seven drivers (Figure 9, Figure 10, Figure 11 and Figure 12). The interactions between elevation and the other drivers were significantly strong in Huizhou, Jiangmen, Zhaoqing, and Guangzhou (Figure 9 and Figure 10). The greatest effects of the drivers’ interactions on daytime LST were Elevation ∩ NDVI (68%), Elevation ∩ LUCC (46%), Elevation ∩ GDP (68%), and Elevation ∩ NDVI (71%) in Huizhou, Jiangmen, Zhaoqing, and Guangzhou, respectively, in 2005. In 2015, the greatest effects of drivers’ interactions on daytime LST were Elevation ∩ NLI in Huizhou (69%), Jiangmen (57%), and Guangzhou (78%). The explanation rate of Elevation ∩ LUCC, Elevation ∩ ISDD, and Elevation ∩ POP for daytime LST in Zhaoqing was 63%, which illustrates that elevation had the greatest influence on daytime LST in this city.
The interactions between elevation and the socio-economic factors showed a high explanation rate for nighttime LST in Zhaoqing, Jiangmen, Huizhou, and Guangzhou (Figure 11 and Figure 12). The explanation rates of the interactions between elevation and the three socio-economic factors exceeded 30% (in Zhaoqing), 40% (in Jiangmen), 42% (in Huizhou), and 72% (in Guangzhou) in 2005. In 2015, the highest combined explanations of elevation and the socio-economic factors reached 39% (in Zhaoqing), 43% (in Jiangmen), 57% (in Huizhou), and 72% (in Guangzhou).
In Dongguan and Shenzhen, in 2005, the interactions between the NDVI and the three socio-economic factors exceeded 63% and 74%, respectively (Figure 9). In 2015, the greatest influence of the interactions on daytime LST in Dongguan and Shenzhen was from NLI ∩ LUCC (72%) and NLI ∩ NDVI (79%), respectively (Figure 10). The results of the interaction analysis for daytime LST in Dongguan and Shenzhen were consistent with the results of the factor detector analysis for daytime LST in these two cities. For the nighttime LST in Dongguan and Shenzhen, the predominant interactions between drivers were NDVI ∩ Elevation, NDVI ∩ NLI, NDVI ∩ POP, and NDVI ∩ GDP (Figure 11 and Figure 12). This result indicates the important influence of the NDVI and socio-economic factors on the nighttime LST in these two cities.
Similarly, the interactions between land cover and the socio-economic drivers were most predominant in Foshan, Zhongshan, and Zhuhai. NLI ∩ LUCC had the greatest influence on daytime LST in Foshan with 64% in 2005 and 63% in 2015. NLI ∩ NDVI had the greatest influence on daytime LST in Zhuhai with 43% in 2005 and 56% in 2015. The strongest interaction in Zhongshan was between the drivers NLI ∩ ISDD (65%) in 2005, and the interactions between NLI and the three land cover drivers explained 70% in 2015 (Figure 9 and Figure 10). For the nighttime LST in Foshan, Zhongshan, and Zhuhai, the interactions between the NDVI and socio-economic factors were predominant during the study period (Figure 11 and Figure 12).

5. Discussion

5.1. Spatial Patterns and Drivers of LST

This paper aimed to study the spatial distribution characteristics and main drivers of LST in the PRD urban agglomerations. The HSAs were mainly located on both sides of the Pearl River estuary. Our findings agree with those of [37]. The HSAs were mainly distributed in Shenzhen, Dongguan, Guangzhou, Foshan, Zhongshan, and Zhuhai, while there were fewer HSAs in Huizhou, Jiangmen, and Zhaoqing (Figure 4). The urbanization rates of the nine cities are as follows: Shenzhen > Guangzhou > Zhuhai > Dongguan > Foshan > Zhongshan > Huizhou > Jiangmen > Zhaoqing [85]. The HSAs results indicate that high temperatures are more likely to be observed in areas with high urbanization rates. There was a remarkable decrease in the daytime HSAs in the northern PRD (Figure 4). There are many mountains and forests in the northern PRD, where the environment has been improved significantly since 2006. A series of ecological projects have continuously promoted the increase in vegetation cover in these areas (http://gz.gov.cn, accessed on 15 September 2020), which decreased the LST in the northern PRD. This finding is consistent with the findings of [20]. There was a difference between the spatial distributions of daytime and nighttime HSAs. This could be explained by the impacts of impervious surfaces and human activities on the LST in areas with higher urbanization rates during the day, while the impact of water became significant at night due to its high thermal capacity and properties [10]. In other words, the differences between daytime and nighttime HSAs may be related to the different driving forces of daytime and nighttime LST [86].
The HRI was developed to quantitatively evaluate and rank the thermal environment of each city. The results for the HRI indicated that Dongguan and Shenzhen, which were characterized by high urbanization rates, were the most thermally cities in day and night (Figure 6). This can be explained by the fact that Dongguan is an industrial city, while Shenzhen has a big port with intensive traffic, as it is a coastal city, which increased the LSTs in both cities [66]. The daytime HRI index also increased more in Foshan and Zhongshan than in other cities (Figure 6), which can be due to the impervious surfaces, which obviously increased in these cities from 2005 to 2015 [37]. However, Zhaoqing, Jiangmen, and Huizhou, which were characterized by the lowest urbanization rates, showed the lowest HRI values. These findings can provide guidelines for the improvement of the thermal environment in urban agglomerations.
The drivers of LST were analyzed by applying the GD metric. All of the drivers showed significant influences on daytime and nighttime LST in the PRD. However, the main driving factors varied from city to city. Vegetation has a cooling effect through evapotranspiration and by shading other urban facets. Vegetation can absorb a large fraction of solar radiation and use a large fraction of it for evaporation and transpiration, thereby reducing sensible heat transfer to the boundary layer, i.e., reducing the temperatures of both the vegetation and urban air [19,38]. The shade from vegetation protects other urban surfaces from solar radiation and prevents increases in air and surface temperatures [87]. Our results showed that the NDVI had a strong correlation with daytime LST in Shenzhen and Guangzhou. Our results agree with those of [19,30]. The NDVI also showed a strong influence on nighttime LST in Dongguan, Shenzhen, Foshan, Zhongshan, and Guangzhou. This result is in agreement with the findings of [88].
Variations in LST due to elevation differences should be considered in LST studies in large areas where the terrain is not flat [89]. A negative correlation was observed between LST and elevation [90]. In our study, the elevation factor had a stronger influence on daytime LST in Huizhou, Zhaoqing, Jiangmen, Guangzhou, and Shenzhen. The elevation values of these five cities are higher than those of the other cities in the PRD (Figure 1 and Table 1). The high density of vegetation in the mountainous areas led to a great impact on temperature [91]. In addition, the low urbanization rates in Zhaoqing, Jiangmen, and Huizhou indicated the weak influences of the ISDD, GDP, POP, and NLI factors on daytime LST, which was in line with our results (Figure 7). LST is usually affected by multiple factors, and the higher correlation between the elevation factor and LST in these three cities may be the result of the weak influences of the other factors that were related to the urbanization rate on daytime LST. Similarly, the differences in correlation intensity between elevation and LST in 2005 and 2015 can also be partially explained by the variations in the influences of other factors on LST. The influence of elevation on nighttime LST in the PRD was lower than that on daytime LST in the PRD (Table 6, Figure 7 and Figure 8); this could be due to the location of the PRD. The influence of the ocean at night makes the driving mechanism of nighttime LST more complex. This finding is in agreement with those of [37].
In this study, POP had a significant influence on daytime LST in Dongguan, Shenzhen, Foshan, Zhongshan, and Guangzhou, which were characterized by high urbanization rates (Figure 7). However, a case study in the Yangtze River Delta urban agglomeration found that there was no significant correlation between the surface UHI intensity and population density [92]. The statistical population census data aggregated by the district were used in the study of the Yangtze River Delta, while gridded population data with a 1 km spatial resolution were used in our study, and these were consistent with the spatial resolution of the LST data used in our study. Population indirectly reflects the development of an area and the complexity of the urban surface. An increasing population leads to rapid transformation of natural land cover into impervious surfaces, such as buildings, streets, and other human-made features, which can reduce thermal admittance and increase the surface temperature through a modification of the energy balance [31]. In addition, a high population density can directly (by metabolic heating) or indirectly (by anthropogenic heat emissions) affect urban surface temperature.
In 2005, the socio-economic drivers explained most of the observed variations in daytime LST in Dongguan, Shenzhen, Guangzhou, Foshan, and Zhongshan, which were characterized by high urbanization rate. The daytime LST is affected by landscape changes and anthropogenic activities [9]. Socio-economic activities are usually associated with energy consumption, which increases anthropogenic heat and local surface temperature [93]. The change rates of the population and electricity consumption were positive in these cities (Table 1), which indicated the possible increase in the intensity of the population and socio-economic activities. The NLI represents the intensity of nighttime lighting, and it is an indicator of human density [86]. Anthropogenic heat emissions caused by human activities contribute to daytime LST increases. A low intensity of nighttime lighting is the result of agricultural activities, especially in underdeveloped areas with low urbanization rates. In addition, the brightest areas in nighttime light images could represent factories or industries, which also consume energy and generate heat emissions in the daytime, causing daytime surface temperature changes [94]. Consequently, it can be inferred that the greater influence of NLI on the daytime LST in Dongguan and Shenzhen cities was related to the high urbanization rates and industrialization characteristics of these two cities. Our results agree with those of [95]. The results for the drivers in these nine cities further revealed the mechanisms that drive the LST.

5.2. Management of Urban Agglomerations

The results of the HSAs and HRI showed that the spatial distribution of LST in the PRD urban agglomeration was highly heterogeneous among the nine cities in both daytime and nighttime. Therefore, it is recommended that more attention and resources be committed to improving the thermal environments of cities that are characterized by higher thermal stress in daytime, such as Dongguan, Shenzhen, Zhongshan, and Foshan. Human-made surfaces absorb solar radiation and lead to heat storage in urban areas [39]. As the urbanization is greater in Dongguan and Shenzhen compared to Huizhou, Jiangmen, and Zhaoqing, the thermal stress in daytime is higher in Dongguan and Shenzhen than in Huizhou, Jiangmen, and Zhaoqing. To reduce the thermal stress, the spatial expansion of urban areas should be controlled in these cities. On the other hand, increasing green vegetation areas is an effective way to mitigate the increasing LSTs in regions with high thermal stress. The significant reduction of HSAs in the northern part of the PRD is due to the implementation of greening measures by local governments [20]. Therefore, increasing the green areas may also be an effective way to alleviate the thermal stress in Shenzhen, Dongguan, Guangzhou, and Huizhou, as the NDVI explained over 40% of the variations in the daytime LST in these cities (Figure 7). In addition, the NDVI also showed a strong influence on nighttime LST in Dongguan, Shenzhen, Foshan, Zhongshan, and Guangzhou. The dominant drivers of daytime LST in the central cities of the PRD were the socio-economic ones in 2015, including in Dongguan, Shenzhen, Foshan, Zhongshan, Guangzhou, and Zhuhai. The HRI greatly increased in Dongguan, Shenzhen, Foshan, and Zhongshan, which could be due to the increased intensity of socio-economic activities. Therefore, it is suggested that the heat emissions caused by socio-economic activities should be considered in the urban planning in order to reduce the thermal stress in these cities. The results of this study can provide useful guidance for planners towards better management of the thermal environment.

5.3. Limitations and Future Work

This study provided a comprehensive framework for identifying the spatial distribution characteristics and main driving factors of the LST at different spatial scales in the PRD. There are still some limitations. First, this study analyzed the spatial patterns and the influencing factors of the LST for just two years: 2005 and 2015. Therefore, further studies are needed in order to address this aspect by applying the most recent multi-temporal remote sensing data in the future. Second, the annual scale was selected in this study, as it provided good results in many previous studies [31,37,96]. Seasonal changes also need to be studied in the future. Third, we considered five levels of LST classification, but more classification criteria need to be considered in future studies. Fourth, the combined effects of two drivers on the LST were measured in this study. However, the combined effects of multiple variables on the LST are important and need to be studied in future works. Finally, the spatial resolution of the remote sensing data must be improved by using higher-resolution remote sensing data in the future.

6. Conclusions

This study took the PRD urban agglomeration, a typical urban agglomeration in Southeast China, as a case study and focused on the spatial distribution and main driving factors of the LST in 2005 and 2015. A spatial autocorrelation analysis, hotspot analysis, and the HRI were used to quantitatively analyze the spatial distribution characteristics of the LST. Seven drivers of LST were studied, including physiographical, land cover, and socio-economic drivers. The GD metric was applied to explore the explanation rate of the driving factors for the LST. The main conclusions from this study can be summarized as follows:
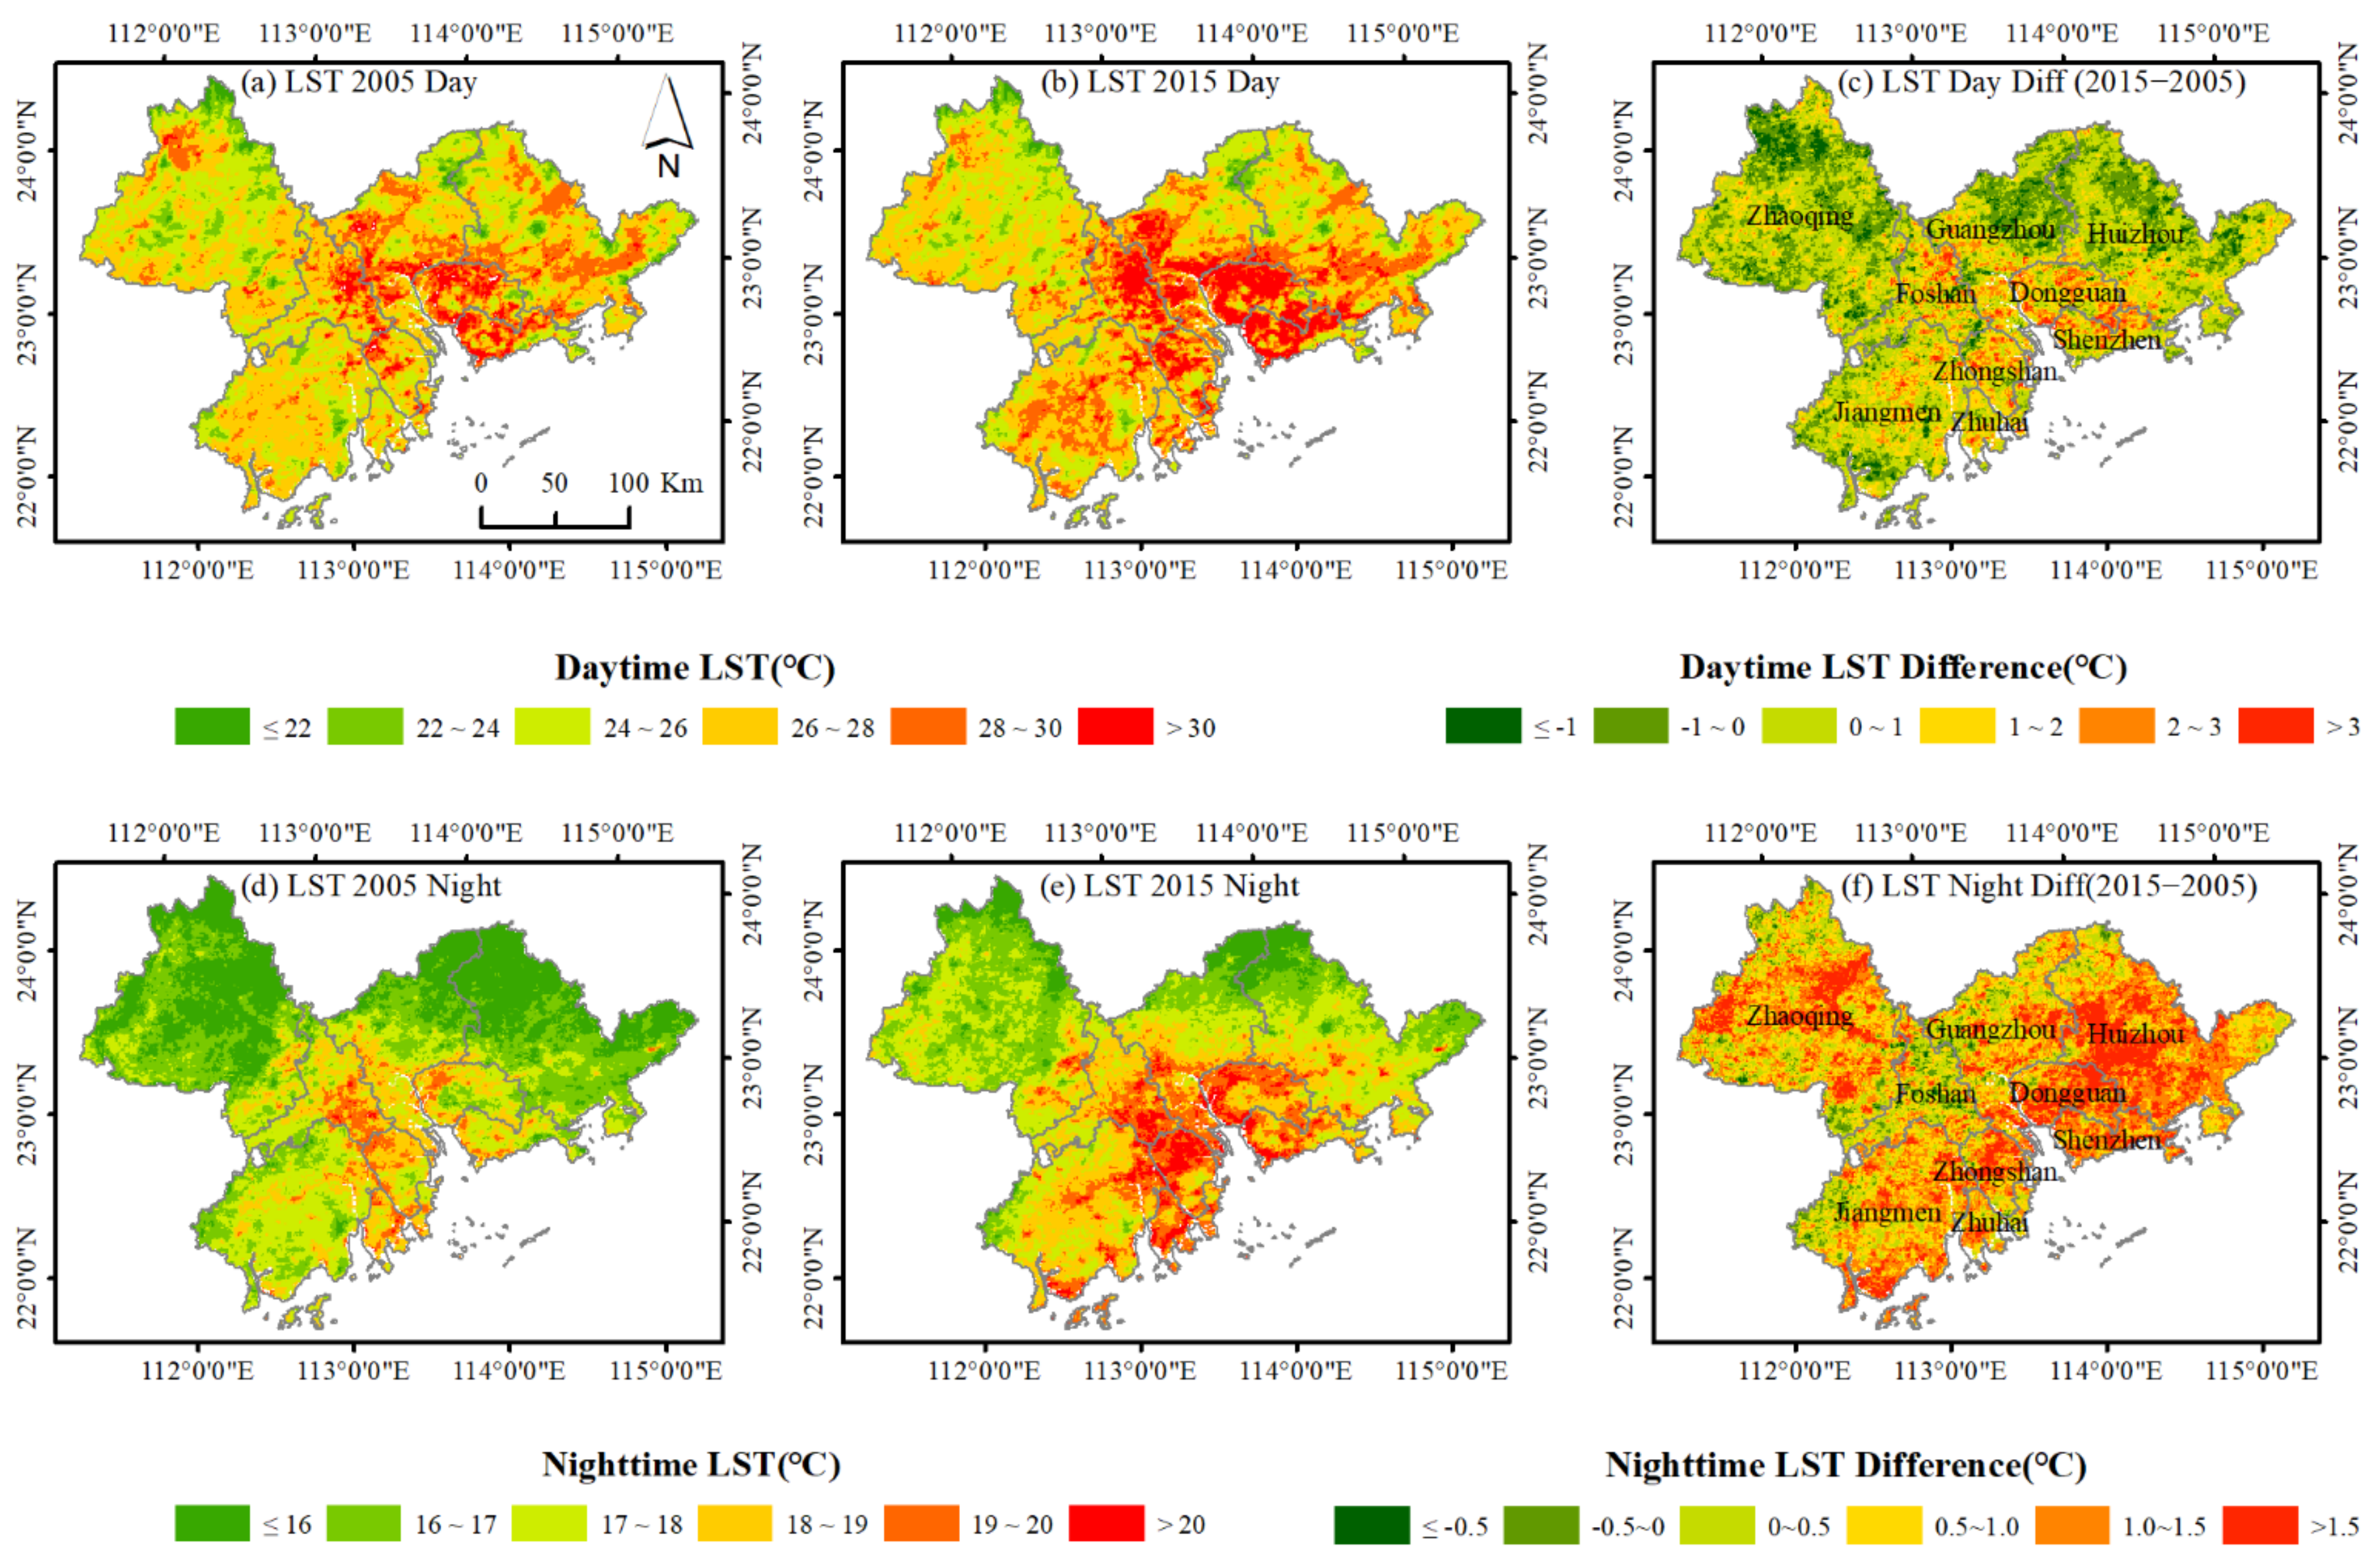
  • From 2005 to 2015, the daytime HSAs were concentrated towards the center of the PRD, while they decreased in the northern PRD. The stable daytime HSAs were concentrated and distributed on both sides of the Pearl River estuary.
  • The rankings of the HRI values of the nine cities showed that, during the study period, the highest daytime stress on the thermal environment among all cities was recorded in Dongguan and Shenzhen. The nighttime stress on the thermal environment recorded in Zhongshan, Zhuhai, Dongguan, and Shenzhen was higher than that in the other cities in 2015, while the lowest HRI values were observed in Zhaoqing, Jiangmen, and Huizhou, which were characterized by the lowest urbanization rates. This finding indicates that highly urbanized cities are more likely to experience severe thermal environments than cities with low urbanization rates.
  • The influence of land cover and socio-economic factors on daytime LST was higher in the relatively highly urbanized cities than in the cities with low urbanization rates. This finding indicates that human activities greatly contributed to the variations in LST in highly urbanized areas.
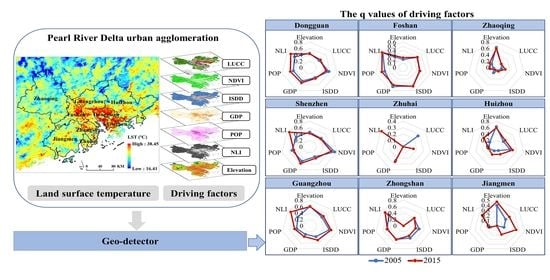
  • In 2015, the NLI factor exhibited the strongest influence on daytime LST in Shenzhen, Dongguan, Guangzhou, Foshan, Zhongshan, and Zhuhai. However, for the marginal cities of Zhaoqing, Jiangmen, and Huizhou, the influence of elevation was much higher than that of the other factors. This finding indicates that the influence of socio-economic activities on daytime LST was higher in highly urbanized areas, and even exceeded the influence of land cover. Controlling the anthropogenic heat released due to socio-economic activities is an important step in improving the thermal environment in highly urbanized areas with the development of urban agglomerations.
  • The NDVI showed an important influence on nighttime LST in most of the cities during the study period. Some factors had no significant effects on nighttime LST in some cities, suggesting that the driving mechanisms of nighttime LST are more complex than those of daytime LST.
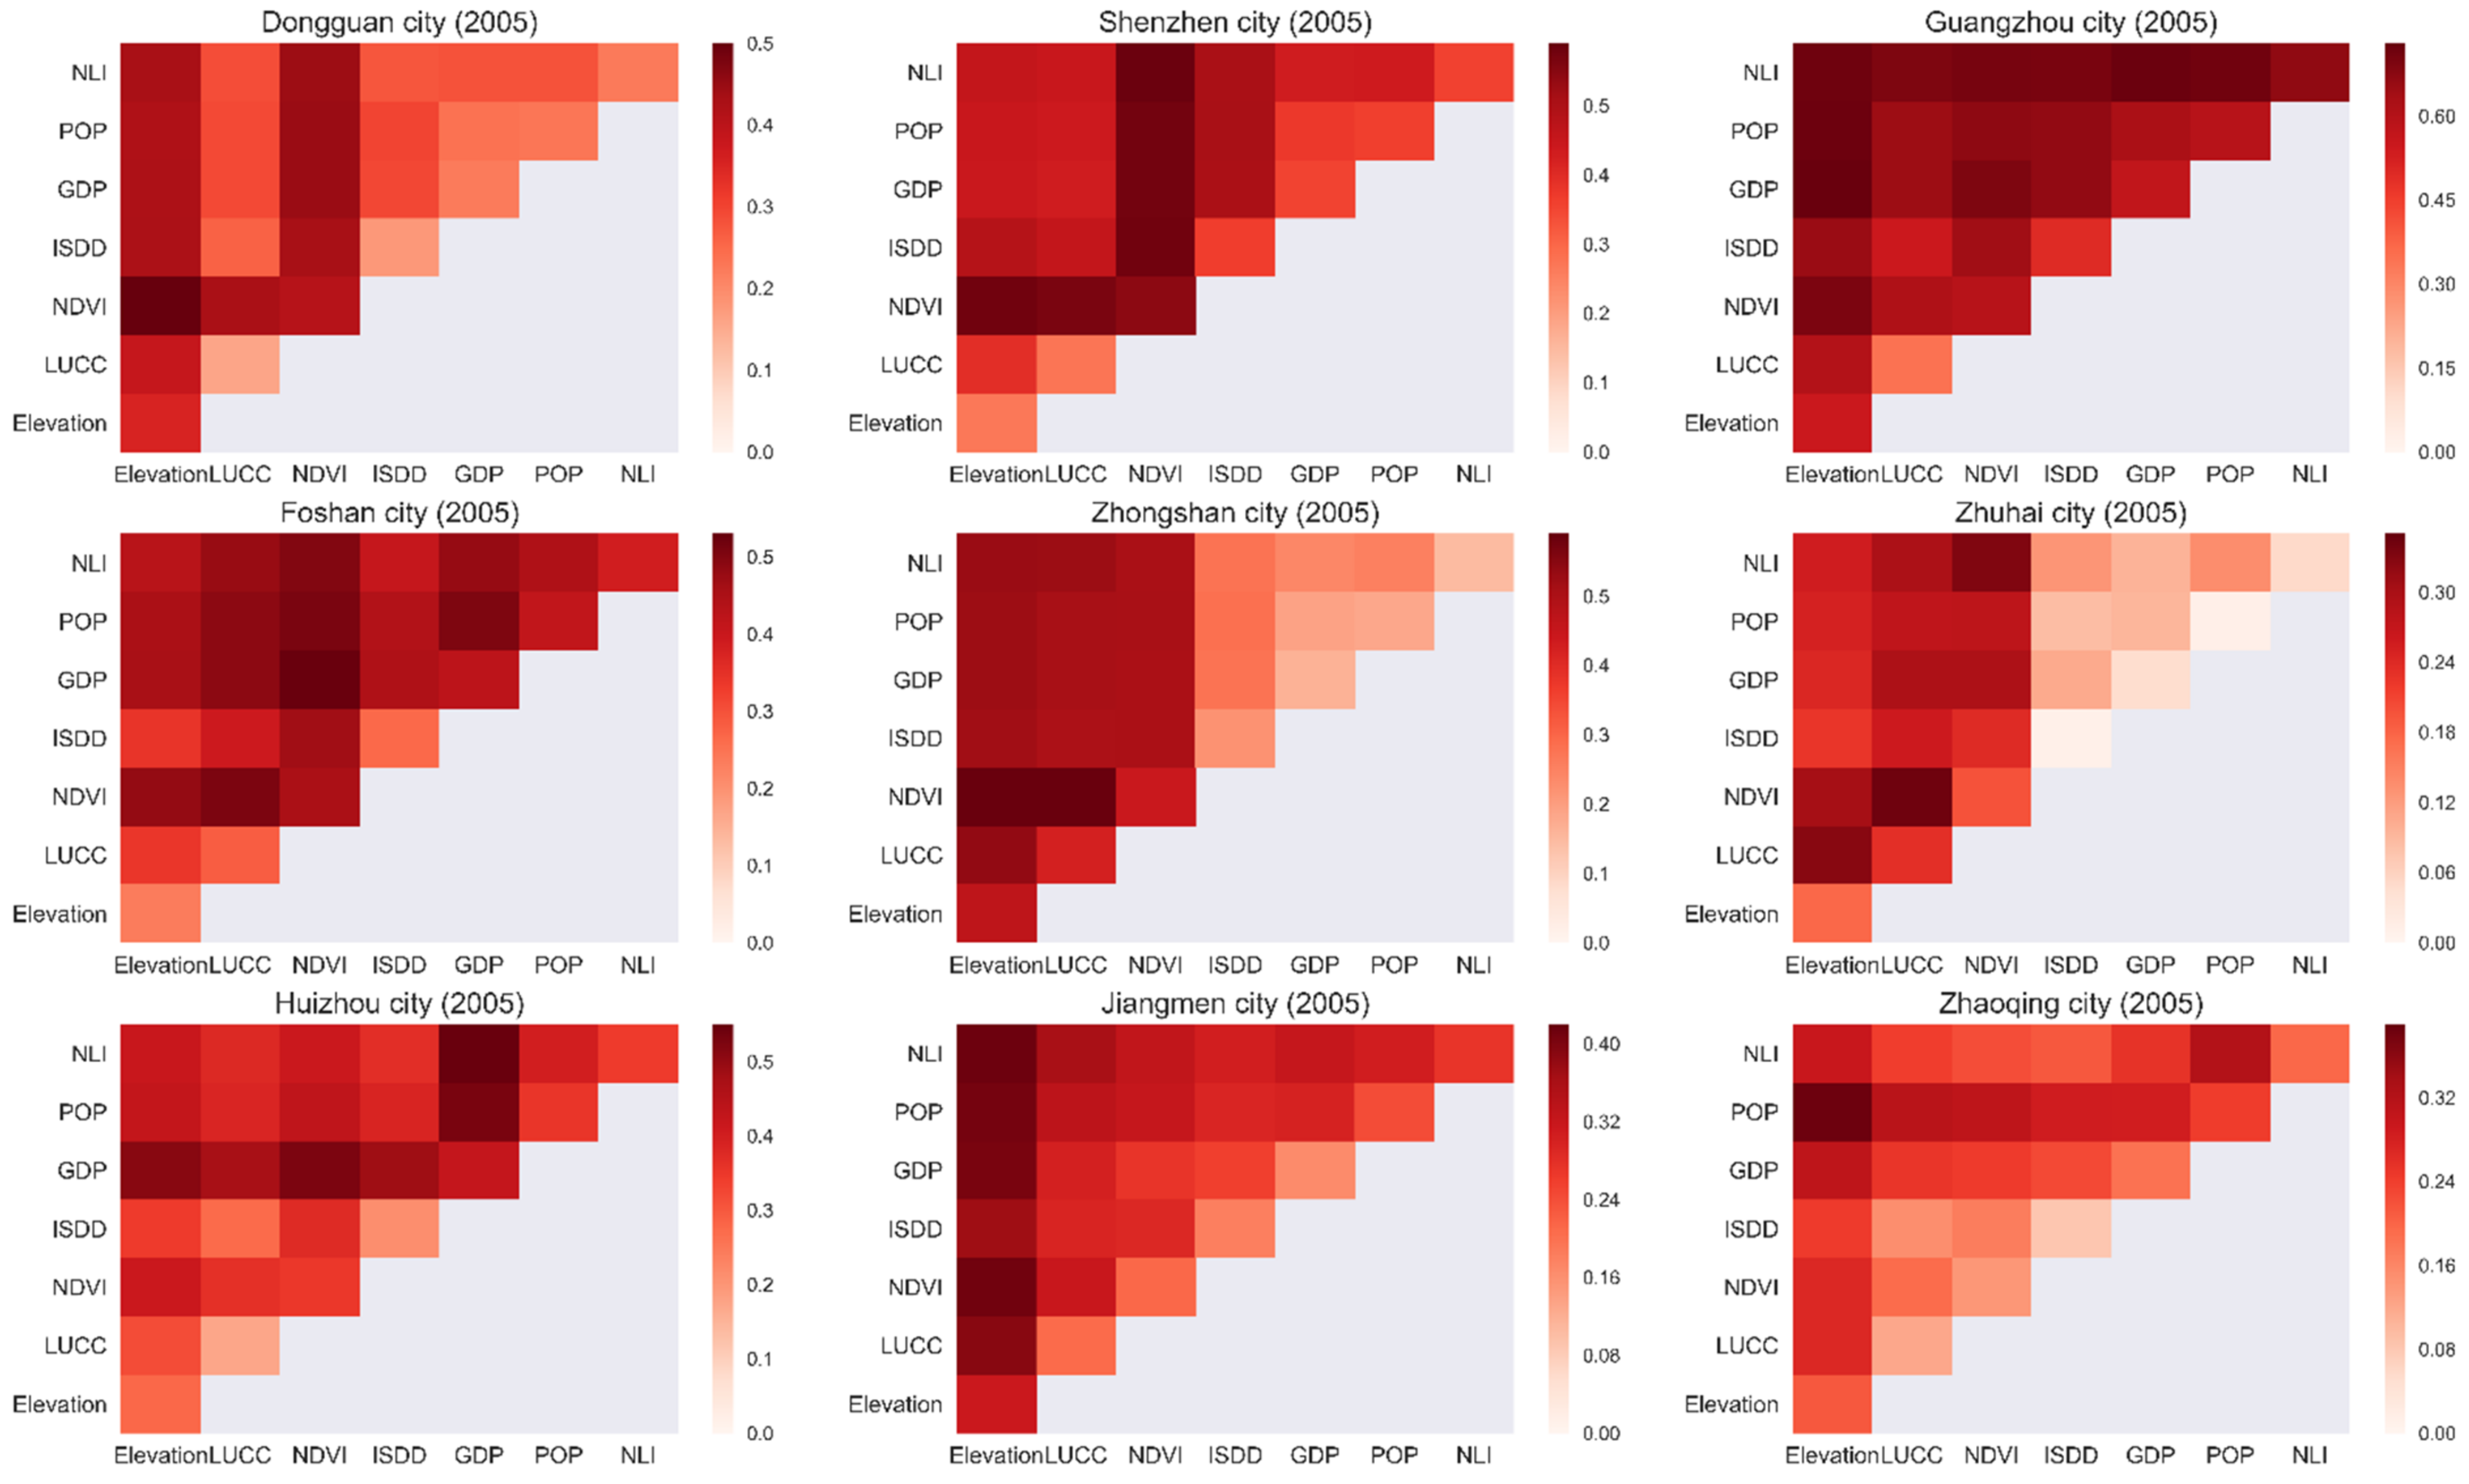
  • LST is the result of the combined effects of multiple factors. The combined effects of different factors on the LST are greater than the independent effects of single factors. The combined effects of different drivers are important in studies of the driving mechanisms of LST.
This study is expected to provide useful guidance for the optimization of the thermal environment in PRD urban agglomerations. In addition, the research framework used in this study can also be applied in other urban agglomerations. The results of this study revealed the complex mechanisms of the variability of the LST among the nine cities in the PRD urban agglomeration, and corresponding improvement measures have been recommended to help urban planners in better articulating urban agglomeration management strategies.

Author Contributions

Conceptualization, W.L. and Q.M.; methodology, W.L. and M.A.; software, data curation, writing-original draft, W.L.; writing—review, Q.M., L.Z., D.H. and M.M.; writing-review and editing, W.L, M.A. and M.M.; visualization, M.A. and D.H.; investigation, L.Z.; supervision, Q.M.; funding acquisition, Q.M. All authors have read and agreed to the published version of the manuscript.

Funding

This research was funded by Tsien Hsue-shen Urbanology Award of Hangzhou International Urbanology Research Center & Zhejiang Urban Governance Studies Center, grant number no.20QXS007; the Major Projects of High-resolution Earth Observation Systems of National Science and Technology, grant number 05-Y30B01-9001-19/20-1.

Institutional Review Board Statement

Not applicable.

Informed Consent Statement

Not applicable.

Data Availability Statement

The data presented in this study are available on request from the corresponding website.

Conflicts of Interest

The authors declare no conflict of interest. The funders had no role in the design of the study; in the collection, analyses, or interpretation of data; in the writing of the manuscript, or in the decision to publish the results.

Abbreviations

GDGeo-detector
GDPGross domestic product
HRIHotspot ratio index
HSAsHotspot areas
ISDDImpervious surface distribution density
LSTLand surface temperature
LUCCLand use/land cover
NDVINormalized difference vegetation index
NLINighttime light index
POPPopulation density
PRDPearl River Delta
UHIUrban heat island

References

  1. Oke, T.R. The energetic basis of the urban heat island. Q. J. R. Meteorol. Soc. 1982, 108, 1–24. [Google Scholar] [CrossRef]
  2. Tao, M.; Chen, L.; Wang, Z.; Wang, J.; Tao, J.; Wang, X. Did the widespread haze pollution over China increase during the last decade? A satellite view from space. Environ. Res. Lett. 2016, 11, 054019. [Google Scholar] [CrossRef]
  3. Curriero, F.C.; Heiner, K.S.; Samet, J.M.; Zeger, S.L.; Strug, L.; Patz, J.A. Temperature and mortality in 11 cities of the eastern United States. Am. J. Epidemiol. 2002, 155, 80–87. [Google Scholar] [CrossRef]
  4. Patz, J.A.; Campbell-Lendrum, D.; Holloway, T.; Foley, J.A. Impact of regional climate change on human health. Nature 2005, 438, 310–317. [Google Scholar] [CrossRef] [PubMed]
  5. Hwang, R.-L.; Lin, T.-P.; Lin, F.-Y. Evaluation and mapping of building overheating risk and air conditioning use due to the urban heat island effect. J. Build. Eng. 2020, 32, 101726. [Google Scholar] [CrossRef]
  6. Fang, C. Important progress and future direction of studies on China’s urban agglomerations. J. Geogr. Sci. 2015, 25, 1003–1024. [Google Scholar] [CrossRef] [Green Version]
  7. Fang, C.; Yu, D. Urban agglomeration: An evolving concept of an emerging phenomenon. Landsc. Urban Plan. 2017, 162, 126–136. [Google Scholar] [CrossRef]
  8. Li, W.; Han, C.; Li, W.; Zhou, W.; Han, L. Multi-scale effects of urban agglomeration on thermal environment: A case of the Yangtze River Delta Megaregion, China. Sci. Total Environ. 2020, 713, 136556. [Google Scholar] [CrossRef] [PubMed]
  9. Hu, D.; Meng, Q.; Zhang, L.; Zhang, Y. Spatial quantitative analysis of the potential driving factors of land surface temperature in different “Centers” of polycentric cities: A case study in Tianjin, China. Sci. Total Environ. 2020, 706, 135244. [Google Scholar] [CrossRef] [PubMed]
  10. Imhoff, M.L.; Zhang, P.; Wolfe, R.E.; Bounoua, L. Remote sensing of the urban heat island effect across biomes in the continental USA. Remote Sens. Environ. 2010, 114, 504–513. [Google Scholar] [CrossRef] [Green Version]
  11. Estoque, R.C.; Murayama, Y.; Myint, S.W. Effects of landscape composition and pattern on land surface temperature: An urban heat island study in the megacities of Southeast Asia. Sci. Total Environ. 2017, 577, 349–359. [Google Scholar] [CrossRef] [PubMed]
  12. Yao, R.; Wang, L.; Huang, X.; Niu, Z.; Liu, F.; Wang, Q. Temporal trends of surface urban heat islands and associated determinants in major Chinese cities. Sci. Total Environ. 2017, 609, 742–754. [Google Scholar] [CrossRef]
  13. Kedia, S.; Bhakare, S.P.; Dwivedi, A.K.; Islam, S.; Kaginalkar, A. Estimates of change in surface meteorology and urban heat island over northwest India: Impact of urbanization. Urban Clim. 2021, 36, 100782. [Google Scholar] [CrossRef]
  14. Sultana, S.; Satyanarayana, A. Assessment of urbanisation and urban heat island intensities using landsat imageries during 2000–2018 over a sub-tropical Indian City. Sustain. Cities Soc. 2020, 52, 101846. [Google Scholar] [CrossRef]
  15. El Kenawy, A.M.; Hereher, M.; Robaa, S.M.; McCabe, M.F.; Lopez-Moreno, J.I.; Domínguez-Castro, F.; Gaber, I.M.; Al-Awadhi, T.; Al-Buloshi, A.; Al Nasiri, N. Nocturnal Surface Urban Heat Island over Greater Cairo: Spatial Morphology, Temporal Trends and Links to Land-Atmosphere Influences. Remote Sens. 2020, 12, 3889. [Google Scholar] [CrossRef]
  16. Mohammad, P.; Goswami, A.; Bonafoni, S. The impact of the land cover dynamics on surface urban heat island variations in semi-arid cities: A case study in Ahmedabad City, India, using multi-sensor/source data. Sensors 2019, 19, 3701. [Google Scholar] [CrossRef] [Green Version]
  17. Haashemi, S.; Weng, Q.; Darvishi, A.; Alavipanah, S.K. Seasonal variations of the surface urban heat island in a semi-arid city. Remote Sens. 2016, 8, 352. [Google Scholar] [CrossRef] [Green Version]
  18. Liu, X.; Tian, G.; Feng, J.; Ma, B.; Wang, J.; Kong, L. Modeling the warming impact of urban land expansion on hot weather using the weather research and forecasting model: A case study of Beijing, China. Adv. Atmos. Sci. 2018, 35, 723–736. [Google Scholar] [CrossRef]
  19. Guo, G.; Wu, Z.; Chen, Y. Complex mechanisms linking land surface temperature to greenspace spatial patterns: Evidence from four southeastern Chinese cities. Sci. Total Environ. 2019, 674, 77–87. [Google Scholar] [CrossRef]
  20. Yu, Z.; Yao, Y.; Yang, G.; Wang, X.; Vejre, H. Spatiotemporal patterns and characteristics of remotely sensed region heat islands during the rapid urbanization (1995–2015) of Southern China. Sci. Total Environ. 2019, 674, 242–254. [Google Scholar] [CrossRef]
  21. Chen, X.-L.; Zhao, H.-M.; Li, P.-X.; Yin, Z.-Y. Remote sensing image-based analysis of the relationship between urban heat island and land use/cover changes. Remote Sens. Environ. 2006, 104, 133–146. [Google Scholar] [CrossRef]
  22. Yao, L.; Li, T.; Xu, M.; Xu, Y. How the landscape features of urban green space impact seasonal land surface temperatures at a city-block-scale: An urban heat island study in Beijing, China. Urban For. Urban Green. 2020, 52, 126704. [Google Scholar] [CrossRef]
  23. Dwivedi, A.; Mohan, B.K. Impact of green roof on micro climate to reduce Urban Heat Island. Remote Sens. Appl. Soc. Environ. 2018, 10, 56–69. [Google Scholar] [CrossRef]
  24. Singh, P.; Kikon, N.; Verma, P. Impact of land use change and urbanization on urban heat island in Lucknow city, Central India. A remote sensing based estimate. Sustain. Cities Soc. 2017, 32, 100–114. [Google Scholar] [CrossRef]
  25. Dai, Z.; Guldmann, J.-M.; Hu, Y. Spatial regression models of park and land-use impacts on the urban heat island in central Beijing. Sci. Total Environ. 2018, 626, 1136–1147. [Google Scholar] [CrossRef] [PubMed]
  26. Morabito, M.; Crisci, A.; Guerri, G.; Messeri, A.; Congedo, L.; Munafò, M. Surface urban heat islands in Italian metropolitan cities: Tree cover and impervious surface influences. Sci. Total Environ. 2021, 751, 142334. [Google Scholar] [CrossRef] [PubMed]
  27. Meng, Q.; Zhang, L.; Sun, Z.; Meng, F.; Wang, L.; Sun, Y. Characterizing spatial and temporal trends of surface urban heat island effect in an urban main built-up area: A 12-year case study in Beijing, China. Remote Sens. Environ. 2018, 204, 826–837. [Google Scholar] [CrossRef]
  28. Yuan, F.; Bauer, M.E. Comparison of impervious surface area and normalized difference vegetation index as indicators of surface urban heat island effects in Landsat imagery. Remote Sens. Environ. 2007, 106, 375–386. [Google Scholar] [CrossRef]
  29. Li, Y.; Sun, Y.; Li, J.; Gao, C. Socioeconomic drivers of urban heat island effect: Empirical evidence from major Chinese cities. Sustain. Cities Soc. 2020, 63, 102425. [Google Scholar] [CrossRef]
  30. Peng, J.; Jia, J.; Liu, Y.; Li, H.; Wu, J. Seasonal contrast of the dominant factors for spatial distribution of land surface temperature in urban areas. Remote Sens. Environ. 2018, 215, 255–267. [Google Scholar] [CrossRef]
  31. Dewan, A.; Kiselev, G.; Botje, D.; Mahmud, G.I.; Bhuian, M.H.; Hassan, Q.K. Surface urban heat island intensity in five major cities of Bangladesh: Patterns, drivers and trends. Sustain. Cities Soc. 2021, 71, 102926. [Google Scholar] [CrossRef]
  32. Portela, C.I.; Massi, K.G.; Rodrigues, T.; Alcântara, E. Impact of urban and industrial features on land surface temperature: Evidences from satellite thermal indices. Sustain. Cities Soc. 2020, 56, 102100. [Google Scholar] [CrossRef]
  33. Lo, C. Modeling the population of China using DMSP operational linescan system nighttime data. Photogramm. Eng. Remote Sens. 2001, 67, 1037–1047. [Google Scholar]
  34. Chand, T.K.; Badarinath, K.; Elvidge, C.; Tuttle, B. Spatial characterization of electrical power consumption patterns over India using temporal DMSP-OLS night-time satellite data. Int. J. Remote Sens. 2009, 30, 647–661. [Google Scholar] [CrossRef]
  35. Yu, B.; Tang, M.; Wu, Q.; Yang, C.; Deng, S.; Shi, K.; Peng, C.; Wu, J.; Chen, Z. Urban built-up area extraction from log-transformed NPP-VIIRS nighttime light composite data. IEEE Geosci. Remote Sens. Lett. 2018, 15, 1279–1283. [Google Scholar] [CrossRef]
  36. Bennett, M.M.; Smith, L.C. Advances in using multitemporal night-time lights satellite imagery to detect, estimate, and monitor socioeconomic dynamics. Remote Sens. Environ. 2017, 192, 176–197. [Google Scholar] [CrossRef]
  37. Ma, Y.; Zhang, S.; Yang, K.; Li, M. Influence of spatiotemporal pattern changes of impervious surface of urban megaregion on thermal environment: A case study of the Guangdong–Hong Kong–Macao Greater Bay Area of China. Ecol. Indic. 2021, 121, 107106. [Google Scholar] [CrossRef]
  38. Mathew, A.; Khandelwal, S.; Kaul, N. Investigating spatial and seasonal variations of urban heat island effect over Jaipur city and its relationship with vegetation, urbanization and elevation parameters. Sustain. Cities Soc. 2017, 35, 157–177. [Google Scholar] [CrossRef]
  39. Huang, X.; Wang, Y. Investigating the effects of 3D urban morphology on the surface urban heat island effect in urban functional zones by using high-resolution remote sensing data: A case study of Wuhan, Central China. ISPRS J. Photogramm. Remote Sens. 2019, 152, 119–131. [Google Scholar] [CrossRef]
  40. Zhou, D.; Bonafoni, S.; Zhang, L.; Wang, R. Remote sensing of the urban heat island effect in a highly populated urban agglomeration area in East China. Sci. Total Environ. 2018, 628, 415–429. [Google Scholar] [CrossRef]
  41. Cui, C.; Wang, B.; Ren, H.; Wang, Z. Spatiotemporal variations in gastric cancer mortality and their relations to influencing factors in S County, China. Int. J. Environ. Res. Public Health 2019, 16, 784. [Google Scholar] [CrossRef] [Green Version]
  42. Wang, J.F.; Li, X.H.; Christakos, G.; Liao, Y.L.; Zhang, T.; Gu, X.; Zheng, X.Y. Geographical detectors-based health risk assessment and its application in the neural tube defects study of the Heshun Region, China. Int. J. Geogr. Inf. Sci. 2010, 24, 107–127. [Google Scholar] [CrossRef]
  43. Ding, Y.; Zhang, M.; Qian, X.; Li, C.; Chen, S.; Wang, W. Using the geographical detector technique to explore the impact of socioeconomic factors on PM2. 5 concentrations in China. J. Clean. Prod. 2019, 211, 1480–1490. [Google Scholar] [CrossRef]
  44. Zhou, C.; Chen, J.; Wang, S. Examining the effects of socioeconomic development on fine particulate matter (PM2. 5) in China’s cities using spatial regression and the geographical detector technique. Sci. Total Environ. 2018, 619, 436–445. [Google Scholar] [CrossRef]
  45. Zhao, R.; Zhan, L.; Yao, M.; Yang, L. A geographically weighted regression model augmented by Geodetector analysis and principal component analysis for the spatial distribution of PM2. 5. Sustain. Cities Soc. 2020, 56, 102106. [Google Scholar] [CrossRef]
  46. Liao, Y.; Zhang, Y.; He, L.; Wang, J.; Liu, X.; Zhang, N.; Xu, B. Temporal and spatial analysis of neural tube defects and detection of geographical factors in Shanxi Province, China. PLoS ONE 2016, 11, e0150332. [Google Scholar]
  47. Huang, J.; Wang, J.; Bo, Y.; Xu, C.; Hu, M.; Huang, D. Identification of health risks of hand, foot and mouth disease in China using the geographical detector technique. Int. J. Environ. Res. Public Health 2014, 11, 3407–3423. [Google Scholar] [CrossRef] [PubMed]
  48. Ren, Y.; Deng, L.; Zuo, S.; Luo, Y.; Shao, G.; Wei, X.; Hua, L.; Yang, Y. Geographical modeling of spatial interaction between human activity and forest connectivity in an urban landscape of southeast China. Landsc. Ecol. 2014, 29, 1741–1758. [Google Scholar] [CrossRef]
  49. Ju, H.; Zhang, Z.; Zuo, L.; Wang, J.; Zhang, S.; Wang, X.; Zhao, X. Driving forces and their interactions of built-up land expansion based on the geographical detector–a case study of Beijing, China. Int. J. Geogr. Inf. Sci. 2016, 30, 2188–2207. [Google Scholar] [CrossRef]
  50. Ding, Y.; Cai, J.; Ren, Z.; Yang, Z. Spatial disparities of economic growth rate of China’s National-level ETDZs and their determinants based on geographical detector analysis. Prog. Geogr. 2014, 33, 657–666. [Google Scholar]
  51. Wang, Y.; Wang, S.; Li, G.; Zhang, H.; Jin, L.; Su, Y.; Wu, K. Identifying the determinants of housing prices in China using spatial regression and the geographical detector technique. Appl. Geogr. 2017, 79, 26–36. [Google Scholar] [CrossRef]
  52. Ren, Y.; Deng, L.-Y.; Zuo, S.-D.; Song, X.-D.; Liao, Y.-L.; Xu, C.-D.; Chen, Q.; Hua, L.-Z.; Li, Z.-W. Quantifying the influences of various ecological factors on land surface temperature of urban forests. Environ. Pollut. 2016, 216, 519–529. [Google Scholar] [CrossRef] [Green Version]
  53. Bank, W. East Asia’s Changing Urban Landscape: Measuring a Decade of Spatial Growth; The World Bank: Washington, DC, USA, 2015. [Google Scholar]
  54. Zhang, L.; Weng, Q. Annual dynamics of impervious surface in the Pearl River Delta, China, from 1988 to 2013, using time series Landsat imagery. ISPRS J. Photogramm. Remote Sens. 2016, 113, 86–96. [Google Scholar] [CrossRef]
  55. Liu, B.; Peng, S.; Liao, Y.; Long, W. The causes and impacts of water resources crises in the Pearl River Delta. J. Clean. Prod. 2018, 177, 413–425. [Google Scholar] [CrossRef]
  56. Chan, F.K.S.; Yang, L.E.; Scheffran, J.; Mitchell, G.; Adekola, O.; Griffiths, J.; Chen, Y.; Li, G.; Lu, X.; Qi, Y. Urban flood risks and emerging challenges in a Chinese delta: The case of the Pearl River Delta. Environ. Sci. Policy 2021, 122, 101–115. [Google Scholar] [CrossRef]
  57. Hou, H.; Liu, K.; Li, X.; Chen, S.; Wang, W.; Rong, K. Assessing the urban heat island variations and its influencing mechanism in metropolitan areas of Pearl River Delta, South China. Phys. Chem. Earth Parts A/B/C 2020, 120, 102953. [Google Scholar] [CrossRef]
  58. Wu, Z.; Zhang, Y.; Zhang, L.; Huang, M.; Zhong, L.; Chen, D.; Wang, X. Trends of outdoor air pollution and the impact on premature mortality in the Pearl River Delta region of southern China during 2006–2015. Sci. Total Environ. 2019, 690, 248–260. [Google Scholar] [CrossRef]
  59. Hu, M.; Wang, Y.; Xia, B.; Huang, G. Surface temperature variations and their relationships with land cover in the Pearl River Delta. Environ. Sci. Pollut. Res. 2020, 27, 37614–37625. [Google Scholar] [CrossRef]
  60. Nichol, J.E.; Choi, S.Y.; Wong, M.S.; Abbas, S. Temperature change and urbanisation in a multi-nucleated megacity: China’s Pearl River Delta. Urban Clim. 2020, 31, 100592. [Google Scholar] [CrossRef]
  61. Wang, R.; Cai, M.; Ren, C.; Bechtel, B.; Xu, Y.; Ng, E. Detecting multi-temporal land cover change and land surface temperature in Pearl River Delta by adopting local climate zone. Urban Clim. 2019, 28, 100455. [Google Scholar] [CrossRef]
  62. Zhang, Q.; Wu, Z.; Yu, H.; Zhu, X.; Shen, Z. Variable Urbanization Warming Effects across Metropolitans of China and Relevant Driving Factors. Remote Sens. 2020, 12, 1500. [Google Scholar] [CrossRef]
  63. Chen, Y.; Yu, S. Impacts of urban landscape patterns on urban thermal variations in Guangzhou, China. Int. J. Appl. Earth Obs. Geoinf. 2017, 54, 65–71. [Google Scholar] [CrossRef]
  64. Cao, Z.; Wu, Z.; Liu, L.; Chen, Y.; Zou, Y. Assessing the relationship between anthropogenic heat release warming and building characteristics in Guangzhou: A sustainable development perspective. Sci. Total Environ. 2019, 695, 133759. [Google Scholar] [CrossRef]
  65. Wang, W.; Liu, K.; Tang, R.; Wang, S. Remote sensing image-based analysis of the urban heat island effect in Shenzhen, China. Phys. Chem. Earth Parts A/B/C 2019, 110, 168–175. [Google Scholar] [CrossRef]
  66. Li, W.; Cao, Q.; Lang, K.; Wu, J. Linking potential heat source and sink to urban heat island: Heterogeneous effects of landscape pattern on land surface temperature. Sci. Total Environ. 2017, 586, 457–465. [Google Scholar] [CrossRef] [PubMed]
  67. Wei, C.; Taubenböck, H.; Blaschke, T. Measuring urban agglomeration using a city-scale dasymetric population map: A study in the Pearl River Delta, China. Habitat Int. 2017, 59, 32–43. [Google Scholar] [CrossRef] [Green Version]
  68. Wan, Z. New refinements and validation of the collection-6 MODIS land-surface temperature/emissivity product. Remote Sens. Environ. 2014, 140, 36–45. [Google Scholar] [CrossRef]
  69. Wang, C.; Li, Y.; Myint, S.W.; Zhao, Q.; Wentz, E.A. Impacts of spatial clustering of urban land cover on land surface temperature across Köppen climate zones in the contiguous United States. Landsc. Urban Plan. 2019, 192, 103668. [Google Scholar] [CrossRef]
  70. Shen, H.; Huang, L.; Zhang, L.; Wu, P.; Zeng, C. Long-term and fine-scale satellite monitoring of the urban heat island effect by the fusion of multi-temporal and multi-sensor remote sensed data: A 26-year case study of the city of Wuhan in China. Remote Sens. Environ. 2016, 172, 109–125. [Google Scholar] [CrossRef]
  71. Quan, J.; Chen, Y.; Zhan, W.; Wang, J.; Voogt, J.; Wang, M. Multi-temporal trajectory of the urban heat island centroid in Beijing, China based on a Gaussian volume model. Remote Sens. Environ. 2014, 149, 33–46. [Google Scholar] [CrossRef]
  72. Streutker, D.R. Satellite-measured growth of the urban heat island of Houston, Texas. Remote Sens. Environ. 2003, 85, 282–289. [Google Scholar] [CrossRef]
  73. Yang, Q.; Huang, X.; Tang, Q. The footprint of urban heat island effect in 302 Chinese cities: Temporal trends and associated factors. Sci. Total Environ. 2019, 655, 652–662. [Google Scholar] [CrossRef] [PubMed]
  74. Peng, J.; Hu, Y.; Dong, J.; Liu, Q.; Liu, Y. Quantifying spatial morphology and connectivity of urban heat islands in a megacity: A radius approach. Sci. Total Environ. 2020, 714, 136792. [Google Scholar] [CrossRef] [PubMed]
  75. Qiao, Z.; Wu, C.; Zhao, D.; Xu, X.; Yang, J.; Feng, L.; Sun, Z.; Liu, L. Determining the boundary and probability of surface urban heat island footprint based on a logistic model. Remote Sens. 2019, 11, 1368. [Google Scholar] [CrossRef] [Green Version]
  76. Feyisa, G.L.; Meilby, H.; Jenerette, G.D.; Pauliet, S. Locally optimized separability enhancement indices for urban land cover mapping: Exploring thermal environmental consequences of rapid urbanization in Addis Ababa, Ethiopia. Remote Sens. Environ. 2016, 175, 14–31. [Google Scholar] [CrossRef]
  77. Ord, J.K.; Getis, A. Local spatial autocorrelation statistics: Distributional issues and an application. Geogr. Anal. 1995, 27, 286–306. [Google Scholar] [CrossRef]
  78. Songchitruksa, P.; Zeng, X. Getis–Ord spatial statistics to identify hot spots by using incident management data. Transp. Res. Rec. 2010, 2165, 42–51. [Google Scholar] [CrossRef]
  79. Shirani-Bidabadi, N.; Nasrabadi, T.; Faryadi, S.; Larijani, A.; Roodposhti, M.S. Evaluating the spatial distribution and the intensity of urban heat island using remote sensing, case study of Isfahan city in Iran. Sustain. Cities Soc. 2019, 45, 686–692. [Google Scholar] [CrossRef]
  80. Xu, H.-Q.; Chen, B.-Q. Remote sensing of the urban heat island and its changes in Xiamen City of SE China. J. Environ. Sci. 2004, 16, 276–281. [Google Scholar]
  81. Qiao, Z.; Tian, G.; Zhang, L.; Xu, X. Influences of urban expansion on urban heat island in Beijing during 1989–2010. Adv. Meteorol. 2014, 2014, 187169. [Google Scholar] [CrossRef] [Green Version]
  82. Cao, F.; Ge, Y.; Wang, J.-F. Optimal discretization for geographical detectors-based risk assessment. GISci. Remote Sens. 2013, 50, 78–92. [Google Scholar] [CrossRef]
  83. De Smith, M.J.; Goodchild, M.F.; Longley, P. Geospatial Analysis: A Comprehensive Guide to Principles, Techniques and Software Tools; Troubador Publishing Ltd: Kibworth Harcourt, UK, 2007. [Google Scholar]
  84. Chen, W.; Zhang, Y.; Pengwang, C.; Gao, W. Evaluation of urbanization dynamics and its impacts on surface heat islands: A case study of Beijing, China. Remote Sens. 2017, 9, 453. [Google Scholar] [CrossRef] [Green Version]
  85. Li, H.; Xu, E.; Zhang, H. Examining the coupling relationship between urbanization and natural disasters: A case study of the Pearl River Delta, China. Int. J. Disaster Risk Reduct. 2021, 55, 102057. [Google Scholar] [CrossRef]
  86. Peng, S.; Piao, S.; Ciais, P.; Friedlingstein, P.; Ottle, C.; Bréon, F.o.-M.; Nan, H.; Zhou, L.; Myneni, R.B. Surface urban heat island across 419 global big cities. Environ. Sci. Technol. 2012, 46, 696–703. [Google Scholar] [CrossRef] [PubMed]
  87. Aram, F.; García, E.H.; Solgi, E.; Mansournia, S. Urban green space cooling effect in cities. Heliyon 2019, 5, e01339. [Google Scholar] [CrossRef] [Green Version]
  88. Logan, T.; Zaitchik, B.; Guikema, S.; Nisbet, A. Night and day: The influence and relative importance of urban characteristics on remotely sensed land surface temperature. Remote Sens. Environ. 2020, 247, 111861. [Google Scholar] [CrossRef]
  89. Khandelwal, S.; Goyal, R.; Kaul, N.; Mathew, A. Assessment of land surface temperature variation due to change in elevation of area surrounding Jaipur, India. Egypt. J. Remote Sens. Space Sci. 2018, 21, 87–94. [Google Scholar] [CrossRef]
  90. Goyal, R.; Khandelwal, S.; Kaul, N. Analysis of relative importance of parameters representing vegetation, urbanization and elevation with land surface temperature using ANN. In Proceedings of the Geospatial World Forum Hyderabad, Hyderabad, India, 18–21 January 2011. [Google Scholar]
  91. Mathew, A.; Khandelwal, S.; Kaul, N. Spatial and temporal variations of urban heat island effect and the effect of percentage impervious surface area and elevation on land surface temperature: Study of Chandigarh city, India. Sustain. Cities Soc. 2016, 26, 264–277. [Google Scholar] [CrossRef]
  92. Du, H.; Wang, D.; Wang, Y.; Zhao, X.; Qin, F.; Jiang, H.; Cai, Y. Influences of land cover types, meteorological conditions, anthropogenic heat and urban area on surface urban heat island in the Yangtze River Delta Urban Agglomeration. Sci. Total Environ. 2016, 571, 461–470. [Google Scholar] [CrossRef]
  93. McCarthy, M.P.; Best, M.J.; Betts, R.A. Climate change in cities due to global warming and urban effects. Geophys. Res. Lett. 2010, 37, L09705. [Google Scholar] [CrossRef] [Green Version]
  94. Tripathy, B.R.; Sajjad, H.; Elvidge, C.D.; Ting, Y.; Pandey, P.C.; Rani, M.; Kumar, P. Modeling of electric demand for sustainable energy and management in India using spatio-temporal DMSP-OLS night-time data. Environ. Manag. 2018, 61, 615–623. [Google Scholar] [CrossRef] [PubMed]
  95. Li, J.; Wang, F.; Fu, Y.; Guo, B.; Zhao, Y.; Yu, H. A Novel SUHI Referenced Estimation Method for Multicenters Urban Agglomeration using DMSP/OLS Nighttime Light Data. IEEE J. Sel. Top. Appl. Earth Obs. Remote Sens. 2020, 13, 1416–1425. [Google Scholar] [CrossRef]
  96. Liu, H.; Huang, B.; Zhan, Q.; Gao, S.; Li, R.; Fan, Z. The influence of urban form on surface urban heat island and its planning implications: Evidence from 1288 urban clusters in China. Sustain. Cities Soc. 2021, 71, 102987. [Google Scholar] [CrossRef]
Figure 1. Maps of the Pearl River Delta (PRD) urban agglomeration: (a) map of Guangdong province, China; (b) PRD urban agglomerations, including nine cities; (c) elevation map of the PRD.
Remotesensing 13 02858 g001
Figure 2. Daytime and nighttime land surface temperature (LST) maps of the PRD:(a) daytime LST in 2005; (b) daytime LST in 2015; (c) daytime LST difference between 2005 and 2015; (d) nighttime LST in 2005; (e) nighttime LST in 2015; (f) nighttime LST difference between 2005 and 2015.
Remotesensing 13 02858 g002
Figure 3. Hot-/cold-spot distributions in the PRD: (a) hot-/cold-spots for daytime LST in 2005; (b) hot-/cold-spots for daytime LST in 2015; (c) hot-/cold-spots for nighttime LST in 2005; (d) hot-/cold-spots for nighttime LST in 2015.
Remotesensing 13 02858 g003
Figure 4. Maps of changes in the spatial distributions of hotspot areas (HSAs) at the 99% significance level in the PRD: (a) the changes in daytime HSAs in the PRD; (b) the changes in nighttime HSAs in the PRD (the “blank” areas did not include HSAs).
Remotesensing 13 02858 g004
Figure 5. HSAs classification in each city in 2005 and 2015: (a) the percentage of different levels of HSAs in the total area of each city in the daytime; (b) the percentage of different levels of HSAs in the total area of each city in the nighttime.
Remotesensing 13 02858 g005
Figure 6. Hotspot Ratio Index (HRI) in the nine cities.
Remotesensing 13 02858 g006
Figure 7. The q values of drivers for each city in the daytime (the blank values indicate that the results of corresponding factors are not significant at a p-value of 0.05).
Remotesensing 13 02858 g007
Figure 8. The q values of drivers for each city in the nighttime (the blank values indicate that the results of corresponding factors are not significant at a p-value of 0.05).
Remotesensing 13 02858 g008
Figure 9. The interactions among drivers with respect to daytime LST in each city (2005).
Remotesensing 13 02858 g009
Figure 10. The interactions among drivers with respect to daytime LST in each city (2015).
Remotesensing 13 02858 g010
Figure 11. The interactions among drivers with respect to nighttime LST in each city (2005).
Remotesensing 13 02858 g011
Figure 12. The interactions among drivers with respect to nighttime LST in each city (2015).
Remotesensing 13 02858 g012
Table 1. Absolute values of selected constant attributes and rates of change for the selected changeable attributes from 2005 to 2015.
VariablesUnitGuangzhouDongguanShenzhenFoshanZhongshanZhuhaiHuizhouZhaoqingJiangmen
Constant variables
Administrative areakm27215.272449.571942.733795.641744.121579.4811,319.1614,898.679365.96
Mean Elevationm110.9642.8690.2524.5023.5138.21167.26207.3277.80
Changeable variables
Average air temperature°C+0.18 +2.69 +3.04 +1.55 +2.32 +3.94 +2.12 +2.97 +3.07
Permanent population10,000 persons+42.16 +25.81 +37.47 +28.11 +31.83 +15.43 +28.29 +10.44 +10.15
Electricity consumption100 million kw/h+83.08 +58.84 +83.25 +85.85 +98.58 +136.07 +176.20 +213.50 +108.69
Cultivated land percentage %−6.18 −18.54 −11.50 −7.78 −7.49 −4.45 −3.68 −1.33 −2.31
Woodland percentage%−2.05 −9.40 −4.42 −3.45 −2.75 −1.43 −1.00 −0.73 −1.28
Grassland percentage%−3.05 −5.37 −3.31 −5.88 0.00 −20.00 +9.72 +25.63 +10.09
Water area percentage%−4.00 -8.53 −14.48 −7.87 −5.56 −12.70 +1.07 −1.65 −1.74
Construction land percentage%+19.43 +14.81 +9.95 +21.65 +16.55 +22.99 +25.68 +16.73 +18.89
Unused land percentage%0.000.000.000.000.000.000.000.00−33.33
Gross domestic product (GDP)1000 yuan/km2+284.58 +266.61 -27.47 +225.57 +329.39 +226.23 +123.42 +253.53 +196.55
Population density (POP)Person/km2+85.52 +385.87 +389.66 +104.63 +121.56 +65.99 +66.93 +12.07 +19.09
Nighttime light index (NLI)__+66.05 +27.98 +32.53 +49.68 +39.19 +71.48 +96.06 +123.03 +117.74
Normalized difference vegetation index (NDVI)__+8.20 +9.09 +17.65 +2.00 −2.00 +1.82 +6.76 +3.85 +2.78
Impervious surface distribution density (ISDD)__+35.71 +28.57 +22.58 +28.00 +40.91 +66.67 +66.67 +100.00 +25.00
Note: “+” indicates the positive changes from 2005 to 2015, and “−” indicates the negative changes from 2005 to 2015; the rate of change is calculated with the formula: (T2015-T2005)/T2005*100.
Table 2. Influencing drivers and data sources.
DriversVariablesOriginal Resolution/Resample ResolutionTimeSource
Physiographical factorElevation1 km/1 km/www.resdc.cn
Land cover factorsLand use/land cover (LUCC)1 km/1 km2005, 2015www.resdc.cn
NDVI1 km/1 km2005, 2015www.resdc.cn
ISDD30 m/1 km2005, 2015https://doi.org/10.6084/m9.figshare.11513178.v1
Socio-economic factorsGDP1 km/1 km2005, 2015www.resdc.cn
POP1 km/1 km2005, 2015www.resdc.cn
NLI1 km/1 km2005www.resdc.cn
750 m/1 km2015http://ngdc.noaa.gov
Table 3. The effects of interactions between two drivers.
DescriptionInteraction Effect
q(X1∩X2) > Min (q(X1), q(X2))Enhance
q(X1∩X2) > Max (q(X1), q(X2))Bi-enhance
q(X1∩X2) > q(X1) + q(X2)Enhance, nonlinear
q(X1∩X2) = q(X1) + q(X2)Independent
q(X1∩X2) < q(X1) + q(X2)Weaken
q(X1∩X2) < Max (q(X1), q(X2))Weaken, un-enhance
q(X1∩X2) < Min (q(X1), q(X2))Weaken, nonlinear
Table 4. Average LSTs and the percentage of hotspot areas (HSAs) in each city during the study periods.
VariablesGuangzhouDongguanShenzhenFoshanZhongshanZhuhai HuizhouZhaoqingJiangmen
Daytime LST (°C)200527.0428.6628.0027.2727.2926.4426.5625.7626.31
201527.4730.2829.3828.3028.6427.5626.9225.9327.04
variation0.431.621.381.031.351.120.360.170.73
Ratio of daytime HSAs to city area20050.260.630.510.250.260.060.190.040.03
20150.220.740.580.340.390.140.110.010.06
variation−0.040.100.070.090.130.07−0.08−0.030.03
Nighttime LST (°C)200516.7617.8817.7618.1218.4818.5816.0616.0817.44
201517.6119.3119.0218.6819.6419.4917.2717.0018.38
variation0.851.431.260.561.160.911.210.920.94
Ratio of nighttime HSAs to city area20050.230.500.390.590.780.830.020.040.20
20150.190.710.530.360.790.760.040.020.22
variation−0.040.210.15−0.230.01−0.070.02−0.010.03
Note: HSAs were delineated at the 99% significance level.
Table 5. Criteria for HSAs classification.
HSAs LevelLST Range (°C)
DaytimeNighttime
Level 1<=28.78<=18.36
Level 228.78~29.4218.36~18.90
Level 329.42–30.1918.90~19.30
Level 430.19~31.2219.30~19.76
Level 5>31.22>19.76
Table 6. The q values of the LST drivers in 2005 and 2015.
YearRegionElevationLUCCNDVIISDDPOPGDPNLI
2005 dayPRD0.500.350.400.300.260.250.36
2015 dayPRD0.500.430.500.44 0.370.310.58
2005 nightPRD0.410.300.440.320.450.350.45
2015 nightPRD0.430.310.450.340.330.290.50
Publisher’s Note: MDPI stays neutral with regard to jurisdictional claims in published maps and institutional affiliations.

