Review

A Systematic Review of Landsat Data for Change Detection Applications: 50 Years of Monitoring the Earth

by
MohammadAli Hemati
1,
Mahdi Hasanlou
1,
Masoud Mahdianpari
2,3,* and
Fariba Mohammadimanesh
2
1
School of Surveying and Geospatial Engineering, College of Engineering, University of Tehran, Tehran 14174-66191, Iran
2
C-CORE, 1 Morrissey Road, St. John’s, NL A1B 3X5, Canada
3
Department of Electrical and Computer Engineering, Memorial University of Newfoundland, St. John’s, NL A1C 5S7, Canada
*
Author to whom correspondence should be addressed.
Remote Sens. 2021, 13(15), 2869; https://doi.org/10.3390/rs13152869
Submission received: 28 May 2021 / Revised: 9 July 2021 / Accepted: 15 July 2021 / Published: 22 July 2021
(This article belongs to the Special Issue Wetland Monitoring Using Remote Sensing)

Abstract

:
With uninterrupted space-based data collection since 1972, Landsat plays a key role in systematic monitoring of the Earth’s surface, enabled by an extensive and free, radiometrically consistent, global archive of imagery. Governments and international organizations rely on Landsat time series for monitoring and deriving a systematic understanding of the dynamics of the Earth’s surface at a spatial scale relevant to management, scientific inquiry, and policy development. In this study, we identify trends in Landsat-informed change detection studies by surveying 50 years of published applications, processing, and change detection methods. Specifically, a representative database was created resulting in 490 relevant journal articles derived from the Web of Science and Scopus. From these articles, we provide a review of recent developments, opportunities, and trends in Landsat change detection studies. The impact of the Landsat free and open data policy in 2008 is evident in the literature as a turning point in the number and nature of change detection studies. Based upon the search terms used and articles included, average number of Landsat images used in studies increased from 10 images before 2008 to 100,000 images in 2020. The 2008 opening of the Landsat archive resulted in a marked increase in the number of images used per study, typically providing the basis for the other trends in evidence. These key trends include an increase in automated processing, use of analysis-ready data (especially those with atmospheric correction), and use of cloud computing platforms, all over increasing large areas. The nature of change methods has evolved from representative bi-temporal pairs to time series of images capturing dynamics and trends, capable of revealing both gradual and abrupt changes. The result also revealed a greater use of nonparametric classifiers for Landsat change detection analysis. Landsat-9, to be launched in September 2021, in combination with the continued operation of Landsat-8 and integration with Sentinel-2, enhances opportunities for improved monitoring of change over increasingly larger areas with greater intra- and interannual frequency.

1. Introduction

The world’s population has increased from 2.6 billion at the beginning of the 1950s to 7.7 billion at present and is predicted to reach ~9.7 billion by 2050. Population growth is known to be the greatest driver of land cover change, via alterations to land use, globally [1]. As such, global land cover is deeply intertwined with the environment and climate, and changes to one will impact the other via several interacting feedback loops [2]. Approximately 60% of all land cover change is directly related to anthropogenic activities such as agricultural and industrial development, and 40% is indirectly linked to human activity, such as climate change [3,4]. Knowing how humans use and alter the landscape is often more crucial for planning and management purposes than the land cover itself [5]. Land use change related to processes such as industrialization, urbanization, desertification, deforestation, and agriculture has long-term impacts on the environment in different aspects, including climate, biodiversity, vegetation composition, energy balance, as well as the water and carbon cycle [6,7]. For example, it has been estimated that approximately one-quarter of cumulative carbon emissions to the atmosphere are related to land use change [8]. To better understand the patterns and impacts of the ever-changing global landscape, information that captures anthropogenic alteration to the Earth’s surface in a systematic and quantifiable fashion is of utmost importance [9]. Recent advances in remote sensing tools and techniques enable researchers to detect and monitor such changes. Landsat data has proven particularly useful, given its substantial historical record and continuous data gathering at national [10,11,12,13,14] and global scales [15,16,17]. These data are of value to policymakers and governments who increasingly apply Landsat change detection products in support of national reporting and policy development and to inform international programs [18,19].
Landsat is currently nearing five decades of uninterrupted satellite imaging [9]. The initiation of the Landsat program was in 1972, providing for some locations an early baseline for change detection that is unique among satellite programs [20]. Later changes to the Landsat data policy in 2008 by the United States Geological Survey (USGS) resulted in free and open access to the global Landsat archive [21]. This policy change lead to a vast increase in global applications, particularly in terms of monitoring changes over large areas [22] and to the formalization of Landsat data in commercial and government programs [23]. Efforts have been made by the Landsat Global Archive Consolidation (LGAC) to ensure that all images gathered at international receiving stations are captured, processed, stored, and made available via the collection of Landsat data into the USGS Landsat data archive. Today, the Landsat archive is more complete than ever [24]. Much of the globally acquired Landsat data was collected by numerous instruments under various atmospheric conditions and angles, meaning that geometric and radiometric calibration are necessary if Landsat data are used in a time series analysis or within a stack. This ultimately limited the use of these data by those lacking certain knowledge or software capabilities. However, with the availability of Landsat Collection 1, and recently Collection 2, and other preprocessed products [25,26] with automated cloud detection algorithms [27], there is now broad capacity for the use of Landsat data in time series analysis and change detection applications.
For several years, land cover change detection using remote sensing data largely focused on capturing abrupt changes between two time intervals, where one land cover type is replaced by another [28]. Over time, however, improvements to instruments and data availability and advancements in algorithms and computation methods allowed for the development of different change-detecting techniques, such as time series analysis and temporal trajectory-based change detection [29]. As a result, change detection and land cover classification are no longer implemented as separate and independent activities as was typical in past studies, allowing for the extraction of more thorough and meaningful change-related information. Additionally, recent advances in cloud computing platforms, such as Google Earth Engine (GEE) [30], Amazon Web Services [31], NASA Earth Exchange [32], which host petabyte-scale data archive and offer high performance cloud computing capability, make implementation of state-of-the-art algorithms over large areas feasible [33].
Improvements in space-borne instrument technology and the growing importance of earth observation (EO) satellites for environmental monitoring have increased the number of active civilian remote sensing satellites [20]. For example, high spatial resolution satellite constellations with frequent data acquisition rates have been launched, such as the constellation of more than 180 shoebox-sized “Doves” satellites by Planet with a daily 3.7 m spatial resolution [34]. Despite their high spatial and temporal resolutions, many of these optical sensor programs lack radiometric consistency, consistent spectral bandpasses, and orbital stability [5]. As such, the use of a reference sensor for cross-calibration of surface reflectance products is essential for the integration of data between sensors and to provide measurement integrity through space and time [35]. The Landsat program addresses this issue as it offers radiometric consistency within its historical archive and thus, is one of the few instruments that can act as a reference sensor for other optical satellite programs [9]. Synergistic international partnerships between medium spatial resolution satellites can result in a virtual constellations [36], such as between Landsat and Sentinel-2 [37], reducing the effective revisit rate, such as a latitude-dependent <3 days revisit time for Landsat-8, Sentinel-2A, and Sentinel-2B [38]. Additional improvements via combining Landsat and Sentinel-2 are found in improved geometric fidelity [35].
Given the large number of applications and high rate of new algorithm developments, there are several change detection review papers currently published [5,28,29,39,40]. Despite the important position of Landsat data in change detection studies and applications, there is only a single review article focusing specifically on Landsat change detection [41]. In particular, the past review articles investigated change detection techniques using different sources of EO data from a descriptive perspective and thus, do not offer a quantitative comparison between Landsat-specific algorithms and applications. As such, the main objective of this study is to fill this gap via an analytical review of remote sensing change detection with a focus on data from the Landsat program. Specifically, this paper provides an overview of Landsat change detection research and a quantitative assessment of common processing pipeline for change detection algorithms using Landsat data. To capture a broad perspective on Landsat change detection and to identify scientific gaps, 490 published papers were selected, reviewed, and compiled into a database for this meta-analysis and review.

2. Landsat Overview

2.1. Landsat Legacy

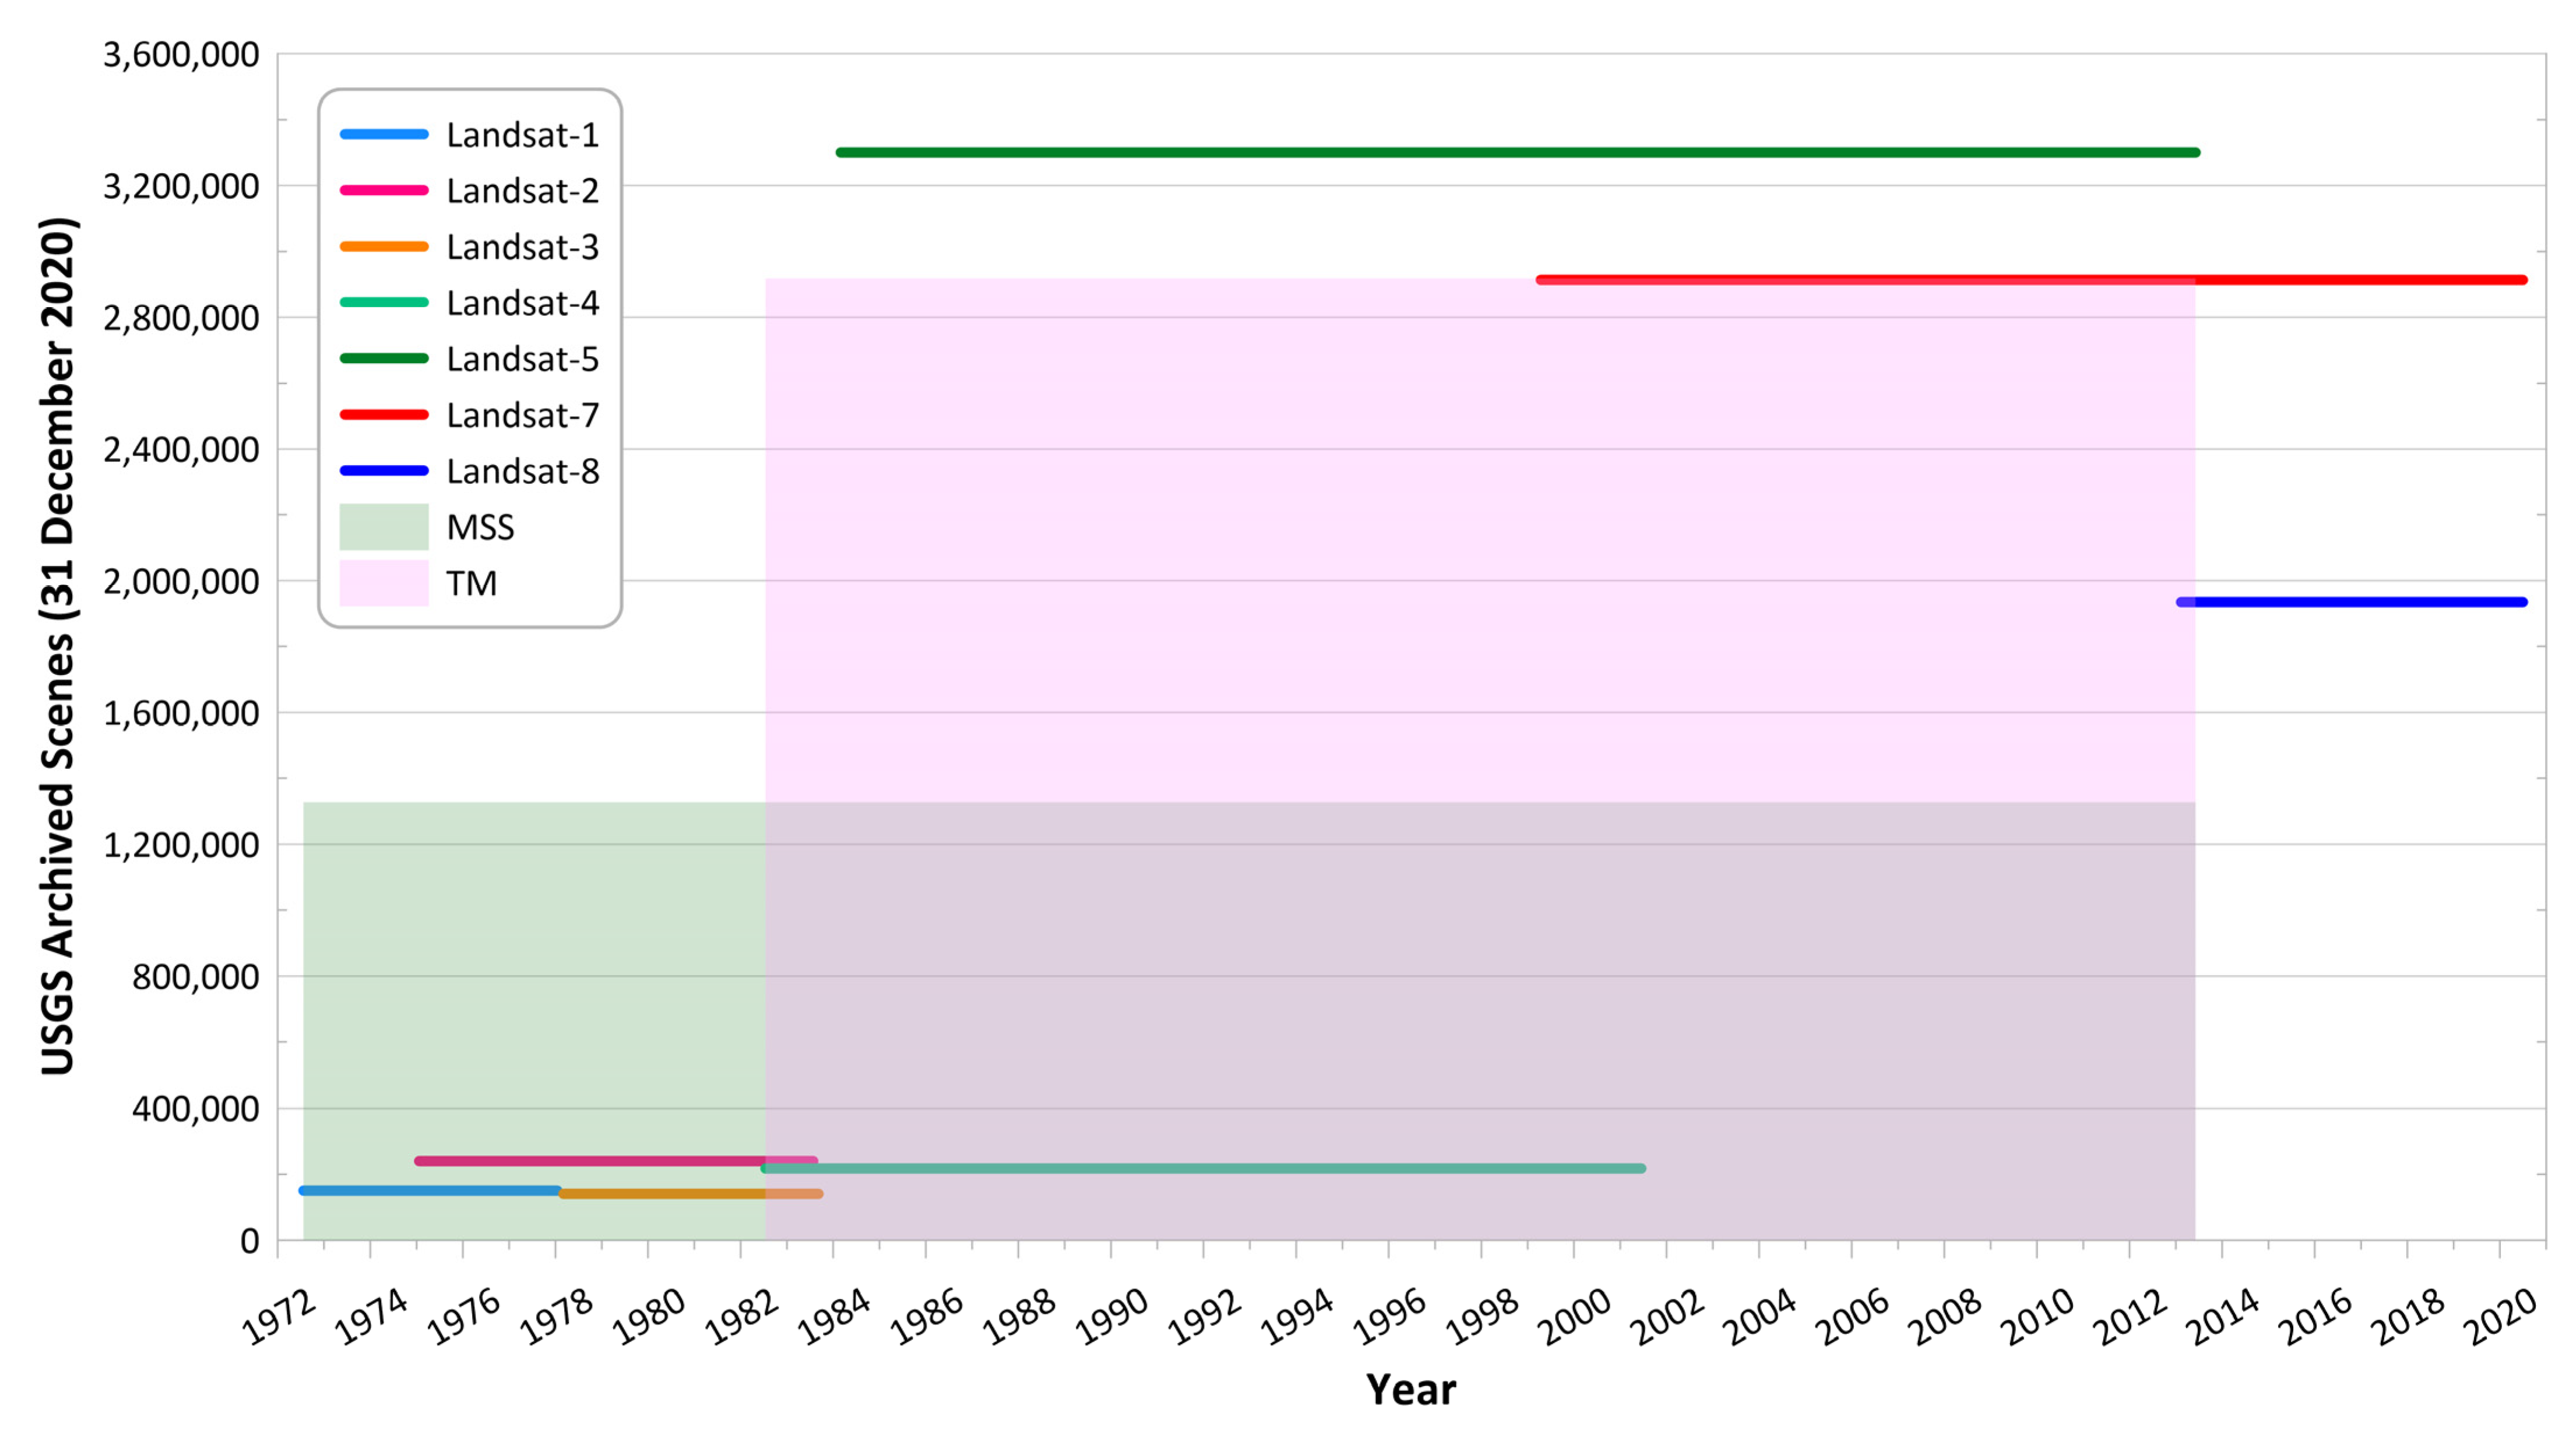
The concept of space-based land cover monitoring was developed as early as the 1960s by NASA and USGS when space-borne observation platforms became available [42]. The launch of Landsat-1, also known as the Earth Resources Technology Satellite (ERTS), on 23 July 1972 represented a new wave of opportunity for the remote sensing community [43] with global data acquisition ambitions. Currently, it is the longest-running uninterrupted Earth imaging program (Figure 1). Based upon this heritage Landsat has become a critical reference for scientific, commercial, and governmental projects, providing land use information to environmental decision-makers and international agreements at both local and global scales [23,44].
The first near polar-orbiting EO satellite is Landsat-1 [45], which carried a Return Beam Vidicon (RBV) and Multispectral Scanner System (MSS) with ~60 m spatial resolution, a 6-bit quantization system, and 4 bands. Later operating alongside Landsat-1 and sharing the same design, Landsat-2 was implemented to achieve complete global coverage and capture periodic images. Landsat-3 carried some sensor improvements, including redesigning the RBV system to use side-by-side mounted cameras with 40 m ground resolution panchromatic spectral response and adding a thermal band, though it did not perform well at the time. Landsat-4 was the first NASA satellite with a global positioning system (GPS) instrument and carried some improvements in spacecraft engineering, such as solar arrays, greater altitude, and orbital control and adjustment. Landsat-4 launched with the Thematic Mapper (TM) sensor carrying 7 bands, 8-bit quantized data, and a 30 m spatial resolution. Landsat-4 marked the beginning of the collection of thermal infrared data with 120 m spatial resolution by the Landsat mission. As seen in Figure 1, Landsat-5, which was originally designed for only three years of operation, had the longest individual operating satellite lifetime, covering the failure of the proceeding Landsat-6, which did not achieve orbit. Next, Landsat-7 launched with the Enhanced Thematic Mapper (ETM+) sensor, an improved version of the previous TM, offering 15 m panchromatic and 60 m thermal infrared spatial resolution bands. Unfortunately, the Landsat-7 Scan Line Corrector (SLC) failure occurred in June 2003, and since then, the data delivered from this sensor contained gaps. Landsat-8 was launched on 11 February 2013. By this time, high spatial resolution sensors were developed; however, Landsat-8 data still has the 30 m spatial resolution to maintain data continuity and consistency with its predecessors. Landsat-8 carries the Operational Land Imager (OLI) and Thermal Infrared Sensor (TIRS) with improvements in quantization (12-bit) and it also has some additional bands (i.e., coastal aerosol and cirrus).
Despite the increasing number of EO satellites, including high-resolution commercial satellites, CubeSats, national programs, and satellite constellations, the Landsat program continues to play a key role in applications of optical imagery, acting as a reference point that is considered “not replaceable” [9]. This is because there is no other science-grade, long-term uninterrupted EO program, which provides a free data policy, global coverage, radiometric consistency between sensors with appropriate spatial and temporal resolutions for resource and environment monitoring. Today, remote sensing scientific communities, commercial programs, and governments rely on the consistency and availability of Landsat data [46].
The European Space Agency (ESA) launched the Sentinel-2 constellation with a multispectral sensor in 2014 and 2017 as a part of the European Union’s Copernicus EO program, providing spatial resolution of 10 m (visible and near-infrared bands), 20 m (red-edge and shortwave infrared bands) and 60 m (atmospheric correction bands), a five-day temporal resolution from two-satellite constellation (at equator), and free access policies [47]. In addition to red edge and water vapor bands, Sentinel-2 has a higher spatial resolution in the visible and shortwave infrared bands compared to that of Landsat, yet Sentinel-2 does not capture data in the thermal infrared band. As such, Sentinel-2 is the best complement to the Landsat program and has resulted in opportunities for international partnerships and virtual constellations [36]. With about 2.5 days of temporal resolution, the synthesis of Sentinel-2A, Sentinel-2B, and Landsat-8 data allows for the development of new applications for monitoring highly dynamic phenomenon [48]. These opportunities are possible via new methods for geometric and radiometric registration between Sentinel-2 and Landsat at pixel-level [49,50,51].
Permanent global imaging and data continuity are the main concerns of the Landsat Program [52]. The Landsat Data Continuity Mission (LDCM), along with the launch of Landsat-8 in 2013, was the first step towards plans for increasing data continuity [53]. From 2014, the U.S. implemented the Sustainable Land Imaging (SLI) program, based on the sustainability, continuity, and reliability of Landsat data, to solidify the future of Landsat legacy into the 2030s and beyond through a partnership between NASA and USGS. This led to the design of the Landsat-9 mission with Operational Land Imager-2 (OLI-2) and Thermal Infrared Sensor-2 (TIRS-2), planned for launch in 2021 [54], coinciding with the end-of-life of Landsat-7 and related orbital changes. At almost any time, at least two Landsat instruments have been in orbit over the Earth for global imaging every 8 days, which is expected to continue well into the future.

2.2. Landsat Archive and Data Characteristics

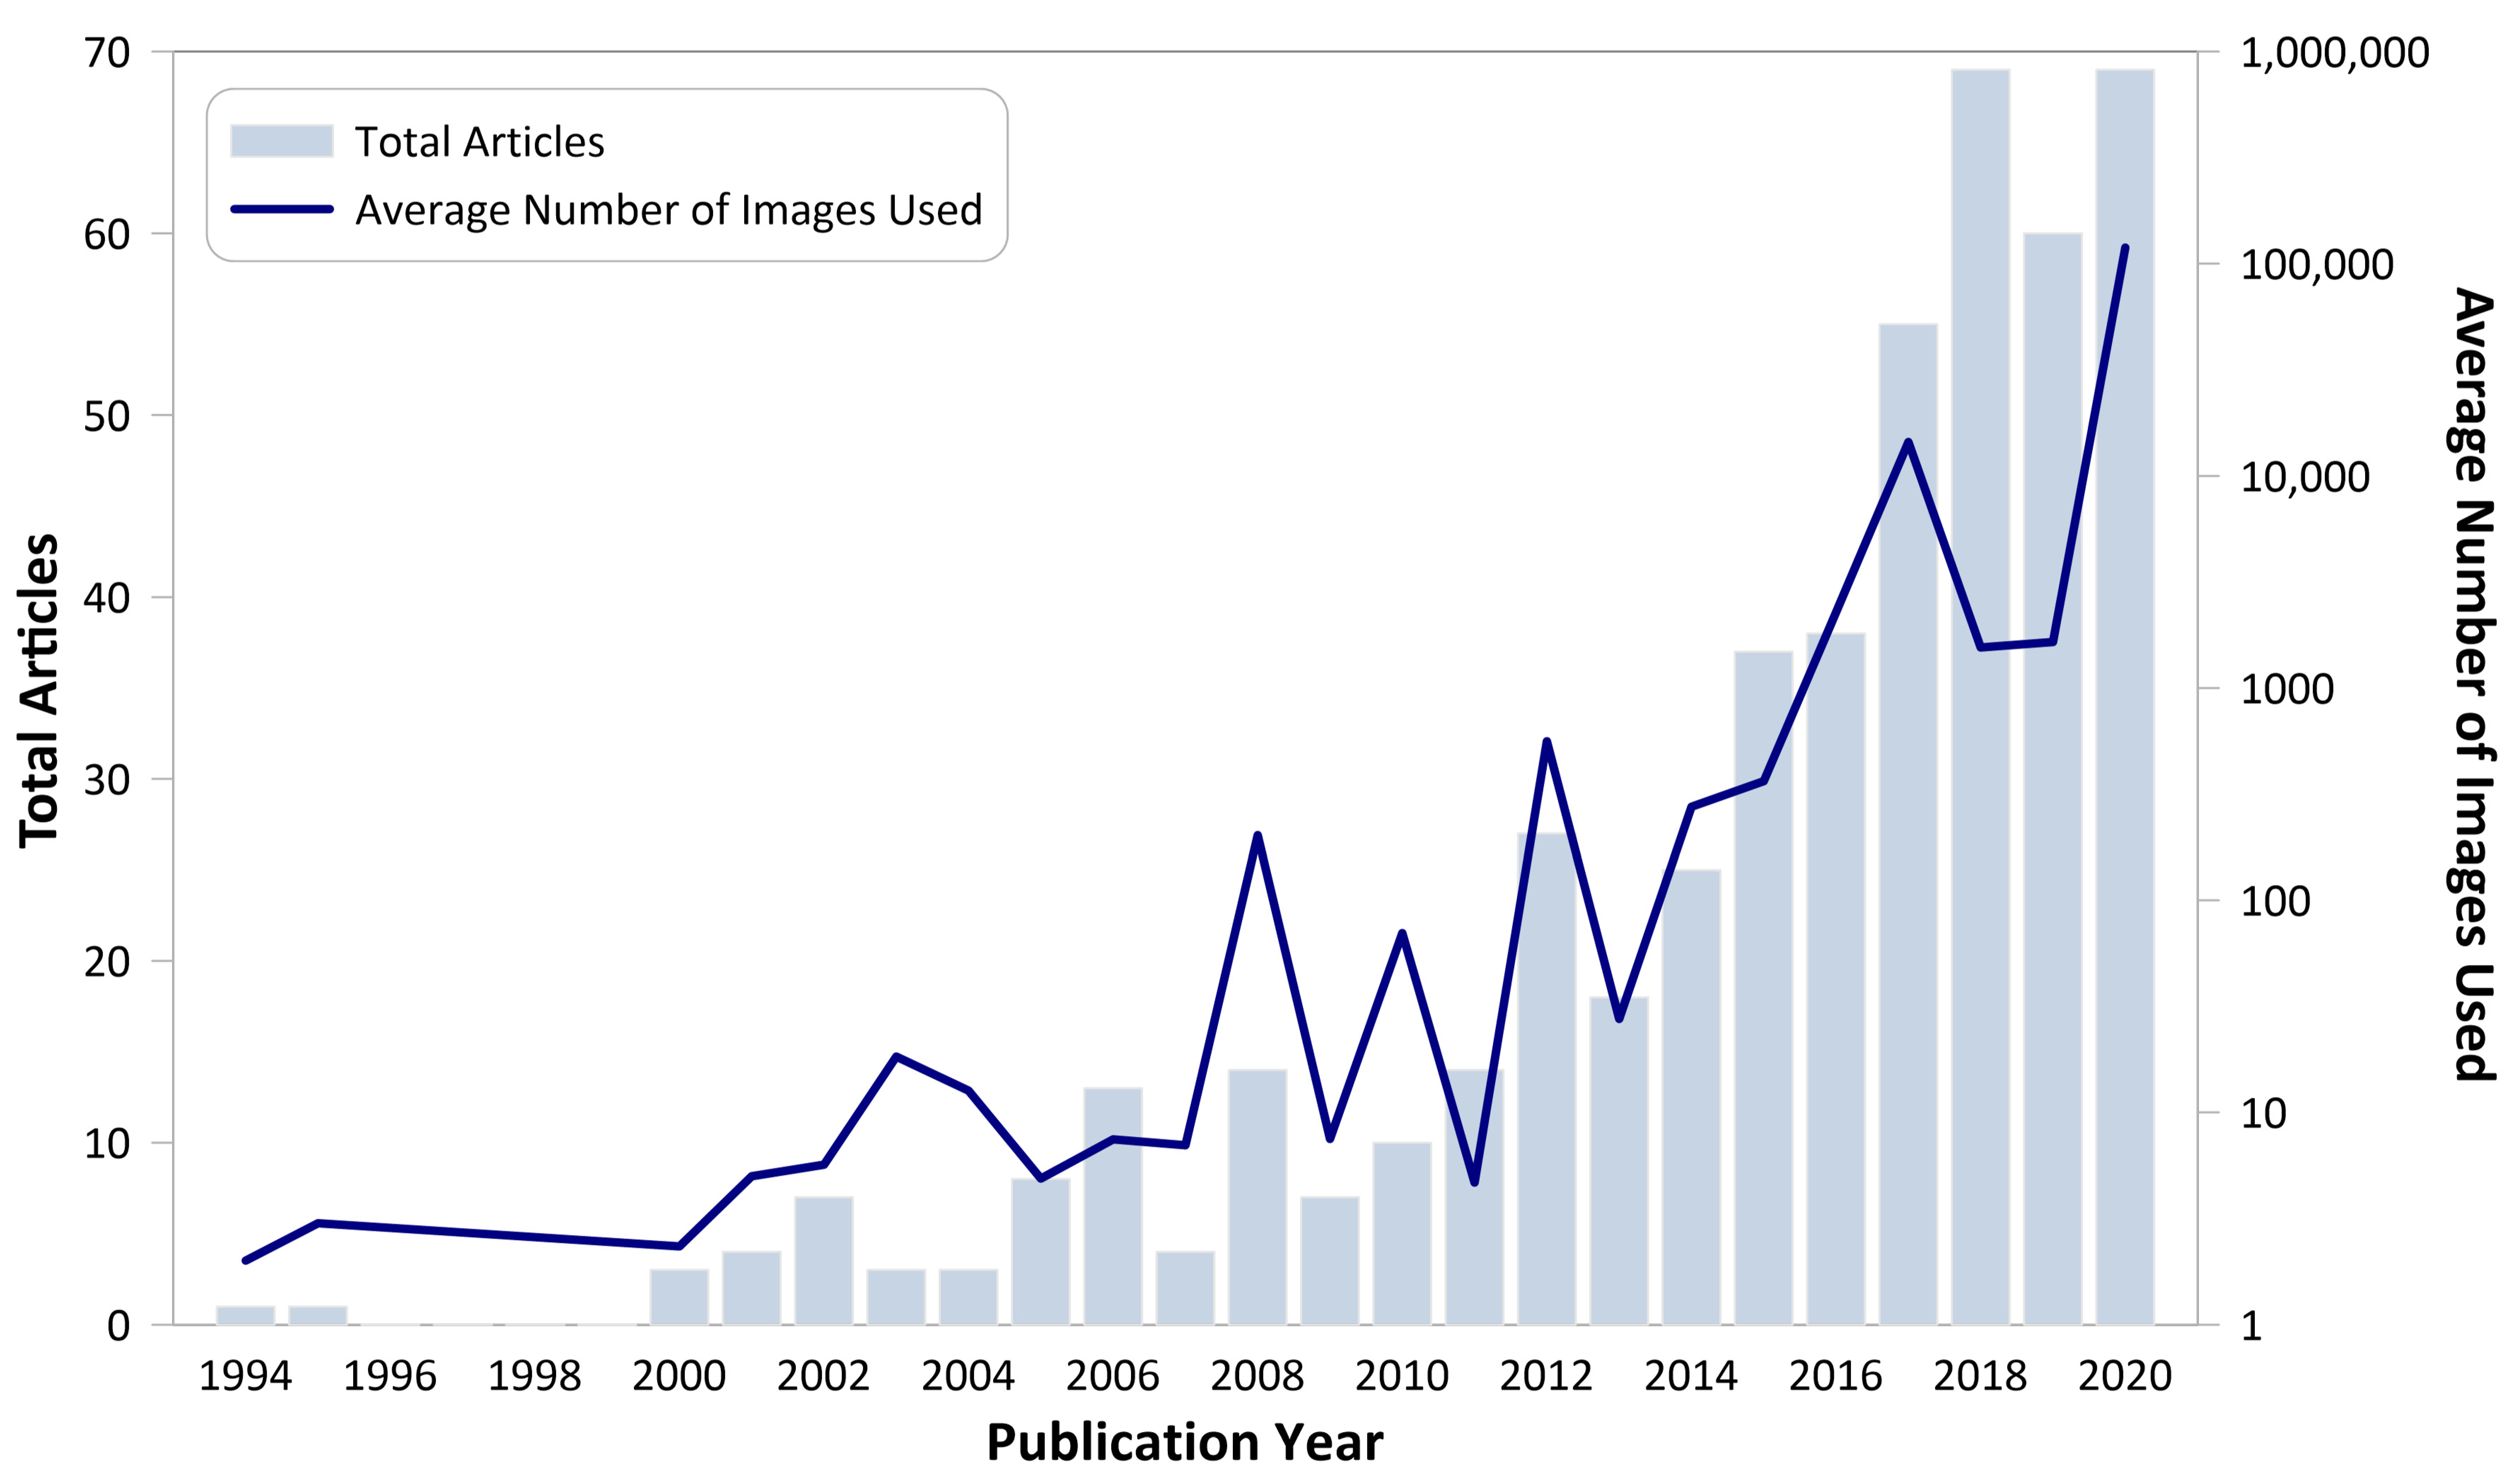
Before 2008, the Landsat data policy affected the widespread use of Landsat data, particularly during the commercial management (EOSAT) years, due to the relatively high cost of a single Landsat image (as high as $4400) and the existence of copyright rules that limited sharing [22]. This resulted in low usage of Landsat data and an interest in using as few images as possible for given study (see Figure 2). From economic benefit studies, this limited the potential societal benefits of Landsat and the return on Landsat program investments [55]. The 2008 change in Landsat data policy [21] is evident in both numbers of images downloaded and the number of scientific publications.
For some time, the imagery provided by the Landsat global archive was sparse (an estimated 4 million images archived at International Cooperators and 1.9 million at USGS as of March 2006 [56]. This was due to limitations of Landsat-1 to Landsat-5, such as the absence of onboard data storage capacity and data transition [57], and the lack of systematic data gathering from international ground stations (IGS) to USGS [56]. However, changes in the data policy since 2008 and the need for a truly complete global archive with deep temporal records resulted in the Landsat Global Archive Consolidation (LPGS) and improvements of onboard and data transition capacity [24].
As a result of the Landsat Global Archive Consolidation (LGAC), the USGS Landsat archive contains around 9.2 million Landsat Level-1 images as of 31 December 2020 (see Figure 3). Additionally, with the new data acquisition policy, ~1200 new observations are added to the USGS archive each day from Landsat-7 and -8, and multiple million images are downloaded per year [9]. Since implementation of free data policy in 2008, many new applications have been developed. These new algorithms have increased the total number of downloaded images from USGS, which now surpasses the 100 million mark.
Several applications of EO data rely on pixel-level radiometric and geometric registration and radiometric consistency within a time series, between sensors, and band-to-band. These requirements lead to the processing of the Landsat Collection 1, released in May 2017 [25], reducing preprocessing requirements and increasing consistency, while implementing the latest in methods and science. Collection 2, released December 2020, further improved geometric accuracy (through updated elevation data), improved radiometric calibration, additional higher level products, more quality assessment bands, updated metadata files, and a cloud optimized file format. Given Global Navigation Satellite System (GNSS), star tracker cameras, and inertial navigation system, and Landsat 8 OLI Harmonized Global Reference Images (GLIs) with Sentinel-2, the Landsat Collection 2 has achieved georectification with a less than 12 m root mean square error (RMSE) and enhanced usage of ground control points (GCPs) to produce more level-1 terrain precision (L1TP) products.
The Collection 2 reflectance-based calibration approach has ~3% accuracy, which is updated through time and is used to propagate radiometric consistency to past generations. Although some algorithms and applications do not require atmospheric correction and can perform well using Landsat TOA data alone (e.g., single-date image classification), multitemporal classification and geographically large-scale change detection studies require atmospheric correction [58]. Surface reflectance, as a physical value, is consistent through space and time. As a result, the application of atmospheric correction makes change detection results more reliable. Therefore, algorithms with dense time series and especially those over large areas [59,60] typically require the use of surface reflectance data, which has become the lowest level of analysis-ready data standard (e.g., as delivered by Landsat Collection 1 or 2).

3. Method

On 14 August 2020, a search of two scientific databases, Web of Science and Scopus, was done for articles containing “Change Detection” OR “Land Cover Change” with “Landsat” and “Time Series” in the title, abstract or keywords, from 1970 to 2020. The Preferred Reporting Items for Systematic Reviews and Meta-Analyses (PRISMA) [61] proposed method was followed (see Figure 4). After removing duplicate results, 643 articles were screened and 490 titles were selected for the systematic review. Landsat data have been used in several scientific fields and in some of them the data only used as an ancillary data or for validation purposes. Articles from non-remote sensing sources that did not use change detection methods or Landsat images as the primary data were excluded from the database. In addition, review papers and articles written in non-English languages were excluded.
The database was built to include 39 attributes in total, which are filled with numeric, Boolean, and string data types containing quantitative, qualitative, and categorical characteristics of the research describing article information, study area and application, data acquisition, preprocessing steps, change detection method, and evaluation results (Table 1).

4. Results and Discussion

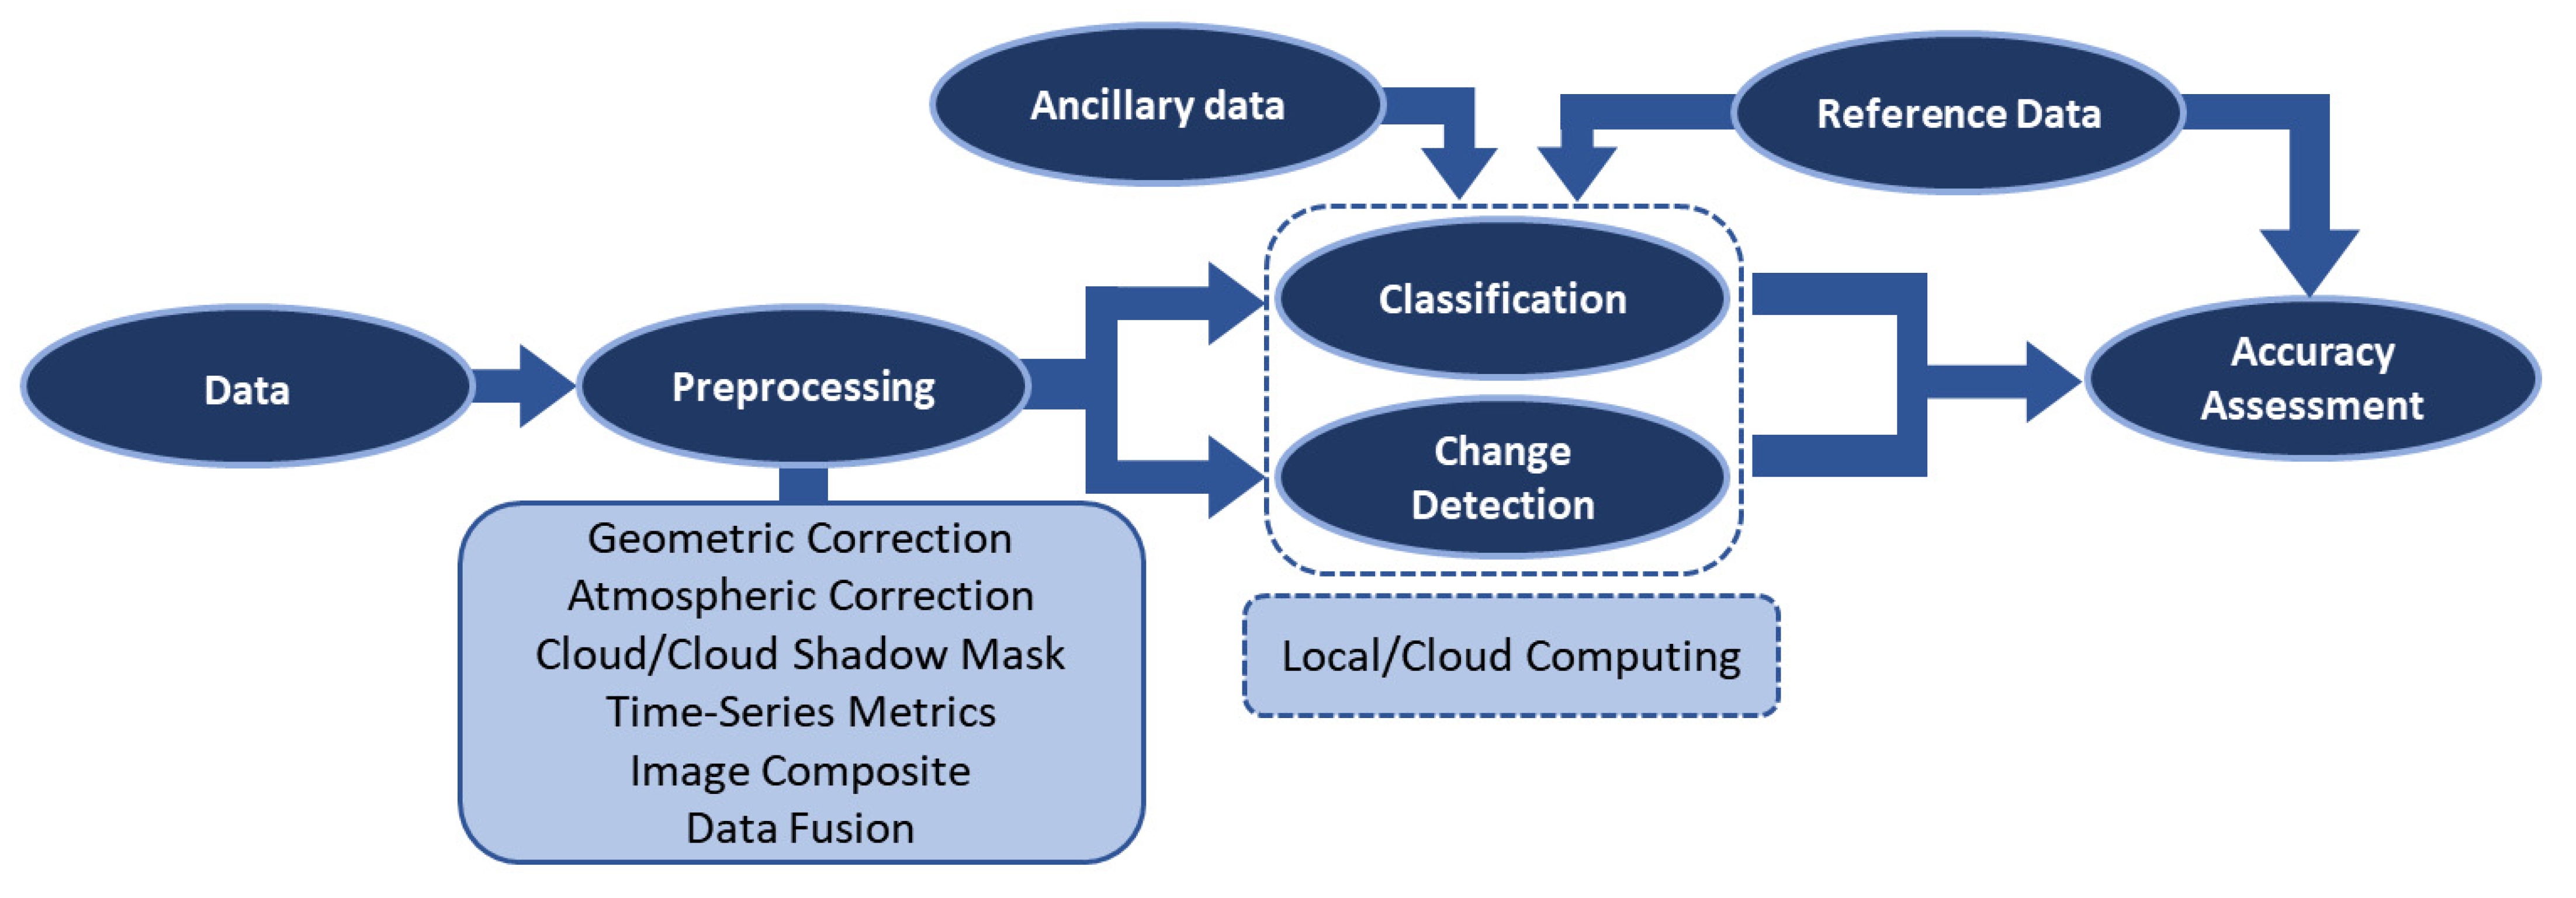
After creating the meta-analysis database from 490 journal articles, as described above, relevant information was extracted from the reviewed papers. Figure 5 demonstrates a typical workflow of the Landsat change detection methodology used in these studies. As shown, after data collection and preprocessing, reference data and ancillary data were used for classification and change detection, and the results are evaluated using different accuracy assessment indices.
Previous studies produced land cover maps to represent the state of the land cover at a specific date or period, and change detection was then implemented as a separate action or as a postprocessing activity [5]. Using this method, errors or uncertainties present in the individual land cover maps were duplicated and spread to the final change maps, resulting in incorrect attribution of change [28]. More recently, change data are integrated into land cover classification through a time series methodology implemented using a multiyear stack of Landsat data, resulting in quantitative enhancements of estimated land cover [62]. Change information is available in many forms. For example, change metrics provided by time series approaches can be used to assist in the production of sequentially integrated land cover maps. Similarly, the integration of ecological succession knowledge supports the temporal consistency of land cover maps [12,63]. Utilization of annually consistent land cover maps provides a comprehensive analysis of the land cover transition of pixels through time, resulting in a more accurate assessment of change compared to more traditional “from–to” change detection maps more commonly implemented in the past. Coefficients and the RMSE from time series models and model estimation are now key inputs to classifiers [60].

4.1. General Information and Applications

Landsat change detection research is published in journals of various fields, from remote sensing to ecology, demonstrating the relevance of Landsat change detection to many different scientific communities. In several of these studies, Landsat change detection results are considered a reliable source of data for comparing and evaluating non-remote sensing data. These products are also useful to demonstrate land use changes and their related impacts on the environment. Of 490 papers and 129 journals, Remote Sensing of Environment and Remote Sensing journal have the largest number of publications that applied Landsat data for change detection, featuring a total of 107 and 70 articles, respectively (Figure 6).
As shown in Figure 7, since 2008, there is an increasing number of Landsat change detection articles, largely because of the Landsat free-data policy. The availability of free data and improvements in data storage capacity significantly contributed to the exponential increase in the average number of Landsat images used in the articles reviewed (see Figure 7). Most recently, online repository and APIs with cloud computing platforms enabled researchers to easily use thousands of Landsat images. For example, Pickens et al. (2020) used 3.4 million Landsat images for mapping inland water dynamics through GEE [64].
Landsat change detection studies cover a range of geographical scales, from small- to global-scale applications. Four of the reviewed studies produced global results using Landsat data [64,65,66,67], while several other studies produced continental and country-wide results for Africa [68], Australia, China, the United States [69], Eastern Europe, and Russia [70], for example. Most large-area studies were implemented in the GEE platform, which is capable of handling a massive amount of data. Figure 8 shows by continent the total number of study areas and the total number of Landsat images used. As illustrated, studies in Asia applied Landsat data to map large study areas, whereas studies in North America incorporated more Landsat images in their analysis compared to other continents (through the inclusion of a temporal element).
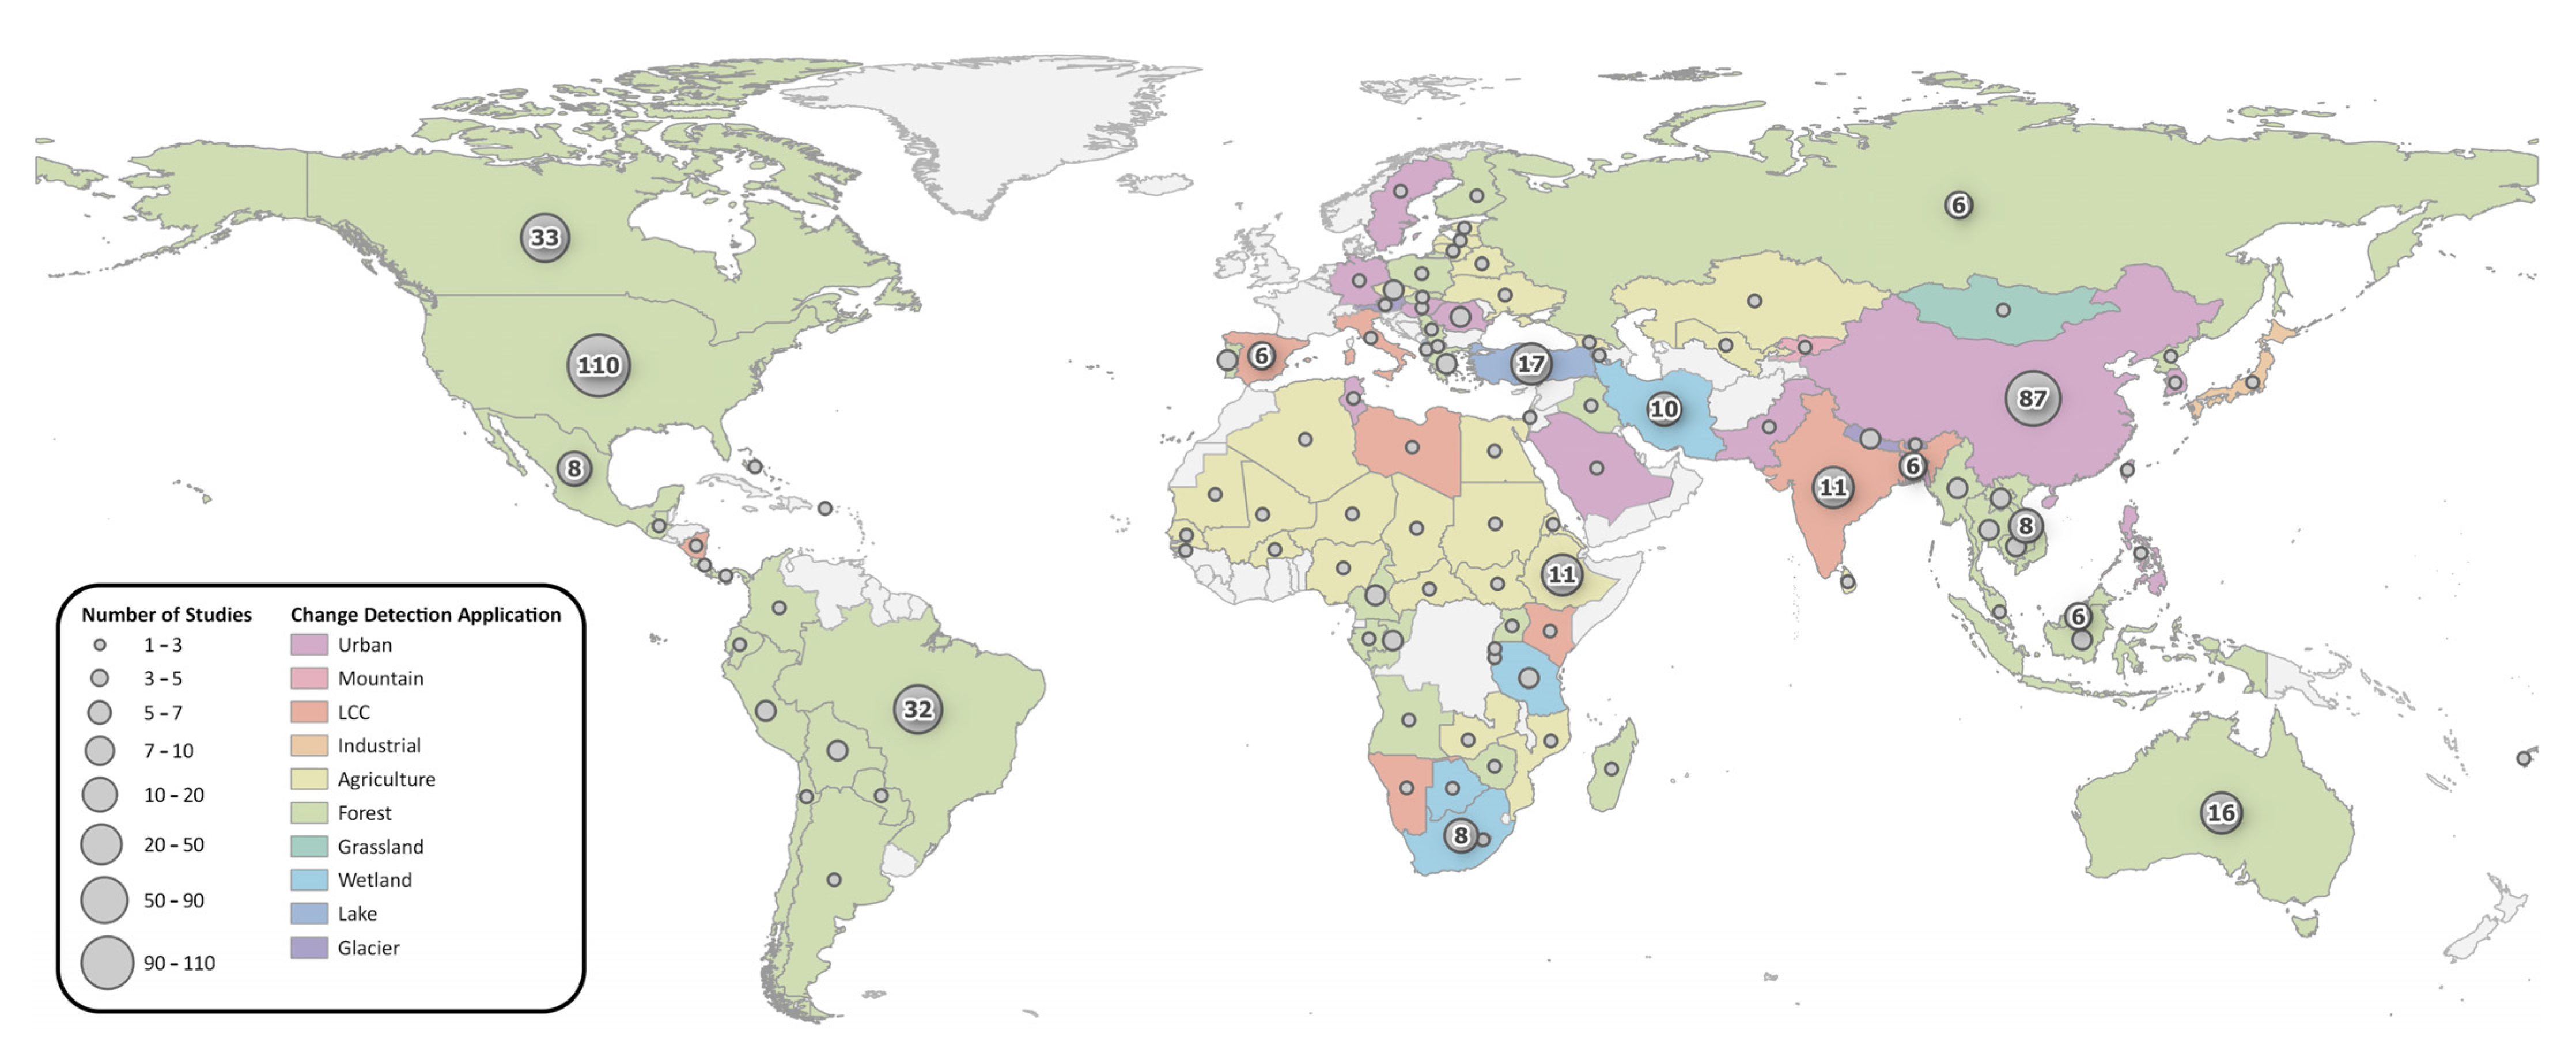
Landsat change detection has various applications, from environmental monitoring to capturing the dynamics of human life. Figure 9 shows the major domains of Landsat change detection studies in different countries. Based on this meta-analysis, forests are the most studied domain using Landsat change detection. Urban expansion is the main focus in China, whereas agriculture and food security are the most common concerns in North Africa.
To better understand drivers of land cover change in the reviewed studies, the most common change agents are summarized in Table 2, categorized as caused by natural or anthropogenic means. Deforestation, urban expansion, human activities, and agriculture expansion are the most common agents of change in the reviewed articles. However, it should be noted that change is more often driven by multiple agents, and different change agents have direct or indirect impacts on each other. For example, deforestation impacts the environment and climate, and climate changes can trigger natural disasters.

4.2. Data and Sensors

Landsat data can be accessed through several different sources, which are displayed in Figure 10. As expected, USGS, the official Landsat data provider, is the main source of Landsat change detection data in the reviewed papers. USGS is accessed through online repositories, such as EarthExplorer, GloVis, and the Earth Resources Observation and Science (EROS) Center science-processing architecture (ESPA) on-demand interface, which provides all historical global data processed at different levels of geometric and radiometric standards. Google Earth Engine (GEE, https://earthengine.google.com) also provides online access to all Landsat data and products. By using GEE, users do not require any storage infrastructure when downloading data. GEE is mostly used to access algorithms and to apply those algorithms to image datasets and other spatial data at a range of geographical scales.
Amazon Web Services (AWS, https://aws.amazon.com/earth) provides another private solution to access data. AWS offers clients admittance to an assortment of datasets (e.g., Sentinels, MODIS, Landsat, and elevation datasets) on a cloud-based platform. The versatility of this serverless computing platform supports code snippets from C#, Python, Node.js, and Java. AWS makes Landsat images accessible to anybody to utilize through Amazon Simple Storage Service (S3). All Landsat-8 images from 2015 are accessible alongside a selection of cloud-free images from 2013 and 2014. Additionally, all daily Landsat data are made available within hours of production. AWS reported 500 million global requests for Landsat data within the first 150 days of the launch of Landsat on AWS in March 2015. Using AWS, Bolton et al. (2020), for example, applied a dense time series of Landsat-8 and Sentinel-2 imagery at continent-scale to quantify the nature and magnitude of seasonality changes and to estimate the timing of vegetation phenophase transitions [71].
Figure 11 shows the number of studies that used data derived from different Landsat sensors. As illustrated, Landsat TM, with its reliable and consistent radiometry, 30 m spatial resolution, and an extensive historical catalog spanning from 1982 to 2012, is the most commonly used sensor in the reviewed studies. For monitoring changes prior to this time, Landsat MSS is the only available data source with 60 m spatial resolution, though it has relatively challenging preprocessing steps. Landsat ETM+ data are used in relatively few studies due to the SLC failure and are usually replaced with Landsat TM data. Importantly, there are many studies applying OLI data within a short time frame, demonstrating the success of Landsat 8 and data continuity.
Ancillary data are commonly used for preparing reference data or increasing the accuracy of results. As seen in Figure 12, land cover maps are the most common type of ancillary data used in Landsat change detection studies. Existing land cover maps are useful to determine the area and type of land cover within a given study area and are often a reliable source for collecting reference data. Historical land cover maps are usually in paper-form and should be digitized for integrating into a GIS or remote sensing framework. After digitization, historical land cover maps are one of the few reliable sources of reference data for evaluating the results of a time series. Google Earth provides access to high-resolution optical data from as early as 2000. Historical aerial photos are usually used for selecting training and validation data. Topographic data and digital elevation models (usually SRTM global 30 m data) are most often used for radiometric corrections of remote sensing imagery. Topographic characteristics, such as aspect and slope, are also extracted from DEM data and are used to improve classification accuracy. Field data, which is usually collected with GPS with a relatively high cost, is the most reliable source of reference data. Climate data are usually used to understand the relationship between land cover changes and climate.
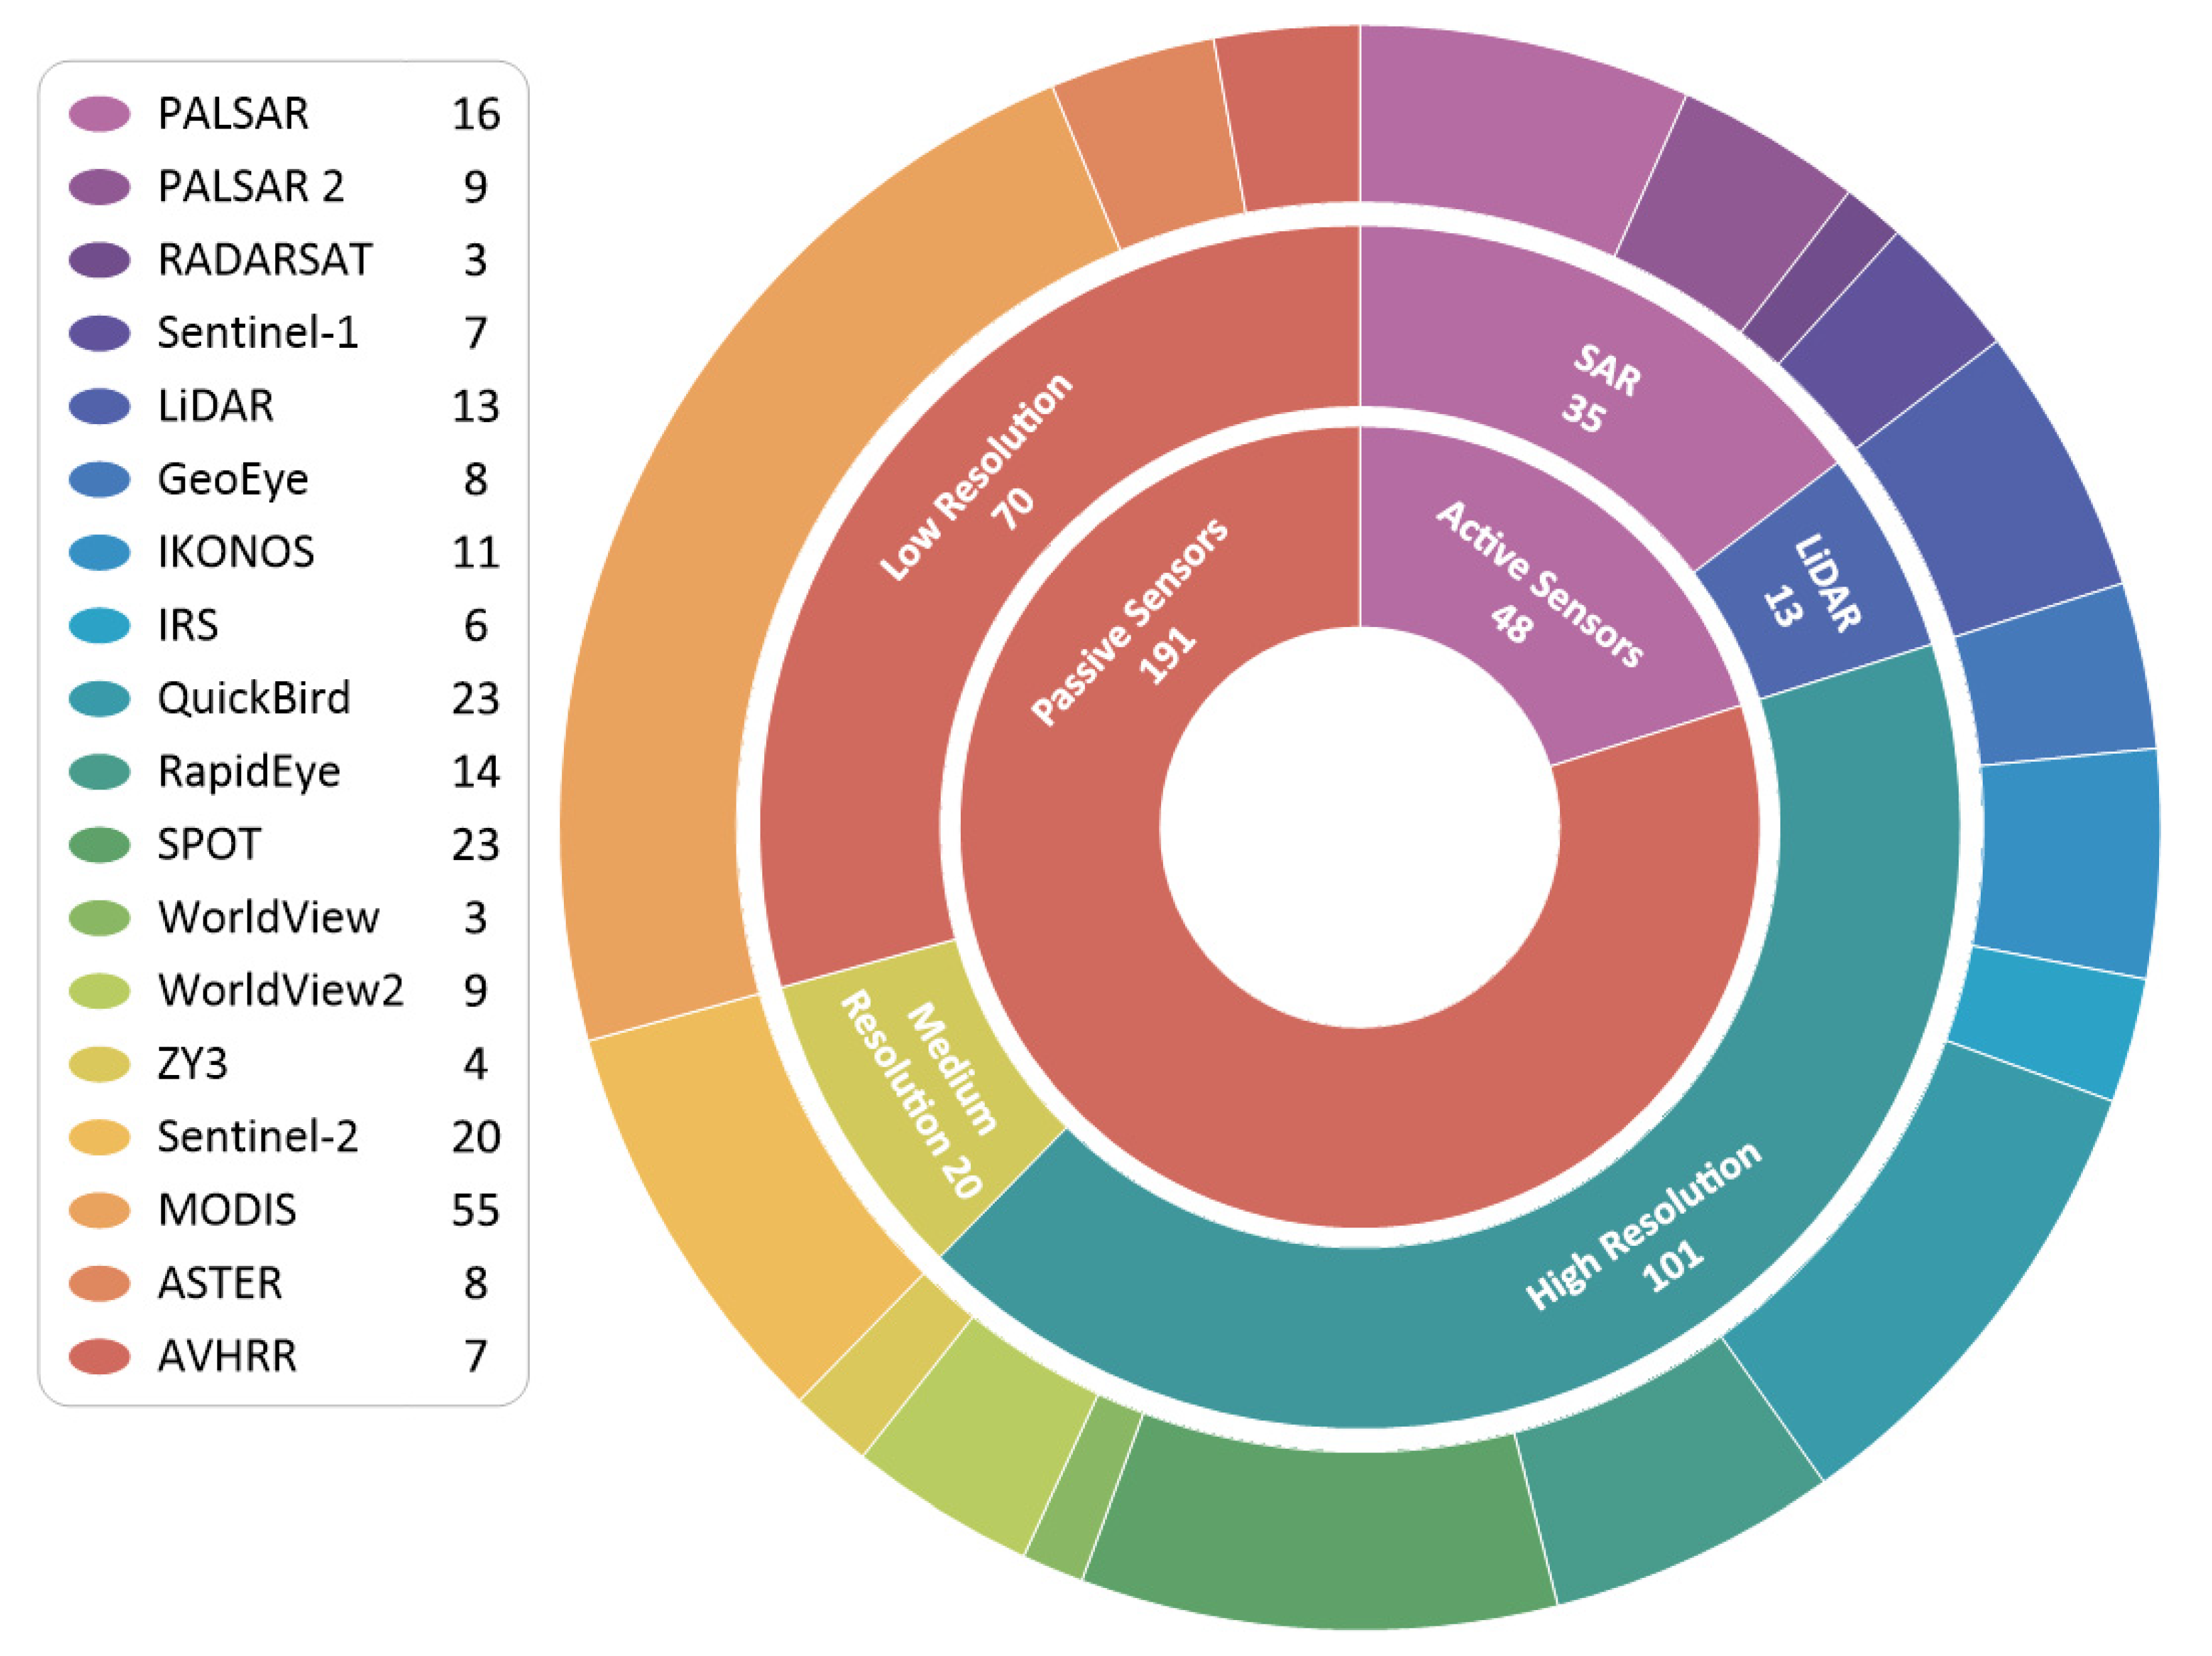
Various sources of Earth observation data can be combined with Landsat data to improve the spatial or temporal resolution of change detection products (see Figure 13). High-resolution satellites are usually used for deriving reference data and image interpretation. Increasingly, Sentinel-2, as a Landsat-like medium resolution EO sensor with higher spatial resolution, is combined with Landsat data for change detection (Figure 13) [72,73,74,75]. With cross-calibration of Landsat 8, Sentinel-2A, and Sentinel-2B, a near-2.5 day global data coverage, an overall increased spatial resolution (from Sentinel), and historical radiometric consistency (from Landsat), can be achieved. However, MODIS data and products are currently the data most often fused with Landsat, totaling 55 studies.
The long revisit cycles, frequent poor atmospheric conditions, and cloudy scenes common in Landsat have restricted its use in detecting rapid changes related to natural hazards and intraseasonal environment varieties. Comparatively, MODIS products have a daily revisit cycle but a coarse spatial resolution and therefore are not suitable for monitoring surface changes within heterogeneous areas. Therefore, combining Landsat and MODIS data is a feasible and more affordable approach to enhance change detection of land surface dynamics. By combining these datasets, both temporal frequency and spatial resolution are improved, contributing vital information for monitoring inter- and intra-annual vegetation phenology, for example. Feng Gao et al. (2006) developed the Spatial and Temporal Adaptive Reflectance Fusion Model (STARFM) to fuse MODIS and Landsat data to enhance both spatial and temporal resolution to better predict daily synthetic surface reflectance [76]. Later on, Zhu et al. (2010) used conversion coefficients to implement an enhanced STARFM (ESTARFM) algorithm to produce more accurate synthetic fine-resolution reflectance products by fusing multisource Earth observation data, especially in mixed-pixel areas [77]. Similarly, the Spatial–Temporal Adaptive Algorithm for Mapping Reflectance Change (STAARCH) uses tasseled cap transformations of both Landsat and MODIS reflectance data to detect vegetated land surface changes. This algorithm requires at least two Landsat images: one at the beginning of the observation time frame and one at the end. The spatial extent of disturbance events is delineated by a change mask, derived from the Landsat pair images. A series of MODIS images determine the date of disturbance [78].
Active sensors such as LiDAR and SAR contribute different information to Landsat change detection studies versus optical data. ALOS-PALSAR is the most used SAR data in Landsat change detection studies [79,80,81]. However, the lack of sustainable SAR data with the required spatial and temporal coverage has generally limited the usage of SAR data in Landsat change detection studies. Sentinel-1 free global 10 m resolution data, though only available from 2014, has great potential for data fusion with Landsat in years to come [82,83,84]. LiDAR data is used in forest and biomass applications to better capture the structure of vegetation and the ground and to improve the accuracy of regional to national models [85,86,87].

4.3. Spatial and Temporal Characteristics

Applications of change detection are expected to increase spatially and temporally over time given the increasing availability of data and computational power. Among the reviewed papers, 99 used all available data, 85 used more than one image per year, 58 used an image for each year, and 248 studies used less than one image per year. As shown in Figure 14, studies using one or more images per year are increasing. Early studies often used pairs of images or a single image for only a limited number of years (e.g., one image for every 5 years), but today, annual or interannual changes such as vegetation phenology are easily monitored. High-frequency Landsat change detection using all available data and dense time series are recently achievable with a cloud computing platform and robust change detection methods [60,88,89].
The use of more frequent data is possible only if the data have a high spatial and radiometric standard, and if preprocessing steps are done using automated methods. Radiometric consistency and the use of surface reflectance data as a physical value are key to avoiding noise in a time series. Increasing the frequency of data applied in research helps to improve the overall accuracy results of Landsat change detection as well (Figure 15). Using more data helps to better distinguish temporary trends, such as separating seasonal changes from permanent changes.
When monitoring change over long periods, the Landsat historical archive is the only option. Figure 14 shows an increasing trend towards studies examining change over longer periods, and multidecade cross-sensor radiometric calibrated data studies have increased during the past years. Amongst the reviewed papers, 14% used MSS data gathered as early as the 1970s, 41% as early as the 1980s, 16% used TM data collected as early as the 1990s, and 29% used other sensors since 2000s in their change analysis. As such, most long-term studies reviewed in this study performed their change detection analysis by data collected since the 1980s. In particular, some studies begin their change analysis in 1982, using data gathered by the Thematic Mapper sensor onboard Landsat-4. However, due to the limited global coverage of Landsat-4, a large number of studies carried out their analysis by data captured since 1984 when Landsat-5 was launched. Landsat-5 is a key point for long-term change detection studies, given its nearly 29-year life span and 30 m spatial resolution, which ensures spatial and spectral compatibility with later Landsat missions. When both TM and ETM+ data were available, many studies preferred TM due to the SLC failure of ETM+ in 2003 and data gaps.
One of the most important challenges involved for studies using time series data over a long time is the accessibility to high quality validation data for evaluating models with early historical records. However, the availability of Landsat-1–Landsat-8 surface reflectance data is useful for this purpose, making long-period studies reliable. In addition, with cross-calibration and Landsat data as a radiometric base point, other sensors can be easily integrated into long-term studies [90].
Improvements to data storage capacity and computational power have led to increasing application of change detection over geographically large study areas (see Figure 14). A study area with a large size allows for a more comprehensive understanding of patterns in land cover within and between regions. Additionally, some applications, such as climate change, are not limited to regional or national scales, but rather are relevant at the scale of the globe. However, there are still many studies covering small areas due to limitations in the amount and quality of reference data, as well as desired accuracy. Notably, of investigated studies over large area only 18% used field-collected reference data, as collecting reference data over large areas is time- and cost-inefficient. Of investigated research, 82% collected reference data in the office from high-resolution images such as Google Earth or existing land cover maps.
Recently, GEE has been one of the major infrastructures for geo-big-data processing. Amongst the studies using GEE, 92 are implemented at a large geographical scale. Parallel geospatial data processing is enabled by Google’s computational infrastructure to reduce computational time. In addition to Landsat-1–Landsat-8, petabytes of other Earth observation data, such as Sentinel 1, 2, 3, 5-P, AVHRR, SRTM DEM, and MODIS, are available within the GEE data catalogue. GEE also provides APIs for JavaScript and Python and a cloud-based integrated development environment (IDE) for scriptwriting and visualizing the data. One of the key features of GEE is the existing ready-to-use packages to simplify coding for both scientific and commercial users [30].

4.4. Preprocessing Stage

Much time and effort were dedicated to the preprocessing stage in early studies. With the developments in specified algorithms for Landsat data and release of Collection 1 and 2, today the preprocessing stage is almost eliminated. As seen in Table 3, we highlighted the trend in preprocessing steps of Landsat change detection studies by categorizing them into automated and user-based strategies.
Geometric correction is one of the key requirements for time series analysis. Small miss-registrations can result in noise, which may be incorrectly attributed as a meaningful change in different algorithms. Additionally, the geometric accuracy of results is required for optimal usage in GIS systems. Geometric corrections have been carried out by users in early applications of Landsat data with a few images. In particular, coregistration was usually done using other maps or images with a reliable geometric accuracy. If ground control points were available, polynomial fitting was done with programming or with the help of commercial software. However, the availability of L1TP Landsat data with less than 12 m RMSE almost eliminated the need for geometric preprocessing of Landsat imagery and as a result, studies using terrain corrected data have increased (see Figure 16).
Atmospheric correction is usually needed in Landsat change detection research due to the influence of different atmospheric conditions across time and space. Early studies used physical radiative transfer models for atmospheric correction, which required information about the atmospheric condition at the time, including humidity, pressure, and sun angle. When this information was not available, relative methods with less accuracy were used. The development of automated atmospheric correction methods for Landsat sensors and processing of Landsat surface reflectance data eliminated the need for atmospheric preprocessing and ensured more reliable change results. As shown in Figure 16, recent studies prefer to use automated atmospheric correction methods or analysis ready data (ARD). From studies that used all available data, 79% applied automated atmospheric correction methods to ensure radiometric consistency through time series.
Early studies usually made efforts to select Landsat images with no or very little cloud coverage, and when necessary, masked cloud/cloud-shadows using manual digitizing or thresholding. However, accessing to annual cloud-free images in some geographical locations can be challenging and even impossible due to nearly permanent cloud cover conditions in some geographic regions. Figure 16 shows an increasing number of studies used automated cloud/cloud-shadow mask algorithms, as studies are increasingly using more frequent-date data. Amongst studies using high-frequency datasets, 76% used automated cloud masking methods. Some studies require annual or seasonal images, and to ensure per pixel quality of data, a composite image must be created from images available within a restricted period of time (e.g., available images in one season). Of investigated studies, 34 used image composite methods, such as best available pixel (BAP), to remove atmospheric effects and cloud/cloud-shadows and to choose the best observation per pixel. Other studies simply picked the median value or maximum of spectral indices (e.g., NDVI) of each pixel to create synthetic seasonal or annual images.

4.5. Landsat Change Detection Methods

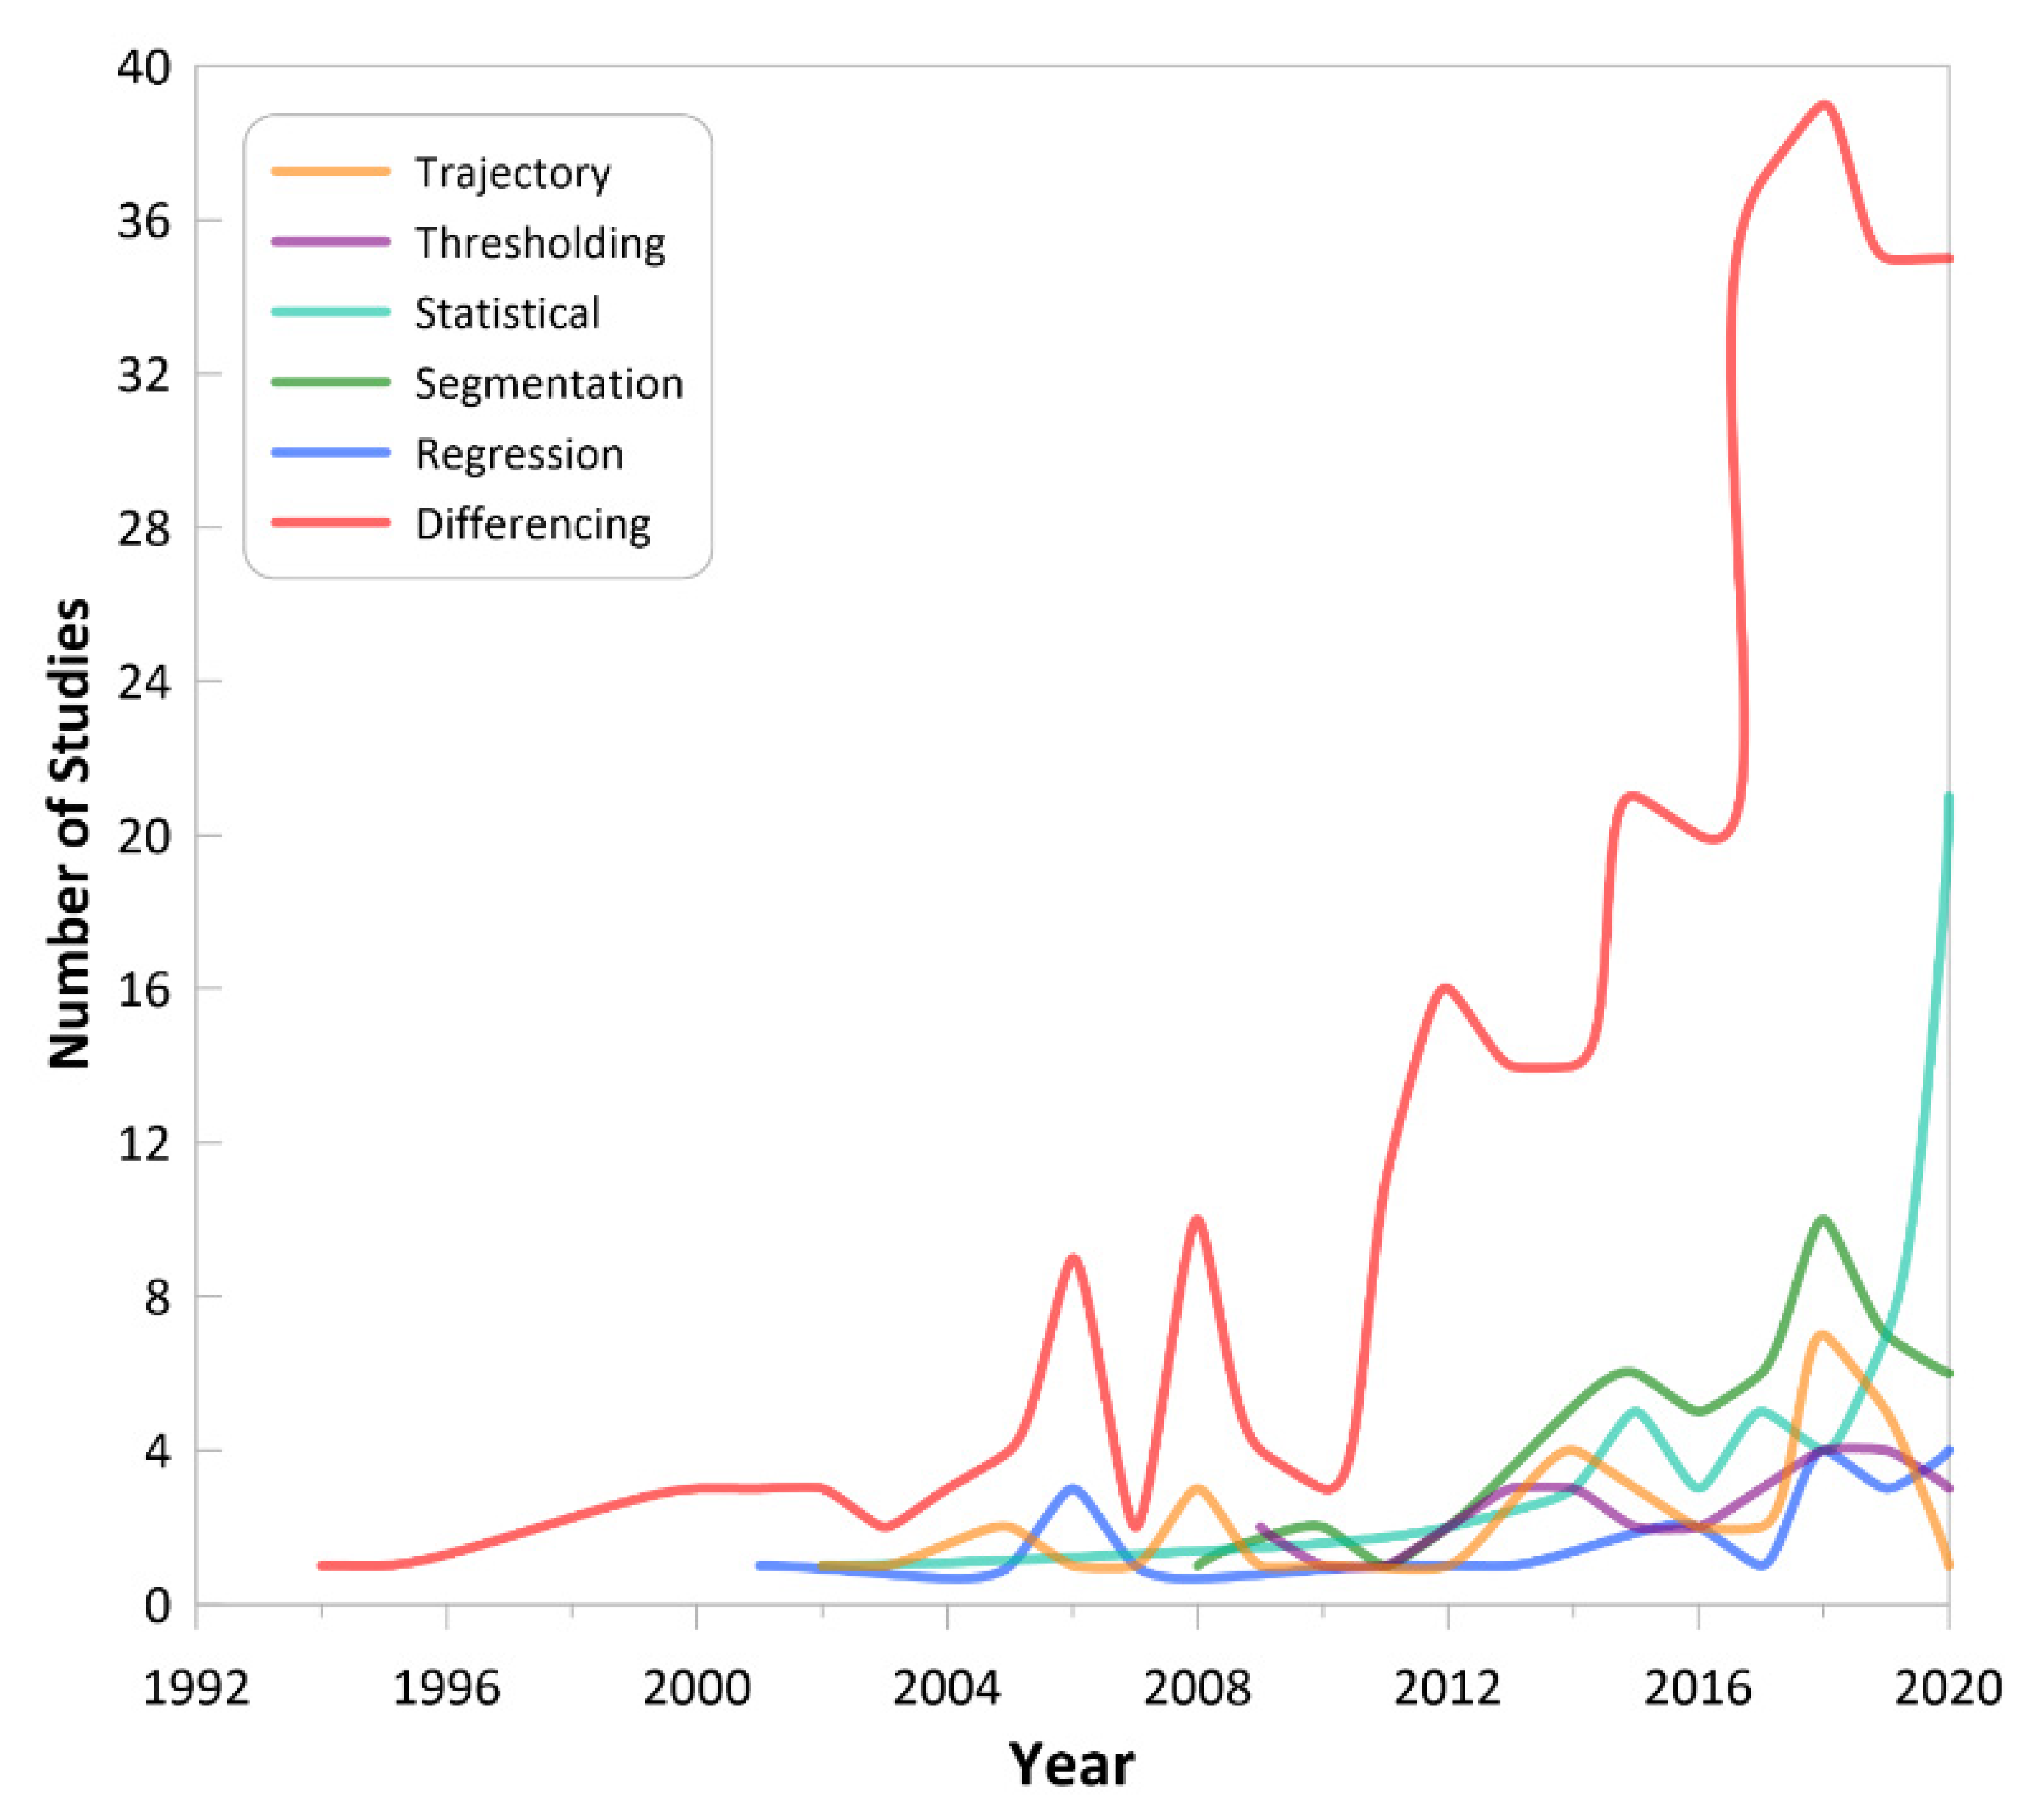
As suggested in a previous review paper [41], Landsat change detection methods can be placed into five categorical approaches. The most common approach is differencing, wherein images at different times are compared to each other across spectral bands or indices, land cover types from post-classification, or endmembers from spectral mixture analysis (SMA; see Figure 17). Post-classification, which is easily implemented and used in 217 studies, is the most used Landsat change detection method and provides “from–to” maps. However, the accuracy of such methods greatly depends on the quality of the final classifications and the availability of substantial amounts of training and testing data needed through the time series.
Thresholding applies a user-defined or estimated threshold to identify changes of a single land cover type. A threshold is usually applied to images transformed into other dimensions sensitive to specific land cover types, such as integrated forest Z-score (IFZ). Trajectory methods identify changes based on prior knowledge of changes and the behavior of trajectories in different change situations. Multidates classification methods are also included in this category.
Statistical, segmentation, and regression methods require larger amounts of data. Regression methods assume linear or nonlinear relationships between time and spectral bands or indices. Segmentation methods use data from the same period in different years and identify changes by breaking a time series into straight lines. Statistical methods are capable of processing all available data and assume that the time series observations follow a statistical model. These approaches apply classification after identifying changes and use harmonic coefficients as input for classification. Trends in different Landsat change detection categories are shown in Figure 17. Differencing methods (mostly post-classification) are the most commonly used approach given their simplicity.
Although the accuracy of change detection methods depends on several factors, such as number of classes, class types, complementary data, study area, and applications, different methods achieve a range of different accuracies (see Figure 18). Statistical methods such as CCDC [60] and BFAST [91] achieved high accuracies using all available data. Post-classification methods have a range of accuracies depending on use of different classification methods. Some methods that used only for a single land cover type, such as the Vegetation Change Tracker (VCT) [92] and LandTrendr [93], used for forest change detection, have demonstrated science and application relevant results.
Although pixel-based algorithms are the most common approaches and have less computational complexity, the number of object-based and subpixel based studies have increased in recent years, which added different levels of information to Landsat change detection results. As demonstrated in Figure 19, a pixel-based approach is preferred for change detection studies because a standard processing chain can be easily defined at the pixel level but not for other processing units, such as objects.
The accuracy of many Landsat change detection products (mostly from post-classification methods) relies on the quality of classification results. Early studies used unsupervised classifiers, wherein the number of classes should be determined before applying some of them, or supervised classifiers, wherein some assumptions about the distribution of data should hold. Although early classifiers were easy to implement, they had less reliable results and required a high amount of training data, which limited the spatial extent of study areas. However, recently, there is an increasing interest in using nonparametric flexible classifiers, which produce more reliable results by holding a fewer assumption compared to parametric approaches (see Figure 19).
With the availability of freely preprocessed data, recent studies prefer to use ARD or surface reflectance physical values, which almost eliminates the preprocessing stage (see Figure 20). Cloud computing platforms allow for the application of change detection analysis over very large study areas. In addition, computational powers allow for the application of state-of-the-art algorithms to solve different prediction problems. As such, several studies use all available data for monitoring abrupt and gradual changes together or composite many images to assure cloud-free annual reliable data.

4.6. Accuracy Assessment

As computational capabilities and algorithms designed for change detection improve over time, an increased need can be seen for the quantity and quality of reference datasets to train models and evaluate the final product. Ideally, change detection accuracy is measured by the juxtaposition of the output map with an isolated set of assessment data. We categorize methods for collecting reference datasets into two main techniques fieldwork- and office-based. Fieldwork often provides high quality and high accuracy training data; however, it is costly and laborious, especially for large-scale studies. Other issues include difficulties associated with accessing to private properties or unreachable terrain. These challenges can be addressed by limiting the sampling area, which reduces flexibility, or by using pre-existing field datasets that rarely match the spatial and temporal scope of the projects.
On the other hand, office-based techniques for collecting ground truth data are an alternative solution to mitigate limitations associated with field campaign. High-resolution satellite or aerial images can be interpreted by a skilled analyst to create validation data. In addition, paper and digital land cover maps from non-remote sensing sources can be used, either to aid interpretation or for use as a validation dataset [94]. Amongst reviewed studies, 131 studies did not report overall accuracy, due to the lack of appropriate reference data, or used other evaluation methods, such as the area under the receiver-operating characteristic curve (AUC) or F-measure. Of those studies that report overall accuracy, 339 studies (77%) used office techniques and 102 studies (23%) used fieldwork to collect assessment datasets (see Figure 21).
Although office-based image interpretation is subjected to some level of uncertainty, these techniques provide the opportunity to view a wider landscape and offer a viewpoint similar to that of the satellite imagery. Office-based image interpretation techniques rely upon the availability of high-resolution images before and after a change event. Google Earth, which was used for validation in 96 studies, provides high-resolution images of world since 2000. Other sources of high-resolution images, such as satellites with high spatial resolution, historical archives of aerial images, and historical land cover maps, can be used for ground truth data collection before that time. However, even with the availability of such data, their quality and quantity over time may not provide enough support for rigorous evaluation protocols [5].
Importantly, visual detection of subtle change targets in high-resolution images, especially in the case of complex change processes, could be challenging. Similarly, it is impossible to detect changes occurring in areas obscured from view, such as under the forest canopy. Although field data are considered a more reliable source of validation data, it can only examine current conditions. Furthermore, a delay between a disturbance and field visitation may cause additional errors. In this review, we compared the overall accuracies derived from these two techniques. Overall result agreement between field- and office-based validation is expected, yet office techniques reported higher overall accuracies. However, questions about the reliability and uncertainty of office-based results remain.

5. Outlook

Landsat change detection is applied in a range of scientific and nonscientific fields, not limited to the remote sensing community. Notable increases in the application of Landsat data in change detection research came as a result of the free data policy in 2008 and developments in cloud computing platforms, such as GEE and AWS. Recent improvements in data standards, computation power, and storage abilities have allowed for the development of algorithms capable of processing large amounts of data. This means Landsat-based change detection research can now be implemented at large geographical and timescales, which were infeasible a decade ago. Future trends will likely rely on the use of multiple sources of data and the virtual constellation comprising of Landsat-8, -9, and the Sentinel satellites.

5.1. Preprocessing and Data Fusion

In earlier studies, the preprocessing stage was important for the appropriate use of Landsat data and as a result, a large proportion of time and resources were dedicated to this step. Miss-registration between images was an early and major source of error in Landsat-based methods, and much effort was dedicated to the geometric correction of images. Additionally, radiative models required information about the atmospheric condition during the time of image collection and relative methods were not accurate enough. Today, however, the availability of the Landsat Collection 2 data has almost eliminated the need for extensive preprocessing, thus contributing to an increased application of Landsat data.
Similarly, clouds and other anomalies common in time series are no longer considered major problem, given developments in cloud masking and composite image methods that ensure cloud-free time series or annual images, such as pixel-based image compositing. For example, White et al. (2014) developed the best-available-pixel (BAP) method for creating image composites over large-areas. This method does not rely on a scene-based analysis, but rather assigns an overall score to each pixel within an image stack based on the distance to clouds, cloud shadow, opacity, sensor, and day of the year [95]. Then a pixel with the highest overall score is chosen for the composite image for a specific period or a limited phenological window. This method can provide annual, multiyear, and proxy-value composite images.
Given improvements in the standards of Landsat data, there has been a great focus on multisensor studies that combine different sources of information to improve overall results. For example, the fusion of high-frequency MODIS data with relatively higher spatial resolution Landsat data allows for the extraction of greater detail in highly dynamic situations [96]. Similarly, radiometrically consistent Landsat data can be fused with Sentinel-2 data, which has a higher spatial resolution [97]. A detailed review is available on recent applications of Landsat-8 and Sentinel-2 with both pixel-based and geographical object-based approaches. Application of conventional vegetation indexes for phenology-based LULC classification is illustrated and challenges to deal with Landsat–Sentinel’s data integration and geo-big-data is highlighted [98]. The fusion of Landsat data with active sensors, such as SAR and LiDAR, can also provide new information to change detection. Unfortunately, there is no uninterrupted freely available SAR data archive that matches the historic extent of Landsat; however, PALSAR 1 and 2 data have been frequently used in multisource studies applying optical and radar data together. Likewise, a synergistic use of Sentinel-1 and Landsat-8 [84] for change detection analysis represents great opportunities for future studies.

5.2. Methods and Applications

Only abrupt land cover changes were detectable with early bi-temporal change detection methods and binary change maps were the only products, as interannual changes were not the main concern. In addition, change detection implementation constituted an independent stage after classification, when comparing land cover classes at different times. Today, different change targets are detectable, resulting from abrupt changes such as natural disasters or gradual changes such as shifts in vegetation phenology. New studies tend to use more data than before and in general, there are an increasing number of studies that used all available data. These studies implemented methods that enabled the detection of changes in near real-time. Although five studies in our database used neural networks, a few studies applied deep learning techniques for Landsat change detection. Lyu et al. (2018) used RNN-based transfer-learning to detect annual urban changes from 1984 to 2016 [69]. The feature representations learned from a few training samples were directly transferred to new target images by combining transfer learning and RNN. The lack of long-term training data, especially in large-scale studies, limited the usage of deep learning techniques. Advanced flexible classifiers have been frequently used and time series change metrics have become an input for the classification of types of land cover changes. The sustainability of Landsat data resulted in the inclusion of Landsat change detection products in many international agreements and plans. A vast majority of applications using Landsat change detection and the results have become a reference point for comparison with products from other sensors or non-remote sensing methods. With the availability of cloud computing platforms, large-scale global products have been increasingly available. The current availability of different data sources caused that recent studies mostly focus on specific applications and the development of new methods for these applications.

5.3. Evaluation and Reference Data

Despite the development of different methods and indices, minimal changes have been applied to accuracy assessment methods over the past several years. The confusion matrix remains as the most common accuracy assessment method. However, validating a time series is still a challenging task, and it is unclear whether all results within a time series should be validated, or a robust single year validation is adequate. Collecting reference data for Landsat change detection is another challenge, due to spatial and temporal roadblocks. Because reference data are used for training and evaluation, there is a need to have a suitable spatial and temporal reference data distribution.
Although reference data can be collected for studies covering large areas using office-based techniques and through sampling from high-resolution images or land cover for a single timeframe, collecting reference data for long period studies remains a problem. Reference data from Google Earth imagery are only available since 2000 and historical aerial photos and/or land cover maps are not usually available. However, there are alternative approaches to address the reference data problem, such as cross-validation [99], bootstrapping [100], interpretation-guided classification with nested segmentation [101], crowdsourced land cover [102], open land use map [103], volunteered geographic information [104], and deep learning network to filter and classify volunteered photographs [105]. A potential solution to the reference data issue would be the generation of a freely available global reference dataset, collected by governments and other users sharing data from previous studies or historical maps and photos. Comparison between office-based techniques and field visits shows that change target and magnitude are the best indicators of whether a field validation is required or not. Most change types derived from Landsat data can be validated adequately using office interpretation [94].

5.4. Future Work and Landsat 9

The remote sensing field is growing exponentially. In response, commercial companies have launched cube satellites with remarkable spatial and temporal resolutions at the expense of low orbital stability and radiometric consistency. In addition to Landsat’s deep historical archive, Landsat data can act as a radiometric reference, thus mitigating the limitations of data collected by cube satellites. Currently, the application of data acquired by these new satellites has been relatively limited, largely due to price, but remains a potential avenue for future work. This can be more feasible if and when these datasets become more easily accessible.
In recent years, cloud platforms have been developed with a focus on planetary-scale products and applications. Most of these platforms rely on free availability of data collected by sensors such as Landsat. However, due to costs and policies, many of these cloud platforms are not commonly used in studies. The inclusion of regional, national, and local reference data sets in these platforms would be of great support to up-and-coming projects.
Landsat-9 is planned to be launched in September 2021 and will provide long-term data production (sustainability), meet the Landsat archive performance standard for monitoring decadal landscape changes (continuity), and continue the long-running Landsat observational record (reliability). Landsat-9 will take the orbital place of Landsat-7, continuing the trend of 8 days of data provision with Landsat-8. Landsat-9 shares many similarities with Landsat-8, including spatial resolution and a sun-synchronous orbit. There are, however, some significant improvements and enhancements. Similar to Landsat-8, Landsat-9 is required to provide at least 400 scenes per day to USGS. However, the collection of as many as ~740 scenes per day is supported by a 4 Tb onboard data recorder and a ground system, designed to allow for control of Landsat-9 in orbit and manage data transmission. The major updates of Landsat-9 are to the OLI-2 and TIRS-2 sensors. OLI-2 data will be downlinked with the full 14-bit radiometric resolution, improving the signal-to-noise ratio in darker areas. The TIRS-2 absolute radiometric accuracy is improved, and the scene-select mirror mechanism has been redesigned for more precise geolocation. Both sensors and the spacecraft were designed with five-year lifetimes. However, consumable resources carried by Landsat-9 are sufficient for 10 years of operation, which is only feasible if the satellite survives its early operation stage.
The Landsat Collection 2 became available in December 2020 and prior to the launch of Landsat-9, representing the second major reprocessing of the Landsat data archive. Collection 2 offers improved geometric accuracy by joining ground control points with Copernicus Sentinel-2 global reference images. Additionally, Collection 2 benefits from updated 3-arc-second digital elevation modeling and radiometric improvements of some satellites. Collection 2 will also provide per-pixel quality assurance (QA) bands shared by Collection 1, including cloud and cloud shadow confidence, snow and ice confidence, radiometric saturation, and terrain occlusion, with the addition of surface reflectance aerosol and surface temperature QA bands. After the public release of Collection 2, Collection 1 will remain accessible for at least one year and Landsat-9 data will be processed only into Collection 2. It is worth noting that Landsat-4–Landsat-9 Collection 2 will include single-channel atmospheric compensation for surface temperature products to ensure time series consistency. However, Landsat-8 and Landsat-9 dual separated thermal channels grow expectations for future Collection 3 reprocessing to enable atmospheric correction via split-window technique [54].
Landsat Collection 2 surface reflectance/temperature products, as the best input for change detection studies, will be available in 25–27 days after Landsat-7 and 15–17 days after Landsat-8 data acquisition. This processing timeline is expected to be reduced to 3 days for Landsat-9 Collection 2 Level-2 products. This will offer more opportunities for near real-time land change detection analysis and other new applications. In addition, 2–3 days temporal frequency will be provided by a combined virtual constellation of Sentinel-2A and B with Landsat-8 and Landsat-9. This MODIS-like revisit cycle with medium spatial resolution will enable researchers and decision-makers to augment the utilization of these data and detect frequent and complex changes to the environment and global ecosystem.

Author Contributions

Conceptualization, M.M., M.H. (Mahdi Hasanlou), M.H. (MohammadAli Hemati), F.M.; Supervision, M.H. (Mahdi Hasanlou), M.M.; Formal Analysis, M.H. (MohammadAli Hemati), M.M.; Data Collection, M.H. (MohammadAli Hemati); Visualization, M.H. (MohammadAli Hemati), M.M.; Writing—Original Draft Preparation, M.H. (MohammadAli Hemati), M.M.; Writing—Review & Editing, M.M., M.H. (Mahdi Hasanlou), F.M.; Funding Acquisition: M.M. All authors have read and agreed to the published version of the manuscript.

Funding

This research was funded by Natural Resources Canada under Grant (NRCan-3000694092) to M. Mahdianpari.

Data Availability Statement

Not appliable.

Acknowledgments

The authors wish to thank Michael A. Wulder, of the Canadian Forest Service, for providing valuable feedback on an earlier version of this review.

Conflicts of Interest

The authors declare no conflict of interest.

References

  1. Meyer, W.B.; Turner II, B.L. Human Population Growth and Global Land-Use/Cover Change. Annu. Rev. Ecol. Syst. 1992, 23, 39–61. [Google Scholar] [CrossRef]
  2. Foley, J.A. Global Consequences of Land Use. Science 2005, 309, 570–574. [Google Scholar] [CrossRef] [Green Version]
  3. Evenson, R.E. Assessing the Impact of the Green Revolution, 1960 to 2000. Science 2003, 300, 758–762. [Google Scholar] [CrossRef] [Green Version]
  4. Song, X.-P.; Hansen, M.C.; Stehman, S.V.; Potapov, P.V.; Tyukavina, A.; Vermote, E.F.; Townshend, J.R. Global Land Change from 1982 to 2016. Nature 2018, 560, 639–643. [Google Scholar] [CrossRef] [PubMed]
  5. Wulder, M.A.; Coops, N.C.; Roy, D.P.; White, J.C.; Hermosilla, T. Land Cover 2.0. Int. J. Remote Sens. 2018, 39, 4254–4284. [Google Scholar] [CrossRef] [Green Version]
  6. Bonan, G.B.; Doney, S.C. Climate, Ecosystems, and Planetary Futures: The Challenge to Predict Life in Earth System Models. Science 2018, 359, eaam8328. [Google Scholar] [CrossRef] [Green Version]
  7. Turner, B.L.; Lambin, E.F.; Reenberg, A. The Emergence of Land Change Science for Global Environmental Change and Sustainability. Proc. Natl. Acad. Sci. USA 2007, 104, 20666–20671. [Google Scholar] [CrossRef] [PubMed] [Green Version]
  8. Le Quéré, C.; Andrew, R.M.; Canadell, J.G.; Sitch, S.; Korsbakken, J.I.; Peters, G.P.; Manning, A.C.; Boden, T.A.; Tans, P.P.; Houghton, R.A.; et al. Global Carbon Budget 2016. Data Algorithms Models 2016, 8, 605–649. [Google Scholar] [CrossRef] [Green Version]
  9. Wulder, M.A.; Loveland, T.R.; Roy, D.P.; Crawford, C.J.; Masek, J.G.; Woodcock, C.E.; Allen, R.G.; Anderson, M.C.; Belward, A.S.; Cohen, W.B.; et al. Current Status of Landsat Program, Science, and Applications. Remote Sens. Environ. 2019, 225, 127–147. [Google Scholar] [CrossRef]
  10. Griffiths, P.; Kuemmerle, T.; Baumann, M.; Radeloff, V.C.; Abrudan, I.V.; Lieskovsky, J.; Munteanu, C.; Ostapowicz, K.; Hostert, P. Forest Disturbances, Forest Recovery, and Changes in Forest Types across the Carpathian Ecoregion from 1985 to 2010 Based on Landsat Image Composites. Remote Sens. Environ. 2014, 151, 72–88. [Google Scholar] [CrossRef]
  11. Healey, S.P.; Cohen, W.B.; Yang, Z.; Kenneth Brewer, C.; Brooks, E.B.; Gorelick, N.; Hernandez, A.J.; Huang, C.; Joseph Hughes, M.; Kennedy, R.E.; et al. Mapping Forest Change Using Stacked Generalization: An Ensemble Approach. Remote Sens. Environ. 2018, 204, 717–728. [Google Scholar] [CrossRef]
  12. Hermosilla, T.; Wulder, M.A.; White, J.C.; Coops, N.C.; Hobart, G.W. Disturbance-Informed Annual Land Cover Classification Maps of Canada’s Forested Ecosystems for a 29-Year Landsat Time Series. Can. J. Remote Sens. 2018, 44, 67–87. [Google Scholar] [CrossRef]
  13. Kennedy, R.E.; Townsend, P.A.; Gross, J.E.; Cohen, W.B.; Bolstad, P.; Wang, Y.Q.; Adams, P. Remote Sensing Change Detection Tools for Natural Resource Managers: Understanding Concepts and Tradeoffs in the Design of Landscape Monitoring Projects. Remote Sens. Environ. 2009, 113, 1382–1396. [Google Scholar] [CrossRef]
  14. White, J.C.; Wulder, M.A.; Hermosilla, T.; Coops, N.C.; Hobart, G.W. A Nationwide Annual Characterization of 25 Years of Forest Disturbance and Recovery for Canada Using Landsat Time Series. Remote Sens. Environ. 2017, 194, 303–321. [Google Scholar] [CrossRef]
  15. Hansen, M.C.; Potapov, P.V.; Moore, R.; Hancher, M.; Turubanova, S.A.; Tyukavina, A.; Thau, D.; Stehman, S.V.; Goetz, S.J.; Loveland, T.R.; et al. High-Resolution Global Maps of 21st-Century Forest Cover Change. Science 2013, 342, 850–853. [Google Scholar] [CrossRef] [PubMed] [Green Version]
  16. Sexton, J.O.; Song, X.-P.; Feng, M.; Noojipady, P.; Anand, A.; Huang, C.; Kim, D.-H.; Collins, K.M.; Channan, S.; DiMiceli, C.; et al. Global, 30-m Resolution Continuous Fields of Tree Cover: Landsat-Based Rescaling of MODIS Vegetation Continuous Fields with Lidar-Based Estimates of Error. Int. J. Digit. Earth 2013, 6, 427–448. [Google Scholar] [CrossRef] [Green Version]
  17. Townshend, J.R.; Masek, J.G.; Huang, C.; Vermote, E.F.; Gao, F.; Channan, S.; Sexton, J.O.; Feng, M.; Narasimhan, R.; Kim, D.; et al. Global Characterization and Monitoring of Forest Cover Using Landsat Data: Opportunities and Challenges. Int. J. Digit. Earth 2012, 5, 373–397. [Google Scholar] [CrossRef] [Green Version]
  18. GCOS The Global Observing System for Climate: Implementation Needs. Available online: https://unfccc.int/files/science/workstreams/systematic_observation/application/pdf/gcos_ip_10oct2016.pdf (accessed on 23 September 2020).
  19. Potapov, P.; Hansen, M.C.; Gerrand, A.M.; Lindquist, E.J.; Pittman, K.; Turubanova, S.; Løyche Wilkie, M. The Global Landsat Imagery Database for the FAO FRA Remote Sensing Survey. Int. J. Digit. Earth 2011, 4, 2–21. [Google Scholar] [CrossRef]
  20. Belward, A.S.; Skøien, J.O. Who Launched What, When and Why; Trends in Global Land-Cover Observation Capacity from Civilian Earth Observation Satellites. ISPRS J. Photogramm. Remote Sens. 2015, 103, 115–128. [Google Scholar] [CrossRef]
  21. Woodcock, C.E.; Allen, R.; Anderson, M.; Belward, A.; Bindschadler, R.; Cohen, W.; Gao, F.; Goward, S.N.; Helder, D.; Helmer, E.; et al. Free Access to Landsat Imagery. Science 2008, 320, 1011a. [Google Scholar] [CrossRef]
  22. Wulder, M.A.; Masek, J.G.; Cohen, W.B.; Loveland, T.R.; Woodcock, C.E. Opening the Archive: How Free Data Has Enabled the Science and Monitoring Promise of Landsat. Remote Sens. Environ. 2012, 122, 2–10. [Google Scholar] [CrossRef]
  23. Zhu, Z.; Wulder, M.A.; Roy, D.P.; Woodcock, C.E.; Hansen, M.C.; Radeloff, V.C.; Healey, S.P.; Schaaf, C.; Hostert, P.; Strobl, P.; et al. Benefits of the Free and Open Landsat Data Policy. Remote Sens. Environ. 2019, 224, 382–385. [Google Scholar] [CrossRef]
  24. Wulder, M.A.; White, J.C.; Loveland, T.R.; Woodcock, C.E.; Belward, A.S.; Cohen, W.B.; Fosnight, E.A.; Shaw, J.; Masek, J.G.; Roy, D.P. The Global Landsat Archive: Status, Consolidation, and Direction. Remote Sens. Environ. 2016, 185, 271–283. [Google Scholar] [CrossRef] [Green Version]
  25. Dwyer, J.L.; Roy, D.P.; Sauer, B.; Jenkerson, C.B.; Zhang, H.K.; Lymburner, L. Analysis Ready Data: Enabling Analysis of the Landsat Archive. Remote Sens. 2018, 10, 1363. [Google Scholar] [CrossRef]
  26. Masek, J.G.; Vermote, E.F.; Saleous, N.E.; Wolfe, R.; Hall, F.G.; Huemmrich, K.F.; Gao, F.; Kutler, J.; Lim, T.-K. A Landsat Surface Reflectance Dataset for North America, 1990–2000. IEEE Geosci. Remote Sens. Lett. 2006, 3, 68–72. [Google Scholar] [CrossRef]
  27. Zhu, Z.; Woodcock, C.E. Object-Based Cloud and Cloud Shadow Detection in Landsat Imagery. Remote Sens. Environ. 2012, 118, 83–94. [Google Scholar] [CrossRef]
  28. Coppin, P.; Jonckheere, I.; Nackaerts, K.; Muys, B.; Lambin, E. Review ArticleDigital Change Detection Methods in Ecosystem Monitoring: A Review. Int. J. Remote Sens. 2004, 25, 1565–1596. [Google Scholar] [CrossRef]
  29. Hecheltjen, A.; Thonfeld, F.; Menz, G. Recent Advances in Remote Sensing Change Detection—A Review. In Land Use and Land Cover Mapping in Europe; Manakos, I., Braun, M., Eds.; Remote Sensing and Digital Image Processing; Springer: Dordrecht, The Netherlands, 2014; Volume 18, pp. 145–178. ISBN 978-94-007-7968-6. [Google Scholar]
  30. Gorelick, N.; Hancher, M.; Dixon, M.; Ilyushchenko, S.; Thau, D.; Moore, R. Google Earth Engine: Planetary-Scale Geospatial Analysis for Everyone. Remote Sens. Environ. 2017, 202, 18–27. [Google Scholar] [CrossRef]
  31. Jackson, K.R.; Ramakrishnan, L.; Muriki, K.; Canon, S.; Cholia, S.; Shalf, J.; Wasserman, H.J.; Wright, N.J. Performance Analysis of High Performance Computing Applications on the Amazon Web Services Cloud. In Proceedings of the 2010 IEEE Second International Conference on Cloud Computing Technology and Science, Indianapolis, IN, USA, 30 November–3 December 2010; pp. 159–168. [Google Scholar]
  32. Nemani, R. Nasa Earth Exchange: Next Generation Earth Science Collaborative. Int. Arch. Photogramm. Remote Sens. Spat. Inf. Sci. 2012, XXXVIII-8/W20, 17. [Google Scholar] [CrossRef] [Green Version]
  33. Tamiminia, H.; Salehi, B.; Mahdianpari, M.; Quackenbush, L.; Adeli, S.; Brisco, B. Google Earth Engine for Geo-Big Data Applications: A Meta-Analysis and Systematic Review. ISPRS J. Photogramm. Remote Sens. 2020, 164, 152–170. [Google Scholar] [CrossRef]
  34. Strauss, M. Flotilla of Tiny Satellites Will Photograph the Entire Earth Every Day. 2017. Available online: https://www.sciencemag.org/news/2017/02/flotilla-tiny-satellites-will-photograph-entire-earth-every-day (accessed on 12 August 2020).
  35. Helder, D.; Anderson, C.; Beckett, K.; Houborg, R.; Zuleta, I.; Boccia, V.; Clerc, S.; Kuester, M.; Markham, B.; Pagnutti, M. Observations and Recommendations for Coordinated Calibration Activities of Government and Commercial Optical Satellite Systems. Remote Sens. 2020, 12, 2468. [Google Scholar] [CrossRef]
  36. Wulder, M.A.; Hilker, T.; White, J.C.; Coops, N.C.; Masek, J.G.; Pflugmacher, D.; Crevier, Y. Virtual Constellations for Global Terrestrial Monitoring. Remote Sens. Environ. 2015, 170, 62–76. [Google Scholar] [CrossRef] [Green Version]
  37. Claverie, M.; Ju, J.; Masek, J.G.; Dungan, J.L.; Vermote, E.F.; Roger, J.-C.; Skakun, S.V.; Justice, C. The Harmonized Landsat and Sentinel-2 Surface Reflectance Data Set. Remote Sens. Environ. 2018, 219, 145–161. [Google Scholar] [CrossRef]
  38. Li, J.; Chen, B. Global Revisit Interval Analysis of Landsat-8-9 and Sentinel-2A-2B Data for Terrestrial Monitoring. Sensors 2020, 20, 6631. [Google Scholar] [CrossRef]
  39. Boriah, S. Time Series Change Detection: Algorithms for Land Cover Change. Ph.D. Thesis, University of Minnesota, Minneapolis, MN, USA, 2010. [Google Scholar]
  40. Lu, D.; Mausel, P.; Brondízio, E.; Moran, E. Change Detection Techniques. Int. J. Remote Sens. 2004, 25, 2365–2401. [Google Scholar] [CrossRef]
  41. Zhu, Z. Change Detection Using Landsat Time Series: A Review of Frequencies, Preprocessing, Algorithms, and Applications. ISPRS J. Photogramm. Remote Sens. 2017, 130, 370–384. [Google Scholar] [CrossRef]
  42. Mack, P.E. Viewing the Earth: The Social Construction of the Landsat Satellite System (Inside Technology). Available online: https://www.amazon.com/Viewing-Earth-Construction-Satellite-Technology/dp/0262132591 (accessed on 5 August 2020).
  43. Pecora, W. Earth Resources Observation Satellite (EROS). Available online: https://scholar.google.com/scholar_lookup?title=Earth%20Resources%20Observation%20Satellite%20(EROS)%3A%20A%20Department%20of%20Interior%20Program%20to%20Utilize%20Space-acquired%20Data%20for%20Natural%20and%20Human%20Resource%20Management&author=W.T.%20Pecora&publication_year=1966 (accessed on 5 August 2020).
  44. Wu, Z.; Snyder, G.; Vadnais, C.; Arora, R.; Babcock, M.; Stensaas, G.; Doucette, P.; Newman, T. User Needs for Future Landsat Missions. Remote Sens. Environ. 2019, 231, 111214. [Google Scholar] [CrossRef]
  45. Townshend, J.R.G.; Justice, C.O. Selecting the Spatial Resolution of Satellite Sensors Required for Global Monitoring of Land Transformations. Int. J. Remote Sens. 1988, 9, 187–236. [Google Scholar] [CrossRef]
  46. Goward, S.N.; Arvidson, T.; Johnston, S.S.; Laura, E.P.R. Landsat’s Enduring Legacy: Pioneering Global Land Observations from Space; ASPRS: Bethesda, MD, USA, 2017. [Google Scholar]
  47. Drusch, M.; Del Bello, U.; Carlier, S.; Colin, O.; Fernandez, V.; Gascon, F.; Hoersch, B.; Isola, C.; Laberinti, P.; Martimort, P.; et al. Sentinel-2: ESA’s Optical High-Resolution Mission for GMES Operational Services. Remote Sens. Environ. 2012, 120, 25–36. [Google Scholar] [CrossRef]
  48. Li, J.; Roy, D.P. A Global Analysis of Sentinel-2A, Sentinel-2B and Landsat-8 Data Revisit Intervals and Implications for Terrestrial Monitoring. Remote Sens. 2017, 9, 902. [Google Scholar] [CrossRef] [Green Version]
  49. Skakun, S.; Roger, J.-C.; Vermote, E.F.; Masek, J.G.; Justice, C.O. Automatic Sub-Pixel Co-Registration of Landsat-8 Operational Land Imager and Sentinel-2A Multi-Spectral Instrument Images Using Phase Correlation and Machine Learning Based Mapping. Int. J. Digit. Earth 2017, 10, 1253–1269. [Google Scholar] [CrossRef] [PubMed]
  50. Storey, J.; Roy, D.P.; Masek, J.; Gascon, F.; Dwyer, J.; Choate, M. A Note on the Temporary Misregistration of Landsat-8 Operational Land Imager (OLI) and Sentinel-2 Multi Spectral Instrument (MSI) Imagery. Remote Sens. Environ. 2016, 186, 121–122. [Google Scholar] [CrossRef] [Green Version]
  51. Yan, L.; Roy, D.P.; Zhang, H.; Li, J.; Huang, H. An Automated Approach for Sub-Pixel Registration of Landsat-8 Operational Land Imager (OLI) and Sentinel-2 Multi Spectral Instrument (MSI) Imagery. Remote Sens. 2016, 8, 520. [Google Scholar] [CrossRef] [Green Version]
  52. Wulder, M.A.; White, J.C.; Goward, S.N.; Masek, J.G.; Irons, J.R.; Herold, M.; Cohen, W.B.; Loveland, T.R.; Woodcock, C.E. Landsat Continuity: Issues and Opportunities for Land Cover Monitoring. Remote Sens. Environ. 2008, 112, 955–969. [Google Scholar] [CrossRef]
  53. Irons, J.R. Requirements for a Landsat Data Continuity Mission. Available online: https://www.researchgate.net/publication/281526641_Requirements_for_a_Landsat_Data_Continuity_Mission (accessed on 6 August 2020).
  54. Masek, J.G.; Wulder, M.A.; Markham, B.; McCorkel, J.; Crawford, C.J.; Storey, J.; Jenstrom, D.T. Landsat 9: Empowering Open Science and Applications through Continuity. Remote Sens. Environ. 2020, 248, 111968. [Google Scholar] [CrossRef]
  55. Straub, C.L.; Koontz, S.R.; Loomis, J.B. Economic Valuation of Landsat Imagery; Open-File Report; U.S. Geological Survey: Reston, VA, USA, 2019; Volume 2019–1112.
  56. Goward, S.; Arvidson, T.; Williams, D.; Faundeen, J.; Irons, J.; Franks, S. Historical Record of Landsat Global Coverage. Photogramm. Eng. Remote Sens. 2006, 72, 1155–1169. [Google Scholar] [CrossRef]
  57. Markham, B.L.; Storey, J.C.; Williams, D.L.; Irons, J.R. Landsat Sensor Performance: History and Current Status. IEEE Trans. Geosci. Remote Sens. 2004, 42, 2691–2694. [Google Scholar] [CrossRef]
  58. Song, C.; Woodcock, C.E.; Seto, K.C.; Lenney, M.P.; Macomber, S.A. Classification and Change Detection Using Landsat TM Data: When and How to Correct Atmospheric Effects? Remote Sens. Environ. 2001, 75, 230–244. [Google Scholar] [CrossRef]
  59. Hermosilla, T.; Wulder, M.A.; White, J.C.; Coops, N.C.; Hobart, G.W. An Integrated Landsat Time Series Protocol for Change Detection and Generation of Annual Gap-Free Surface Reflectance Composites. Remote Sens. Environ. 2015, 158, 220–234. [Google Scholar] [CrossRef]
  60. Zhu, Z.; Woodcock, C.E. Continuous Change Detection and Classification of Land Cover Using All Available Landsat Data. Remote Sens. Environ. 2014, 144, 152–171. [Google Scholar] [CrossRef] [Green Version]
  61. Moher, D.; Liberati, A.; Tetzlaff, J.; Altman, D.G. The PRISMA Group Preferred Reporting Items for Systematic Reviews and Meta-Analyses: The PRISMA Statement. PLoS Med. 2009, 6, e1000097. [Google Scholar] [CrossRef] [PubMed] [Green Version]
  62. Abercrombie, S.P.; Friedl, M.A. Improving the Consistency of Multitemporal Land Cover Maps Using a Hidden Markov Model. IEEE Trans. Geosci. Remote Sens. 2016, 54, 703–713. [Google Scholar] [CrossRef]
  63. Gómez, C.; White, J.C.; Wulder, M.A. Optical Remotely Sensed Time Series Data for Land Cover Classification: A Review. ISPRS J. Photogramm. Remote Sens. 2016, 116, 55–72. [Google Scholar] [CrossRef] [Green Version]
  64. Pickens, A.H.; Hansen, M.C.; Hancher, M.; Stehman, S.V.; Tyukavina, A.; Potapov, P.; Marroquin, B.; Sherani, Z. Mapping and Sampling to Characterize Global Inland Water Dynamics from 1999 to 2018 with Full Landsat Time-Series. Remote Sens. Environ. 2020, 243, 111792. [Google Scholar] [CrossRef]
  65. Kleinschroth, F.; Winton, R.S.; Calamita, E.; Niggemann, F.; Botter, M.; Wehrli, B.; Ghazoul, J. Living with Floating Vegetation Invasions. Ambio 2020. [Google Scholar] [CrossRef]
  66. Potapov, P.; Hansen, M.C.; Kommareddy, I.; Kommareddy, A.; Turubanova, S.; Pickens, A.; Adusei, B.; Tyukavina, A.; Ying, Q. Landsat Analysis Ready Data for Global Land Cover and Land Cover Change Mapping. Remote Sens. 2020, 12, 426. [Google Scholar] [CrossRef] [Green Version]
  67. Ying, Q.; Hansen, M.C.; Potapov, P.V.; Tyukavina, A.; Wang, L.; Stehman, S.V.; Moore, R.; Hancher, M. Global Bare Ground Gain from 2000 to 2012 Using Landsat Imagery. Remote Sens. Environ. 2017, 194, 161–176. [Google Scholar] [CrossRef] [Green Version]
  68. Midekisa, A.; Holl, F.; Savory, D.J.; Andrade-Pacheco, R.; Gething, P.W.; Bennett, A.; Sturrock, H.J.W. Mapping Land Cover Change over Continental Africa Using Landsat and Google Earth Engine Cloud Computing. PLoS ONE 2017, 12, e0184926. [Google Scholar] [CrossRef]
  69. Lyu, H.; Lu, H.; Mou, L.; Li, W.; Wright, J.; Li, X.; Li, X.; Zhu, X.; Wang, J.; Yu, L.; et al. Long-Term Annual Mapping of Four Cities on Different Continents by Applying a Deep Information Learning Method to Landsat Data. Remote Sens. 2018, 10, 471. [Google Scholar] [CrossRef] [Green Version]
  70. Alcantara, C.; Kuemmerle, T.; Prishchepov, A.V.; Radeloff, V.C. Mapping Abandoned Agriculture with Multi-Temporal MODIS Satellite Data. Remote Sens. Environ. 2012, 124, 334–347. [Google Scholar] [CrossRef]
  71. Bolton, D.K.; Gray, J.M.; Melaas, E.K.; Moon, M.; Eklundh, L.; Friedl, M.A. Continental-Scale Land Surface Phenology from Harmonized Landsat 8 and Sentinel-2 Imagery. Remote Sens. Environ. 2020, 240, 111685. [Google Scholar] [CrossRef]
  72. Pastick, N.; Wylie, B.; Wu, Z. Spatiotemporal Analysis of Landsat-8 and Sentinel-2 Data to Support Monitoring of Dryland Ecosystems. Remote Sens. 2018, 10, 791. [Google Scholar] [CrossRef] [Green Version]
  73. Roy, D.P.; Huang, H.; Boschetti, L.; Giglio, L.; Yan, L.; Zhang, H.H.; Li, Z. Landsat-8 and Sentinel-2 Burned Area Mapping—A Combined Sensor Multi-Temporal Change Detection Approach. Remote Sens. Environ. 2019, 231, 111254. [Google Scholar] [CrossRef]
  74. Urban, M.; Berger, C.; Mudau, T.; Heckel, K.; Truckenbrodt, J.; Onyango Odipo, V.; Smit, I.; Schmullius, C. Surface Moisture and Vegetation Cover Analysis for Drought Monitoring in the Southern Kruger National Park Using Sentinel-1, Sentinel-2, and Landsat-8. Remote Sens. 2018, 10, 1482. [Google Scholar] [CrossRef] [Green Version]
  75. Zhou, Q.; Rover, J.; Brown, J.; Worstell, B.; Howard, D.; Wu, Z.; Gallant, A.; Rundquist, B.; Burke, M. Monitoring Landscape Dynamics in Central U.S. Grasslands with Harmonized Landsat-8 and Sentinel-2 Time Series Data. Remote Sens. 2019, 11, 328. [Google Scholar] [CrossRef] [Green Version]
  76. Gao, F.; Masek, J.; Schwaller, M.; Hall, F. On the Blending of the Landsat and MODIS Surface Reflectance: Predicting Daily Landsat Surface Reflectance. IEEE Trans. Geosci. Remote Sens. 2006, 44, 2207–2218. [Google Scholar] [CrossRef]
  77. Zhu, X.; Chen, J.; Gao, F.; Chen, X.; Masek, J.G. An Enhanced Spatial and Temporal Adaptive Reflectance Fusion Model for Complex Heterogeneous Regions. Remote Sens. Environ. 2010, 114, 2610–2623. [Google Scholar] [CrossRef]
  78. Hilker, T.; Wulder, M.A.; Coops, N.C.; Linke, J.; McDermid, G.; Masek, J.G.; Gao, F.; White, J.C. A New Data Fusion Model for High Spatial- and Temporal-Resolution Mapping of Forest Disturbance Based on Landsat and MODIS. Remote Sens. Environ. 2009, 113, 1613–1627. [Google Scholar] [CrossRef]
  79. Clewley, D.; Lucas, R.; Accad, A.; Armston, J.; Bowen, M.; Dwyer, J.; Pollock, S.; Bunting, P.; McAlpine, C.; Eyre, T.; et al. An Approach to Mapping Forest Growth Stages in Queensland, Australia through Integration of ALOS PALSAR and Landsat Sensor Data. Remote Sens. 2012, 4, 2236–2255. [Google Scholar] [CrossRef] [Green Version]
  80. Marshak, C.; Simard, M.; Denbina, M. Monitoring Forest Loss in ALOS/PALSAR Time-Series with Superpixels. Remote Sens. 2019, 11, 556. [Google Scholar] [CrossRef] [Green Version]
  81. Reiche, J.; Verbesselt, J.; Hoekman, D.; Herold, M. Fusing Landsat and SAR Time Series to Detect Deforestation in the Tropics. Remote Sens. Environ. 2015, 156, 276–293. [Google Scholar] [CrossRef]
  82. Muro, J.; Canty, M.; Conradsen, K.; Hüttich, C.; Nielsen, A.; Skriver, H.; Remy, F.; Strauch, A.; Thonfeld, F.; Menz, G. Short-Term Change Detection in Wetlands Using Sentinel-1 Time Series. Remote Sens. 2016, 8, 795. [Google Scholar] [CrossRef] [Green Version]
  83. Reiche, J.; Hamunyela, E.; Verbesselt, J.; Hoekman, D.; Herold, M. Improving Near-Real Time Deforestation Monitoring in Tropical Dry Forests by Combining Dense Sentinel-1 Time Series with Landsat and ALOS-2 PALSAR-2. Remote Sens. Environ. 2018, 204, 147–161. [Google Scholar] [CrossRef]
  84. Stiller, D.; Ottinger, M.; Leinenkugel, P. Spatio-Temporal Patterns of Coastal Aquaculture Derived from Sentinel-1 Time Series Data and the Full Landsat Archive. Remote Sens. 2019, 11, 1707. [Google Scholar] [CrossRef] [Green Version]
  85. Caughlin, T.T.; Rifai, S.W.; Graves, S.J.; Asner, G.P.; Bohlman, S.A. Integrating LiDAR Derived Tree Height and Landsat Satellite Reflectance to Estimate Forest Regrowth in a Tropical Agricultural Landscape. Remote Sens. Ecol. Conserv. 2016, 2, 190–203. [Google Scholar] [CrossRef] [Green Version]
  86. Kennedy, R.E.; Ohmann, J.; Gregory, M.; Roberts, H.; Yang, Z.; Bell, D.M.; Kane, V.; Hughes, M.J.; Cohen, W.B.; Powell, S.; et al. An Empirical, Integrated Forest Biomass Monitoring System. Environ. Res. Lett. 2018, 13, 025004. [Google Scholar] [CrossRef]
  87. White, J.C.; Saarinen, N.; Kankare, V.; Wulder, M.A.; Hermosilla, T.; Coops, N.C.; Pickell, P.D.; Holopainen, M.; Hyyppä, J.; Vastaranta, M. Confirmation of Post-Harvest Spectral Recovery from Landsat Time Series Using Measures of Forest Cover and Height Derived from Airborne Laser Scanning Data. Remote Sens. Environ. 2018, 216, 262–275. [Google Scholar] [CrossRef]
  88. Wang, Z.; Yao, W.; Tang, Q.; Liu, L.; Xiao, P.; Kong, X.; Zhang, P.; Shi, F.; Wang, Y. Continuous Change Detection of Forest/Grassland and Cropland in the Loess Plateau of China Using All Available Landsat Data. Remote Sens. 2018, 10, 1775. [Google Scholar] [CrossRef] [Green Version]
  89. Zhu, Z.; Woodcock, C.E.; Olofsson, P. Continuous Monitoring of Forest Disturbance Using All Available Landsat Imagery. Remote Sens. Environ. 2012, 122, 75–91. [Google Scholar] [CrossRef]
  90. Fortin, J.A.; Cardille, J.A.; Perez, E. Multi-Sensor Detection of Forest-Cover Change across 45 Years in Mato Grosso, Brazil. Remote Sens. Environ. 2020, 238, 111266. [Google Scholar] [CrossRef]
  91. Verbesselt, J.; Hyndman, R.; Newnham, G.; Culvenor, D. Detecting Trend and Seasonal Changes in Satellite Image Time Series. Remote Sens. Environ. 2010, 114, 106–115. [Google Scholar] [CrossRef]
  92. Huang, C.; Goward, S.N.; Masek, J.G.; Thomas, N.; Zhu, Z.; Vogelmann, J.E. An Automated Approach for Reconstructing Recent Forest Disturbance History Using Dense Landsat Time Series Stacks. Remote Sens. Environ. 2010, 114, 183–198. [Google Scholar] [CrossRef]
  93. Kennedy, R.E.; Yang, Z.; Cohen, W.B. Detecting Trends in Forest Disturbance and Recovery Using Yearly Landsat Time Series: 1. LandTrendr—Temporal Segmentation Algorithms. Remote Sens. Environ. 2010, 114, 2897–2910. [Google Scholar] [CrossRef]
  94. Copass, C.; Antonova, N.; Kennedy, R. Comparison of Office and Field Techniques for Validating Landscape Change Classification in Pacific Northwest National Parks. Remote Sens. 2018, 11, 3. [Google Scholar] [CrossRef] [Green Version]
  95. White, J.C.; Wulder, M.A.; Hobart, G.W.; Luther, J.E.; Hermosilla, T.; Griffiths, P.; Coops, N.C.; Hall, R.J.; Hostert, P.; Dyk, A.; et al. Pixel-Based Image Compositing for Large-Area Dense Time Series Applications and Science. Can. J. Remote Sens. 2014, 40, 192–212. [Google Scholar] [CrossRef] [Green Version]
  96. Wu, L.; Li, Z.; Liu, X.; Zhu, L.; Tang, Y.; Zhang, B.; Xu, B.; Liu, M.; Meng, Y.; Liu, B. Multi-Type Forest Change Detection Using BFAST and Monthly Landsat Time Series for Monitoring Spatiotemporal Dynamics of Forests in Subtropical Wetland. Remote Sens. 2020, 12, 341. [Google Scholar] [CrossRef] [Green Version]
  97. Rengarajan, R.; Storey, J.C.; Choate, M.J. Harmonizing the Landsat Ground Reference with the Sentinel-2 Global Reference Image Using Space-Based Bundle Adjustment. Remote Sens. 2020, 12, 3132. [Google Scholar] [CrossRef]
  98. Chaves, M.E.D.; Picoli, M.C.A.; Sanches, I.D. Recent Applications of Landsat 8/OLI and Sentinel-2/MSI for Land Use and Land Cover Mapping: A Systematic Review. Remote Sens. 2020, 12, 3062. [Google Scholar] [CrossRef]
  99. Friedl, M.A.; Sulla-Menashe, D.; Tan, B.; Schneider, A.; Ramankutty, N.; Sibley, A.; Huang, X. MODIS Collection 5 Global Land Cover: Algorithm Refinements and Characterization of New Datasets. Remote Sens. Environ. 2010, 114, 168–182. [Google Scholar] [CrossRef]
  100. Champagne, C.; McNairn, H.; Daneshfar, B.; Shang, J. A Bootstrap Method for Assessing Classification Accuracy and Confidence for Agricultural Land Use Mapping in Canada. Int. J. Appl. Earth Obs. Geoinf. 2014, 29, 44–52. [Google Scholar] [CrossRef] [Green Version]
  101. Egorov, A.V.; Hansen, M.C.; Roy, D.P.; Kommareddy, A.; Potapov, P.V. Image Interpretation-Guided Supervised Classification Using Nested Segmentation. Remote Sens. Environ. 2015, 165, 135–147. [Google Scholar] [CrossRef] [Green Version]
  102. Fritz, S.; See, L.; Perger, C.; McCallum, I.; Schill, C.; Schepaschenko, D.; Duerauer, M.; Karner, M.; Dresel, C.; Laso-Bayas, J.-C.; et al. A Global Dataset of Crowdsourced Land Cover and Land Use Reference Data. Sci. Data 2017, 4, 170075. [Google Scholar] [CrossRef] [Green Version]
  103. Yang, D.; Fu, C.-S.; Smith, A.C.; Yu, Q. Open Land-Use Map: A Regional Land-Use Mapping Strategy for Incorporating OpenStreetMap with Earth Observations. Geo-Spat. Inf. Sci. 2017, 20, 269–281. [Google Scholar] [CrossRef] [Green Version]
  104. Foody, G.M.; See, L.; Fritz, S.; van der Velde, M.; Perger, C.; Schill, C.; Boyd, D.S.; Comber, A. Accurate Attribute Mapping from Volunteered Geographic Information: Issues of Volunteer Quantity and Quality. Cartogr. J. 2015, 52, 336–344. [Google Scholar] [CrossRef]
  105. Tracewski, L.; Bastin, L.; Fonte, C.C. Repurposing a Deep Learning Network to Filter and Classify Volunteered Photographs for Land Cover and Land Use Characterization. Geo-Spat. Inf. Sci. 2017, 20, 252–268. [Google Scholar] [CrossRef] [Green Version]
Figure 1. Graphical illustration of Landsat mission’s timeline, showing previously launched satellites and Landsat-9 planned to be launched in September 2021.
Remotesensing 13 02869 g001
Figure 2. Annual publications that included “Landsat” in title, abstract, or keywords within the Scopus database (purple line), Landsat scene downloads from USGS archive (blue line), and Landsat image price (black line) (Source: USGS [22]) showing the impact of Landsat data policy through time on the usage of Landsat data.
Remotesensing 13 02869 g002
Figure 3. The total number of available Landsat images in the USGS archive from different Landsat instruments or sensors, which totaled 9,177,028 images as of 31 December 2020. (Source: USGS).
Remotesensing 13 02869 g003
Figure 4. PRISMA flow diagram for database article selection.
Remotesensing 13 02869 g004
Figure 5. A general workflow used in Landsat change detection studies.
Remotesensing 13 02869 g005
Figure 6. The number of Landsat change detection articles in each journal meeting the search criteria.
Remotesensing 13 02869 g006
Figure 7. The total number of Landsat change detection journal articles published since 1994.
Remotesensing 13 02869 g007
Figure 8. The total number of study areas and images used in Landsat change detection studies on different continents (5 global studies excluded).
Remotesensing 13 02869 g008
Figure 9. The geographic distribution of Landsat change detection studies for different applications.
Remotesensing 13 02869 g009
Figure 10. Data sources of Landsat imagery in the reviewed studies.
Remotesensing 13 02869 g010
Figure 11. Usage of different Landsat sensors in studies over time.
Remotesensing 13 02869 g011
Figure 12. Ancillary data used in Landsat change detection studies.
Remotesensing 13 02869 g012
Figure 13. Usage of other EO data along with Landsat data in the reviewed studies.
Remotesensing 13 02869 g013
Figure 14. Frequency, time period, and size of Landsat change detection studies over time.
Remotesensing 13 02869 g014
Figure 15. The effect of the number of Landsat imagery per year in time series analysis on the accuracy of change detection studies.
Remotesensing 13 02869 g015
Figure 16. The trend in the use of different preprocessing strategies over time.
Remotesensing 13 02869 g016
Figure 17. Trends in different Landsat change detection method categories over time.
Remotesensing 13 02869 g017
Figure 18. A scatter plot showing the different Landsat change detection methods and overall accuracies over time.
Remotesensing 13 02869 g018
Figure 19. Usage of different processing units and classifier categories over time. Note that early classifiers include Mahalanobis, minimum distance, nearest neighbor, ISODATA, K-means, maximum likelihood, whereas advanced classifiers include support vector machine, artificial neural network, random forest, decision tree and classification and regression tree, or object-based methods.
Remotesensing 13 02869 g019
Figure 20. Recent trends in Landsat change detection studies.
Remotesensing 13 02869 g020
Figure 21. The trend in reference data collection techniques (office reference data sampled from Google Earth, high-resolution images, or existing land cover maps).
Remotesensing 13 02869 g021
Table 1. The database features are used for meta-analysis quantitative and qualitative synthesis.
FeatureData TypeDescription
TitleFree TextArticle title
First AuthorFree TextFirst author name
YearNumericPublished year
SourceFree TextPublished journal
DOINumericArticle DOI
Study area CountryFree TextStudy area country (or region)
Study area sizeNumericStudy area size in square kilometers
ApplicationFree TextChange detection application
Change CauseFree TextCause of change (change agent) mentioned in articles
Data ProviderFree TextData download or access source
Total ImagesNumericTotal number of Landsat images used
Total Available DataBooleanIf used all available Landsat images
LandsatCategoricalWhich Landsat instrument(s) used
Landsat SensorCategoricalWhich Landsat sensor(s) used
Change FrequencyCategoricalUsing more than one, one, or less than one image per year
Start DateNumericStarting year
Ending DateNumericEnding year
DurationNumericTime frame
Images Per YearNumericThe average number of used images per year
ARDBooleanIf used analysis ready data or surface reflectance data
GeometricFree TextGeometric correction method or standard
AtmosphericFree TextAtmospheric correction method
RadiometricFree TextRadiometric correction method
Cloud RemovalFree TextCloud, cloud shadow, and other anomalies masking method
Composite methodFree TextComposite image creation method
Other SensorFree TextOther Earth observation data
Ancillary DataFree TextAncillary data used
Change CategoryCategoricalCategory of change detection method
Change MethodFree TextChange detection method
Change IndexFree TextChange metric or index
Computing platformFree TextCloud computing platform or local computation
Processing UnitCategoricalChange detection processing element
Ground TruthFree TextReference data used for evaluation
CD ResolutionNumericFinal product resolution
ClassifierFree TextClassifier used
Classification FeaturesFree TextFeatures used in classification
Classification OANumericOverall accuracy of classification
Assessment IndicesFree TextAssessment indices
CD OANumericChange detection overall accuracy
Table 2. Change agents in Landsat change detection studies.
Change AgentChange MagnitudeNumber of Studies
AnthropogenicDeforestationAbrupt/Gradual149
Urban expansionGradual102
Human ActivitiesAbrupt/Gradual47
Agriculture expansionGradual30
Population growthGradual21
AfforestationGradual20
IndustrialAbrupt11
EconomicAbrupt7
DisturbanceAbrupt/Gradual6
MiningGradual5
HarvestAbrupt4
DamAbrupt3
NaturalInsectGradual9
FireAbrupt8
Climate changeGradual7
DesertificationGradual7
DroughtGradual6
EarthquakeAbrupt4
Table 3. Different strategies and methods for preprocessing steps of Landsat change detection studies.
StrategyMethod
GeometricAutomatedL1TP standard data
User-BasedCoregistration
Polynomial fitting
Commercial software
AtmosphericAutomatedSurface reflectance data
LEDAPS
LaSRC
L8SR
User-BasedMODTRAN
LOWTRAN
FLAASH
DOS
COST
ATCOR
6S
Cloud/Cloud shadowAutomatedFmask
CFmask
Tmask
Cloud score
QA band
User-BasedManual mask
Thresholding
Cloud-free image selection
Publisher’s Note: MDPI stays neutral with regard to jurisdictional claims in published maps and institutional affiliations.