Article

Land Use and Degradation in a Desert Margin: The Northern Negev

1
Geographical Sciences, University of Maryland, College Park, MD 20742, USA
2
Ecology, Evolution and Behavior, Hebrew University of Jerusalem, Jerusalem 9190501, Israel
*
Author to whom correspondence should be addressed.
Remote Sens. 2021, 13(15), 2884; https://doi.org/10.3390/rs13152884
Submission received: 1 June 2021 / Revised: 17 July 2021 / Accepted: 20 July 2021 / Published: 23 July 2021

Abstract

:
Degradation in a range of land uses was examined across the transition from the arid to the semi-arid zone in the northern Negev desert, representative of developments in land use taking place throughout the West Asia and North Africa region. Primary production was used as an index of an important aspect of dryland degradation. It was derived from data provided by Landsat measurements at 0.1 ha resolution over a 2500 km2 study region—the first assessment of the degradation of a large area of a desert margin at a resolution suitable for interpretation in terms of human activities. The Local NPP Scaling (LNS) method enabled comparisons between the observed NPP and the potential, nondegraded, reference NPP. The potential was calculated by normalizing the actual NPP to remove the effects of environmental conditions that are not related to anthropogenic degradation. Of the entire study area, about 50% was found to have a significantly lower production than its potential. The degree of degradation ranged from small in pasture, around informal settlements, minimally managed dryland cropping, and a pine plantation, to high in commercial cropping and extreme in low-density afforestation. This result was unexpected as degradation in drylands is often attributed to pastoralism, and afforestation is said to offer remediation and prevention of further damage.

1. Introduction

In drylands, the low productivity of vegetation and susceptibility to erosion limit human livelihoods. Until recently, these areas were sparsely inhabited and used mainly for pastoralism and subsistence cultivation. More recently, however, in large areas of West Asia, North Africa, and other drylands, some of the traditional land uses (LUs) are being displaced by improvements in livestock management, cultivation that is more intensive, modern irrigation, and land conversions associated with expanding populations. Dryland degradation is often attributed to traditional LUs—mainly overgrazing (e.g., [1,2])—even though it has frequently been shown that traditional lifestyles have enabled the sustainable occupation of marginal regions (e.g., [3]). Notwithstanding degradation associated with traditional LUs, degradation in new LUs has not been assessed but is often supposed to be less.
This paper assessed the effects of traditional and new LUs in the arid to semi-arid ecotone in the northern Negev (Figure 1). The main Bedouin LU is pastoralism, but forced sedentarization of the traditionally nomadic people and their confinement to a 10% area of the land they formerly occupied [4] has led to greater concentrations of livestock [5,6]. Large military installations also occupy land, most of which could be grazed.
With the loss of more productive land, pastoralists have moved to drier areas, which are more susceptible to degradation. Land as far as 50 km from habitation is grazed—as is evident in the contrasts between fenced and grazed land distant from settlements. Most households purchase hay and other supplementary fodder, indicating that the livestock densities are unsustainable. Studies in similar conditions in Jordan have estimated a 70% loss of production in grazed areas. Nevertheless, Bedouin pastoralism has been regarded by some as desirable (e.g., [1,7,8]).
Intensive agriculture now occupies much of the north and northwest of the study area, made possible by mechanized cultivation, irrigation with water piped from wetter regions, favorable soils, and the use of fertilizers and pesticides. Virtually all the land is cultivated, growing vegetables, fruits, and wheat, and large yields are achieved. On the other hand, cultivation by Bedouin and marginalized populations elsewhere [9] is often on borderline suitable land, which is all that is left [2]. The land is ploughed but only planted following rainfall, and fertilizer use is not universal.
Extensive afforestation is being undertaken in the northern Negev by the JNF (Jewish National Fund, Keren Kayemet LeYisrael), a parastatal organization that has responsibility for forestry. There are two distinct types of plantations. The most visually prominent are dense plantations of Aleppo pine (Pinus halepensis) on the southern Judean Mountains, contrasting with more extensive, low-density plantings, often using exotic, drought-tolerant deciduous species. The low-density plantations create a landscape known as “savannization” [10], owing to its similarity with the physiognomy of tropical savanna. The “National Outline Plan for Forests and Afforestation” [11] envisages the doubling of the current planted forest (115 km2), and the creation of new forest parks (32 km2, in addition to the existing 88 km2). While the Plan claims that afforestation will increase productivity [11], it has been said to exacerbate degradation [12] owing to the use of heavy machinery to remove the native vegetation, followed by landscaping to create terraces on slopes to capture surface run-off [13]. In drylands, recovery of ground vegetation cover, after exposing large areas of soil, can be very slow.
Finally, urbanization now occupies land formerly used for grazing and low-intensity cultivation. This has affected much larger areas than the towns and suburbs themselves, with new industrial enterprises, a road and rail system, and increased outdoor recreation.
Orenstein et al. [5] noted that in “each of the predominant settlement types in the Negev—city, agricultural collective, exurban/residential community, homestead, Bedouin town, and unrecognized Bedouin village—each has a unique and characteristic environmental impact on their surroundings.”
The detection of degradation is not straightforward and methodologies continue to be debated [14]. The reduction in the net primary production (NPP) of vegetation is a widely used indicator, both as a direct component of degradation and as an indicator of others [15,16]. However, not all forms of degradation have measurable effects on NPP. For example, the replacement of palatable species caused by overgrazing may allow the establishment of less desirable ones, but without any change in NPP.
As both anthropogenic and natural processes can cause degradation, it is critical that these two are distinguished. A number of methods have been used which attempt to normalize the most important natural variable in drylands, that is precipitation. The assumption is that all remaining variability in NPP is indicative of degradation. For example, the rain use efficiency (RUE), which transforms NPP to NPP per unit precipitation [17], using the coefficient of regression of NPP on precipitation as the baseline and estimating degradation by deviations from it. More recently, the residual trend (RESTREND) technique has become popular [18]. It calculates the RUE of nondegraded pixels, followed by plotting the difference between the value of each pixel and the maximum RUE against time. Negative temporal trends in residuals are interpreted as degradation and positive trends as recovery. RUE and RESTREND are transforms of the same three variables—NPP, precipitation, and time. RUE highlights the precipitation–productivity relationship, while RESTREND emphasizes temporal trends. There are two fundamental problems with RUE/RESTREND. First, the nondegraded reference is the regression coefficient of NPP on precipitation. As it is not known a priori which pixels are degraded and which are not, the regression coefficient is an underestimate. The other drawback arises from the naturally slow rate of change in vegetation growth in response to a change in precipitation (from weeks to years), while annual precipitation varies from minutes to years. Therefore, even with no difference in productivity, RUE will be higher in dry years and lower in wet years.
Local NPP Scaling (LNS) is a different approach [14,19]. It attempts to identify nondegraded reference sites without the need for a priori knowledge of site condition [14]. It starts with the division of the study area into homogeneous land capability classes (LCCs) using all available environmental factors that affect productivity, other than anthropogenic. It is assumed that all pixels in a single LCC would have the same productivity in the absence of degradation. Using frequency distributions of the productivity of all pixels in each LCC, those with the maximum productivity are designated the reference. This maximum production is used as an estimator of nondegraded NPP. All the pixels in an LCC have a single value. The degree of degradation in each pixel is determined by subtraction of the production of every pixel from the nondegraded, reference NPP in its LCC (LNSdiff), or as a percentage (LNS%). LNSdiff preserves the numeric value of the difference between the actual (NPPobs) and its potential (NPPpot, [20]) in carbon sequestration units (gC m−2 yr−1). LNS% provides information on its impact on survival of the vegetation: whether plants are naturally large or small, survival after, e.g., a 80% reduction in their photosynthetic structures is less likely than after, e.g., 20%. The principal drawbacks of LNS are the assumptions that the LCCs are sufficiently internally homogeneous and that the maximum productivity in each LCC is a good estimate of the potential [19]. In common with RUE/RESTREND, LNS uses a time series of NPP data in order to estimate an interannual average. However, LNS has the advantage that the reference potential production is recalculated each year so it can respond to any interannual changes in the precipitation/NPP relationship. This is not possible with RUE/RETREND, if all years are used to estimate the reference.
When applied to cultivation or other forms of land management, the maximum productivity is determined by the most productive management conditions and not the natural condition of the land before conversion. In this case, LNS measures the difference in NPP between an artificial maximum and the actual production, and it is therefore a “difference,” not “degradation.” An important distinction between the utilization of natural, undisturbed land and intensive management is that the first generally causes a reduction in productivity while the second aims to increase economically valuable productivity.

2. Materials and Methods
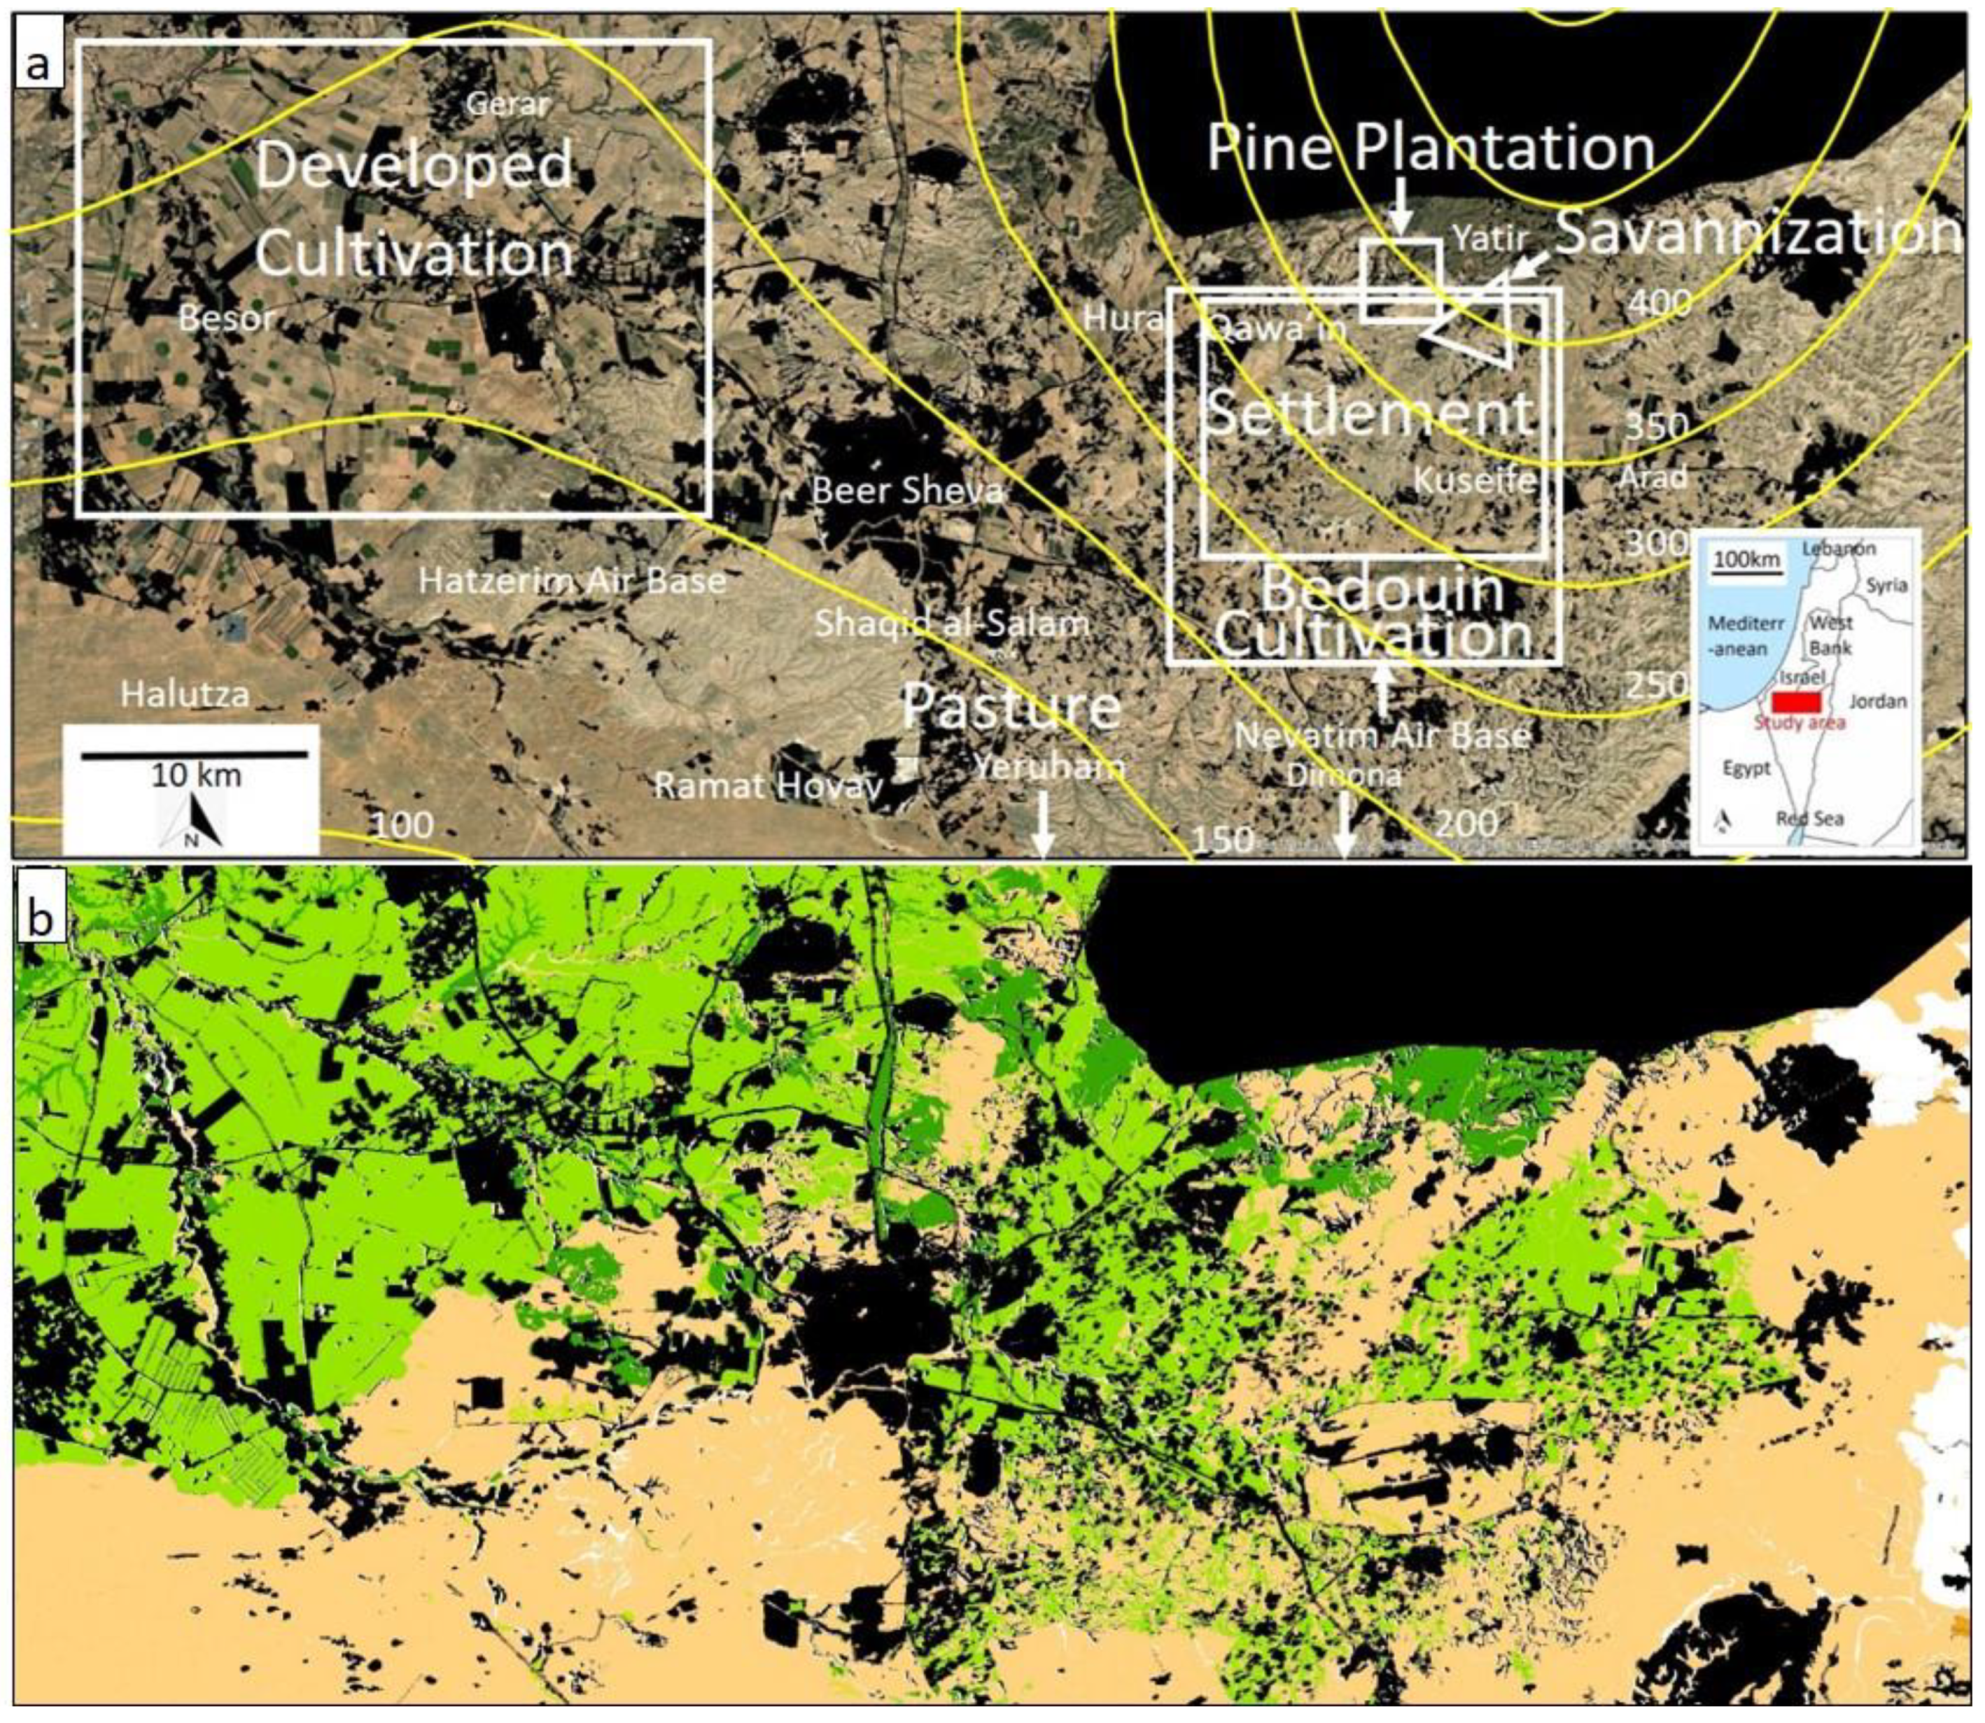
2.1. Study Area

The study was conducted in the northern Negev of Israel, from arid to semi-arid climates (Figure 1). The vegetation is zonal, matching the precipitation gradient. Soils and topography are quite varied—sand, dunes, loess, alluvium, and limestone—which correlate with vegetation patterns [21]. To the south and east, frequent deep valleys (wadis) dissect the landscape, exposing bare rock and desert lithosols. The wadis create differences in slopes and aspects that are locally important for vegetation type and cover [22].
Six sites, representative of their LU types, were selected for detailed study (Table 1, Figure 1).

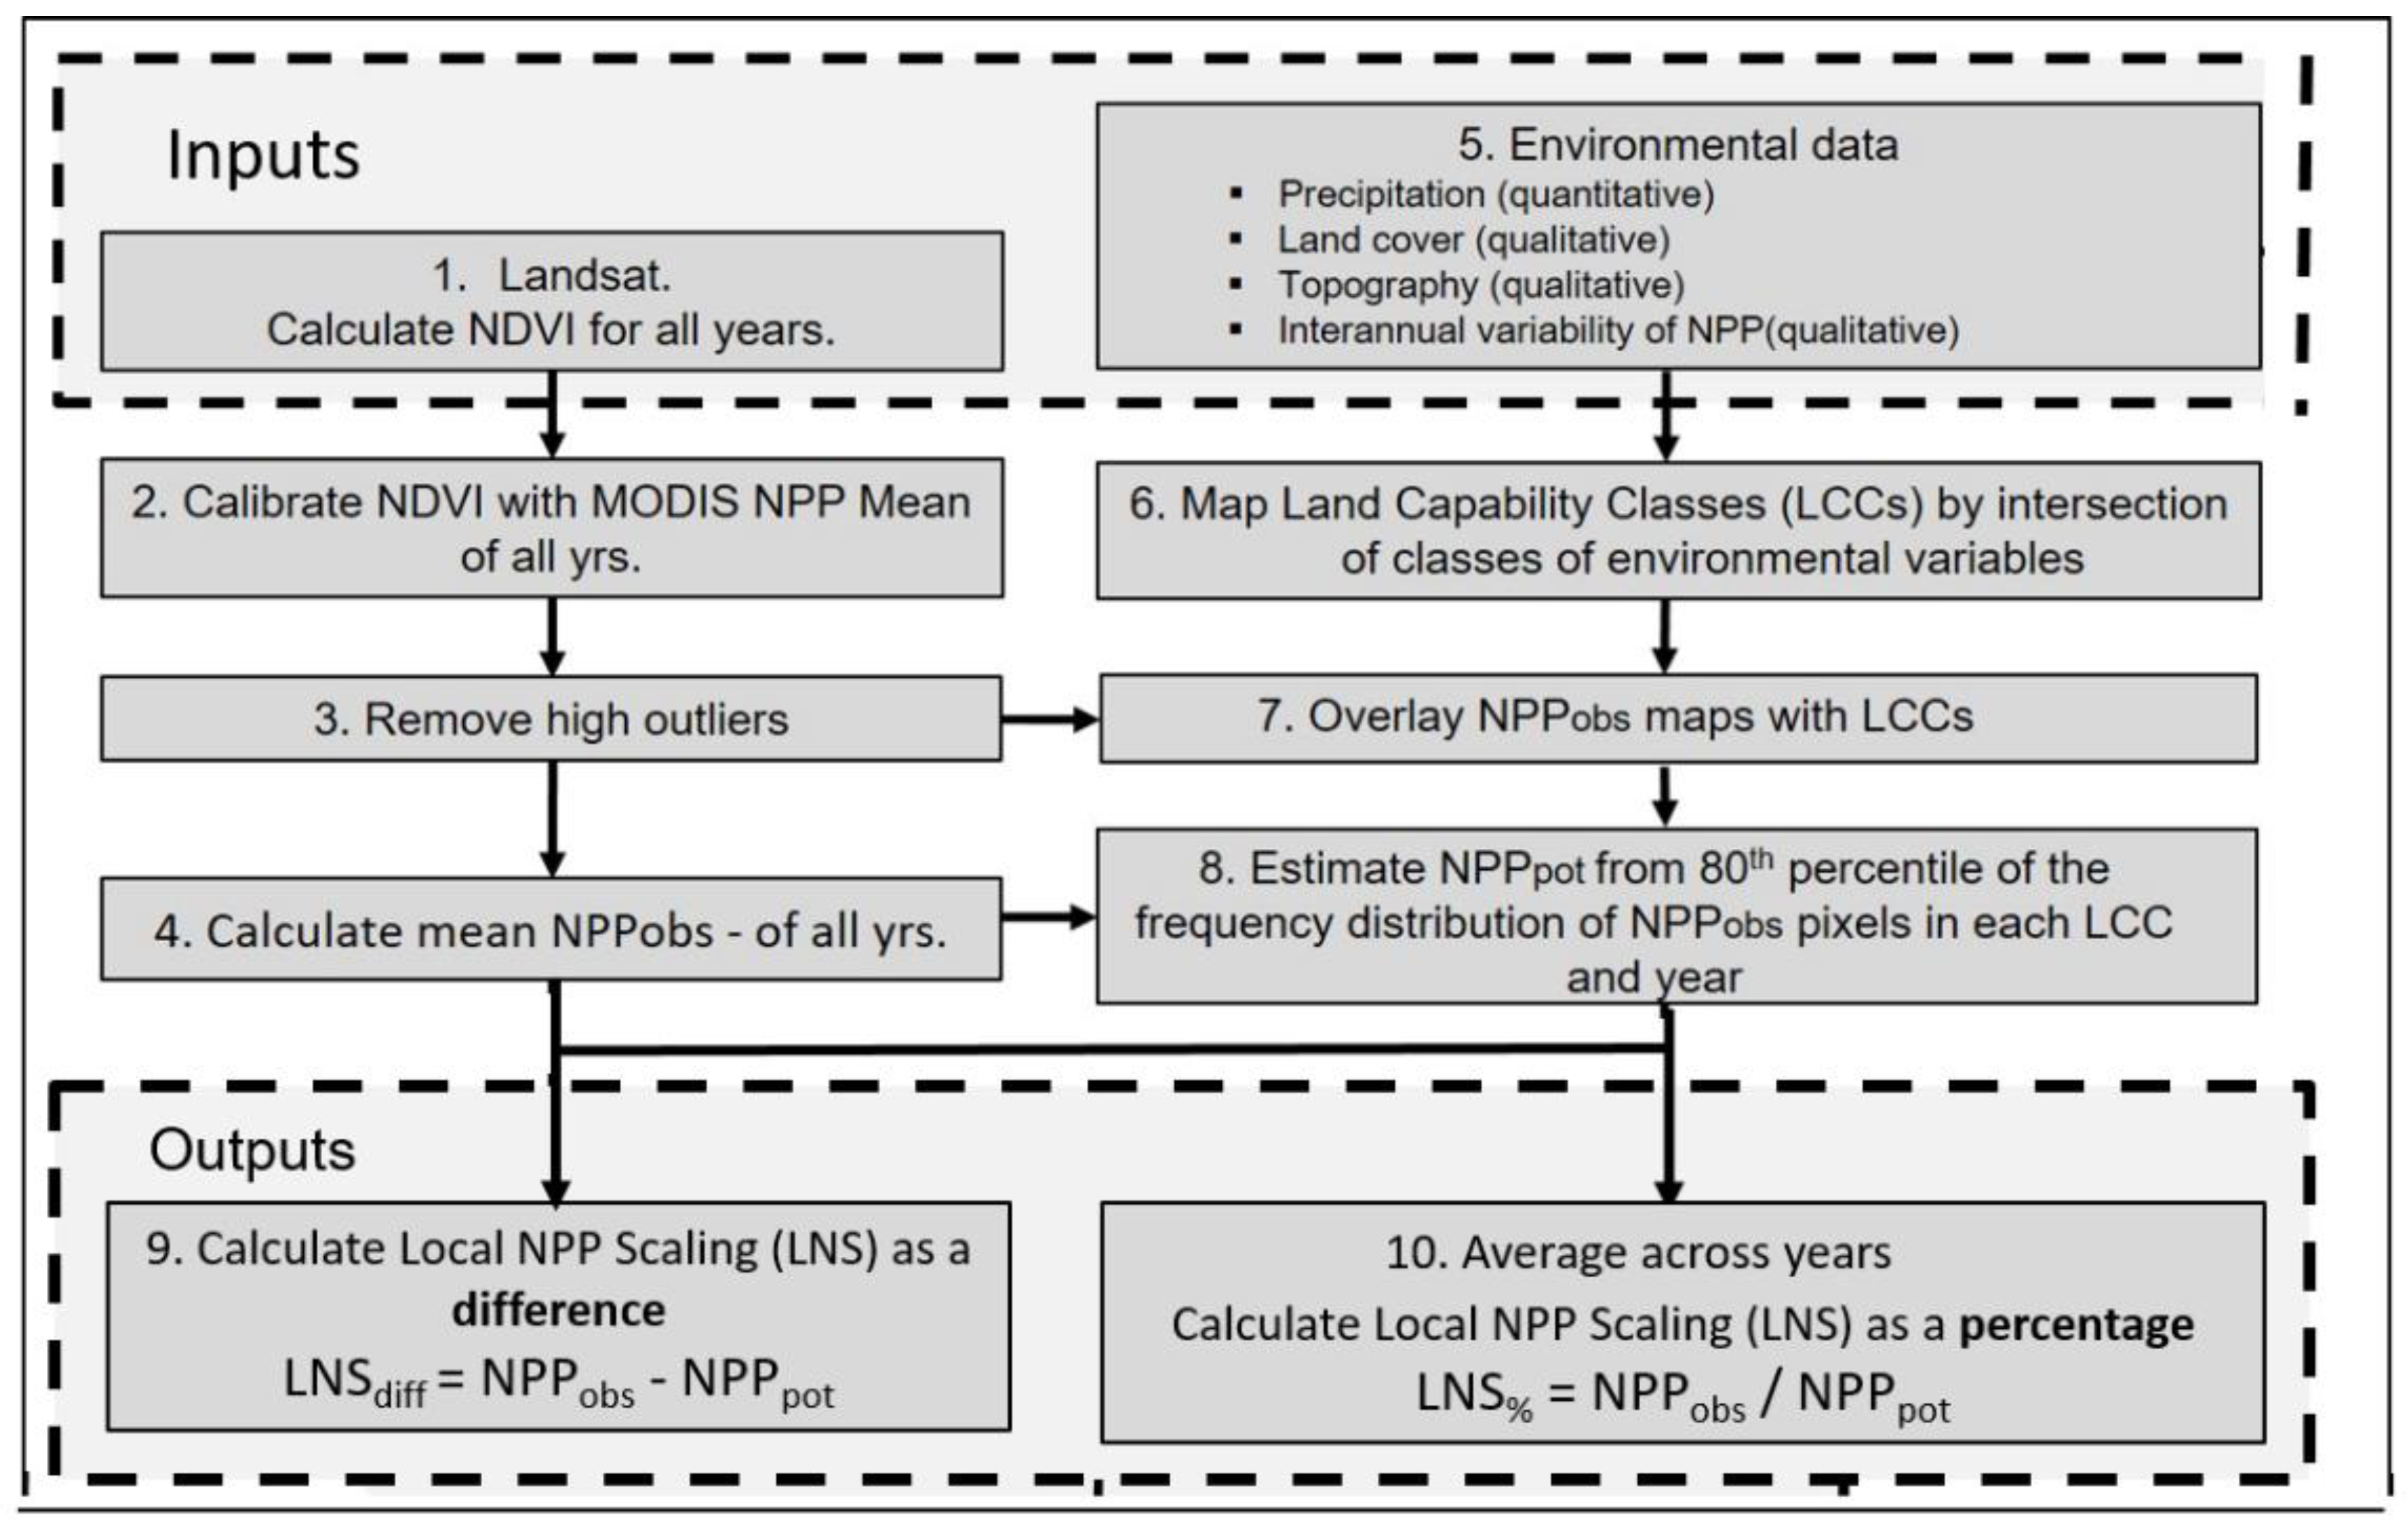
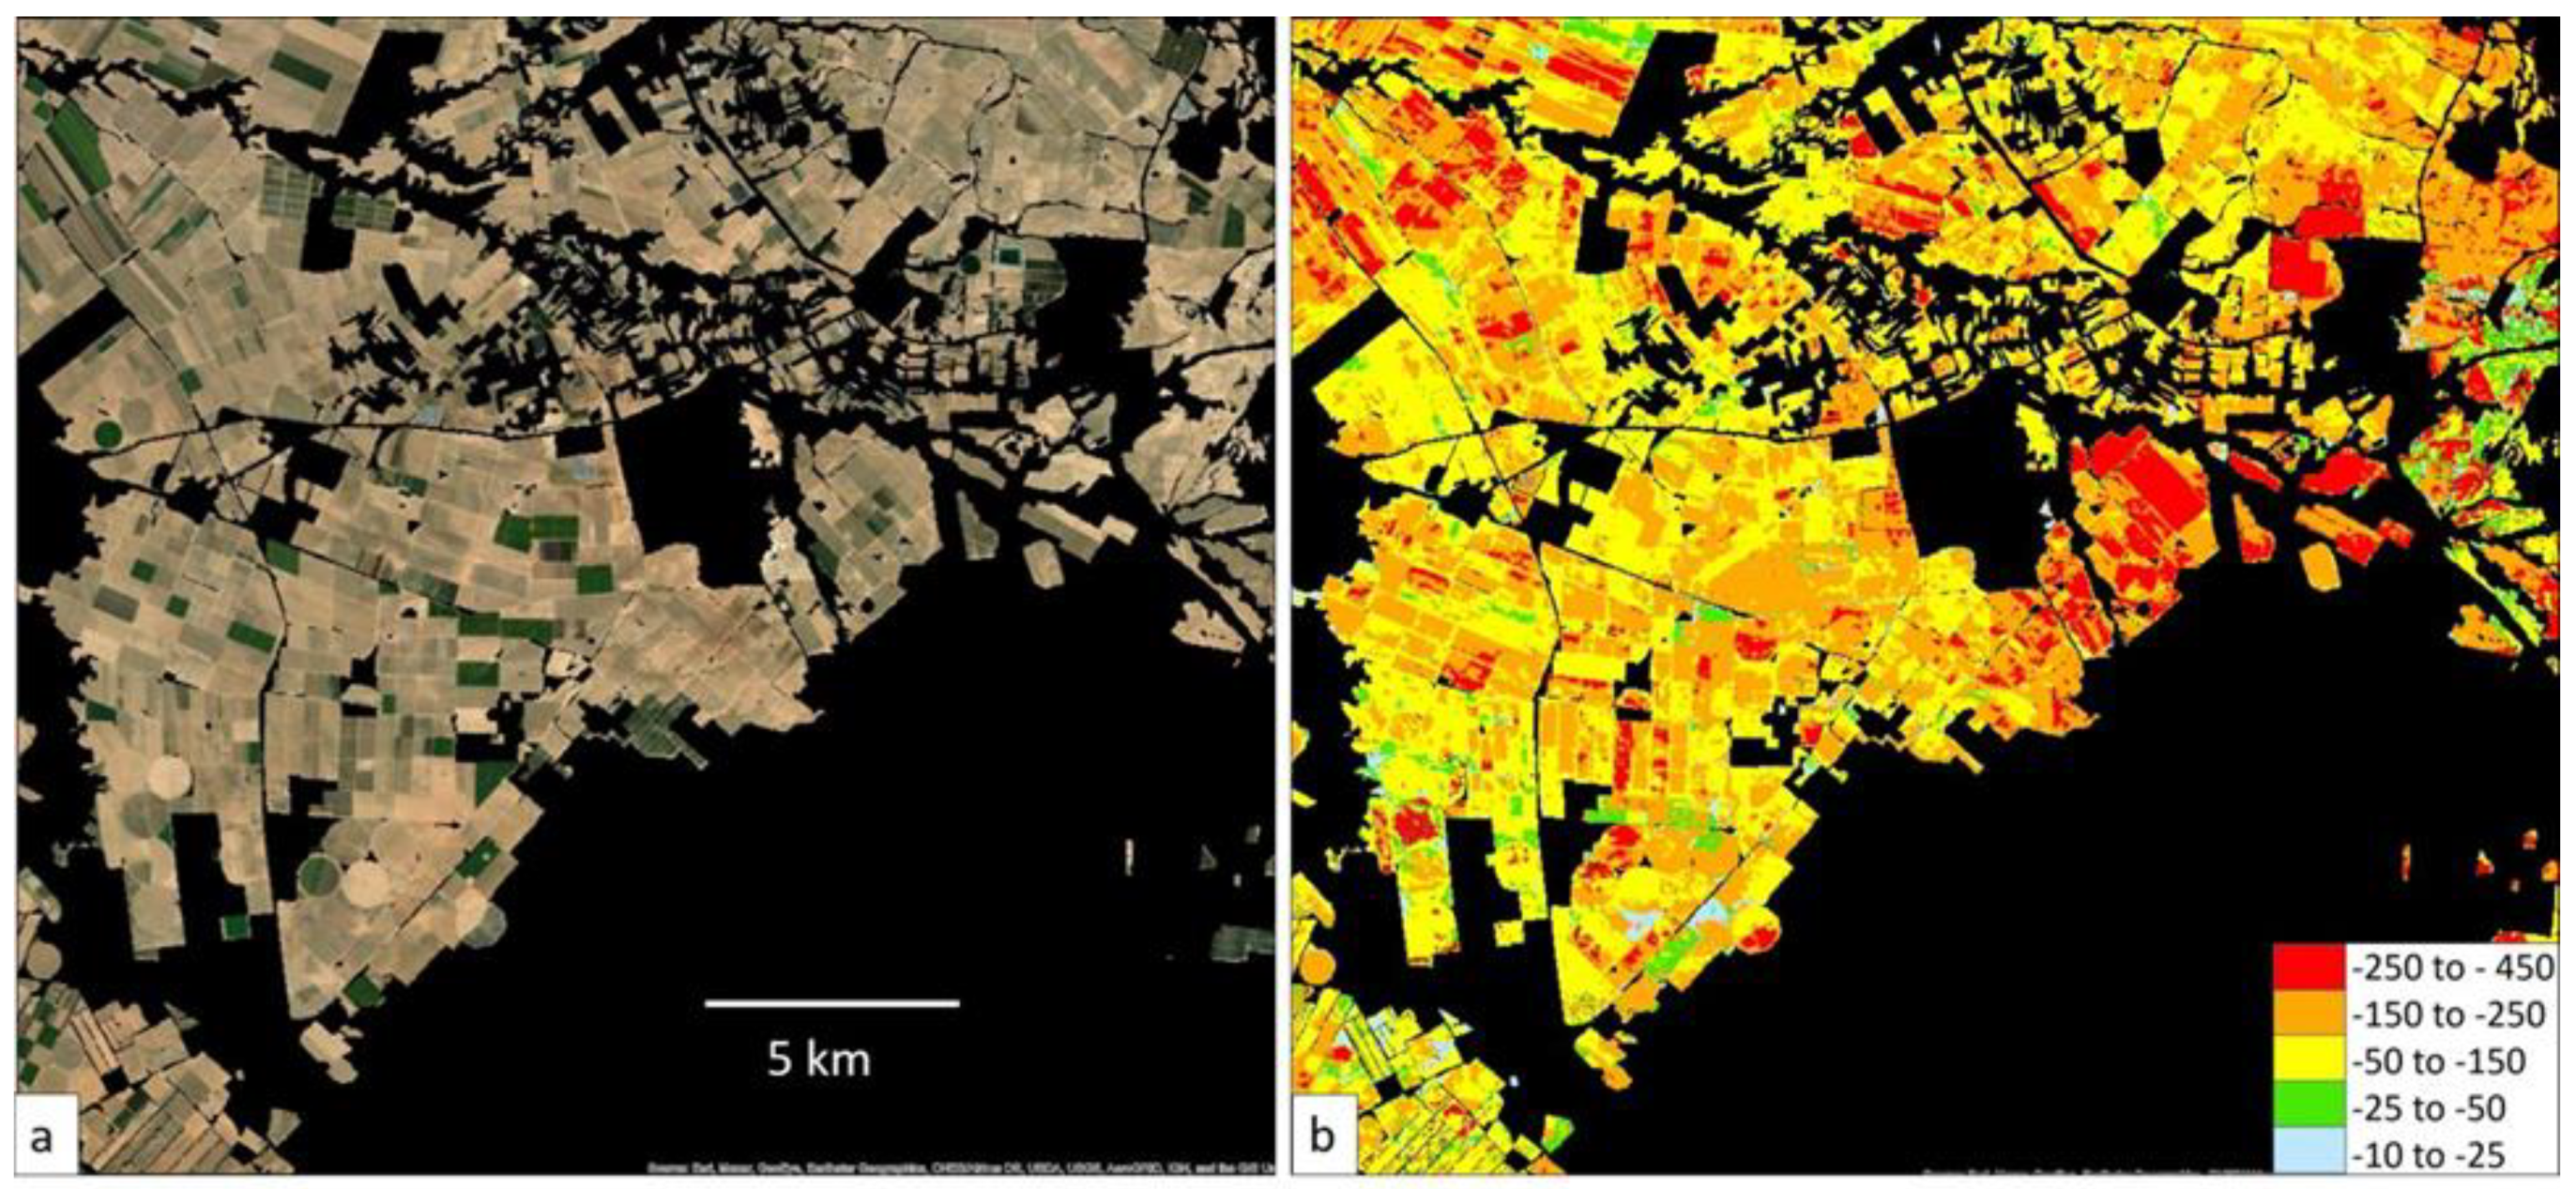
2.2. Degradation Mapping

The steps in data processing are shown in the schematic diagram (Figure 2) and Table 2. Steps 5–8 are the crux of the LNS analysis technique, in which the potential NPP in the absence of human influences (NPPpot) is estimated. The results for steps 1–8 in the present study have been reported and assessed previously [20].

2.3. Mapping Land Uses

Since NPPpot can vary between LU classes because of environmental differences, maps of each LU type were developed plus a map of river valleys [20]. Two existing LU maps were used—the National Geographic Information (NGI) land-use layer [23] and a JNF forest map (personal communication). These were refined by the selection of parts of the overall study area in which the LU classification seemed, by visual judgement of Google Earth imagery, to be most accurate. Some LU classes were not adequately shown in the maps, in which case additional criteria were included (Table 1). For example, for the zone surrounding settlements, a buffer between 90 and 390 m measured from the settlement edge was used. A zone of 500 m has been proposed [5], but 390 m was used here to exclude other LUs that are often present close to settlements (e.g., cultivation and pasture). The inner boundary of 90 m was used to minimize the effects of errors in the NGI settlement map. In addition to “area with no known characteristic”, some parts of the study area were excluded such as riparian strips and altitudes >500 m. The accuracy of the LU map is important and deficiencies in the data sources were a contributor to errors in the derivation of LNS.

2.4. Interpretation of LNS Differences at Local Scales

The LNS results were at the scale of the remote sensing data used to calculate NPP—in this case, Landsat ETM, which has an approximately 30 m (0.1 ha) ground resolution. This scale was adequate for identification of the relevant features and hence interpretation of their degree of degradation [25]. The human activities that can cause degradation have a finer scale. These were assessed using the available Google Earth imagery (2004–2013) closest in time to the study period.

3. Results

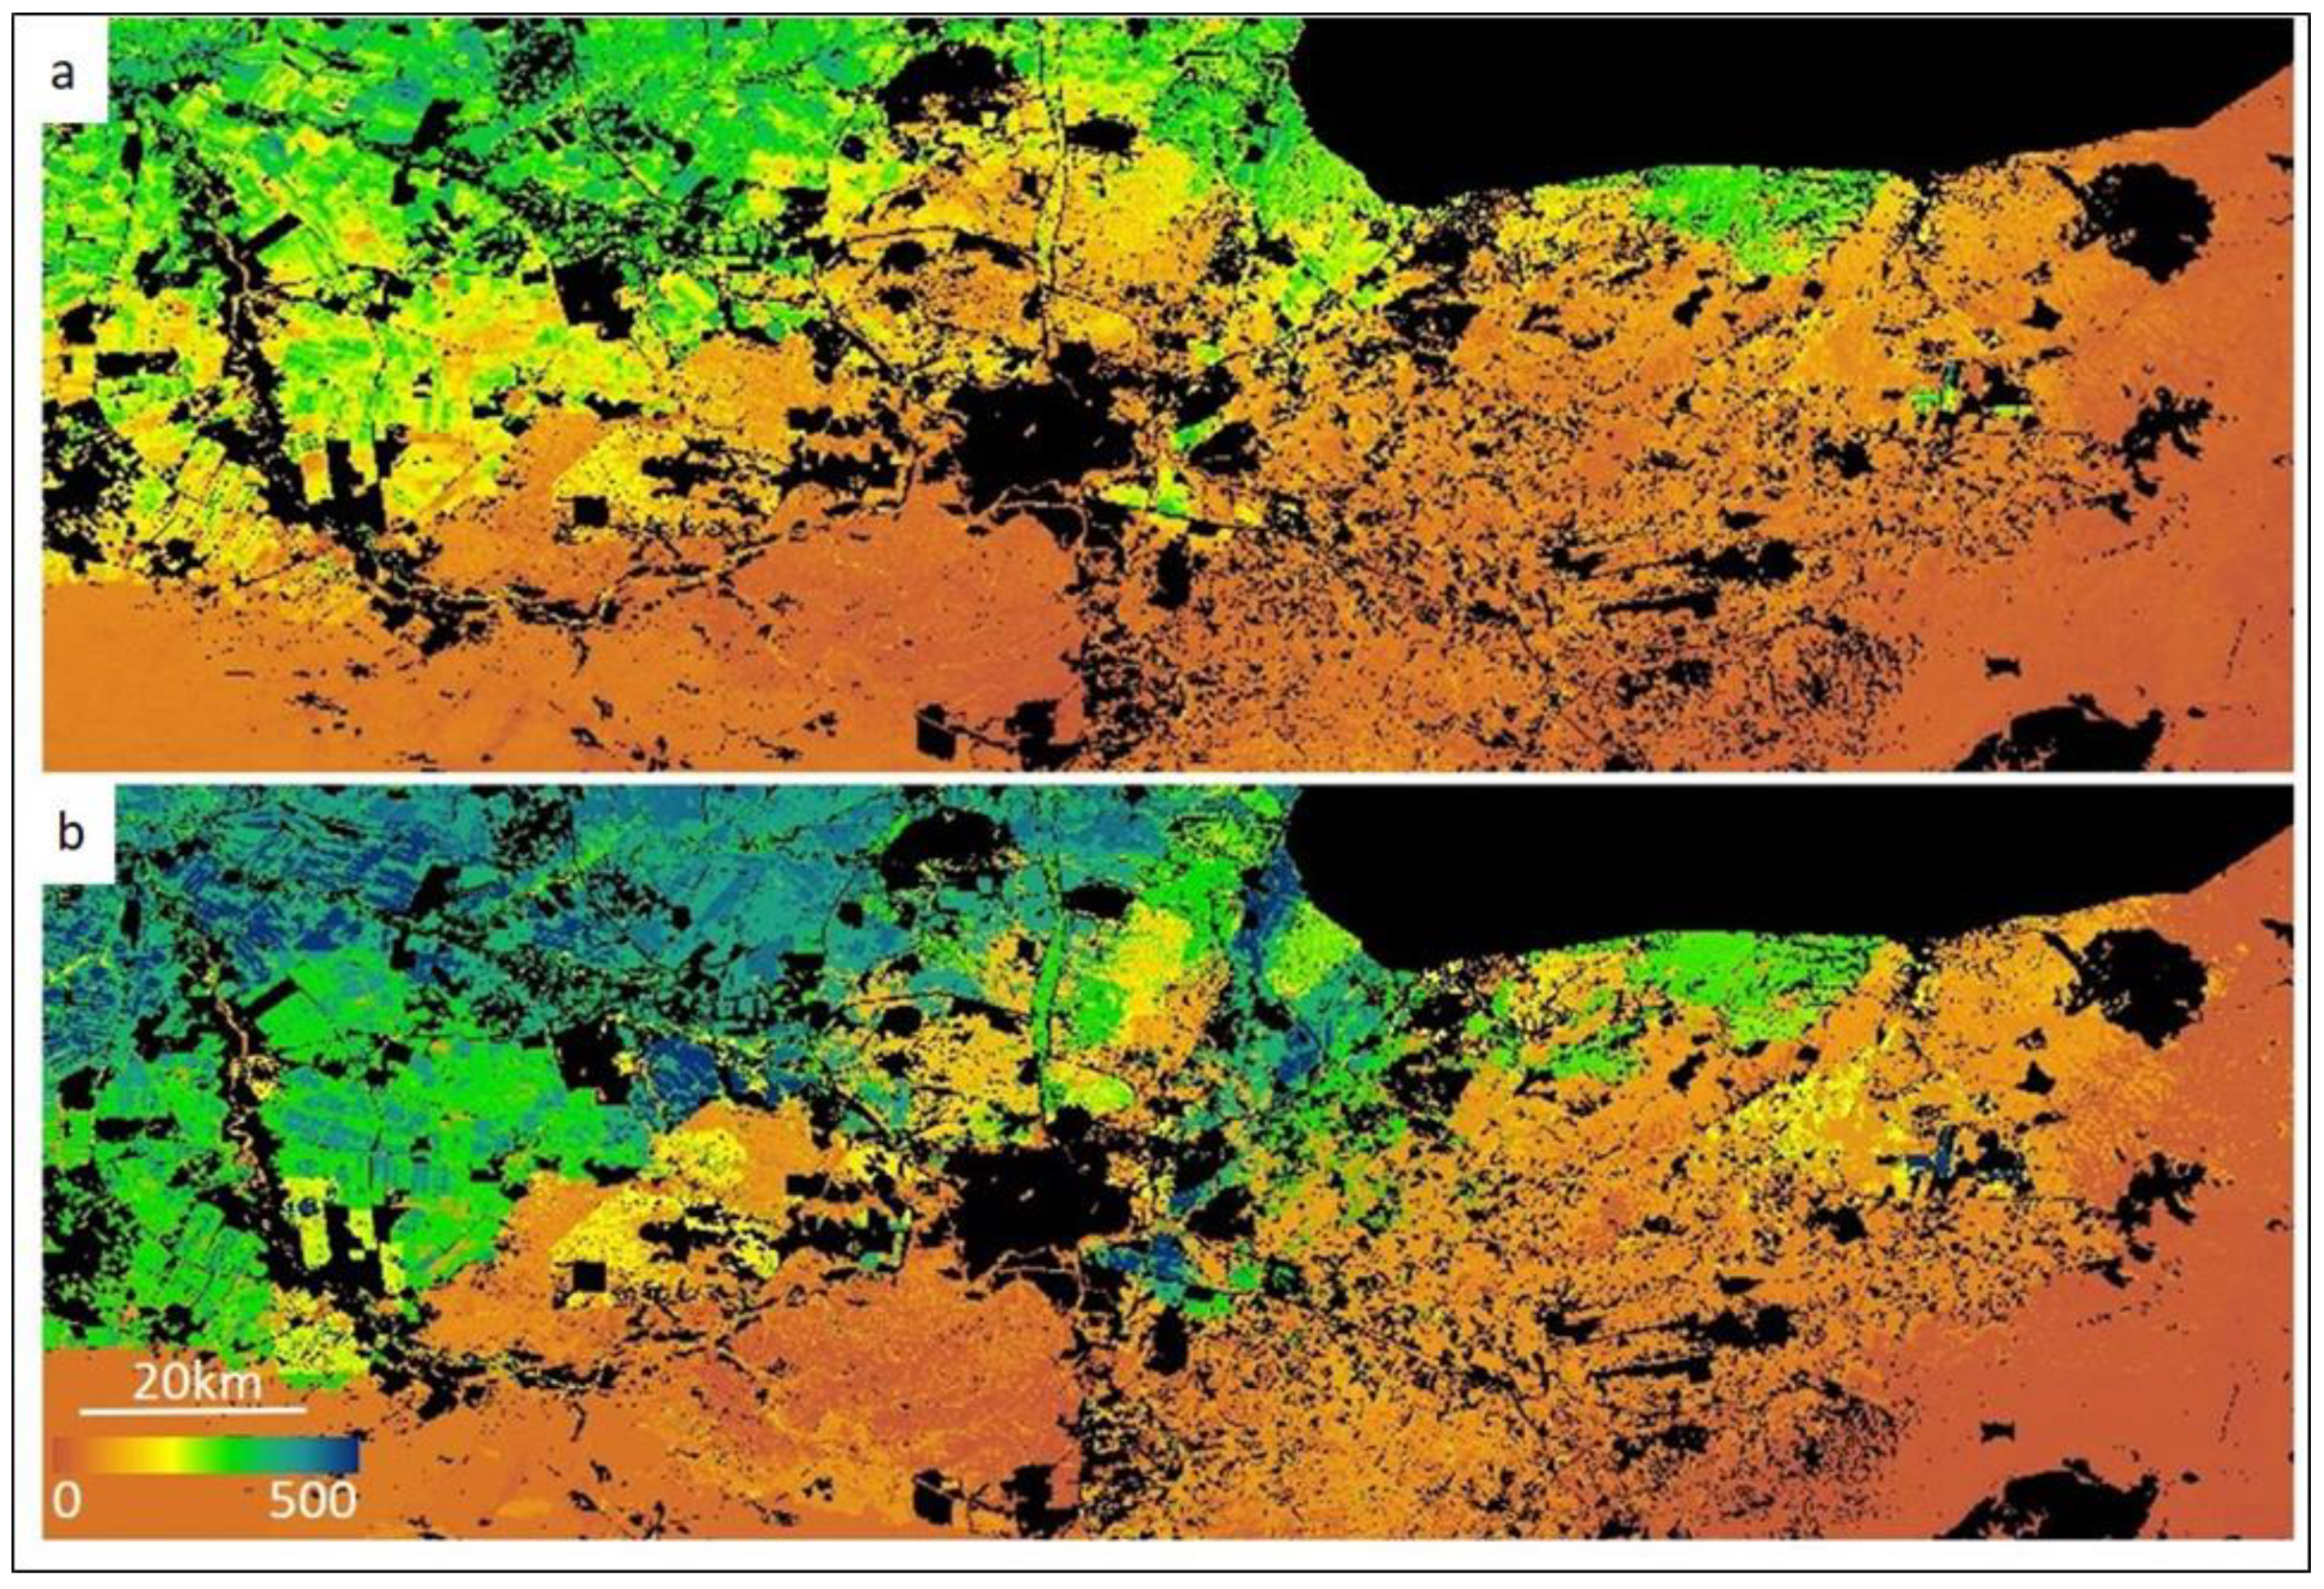
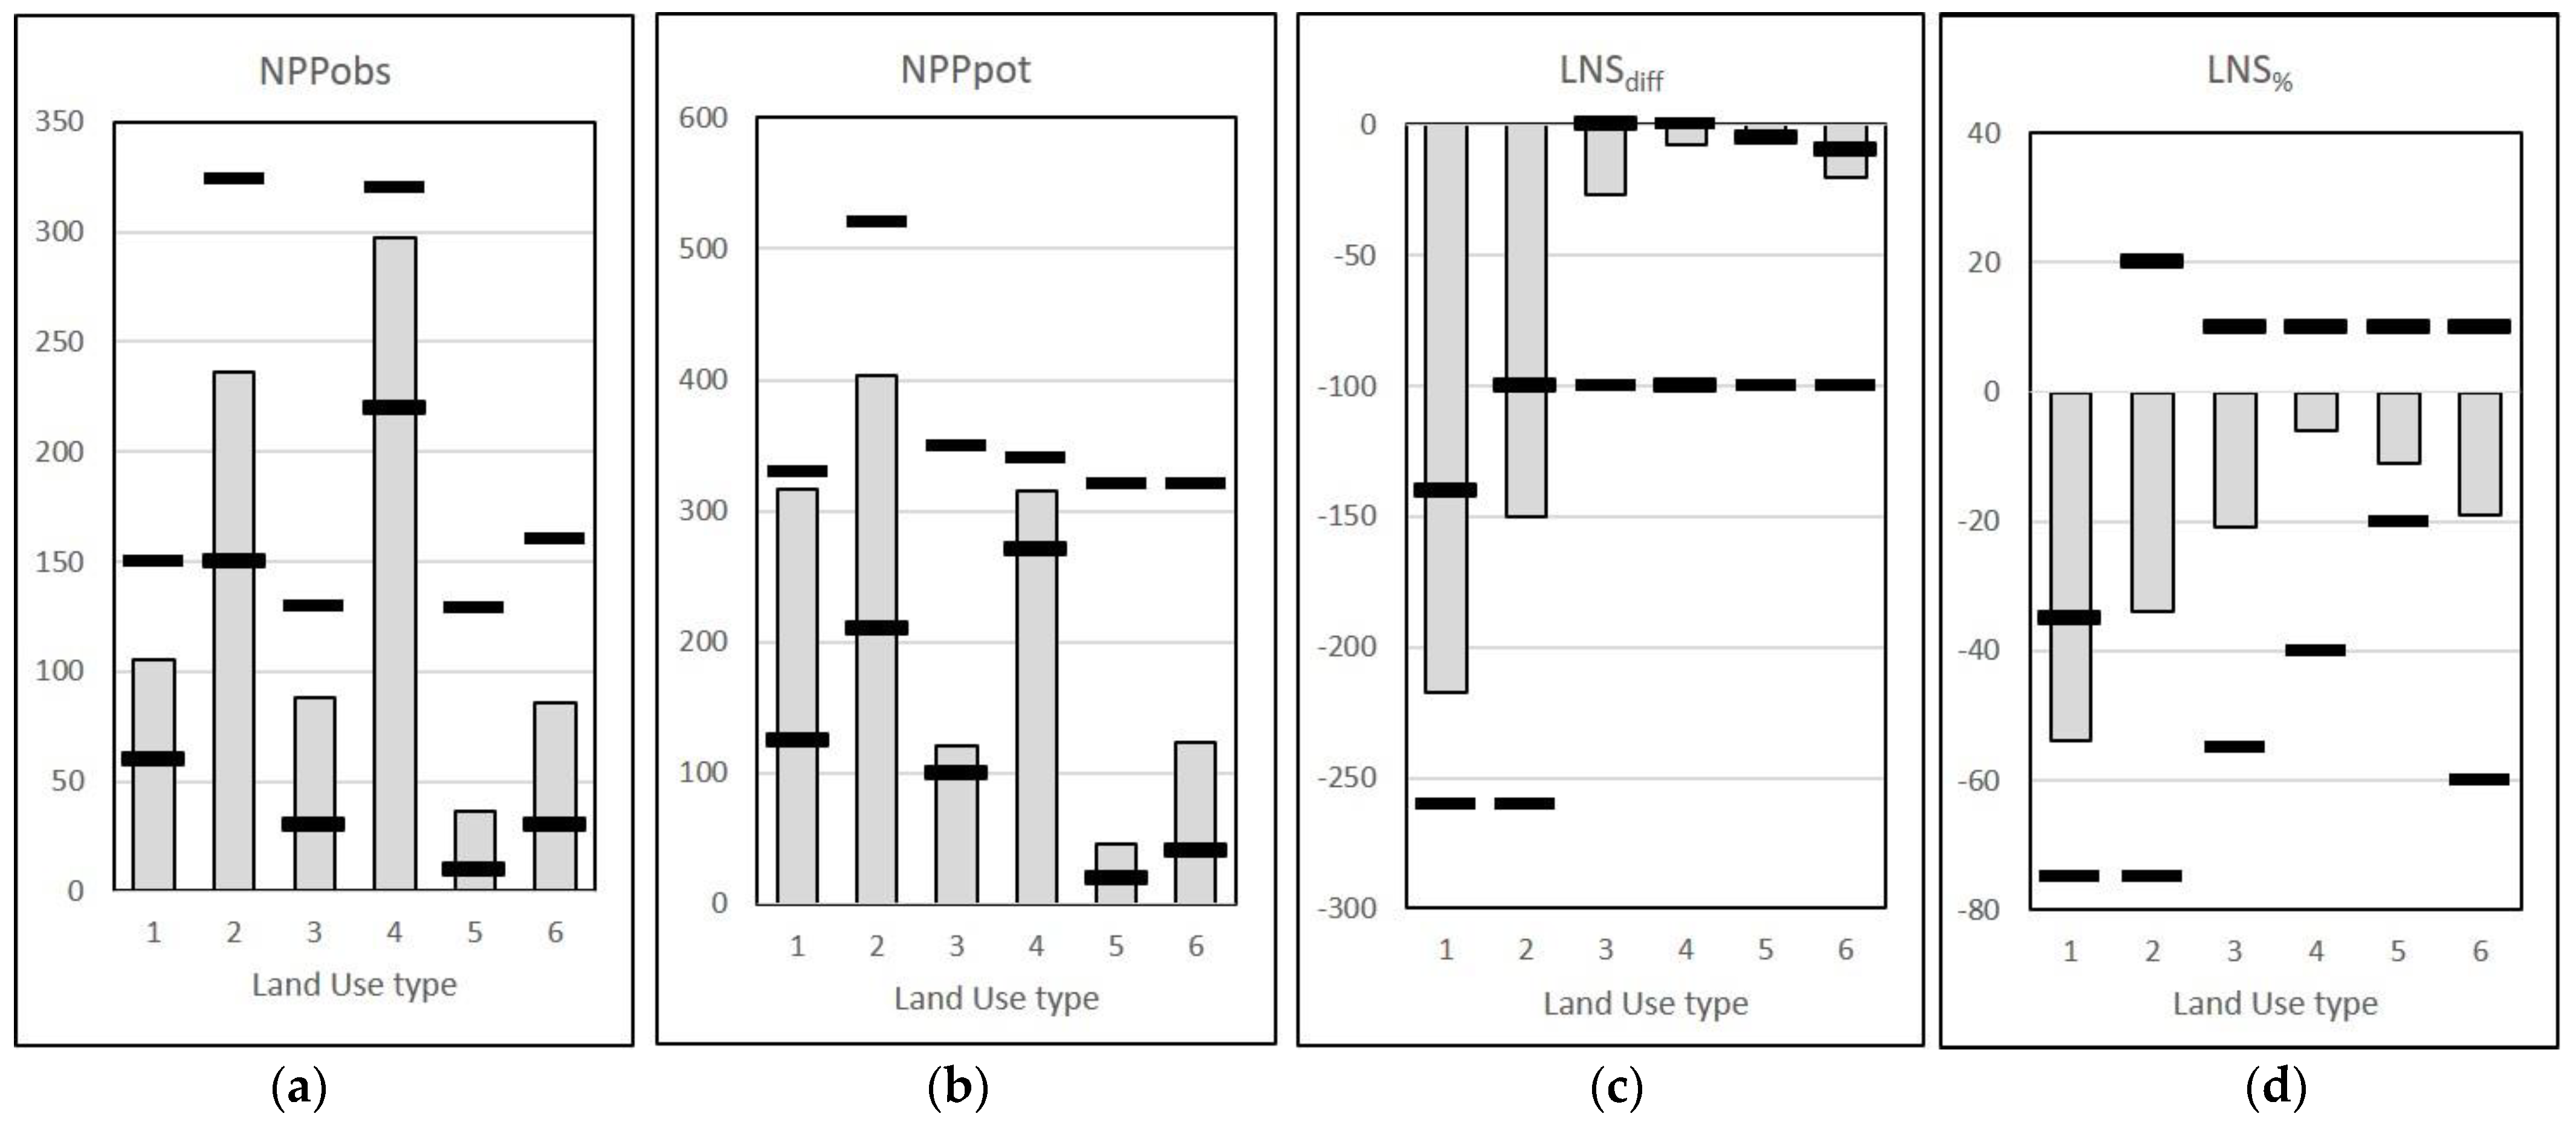
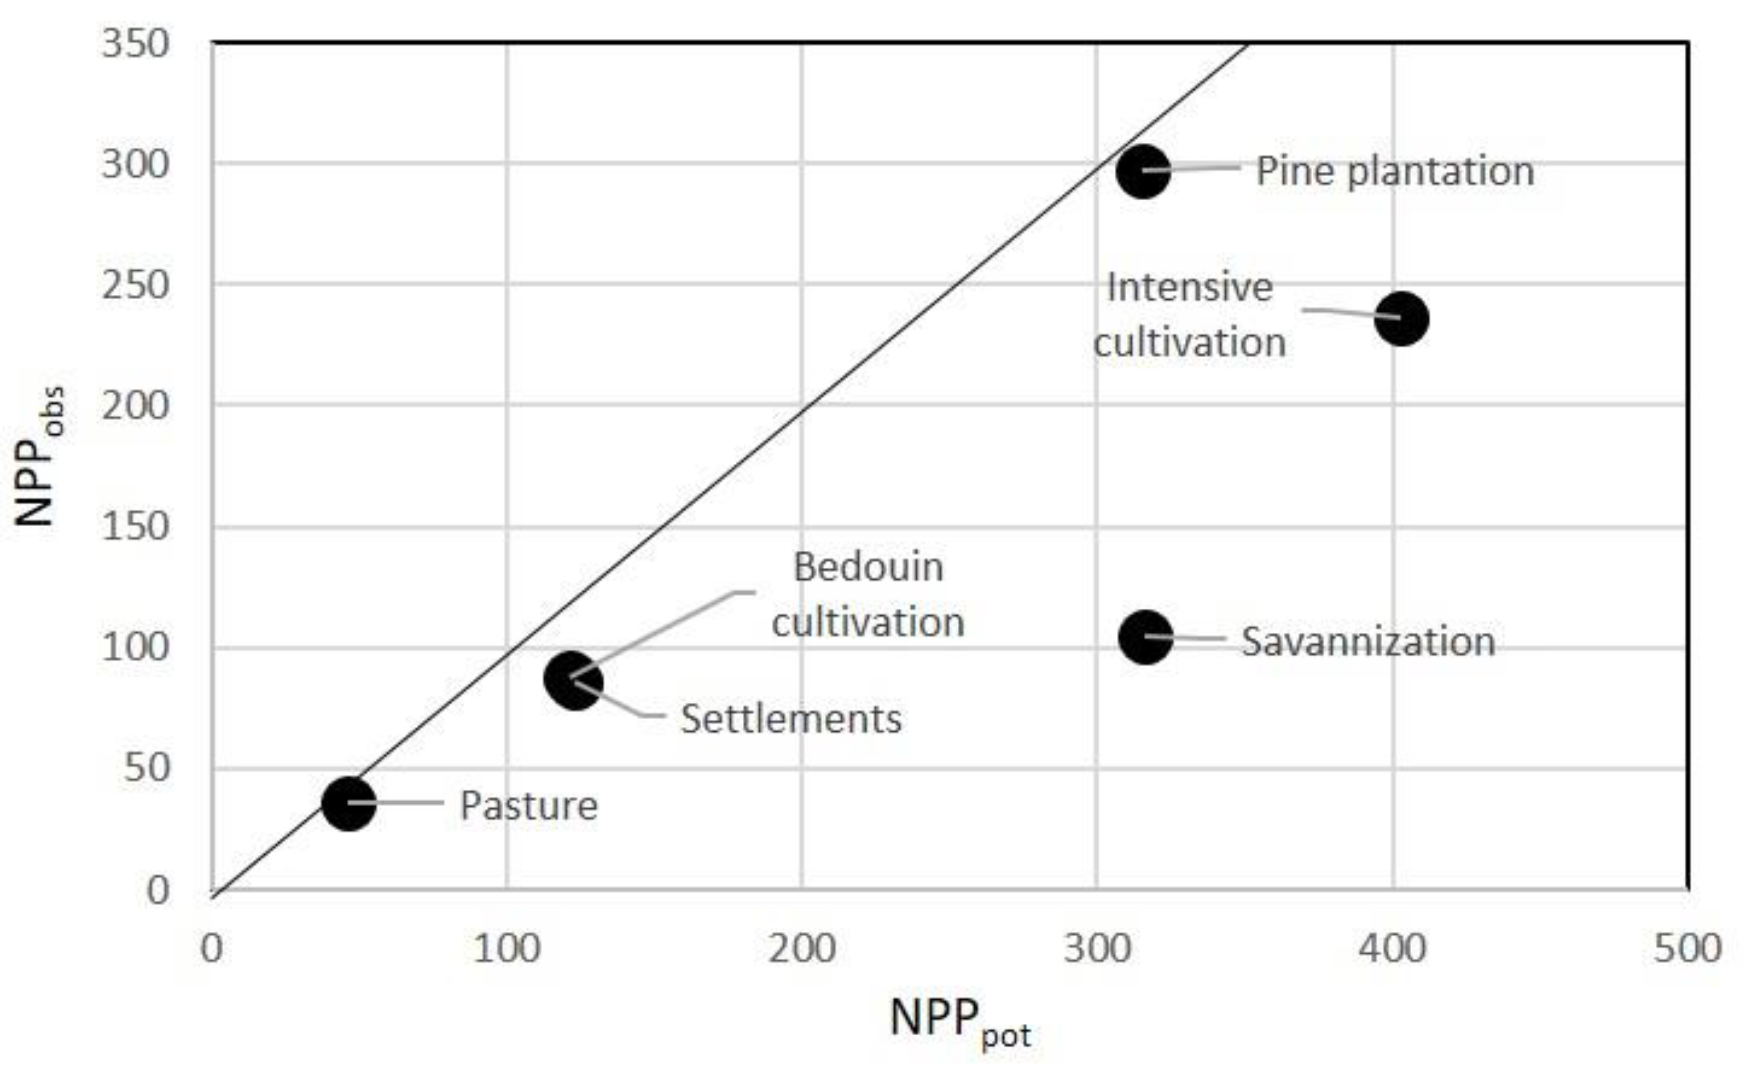
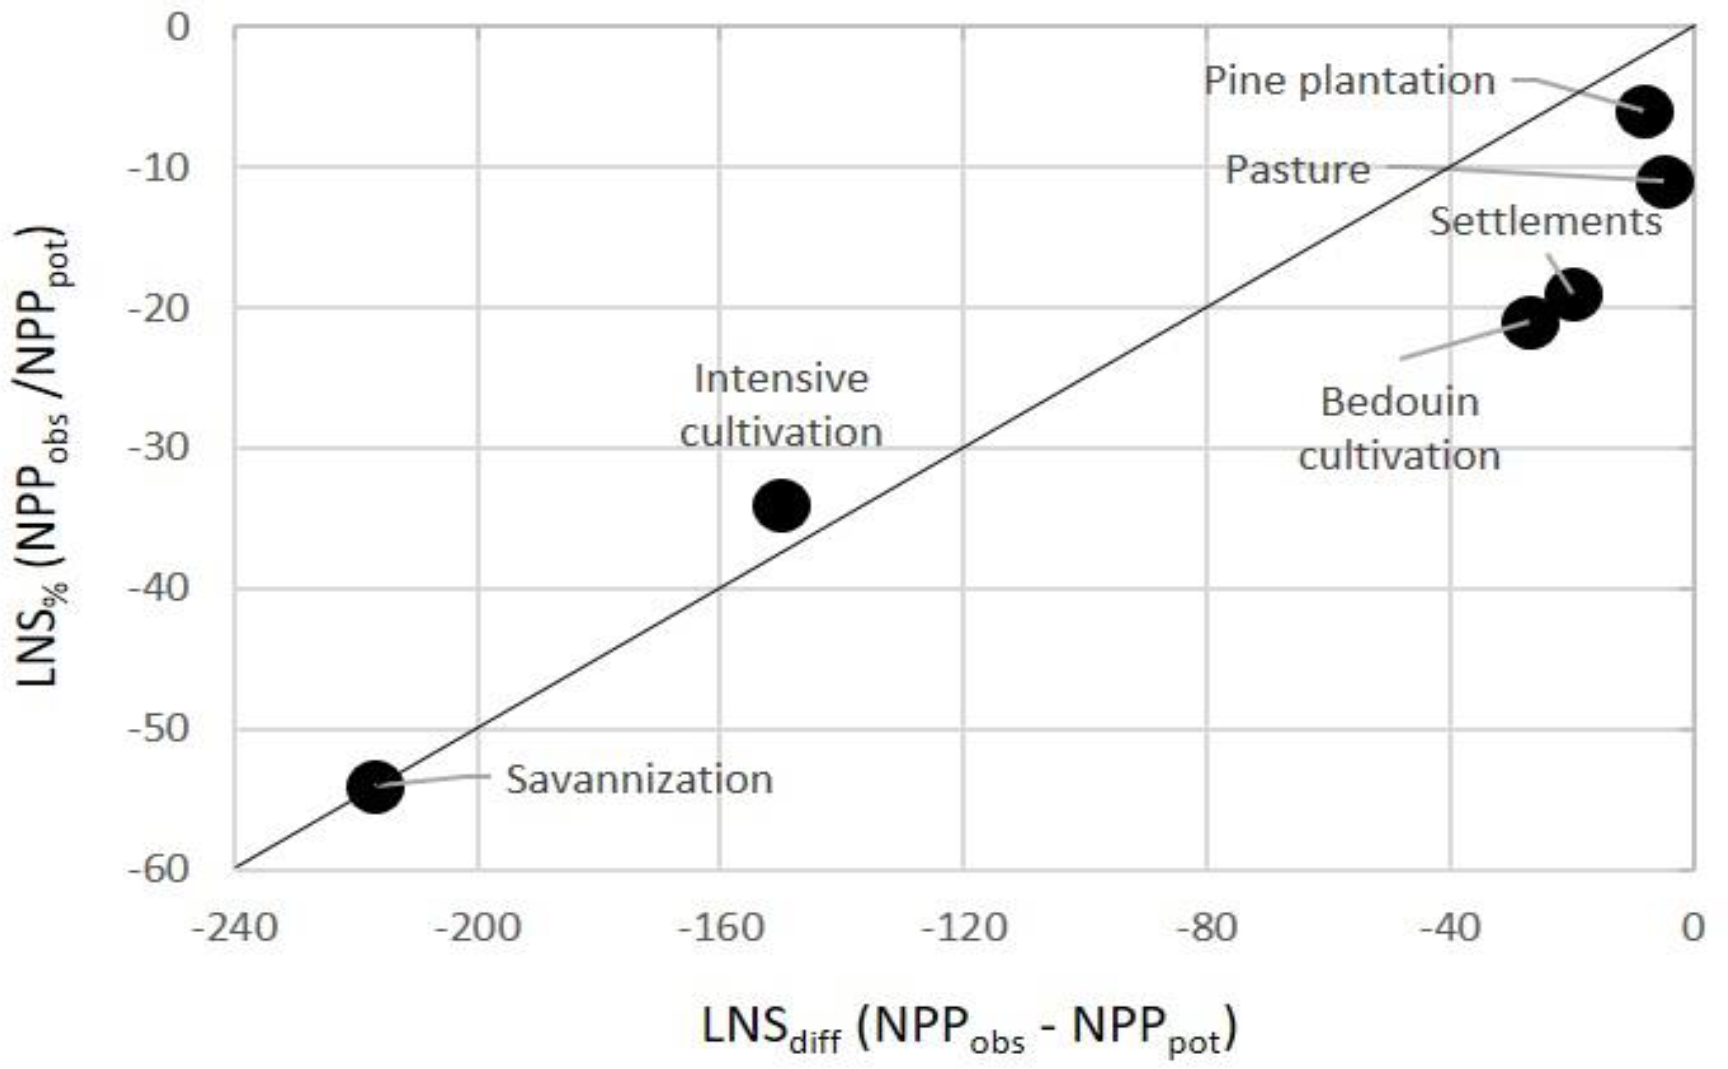
3.1. Differences between Potential and Actual NPP in the Entire Study Area

NPPobs and NPPpot are shown in Figure 3. Moderate or larger differences affected more than 50% of the study area (Figure 4). There was a wide range of values, from none to losses of more than 500 gC m−2yr−1. (For clarity, the values of LNS are referred to in five ranges: <34 gC m−2yr−1 = none-slight; 34–87 = low; 87–155 = moderate; 155–200 = high; >200 = extreme). In all LU classes, the higher the rainfall, the lower was NPPobs compared with NPPpot.
The modal values of frequency distributions of LNSdiff differed between LU types (Figure 5). For all LUs, apart from Pasture and Pine Plantation, the distributions had clear peaks, falling off above and below a mode, although all had long tails of low values. Pasture and Pine Plantation frequencies declined monotonically from a maximum near-zero LNSdiff. The frequency distributions were mostly asymmetric and could not be defined, so normal measures of dispersion could not be used. The spread of frequencies about the modes was therefore assessed using the range of LNS values between the upper and lower inflection points of the histograms.
The relative values of the difference in NPP expressed as LNSdiff and LNS% are shown in Figure 5. The highest LNS (least negative, i.e., least degraded) was in the Pasture class and the smallest in Savannization. Pine Plantation and Pasture were very similar, as were Bedouin Cultivation and Settlements. Intensive Cultivation had much smaller LNS values (more degraded) than the first four, and Savannization was even more so. The frequencies of LNS in Intensive Cultivation had a very wide range, often changing from low to high in adjacent fields. There were also some clear patterns in Pasture especially around Bedouin settlements, and a general decline into the drier areas to the S. There were somewhat lower values along the major valleys (e.g., 7 km S of Beer Sheva). In all LU classes, the higher the rainfall, the lower was NPPobs compared with NPPpot.
The LNS% (Figure 5) had very similar relative values as LNSdiff. However, there were some differences in their ranks.
While some of the LU types had similar LNS values, they were often quite different in their NPP (Figure 6 and Figure 7). For example, Pasture and Pine Plantation had LNSdiff of −11 and −6, respectively, but their corresponding NPPpot values were 46 and 315. Clearly, reductions in NPP occurred in both high and low NPP.

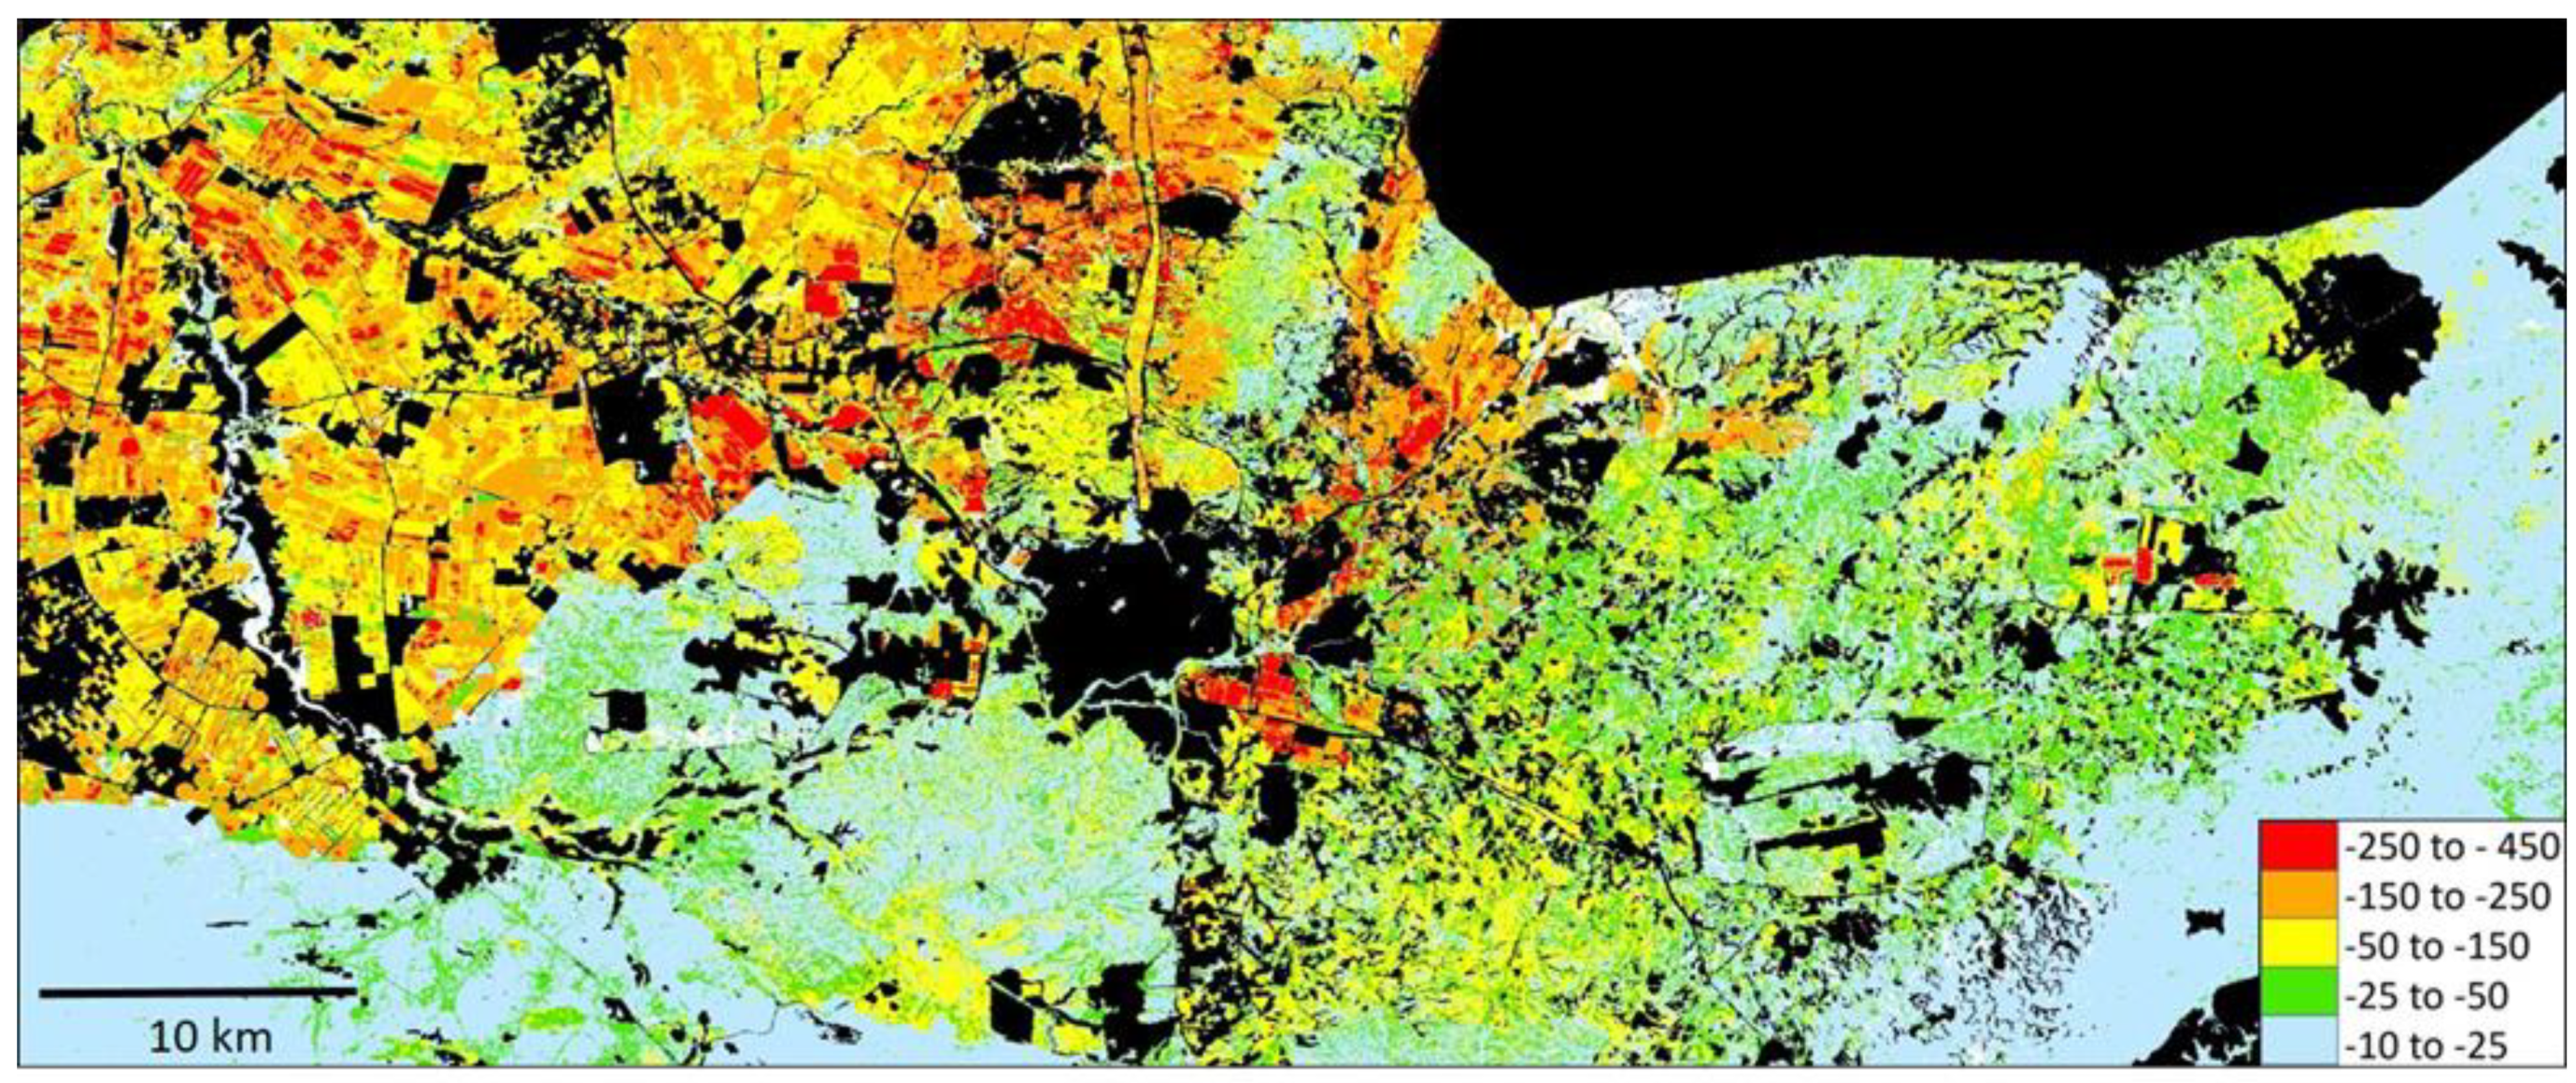
3.2. Reductions in NPP at Local Scale

3.2.1. Settlements

LNS between adjoining groups of dwellings, and along tracks and unmetalled roads was in the low-moderate class (Figure 8). Farther away, it was in the none-slight class. Wherever settlements bordered other types of LU, there was a noticeable transition to higher LNS. Overall, the NPP of Settlements was less than for Pasture.

3.2.2. Bedouin Cultivation

There was a pattern of moderately low NPP and LNS in the low-moderate range (Figure 9). Differences were much greater in the higher-precipitation areas, suggesting that cultivation is more damaging in drier zones. Some fields had smaller values, but this may have been an artifact of using a single date of satellite data that included years when fields may have been temporally without vegetation. However, unlike Intensive Cultivation, the single date of satellite data should have caused less bias, as Bedouin Cultivation follows the same phenology as natural vegetation.
A field survey near Qawa’in found frequent water erosion features immediately around habitations. Much of the land with low LNS had been ploughed, probably a number of years ago. Generally, the fields were on hilltops and the gentle slopes around these. Most erosion, however, was on the steeper slopes, which, although not ploughed, could have been grazed. There was lush vegetation in ephemeral streams that receive runoff following rainstorms, but too narrow for cultivation.

3.2.3. Intensive Cultivation

In Intensive Cultivation, there were some of the highest and some of the lowest LNS values of the entire study area (Figure 10). The strong contrasts between adjacent fields suggest that the variation was a result of the specific cultivation practices—mechanized cultivation, applications of fertilizers, and irrigation. Because the LNS was an average of individual acquisitions over 11 years, the contrasts between farm management in a single year would have been greater.

3.2.4. Pine Plantation

In the Aleppo Pine (Pinus halepensis) Plantations, there was little variation in NPP and high LNS, except along road margins, where vehicles may have caused disturbances, and on the edges of the forest where it abutted other LU types (Figure 11). The variation within the forest may have been a result of differences in planting densities.

3.2.5. Savannization

There were large differences in NPP and very low LNS in much of the savannized area. The planting of trees is preceded by earth-moving using heavy machinery to create terraces along slopes (Figure 12a), and so bare earth, may have been responsible for the extreme differences in NPP and, hence, low LNS (Figure 12b). Some small, mostly linear areas mainly along access tracks were less affected. While the earth movement would create low NPP, the maximum is likely to be set by residual areas of natural vegetation. However, if this were not the case, the potential would be lower and the LNS would underestimate degradation. There were strong contrasts with surrounding LUs as shown in Figure 12b.

3.2.6. Pasture

Overall, differences in LNSdiff were small (Figure 13). In the more heavily populated areas, NW of a line from Arad to Dimona, the differences increased, resulting in lower LNS. In the changeover zone, some of the areas with larger differences were linear, aligned with valleys (e.g., 7 km S of Beer Sheva). Large rates of gulley retreat have been reported in three individual drainage basins with LU similar to Pasture [26], and there were many gullies and eroded drainage channels visible in high-resolution images (Google Earth), but they did not extend dramatically between 2004 and 2013.

4. Discussion

The map of the potential (NPPpot) and actual (NPPobs) production (Figure 3) indicates significant degradation in the study area overall, and differences in the degree of degradation between LUs. The least degradation (high LNS) was in the Pasture class and the most in Savannization (Figure 5 and Figure 7). Pine Plantation and Pasture were very similar, as were Bedouin Cultivation and Settlements. There were some clear patterns in Pasture—lower LNS around Bedouin settlements and some variations along the major valleys to the south. Intensive Cultivation had a much lower LNS than the others LUs, except for Savannization which was dramatically low. LNS in Intensive Cultivation had a very wide range, from low in fallow to high in planted fields. In all LU types that spanned the north–south precipitation gradient, the most affected areas were in the north where rainfall (Figure 1), soils, and terrain were more favorable. Apart from Pasture and Pine Plantation, in which the highest frequencies of pixels were close to zero LNS, the frequency distributions of LNS had clear peaks (modes)—although with some overlap in ranges (Figure 5)—indicating distinct differences within each LU type.
Some of the LU types with similar LNS (Figure 5 and Figure 7) were quite different in their NPP (Figure 5 and Figure 6). For example, Pasture and Pine Plantation had LNSdiff of −5 and −8 gC m−2yr−1, respectively—a ratio of 0.625—but their corresponding NPPpot values were 46 and 315, a ratio of 6.800. Clearly, low LNS occurred in LUs with both high and low NPP.
The most severe reduction in NPP (Figure 4) was in Savannization. Preparation of the land before planting involves removing the vegetation and massive earth movement to create terraces to capture runoff water. However, as the trees mature, the land might be expected to recover. In the present study, the eleven years of data were averaged in order to control variation between years. Therefore, no conclusions can be drawn about the time series. On the other hand, some positive effects of savannization have been claimed [11,27], and first-century Nabateans supported extensive settlements by terracing [28]. Nevertheless, on the basis of many studies elsewhere, the recovery of disturbed natural land cover and productivity can be expected to take a long time [29]; even in the case of less severe disturbance in a prairie, there had not been a full recovery even after 80 yrs [30].
In Intensive Cultivation, the annual productivity was high, presumably because of the crops, irrigation, fertilizers, pesticides, the potential for year-round production, and adequate water for leaching to control salinization. However, it has limited potential for increasing regional NPP as it already occupies the most favorable soils and has high carbon costs associated with chemical inputs, mechanized cultivation, and irrigation.
There was relatively little difference between NPPpot and NPPobs within the Pine Plantation. Safriel et al. [31] concluded that some of the environmental effects of afforestation were less than expected, and large improvements in the energy, water, and carbon exchanges have been reported [32,33]. While these observations might suggest that pine plantations are candidates for mitigation of degradation elsewhere, as has been suggested [34], it would be limited as many trees did not survive a drought and no regeneration has been observed [12]. Moreover, any success would be at the expense of degradation elsewhere, over a much larger area than the plantation itself. These more dispersed effects include diversion of water that would otherwise reach other LU types [35], loss of pasture, destruction of natural vegetation including rare species, extensive heat island effects, and reductions in other ecosystem services [36]. Furthermore, these plantations produce no direct profits; rather, they require expensive management for establishment, maintenance, and protection.
Severe degradation is often said to occur in Bedouin-managed cultivation and pasture land, caused by overgrazing, damage to soil crust by trampling, and low-input cultivation [11,37], but this was found to be exaggerated. As is shown clearly in Figure 5 and Figure 7, these LU types were least affected. In fact, Bedouin Cultivation can increase NPP if there is some use of fertilizers. Some gullies and other water erosion features were found locally in the field survey near Qawa’in, and have been reported elsewhere, both in the northern Negev [38,39] and more generally [40]. However, while Google Earth imagery shows many gullies in this region, between 2004 and 2016 (the available data in Google Earth closest to the study period), no clear increases were detectable.
In the land surrounding settlements, there were moderate values of LNS, which was surprising given the disturbance due to vehicles, concentrations of livestock approaching overnight enclosures, and garbage dumps. This may have been an artifact caused by the almost complete degradation and, hence, an unrealistically low maximum used for NPPpot, which would suggest less degradation than in reality.

5. Conclusions

The reduction in NPP below a nondegraded baseline, measured here using LNS, is particularly suited to the detection of degradation in pastures, as there is no management beyond the selection of areas to be grazed by shepherds. However, in contrast to what is widely believed, the LNS technique indicated that the Bedouin pasture was little affected by degradation, similarly with Bedouin Cropping, which also has little management beyond cultivation. Thus, if the aim is to reduce degradation by maintaining the maximum primary production, the results do not support the restriction of traditional pastoralism or cultivation. The small degree of degradation found around settlements may be an artifact. In the three other land use types, Intensive Cropping, Pine Plantation, and Savannization, there was a significant degree of human intervention. Intensive cropping depends on fertilizers, pesticides, irrigation, and mechanical cultivation, and so the reference productivity is the maximum yield, not an undegraded condition. In this case, LNS should be interpreted as an additional metric for agronomic monitoring of the variation in production relative to the highest yield. In the Pine Plantations, the trees were densely planted and of one species, so there was little, if any, undegraded area and the LNS was high. However, in this case, various types of degradation are likely outside the plantation. In Savannization, an unexpected outcome of this investigation was the extreme degradation—eight times worse than Bedouin Cultivation and 43 times worse than Pasture. It is likely that this degradation is primarily driven by soil disturbance. Bedouin have been blamed for causing degradation in pastures, but this was found to be far less damaging than the large-scale earth works involved in savannization. Because of the extreme management in preparation for planting and, on the basis of many studies in similar dryland vegetation, little recovery can be expected in the medium term. This is all the more poignant as the aim of savannization was and still is to increase the productivity in the Negev.

Author Contributions

Conceptualization, S.P.; methodology, S.P. and U.S.; formal analysis, S.P.; original draft preparation, S.P.; writing—review and editing, S.P. and U.S. Both authors have read and agreed to the published version of the manuscript.

Funding

This research was partially funded by the United States Department of Agriculture Forest Service International Programs and by the University of Maryland.

Acknowledgments

We greatly appreciate the constructive comments from the anonymous reviewers.

Conflicts of Interest

The authors declare no conflict of interest.

References

  1. Rosen, S.A. Desertification and pastoralism: A historical review of pastoral nomadism in the Negev region. In Land Use, Land Cover and Soil Sciences; Encyclopedia of Life Support Systems (EOLSS); UNESCO: Oxford, UK, 2009. [Google Scholar]
  2. Portnov, B.A.; Safriel, U.N. Combating desertification in the Negev: Dryland agriculture vs. dryland urbanization. J. Arid Environ. 2004, 56, 659–680. [Google Scholar] [CrossRef]
  3. Blaikie, P.; Brookfield, H. Land Degradation and Society; Routledge: London, UK, 1987. [Google Scholar]
  4. Ben-David, Y. The Negev Bedouin: From nomadism to agriculture. In The Land that Became Israel; Yale University Press: New Haven, CT, USA, 1989; pp. 181–195. [Google Scholar]
  5. Orenstein, D.; Groner, E.; Lihod, O.; Muithui, W.L.; Krukowski, E.; Arnon, O.; Tal, A. The ecological impacts of homestead settlements in the Negev: Final report. In Proceedings of The Israel Ministry of Environmental Protection; Israel Ministry of Environmental Protection: Jerusalem, Israel, 2009. [Google Scholar]
  6. Degen, A.A.; Benjamin, R.W.; Hoorweg, J.C. Bedouin households and sheep production in the Negev desert, Israel. Nomadic Peoples 2000, 4, 125–147. [Google Scholar] [CrossRef]
  7. Kressel, G.M. Let Shepherding Endure: Applied Anthropology and the Preservation of a Cultural Tradition in Israel and the Middle East; State University of New York Press: Albany, NY, USA, 2003. [Google Scholar]
  8. Meir, A. As Nomadism Ends: The Israeli Bedouin of the Negev; Westview Press: Boulder, CO, USA, 1997. [Google Scholar]
  9. Kaplan, S.; Blumberg, D.G.; Mamedov, E.; Orlovsky, L. Land-use change and land degradation in Turkmenistan in the post-Soviet era. J. Arid Environ. 2014, 103, 96–106. [Google Scholar] [CrossRef]
  10. Wolff, P. Savanization-A concept to establish green belts in Israel’s desert areas. Tropenlandwirt 1992, 93, 93–102. [Google Scholar]
  11. Kaplan, M. National Outline Plan for Forests and Afforestation NOP 22 Policy Document; KKL-JNF: Jerusalem, Israel, 2011; 132p. [Google Scholar]
  12. Rotem, G.; Bouskila, A.; Rothschild, A. Ecological Effects of Afforestation in the Northern Negev; Environmental Protection Division, Society for the Protection of Nature in Israel: Tel Aviv, Israel, 2014. [Google Scholar]
  13. Arnon, A.; Svoray, T.; Ungar, E.D. The spatial dimension of pastoral herding: A case study from the northern Negev. Isr. J. Ecol. Evol. 2011, 57, 129–149. [Google Scholar] [CrossRef] [Green Version]
  14. Prince, S.D. Challenges for remote sensing of the sustainable development goal SDG 15.3.1 productivity indicator. Remote Sens. Environ. 2019, 234, 111428. [Google Scholar] [CrossRef]
  15. United Nations United Nations Convention to Combat Desertification in Countries Experiencing Serious Drought and/or Desertification, Particularly in Africa; U.N. Doc.; United Nations: New York, NY, USA, 1994.
  16. Higginbottom, T.; Symeonakis, E. Assessing land degradation and desertification using vegetation index data: Current frameworks and future directions. Remote Sens. 2014, 6, 9552–9575. [Google Scholar] [CrossRef] [Green Version]
  17. Prince, S.D.; De Colstoun, E.B.; Kravitz, L.L. Evidence from rain-use efficiencies does not indicate extensive Sahelian desertification. Glob. Chang. Biol. 1998, 4, 359–374. [Google Scholar] [CrossRef]
  18. Wessels, K.J.; Prince, S.D.; Malherbe, J.; Small, J.; Frost, P.E.; VanZyl, D. Can human-induced land degradation be distinguished from the effects of rainfall variability? A case study in South Africa. J. Arid Environ. 2007, 68, 271–297. [Google Scholar] [CrossRef]
  19. Prince, S.D.; Becker-Reshef, I.; Rishmawi, K. Detection and mapping of long-term land degradation using local net production scaling: Application to Zimbabwe. Remote Sens. Environ. 2009, 113, 1046–1057. [Google Scholar] [CrossRef]
  20. Prince, S.D.; Jackson, H. Unplanned natural experiments: The case of remote sensing of primary production and its environmental correlations in the Negev. Remote Sens. 2020, 12, 3581. [Google Scholar] [CrossRef]
  21. Ward, D.; Olsvig-Whittaker, L.; Lawes, M. Vegetation-environment relationships in a Negev desert erosion cirque. J. Veg. Sci. 1993, 4, 83–94. [Google Scholar] [CrossRef]
  22. Svoray, T.; Karnieli, A. Rainfall, topography and primary production relationships in a semiarid ecosystem. Ecohydrology 2010, 4, 56–66. [Google Scholar] [CrossRef]
  23. Central Bureau of Statistics. National Geographic Information (NGI) Land-Use Layer; Government of Israel: Jerusalem, Israel, 2009.
  24. Dan, J.; Yaalon, D.H.; Raz, Z.; Koyumdjisky, H.; Raz, Z. The Soils of Israel (with Map 1:500,000); Pamphlet 159; Agricultural Research Organization, Division of Scientific Publications: Bet Dagan, Israel, 1976.
  25. Prince, S.D. Spatial and temporal scales of measurement of desertification. In Global Desertification: Do Humans Create Deserts? Stafford-Smith, M., Reynolds, J.F., Eds.; Dahlem University Press: Berlin, Germany, 2002; pp. 23–40. [Google Scholar]
  26. Avni, Y. Gully incision as a key factor in desertification in an arid environment, the Negev highlands, Israel. Catena 2005, 63, 185–220. [Google Scholar] [CrossRef]
  27. Sachs, M.; Itshack, M. Savannization: An ecologically viable management approach to desertified regions. In Arid Lands Management. Towards Ecological Sustainability; Hoekstra, T.W., Shachak, M., Eds.; University of Illinois Press: Champaign, IL, USA, 1999; pp. 248–253. [Google Scholar]
  28. Singer, A. Soils of the Negev; Springer: Berlin/Heidelberg, Germany, 2007; ISBN 978-3-540-71731-7. [Google Scholar]
  29. Webb, R.H. Recovery of Severely Compacted Soils in the Mojave Desert, California, USA. Arid Land Res. Manag. 2002, 16, 291–305. [Google Scholar] [CrossRef]
  30. Peters, D.P.C.; Lauenroth, W.K.; Burke, I.C. The role of disturbance in community and ecosystem dynamics. In Ecology of the Short Grass Steppes: A Long-Term Perspective; Lauenroth, W.K., Burke, I.C., Eds.; Oxford University Press: Oxford, UK, 2008; pp. 84–118. [Google Scholar]
  31. Safriel, U.N.; Berliner, P.; Novoplansky, A.; Laronne, J.B.; Karnieli, A.; Moshe, I.; Kharabsheh, A.; Mohammad, A.G.; Kusek, G. Soil Erosion-Desertification and the Middle Eastern Anthroscapes. In Sustainable Land Management Learning from the Past for the Future; Kapur, S., Eswaran, H., Blum, W.E.H., Eds.; Springer-Verlag: Berlin/Heidelberg, Germany, 2011; ISBN 978-3-642-14781-4. [Google Scholar]
  32. Rotenberg, E.; Yakir, D. Contribution of semi-arid forests to the climate system. Science 2010, 327, 451–454. [Google Scholar] [CrossRef] [PubMed]
  33. Grünzweig, J.M.; Gelfand, I.; Fried, Y.; Yakir, D. Biogeochemical factors contributing to enhanced carbon storage following afforestation of a semi-arid shrubland. Biogeosciences 2007, 4, 891–904. [Google Scholar] [CrossRef] [Green Version]
  34. Schiller, G.; Atzmon, N. Performance of Aleppo pine (Pinus halepensis) provenances grown at the edge of the Negev desert: A review. J. Arid Environ. 2009, 73, 1051–1057. [Google Scholar] [CrossRef]
  35. Rohatyn, S.; Rotenberg, E.; Ramati, E.; Tatarinov, F.; Tas, E.; Yakir, D. Differential Impacts of Land Use and Precipitation on “Ecosystem Water Yield”. Water Resour. Res. 2018, 54, 5457–5470. [Google Scholar] [CrossRef]
  36. Derak, M.; Cortina, J. Multi-criteria participative evaluation of Pinus halepensis plantations in a semiarid area of southeast Spain. Ecol. Indic. 2014, 43, 56–68. [Google Scholar] [CrossRef]
  37. Meir, A.; Tsoar, H. International Borders and Range Ecology: The Case of Bedouin Transborder Grazing. Hum. Ecol. 1996, 24, 39–64. [Google Scholar] [CrossRef]
  38. Mor-Mussery, A.; Laronne, J.B. The effects of gully erosion on the ecology of arid loessial agro-ecosystems, the northern Negev, Israel. CATENA 2020, 194, 104712. [Google Scholar] [CrossRef]
  39. Stavi, I.; Perevolotsky, A.; Avni, Y. Effects of gully formation and headcut retreat on primary production in an arid rangeland: Natural desertification in action. J. Arid Environ. 2010, 74, 221–228. [Google Scholar] [CrossRef]
  40. Montgomery, D.R. Soil erosion and agricultural sustainability. Proc. Natl. Acad. Sci. USA 2007, 104, 13268–13272. [Google Scholar] [CrossRef] [PubMed] [Green Version]
Figure 1. Study area. (a) Names of locations mentioned in the text, isohyets [18] in yellow, and detailed study areas. (b) IGU land use classification [22]. Land use types are indicated by color and IGU LU class composition in parentheses: black and white (600)—excluded areas—mainly habitation and other buildings; tan, pasture (601, 603, 606, 611, 612, and 616); light green, cultivation (608); dark green, planted forest (624): background image in (a) from Google Earth, inset modified from Geolounge.
Remotesensing 13 02884 g001
Figure 2. Schematic diagram of data processing steps. Boxes 1 and 5 are the data inputs and 9–10 the outputs used in the analyses.
Remotesensing 13 02884 g002
Figure 3. Primary production (NPP) of the study area calculated from Landsat data. (a) Observed NPP (NPPobs); (b) potential NPP (NPPpot). Means for 2001–2010 and 2012 in gCm−2 yr−1. The difference between NPPobs and NPPpot is shown in Figure 4.
Remotesensing 13 02884 g003
Figure 4. Degradation measured by Local NPP Scaling (LNS), by calculation of the difference between actual and potential LNS (NPPobs-NPPpot, in gC m−2yr−1 (Figure 3). The more negative the value, the greater the reduction in NPP.
Remotesensing 13 02884 g004
Figure 5. Modal values (columns) and ranges (bars) of (a) NPPobs, (b) NPPpot, (c) LNSdiff, and (d) LNS%, in gC m−2yr−1. Bars indicate the upper and lower inflection points in the frequency distributions—not confidence limits. Land Use Types: 1, Savannization; 2, Intensive Cultivation; 3, Bedouin Cultivation; 4, Pine Plantation; 5, Pasture; 6, Settlements.
Remotesensing 13 02884 g005
Figure 6. Observed NPP (NPPobs) and potential NPP (NPPpot) for the six LU types, in gC m−2yr−1. The line passes through equal values of NPPobs and NPPpot.
Remotesensing 13 02884 g006
Figure 7. Local NPP Scaling (LNS), expressed as differences in gC m−2yr−1 and ratios of potential (NPPpot) and observed (NPPobs) for the six land use types. The line indicates a constant ratio of LNSdiff/LNS%.
Remotesensing 13 02884 g007
Figure 8. Differences in NPP in close proximity to small Bedouin settlements, 6 km E of Hura and 5 km N of Nevatim Air Force base (31°16.14′N, 35°0.24′E). (a) True color image with settlements masked; (b) LNSdiff (gC m−2yr−1).
Remotesensing 13 02884 g008
Figure 9. Bedouin Cultivation showing small fields and noncultivated patches, 5 km NW of Kuseife (31°16.89′N, 35°4.96′E). (a) True color image with settlements masked; (b) LNSdiff (gC m−2yr−1).
Remotesensing 13 02884 g009
Figure 10. Intensive rainfed and irrigated cultivation NE of Hatzerim Air Base (31°17′N, 34°36′E). (a) True color image; (b) LNSdiff (gC m−2yr−1).
Remotesensing 13 02884 g010
Figure 11. Aleppo Pine (Pinus halepensis) Plantation in Yatir forest (31°20.82′N, 35°2.34′E). (a) True color image; (b) LNSdiff (gC m−2yr−1).
Remotesensing 13 02884 g011
Figure 12. Savannization—areas enclosed in blue lines. 1 km S of Afeinish (31°18.46′N, 35°0.18′E). (a) True color image; (b) LNSdiff (gC m−2yr−1).
Remotesensing 13 02884 g012
Figure 13. Pasture 3 km SE of Shaqid al-Salam (31°10.68′N, 34°51.84′E). (a) True color image; (b) LNSdiff (gC m−2yr−1).
Remotesensing 13 02884 g013
Table 1. The six land use types used in the study, and locations of detailed study sites (also shown in Figure 1). Land use from [23] and JNF (Jewish National Fund, Keren Kayemet LeYisrael) [personal communication], and soil types from [24].
Land Use (LU)Descriptions and Locations of Detailed Study Sites
PastureN and E of Hura on brown lithosols and loessial serozems.
Land neither in “agriculture” (NGI class 608) nor “Area with no known characteristic” (NGI Class 600).
A rectangle, coordinates: NW corner 31°26.07590′N, 34°48.57397′E; and SE corner 31°7.26285′N, 35°16.89856′E.
Bedouin CultivationWidespread, but discontinuous E and SE of Beer Sheva, on soils with some loess content.
NGI “cultivated land” (Class 608). A rectangle, coordinates: NW corner 31°20.03342′N, 34°55.70703′E; and SE corner 31°9.9272′N, 35°6.93125′E.
SavannizationLow hills and slopes N of 200–250 mm isohyet on loess-derived soils.
JNF Forest Class #4306. A triangle with coordinates: NW corner 31°18.14239′N, 34°58.96162′E; SE corner 31°19.33678′N, 35°0.98675′E; and E corner 31°17.47428′N, 35°0.56376′E.
Pine PlantationSouthern Judean Mountains, mostly N of 350 mm isohyet. Highest altitude and steepest hills of the study region. Mediterranean Brown Forest soils.
NGI “Planted Forest” (Class 624). A rectangle, coordinates: NW corner 31°21.52207′N, 35°1.27208′E; and SE corner 31°20.05874′N, 35°3.3906′E.
Intensive CultivationNW corner of the study area plus small patches N of Beer Sheva. N of 150 mm isohyet, except for some scattered, small, irrigated settlements in the desert. On sandy Regosols, ending at an abrupt southern boundary with the Halutza sands.
NGI “Cultivated land” (Class 608). A rectangle, coordinates: NW corner 31°23.08152′N, 34°29.40977′E; and SE corner 31°11.5804′N, 34°20.13461′E.
SettlementsA ribbon, 90 to 390 m, surrounding “Area with no known characteristic” (NGI class 600). In a rectangle, coordinates: NW corner 31°19.97237′N, 34°57.06559′E; and SE corner: 31°13.77283′N, 35°7.17938′E.
Table 2. Data processing steps.
StepProcedure
1NDVI calculated using Landsat 5 bands 3 (630–690 nm) and 4 (750 to 900 nm), Path 174, Row 38. Data were for the years 2001–2010 and 2012. 2011 was omitted owing to poor data. In order to capture as near as possible the peak growing season, and also owing to gaps between suitable acquisitions, the dates of the Landsat were different between years—from day 19 to 141. As the purpose of this study was to make spatial comparisons, these interannual differences were of less consequence, although the patterns of NPP may have changed with seasons, so interannual geographic comparisons may sometimes have been inaccurate. However, they captured most aspects of the spatial variation in the MODIS MOD13Q1 NPP. The spatial resolution of Landsat 30 m (0.1 ha) was appropriate since coarser and finer resolutions make attribution to human activities more difficult.
2Growing-season NDVI for each Landsat scene was converted to NPP by regression with NPP from MOD17A3 [18] for the peak of the growing season in each year. MOD17A3 data have a 1 km2 resolution—approximately 11 times coarser than that of Landsat—and, therefore, a finer resolution was obtained by interpolation. Furthermore, MOD17A3 does not cover all the study area, so the calibration had to be made at the northern margins of the Landsat scene. The observed NPP measured using Landsat is referred to as “NPPobs” throughout the text.
3High outliers removed from the data for each year.
4Average NPP calculated from the 11 annual data sets.
5Co-register the environmental data most directly controlling NPP, and for which gridded data exist.
6Environmental data used to classify the study area into land capability classes (LCCs) in which they are uniform and distinct from the other LCCs.
7Segment the NPPobs data with the map of LCCs. Note that NPPpot is the same for all pixels in an LCC.
8Find the 80th percentile (>80th rejected to remove outliers) in the frequency distribution of NPPobs values within each LCC. This is the estimator of the potential NPP (NPPpot), which is the NPP that would occur in the absence of human activity, in a uniform environment [20].
9The divergence between NPPpot and actual observed NPP (NPPobs) calculated as a difference (LNSdiff = NPPobs − NPPpot).
10The ratio of NPPobs and NPPpot (NPPobs/NPPpot) expressed as a percentage for each pixel.
Publisher’s Note: MDPI stays neutral with regard to jurisdictional claims in published maps and institutional affiliations.

