Abstract
Detecting animals to estimate abundance can be difficult, particularly when the habitat is dense or the target animals are fossorial. The recent surge in the use of thermal imagers in ecology and their use in animal detections can increase the accuracy of population estimates and improve the subsequent implementation of management programs. However, the use of thermal imagers results in many hours of captured flight videos which require manual review for confirmation of species detection and identification. Therefore, the perceived cost and efficiency trade-off often restricts the use of these systems. Additionally, for many off-the-shelf systems, the exported imagery can be quite low resolution (<9 Hz), increasing the difficulty of using automated detections algorithms to streamline the review process. This paper presents an animal species detection system that utilises the cost-effectiveness of these lower resolution thermal imagers while harnessing the power of transfer learning and an enhanced small object detection algorithm. We have proposed a distant object detection algorithm named Distant-YOLO (D-YOLO) that utilises YOLO (You Only Look Once) and improves its training and structure for the automated detection of target objects in thermal imagery. We trained our system on thermal imaging data of rabbits, their active warrens, feral pigs, and kangaroos collected by thermal imaging researchers in New South Wales and Western Australia. This work will enhance the visual analysis of animal species while performing well on low, medium and high-resolution thermal imagery.
1. Introduction
Recent advances in remotely piloted aircraft (RPA; a.k.a. drones, unmanned aerial vehicles) and imaging technologies have enabled a marked increase in non-invasive monitoring of animals in recent years [1,2,3,4]. The addition of thermal imaging technology offers an opportunity to not only improve the detection of target species, but, in the case of fossorial animals, their habitats as well [5,6,7]. However, manual detection of animals, habitat identification, and estimation of population size are cumbersome as they require frame-by-frame analysis of hours of video data. Some automated approaches have been proposed recently [8,9,10,11,12,13]. However, they often lack usability due to low accuracy, ineffectiveness against occlusion, visible spectrum limitations, and low detection speed. Thus there is a need for an intelligent, fully automated detection system.
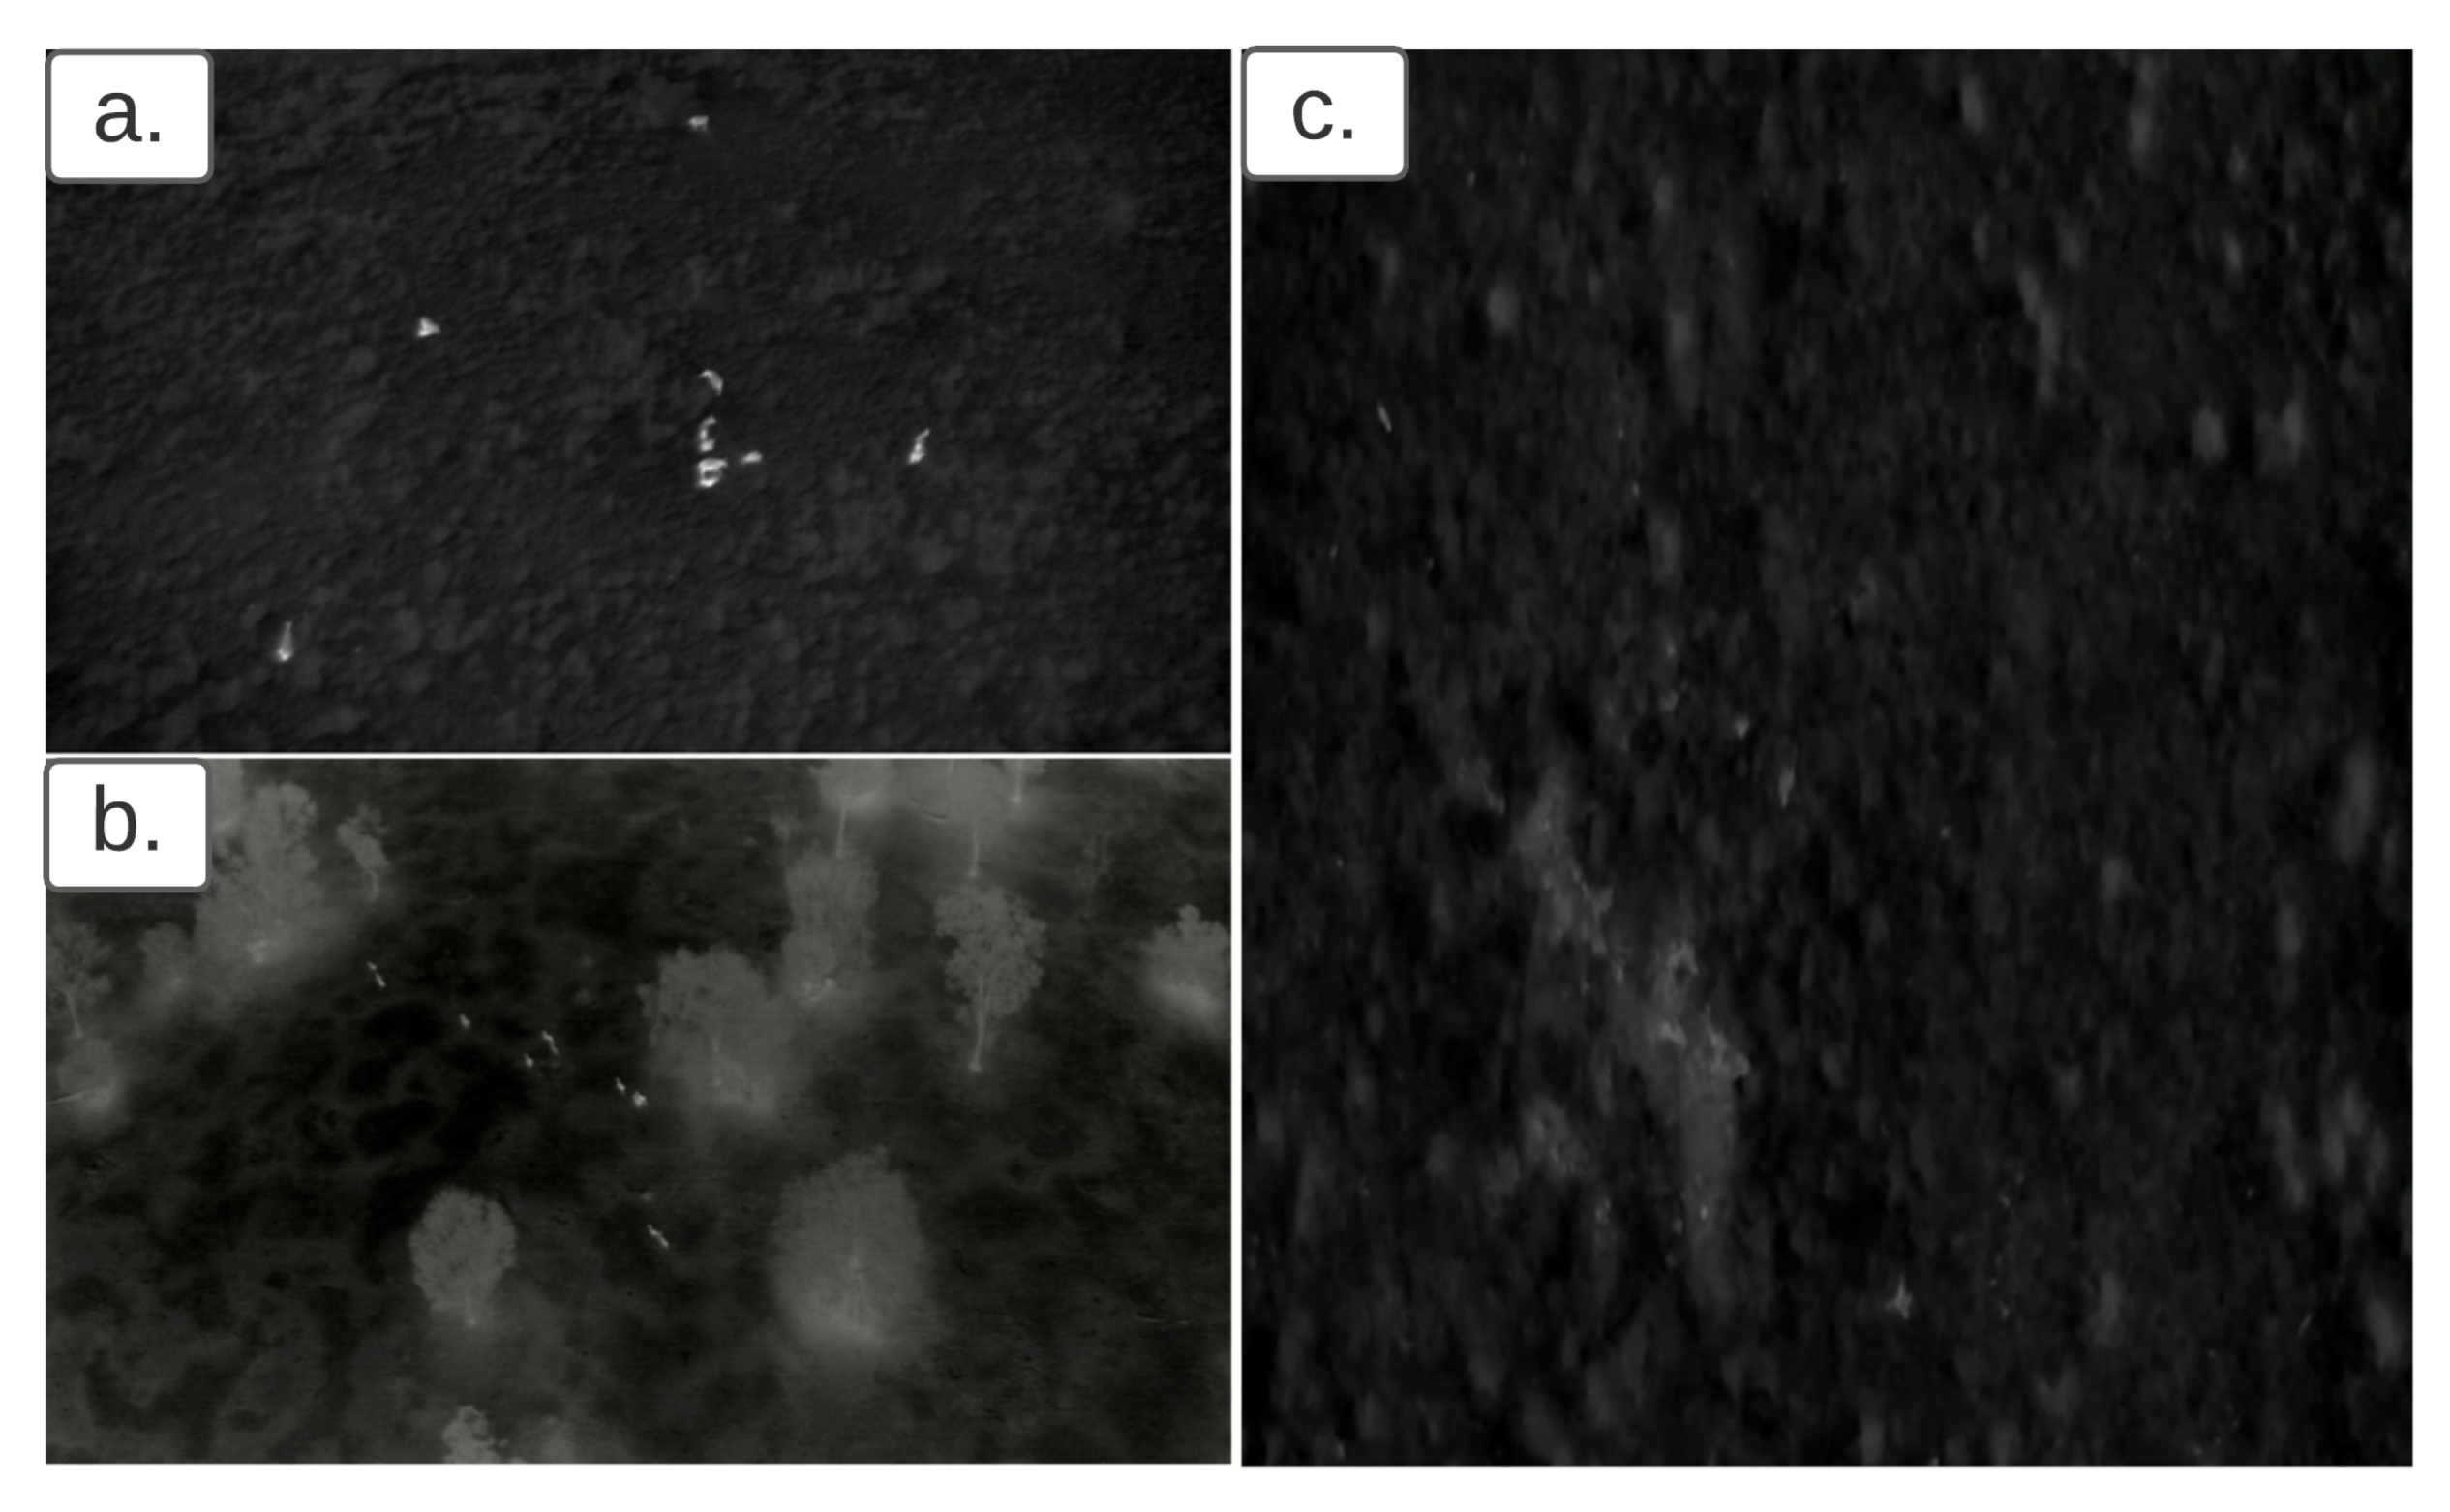
Two main factors affect the success of automated approaches: target animal size and thermal image quality. Large mammals (≥350 kg) are typically obvious with strong thermal signatures and many pixels per animal (Figure 1a). Medium-bodied mammals (15–350 kg) can also be readily identified in an automated process, provided image quality is good, and the signature is not obscured by vegetation (Figure 1b). For smaller mammals, (≤15 kg) automated identification can be difficult even with high-quality thermal imagery in ideal conditions. Thermal signatures are often weaker, and there are fewer pixels per animal (Figure 1c). As object size becomes very small, even manual identification and tagging of correct thermal signatures is problematic. As lower altitude flights often disturb animals, high altitude flights are preferred among the research community. This poses further detection quality challenges.

Figure 1.
Larger animals ((a) cattle, (b) goats) have stronger thermal imagers and greater pixels per animal than much smaller animals ((c) rabbits—two individuals top left of the image). (Image (a,b) taken from footage collected on the VayuHD. Image (c) taken from footage collected on the Jenoptik VarioCamHD).
Deep learning has revolutionised object detection, and various deep object detection approaches exist in the literature. Some of the notable techniques include Region-based Convolutional Neural Networks (RCNN) [14], Fast-RCNN [15], Faster-RCNN [16], Mask-RCNN [17], Feature Pyramid Network (FPN) [18], Single-shot multibox Detector (SSD) [19], and You Only Look Once (YOLO) [20]. The RCNN family of detectors comprises two-stage detectors based on the concept of region proposals requiring considerable processing time and unsuitable for fast and real-time object detection. SSD [19] and YOLO [20] are one stage or one-shot detectors. SSD is very slow for detection tasks due to the sliding window approach, while YOLO outperforms these in terms of accuracy and processing time approaches. As YOLO initially is trained on the MS COCO dataset [21], its performance suffers if objects are tiny and the receptive field is limited. YOLOv3 [22] uses DarkNet-53 for feature extraction and introduces the Feature Pyramid to detect small objects at different scales. FPN predicts small-scale objects in the shallower layers with low semantic information, which might not be sufficient to classify small objects.
Our work is related to YOLO [20] and its improved versions [22,23]. Some recent work on small object detection from a distance is related to our work. An improved version of YOLO for UAV called UAV-YOLO [24] tried to improve small object detection through YOLO. It included a few more convolution layers and shortcut connections to improve the model. However, the basic limitations of subsampling remain unaddressed. In this work, we addressed the major weakness of convolution operation and aggressive subsampling and proposed a better YOLO; we called it Distant-YOLO (D-YOLO) as we detect animals from a distance.
Due to striding and pooling, the small-scale objects disappear in the deep convolution layers. Therefore, the removal of pooling and striding can improve the existing YOLO scheme to detect smaller objects. Meanwhile, YOLOv4 [23] presents new findings. However, its scope is to increase the overall speed and accuracy of the MS COCO dataset using a different bag of features and bot to increase small object detection in thermal imaging. In this work, we address the above weaknesses by introducing the proposed D-YOLO for small object detection. It enables us to propose an animal detection system with improved accuracy on imagery captured from consumer-level thermal cameras mounted on an aerial platform.
We claim the following contributions in this paper:
- We introduce animal detection from a high altitude with improved accuracy and speed using a deep learning-based object detection approach.
- We improve traditional YOLO by considering model training and structure optimisation to detect smaller and more distant objects.
- We validate our process on an extensive thermal video dataset collected by thermal imagery researchers. This dataset was very challenging as it included low resolution imagery of small animals like rabbits, and imagery of animals that, under certain conditions, can have similar thermal signatures, such as pigs and kangaroos.
2. Materials and Methodology
This section will present our data collection, data pre-processing, the proposed system architecture, and methodology. The details about each step are as follows:
2.1. Data Collection
Target species: We selected three target species for this work: the European rabbit (Oryctolagus cuniculus), feral pigs (Sus scrofa), and kangaroos (Macropodidae). Rabbits and pigs were selected due to the large datasets of existing thermal imagery available for use. Kangaroos were chosen as they are found in almost all habitats in Australia and are regularly captured on thermal imaging surveys for other species. To perform this study, we first established an image database. The imagery in this database was collected by the Department of Primary Industry, New South Wales (NSW), and the Department of Primary Industries and Regional Development, Western Australia.
In the proposed work, we used the deep neural network-based object detection method for animal detection in thermal imaging data.
Thermal imager types and specifications: Thermal imagery was collected via several platforms with a range of thermal imagers (Table 1). The imagers used range in price and quality of exported imagery (please see Cox et al. [7] for a discussion on the effect of these specifications on image output).These imagers were not selected to collect imagery, rather, these are the imagers that the imagery used in this research was collected with.

Table 1.
The types and specifications of the thermal imagers that collected the footage that was used for this study.
2.2. Data Pre-Processing
From the thermal footage obtained, we extracted frames to prepare the training dataset. As the video frame rate from the Vayu (used for the training dataset) is 60 fps, we had a huge number of extracted frames. However, most frames have no evidence of any animals; therefore, we used only those frames that had confirmed the presence of targeted animals while discarding the rest of the frames in feeding our training model for robust results.
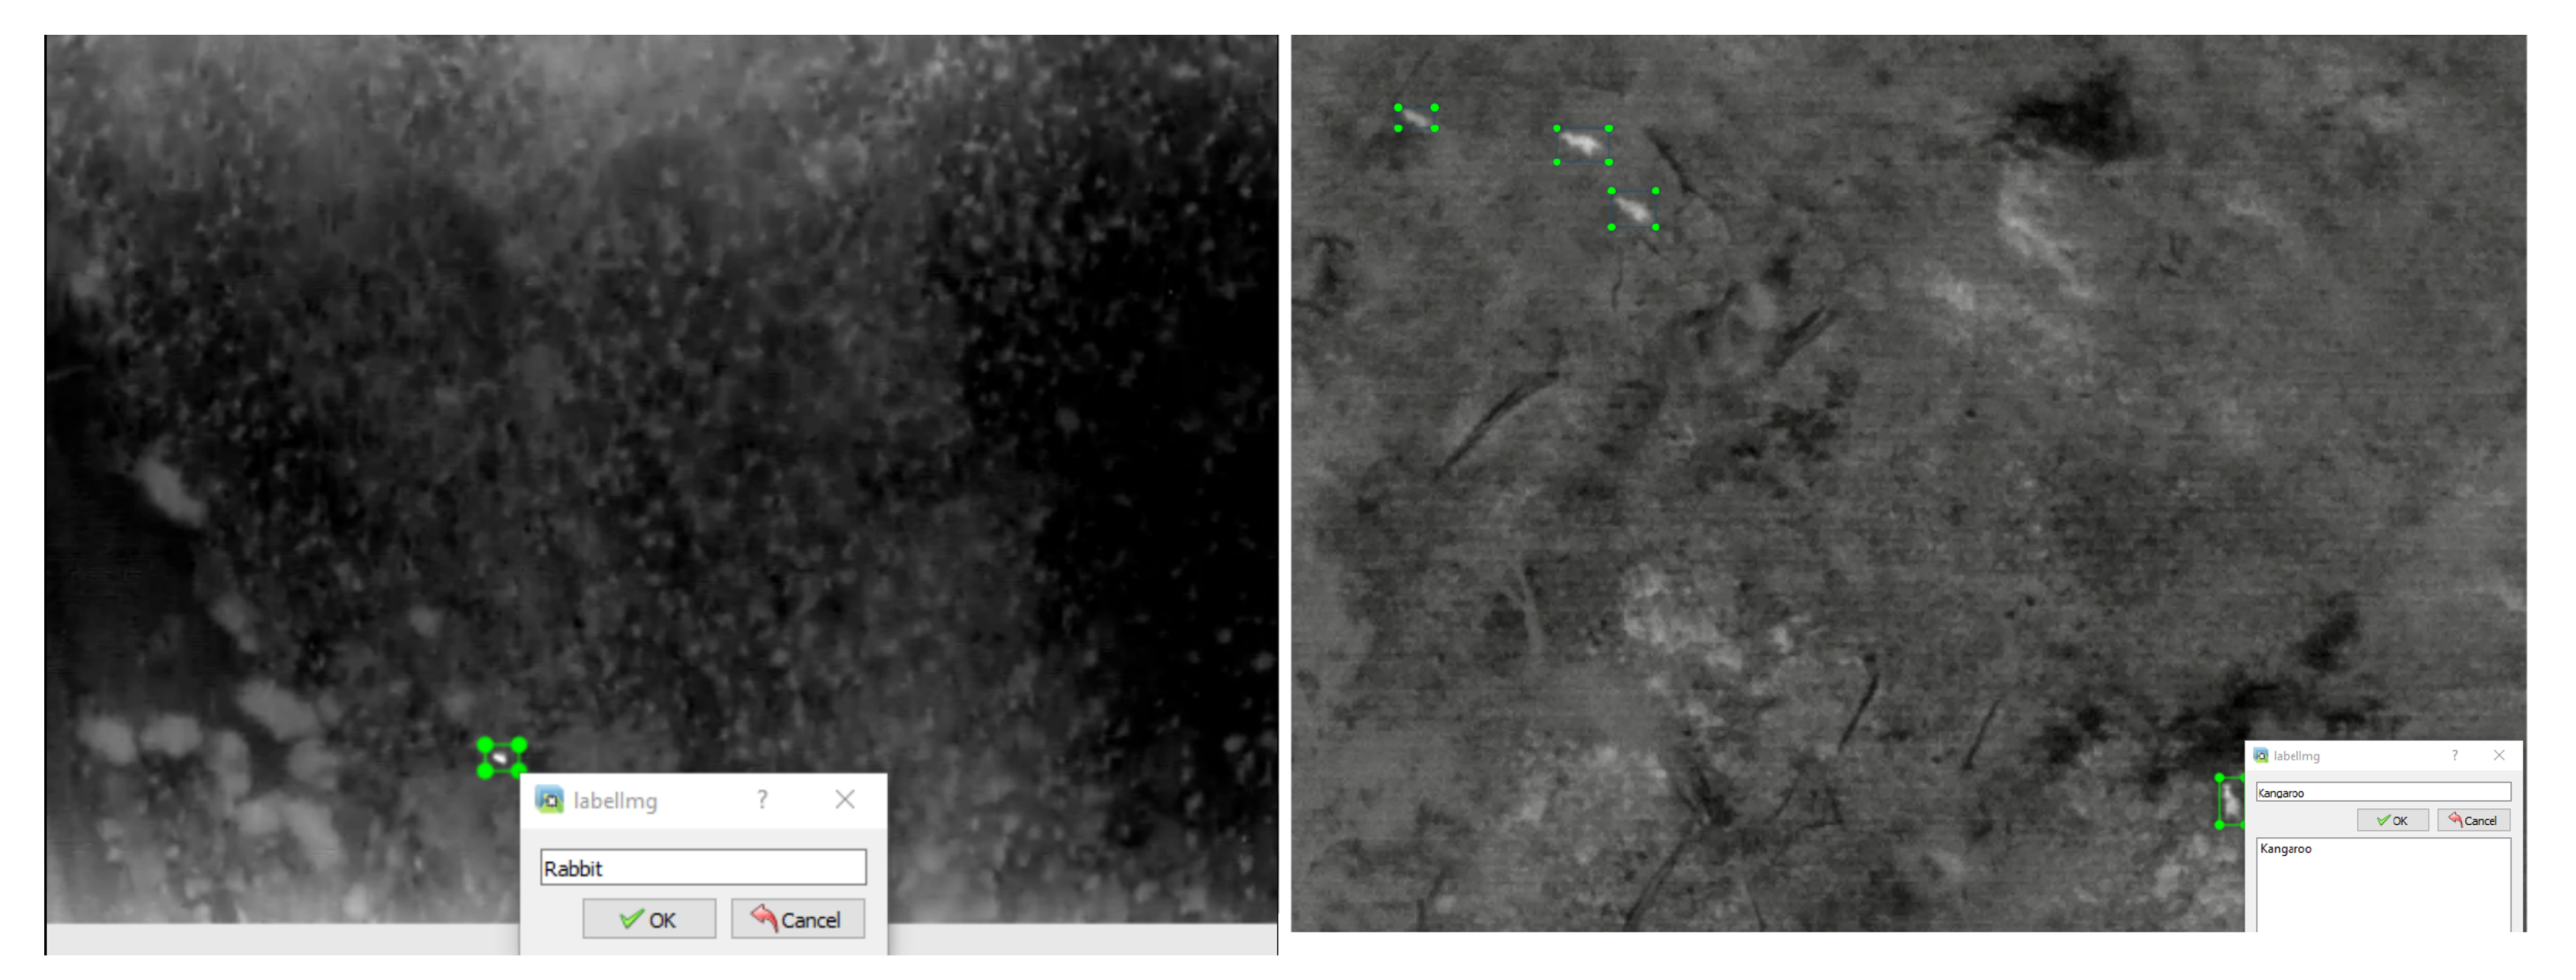
For supervised training, we manually labelled the dataset. We used the python-based library open-source annotation tool “Labelme”, a graphical image annotation tool inspired by MIT, Computer Science and Artificial Intelligence Laboratory [25]. We also observed that target objects were very small in some of the frames collected from a high altitude (67 m). Similarly, some of the targets were obscure, and even manual classification of their thermal signatures was challenging. We had to magnify such frames/images to label them accurately. Some sample shots of the manual annotation of our thermal dataset are shown in Figure 2, whereas Table 2 illustrates the dataset details.

Figure 2.
An example of data annotation/labelling performed for different animal species in our dataset.
Table 2.
Dataset used for training purpose.
2.3. Data Annotation, Model Training and Detection
Our footage library was extensive; thus, we divided it into three datasets: training dataset, evaluation dataset, and testing dataset. First, we annotated target animals of interest in our training dataset using a Python-based annotation tool. We then trained our proposed D-YOLO model on the training dataset. A detailed description of D-YOLO is provided below.
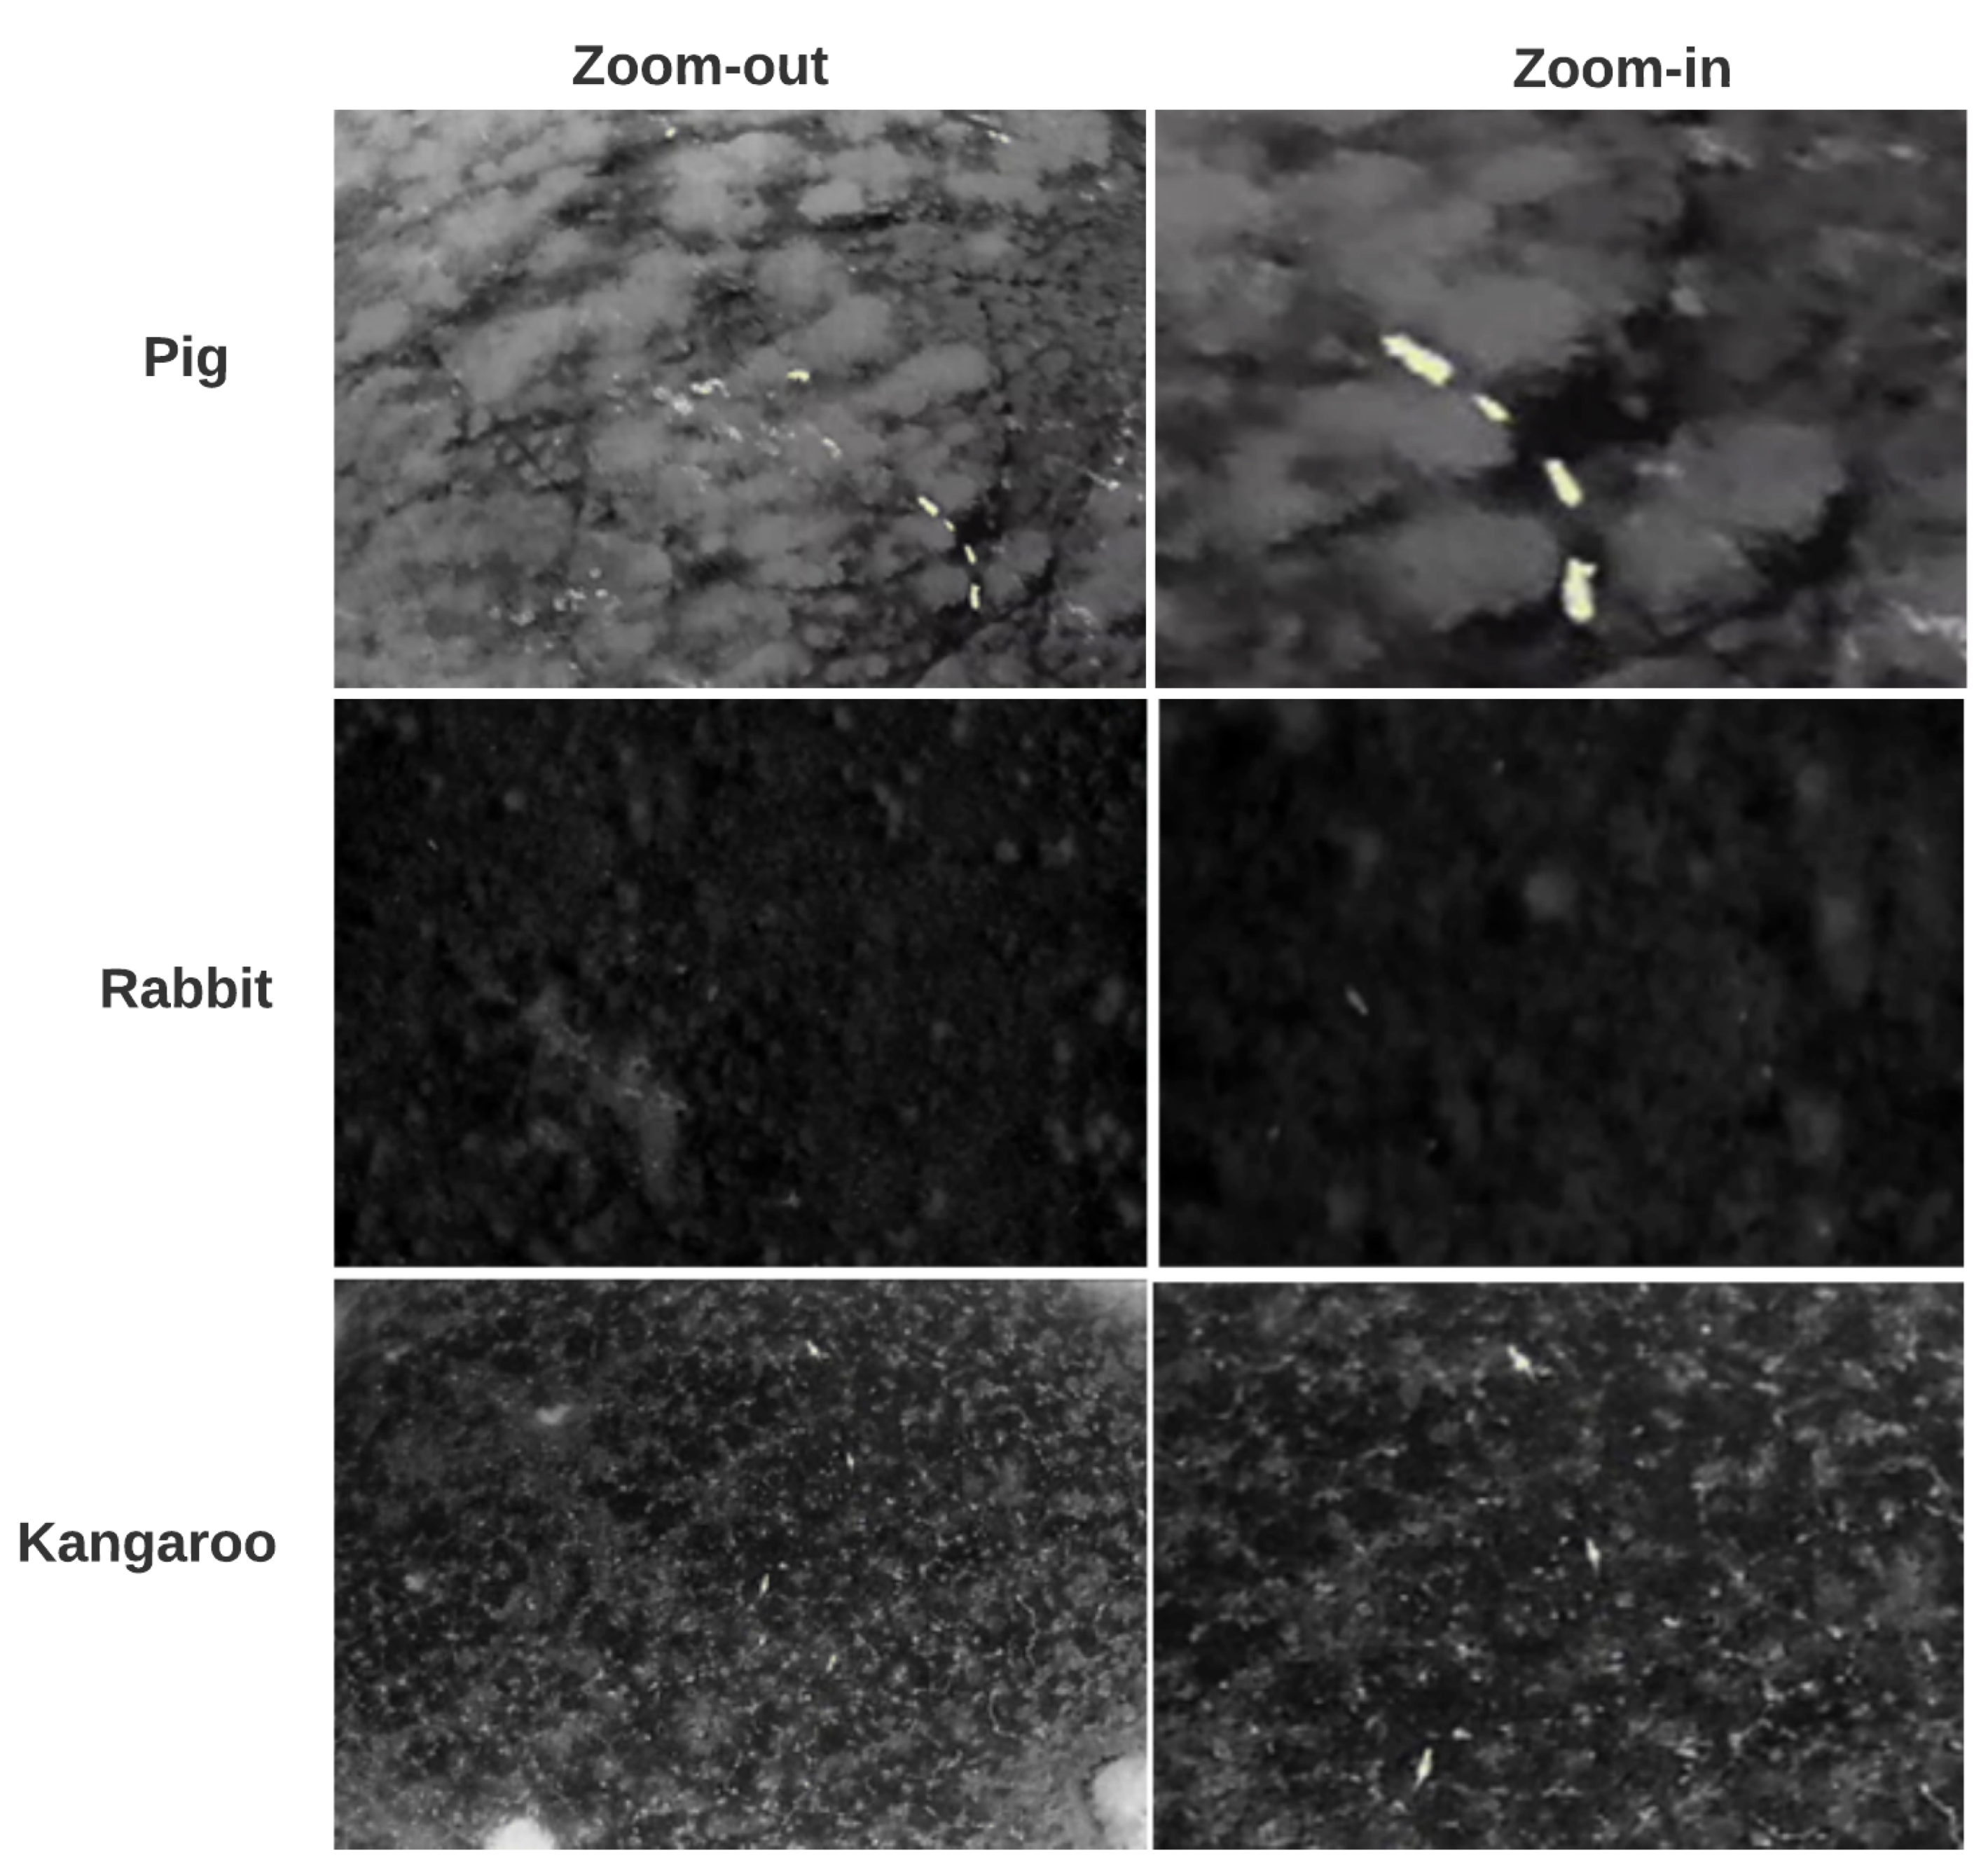
During data collection, we took both far and nearer footage of animals using different camera zoom. Therefore, to improve the performance of YOLOv3 for small object detection, we divided our dataset into two categories named “zoom-out” and “zoom-in” groups by taking the distance and receptive field into consideration, as shown in Figure 3. We also used data augmentation to balance their sizes. K-means [26] was then used to cluster different numbers of anchor boxes to find the optimised number and size for better results. Finally, the model was retrained using the “zoom-out” category data.

Figure 3.
Dataset sample of zoom-in and zoom-out.
A brief introduction to YOLO: YOLOv3 is a more established one-shot detector that is an incremental model of the former YOLO [27], and YOLO9000 [20]. The YOLOv3 backbone known as DarkNet-53 includes 53 convolution layers and Resnet [28] short cut connections. The prediction stage uses FPN that uses three scale feature maps, where small feature maps provide semantic information and large feature maps provide finer-grained information. Darknet (conv2D BN Leaky, short as DBL) comprises one convolution layer, one batch normalisation layer, and one leaky relu layer displayed as DBL. YOLOv3 uses independent logistic classifiers rather than softmax with binary cross-entropy loss for the class predictions in the training stage. FPN uses three detection scales with different receptive fields, where the 32-fold down-sampling is suitable for large objects, the 16-fold for middle-sized objects, and the 8-fold for small size objects.
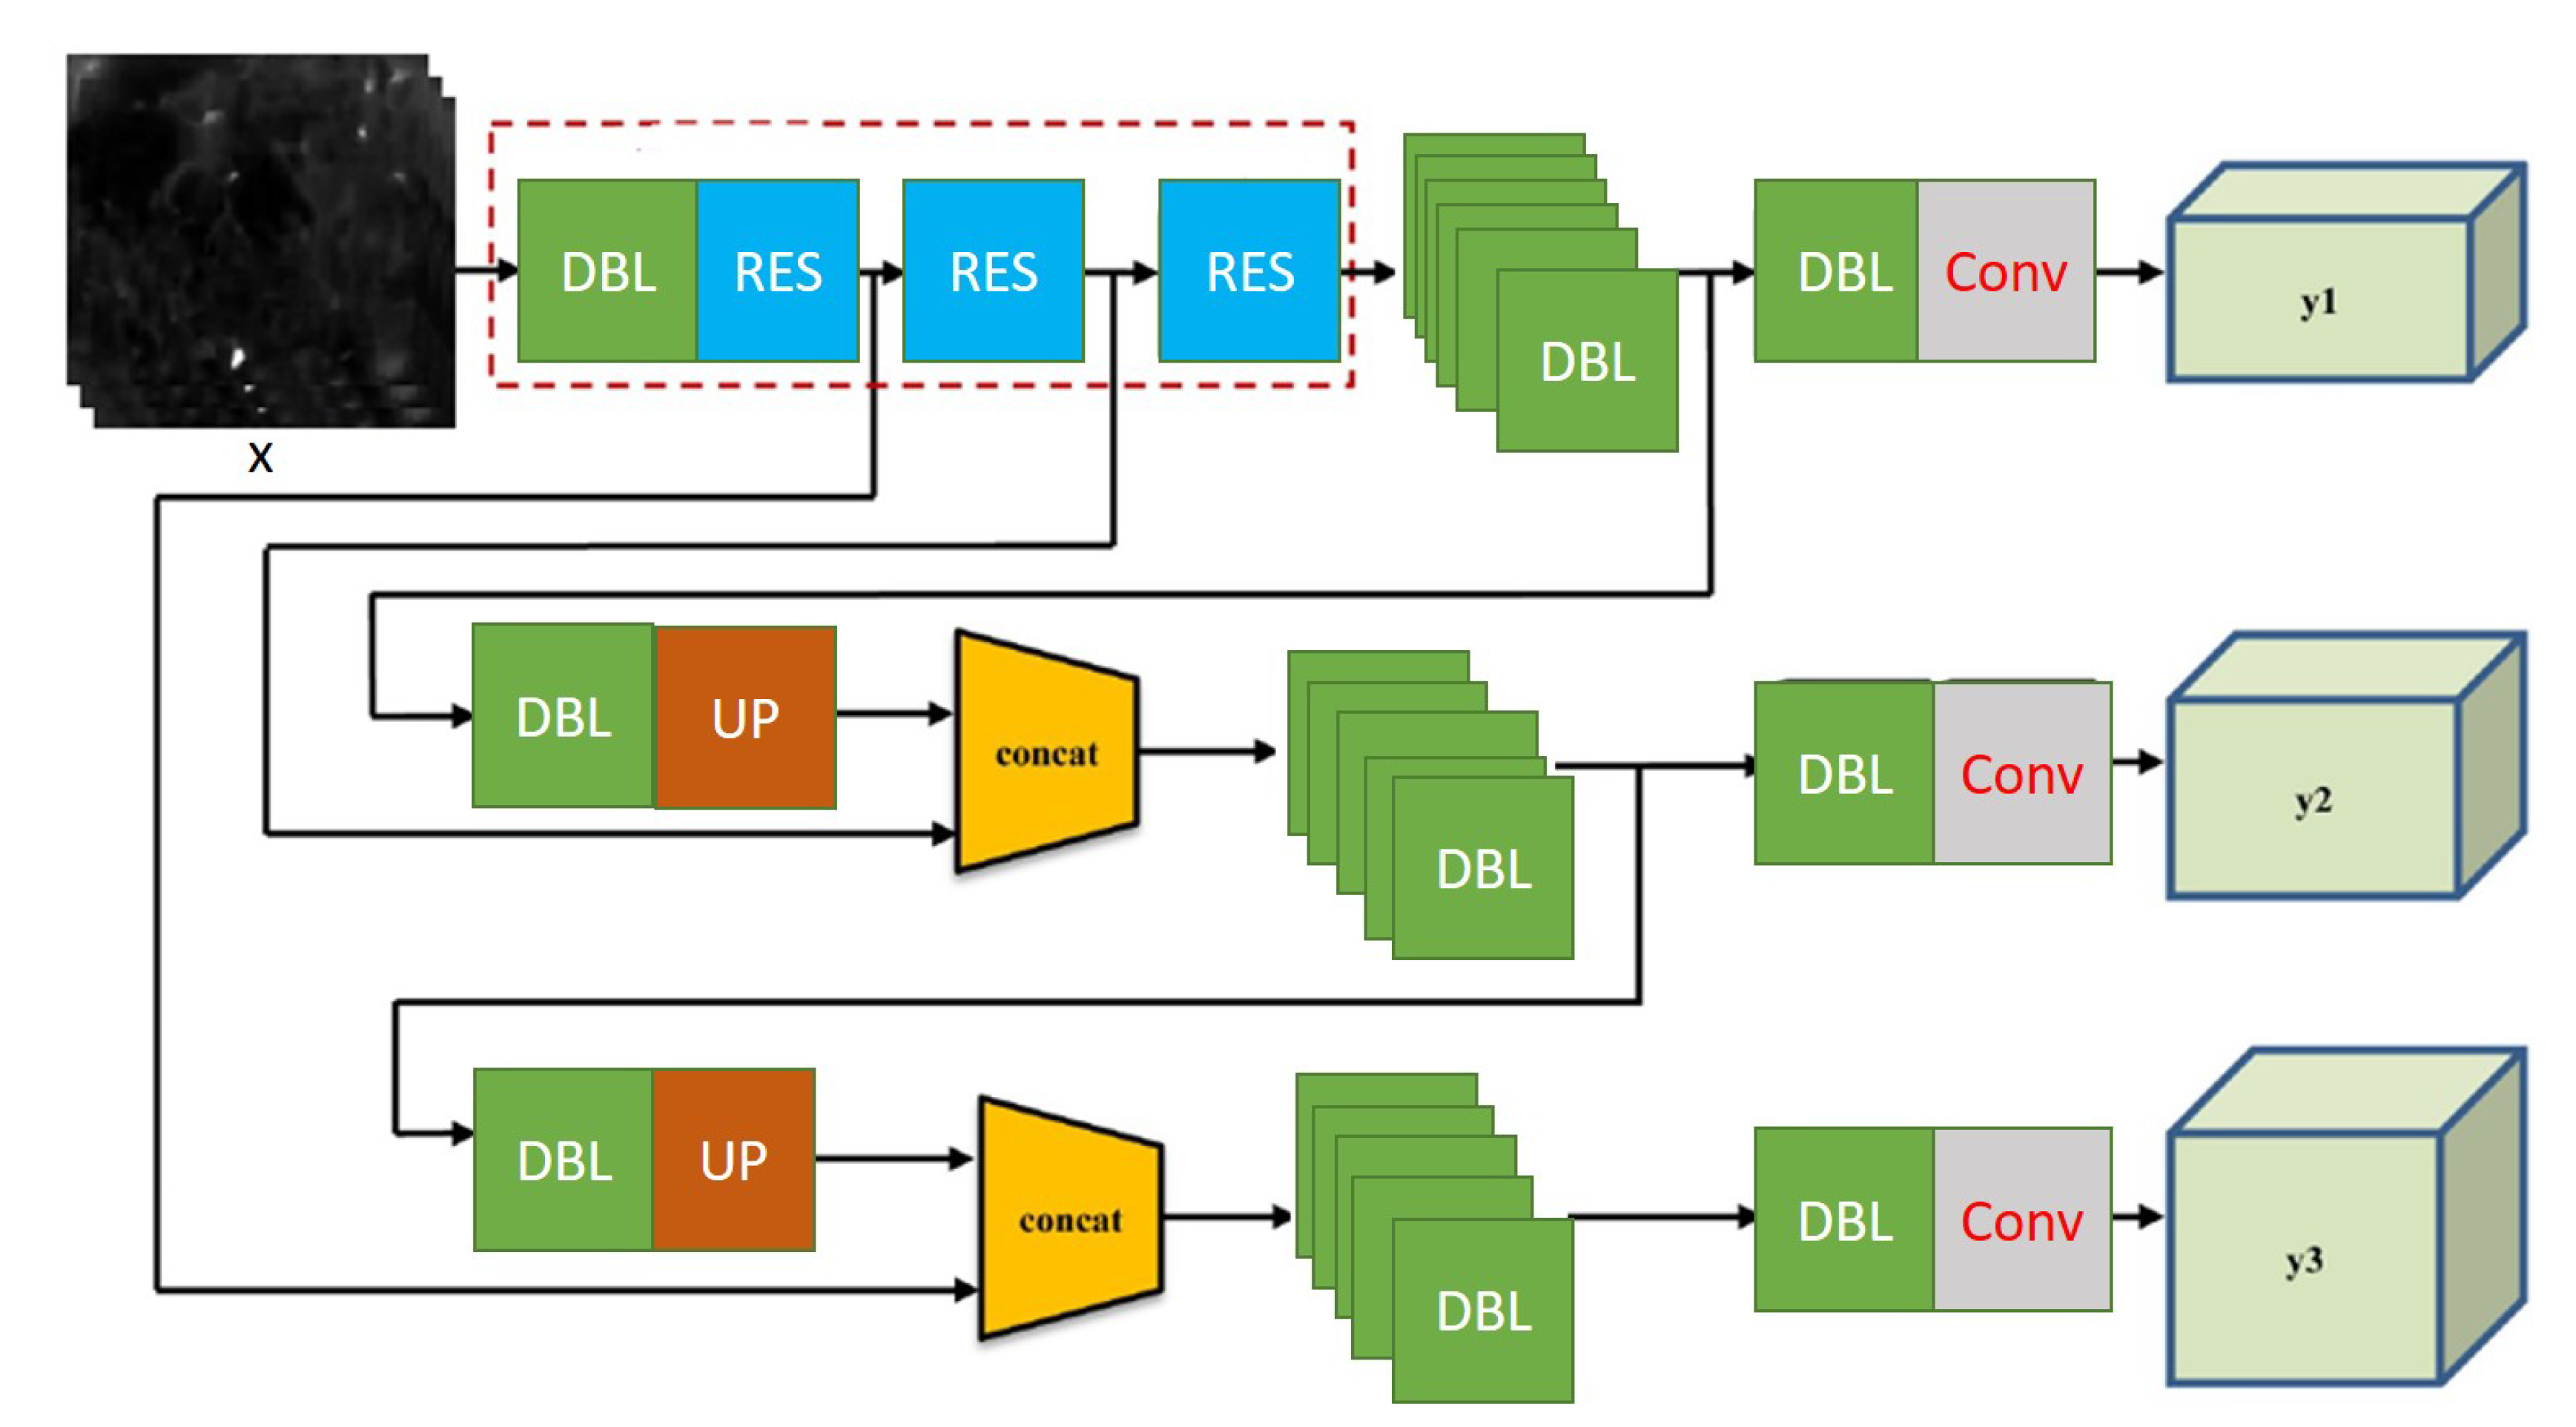
An architectural diagram of YOLOv3 is shown in Figure 4. It takes an input image of size 416 × 416 pixels and calculates three types of feature map (13 × 13 × 3, 26 × 26 × 3, and 52 × 52 × 3) bounding boxes as output. Darknet (conv2D BN Leaky, shortened to DBL) comprises one convolution layer, one batch normalisation layer, and one leaky relu layer displayed as DBL. It also includes ResUnit that includes two “DBL” structures followed by one “add” layer. It leads to the residual-like unit, “ResBlock”. “ResBlock” is the module element of Darknet 53.

Figure 4.
YOLOv3 architecture with the input image and three types of feature map as output. The basic element of YOLOv3 is called Darknet conv2D BN Leaky (DBL), which is composed of one convolution layer, one batch normalization layer, and one leaky relu layer. Other important components of the structure are explained in the text.
The proposed D-YOLO Scheme:
One of the problems with traditional CNN networks is their inability to handle low resolution and receptive field at both pooling and striding may cause loss of small targets. The semantic information about the small objects will vanish or weaken with a decreased spatial resolution of feature maps in subsequent layers. Low semantic information may not be enough to recognise the small object category in thermal images.
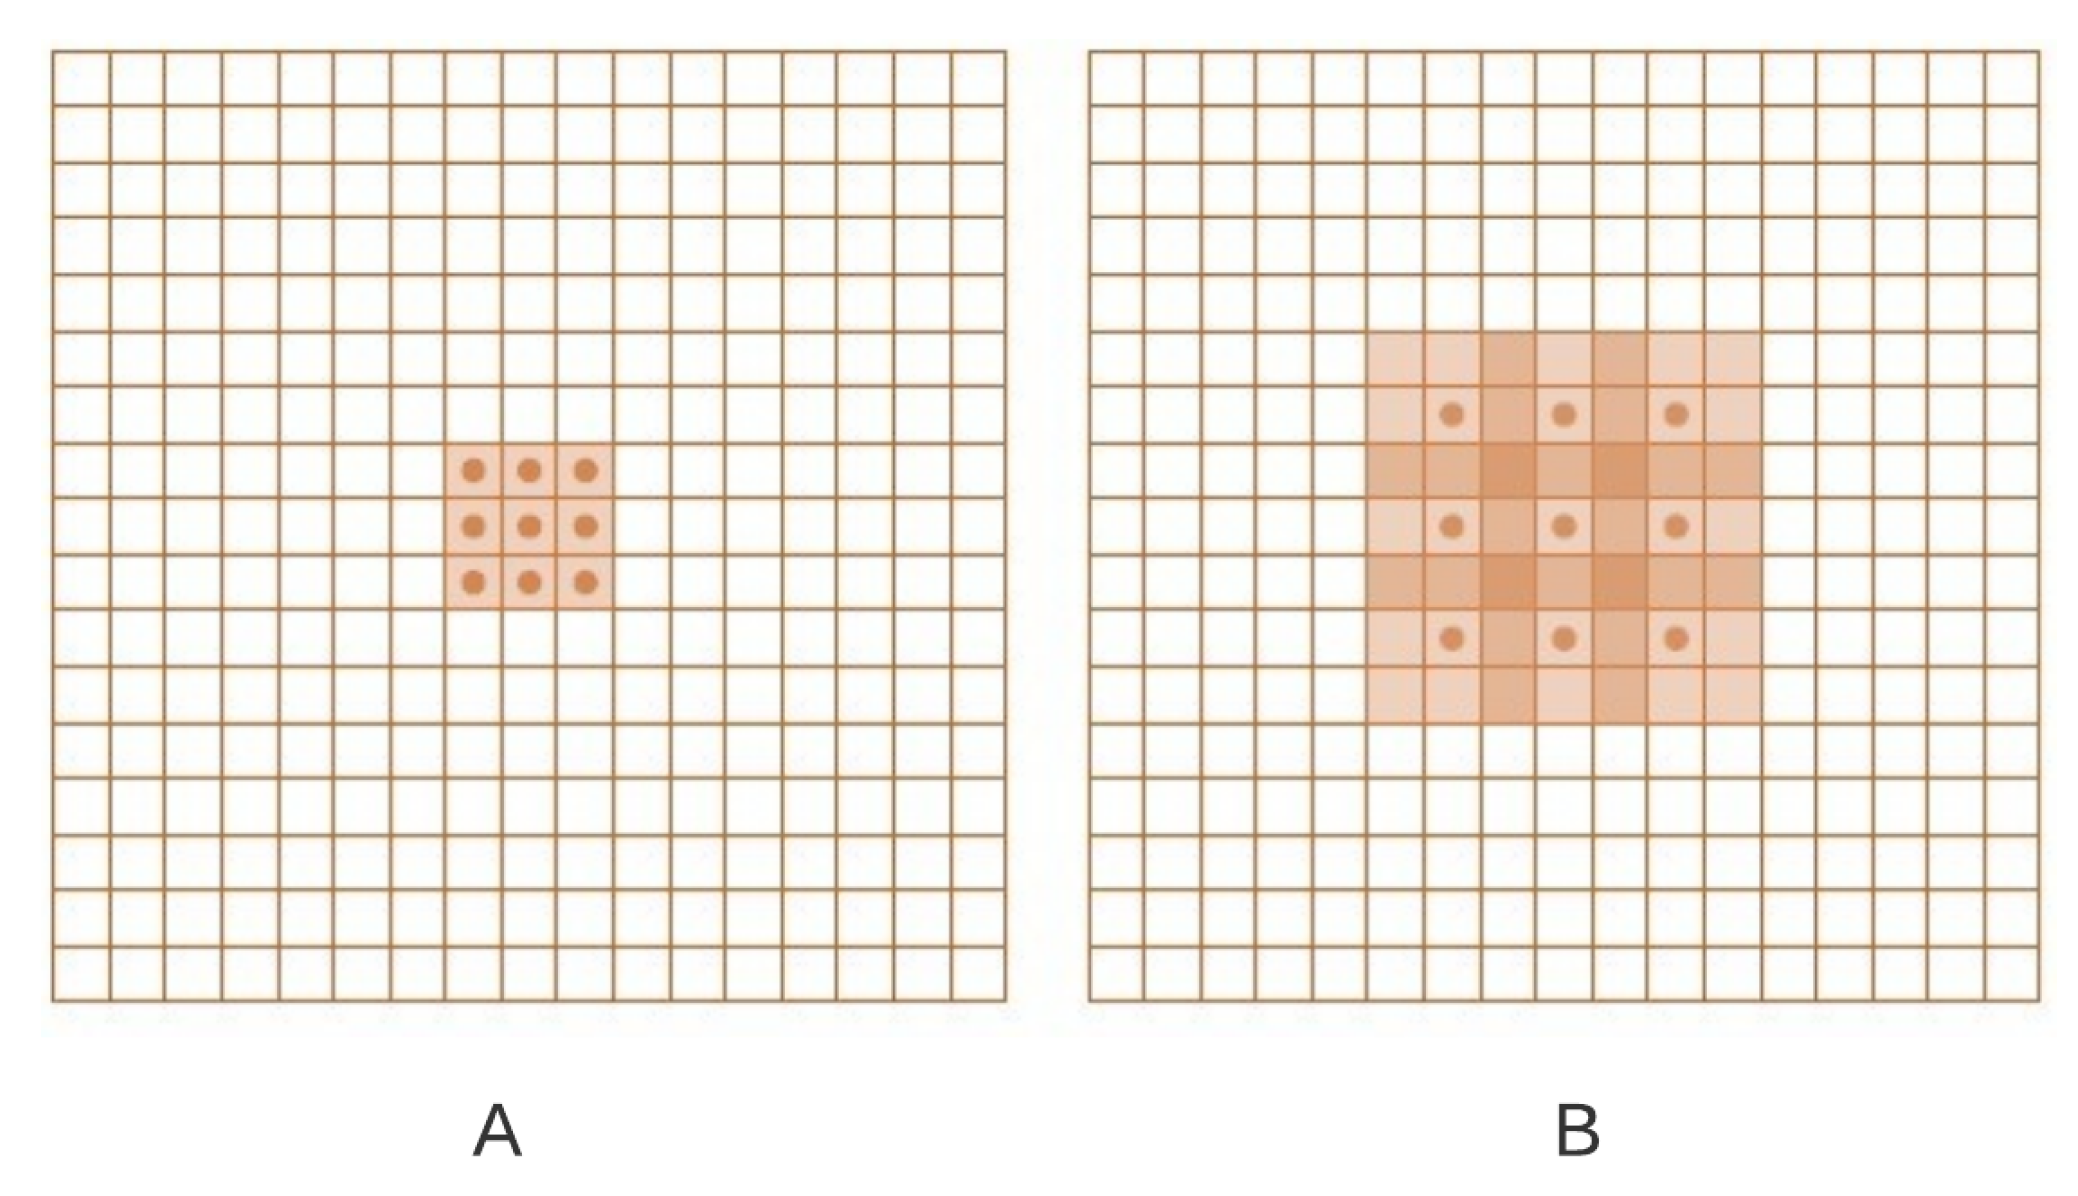
A region of the input on which a pixel value in the output depends is called the receptive field. CNN’s pooling (progressively reducing resolution and removing sub-sampling) can help, but it reduces the receptive field. On the other hand, dilated convolutions [29] can increase the explanation of the output feature maps without harming the receptive field of individual neurons. Dilated convolution is also called “convolution with a dilated filter”, as it is a similar filter used for wavelet transformation. This concept is explained in Figure 5.

Figure 5.
Dilated Convolutions: The figure (A) on the left shows the output generated from convolving F1 by a 1-dilated convolution f1; F1, F2 are the larger grid showing original discrete functions and f1, f2 are the green colour discrete filters. Each element in this representation has a receptive field of 3 × 3. Figure (B) on the right shows the output generated from F2 convolved with a 2-dilated convolution f2; Each element in this representation has a receptive field of 7 × 7.
Let be a discrete function, and let be another discrete function; the convolution operator ∗ can be defined as:
Let us define d as a dilation factor and let be defined as:
where is a d-dilated convolution, the traditional CNN convolution is simply the 1-dilated convolution. Dilated convolution supports an exponential expansion of the receptive field without loss of resolution. Figure 5 illustrated the outcome of dilated convolution. F1, F2 are the larger grid showing original discrete functions and f1, f2 are the green colour discrete filters. Figure 5A on the left shows output generated from convolving F1 by a 1-dilated convolution f1; where F is the larger grid and f is the green colour filter. Each element in this representation has a receptive field of . Figure 5B on the right shows the output generated from F2 convolved with a 2-dilated convolution f2; Each element in this representation has a receptive field of .
Therefore, to increase the receptive field of YOLO to handle small objects, we integrated dilated convolutions in its architecture. For this purpose, we replaced the DDL block with a DDDL block that uses dilated convolution followed by batch normalisation and leaky Relu. Likewise, RES block is replaced with DRN (Dilated Residual Network) [30]. Similarly, for multiscale spatial pooling, we use different dilation rates and replace upsampling with dilation filtering. Finally, semantic information from three scales is concatenated to detect objects and their categories. The proposed D-YOLO architecture is shown in Figure 6.

Figure 6.
D-YOLO architecture with input image size 416 × 416 pixels and 3 types of feature map (13 × 13 × 3, 26 × 26 × 3, and 52 × 52 × 3) as output; DDBL stands for Darknet dilated conv2D BN Leaky, composed of one convolution layer, one batch normalisation layer, and one leaky relu layer.; DRN (Dilated Residual Network) provides residual-like connection with dilated convolutions. Similarly, for multiscale spatial pooling, we use different dilation rates and replace upsampling with dilation filtering.
2.4. Geo-Tagging and Visualizing of Detected Targets
Finally, geo-tagging of detected animals is done by embedding a Google maps API platform on the acquired flight GPS data for locating and visualising targets in processing real-time. It provides precise tracking of target locations and visualisation of their movement within the surrounding. Such information is key to monitor animal movement patterns and gain valuable insights about their activities. Figure 7 illustrates the process of geo-tagging of detected animals from aerial data and also provides visualisation of their movements during the time of flight.
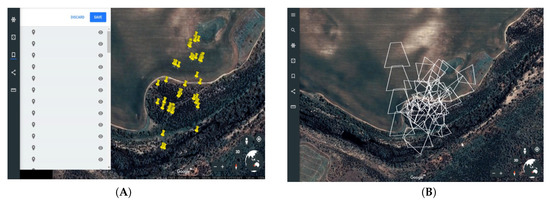
Figure 7.
(A) The geo-tagging of detected animals from drone data that points out their detection location and (B) visualisation of animal movements that display the area of their activity.
2.5. Experiments and Results
The majority of classifiers assume that output labels are mutually exclusive. If the output consists of mutually exclusive object classes, this is true. As a result, YOLO uses a softmax function to transform scores into one-to-one probability. At this point, the total output can be larger than one. The algorithm substitutes the softmax algorithm with independent logistic classifiers to assess the likelihood that an input belongs to a certain label. The algorithm calculates the classification loss for each tag using binary cross-entropy loss rather than mean square error. Omitting the softmax function also reduces processing complexity.
The algorithm uses logistic regression to estimate an objectness score for each bounding box. The matching objectness score should be one of the bounding boxes prior (anchor) overlapping a ground truth object more than others. Only one boundary box prior is linked with each ground truth item. There is no classification or localisation loss if a bounding box prior is not assigned; nonetheless, there is a confidence loss on objectness. To compute the loss, we utilise tx and ty (rather than bx and by).
Precision, recall, accuracy, and the f1-score are some of the ways used to examine the performance of neural networks. The precision tells us about the correct predictions made out of false-positives, while recall tells us about the correct predictions made out of false negatives. The accuracy is the number of correct predictions out of both false positives and false negatives. All the performance metrics for our trained model have been determined using the formulas listed in Equations (3)–(6).
where true positives are TP, true negatives are TN, false positives are FP, and false negatives are FN. The TP and TN are the right predictions, whereas the FP and FN are our model’s wrong predictions.
We carried out the training process for our deep model experiments both on Windows and Ubuntu operating systems. We used the deep learning framework PyTorch and related Python libraries for system training and testing. Training and testing were performed on both windows and ubuntu operating systems workstations. They had an Intel ninth gen i9 CPU, i.e., 9900 k, 64 GB RAM and Nvidia dual RTX 2080 Ti 11 GB VRAM GPUs. Table 3. shows the system specifications.
Table 3.
System Specifications for Training/Testing.
The experimental dataset was divided into training and validation as 85% and 15%, respectively, as shown in Table 4 to get the optimised results and overcome the issue of over-fitting.
Table 4.
Data Split for Testing/Training & Accuracy Obtained.
We first tried to establish the baseline by training a YOLOv3 based detection; for this purpose, we used the size of input frames as an integer multiple of 32 (416 × 416), with five steps for downsampling operation leading to the largest stride size of 32. As this version used multi-scale analysis, y1, y2, and y3 lead to three different feature maps. Information for the detection of final bounding boxes comes from the combination of all three scales.
We fine-tuned a pre-trained YOLOv3 model for training, with a mini-batch size of 32, 10,500 batches, subdivisions of 15 on 1 GPU, a momentum of 0.8, and a weight decay of 0.0004. We adopted the multistep learning rate with a base learning rate of 0.0001 and the learning rate scales of [0.1, 0.1].
We then designed the proposed D-YOLO algorithm by replacing convolutions with dilated versions. For this purpose, we used the size of input frames as an integer multiple of 32 (416 × 416), without a downsampling operation, and introduced dilation rates of 6, 12, and 18 at different levels. The rest of the design remains the same. Information for the detection of final bounding boxes comes from the combination of all three scales. However, the original model size remains the same as of YOLOv3. We used similar training specifications for our baseline model.
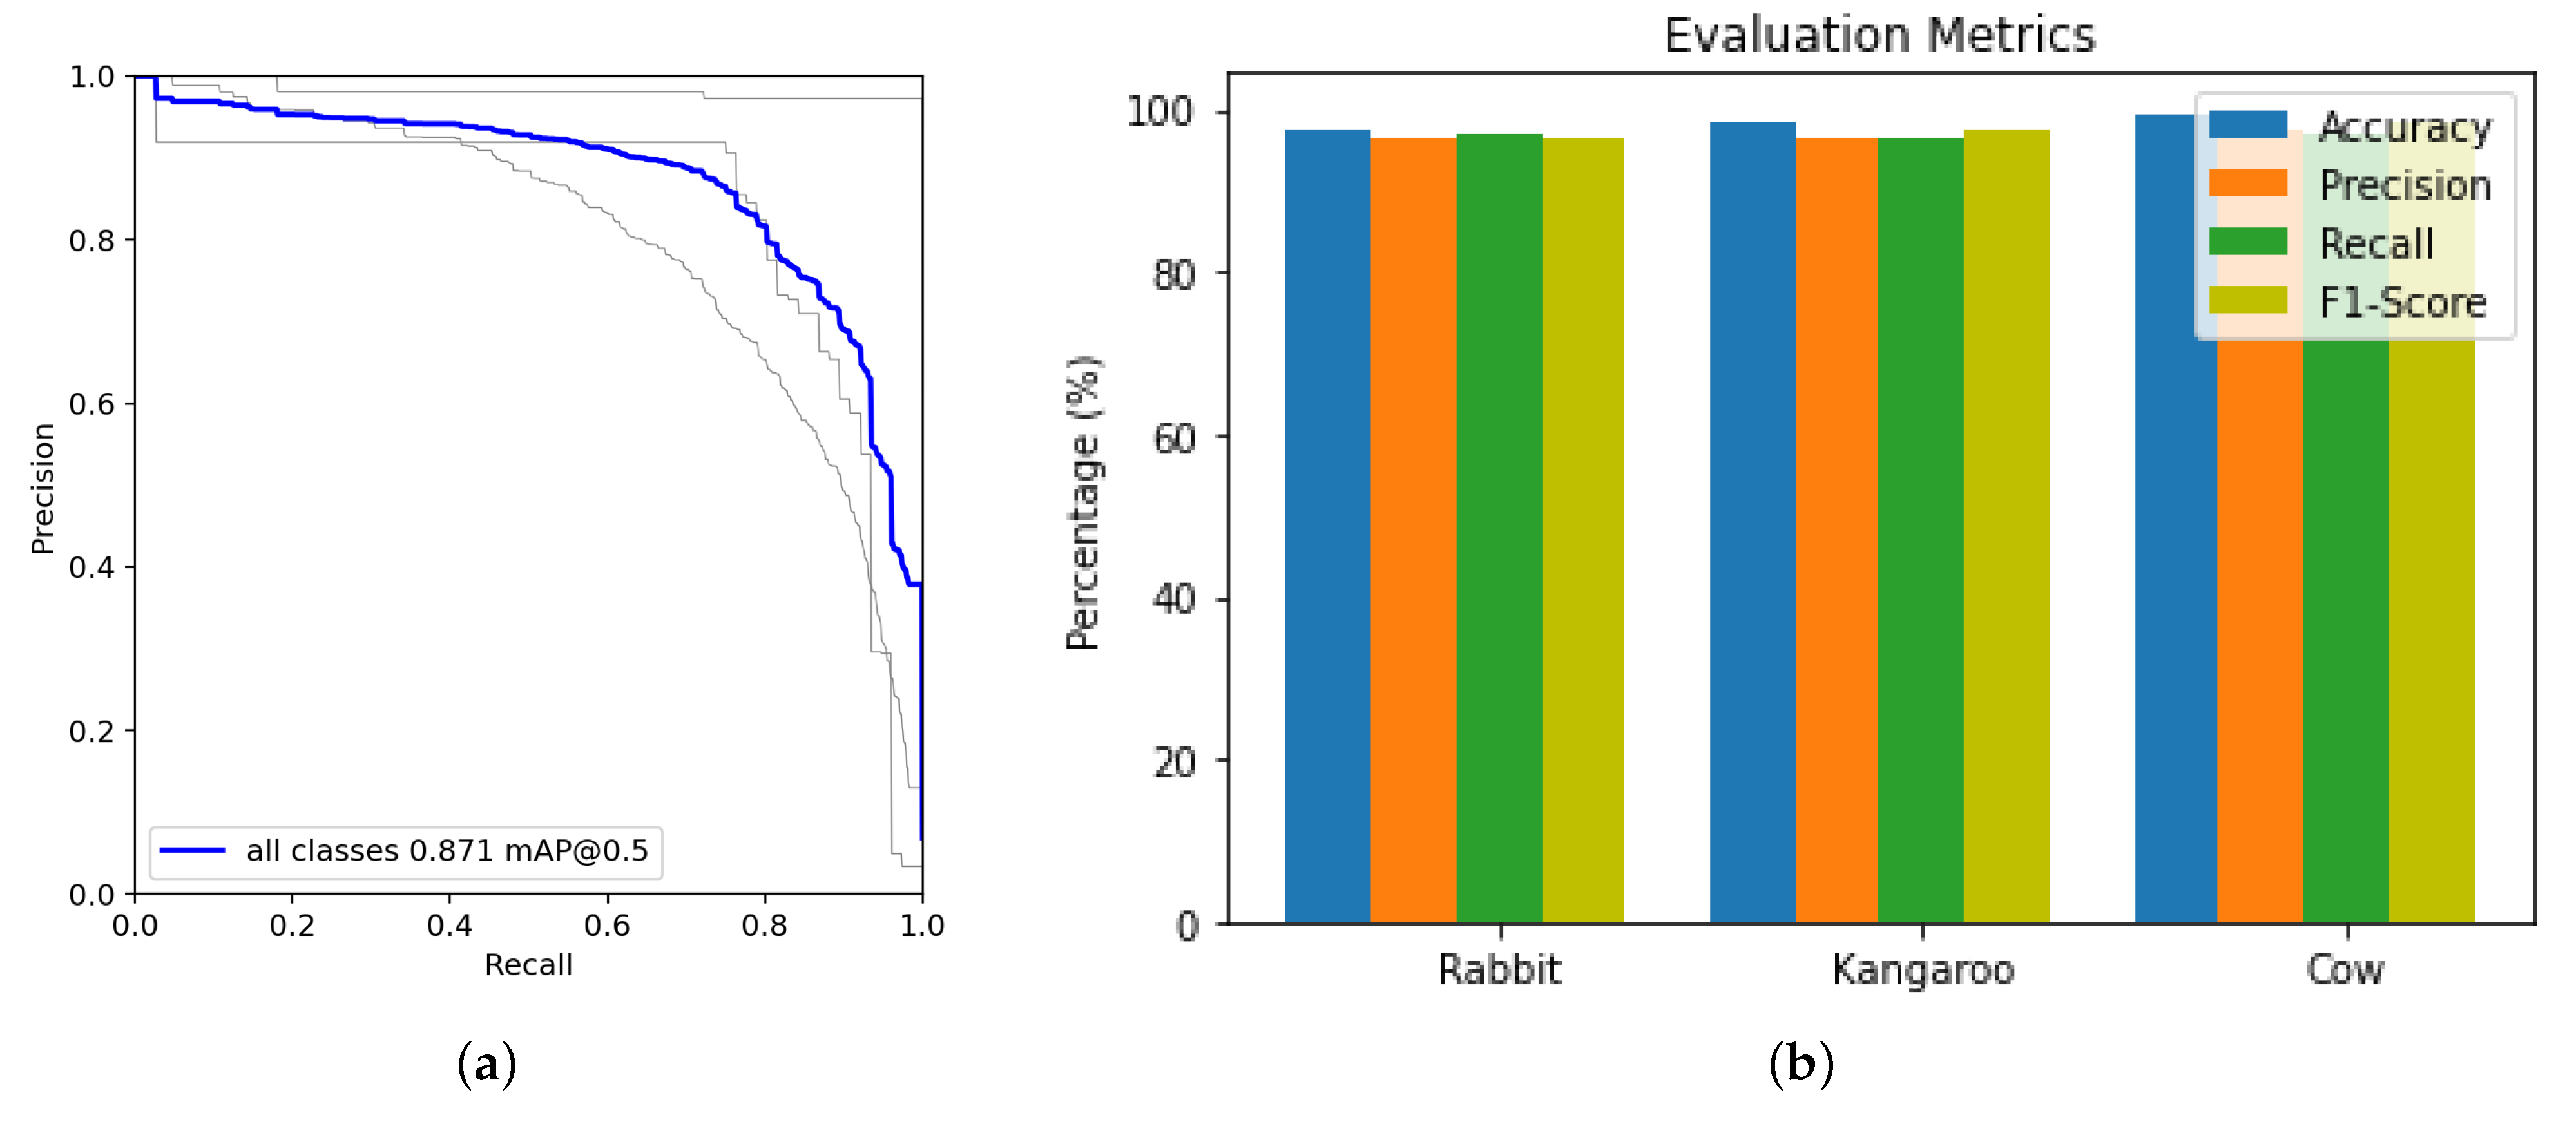
The average of numerous intersections over union (IoU) is referred to as the average precision (AP) (the minimum IoU to consider a positive match). For example, AP@[.5:.95] represents the average AP for IoU with a step size of 0.05 from 0.5 to 0.95. In our experiments, the mAP0.5 is 0.871, as shown in Figure 8a. We achieved an average accuracy of 98.33% for the D-YOLO during the testing phase, compared to 92.33% accuracy for the baseline YOLO model. For Pig class accuracy = 97.34%, recall = 96.89%, precision = 96.37%, and f1-score = 96.35%. Kangaroo class accuracy = 99.48%, recall = 96.96%, precision = 97.30%, and f1-score = 98.60%. Rabbit class accuracy = 98.17%, recall = 96.70%, precision = 96.48%, and f1-score = 97.48%. Figure 8b visualizes the above results. Hence, kangaroo signatures are bigger and differentiable, and therefore achieved better accuracy for this class. For warren detection, we achieved (accuracy = 93.34%, recall = 96.89%, precision = 96.37%, and f1-score = 96.3%).

Figure 8.
(a) Mean Average Precision (mAP) for all the classes. (b) System performance metrics for each class of animal.
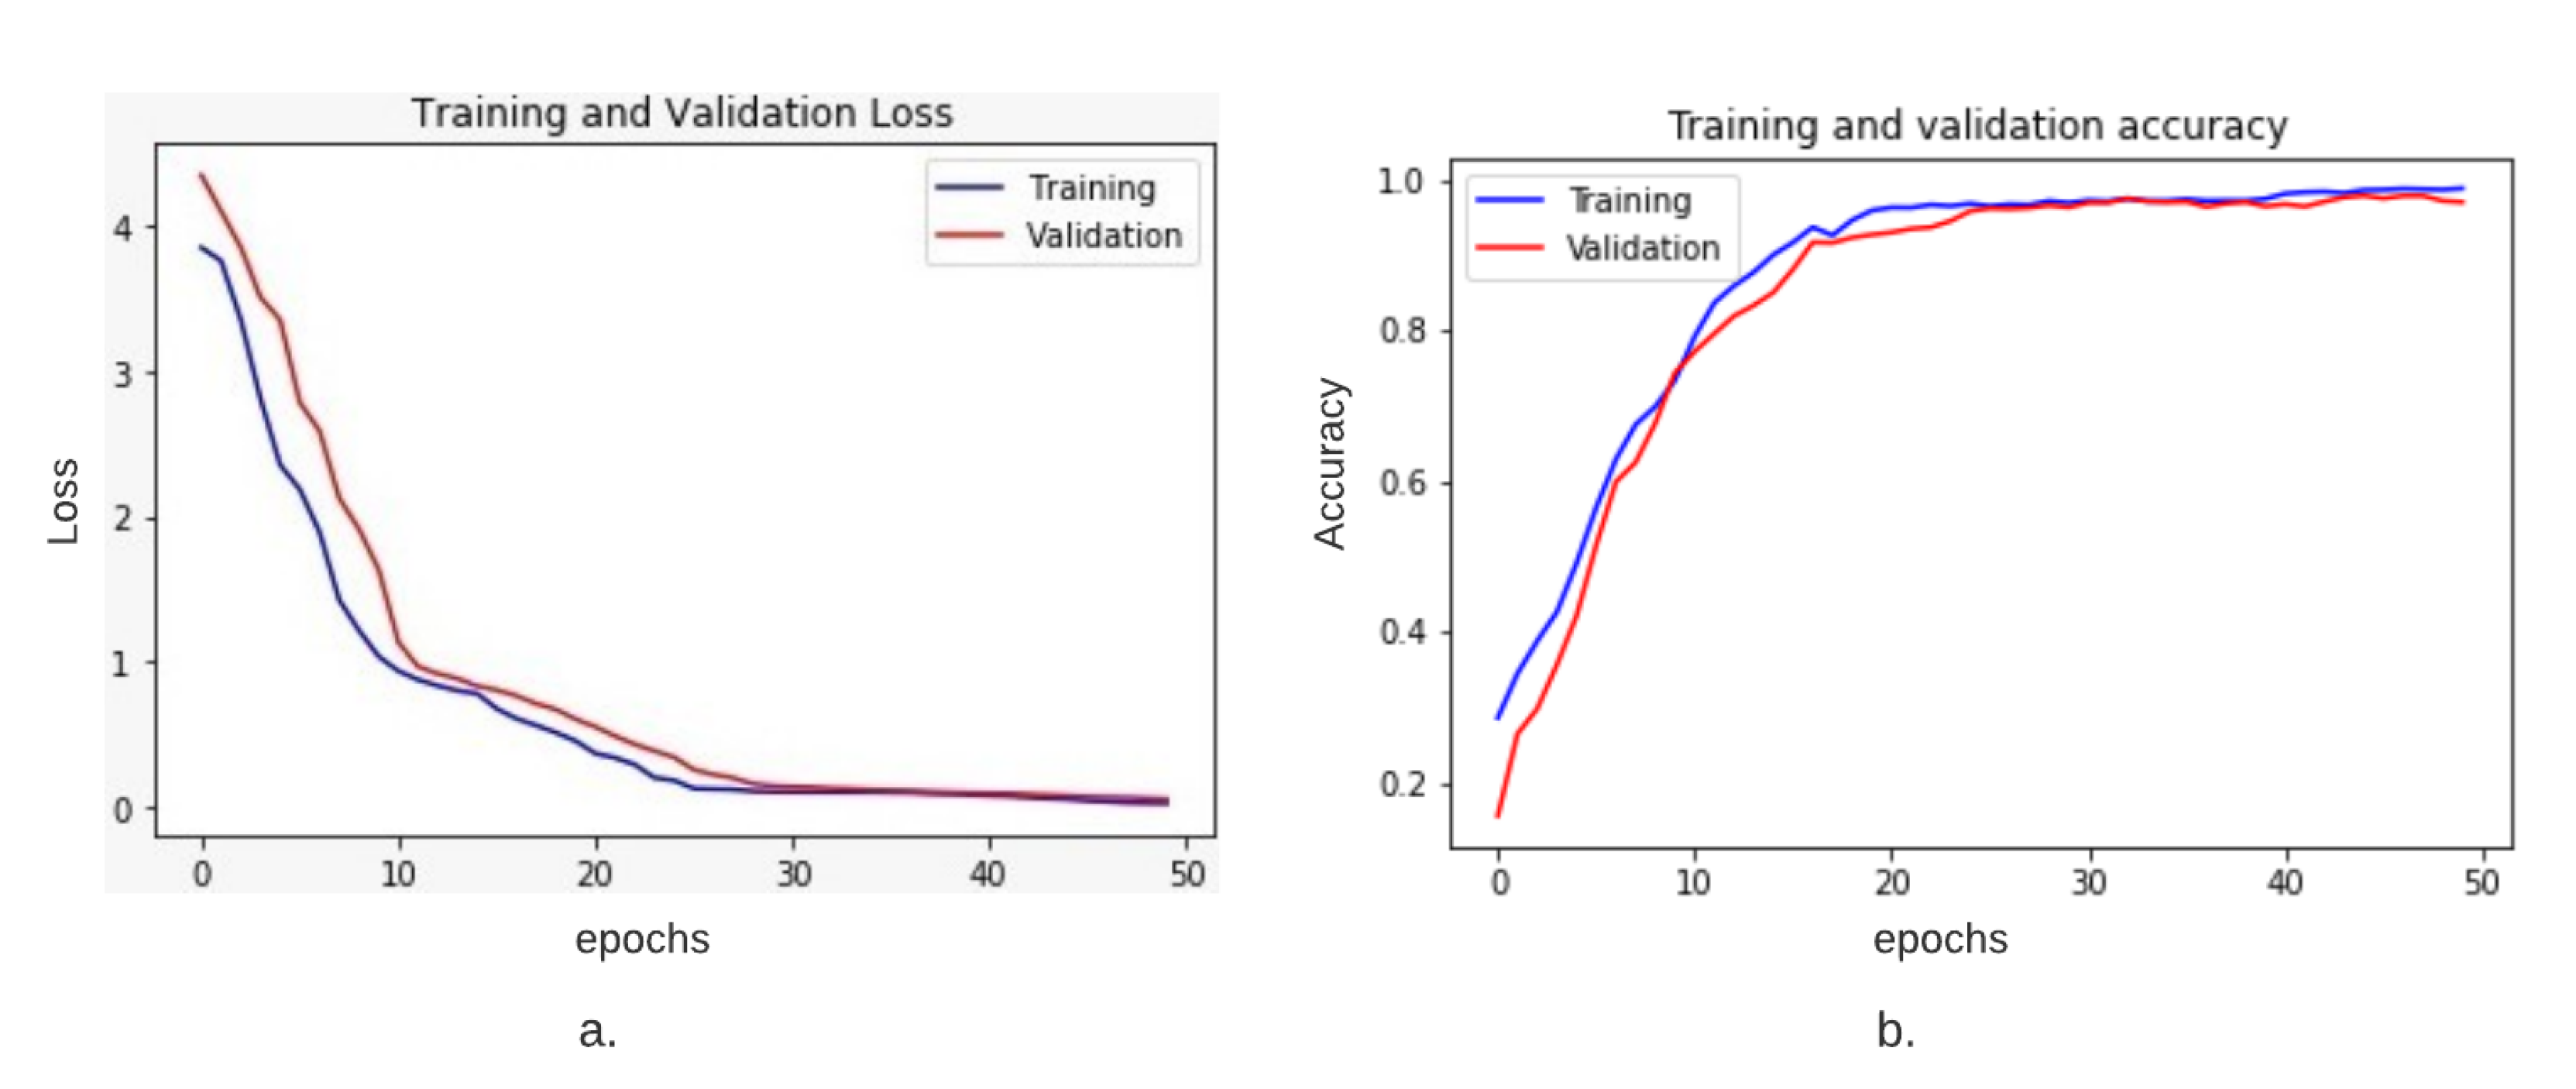
Training and test accuracy was calculated for our training and validation set. Figure 9a,b displays our training and validation loss for each epoch. These graphs were generated for a data split of 85–15%. The accuracy graph visually shows that both training and testing accuracy increases gradually and then converges on a specific point. It also shows that after 40 epochs, the accuracy reduction reduces as the validation accuracy appears to be equivalent to training accuracy. Similarly, the right graph shows how the loss decreases gradually as the model learns on a given dataset. The loss of validation data becomes stable after 43 epochs and thus tends towards a specific value.

Figure 9.
(a). Training and validation loss plot and (b). Training and validation accuracy plot. Both the plots show consistency in decreasing loss and increasing accuracy on the given dataset. Training is shown in blue colour, and validation is shown in red colour.
We tested our approach on the data that was not part of our training or validation set. We first detected all bounding boxes and used them for counting the number of detected animals. Then, to remove double counting, we sustained our count until the 10th frame. This value was found empirically based on manual inspection of frames and detected animals. Finally, we counted ground truth detections and compared them with the automated population count of animals for verification purposes. This process also verified our detection results accuracy.
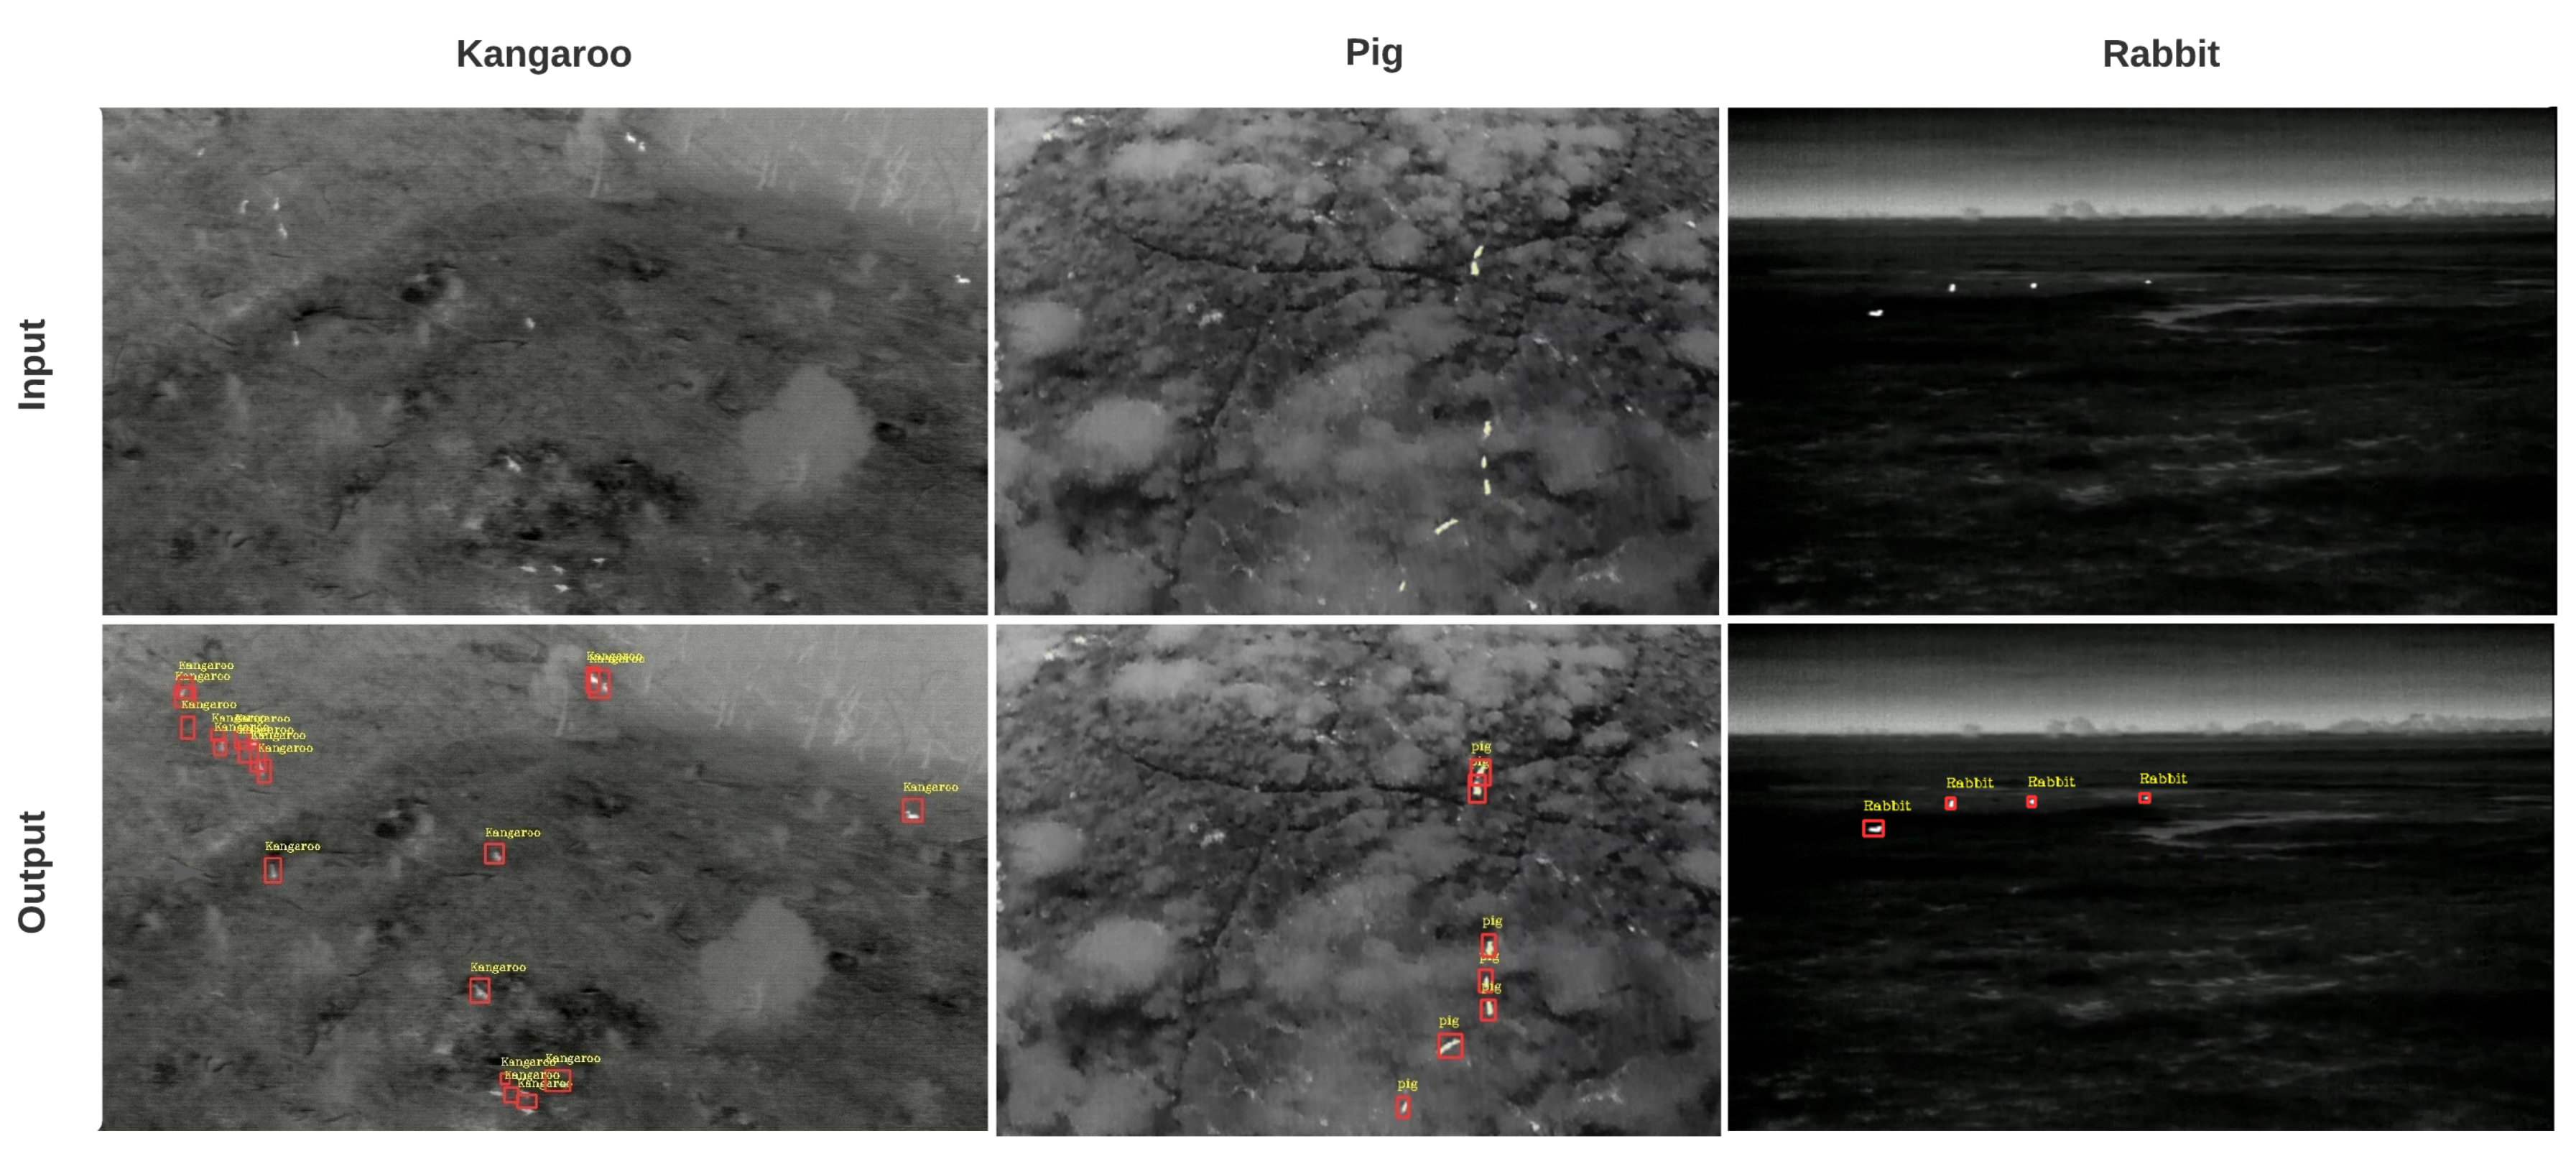
Some of the sample detection results are shown in Figure 10. Detected labels and their sizes are intentionally made small to show small bounding boxes.

Figure 10.
Sample Results: the first row includes input images, while the second row shows respective output images. Both bounding boxes and labels are shown.
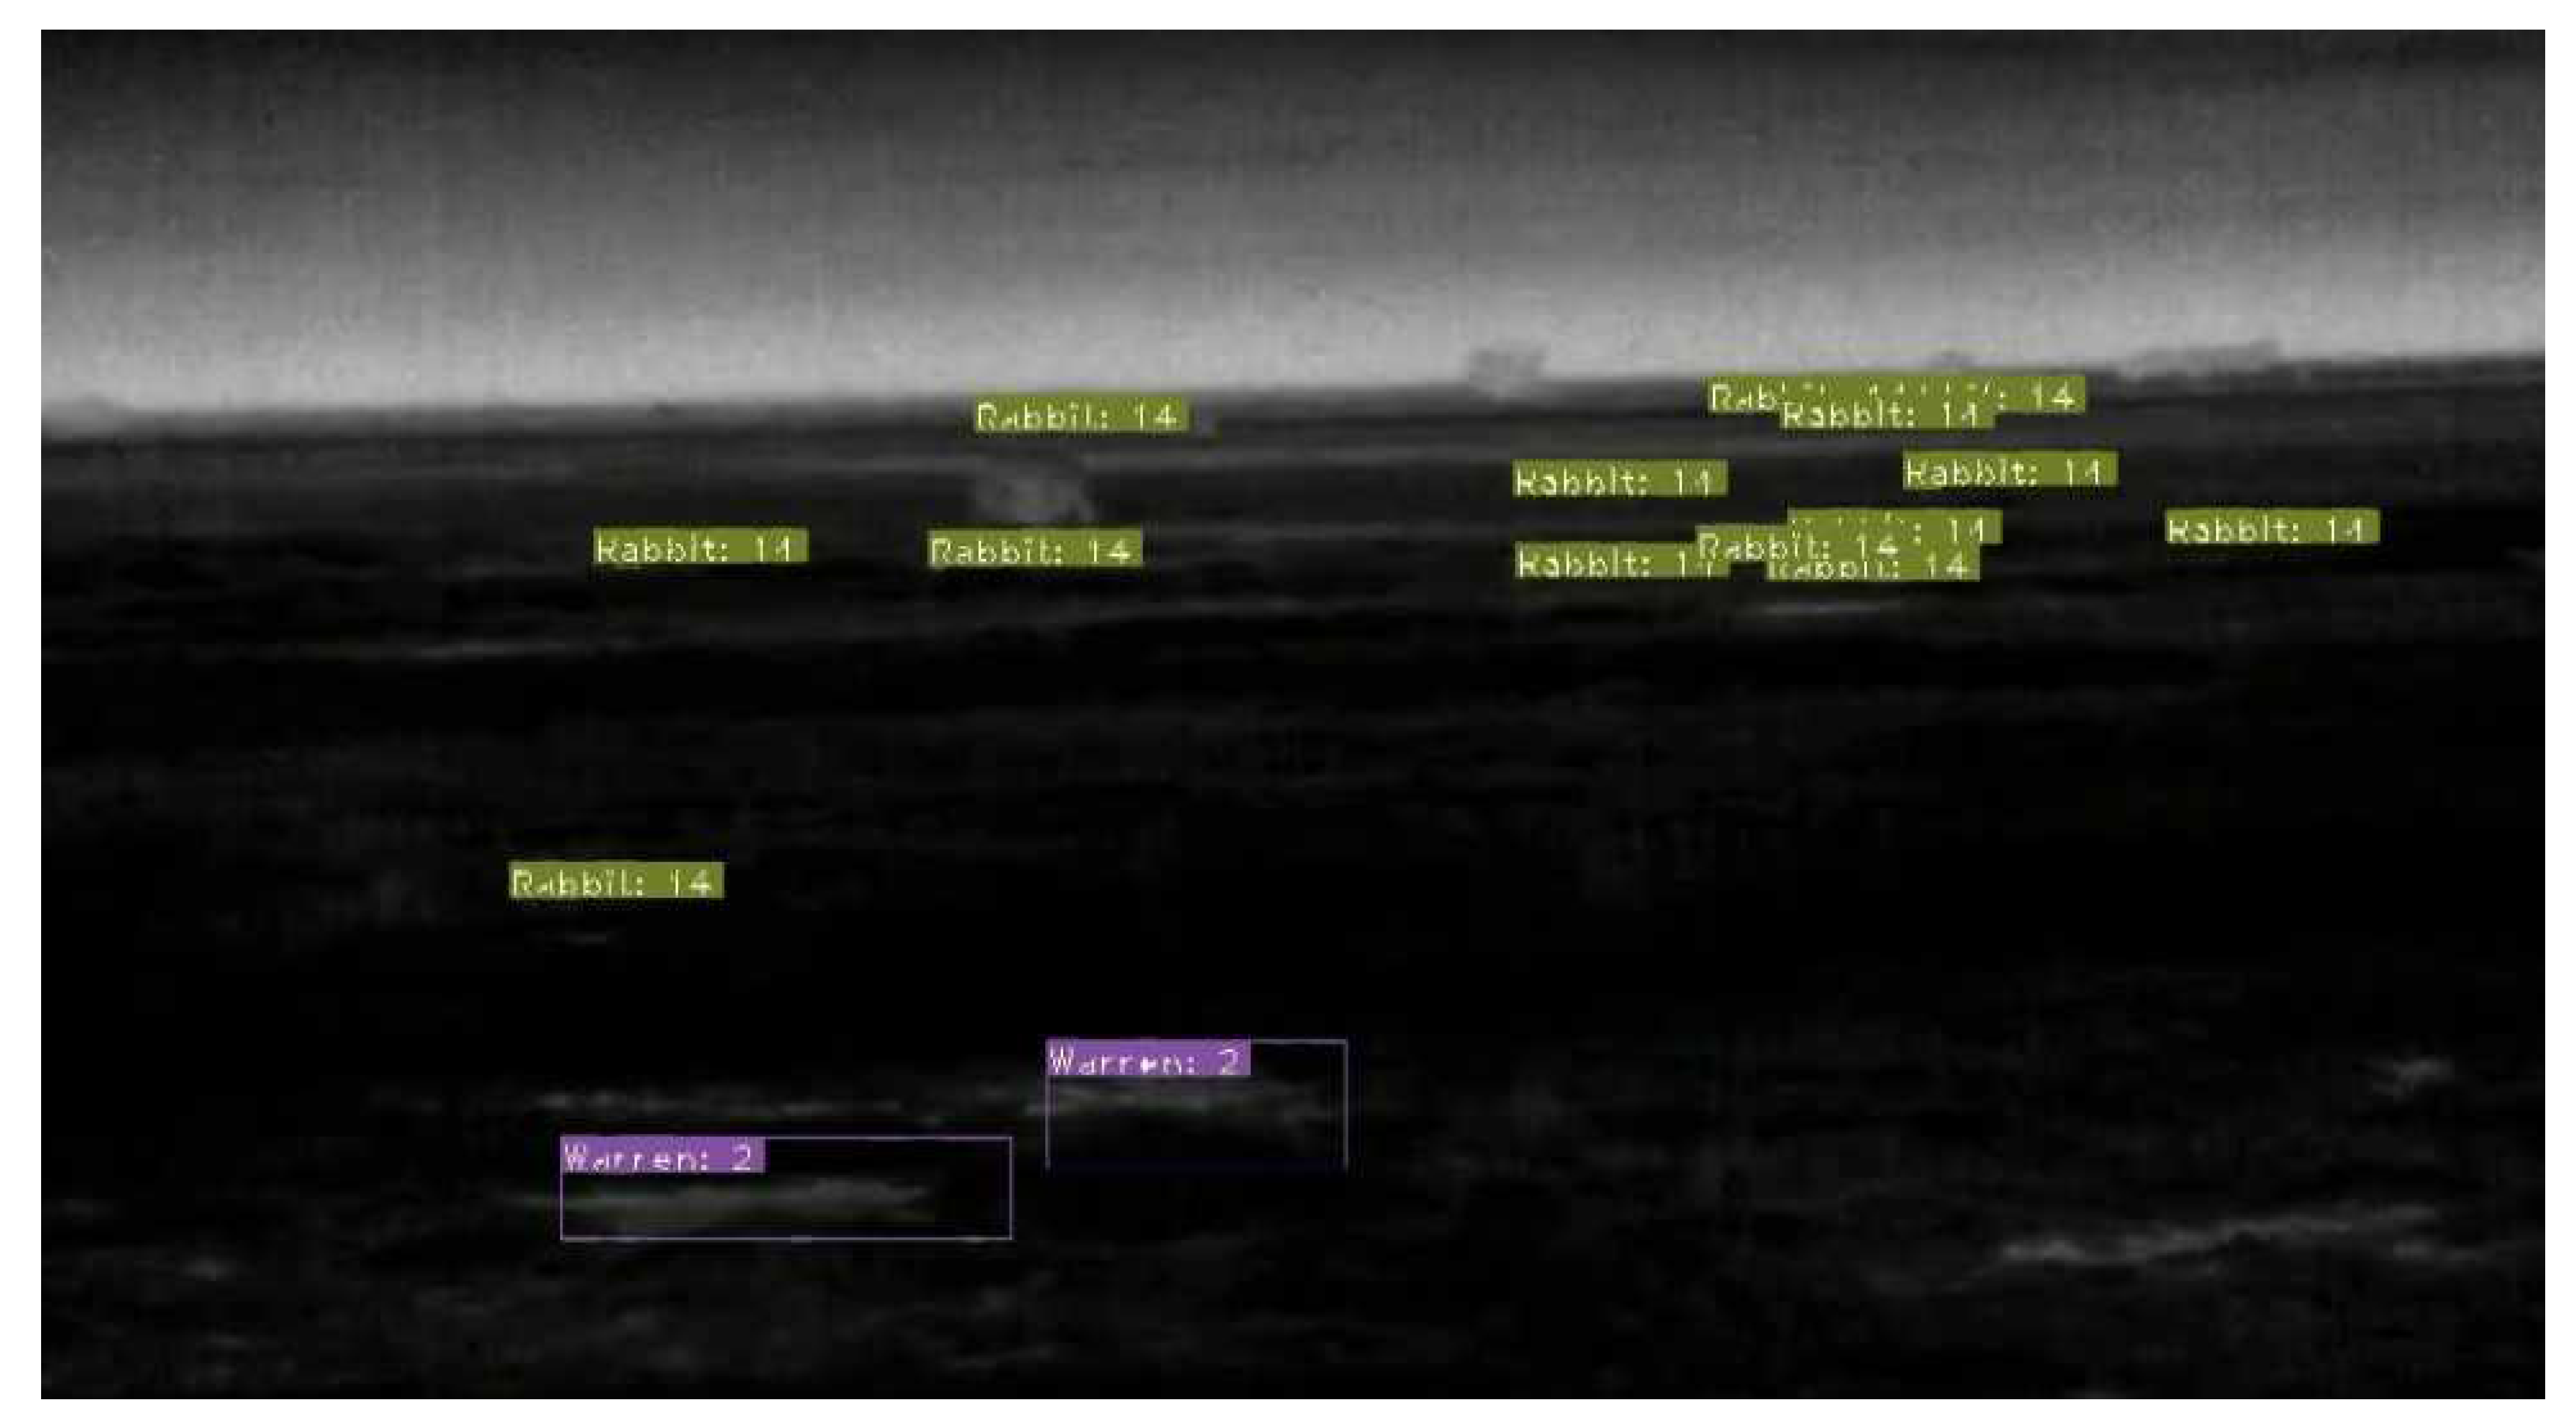
Similarly, we also trained our model for automated identification of habitats specifically rabbit warrens. Where rabbit numbers are high, warren entrances tend to be visible on thermal imagery, Cox et al. [7]. Figure 11 and so could be included in the automated detection with confidence.

Figure 11.
Identification of rabbits and their warren is shown with their respective labels found by our model. Yellow colour labels belong to rabbits, while purple colour labels are their warrens.
3. Dicussion
Our system enabled detection of small animals in low-resolution video sequences from thermal imagery. As thermal imagery is used more widely in wildlife management programs, the ability to accurately identify animals within the footage in timely manner will only become more important. Our work enhances the existing object detection algorithm, YOLO, to work with low resolution thermal imagery on a select number of animals. Future work will see the current model extended to include several other species of animal to make this system more broadly applicable.
We successfully detected all animals with D-YOLO that were detected manually. However, it is not yet known whether D-YOLO is better at detecting animals in thermal imagery than manual detection. Manual detection relies on observers, and observers can be subject to biases and other factors, including fatigue, interest, skill level, training, eyesight etc. These factors are essentially removed in automated detection, so automated detection may be more effective at identifying target species than manual review. Further investigation of how D-YOLO performs compared to manual detection is required.
The comparison of automated and manual review has flow-on effects for how automated detection algorithms are used in wildlife research programs. For pest animal management, the cost of missing or underestimating the number of animals in the landscape can be more than relying on manual detection. In these cases, there needs to be high confidence in the accuracy and precision of the algorithm compared to manual review. However, in conservation scenarios, this level of accuracy and precision may be less important. Therefore, not detecting every animal available does not have a negative cost impact on the land manager.
While we successfully developed this algorithm to identify these three species correctly, an aspect requiring further development is removing double counts. Although we didn’t report on this here, the same animal was counted twice in some instances as animals were identified. Future work will focus on developing robust strategies to manage this problem so that accurate counts of species can also be provided. Nevertheless, it is an important element of automation and will provide wildlife researchers and managers with a functional and valuable tool for reviewing thermal imaging footage.
4. Conclusions
This paper proposed a robust detection system to identify animals, and in the case of rabbits, their habitat, from aerial thermal imaging data. Our dataset had several challenges as the size of target animals was cryptic and small, but the resolution of our cameras was also low. This project aimed to develop a robust system for the identification of animals using consumer-level cameras. For this purpose, we introduced the distant object detection algorithm named D-YOLO (Distant-You Only Look Once) [20] for remote detection of small targets. Our system, trained on the massive data collected from New South Wales and Western Australia, can detect animals (rabbits, kangaroos, and pigs) with a probablity comparable to that of manual detection. This work will facilitate wildlife researchers to monitor the activities of animals across the landscape.
Author Contributions
All authors have made significant contributions to this research. Conceptualization, A.U. and A.K.; methodology, A.U., A.K. and T.L.; software, A.K. and T.L.; validation, A.U. and A.K.; formal analysis, A.K. and T.L.; investigation, A.U., A.K., M.P., P.A., T.E.C. and T.L.; resources, P.A. and T.E.C., data curation, A.K. and T.L.; writing—original draft preparation, A.U. and A.K.; writing—review and editing, A.U., A.K., M.P., P.A. and T.E.C.; visualization, A.K. and T.L.; supervision, A.U., A.K. and M.P.; project administration, A.U., A.K., M.P., P.A., T.E.C. and T.L.; funding acquisition, P.A. and T.E.C. All authors have read and agreed to the published version of the manuscript.
Funding
This research work was funded through the Australian Commonwealth Government’s Control tools and technologies for established pest animals and weeds competitive grants program 2017 and was completed with animal ethics approval (Orange AEC-ORA18/21/021).
Institutional Review Board Statement
Not applicable.
Informed Consent Statement
Not applicable.
Data Availability Statement
The data used to support the findings of this study are available subject to approval from the relevant departments through the corresponding author upon request.
Conflicts of Interest
The authors declare no conflict of interest.
References
- Van Hespen, R.; Hauser, C.E.; Benshemesh, J.; Rumpff, L.; Monfort, J.J.L. Designing a camera trap monitoring program to measure efficacy of invasive predator management. Wildl. Res. 2019, 46, 154–164. [Google Scholar] [CrossRef]
- Jepsen, E.M.; Ganswindt, A.; Ngcamphalala, C.A.; Bourne, A.R.; Ridley, A.R.; McKechnie, A.E. Non-invasive monitoring of physiological stress in an afrotropical arid-zone passerine bird, the southern pied babbler. Gen. Comp. Endocrinol. 2019, 276, 60–68. [Google Scholar] [CrossRef] [PubMed]
- Georgieva, M.; Georgiev, G.; Mirchev, P.; Filipova, E. Monitoring on appearance and spread of harmful invasive pathogens and pests in Belasitsa Mountain. In Proceedings of the X International Agriculture Symposium, Agrosym 2019, Jahorina, Bosnia and Herzegovina, 3–6 October 2019; Faculty of Agriculture, University of East Sarajevo: Lukavica, Bosnia and Herzegovina, 2019; pp. 1887–1892. [Google Scholar]
- Burke, C.; Rashman, M.; Wich, S.; Symons, A.; Theron, C.; Longmore, S. Optimizing observing strategies for monitoring animals using drone-mounted thermal infrared cameras. Int. J. Remote Sens. 2019, 40, 439–467. [Google Scholar] [CrossRef] [Green Version]
- Witczuk, J.; Pagacz, S.; Zmarz, A.; Cypel, M. Exploring the feasibility of unmanned aerial vehicles and thermal imaging for ungulate surveys in forests-preliminary results. Int. J. Remote Sens. 2018, 39, 5504–5521. [Google Scholar] [CrossRef]
- Colomina, I.; Molina, P. Unmanned aerial systems for photogrammetry and remote sensing: A review. ISPRS J. Photogramm. Remote Sens. 2014, 92, 79–97. [Google Scholar] [CrossRef] [Green Version]
- Cox, T.E.; Matthews, R.; Halverson, G.; Morris, S. Hot stuff in the bushes: Thermal imagers and the detection of burrows in vegetated sites. Ecol. Evol. 2021, 11, 6406–6414. [Google Scholar] [CrossRef] [PubMed]
- Karp, D. Detecting small and cryptic animals by combining thermography and a wildlife detection dog. Sci. Rep. 2020, 10, 5220. [Google Scholar] [CrossRef] [PubMed]
- Berg, A.; Johnander, J.; Durand de Gevigney, F.; Ahlberg, J.; Felsberg, M. Semi-automatic annotation of objects in visual-thermal video. In Proceedings of the IEEE International Conference on Computer Vision Workshops, Seoul, Korea, 27–28 October 2019. [Google Scholar]
- Kellenberger, B.; Marcos, D.; Lobry, S.; Tuia, D. Half a percent of labels is enough: Efficient animal detection in UAV imagery using deep cnns and active learning. IEEE Trans. Geosci. Remote Sens. 2019, 57, 9524–9533. [Google Scholar] [CrossRef] [Green Version]
- Meena, D.; Agilandeeswari, L. Invariant Features-Based Fuzzy Inference System for Animal Detection and Recognition Using Thermal Images. Int. J. Fuzzy Syst. 2020, 22, 1868–1879. [Google Scholar] [CrossRef]
- Shepley, A.J.; Falzon, G.; Meek, P.; Kwan, P. Location Invariant Animal Recognition Using Mixed Source Datasets and Deep Learning. bioRxiv 2020. [Google Scholar] [CrossRef]
- Corcoran, E.; Denman, S.; Hanger, J.; Wilson, B.; Hamilton, G. Automated detection of koalas using low-level aerial surveillance and machine learning. Sci. Rep. 2019, 9, 3208. [Google Scholar] [CrossRef] [PubMed] [Green Version]
- Girshick, R.; Donahue, J.; Darrell, T.; Malik, J. Rich feature hierarchies for accurate object detection and semantic segmentation. In Proceedings of the IEEE Conference on Computer Vision and Pattern Recognition, Columbus, OH, USA, 23–28 June 2014; pp. 580–587. [Google Scholar]
- Girshick, R. Fast r-cnn. In Proceedings of the IEEE International Conference on Computer Vision, Santiago, Chile, 7–13 December 2015; pp. 1440–1448. [Google Scholar]
- Ren, S.; He, K.; Girshick, R.; Sun, J. Faster r-cnn: Towards real-time object detection with region proposal networks. Adv. Neural Inf. Process. Syst. 2015, 28, 91–99. [Google Scholar] [CrossRef] [PubMed] [Green Version]
- He, K.; Gkioxari, G.; Dollár, P.; Girshick, R. Mask r-cnn. In Proceedings of the IEEE International Conference on Computer Vision, Venice, Italy, 22–29 October 2017; pp. 2961–2969. [Google Scholar]
- Lin, T.Y.; Dollár, P.; Girshick, R.; He, K.; Hariharan, B.; Belongie, S. Feature pyramid networks for object detection. In Proceedings of the IEEE Conference on Computer Vision and Pattern Recognition, Honolulu, HI, USA, 21–26 July 2017; pp. 2117–2125. [Google Scholar]
- Liu, W.; Anguelov, D.; Erhan, D.; Szegedy, C.; Reed, S.; Fu, C.Y.; Berg, A.C. Ssd: Single shot multibox detector. In European Conference on Computer Vision; Springer: Berlin/Heidelberg, Germany, 2016; pp. 21–37. [Google Scholar]
- Redmon, J.; Farhadi, A. YOLO9000: Better, faster, stronger. In Proceedings of the IEEE Conference on Computer Vision and Pattern Recognition, Honolulu, HI, USA, 21–26 July 2017; pp. 7263–7271. [Google Scholar]
- Lin, T.Y.; Maire, M.; Belongie, S.; Hays, J.; Perona, P.; Ramanan, D.; Dollár, P.; Zitnick, C.L. Microsoft coco: Common objects in context. In European Conference on Computer Vision; Springer: Berlin/Heidelberg, Germany, 2014; pp. 740–755. [Google Scholar]
- Redmon, J.; Farhadi, A. Yolov3: An incremental improvement. arXiv 2018, arXiv:1804.02767. [Google Scholar]
- Bochkovskiy, A.; Wang, C.Y.; Liao, H.Y.M. YOLOv4: Optimal Speed and Accuracy of Object Detection. arXiv 2020, arXiv:2004.10934. [Google Scholar]
- Liu, M.; Wang, X.; Zhou, A.; Fu, X.; Ma, Y.; Piao, C. UAV-YOLO: Small Object Detection on Unmanned Aerial Vehicle Perspective. Sensors 2020, 20, 2238. [Google Scholar] [CrossRef] [Green Version]
- LabelMe. The Open Annotation Tool. Available online: http://labelme2.csail.mit.edu/Release3.0/index.php?message=1 (accessed on 9 July 2021).
- Guo, W.; Li, W.; Gong, W.; Cui, J. Extended Feature Pyramid Network with Adaptive Scale Training Strategy and Anchors for Object Detection in Aerial Images. Remote Sens. 2020, 12, 784. [Google Scholar] [CrossRef] [Green Version]
- Redmon, J.; Divvala, S.; Girshick, R.; Farhadi, A. You only look once: Unified, real-time object detection. In Proceedings of the IEEE Conference on Computer Vision and Pattern Recognition, Las Vegas, NV, USA, 27–30 June 2016; pp. 779–788. [Google Scholar]
- He, K.; Zhang, X.; Ren, S.; Sun, J. Deep residual learning for image recognition. In Proceedings of the IEEE Conference on Computer Vision and Pattern Recognition, Las Vegas, NV, USA, 27–30 June 2016; pp. 770–778. [Google Scholar]
- Yu, F.; Koltun, V. Multi-scale context aggregation by dilated convolutions. arXiv 2015, arXiv:1511.07122. [Google Scholar]
- Yu, F.; Koltun, V.; Funkhouser, T. Dilated residual networks. In Proceedings of the IEEE Conference on Computer Vision and Pattern Recognition, Honolulu, HI, USA, 21–26 July 2017; pp. 472–480. [Google Scholar]


Publisher’s Note: MDPI stays neutral with regard to jurisdictional claims in published maps and institutional affiliations. |
© 2021 by the authors. Licensee MDPI, Basel, Switzerland. This article is an open access article distributed under the terms and conditions of the Creative Commons Attribution (CC BY) license (https://creativecommons.org/licenses/by/4.0/).