Abstract
Remote sensing holds great potential for detecting stress in vegetation caused by hydrocarbons, but we need to better understand the effects of hydrocarbons on plant growth and specific spectral expression. Willow (Salix viminalis var. Tora) cuttings and maize (Zea mays var. Lapriora) seedlings were grown in pots of loam soil containing a hydrocarbon-contaminated layer at the base of the pot (crude or refined oil) at concentrations of 0.5, 5, or 50 g·kg−1. Chlorophyll concentration, biomass, and growth of plants were determined through destructive and nondestructive sampling, whilst reflectance measurements were made using portable hyperspectral spectrometers. All biophysical (chlorophyll concentration and growth) variables decreased in the presence of high concentrations of hydrocarbons, but at lower concentrations an increase in growth and chlorophyll were often observed with respect to nonpolluted plants, suggesting a biphasic response to hydrocarbon presence. Absorption features were identified that related strongly to pigment concentration and biomass. Variations in absorption feature characteristics (band depth, band area, and band width) were dependent upon the hydrocarbon concentration and type, and showed the same biphasic pattern noted in the biophysical measurements. This study demonstrates that the response of plants to hydrocarbon pollution varies according to hydrocarbon concentration and that remote sensing has the potential to both detect and monitor the variable impacts of pollution in the landscape.
1. Introduction
Hydrocarbon leakage into the environment is a major problem, with large economic and environmental impacts [1]. In the year 2000, it was estimated that 1,802,000 tonnes of oil per year were spilled, with 600,000 tonnes per year from natural oil spills and 1,178,000 tonnes from industry [2,3]. Traditional methods for investigating seepages and oil pollution are time consuming, destructive, and expensive [4]. Investigation using hyperspectral remote sensing techniques to detect vegetation stress associated with hydrocarbon pollution have produced promising results [5,6,7,8], but further work is necessary to better understand the relationships between hydrocarbon pollutants, plant biophysical stresses, and spectral response at plant and canopy scales.
The appearance, growth, and productivity of vegetation are impacted by hydrocarbon leakage [9,10,11]. Vegetation is thus both impacted by and an indicator of hydrocarbon presence when compared to surrounding unpolluted landscapes. As discussed in [6], it is important that there are measurable physiological changes in the biochemical and biophysical characteristics of the vegetation that grows in polluted sites because if there is no measurable physiological change, then it cannot be remotely sensed. These biophysical and biochemical changes affecting plant health are diverse and can vary depending on factors including plant species, hydrocarbon type, concentration, persistence, and climate, among others [12,13] and, in consequence, the associated change in the spectral response is complex.
1.1. Hydrocarbon Impacts on Vegetation
Pollution of soil by hydrocarbons affects the biochemistry, physiology, and growth of plants: restricted growth in plants where high concentrations of hydrocarbons are present [7,9,10,11], as well as a reduction in height and weight [14], inhibition of germination [9,10,11,14], changes in the cellular structure [15], and even the death of the canopy [16,17] have all been observed.
In hydrocarbon polluted environments, chlorophyll may decrease differently depending on both plant species and hydrocarbon type [18,19,20]. However, some authors have observed the inverse effect of hydrocarbons on chlorophyll content, detecting a rise at hydrocarbon concentrations of 1 g·kg−1 of hydrocarbons [20] and in soils with 10 g·kg−1 of crude oil [21].
The three most important components in the generation of plant biomass from carbon assimilation are starch, cellulose, and lignin. These leaf biochemical constituents can be used to estimate canopy structural variables; [22,23] found that crude oil at concentrations of 2.5–5–10–20 g·kg−1 produced a decrease in growth of Vigna unguiculata due to an inhibition of starch assimilation by the plant.
1.2. Spectral Response of Vegetation in Hydrocarbon Polluted Environments
The reflectance of plants varies depending on which biophysical and biochemical properties are impacted by the presence of hydrocarbons in the soil. Several authors have reported different behaviors in different parts of the spectrum depending on the hydrocarbon type and concentration (Table 1).

Table 1.
Previously published changes in the visible (VIS), near-infrared (NIR), and shortwave infrared (SWIR) reflectance of vegetation depending on the hydrocarbon type, concentration, plant species, and days of exposure. (HC: hydrocarbon, ↑: increase of reflectance, ↓: decrease of reflectance).
Absorption features in vegetation reflectance spectra are driven by the concentration of biochemical components in leaves, e.g., pigments, nitrogen, water, cellulose, lignin, among others [24]. Several studies have noted variable responses of absorption features to pollution from diesel and gasoline, with decreased band depth ratios in Zea maize, Brachiara brizantha, and Neonotonia wightii Arn absorption at 500 to 800 nm compared to controlled sites [25] but both increases and decreases in band depth for Brachiara brizantha [26]. Both studies noted changing responses of the same features over time. Thus, the spectral characteristics of vegetation responding to hydrocarbon pollution may change with both species and time since pollution.
In hydrocarbon polluted environments, hyperspectral vegetation indices have been used to evaluate the impacts on vegetation [6,27,28]. Several authors [6,26,29] have shown that indices with sensitivity to photosynthetic pigments were the most useful for discriminating polluted and nonpolluted vegetation, and even different hydrocarbon pollution concentrations. Vegetation indices are also suitable for tracking pigment and water content variations in hydrocarbon polluted vegetation over time [5,6,30].
In the case of broadband vegetation indices, studies using the NDVI (normalized difference vegetation index) and NDWI (normalized difference water index) have been used to detect changing spectral response of vegetation in hydrocarbon polluted locations [6,33,34], as have indices based on the red edge position of plant reflectance. The majority of authors have found that high concentrations of hydrocarbons in soils produce shifts in the red edge position to shorter wavelengths [19,26,35]. However, at low hydrocarbon concentrations, several studies [25,26,36] have reported shifts towards longer wavelengths, indicating increases in chlorophyll content and/or LAI (leaf area index).
Observational scale is one of the challenges of using remote sensing in hydrocarbon-impacted environments. The transferability of the response between handheld devices that measure say leaf-scale response, to satellite imagery that may record canopy/landscape responses to change, must be understood taking into account all the biochemical and biophysical changes that ultimately control all the inputs and responses at every scale of work. This study seeks to monitor and evaluate the biophysical and spectral responses of willow and maize to localised hydrocarbon pollution that results from different concentrations of crude and refined oil, to ultimately aid the use of remote sensing as a tool to monitor hydrocarbon pollution and vegetation stress in the wider landscape. Hydrocarbon pollutant was introduced in a layer of soil underneath the experimental plants to better simulate hydrocarbon seepage from buried pipelines or natural oil seeps.
2. Materials and Methods
2.1. Experiment Design
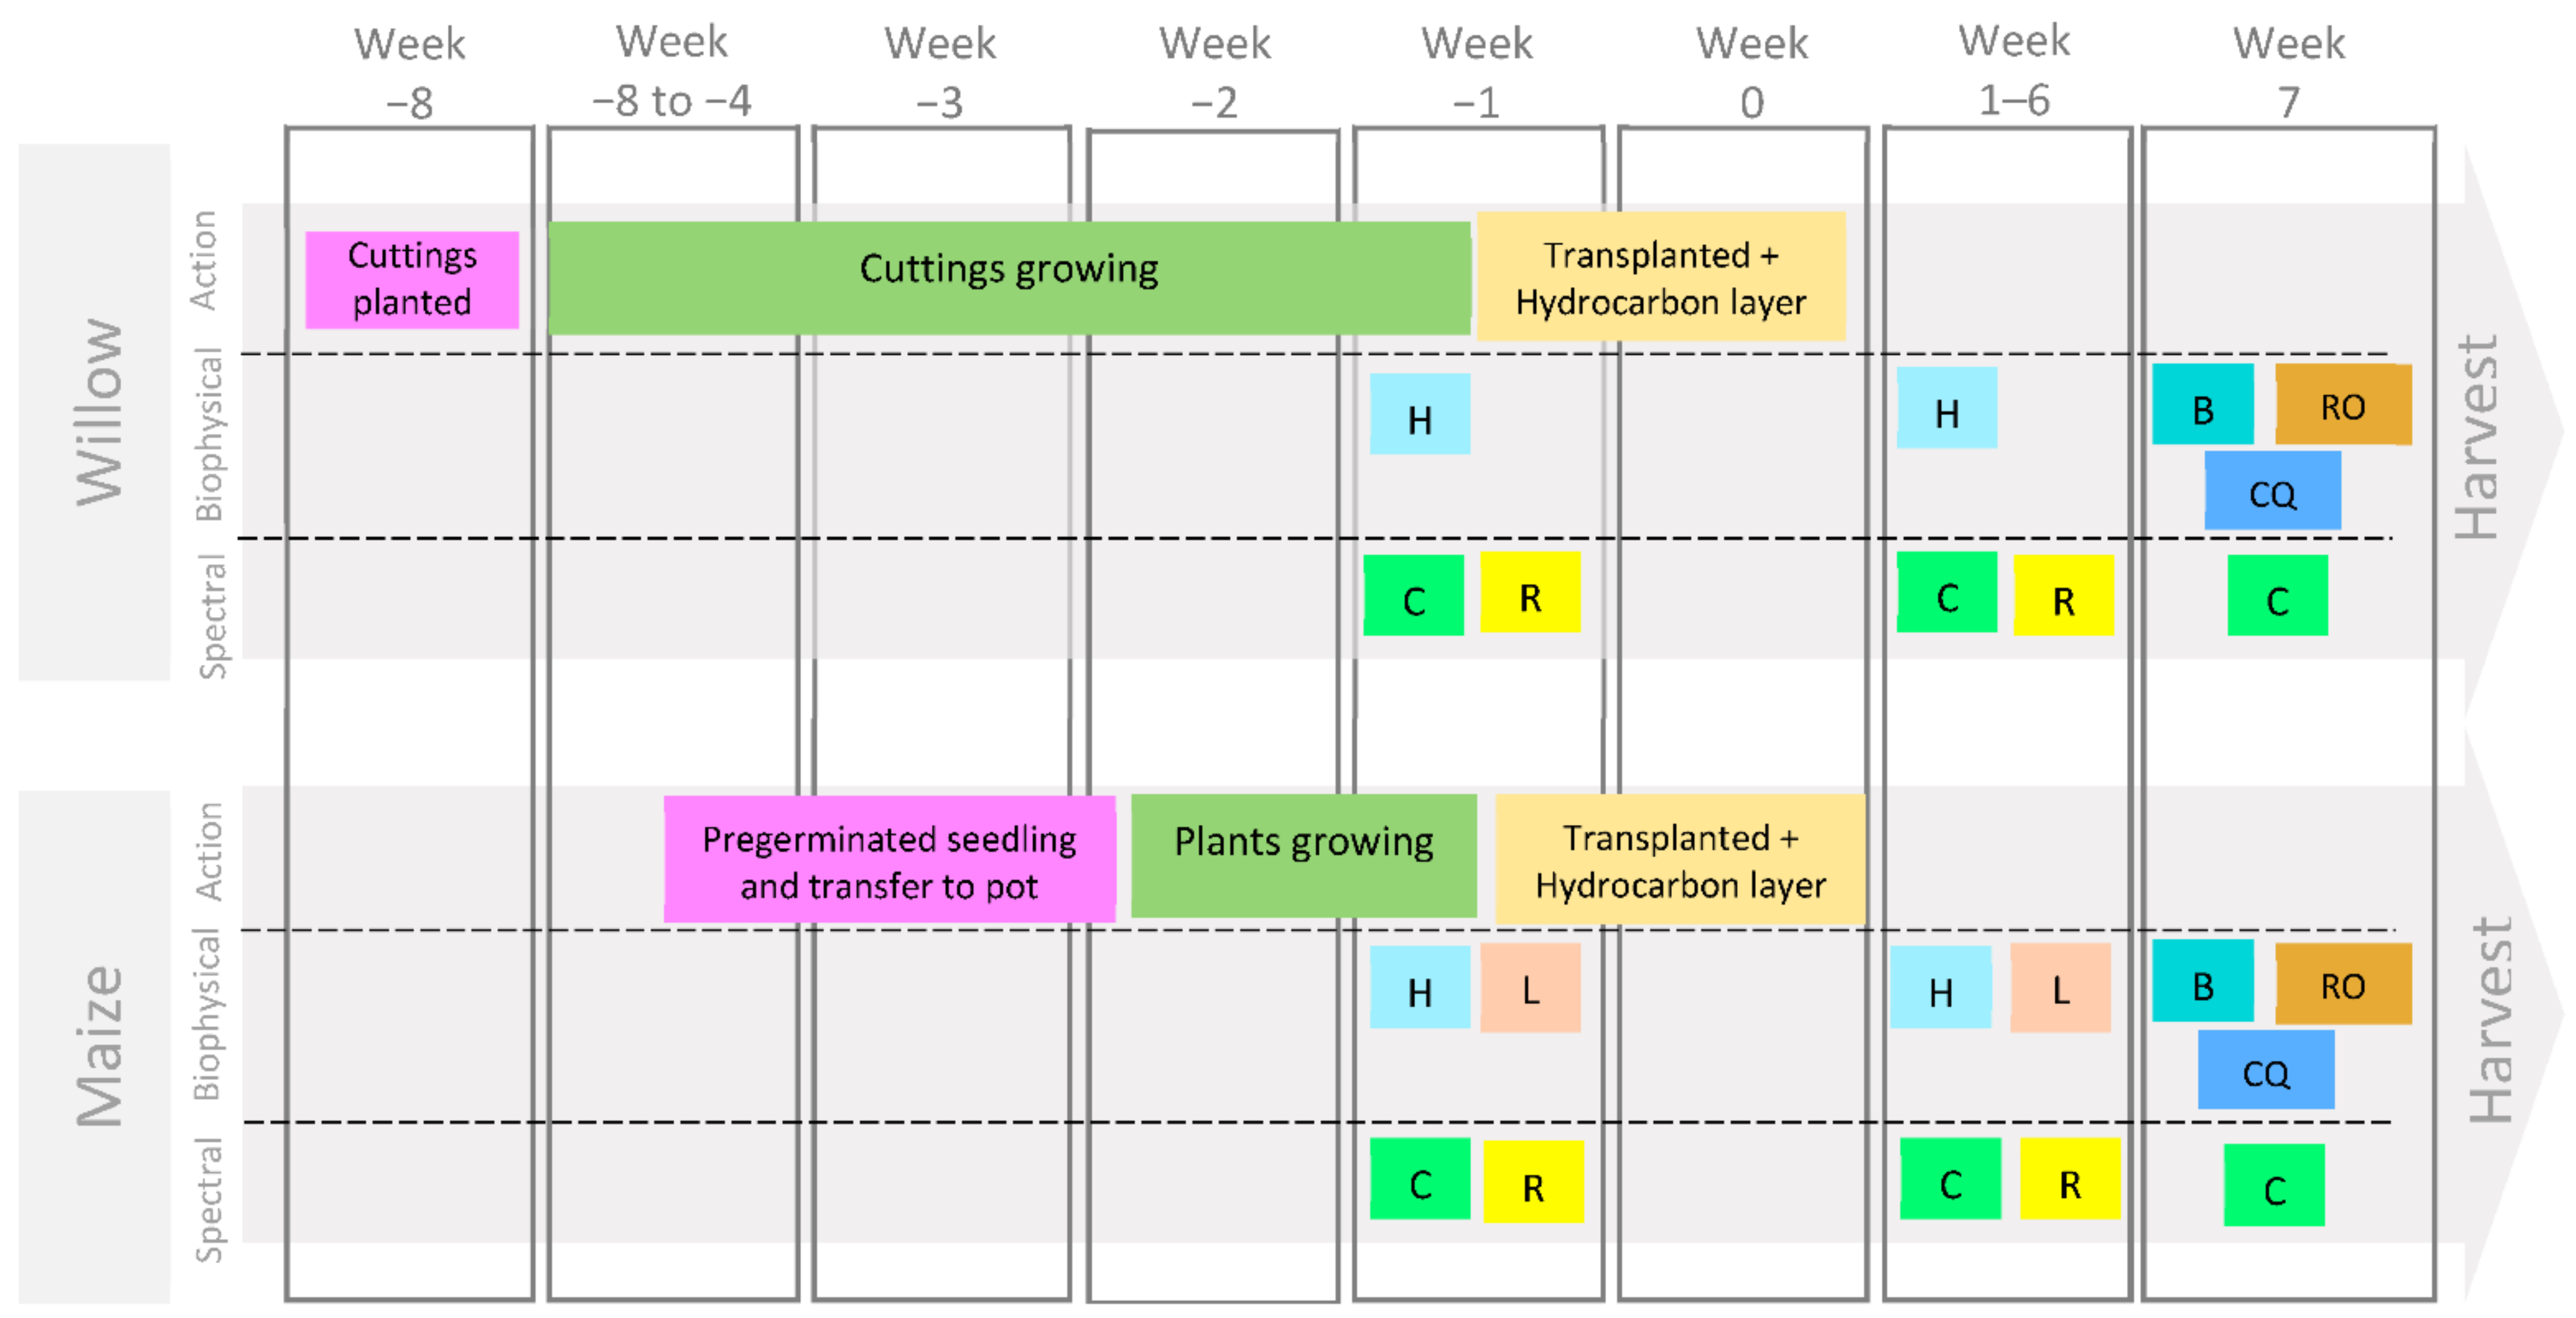
A pot-based experiment was conducted in the polytunnels of The James Hutton Institute in Invergowrie (United Kingdom), from the 1 May 2018 to the end of August 2018. Individual plants of two species, maize (Zea mays var. Lapriora, propagated from grain), and willow (Salix viminalis var. Tora, propagated from cuttings) were grown in two litre pots (15.6 cm width by 15.4 cm height) and filled initially with 2 kg of John Innes No. 2 loam (CTS Garden Supplies, Lanark, UK), sieved and mixed in a 10 mm sieve to maintain uniformity. Plants were watered with 200 mL of mains water twice a week for 3 weeks and then with an automatic irrigation system (drip irrigation with irrigation spikes) set up to deliver 100 mL of water twice a day, in the morning and in the evening (Figure 1). The pots were placed in a random position within the polytunnel to minimise any systematic bias resulting from variation in light or temperature. The plants were grown illuminated only by sunlight (approximately 16 h daylength). Handheld spectrometer MultispeQ recorded temperature and ambient humidity when leaf-readings were taken inside the polytunnel doorway (averaging 25 to 27 °C, and 50% to 60%, respectively).
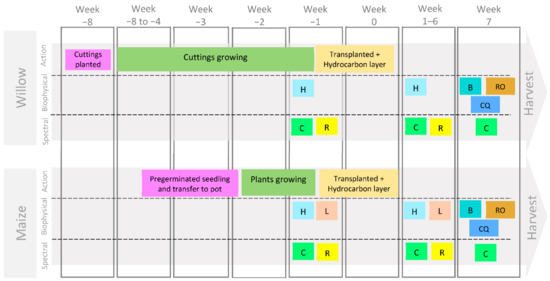
Figure 1.
Experiment steps (Action), biophysical and spectral data collection for willow and maize. (L = leaf number, including colour; H = plant height, C = chlorophyll measured with MultispeQ, R = reflectance measured with ASD FieldSpec® Pro 3, B = total plant biomass, RO = root observations, CQ = chemical analysis of chlorophyll).
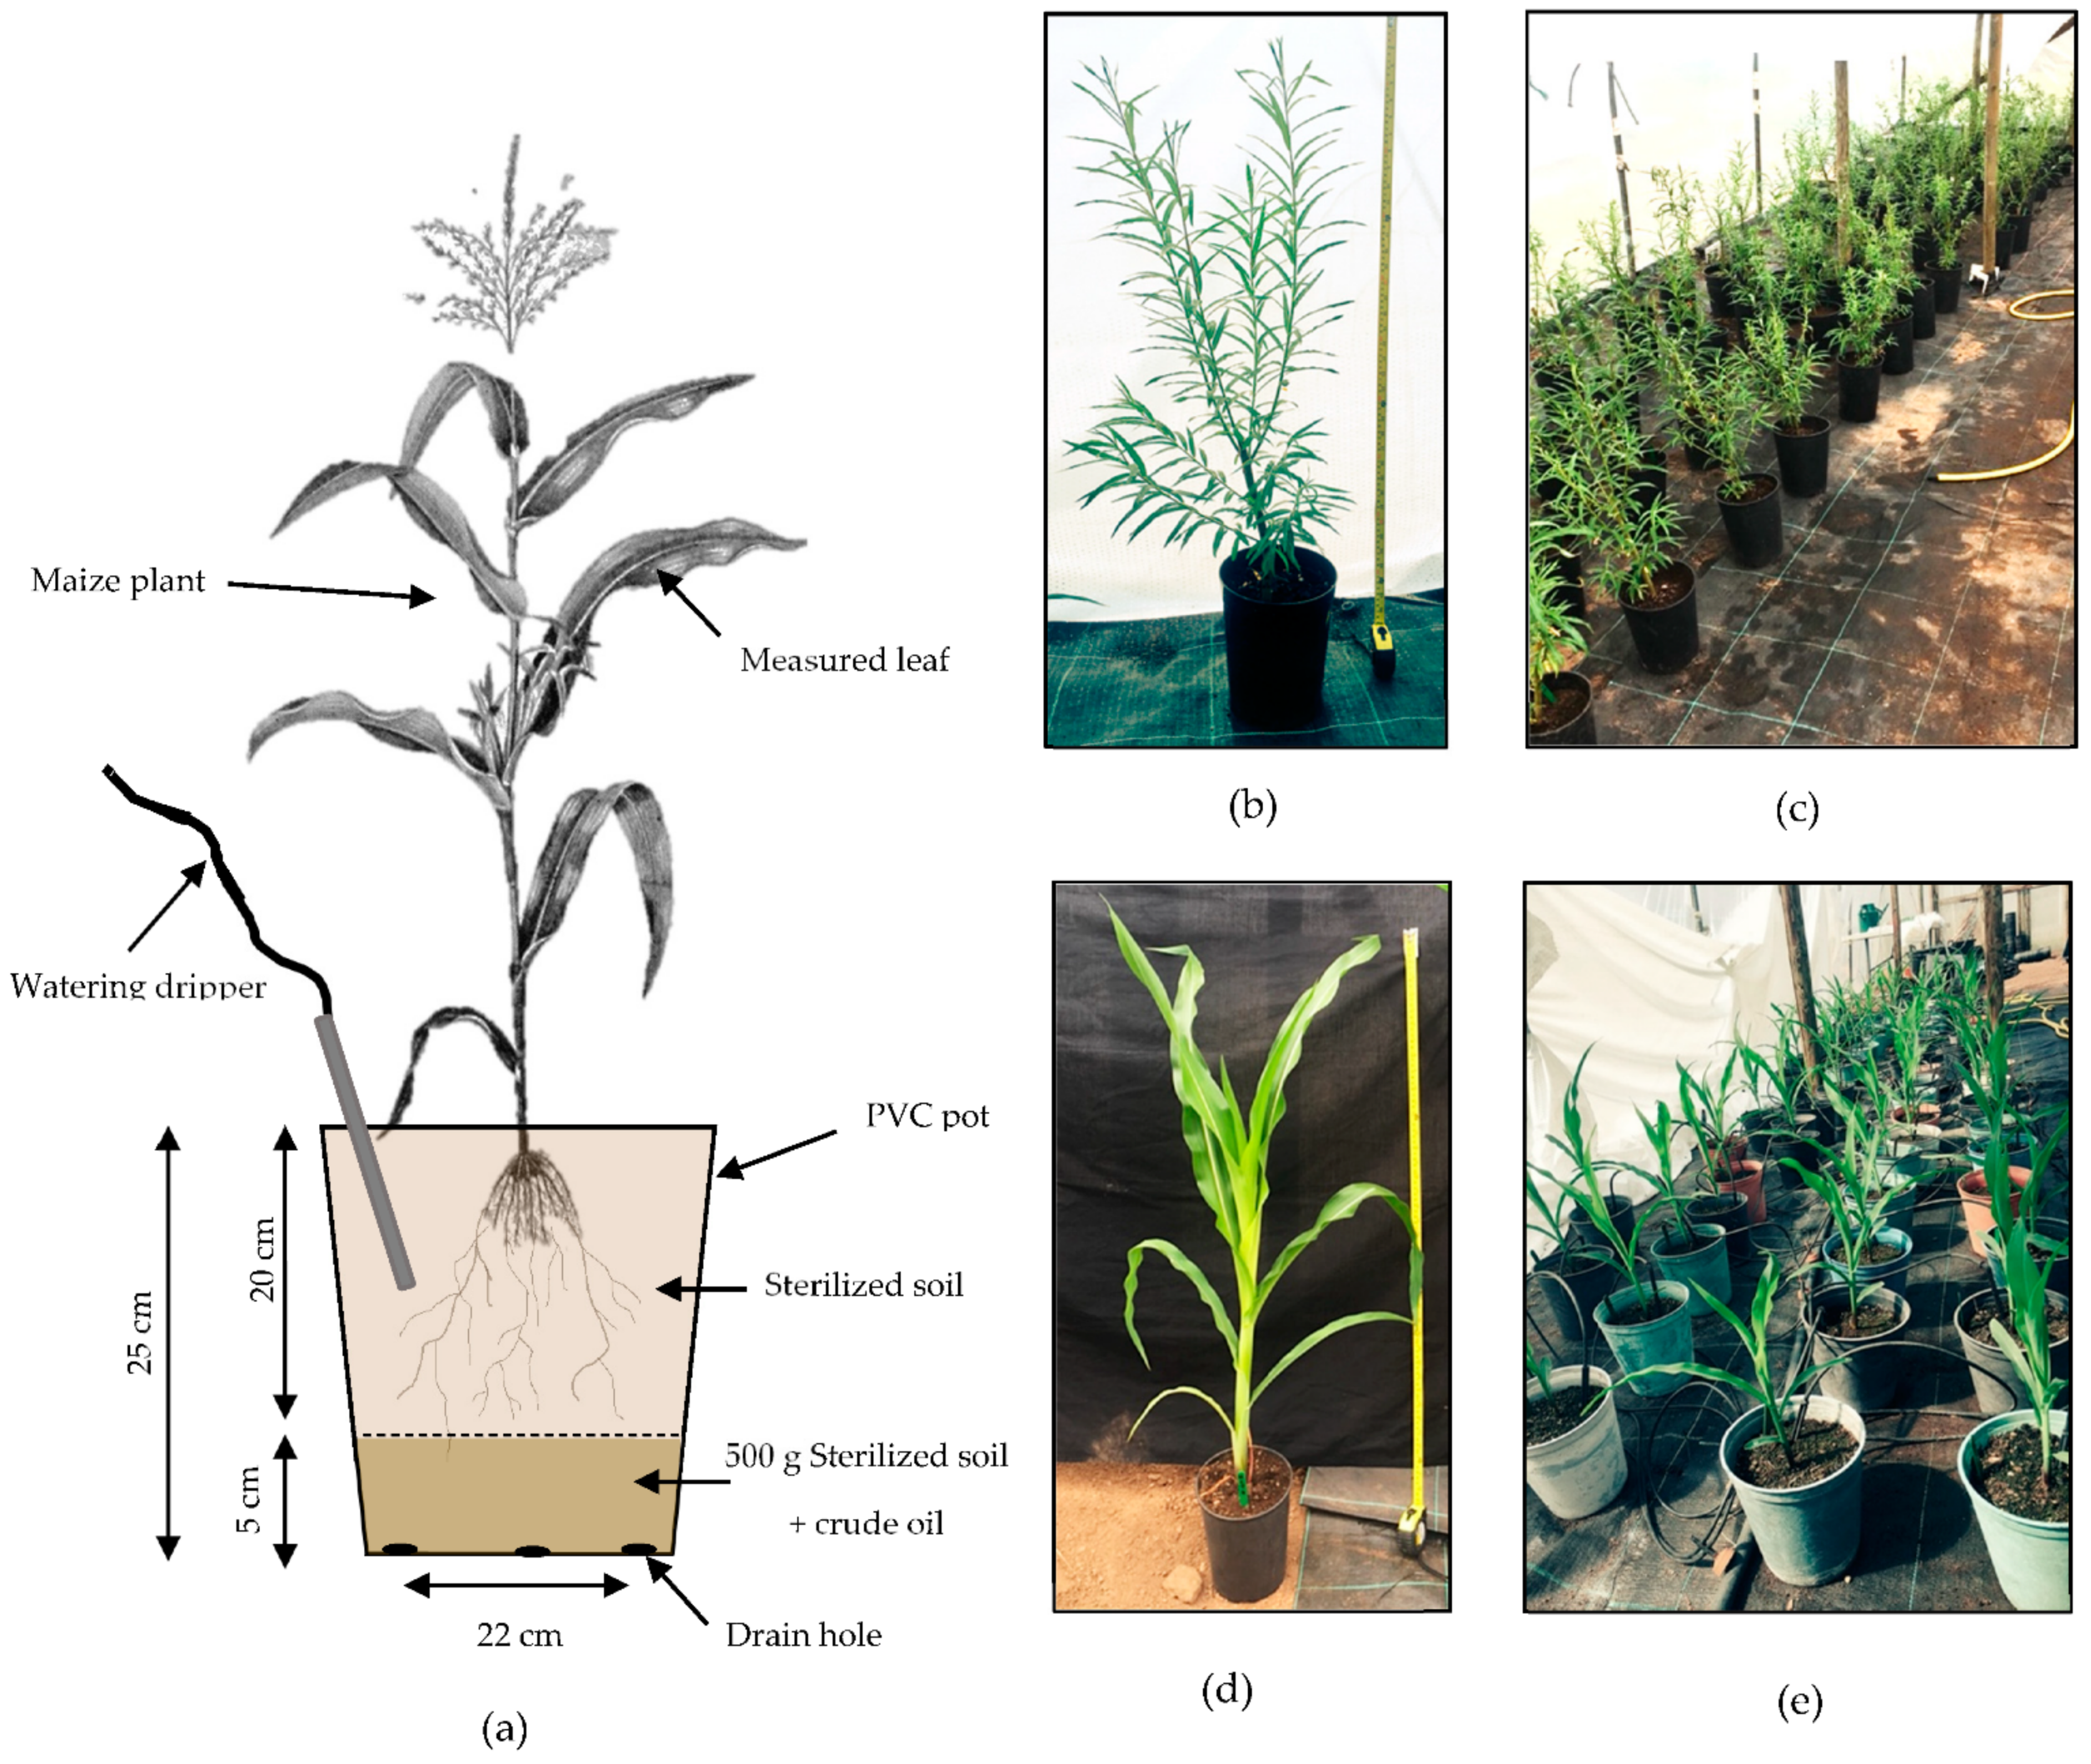
After establishment (8 weeks for willows and 3 weeks for maize), plants were repotted in 4 litre plant pots with a uniformly mixed polluted soil layer containing a specific hydrocarbon type and concentration (Figure 1). The hydrocarbons used for the polluted layer were a crude oil from a North Sea oil field (crude oil sweet <0.5% sulfur) proportioned by TOTAL Energies and commercial petrol octane rating number 98 (refined oil). The polluted layer was composed of an additional 500 g of the same soil, John Innes No. 2 loam used during the growth stage of plants, but with the addition of the specific liquid hydrocarbon. To better simulate hydrocarbon seepages, hydrocarbon pollutant was introduced in a 5 cm layer of soil underneath the experimental plants. The pots were distributed in eight groups along the greenhouse in which each group was formed by one replicate of each treatment (Figure 2). In addition, the pot positions were rotated every week to minimise any light or temperature bias due to their location in the polytunnel.
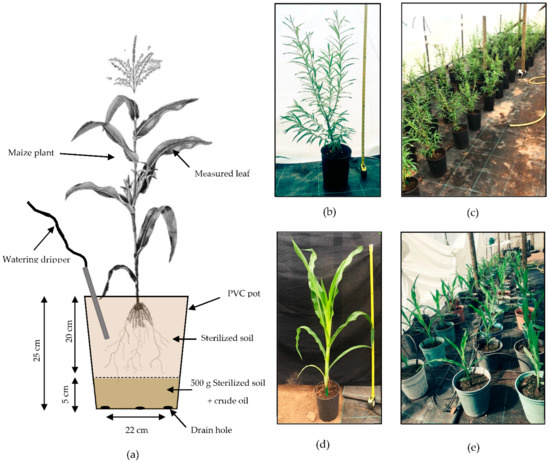
Figure 2.
(a) Schematic diagram of a maize plant set up in the experiment. (b) Willow tree after 8 weeks of growth before the addition of the crude oil polluted layer (1 m tape). (c) Distribution of willow trees in the polytunnel during the experiment. (d) Maize plant after 5 weeks of growth with no crude oil pollution layer in the pot (1 m tape). (e) Distribution of maize plants in the polytunnel during the experiment. (Plant diagram modified from https://upload.wikimedia.org/wikipedia/commons/0/0c/PSM_V82_D230_Maize_and_its_proposed_asiatic_origin.png, accessed on 12 May 2021; unknown author, public domain via Wikimedia Commons).
2.2. Biophysical Measurements
For willows, plant height and chlorophyll content were measured weekly, and in the case of maize, the total number of leaves, number of green leaves, number of yellow leaves, number of brown leaves, and chlorophyll content was measured. Chlorophyll measurements were taken using the handheld spectrometer MultispeQ (PhotosynQ LLC, East Lansing, MI, USA).
At the end of the experiment, additional measurements were taken for both willows and maize: for willows, fresh aboveground biomass, transpiration (24 h mass-loss with covered soil surface), and soil nutrient chemical analysis; in the case of maize, leaf length, leaf width, height, fresh biomass, dry biomass, transpiration (24 h mass-loss with covered soil surface) and soil nutrient chemical analysis.
In order to carry out calibration/validation of the spectral data, chlorophyll was measured in leaf samples. To determine chlorophyll and carotenoid content, each sample of 50 g of leaf material was collected and placed in sterilized plastic tubs and stored in a cool box for later chemical analysis following the procedure described in [37].
To determine the fresh biomass of willow trees, the mass of the entire aboveground plant was recorded. In the case of maize, it was divided into leaves, stem, and cobs, and each component was weighed separately. Dry biomass in maize plants was measured after drying the plants in paper bags in an oven at 70 °C for 72 h and then weighing again. Roots were photographed at the end of the experiment after removing the plant from the plastic pot, to give a visual indication of the relative root distributions in the different concentration treatments and between soil layers.
2.3. Spectral Measurements
In situ reflectance measurements were obtained using two instruments; an ASD FieldSpec® Pro 3 high resolution spectroradiometer [38], loaned from the NERC Field Spectroscopy Facility (University of Edinburgh, United Kingdom) and a multispectral and fluorescence handheld spectrometer MultispeQ (PhotosynQ LLC, East Lansing, MI, USA). The ASD FieldSpec® Pro 3 detects electromagnetic radiation between 350 and 2500 nm with a spectral resolution of 3 nm from 350 to 700 nm, 8.5 nm from 700 to 1400 nm, and 6.5 nm from 1400 to 2100 nm [38]. The MultispeQ is built with 2 photodiode detectors covering the visible from 400 to 700 nm and the near-infrared from 700 to 1500 nm. These detectors capture the emission of the 8 LEDs that have peak emissions at 530, 605, 650, 730, 850, and 940 nm [12].
Leaf spectral reflectance was measured on seven separate occasions during the experiment with the ASD FieldSpec® Pro 3, by measuring 3 leaves per individual plant and 3 individuals per treatment each time. The three individual replicate plants chosen for measurement were selected according to the spatial distribution of plant groups inside the tunnel; the group closer to the door, the group in the middle of the tunnel and the group located furthest away from the entrance. For each willow tree replicate, three branches were selected and for each branch one leaf from the middle part of the branch was removed. Detached leaves were used only in the case of willow because a single leaf did cover the entire field-of-view of the spectroradiometer, even when using the specialized plant probe fore optics. To ensure that the FOV was completely filled, each spectrum was recorded using three willow leaves, detaching them immediately before each measurement (Figure S14a,b). The leaves selected for each measurement were detached from the plant and placed with the adaxial surface up on the low reflectance dish side-by-side. The sample area measured by the plant probe was 10 mm in diameter. In the case of maize plants, leaf numbers 3, 4, and 5 counting from the base were selected for each measurement. The leaf was placed on top of the low reflectance dish, completely filling the field of view, and a spectrum recorded.
Multispectral was made with the MultispeQ on 7 occasions just after the ASD FieldSpec® Pro 3 measurements, collecting 24 samples per treatment. Nondestructive measurements were made by placing willow and maize leaves within the sensor clamp for 15 s. For maize, measurements were made on the fourth leaf counting from the base of the plant and for willow random leaves in the middle part of the tree were selected.
2.4. Reflectance Data Processing
The ASD FieldSpec® Pro 3 recorded an average reflectance from 30 scans and then averaged for each spectrum saved. A total of 3 spectra were saved from the same place. Reflectance spectra were analysed according to the shape of the reflectance curve and the position of the spectral changes in the time series according to the methodology described by [39]. For the analysis of the spectral shape, the reflectance signatures were averaged by measurement, day, and treatment. The analysis of the position of the spectral changes was evaluated by calculating the average for each control and polluted treatment reflectance spectra for each day of measurement. The ratio between reflectance values of polluted treatments and control treatments was calculated as a percentage of change with respect to the control treatment (Equations (1) and (2)).
where Rλ is the average of the reflectance values for each day of measurement and Rλ Change above 95% confidence is the 95% change above the confidence interval of the control reflectance measurements. A modification to the ratio was introduced with respect to the one stated in [39] due to the changing phenology of the plants. In order to account for phenology changes, Rλ control used was different for each day of the time series instead of taking the Rλ control only from the beginning of the season.
Derivative analysis was used to identify spectral absorption features, reduce spectral variations due to illumination, baseline shifts, and to reveal absorption features masked by broader interference from other leaf components and biochemicals. The data were smoothed using a polynomial fitting method [40]. Each spectrum was processed to obtain the second derivative and the location of the local maxima. Changes in the magnitude of the reflectance spectra increased the local maxima peaks in the second derivative that were related to concentration increase of the substance causing the absorbance. To extract the wavelengths of the local maxima, a function called “findpeaks” from the function package GGMISC [41] was implemented in the open-source software R [42]. This function detects local maxima defining a peak as a point with n points at either site with a smaller value in the function.
2.5. Continuum Removal
Specific absorption features were identified and their characteristics determined using a continuum removal method [43]. In this study, a segmented hull was selected due to the close position of the absorption features in the derivative analysis. From the continuum line, band depth, band area, and band width were calculated.
2.6. Spectral Vegetation Indices
SVIs (spectral vegetation indices) were selected according to the areas of interest extracted from the derivative and absorption feature analysis and from indices reported in previously published literature (Table S3). The performance of various indices was studied in relation to the ability to discriminate between the different pollution levels with respect to the control treatments. SVIs were processed using the HSDAR package [44] in the open-source R programming software [42].
2.7. Statistics
Analysis of variance was computed for all absorption features and SVIs in all treatments for each day of measurement to determine whether statistically significant difference existed between treatments.
3. Results
3.1. Biophysical Results
Note: To save space, results for the crude oil treatments are shown in the main figures of the paper, whilst results from the refined oil experiments are plotted in Supplementary Data associated with this paper. Both sets of data are discussed in the text, and many similarities existed between the two contamination treatments.
3.1.1. Plant Morphology and Biomass
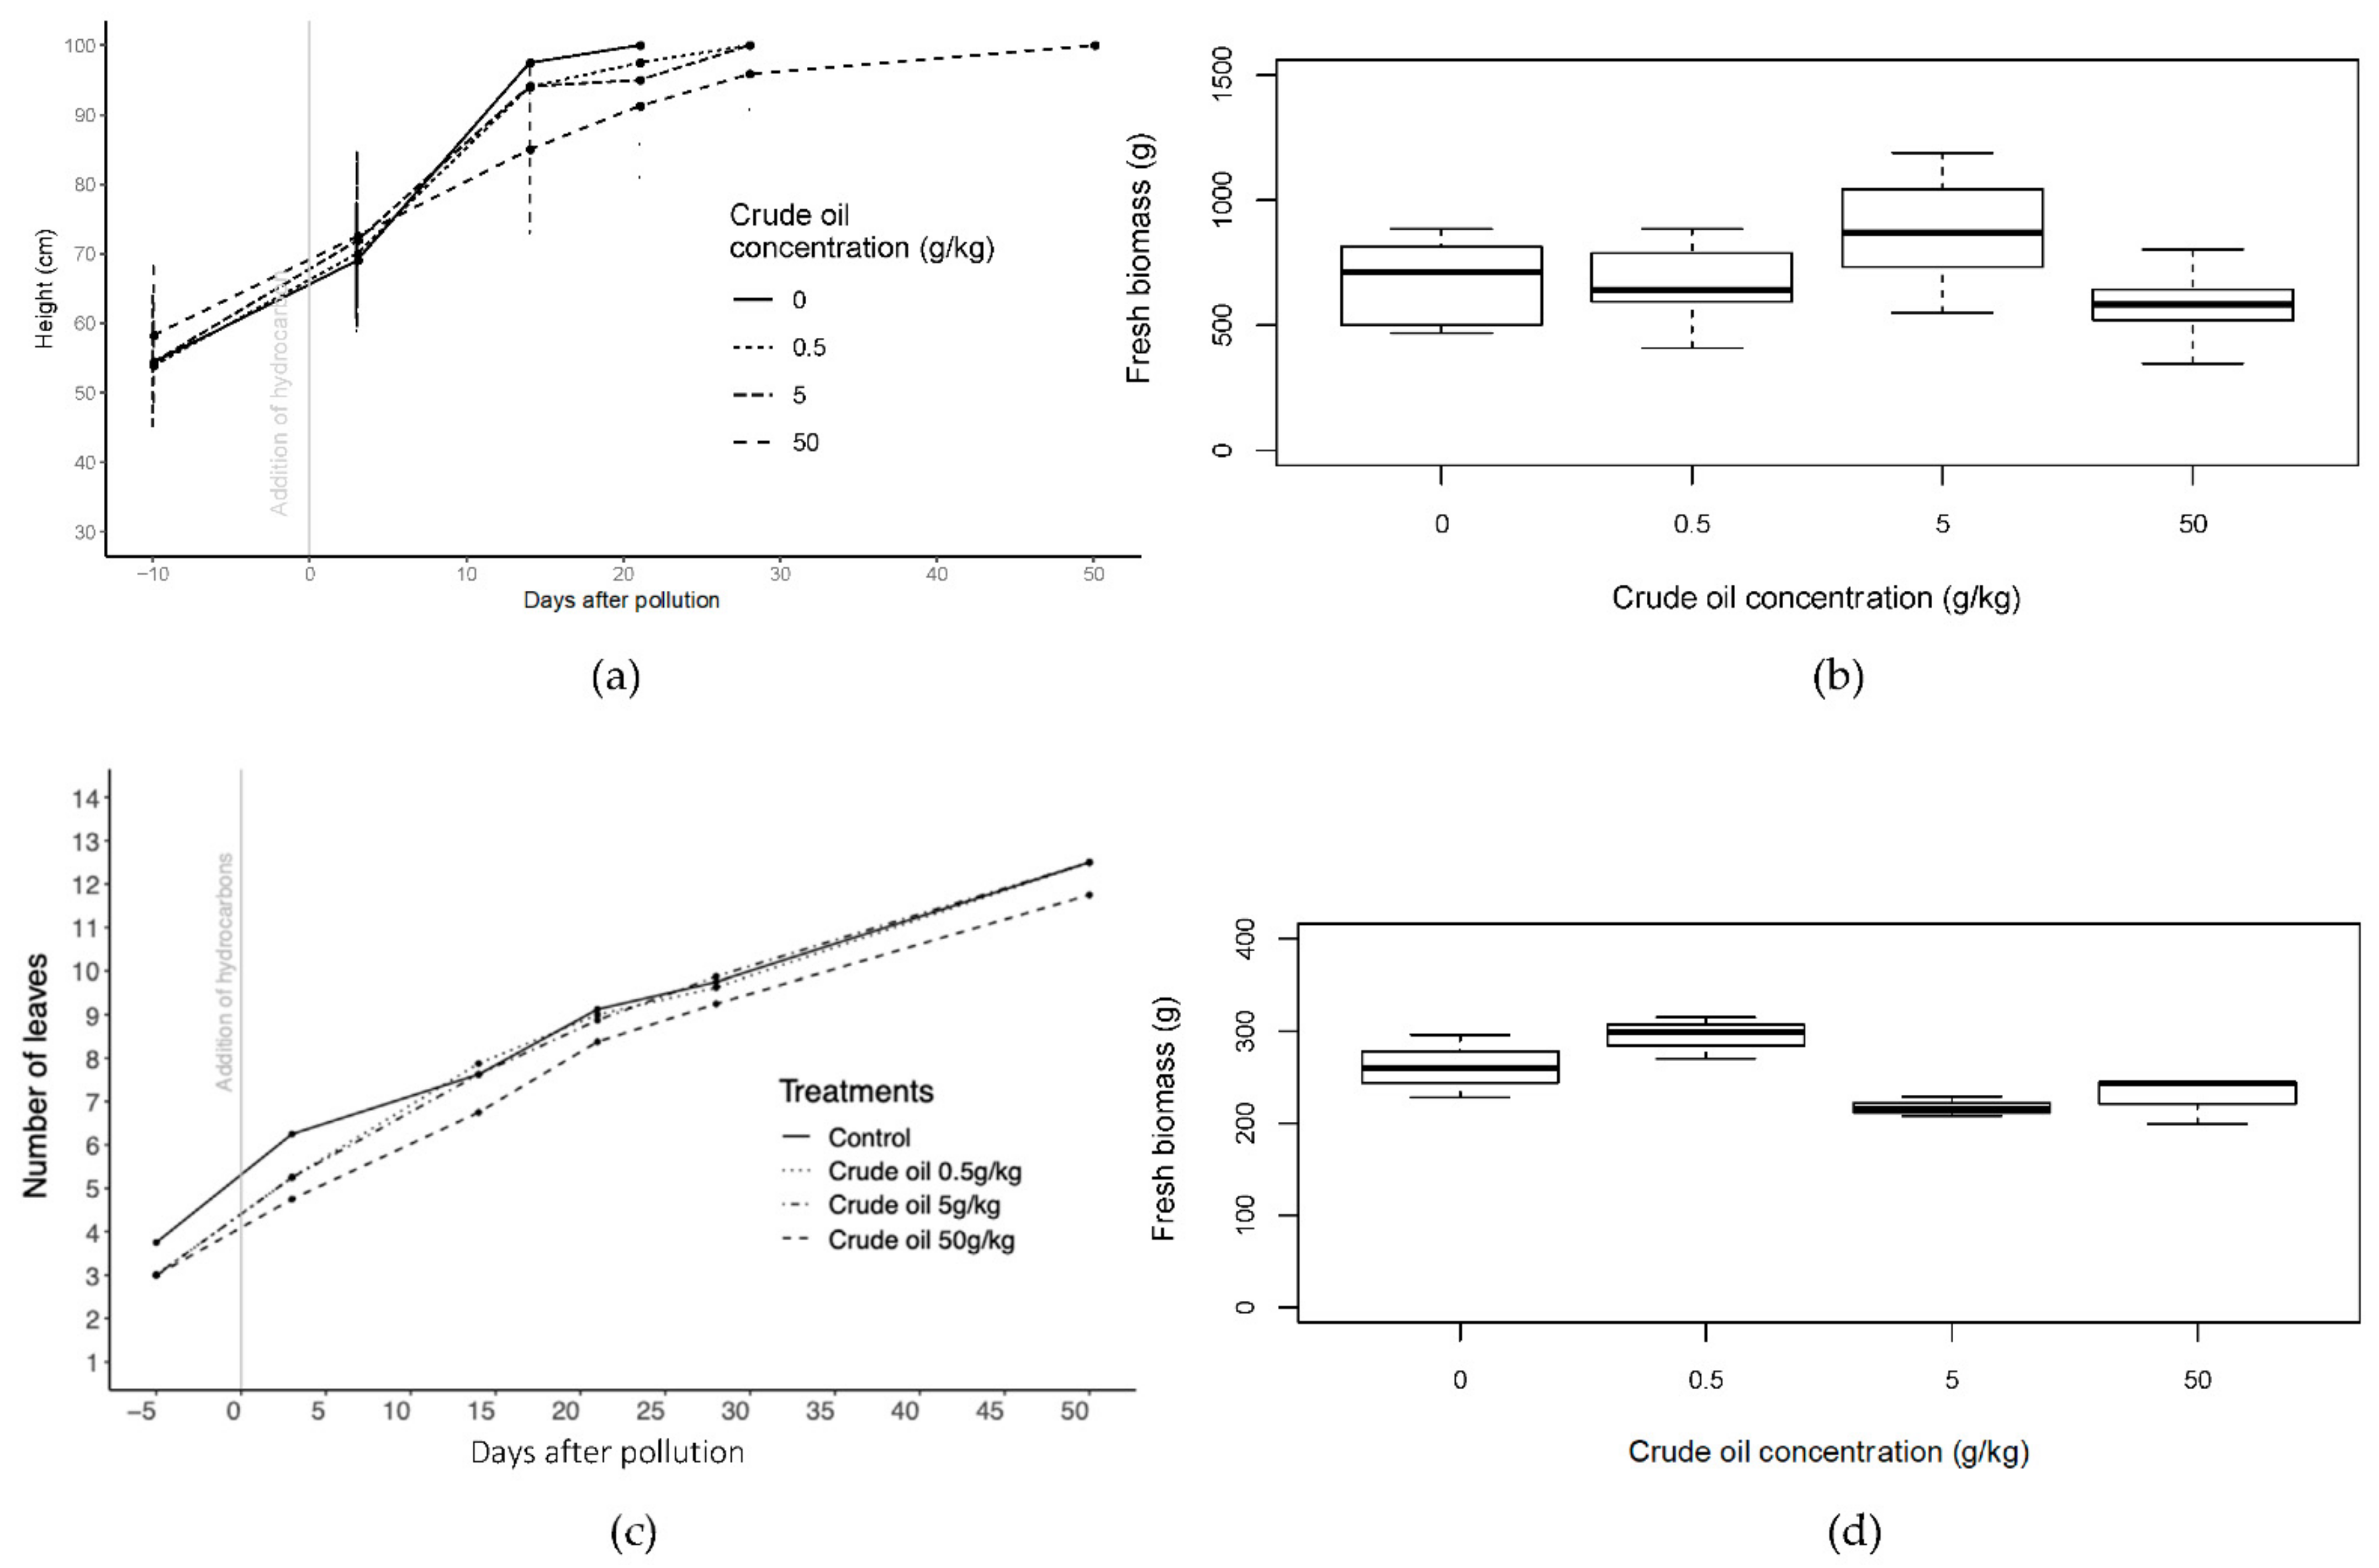
In willow, whilst there was no significant difference in height between treatments at the start of the experiment, 14 days after introducing the polluted layer C50 (50 g·kg−1 of crude oil in soil) plants were significantly shorter than control plants (p < 0.05; one-way ANOVA (analysis of variance); N = 8). The C50 plants reached 100 cm approximately three weeks later than the other treatments. Once exceeded, willows were pruned to restrict their maximum height to 100 cm.
Leaf number increased with time for all treatments in maize. Plants in C50 and R50 (50 g·kg−1 of refined oil in soil) treatments, typically had between 1 and 1.5 fewer leaves per plant than the other treatments, with more yellowing of leaves from day 20 to 40 of the experiment and an early presence of brown leaves during the first 20 days of the experiment (Figure S1). In the case of less-polluted treatments (C5, C05, R5, and R05), significant differences (p < 0.05; one-way ANOVA; N = 56; F = 13.47; day 14) in number of leaves with respect to the control were only found during the first 14 days of the experiment and with C50 and R50 during the whole experiment. Yellowing of leaves presented a peak around day 21 in both types of hydrocarbons.
The greater oil concentrations tended to have smaller leaf areas, with the smallest area for the R50 treatment (only 75% of the control leaf area). ANOVA indicated significant differences in leaf area between C5 (5 g·kg−1 of crude oil in soil) treatment and C05 (0.5 g·kg−1 of crude oil in soil) and control, and in the case of refined oil treatments between R50 and all the other treatments (p < 0.05; one-way ANOVA; N = 21). Significant difference was also found in leaf length and leaf width in refined oil treatment (p < 0.05; one-way ANOVA; N = 21), with R50 treatment with shorter significant leaf length than the other treatments.
In crude oil treatments of willows, fresh biomass was about 30% greater in C5 than the control treatment and significant differences were found between C5 and C50 (p < 0.05, one-way ANOVA, N = 16) (Figure 3). In refined oil treatments, R05 had the greatest fresh biomass values and was significantly different (p < 0.05, one-way ANOVA, N = 16) from all the other treatments including the control (Figure S1). In the case of maize plants, only crude oil treatments had significant differences among treatments in fresh biomass and dry biomass (p < 0.05; one-way ANOVA; N = 54) and generally there was decreased biomass in the more polluted treatments, though the C5 treatment had the smallest biomass.
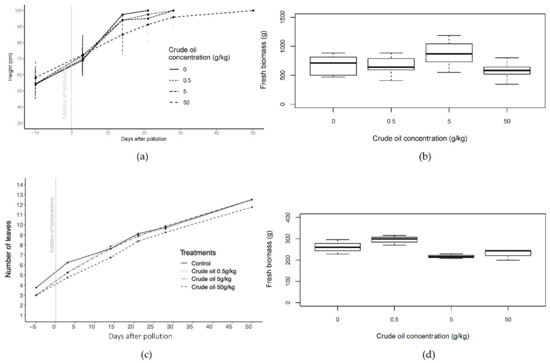
Figure 3.
Height of all the crude oil treatments of willow trees before and until 50 days of the addition of the polluted layer. (b) Fresh biomass of crude oil treatments of willow trees at the end of the experiment after 50 days of pollution. (c) Number of leaves in crude oil treatments of maize plants before and until 50 days of the addition of the polluted layer. (d) Fresh biomass of crude oil treatments of maize plants at the end of the experiment after 50 days of pollution. Bars in (a,c) represent the standard error.
3.1.2. Chlorophyll Content
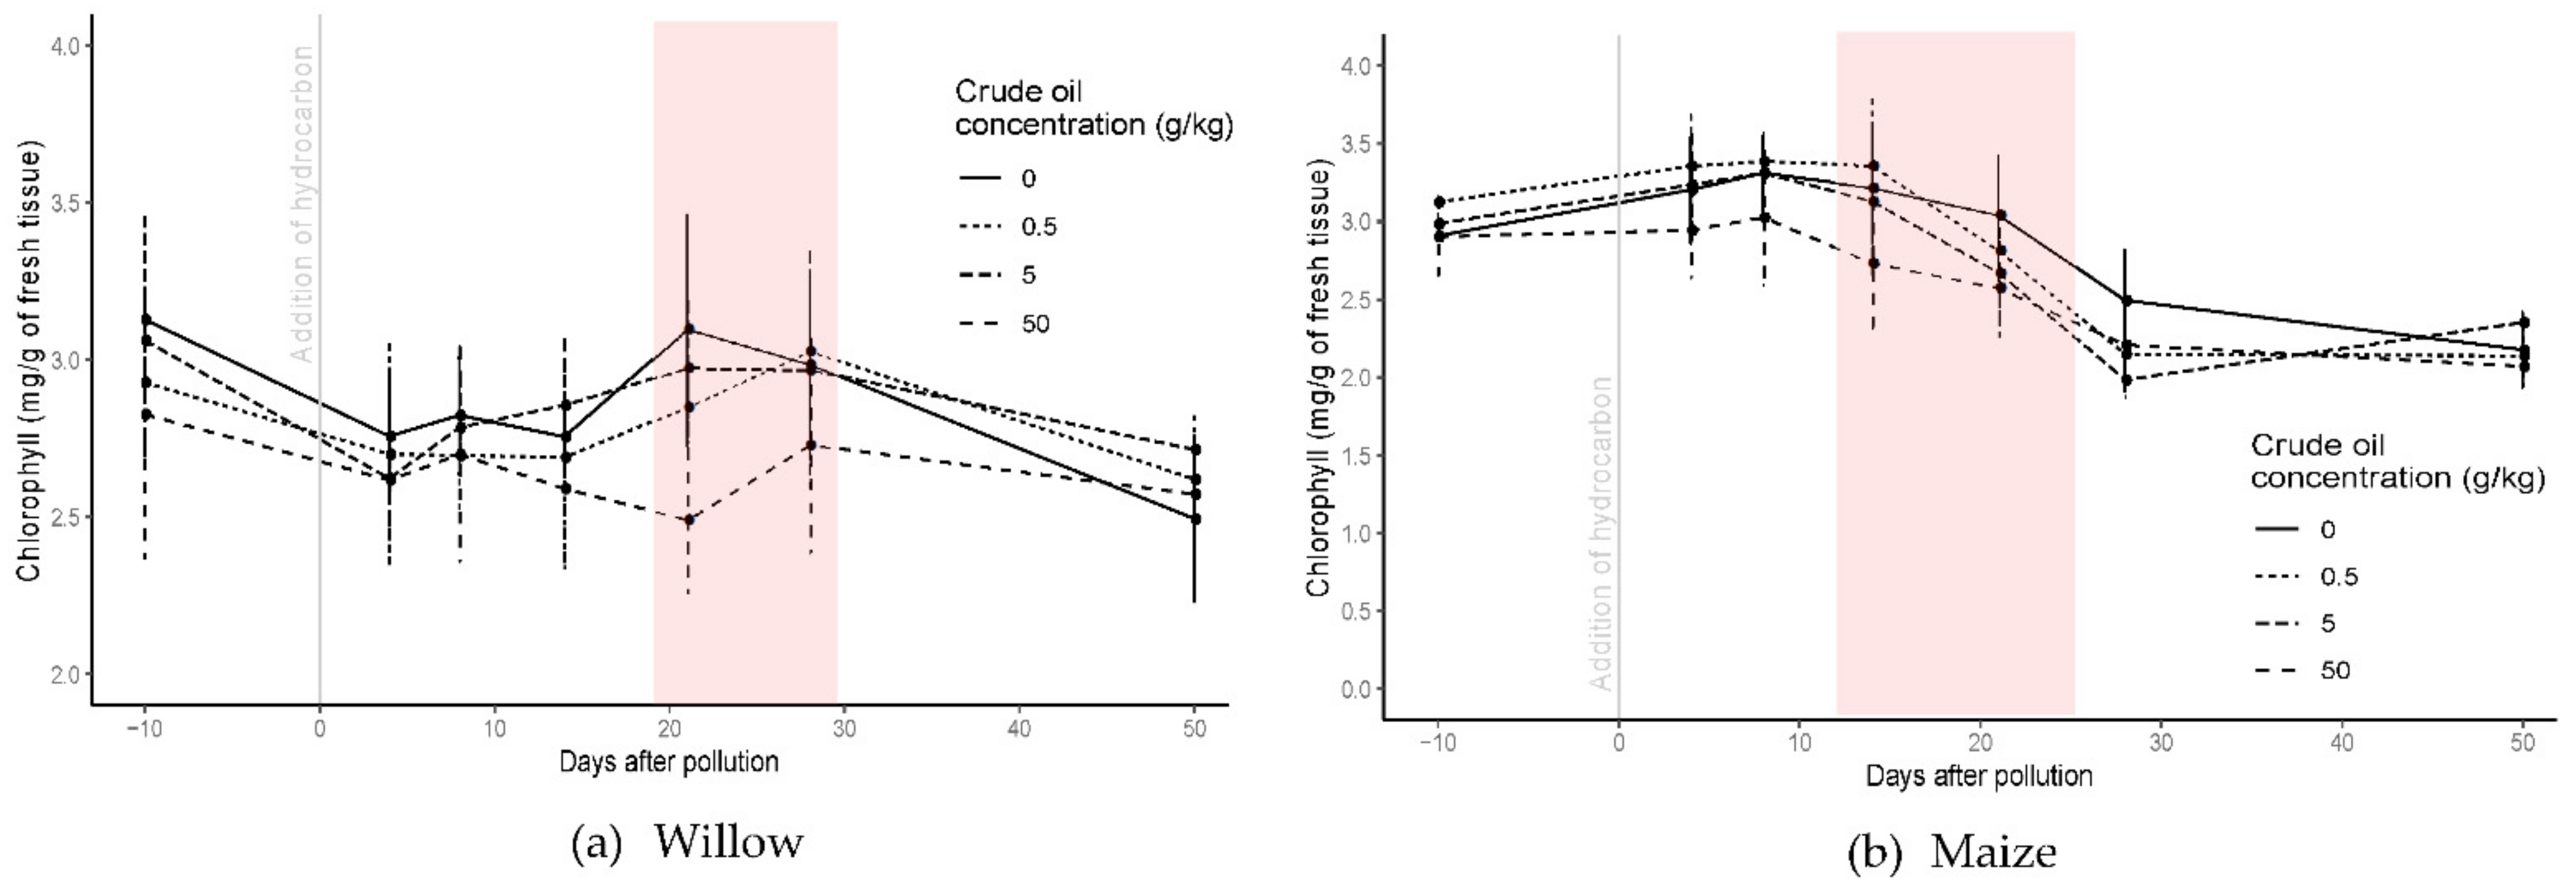
After the addition of the polluted layer, chlorophyll content from crude oil polluted treatments in willow trees did not differ significantly from the control treatment until day 14, and until day 8 for the refined oil treatments. After 8 days of pollution and until the end of the experiment, the chlorophyll response in both hydrocarbon types was similar, with significant differences between 14 and 28 days of pollution for crude oil treatment (Figure 4) and 8 and 21 days for refined oil treatment (Figure S2). For C50 and R50 treatments, chlorophyll content decreased to 2.5 ± 0.14 mg·g−1 after 21 days of pollution, but later it increased to the same content as the control treatment. For the C05 and R05 polluted treatments, mean chlorophyll content increased above that of the control treatment from day 28 and 21, respectively, until the end of the experiment (p < 0.05; one-way ANOVA; N = 40).
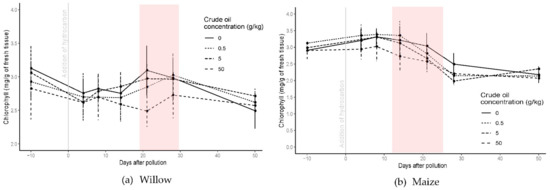
Figure 4.
Chlorophyll content in willow (a) and maize (b) for all the crude oil treatments before and until 50 days the addition of the polluted layer. The red square highlights the period of significant differences between treatments. Bars represent the standard error.
For maize plants, chlorophyll content was affected similarly in both crude and refined oil treatments, although the effect was greater for the refined oil (Figure S2). Chlorophyll content decreased rapidly and significantly for C50 and R50 treatments within 4 days of introducing the polluted layer (p < 0.05; one-way ANOVA; N = 54). The lower concentrations (C5, C05, R5, and R05) had a smaller effect on the chlorophyll content, and by the end of the experiment the difference in chlorophyll content had largely disappeared for both crude and refined oil (Figure 4 and Figure S2).
3.1.3. Roots
Different patterns of root distribution were observed depending on the concentration of the hydrocarbon. In the case of willow trees, both crude and refined oil treatments had a total amount of roots that looked similar to the control treatment, but the distribution of the visible roots was different (Figure S3). Interestingly, in the C5, C05, R5, and R05 treatments, the roots were mainly located in the polluted layer and in the middle of the pot, but in C50 and R50 treatments fewer roots were present in the polluted layer. Both hydrocarbon types shared a similar pattern of root thickness; C5, C05, R5, and R05 treatments had a predominance of thin roots (roots of 1 mm or less), whilst C50 and R50 treatments had more thicker roots (roots of 2–3 mm).
In maize plants there appeared to be substantially less root present in the pots with a polluted layer as compared with the control treatment (Figure S4). The C50, R50, C5, and R5 had fewer thin roots present than C05, R05, and the control. The polluted layer was well colonised by roots and, in all cases, there were more roots towards the base of the pot than in the upper regions. Roots of the control plants were white, whilst roots in the polluted treatments were a mixture of white and brown roots. It must be remembered that the root distribution of these visible roots may differ from the root distribution within the bulk soil.
3.2. Spectral Signatures
3.2.1. Willows
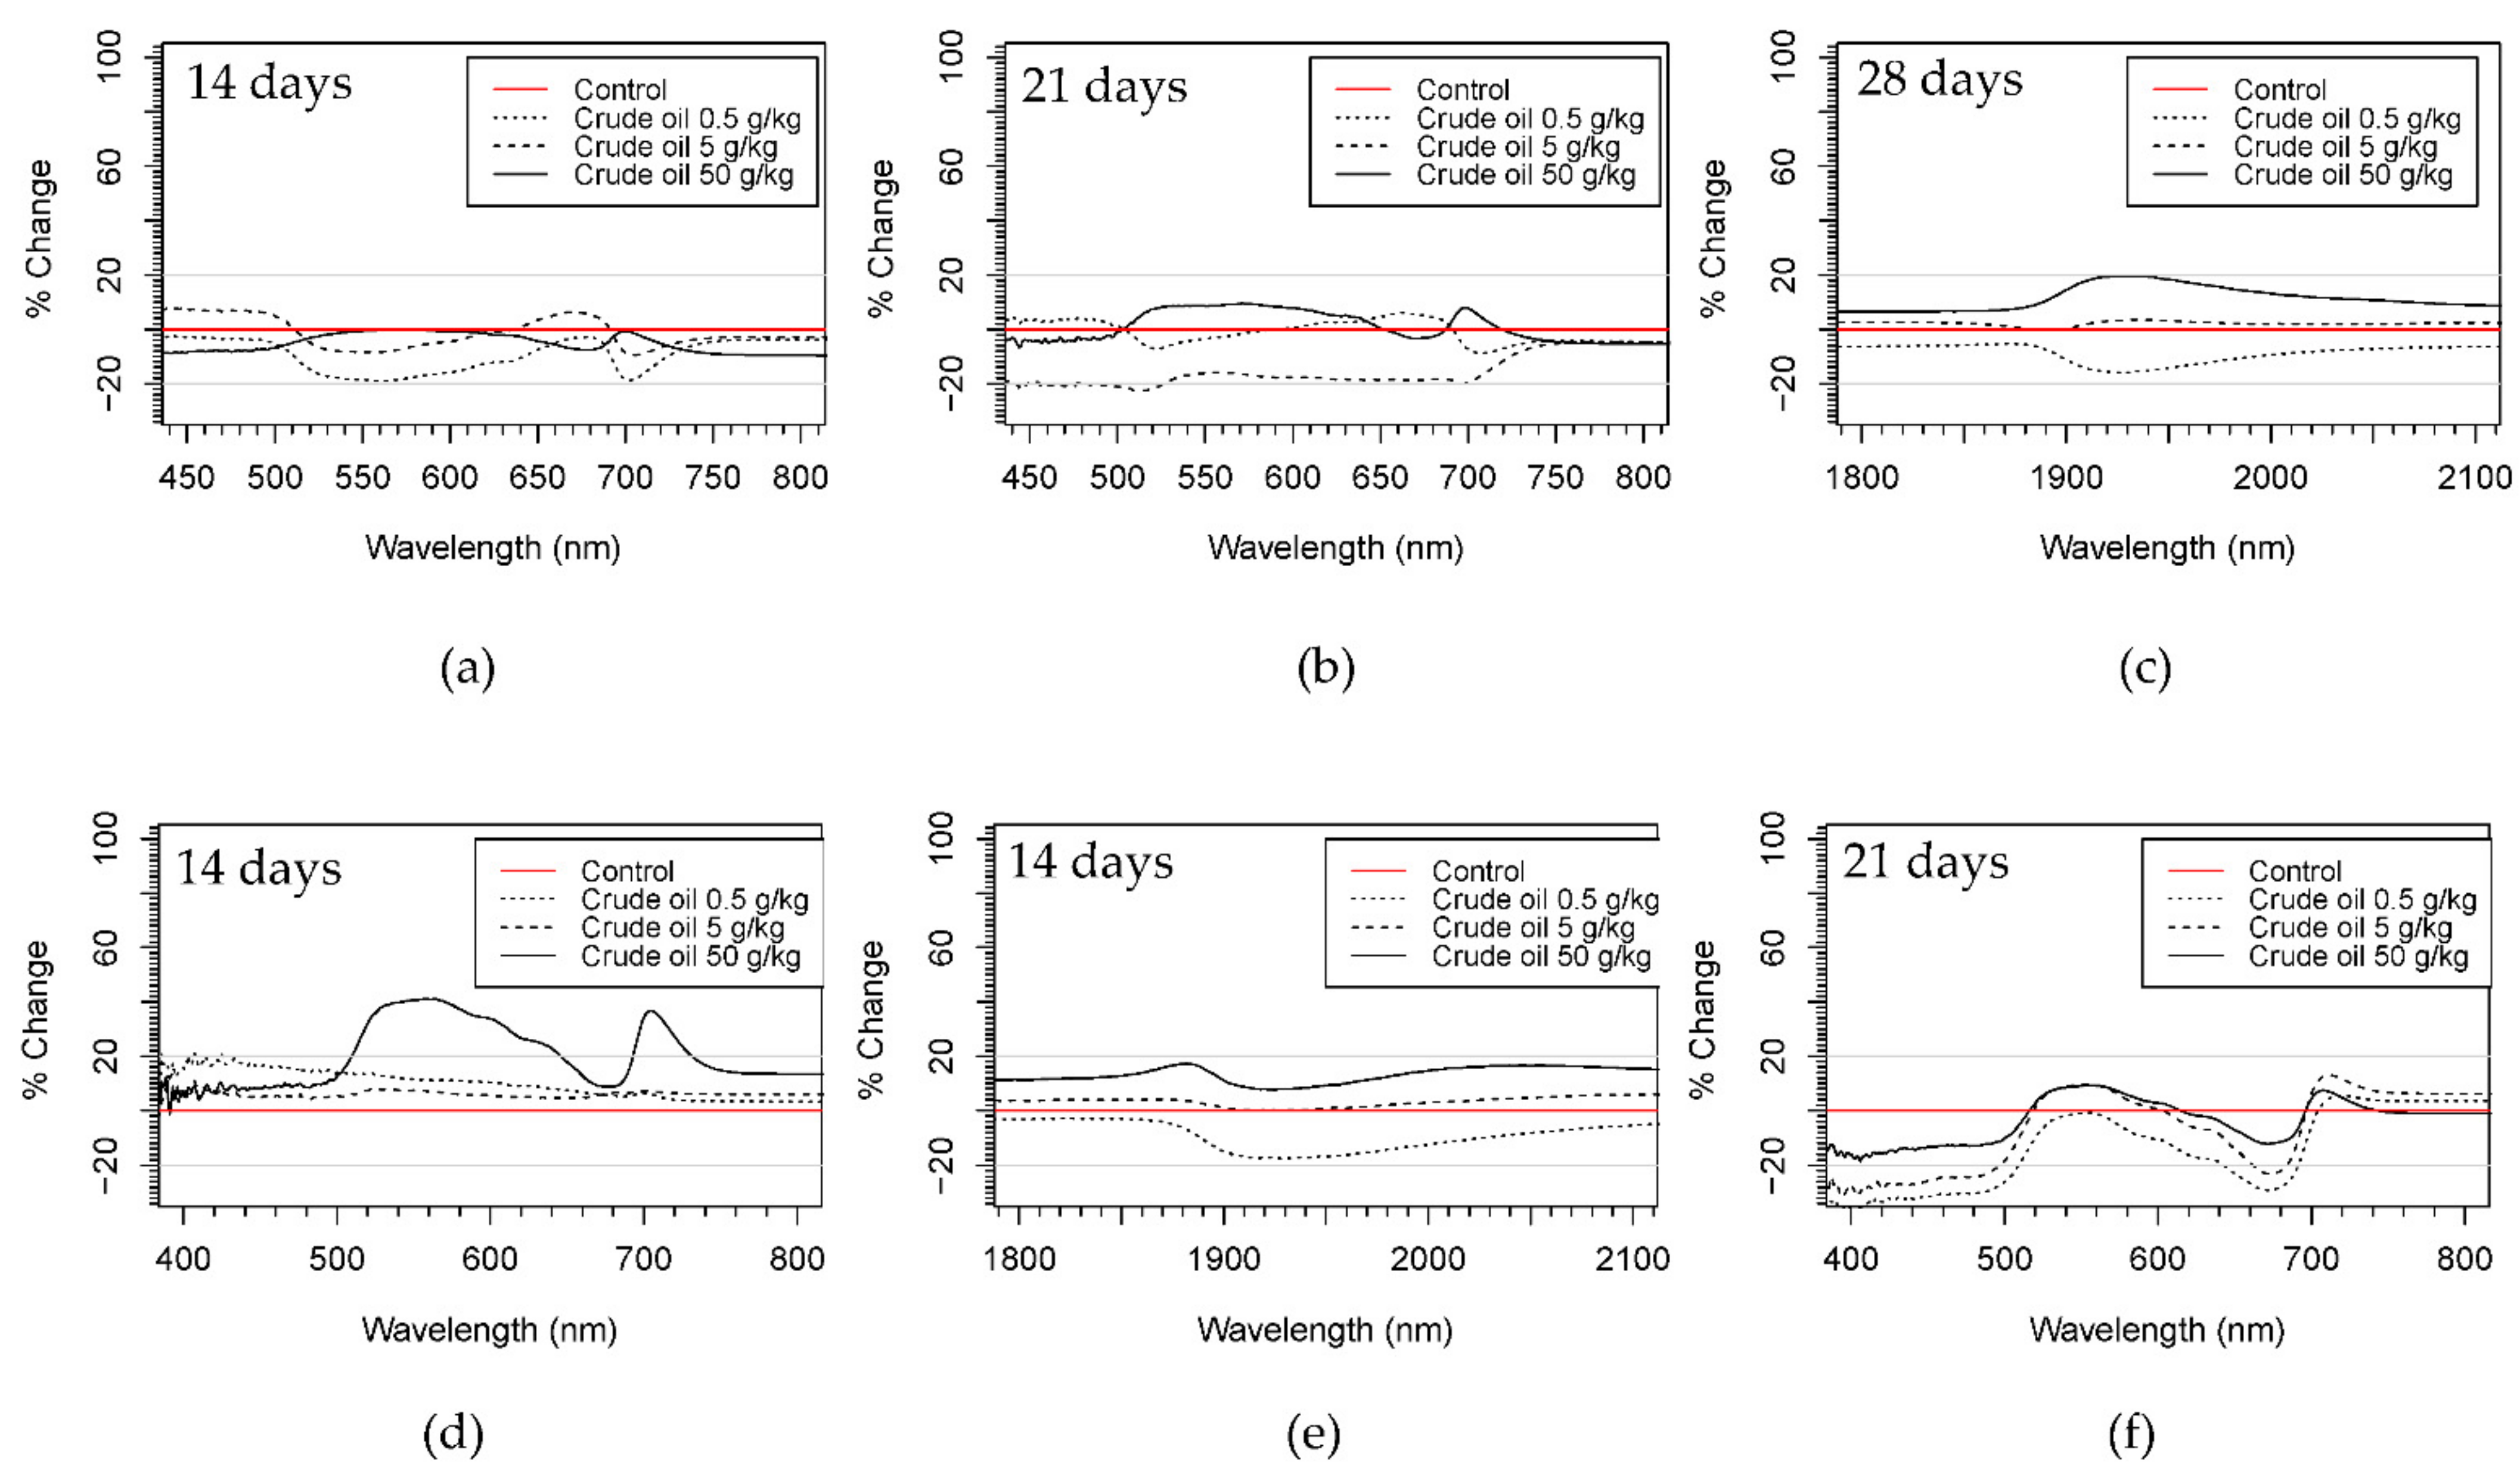
All the treatments presented more than 20% difference (increase or decrease reflectance) with respect to the control treatments in the VIS (visible) and SWIR (shortwave infrared) regions of the spectrum, but with little change in the NIR (near-infrared) region. High polluted treatments (C50 and R50) of both hydrocarbon types showed a general increase in reflectance from 400 to 2500 nm during the whole experiment. Only in R50 treatment after 50 days of pollution was a decrease of more than 20% in the region of 500–700 nm observed. C5 and R5 treatments presented different patterns at different time stages of the experiment (Figure 5 and Figure S5).
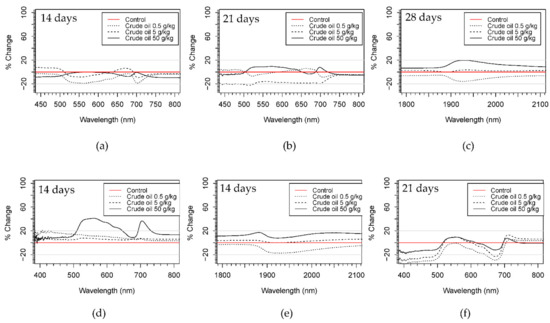
Figure 5.
Ratios of reflectance change of crude oil treatments respect to control treatments in willow (a–c) and maize plants (d–f) in different parts of the spectra and on different days of the experiment. Red line representing the control was calculated using the standard deviation as is indicated in Equation (1).
In crude oil, reflectance values increased during the first 8 days of the experiment then decreased from 14 to 28 days, increasing again at the end of the experiment. On the other hand, refined oil treatments showed only a decrease in reflectance in the VIS and SWIR. C05 and R05 showed changes in the VIS range, showing an increase during the first week of pollution and then a decrease until the end of the experiment. The location of the reflectance changes in the visible range were mainly located at wavelengths 420–500 nm and 680–710 nm for crude oil treatments, and at 1900–2000 nm in the SWIR for both hydrocarbon types. In refined oil treatments, changes in the VIS were centered on 530–680 nm and at wavelengths around 700 nm.
3.2.2. Maize
Comparing the spectral signatures qualitatively, all treatments showed more than 20% difference (increase or decrease reflectance) with respect to the control treatments in both the VIS and SWIR regions of the spectra, but with little variation in the NIR region. Other observed responses were an increase in the number of days presenting differences between polluted and control treatments in the SWIR region in crude oil treatments with respect to refined oil.
Reflectance changes in the VIS were mainly located between 500 and 600 nm and around 700 nm from day 8 to 14 of the experiment for both hydrocarbon types. In the SWIR region, changes in the reflectance spectra were noted around 1400 and 1500 nm and between 1900 and 2000 nm, again for both hydrocarbon types.
C50 and R50 treatment presented a similar pattern for VIS and SWIR areas of the spectrum, with an increase for the first 14 days of the experiment for C50 and during the first week for R50, a decrease of more than 20% with respect to the control after 21 days (Figure 5 and Figure S5). C5, C05, R5, and R05 had the same pattern for VIS, and SWIR was observed with no ratios of change more than 20% greater or less than the control treatment for the first 8 days of pollution and then a decrease in reflectance from 8 to 21 days with respect to the control treatment.
3.3. Absorption Feature Identification
3.3.1. Willows
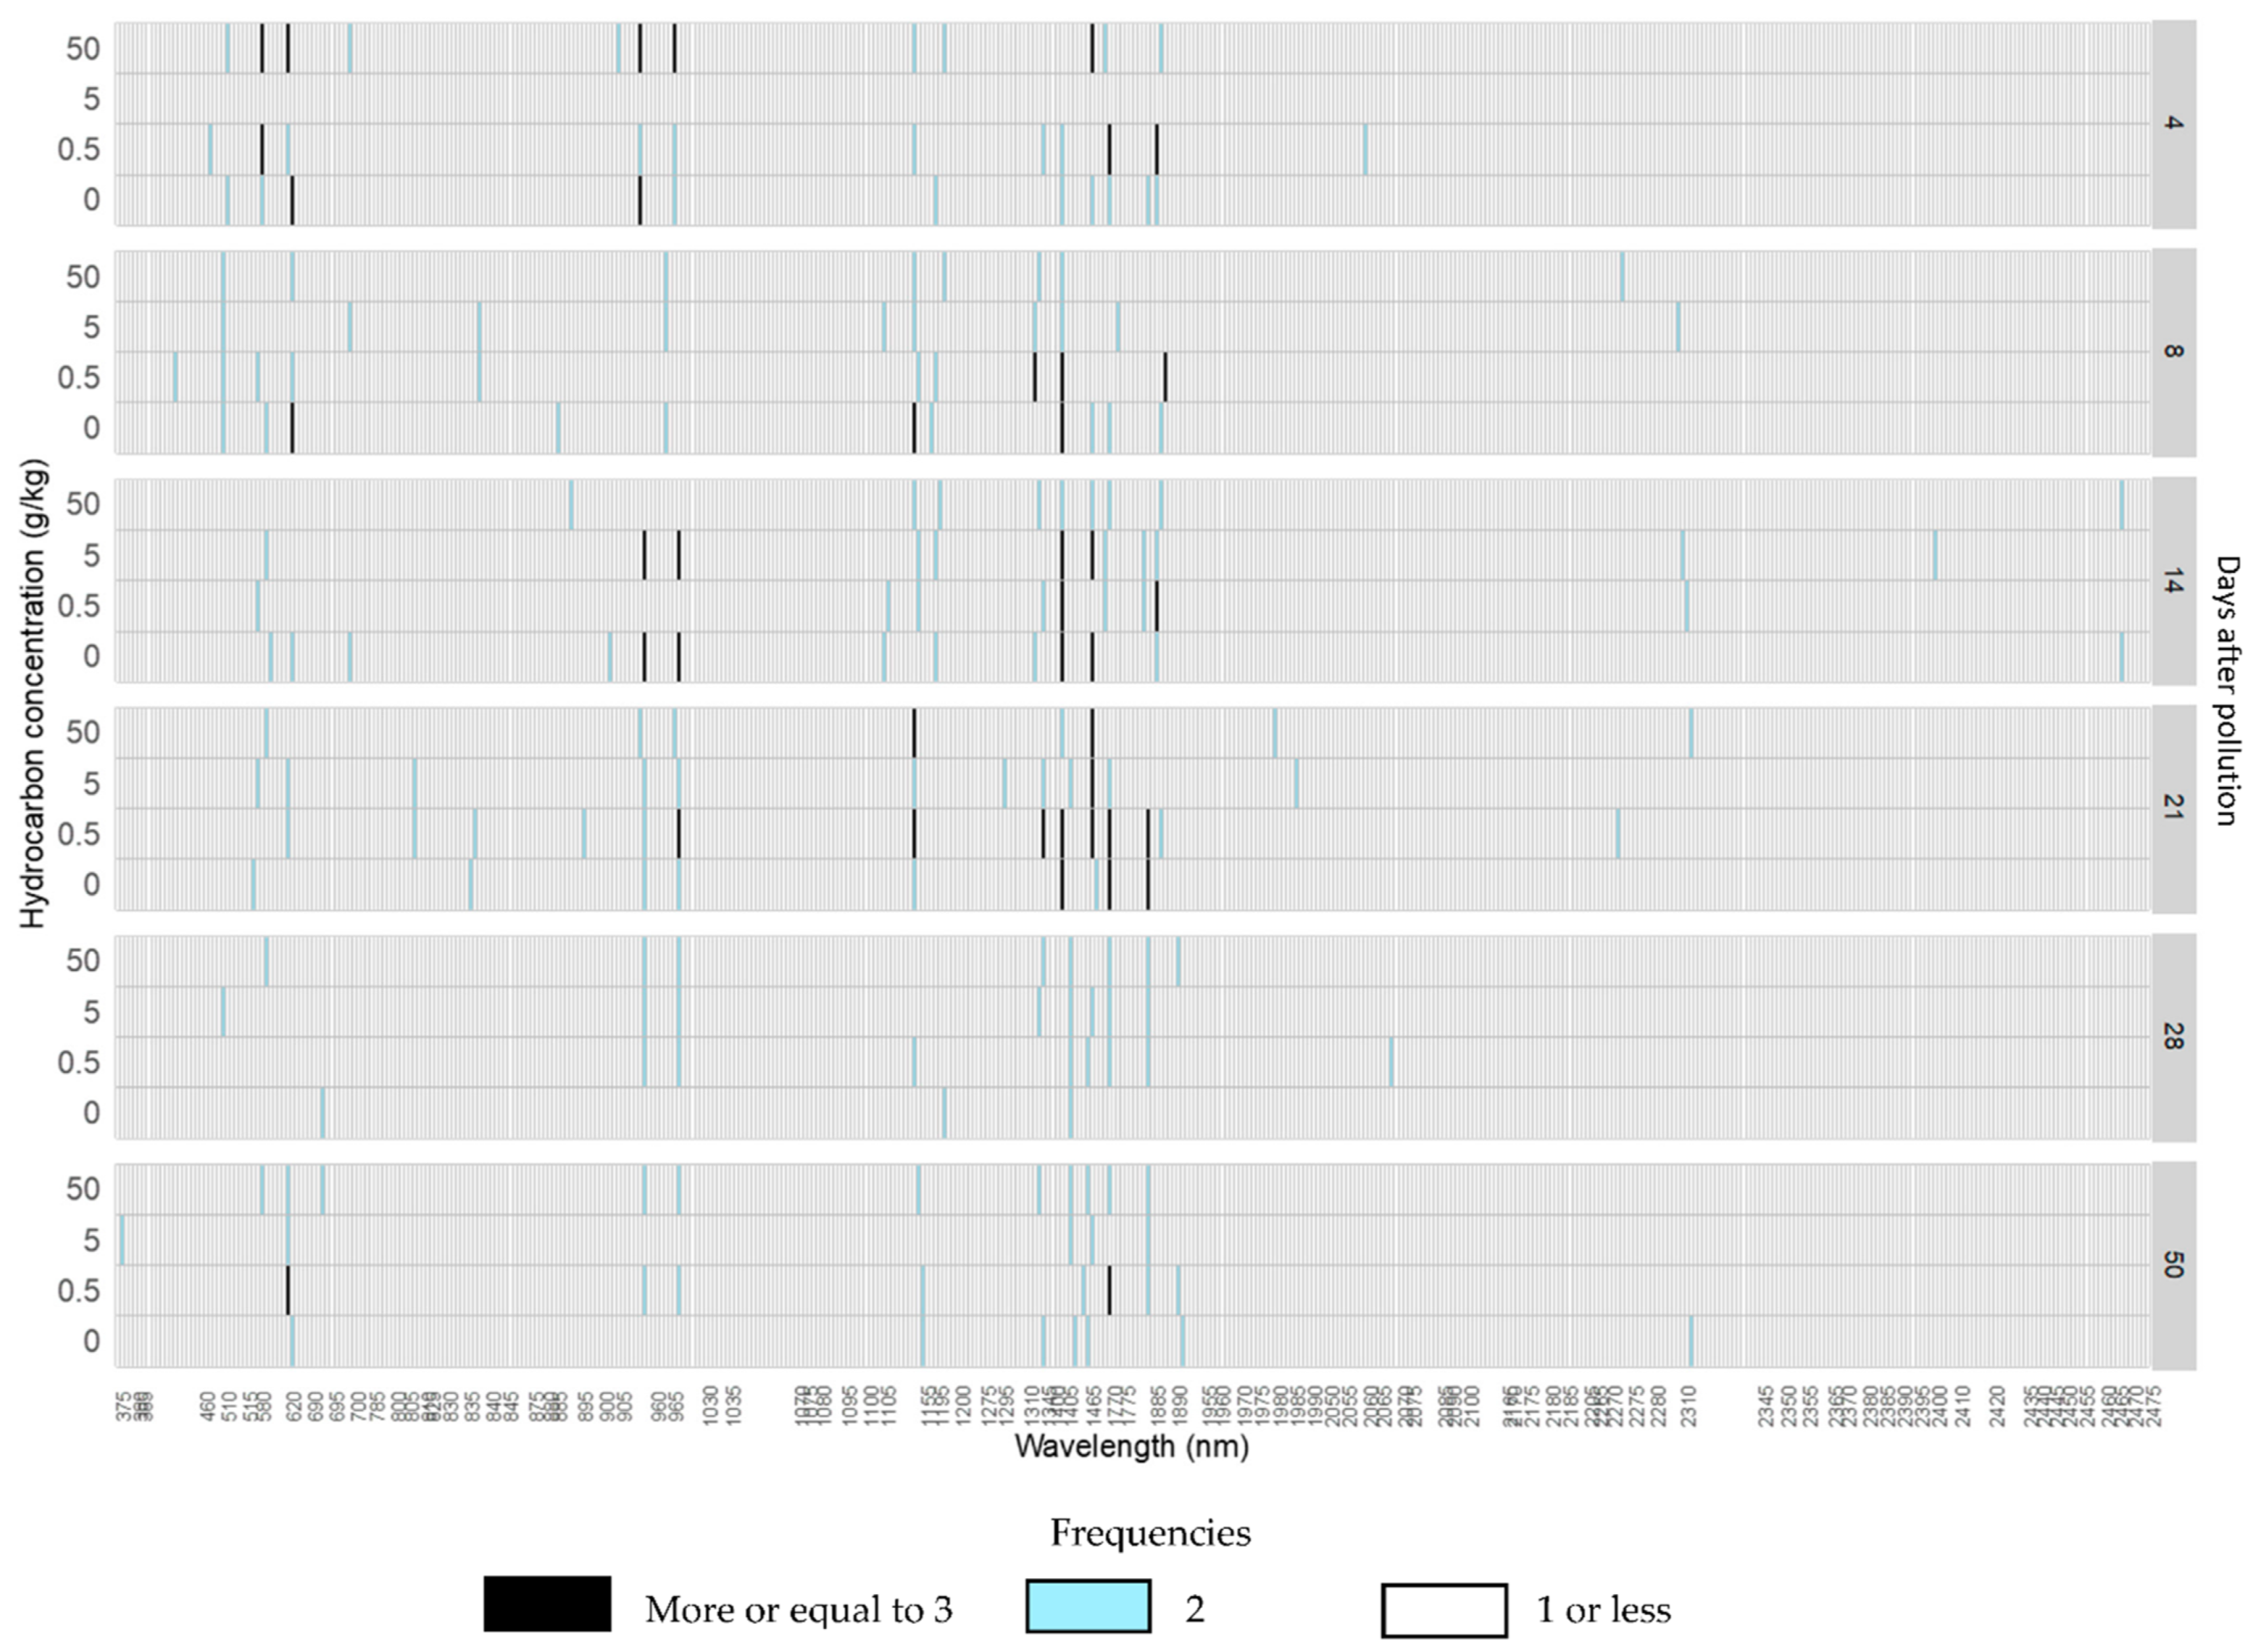
In crude oil reflectance spectra, most absorption features appeared after 14 days of pollution, and the others after 21 days of pollution. Most absorption features were also seen in the control treatments at some point during the experiment, with the exceptions of features at 581, 990, 1346, 1726, 1802, and 2271 nm, which did not show in any control treatment (Figure 6). Absorption features which only appeared in a specific treatment were all found in C05 with the exception of the absorption 836 nm, which only appeared in C5 (Table 2 and Table S2).
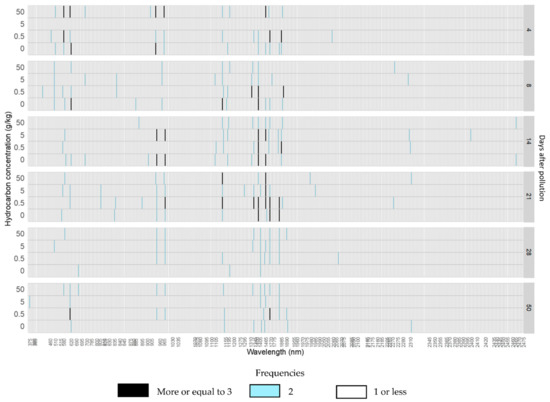
Figure 6.
Histogram of the frequencies of absorption features detected in each wavelength position for each hydrocarbon concentration from 4 to 50 days after the addition of the crude oil polluted layer in willow trees.

Table 2.
Major absorption features appearing in the control and polluted treatments for both willow and maize plants.
In refined oil treatments, the absorption features appeared in almost all the same wavebands as crude oil with the exception of 904 nm in the NIR and four in the SWIR (Figure S7). A greater number of absorption features appeared in refined oil treatments from the beginning of the experiment, with the exception of features at 957, 1155, and 2176 nm, which returned higher counts in R50 treatment (Table 2).
3.3.2. Maize
On average, the majority of absorption features appeared after 4 days of pollution at 512, 581, 620, 836, 957, 990, 1155, 1195, 1466, and 1887 nm; and after 14 days of pollution at 1345, 1407, 1768, and 1802 nm (Figures S6 and S8, Table S2). Other absorption features, e.g., at 1802 and 1769 nm, appeared after 21 days of pollution (Table 2).
In the refined oil treatment, there were more absorption features that only appeared in polluted treatments than for crude oil treatments. From absorption features only appearing in polluted treatments, two of them, 836 and 880 nm, were shared by both hydrocarbons. Absorption features at 1886 and 2059 nm were only found in crude oil treatments.
3.4. Absorption Features Characterization
Major changes in band depth, band area, and band width indices occurred from day 8 to day 21 after pollution in both hydrocarbon types and both plants species.
3.4.1. Band Area, Depth and Width in Willows
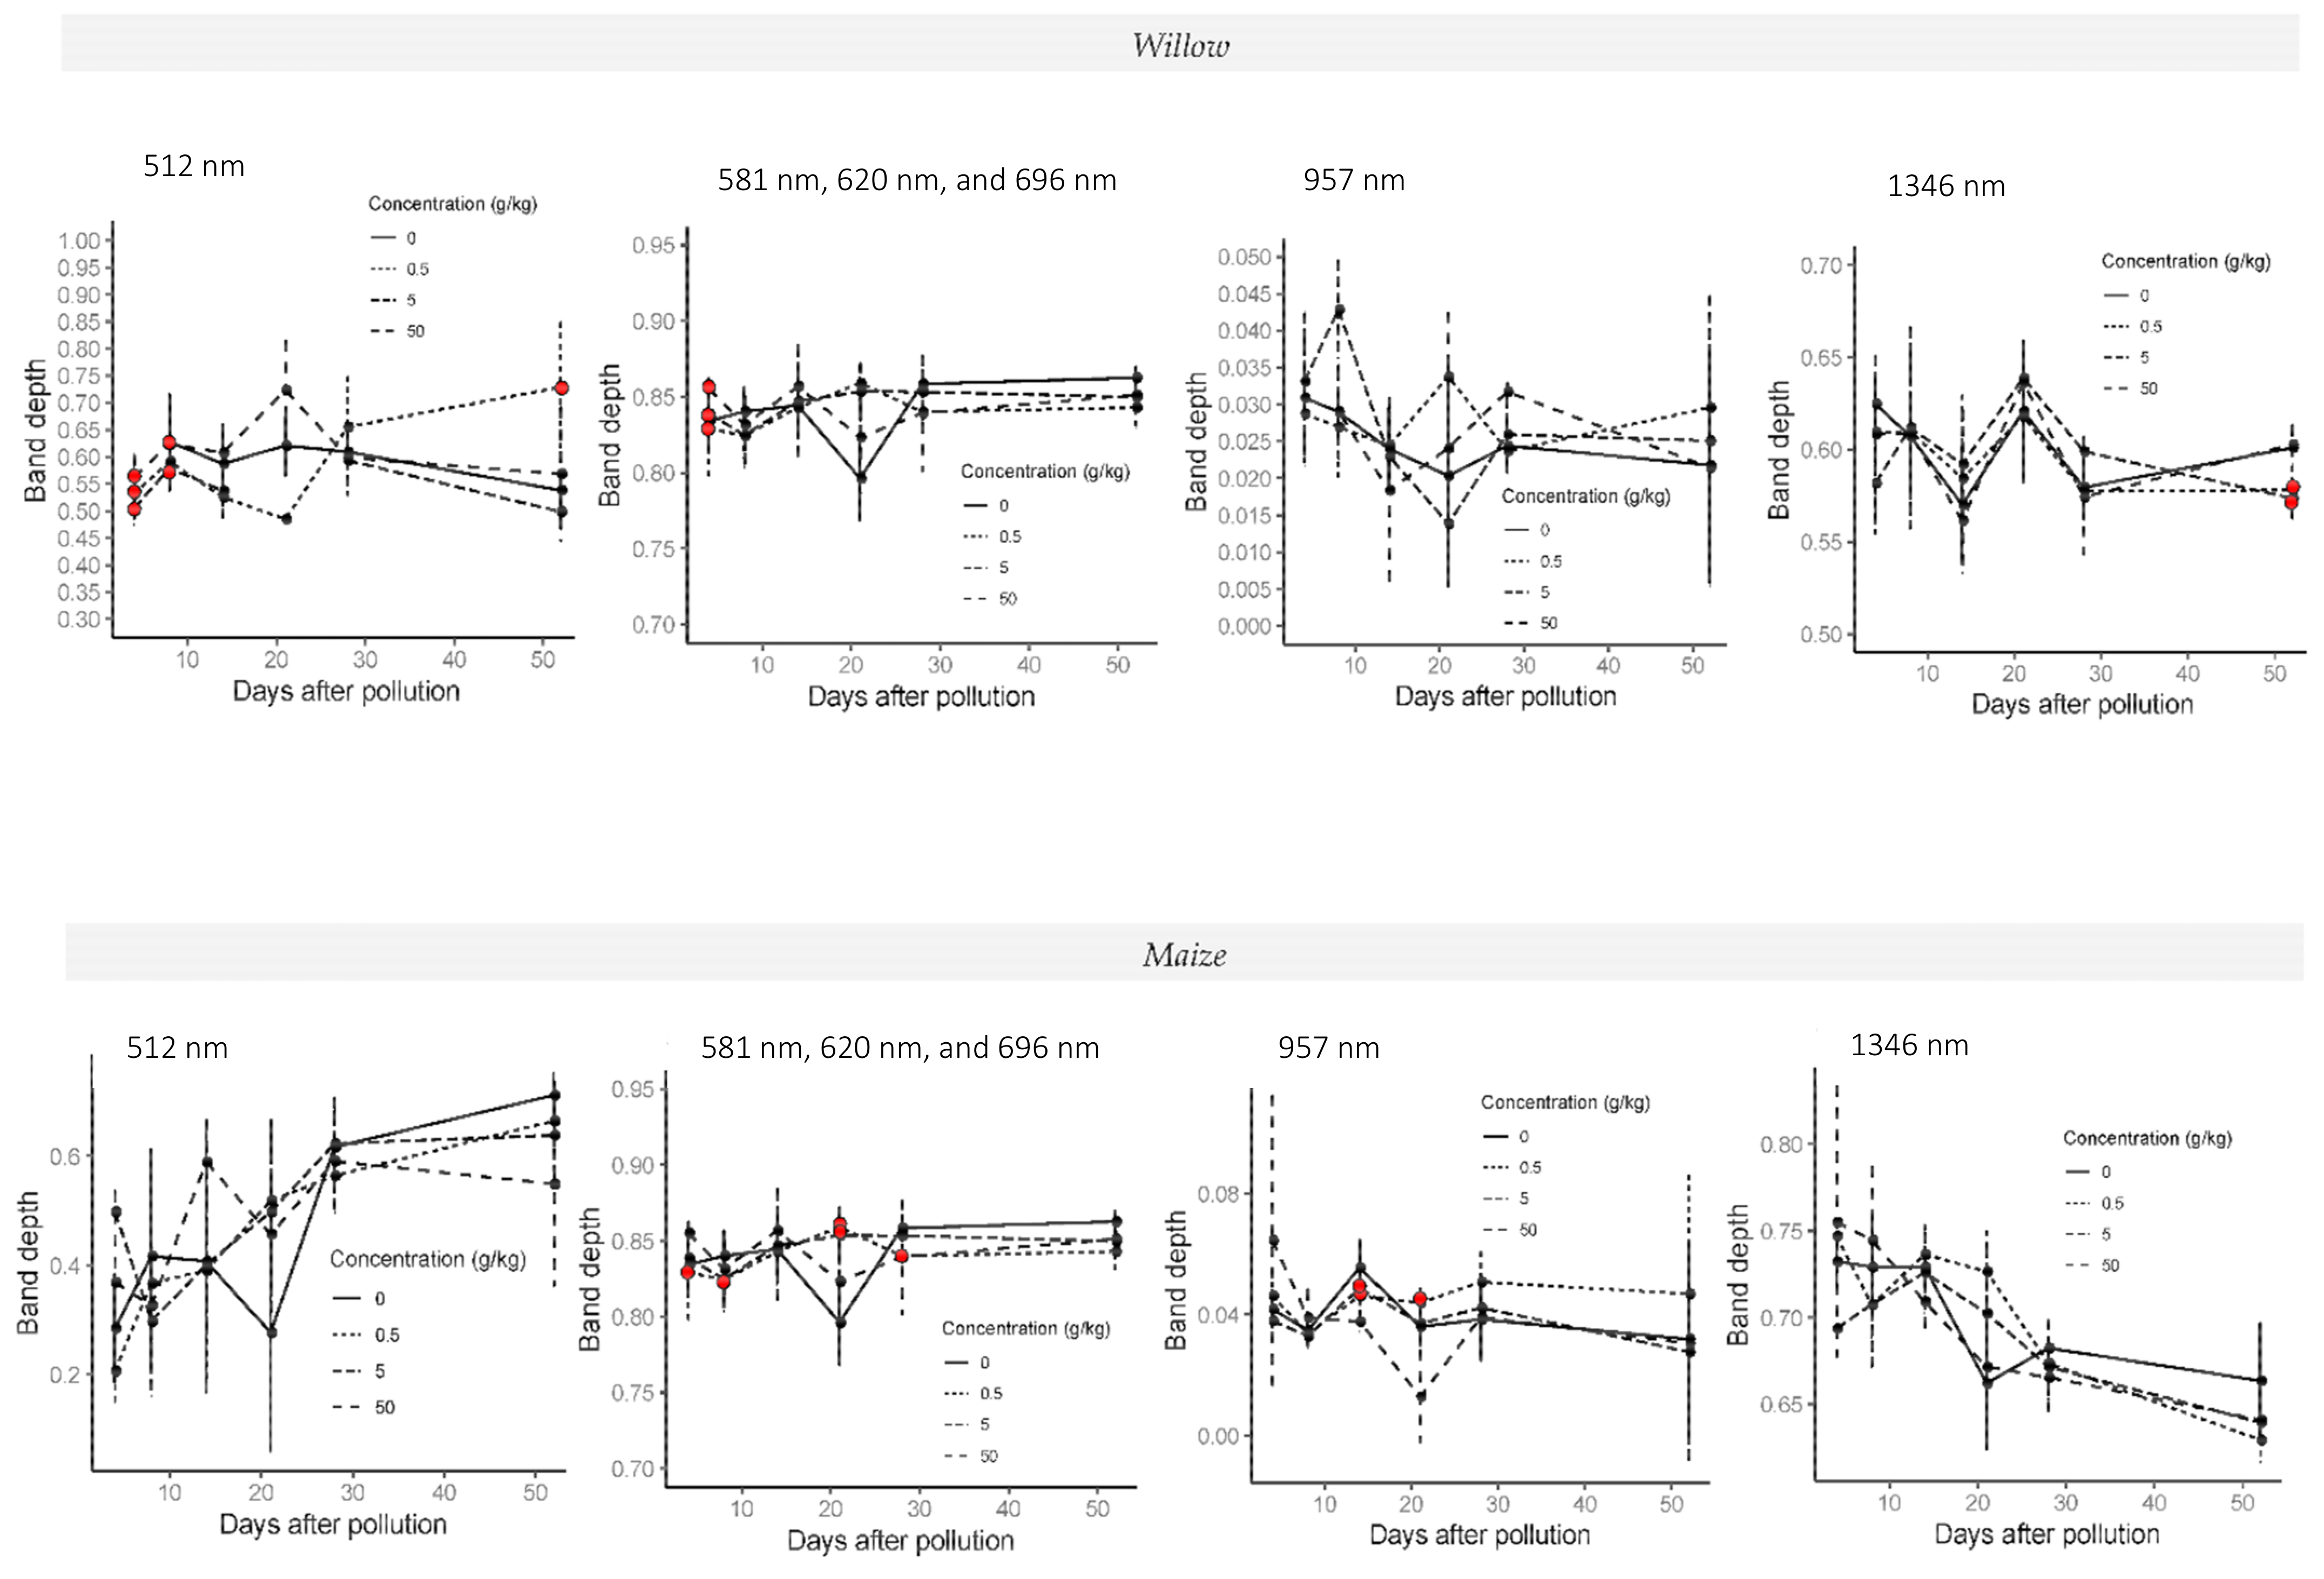
On average it was observed that from day 4 until day 14, control treatments had larger band areas than polluted treatments and higher band depths towards the end of the experiment. From day 14 to 21, an increment of 25–30% in the three indices in C5 treatment was observed with respect to the control in wavebands 620, 836, 957, and 1155 nm. On the other hand, significant reductions (p-value < 0.05; one-way ANOVA; N = 32) of 30% in band area and band depth for the C05 were noted at 512 nm, and at 904 nm for all crude treatments for the same period of time (Figure 7).
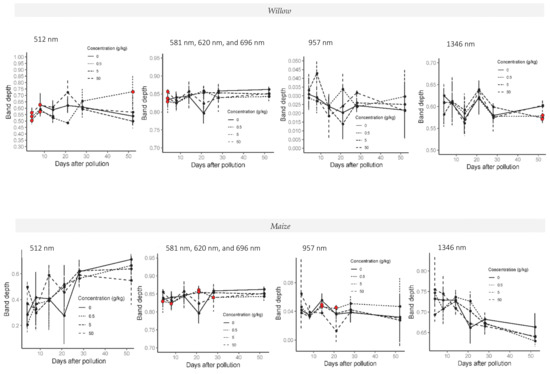
Figure 7.
Band depth time series in 512, 620, 957, and 1346 nm absorption features in willow (top line charts) and maize plants (bottom line charts) during the whole experiment in crude oil treatments. Red dots indicate the treatments with significant differences relative to the control treatment. Last spectral measurement of willow was 52 days after the addition of the pollution and last day in the maize experiment was 50 days after the addition of the pollution.
Absorption features in NIR bands (836 and 904 nm) revealed a constant increase in band area after 21 days for the control plants and a reduction in crude oil treatments until the end of the experiment. In comparison, the control treatment in the SWIR had the largest band area and band width index in all the absorptions features analysed and showed significant differences with polluted treatments (p-value < 0.05; one-way ANOVA; N = 32) from day 8 to 28 of the experiment.
In refined oil treatments, from day 4 to 14 absorption features at 620 nm increased for R05 and R5 treatments, and a decrease in band area for R05 at 1155, 1894, and 1346 nm. The same increase in band area and band depth was noted from 14 and 21 days after the addition of the pollution for C5 treatment in refined oil for 620 and 836 nm, with increases with respect to the control of 27% and 13%, respectively. For absorption features at 957 and 990 nm, there was an increase of 75% and 34% in band area, respectively, for R05 treatment. From day 21 to the end of the experiment, R50 exhibited higher band area and deeper band depth in almost all the absorption features detected and with significant differences (p-value < 0.05; one-way ANOVA; N = 32) with control treatment at 2271 and 957 nm, whilst R05 and R5 were similar to control treatment (Figure S9).
3.4.2. Band Area, Band Depth and Band Width Index in Maize Plants
Significant differences in band depth and band area between the control treatment and low concentration treatments were observed in crude oil treatments at 620, 1346, 1887, and 2271 nm, whilst for higher polluted treatments were noticed at 957, 1346, 1887, and 2271 nm. Significant differences were mostly observed between the control and C05 on days 21 and 14 after the addition of the pollution. Differences relative to the control treatment are shown in Figure 7. In the case of band width, significant differences were only present in C50 treatment with respect to the control in 1346 and 2271 nm between 14 and 21 days after the addition of the pollution.
From day 8 to 14 of the experiment, the refined oil band area and band width indices generally increased, followed by a decrease at absorption features 512, 620, 957, 1195, 1346, and 1887 nm in R5, R05, and control treatments. On the other hand, band area and band width index decreased in the high polluted treatment on the same days with only significant differences found at 512, 620, 1346, and 2271 nm. Band depth presented significant differences (p < 0.05; one-way ANOVA; N = 32) in the same absorption features after 50 days of pollution.
Considerable increases in band area were observed for R5 and R05 treatments from day 14 to 21 of the experiment. The only exception was for R50, which showed a greater band depth at 512 nm.
3.5. Vegetation Indices
3.5.1. Willow
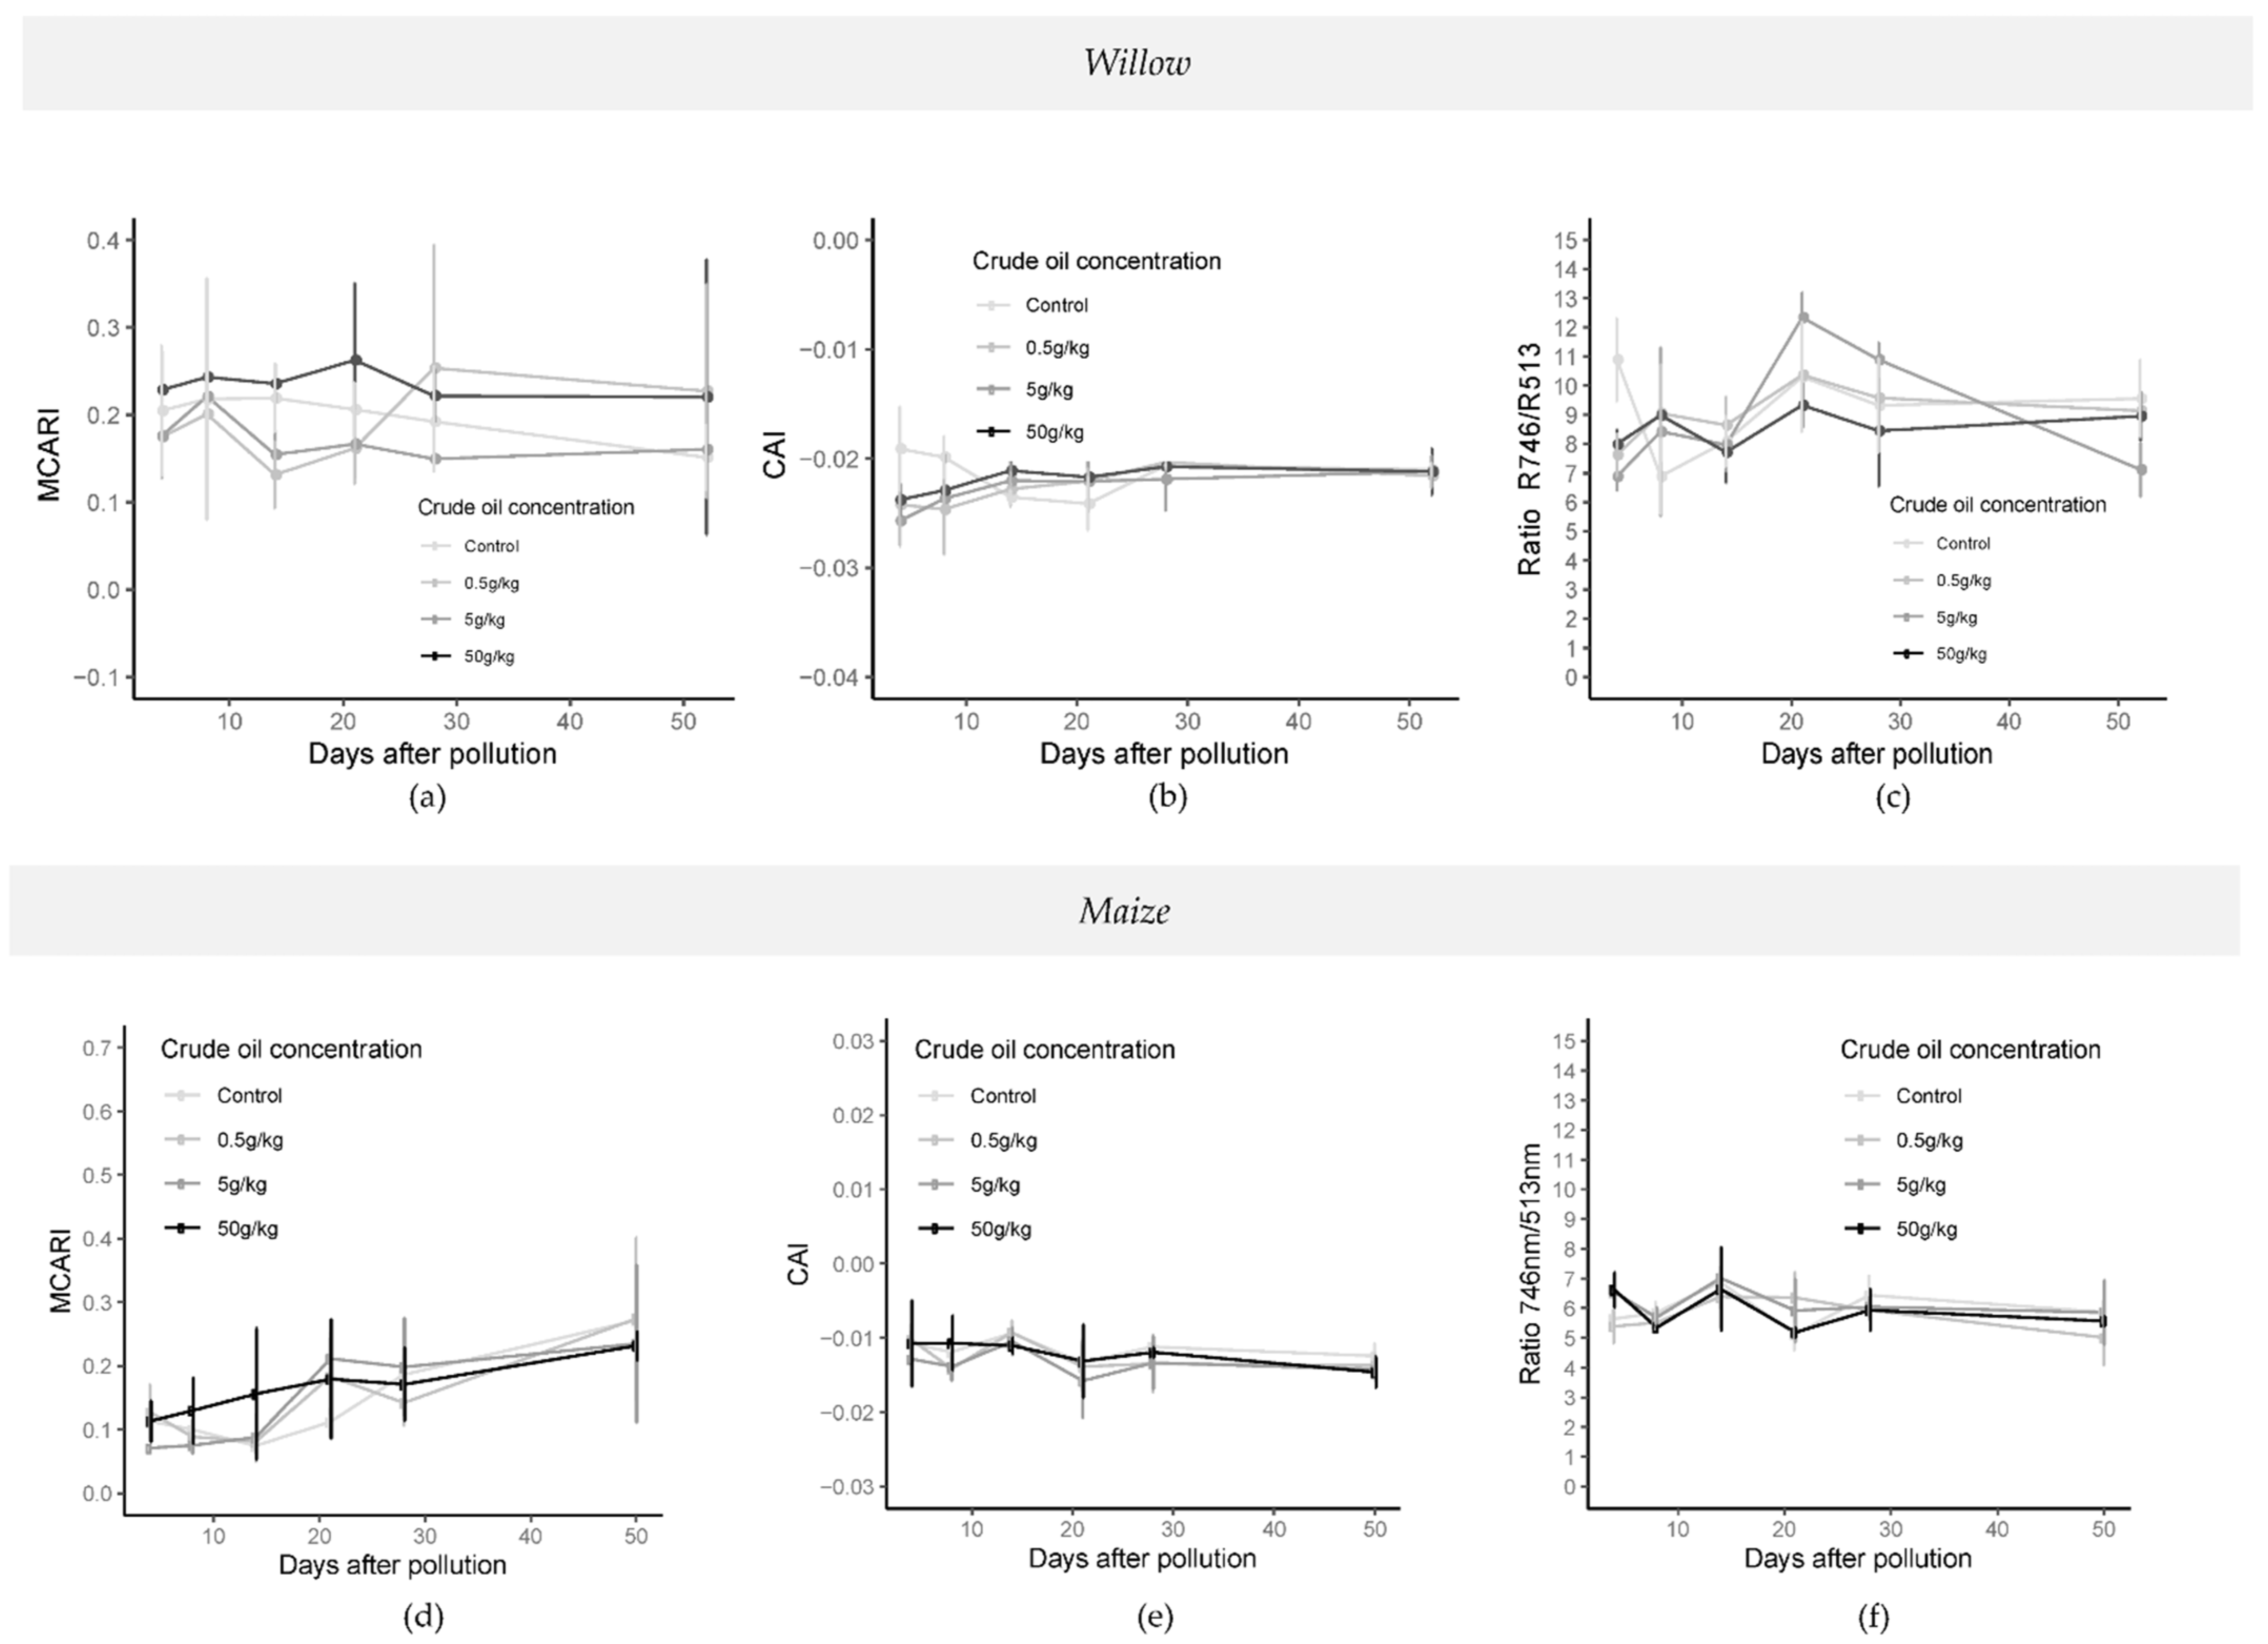
Significant differences (p-value < 0.05; one-way ANOVA; N = 32) in the cellulose absorption index “CAI” [45] were found from day 14 to 21 between control treatment and polluted treatments in crude oil (Figure 8). The CARI (chlorophyll absorption ratio index) and MCARI (modified chlorophyll absorption reflectance index) [46] both showed significant differences (p-value < 0.05; one-way ANOVA; N = 32) during the whole experiment for crude and refined oil treatments. Significant differences were mainly between low polluted treatments (C5, C05, R5, and R05) and high polluted treatment (C50 and R50) (Figure 8). In refined oil treatments (Figure S10), significant differences (p-value < 0.05; one-way ANOVA; N = 32) were found on specific days for CARI, and between 14 and 28 days of pollution for MCARI and RARS (ratio analysis of reflectance spectra [47]).
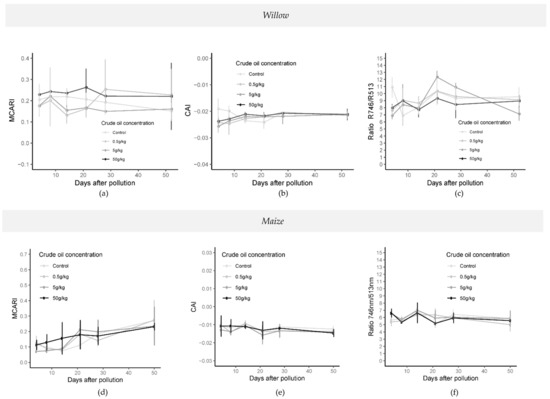
Figure 8.
Time series of vegetation indices MCARI (a,d), CAI (b,e), and RARS (c,f) in crude oil treatments in willow (top) and maize (bottom) from 4 days after the addition of the polluted layer until 50 days later. (MCARI: modified chlorophyll absorption reflectance index, CAI: cellulose absorption index). Last spectral measurement of willow was 52 days after the addition of the pollution and last day in the maize experiment was 50 days after the addition of the pollution.
3.5.2. Maize
Significant differences (p < 0.05; one-way ANOVA; N:32) in vegetation index responses between crude oil treatments and control treatments were noted after 8 days (CAI), 14 days after pollution (NDWI (normalized difference water index, [48])) and 21 days after pollution (NDWI and NDLI (normalized difference lignin index [49])), particularly in the highest pollution concentrations compared with the control and C05 treatments (Figure 8). In the crude oil experiment, significant differences (p < 0.05; one-way ANOVA; N = 32) were found in MCARI, CARI, ARI (anthocyanin reflectance index [50]), and RARS indices, between C50 and C05 and control treatments.
For refined oil, significant differences (p < 0.05; one-way ANOVA; N = 32) were found in MCARI, CARI, RARS, and ARI between R50, control, and low polluted treatments (R5 and R5) on day 8 (Figure S10). Significant differences were also observed in all indices (NDWI, CAI, NDLI, CARI, MCARI, ARI, CRI (carotenoids reflectance index [51]), RARS, PRI [52], and PRI*CI [51,52]) between the R50 and R5 treatments (p < 0.05; one-way ANOVA; N = 32) seven days later than in crude oil treatments (Figure S10).
3.6. Red Edge Position
3.6.1. Willow
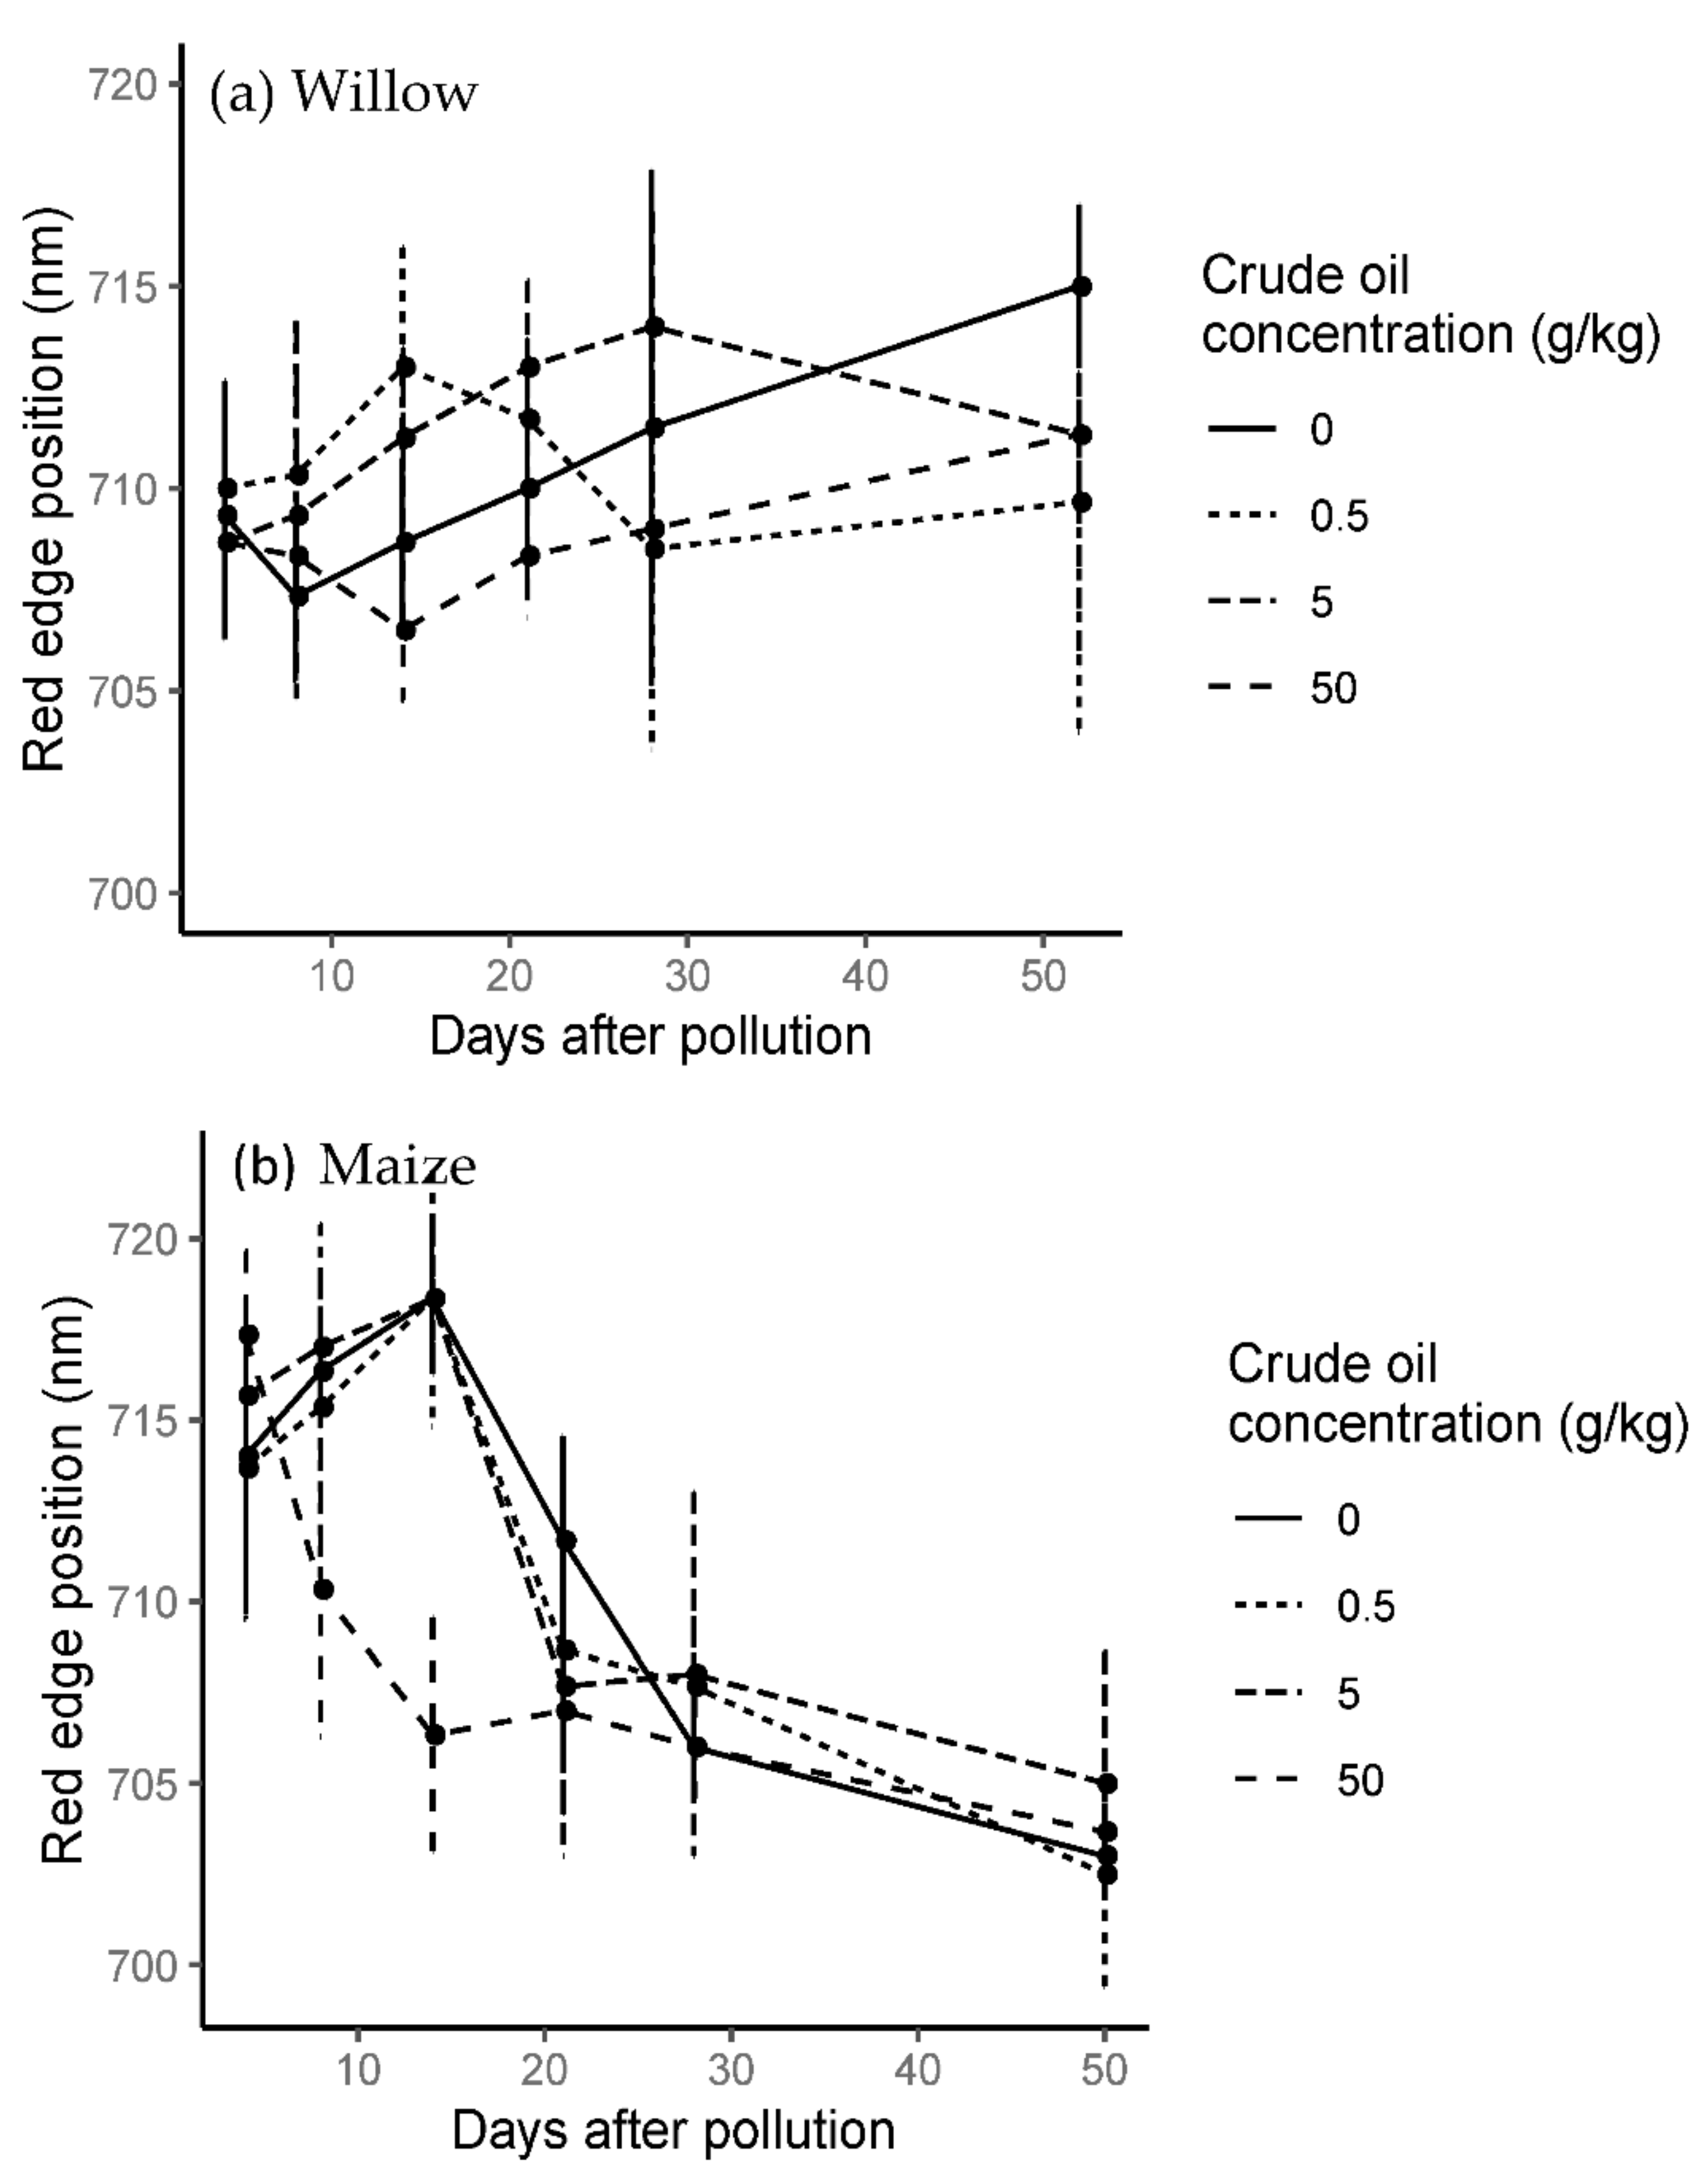
The red edge position (REP) varied according to both hydrocarbon type and with time. For the crude oil treatments, red edge position moved to shorter wavelengths for C50 but was variable for C5 and C05 (Figure 9).
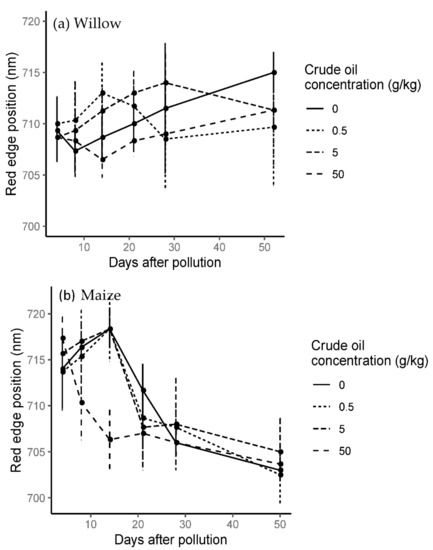
Figure 9.
Mean and standard error time series red edge position in crude oil treatments in willow (a) and maize (b) during the whole experiment. Last spectral measurement of willow was 52 days after the addition of the pollution and last day in the maize experiment was 50 days after the addition of the pollution.
The results for refined oil treatments showed the same trend as crude oil treatments (Figure S11), except there was a recovery of R50 towards longer wavelengths after 28 days of pollution, even surpassing R05 and control treatments with red edge positions shifting to longer wavelengths (Figure 9).
On day 14, there was an average of 7–8 nm difference between high and low pollution treatments for both hydrocarbon types. Compared to the control treatment on the same day, R05 and C05 treatments shifted on average 4–5 nm towards longer wavelengths and R50 and C50 shifted 3–2 nm towards shorter wavelengths.
3.6.2. Maize
For refined oil treatments, REP was located at longer wavelengths in R5 and R05, and shorter wavelengths in R50 treatment until 21 days after the addition of the pollution when the REP shifted from shorter to longer wavelengths (Figure S11).
Crude oil treatments showed similar results to refined oil treatments during the first 21 days of pollution, but after 21 days the REP did not shift towards longer wavelengths in the C50 treatment (Figure 9).
4. Discussion
4.1. Effects of Crude and Refined Oil Contamination on Plant Growth
Previous studies have suggested that hydrocarbon pollution can cause a decrease in plant growth, chlorophyll content, root quantity, and germination rate [5,11,19,25]. These responses were associated with high concentrations of hydrocarbons (>50 g·kg−1) and in the majority of the cases tested on grass or legume species simulating large oil spills.
The high concentration of hydrocarbons (crude and refined oil) in which willow and maize were grown here also showed inhibitory effects on biophysical variables (chlorophyll content, general plant growth, root quantity, and total biomass), as seen in previous experiments [20,31,53]. Differences in the response time were also observed between the plant species. Maize responded faster than willow, making the interpretation of the biophysical changes in hydrocarbon polluted environments more challenging in that the phenology of the different plant species needs to be accounted for, an observation that has not been explored in detail before, as far as we are aware.
Low concentrations of hydrocarbons (<5 g·kg−1 of soil) in soil tested on the same plant species as the high concentrations revealed a stimulated response in the biophysical parameters of plants (chlorophyll content, general growth, root quantity, biomass, leaf size, and height). The few previous experiments that have analysed low hydrocarbon pollution environments [27,54,55,56] were focused mainly on a general increase of plant growth without having a more detailed description of other biophysical variables. What this paper shows is a more variable pattern of changes to biomass, biochemical content, and root growth in response to variable concentrations and types of hydrocarbons present.
4.2. Impact of Crude Oil and Refined Oil on Spectral Properties
Changes in reflectance spectra were observed mainly in the VIS and SWIR. Low concentrations of hydrocarbon led to a decrease in reflectance, with higher concentrations producing an increase. Gütler et al. [25] reported a similar response for highly polluted soils in an experiment with maize growing in plots of soil mixed with petrol and diesel. Other plant species have shown a similar increase in visible reflectance for species such as Brachiara [26], fountain grass (Cenchrus setaceus) and switchgrass (Panicum virgatum) [5], tropical forest species in Ecuador [57], and bramble (Rubus fruticosus L.) [30].
The impact of crude and refined oil was registered in 22 absorption features related to 8 biochemical components: chlorophyll, carotenoids, water, starch, cellulose, lignin, protein, and oil. Other studies have tended to focus only on absorption features related to chlorophyll (e.g., [25]) or broad absorption features (e.g., [26] with grass (B. brizantha H.S)). Broad absorption features can contain information derived from different biochemical components, such as between 1300 and 1500 nm where there are absorption features attributable to water, starch, lignin, protein, cellulose, or sugar [57,58]. The identification, therefore, of the specific biochemical and physiological changes that occur as a result of hydrocarbon contamination is not straightforward.
4.2.1. Chlorophyll Absorption
Chlorophyll absorption features at 581, 620, and 696 nm were detected and showed change over time in both hydrocarbon types and in both plant species after 14 and 21 days of pollution. The changes in reflectance are indicative of an increase in chlorophyll content for lower hydrocarbon concentrations and a decrease for 50 g·kg−1 concentrations, supported by the observed changes in the leaf biochemical analysis. This demonstrates that at low concentrations of hydrocarbons there was an increase in chlorophyll content in willow and maize plants. According to Gitelson et al. [51], green leaves absorb 80% of light in this range and the penetration of radiation into the leaf is four or six times higher than for chlorophyll absorption features situated in the blue range (450–550 nm). This suggests that chlorophyll absorption features are good indicators of the chlorophyll status of the plant in hydrocarbon polluted environments (Figure 10).

Figure 10.
Indicative relationships between band depth, chlorophyll, and hydrocarbon concentration from day 14 to 28 after the addition of hydrocarbon pollution into the soil. As an example, chlorophyll content and the related band depth are used here. (a) Relationship between band depth from absorption feature and chlorophyll content. (b) Relationship between chlorophyll content in the plant and hydrocarbon concentration in soil. (c) Relationship between band depth of absorption feature and hydrocarbon concentration in soil. (HC: hydrocarbon concentration).
The major changes in the chlorophyll spectral features were more pronounced in both the area and width of the features compared to the depth of the absorption feature in crude oil treatments in willow trees and in refined oil treatments in maize. This phenomena was previously observed by Jago et al. [35], who suggested that an increase of chlorophyll content can create a chlorophyll aggregation, which produces a less deep but broader absorption feature. These results are also consistent with Lassalle et al. [20] who observed the same chlorophyll response and an increase in absorption at 600–690 nm in low polluted hydrocarbon treatments (1 g·kg−1) with Cenchrus alopecuroides growing in a mud pit located in a tropical region.
4.2.2. Carotenoids
Absorption features related to carotenoid content were located in the region 510–513 nm of reflectance spectra in both hydrocarbon types and in both plant species. Contrary to the pattern observed with chlorophyll absorption features, the carotenoid absorption features were deeper in higher concentration than in the lower concentration treatments in both hydrocarbon types after 14 days of pollution. The results can be interpreted as a rise in carotenoid content in 50 g·kg−1 treatments, and according to Garrity et al. [59], increases in carotenoid content can be correlated with changes in the environmental conditions. Gamon et al. [60] found that carotenoid levels increased when plants were exposed to a variety of environmental stressors; in particular, a rise in the ratio carotenoid/chlorophyll content can be considered as an indicator of a reduction of photosynthetic activity.
In the case of low concentration polluted treatments, increases in the absorption feature characteristics of carotenoids were only observed after 28 days of pollution, which agrees with the results of Lassalle et al. [20], where carotenoid content was greater than control in a low polluted treatment (1 g·kg−1) after 42 days of hydrocarbon pollution in Cenchrus alopecuroides.
4.2.3. Starch
An increase in absorption band depth and band area related to starch content was noted in low polluted treatments in both hydrocarbon types and both plant species from 14 to 28 days of pollution. For high polluted treatments, a variable behaviour was present with both a decrease and increase in band depth during this period. An increase in the starch content of plant leaves under hydrocarbon pollution was observed by Baker [55] in citrus leaves on a heavy oil experiment. Baker [55] also suggests the possibility of accumulation in other parts of the plant due to the inhibition of carbohydrate uptake due to the presence of hydrocarbons in a soil. Displacement of starch-related absorption features to shorter wavelengths and a reduction of reflectance were also observed in bean crops [61] and in forage grasses grown on diesel treatments, particularly for the absorption features centred at 2270 and 2320 nm [26].
The increase in absorption at both hydrocarbon concentrations (both low and high) could be due to different mechanisms. On 50 g·kg−1 treatments, the presence of high concentrations of hydrocarbons in the soil can cause water and oxygen deficiency in roots, mechanical disruption in root membranes, and significant reduction of nutrients available for the plant [62]. This root disruption could end in a reduction of both starch accumulation in roots and nutrient uptake, leading to starch accumulation in the leaves to overcome the period of stress. This is then manifest in the increased band depth in the starch absorption features. In low polluted scenarios, an increase in chlorophyll content is present. As a result of any increase in photosynthesis arising from increased chlorophyll, more glucose molecules will be produced and converted into starch, again increasing the starch concentration in leaves and increasing the absorption band depth and band area noted in low polluted treatments. However, more work is required to understand the response dynamics of starch in plants exposed to hydrocarbons.
4.2.4. Cellulose, Lignin, and Glucose
Absorption features attributed to the presence of cellulose, lignin, and glucose were noted during the derivative and continuum removal analysis. A rise in band depth and band area for both 0.5 and 5 g·kg−1 treatments was present in both plant species and in both hydrocarbon types. In the 50 g·kg−1 treatments, however, there was a decrease in band depth until 21 days and an increase afterward, demonstrating a variable response to different concentrations and types of hydrocarbons.
Lignin is biosynthesised from glucose and transformed to phenylalanine in the chloroplasts by the Shikimate pathway, transported, and polymerized in the cell wall with cellulose [63]. This connection to the chloroplast demonstrates a relationship between the increase in chlorophyll content with an increase in cellulose and lignin production and, in consequence, increases in band depth and band area of the related absorption features. Increases in cellulose and lignin production can also be related to an increase in biomass, which was observed in larger leaf dimensions for low concentration treatments in refined oil treatments in maize.
In the 50 g·kg−1 treatments, the decrease in chlorophyll content detected could lead, according to [63], to an interference of lignin biosynthesis, which could then result in an inhibition of plant growth. It is important to highlight that this inhibition of plant growth was observed in both willow and maize. Liu et al. [63] also argue that heavy metals such as cadmium, zinc, and copper can increase the phenolic secondary synthesis and in consequence increase lignin production in plants, giving a possible explanation for the later increase in lignin (manifest through increased absorption at 1460 and 1726 nm) at the end of the experiment.
4.2.5. Absorption Feature at 836 nm
A spectral feature located at 836 nm was observed in our data, with a rise in band depth for lower hydrocarbon concentrations and with a decrease for 50 g·kg−1 for both types of hydrocarbons. In recent studies relating to heavy metal pollution in plants, it was suggested that there is a cadmium pollution absorption feature located between 836 and 838 nm [64,65].
Cadmium is a component of crude and refined hydrocarbons, which can be transported through the roots, stems, and leaves, and is one of the most evenly distributed heavy metals in plants [66]. Previous research [20] reports that the most active zone of cadmium uptake is the thin roots with a positive contribution from root exudates. This suggests that there may be traces of cadmium in leaves possibly associated with an increase of thin roots detected in low concentration treatments. On the other hand, for high concentration treatments, a decrease in root growth was observed, with a low population of soil with root hairs, which may have inhibited cadmium uptake from the soil and in consequence be the only treatment in both hydrocarbons showing a decrease in band depth, band area, and band width of this absorption feature with respect to the control treatment. However, as cadmium in leaves was not directly measured, this requires further work to establish the origin and importance of this absorption feature.
4.3. Variation in Vegetation Indices in Response to Hydrocarbon Pollution
Strong correlations between MCARI and chlorophyll content were noted between days 14 and 21 after the addition of the pollution, which demonstrates that biophysical changes produced by hydrocarbons can be observed in changes to related vegetation indices. The MCARI index was previously used by Zhu et al. [27] to predict TPH (total petroleum hydrocarbons) concentration in soil in an experiment in Chengdong oilfield (China) on reed grass reflectance surrounding oil wells, suggesting a strong potential for hydrocarbon detection and monitoring. It was also observed that MCARI in willows and maize showed significant differences in the highest polluted treatment with respect to the control treatments but at different times during the experiment. This is likely related to the large decrease in chlorophyll content detected with the MultispeQ in willow trees approximately 14–21 days after the addition of the pollution, and in maize plants between 8 and 14 days after the addition of the pollution.
The same results were found for the ARI index with a similar delay in response in willows compared to the maize plants. The significant differences in the highly polluted treatments could be linked to a depressed root function due to the high concentration of hydrocarbons in soils. Chalker-Scott [67] has shown that depressed root function due to drought stress or flood events can increase the anthocyanin production in order to shield the plants for photoinhibition and avoid secondary drought stress on leaves. A similar process may be present here in the presence of hydrocarbons, and further work is needed to test this mechanism.
RARS returned significant results only in crude oil treatments in willows and in both hydrocarbon types in maize for the 50 g·kg−1 treatment. In previous research by Lassalle et al. [20], chlorophyll and carotenoid indices were the best models predicting TPH concentrations, leading to their conclusion that SVIs related to plant pigment content were the best in TPH prediction concentration.
CAI and NDLI returned significant results especially in crude oil treatments in both plant species. These results suggest that the increase in biomass observed in both plant species can be detected with these indices, and this is the first time an experiment using biomass-related indices has been used to discriminate hydrocarbon concentration in soils. The different phenology of the plant species showed an earlier response of cellulose and lignin index in maize than in willow trees, but with the same time step pattern.
4.4. Red Edge Position as One of the Main Indices in Hydrocarbon Detection
Red edge position showed blue shifts for higher concentration treatments and shifted towards longer wavelengths for lower concentration treatments. A similar pattern was reported by Gütler et al. [25] on diesel and gasoline polluted plots with maize and Brachiara spp. after 60 days of pollution and from Yang [68], where shifts to longer wavelengths were detected in wheat canopy reflectance from a hydrocarbon microseepage zone. Others, too, have shown the red edge to be of value in similar experiments [6,19,26,35].
Red edge position is positively correlated with chlorophyll content and is a useful index in detecting the increase in chlorophyll in lower concentration treatments (longer wavelengths) and lower chlorophyll in the high concentration treatments (shorter wavelengths). This suggests there is an “improvement in the health status of the plant” presented when exposed to low concentrations of hydrocarbons and is explored further below. The correlation between the MCARI index (index related to chlorophyll content) and red edge position also returned significant results. This outcome supports again the idea of MCARI as a good indicator of the health status and TPH concentration in soil [27,30].
4.5. Plant Responses Dependent on Time after Pollution Event
Spectral and biophysical results at the end of the experiment (after 28 days of pollution) were different from those recorded during the first weeks of the experiment (Figures S12 and S13). After 28 days, chlorophyll content showed lower values than control treatments in low concentrations and higher values in high concentration treatments. In consequence, related spectral variables, for instance, red edge position, absorption features at 620 nm, and vegetation indices MCARI, CARI, or RARS exhibited a shift in lower concentration treatments to higher concentration treatment behaviour and vice versa for higher concentration treatments. This shift was also observed by [25] in refined oil treatments and may result from refined oils being more volatile and easily biodegraded with no long-term impacts after a certain period of time following pollution events, as long as there is no further input of hydrocarbons.
Time dependent changes in plant response to hydrocarbon exposure could be related to microbial degradation activity in the polluted layer. Due to a fixed amount of crude oil in the soil, microorganisms associated with hydrocarbon degradation can appear and reduce the concentration towards values where the plant can survive [69] or even increase its growth as was observed at low concentrations.
4.6. Hydrocarbon Inhibition and Stimulation of Response in Plants
From the results we can observe two general patterns of response to hydrocarbon pollution in both species:
- Stimulated growth response
Both plant species showed that at low hydrocarbon concentrations there was an increase in both chlorophyll content in leaves and biomass, backed up by associated changes in related spectral responses.
Previous studies [70,71,72] concluded that low concentrations of hydrocarbons and components present in hydrocarbons, such as heavy metals, may produce a stimulatory effect called “hormesis”, increasing chlorophyll content, growth, productivity, and photosynthesis, and matching the results in low concentration treatments in this experiment. Several authors [55,56,73] have suggested that soil microbes in soils with low hydrocarbon concentrations can stimulate growth, pigments, and biomass in plants. Whilst the exact mechanism for increased chlorophyll and apparent productivity has not been studied here, the vegetation response to low concentrations of hydrocarbons is consistent.
- Inhibited growth response
Both plant species showed that at high concentration of hydrocarbons there was a decrease in chlorophyll content in leaves, biomass, and plant growth, again supported by associated changes in spectral responses.
Previous experiments [5,11,16,73,74,75,76] have shown similar responses of biophysical variables as seen here in willows and maize when exposed to high concentration treatments. Explanations for this behaviour were variously attributed to an increase in concentration of degrading hydrocarbon microbial communities [77,78], reduction in root respiration [16], hydrophobic organic films on roots inhibiting water/nutrient uptake [62], or a drastic reduction of nitrogen content in the soil due to the oil pollution [79].
- Field observations of green ”halos”
This dual behaviour of vegetation response to hydrocarbons appears to depend on the hydrocarbon concentration present in the soil, and is also detectable (as shown here) in the plants’ spectral response. This concentration-dependent growth response may help to explain field observations of green vegetation halos surrounding some polluted sites. In the case of natural oil seeps, similar ”halos” were observed by Werff et al. [4] in Upper Ojai Valley (USA) and in Paradfurdo in Hungary. Similarly, Noomen et al. [7], in a field campaign in Ventura basin (USA), noted different spectral responses between the centre of the seep and the surrounding greener ring. This ”dual behaviour” of plant response to hydrocarbon presence has important implications for their detection and monitoring using remote sensing.
5. Conclusions
Biomass and chlorophyll content were the best biophysical indicators of refined and crude oil pollution in willow and maize plants. High concentrations of hydrocarbon reduced the chlorophyll content, the growth of the plants, the biomass, the height, the root quantity, and the size of the leaves. Low concentrations produced the inverse effect of what was observed in high polluted treatments, increasing the chlorophyll content, the general growth of the plants, the root quantity, and the biomass. The main difference between the two plant species was in the time when impacts presented, with maize exhibiting biophysical and associated spectral responses earlier than willows.
Spectral changes produced by the presence of hydrocarbons in the soil were mainly located in the VIS and the SWIR. A decrease of reflectance was associated with low polluted treatments and an increase in reflectance observed with high polluted treatments. Comparing the two plant species, maize had a larger range of spectral responses than willow in the SWIR, especially after 14 days of pollution. Absorption features were all related to plant pigments and biomass-related components. Crude oil impacted more in biomass-related absorption features during the first weeks of pollution and refined oil in chlorophyll absorption features. Chlorophyll-related indices CARI, MCARI, and CAI were the best indices for soil pollution discrimination. Red edge shifts towards shorter wavelengths were found in high polluted treatments and towards longer wavelengths in low polluted treatments in both species. The spectral absorption features and vegetation indices appeared consistent with the biophysical changes observed produced by the presence of hydrocarbons.
The phenotype of plants was also influenced in a time and concentration dependent response by the presence of hydrocarbon pollution in the soil. The results suggest a concentration-dependent behaviour of vegetation around oil spills, which was observed in both the biophysical and spectral data. Further experiments will be needed to study spatial transition with respect to hydrocarbon concentration. Plants’ increase in chlorophyll and productivity at low concentrations, as well as their reduction at high concentrations, has important implications for the detection of hydrocarbon presence in landscapes using remote sensing, and may party explain green ”halos” observed in the field around polluted sites.
Supplementary Materials
The following are available online at https://www.mdpi.com/article/10.3390/rs13173376/s1, Figure S1: Height and fresh biomass in refined oil treatments, Figure S2: Chlorophyll content in refined oil treatments, Figure S3: Visible roots of willow trees, Figure S4: Visible roots in maize plants, Figure S5: Ratios of reflectance change in refined oil treatments, Figure S6: 2D histogram of absorption feature frequencies in refined oil treatments of maize plants, Figure S7: 2D histogram of absorption feature frequencies in refined oil treatments of willow trees, Figure S8: 2D histogram of absorption feature frequencies in crude oil treatments of maize plants, Figure S9: Band depth time series of 620, 957, and 1346 nm absorption features in refined oil treatments, Figure S10: Time series of vegetation indices in refined oil treatments, Figure S11: Red edge position in refined oil treatments in willow and maize plants, Figure S12: Red edge and chlorophyll relationships in refined oil treatments, Figure S13: Red edge and chlorophyll relationships in crude oil treatments, Figure S14: Photos of spectral measurements of the willow experiment, Table S1: Absorption features in refined oil treatments classified according to the appearance during the pollution event, Table S2: Absorption feature details and related biochemical components, Table S3: Spectral vegetation indices.
Author Contributions
R.S.-C., M.E.J.C. and A.G.B. conceived the original idea for this study and designed the field data collection. R.S.-C. led data collection and analysis. R.S.-C., M.E.J.C. and A.G.B. conceived the paper, and all authors contributed to writing the manuscript. All authors have read and agreed to the published version of the manuscript.
Funding
This research was funded by UKRI—NERC CDT in Oil and GAS, grant number 1866153. The James Hutton Institute receives funding from the Scottish Government.
Institutional Review Board Statement
Not applicable.
Informed Consent Statement
Not applicable.
Data Availability Statement
Further data resulting from this study will be published at https://doi.org/10.15132/20000101 after an embargo period, ending 31 March 2023.
Acknowledgments
The authors acknowledge the James Hutton Institute for the use of the facilities and the help during the experiment (with special mention to Ronnie Ogg, David Boldrin, and Graham Pitkin); TOTAL Energies for the donation of the crude oil; the NERC Field Spectroscopy Facility for loan of the ASD Fieldspec Pro and the equipment support (loan number: 789.0418 and 811.1118); and Craig Philips (University of Dundee) for the laboratory support and biochemical analysis.
Conflicts of Interest
The authors declare no conflict of interest. The funders had no role in the design of the study; in the collection, analyses, or interpretation of data; in the writing of the manuscript, or in the decision to publish the results.
References
- Van Der Werff, H.; Van Der Meijde, M.; Jansma, F.; Van Der Meer, F.; Groothuis, G.J. A spatial-spectral approach for visualization of vegetation stress resulting from pipeline leakage. Sensors 2008, 8, 3733–3743. [Google Scholar] [CrossRef]
- Schmidt-Etkin, D. Spill occurrences: A world overview. In Oil Spill Science and Technology; Fingars, M., Ed.; Gulf Professional Publisher: Burlington, VT, USA, 2011; pp. 7–48. [Google Scholar] [CrossRef]
- Kvenvolden, K.A.; Cooper, C.K. Natural seepage of crude oil into the marine environment. Geo-Mar. Lett. 2003, 23, 140–146. [Google Scholar] [CrossRef]
- Van der Werff, H.M.A.; Van Der Noomen, M.F.; Meijde, M.; Van Der Kooistra, J.F. Use of hyperspectral remote sensing to detect hazardous gas leakage from pipelines. In New Developments and Challenges in Remote Sensing; Bochenek, Z., Ed.; Millpress: Rotterdam, The Netherlands, 2007; pp. 707–715. [Google Scholar]
- Lassalle, G.; Credoz, A.; Fabre, S.; Hédacq, R.; Dubucq, D.; Elger, A. Hyperspectral signature analysis of three plant species to long-term hydrocarbon and heavy metal exposure. Proc. SPIE Int. Soc. Opt. Eng. 2017, 10428, 104280Z-1. [Google Scholar] [CrossRef]
- Arellano, P.; Tansey, K.; Balzter, H.; Boyd, D.S. Detecting the effects of hydrocarbon pollution in the amazon forest using hyperspectral satellite images. Environ. Pollut. 2015, 205, 225–239. [Google Scholar] [CrossRef]
- Noomen, M.F.; van der Werff, H.M.A.; van der Meer, F.D. Spectral and spatial indicators of botanical changes caused by long-term hydrocarbon seepage. Ecol. Inform. 2012, 8, 55–64. [Google Scholar] [CrossRef]
- Smith, K.L.; Steven, M.D.; Colls, J.J. Plant spectral responses to gas leaks and other stresses. Int. J. Remote Sens. 2005, 26, 4067–4081. [Google Scholar] [CrossRef]
- Henner, P.; Schiavon, M.; Druelle, V.; Lichtfouse, E. Phytotoxicity of ancient gaswork soils. Effect of polycyclic aromatic hydrocarbons (PAHs) on plant germination. Org. Geochem. 1999, 30, 963–969. [Google Scholar] [CrossRef]
- Bona, C.; de Rezende, I.M.; Santos, G.; de Oliveira Santos, G.; de Souza, L.A. Effect of soil contaminated by diesel oil on the germination of seeds and the growth of schinus terebinthifolius raddi (anacardiaceae) seedlings. Braz. Arch. Biol. Technol. 2011, 54, 1379–1387. [Google Scholar] [CrossRef]
- Baek, K.; Kim, H.; Oh, H.; Yoon, B.; Kim, J.; Lee, I. Effects of crude oil, oil components, and bioremediation on plant growth. J. Environ. Sci. Health 2004, A39, 2465–2472. [Google Scholar] [CrossRef] [PubMed]
- Kuhlgert, S.; Austic, G.; Zegarac, R.; Osei-Bonsu, I.; Hoh, D.; Chilvers, M.I.; Roth, M.G.; Bi, K.; TerAvest, D.; Weebadde, P.; et al. MultispeQ beta: A tool for large-scale plant phenotyping connected to the open photosynq network. R. Soc. Open Sci. 2016, 3, 160592. [Google Scholar] [CrossRef]
- Maxwell, K.; Johnson, G.N. Chlorophyll fluorescence--A practical guide. J. Exp. Bot. 2000, 51, 659–668. [Google Scholar] [CrossRef]
- Onwurah, I.N.E.; Ogugua, V.N.; Onyike, N.B.; Ochonogor, A.E.; Otitoju, O.F. Crude oils spills in the environment, effects and some innovative clean-up biotechnologies. Int. J. Environ. Res. 2007, 1, 307–320. [Google Scholar] [CrossRef]
- Adamu, B.; Tansey, K.; Ogutu, B. An investigation into the factors influencing the detectability of oil spills using spectral indices in an oil-polluted environment. Int. J. Remote Sens. 2016, 37, 2338–2357. [Google Scholar] [CrossRef]
- Jenkins, T.F.; Johnson, L.A.; Collins, C.M.; Mcfadden, T.T. The physical, chemical and biological effects of crude oil spills on black spruce forest, interior alaska. Artic 1978, 31, 305–323. [Google Scholar] [CrossRef]
- Collins, C.M.; Racine, C.H.; Walsh, M.E. Fate and Effects of Crude Oil Spilled on Subarctic Permafrost Terrain in Interior Alaska Fifteen Years Later; NTIS: Springfield, VR, USA, 1993. [Google Scholar]
- Rosso, P.H.; Pushnik, J.C.; Lay, M.; Ustin, S.L. Reflectance properties and physiological responses of salicornia virginica to heavy metal and petroleum contamination. Environ. Pollut. 2005, 137, 241–252. [Google Scholar] [CrossRef]
- Emengini, E.J.; Blackburn, G.A.; Theobald, J.C. Discrimination of plant stress caused by oil pollution and waterlogging using hyperspectral and thermal remote sensing. J. Appl. Remote Sens. 2013, 7, 073476. [Google Scholar] [CrossRef]
- Lassalle, G.; Credoz, A.; Hédacq, R.; Bertoni, G.; Dubucq, D.; Fabre, S.; Elger, A. Estimating persistent oil contamination in tropical region using vegetation indices and random forest regression. Ecotoxicol. Environ. Saf. 2019, 184, 109654. [Google Scholar] [CrossRef] [PubMed]
- Odukoya, J.; Lambert, R.; Sakrabani, R. Impact of crude oil on yield and phytochemical composition of selected green leafy vegetables. Int. J. Veg. Sci. 2019, 25, 554–570. [Google Scholar] [CrossRef]
- Verrelst, J.; Camps-Valls, G.; Muñoz-Marí, J.; Rivera, J.P.; Veroustraete, F.; Clevers, J.G.P.W.; Moreno, J. Optical remote sensing and the retrieval of terrestrial vegetation bio-geophysical properties—A review. ISPRS J. Photogramm. Remote Sens. 2015, 108, 273–290. [Google Scholar] [CrossRef]
- Achuba, F.I. The effect of sublethal concentrations of crude oil on the growth and metabolism of cowpea (vigna unguiculata) seedlings. Environmentalist 2006, 26, 17–20. [Google Scholar] [CrossRef]
- Dawson, T.P.; Curran, P.J.; Plummer, S.E. LIBERTY—Modeling the effects of leaf biochemical concentration on reflectance spectra. Remote Sens. Environ. 1998, 65, 50–60. [Google Scholar] [CrossRef]
- Gürtler, S.; Souza Filho, C.R.; Sanches, I.D.; Alves, M.N.; Oliveira, W.J. Determination of changes in leaf and canopy spectra of plants grown in soils contaminated with petroleum hydrocarbons. ISPRS J. Photogramm. Remote Sens. 2018, 146, 272–288. [Google Scholar] [CrossRef]
- Sanches, I.D.; Souza Filho, C.R.; Magalhães, L.A.; Quitério, G.C.M.; Alves, M.N.; Oliveira, W.J. Assessing the impact of hydrocarbon leakages on vegetation using reflectance spectroscopy. ISPRS J. Photogramm. Remote Sens. 2013, 78, 85–101. [Google Scholar] [CrossRef]
- Zhu, L.; Zhao, X.; Lai, L.; Wang, J.; Jiang, L.; Ding, J.; Liu, N.; Yu, Y.; Li, J.; Xiao, N.; et al. Soil TPH concentration estimation using vegetation indices in an oil polluted area of eastern china. PLoS ONE 2013, 8, e54028. [Google Scholar] [CrossRef] [PubMed]
- Noomen, M.F.; Van Der Meer, F.D.; Skidmore, A.K. Hyperspectral remote sensing for detecting the effects of three hydrocarbon gases on maize reflectance. In Proceedings of the 31st International Symposium on Remote Sensing of Environment, ISRSE 2005: Global Monitoring for Sustainability and Security, Saint Petersburg, Russia, 20–24 May 2005; pp. 6–9. [Google Scholar]
- Lassalle, G.; Credoz, A.; Hédacq, R.; Fabre, S.; Dubucq, D.; Elger, A. Assessing soil contamination due to oil and gas production using vegetation hyperspectral reflectance. Environ. Sci. Technol. 2018, 52, 1756–1764. [Google Scholar] [CrossRef] [PubMed]
- Lassalle, G.; Fabre, S.; Credoz, A.; Hédacq, R.; Borderies, P.; Bertoni, G.; Erudel, T.; Buffan-Dubau, E.; Dubucq, D.; Elger, A. Detection and discrimination of various oil-contaminated soils using vegetation reflectance. Sci. Total Environ. 2019, 655, 1113–1124. [Google Scholar] [CrossRef] [PubMed]
- Credoz, A.; Hédacq, R.; Barreau, C.; Dubucq, D. Experimental study of hyperspectral responses of plants grown on mud pit soil. In Proceedings of the SPIE Remote Sensing 2016, Earth Resources and Environmental Remote Sensing/GIS Applications VII, Edinburgh, UK, 26–29 September 2016. [Google Scholar] [CrossRef]
- Lassalle, G.; Fabre, S.; Credoz, A.; Hédacq, R.; Bertoni, G.; Dubucq, D.; Elger, A. Application of PROSPECT for estimating total petroleum hydrocarbons in contaminated soils from leaf optical properties. J. Hazard. Mater. 2019, 377, 409–417. [Google Scholar] [CrossRef] [PubMed]
- Krupnik, D.; Khan, S.; Red, N.I.R. Hydrocarbon microseepage-related geobotanical analysis in and around oil fields. Lead. Edge 2017, 36, 1–11. [Google Scholar] [CrossRef]
- Adamu, B.; Ogutu, B.; Tansey, K. Remote sensing for detection and monitoring of vegetation affected by oil spills. Int. J. Remote Sens. 2016, 39, 3628–3645. [Google Scholar] [CrossRef]
- Jago, R.A.; Cutler, M.E.J.; Curran, P.J. Estimating canopy chlorophyll concentration from field and airborne spectra. Remote Sens. Environ. 1999, 68, 217–224. [Google Scholar] [CrossRef]
- Yang, H.; Meer, F.V.D.; Zhang, J.; Kroonenberg, S.B. Direct detection of onshore hydrocarbon microseepages by remote sensing techniques. Remote Sens. Rev. 2000, 18, 1–18. [Google Scholar] [CrossRef]
- Lichtenthaler, H.K.; Wellburn, A.R. Determinations of total carotenoids and chlorophylls a and b of leaf extracts in different solvents. Biochem. Soc. Trans. 1983, 11, 591–592. [Google Scholar] [CrossRef]
- Sanches, I.D.; Souza Filho, C.R.; Kokaly, R.F. Spectroscopic remote sensing of plant stress at leaf and canopy levels using the chlorophyll 680nm absorption feature with continuum removal. ISPRS J. Photogramm. Remote Sens. 2014, 97, 111–122. [Google Scholar] [CrossRef]
- Bayat, B.; van der Tol, C.; Verhoef, W. Remote sensing of grass response to drought stress using spectroscopic techniques and canopy reflectance model inversion. Remote Sens. 2016, 8, 557. [Google Scholar] [CrossRef]
- Savitzky, A.; Golay, M.J.E. Smoothing and differentiation of data by simplified least squares procedures. Anal. Chem. 1964, 36, 1627–1639. [Google Scholar] [CrossRef]
- Aphalo, P.J. GGPMISC: Miscellaneous Extensions to “ggplot2”. Available online: https://cran.r-project.org/package=ggpmisc (accessed on 20 January 2020).
- R Core Team. R: A Language and Environment for Statistical Computing. Available online: https://www.r-project.org/ (accessed on 13 February 2020).
- Kokaly, R.F.; Clark, R.N. Spectroscopic determination of leaf biochemistry using band-depth analysis of absorption features and stepwise multiple linear regression. Remote Sens. Environ. 1999, 67, 267–287. [Google Scholar] [CrossRef]
- Lehnert, L.W.; Meyer, H.; Obermeier, W.A.; Silva, B.; Regeling, B.; Thies, B.; Bendix, J. Hyperspectral data analysis in R: The hsdar package. J. Stat. Softw. 2019, 89, 12. [Google Scholar] [CrossRef]
- Nagler, P.L.; Inoue, Y.; Glenn, E.P.; Russ, A.L.; Daughtry, C.S.T. Cellulose absorption index (CAI) to quantify mixed soil-plant litter scenes. Remote Sens. Environ. 2003, 87, 310–325. [Google Scholar] [CrossRef]
- Daughtry, C.S.T.; Walthall, C.L.; Kim, M.S.; de Colstoun, E.b.; McMurtrey, J.E., III. Estimating corn leaf chlorophyll concentration from leaf and canopy reflectance. Remote Sens. Environ. 2000, 74, 229–239. [Google Scholar] [CrossRef]
- Chappelle, E.W.; Kim, M.S.; McMurtrey, J.E. Ratio analysis of reflectance spectra (RARS): An algorithm for the remote estimation of the concentrations of chlorophyll A, chlorophyll B, and carotenoids in soybean leaves. Remote Sens. Environ. 1992, 39, 239–247. [Google Scholar] [CrossRef]
- Gao, B.-C. NDWI—A normalized difference water index for remote sensing of vegetation liquid water from space. Remote Sens. Environ. 1996, 58, 257–266. [Google Scholar] [CrossRef]
- Serrano, L.; Peñuelas, J.; Ustin, S.L. Remote sensing of nitrogen and lignin in mediterranean vegetation from aviris data: Decomposing biochemical from structural signals. Remote Sens. Environ. 2002, 81, 355–364. [Google Scholar] [CrossRef]
- Gitelson, A.A.; Merzlyak, M.N.; Chivkunova, O.B. Optical properties and nondestructive estimation of anthocyanin content in plant leaves. Photochem. Photobiol. 2001, 74, 38–45. [Google Scholar] [CrossRef]
- Gitelson, A.A.; Gritz, Y.; Merzlyak, M.N. Relationships between leaf chlorophyll content and spectral reflectance and algorithms for non-destructive chlorophyll assessment in higher plant leaves. J. Plant Physiol. 2003, 160, 271–282. [Google Scholar] [CrossRef] [PubMed]
- Gamon, J.A.; Serrano, L.; Surfus, J.S. The photochemical reflectance index: An optical indicator of photosynthetic radiation use efficiency across species, functional types, and nutrient levels. Oecologia 1997, 112, 492–501. [Google Scholar] [CrossRef]
- Arellano, P.; Tansey, K.; Balzter, H.; Boyd, D.S. Field spectroscopy and radiative transfer modelling to assess impacts of petroleum pollution on biophysical and biochemical parameters of the Amazon rainforest. Environ. Earth Sci. 2017, 76, 217. [Google Scholar] [CrossRef]
- Carr, R.H. Vegetative growth in soils containing crude petroleum. Soil Sci. 1919, 8, 67–68. [Google Scholar] [CrossRef][Green Version]
- Baker, J.M. The effects of oils on plants. Environ. Pollut. 1970, 1, 27–44. [Google Scholar] [CrossRef]
- Lin, Q.; Mendelssohn, I.A.; Suidan, M.T.; Lee, K.; Venosa, A.D. The Dose-response relationship between no. 2 fuel oil and the growth of the salt marsh grass, spartina alterniflora. Mar. Pollut. Bull. 2002, 44, 897–902. [Google Scholar] [CrossRef]
- Arellano, P.; Tansey, K.; Balzter, H.; Tellkamp, M. Plant family-specific impacts of petroleum pollution on biodiversity and leaf chlorophyll content in the amazon rainforest of ecuador. PLoS ONE 2017, 12, e0169867. [Google Scholar] [CrossRef]
- Curran, P.J. Remote sensing of foliar chemistry. Remote Sens. Environ. 1989, 30, 271–278. [Google Scholar] [CrossRef]
- Garrity, S.R.; Eitel, J.U.H.; Vierling, L.A. Disentangling the relationships between plant pigments and the photochemical reflectance index reveals a new approach for remote estimation of carotenoid content. Remote Sens. Environ. 2011, 115, 628–635. [Google Scholar] [CrossRef]
- Gamon, J.A.; Huemmrich, K.F.; Wong, C.Y.S.; Ensminger, I.; Garrity, S.; Hollinger, D.Y.; Noormets, A.; Peñuelask, J. A remotely sensed pigment index reveals photosynthetic phenology in evergreen conifers. Proc. Natl. Acad. Sci. USA 2016, 113, 13087–13092. [Google Scholar] [CrossRef] [PubMed]
- Sanches, I.D.A.; Alves, M.N.; Oliveira, W.J.; Filho, C.R.S.; Filho, S. Ultra and hyperspectral data as a tool to discriminate between contaminated soils with hydrocarbon fuels and senescent vegetation. In Proceedings of the Latino American Remote Sensing Week, Santiago, Chile, 17 April 2013. [Google Scholar]
- Saranya, K.; Maddela, N.R.; Megharaj, M.; Venkateswarl, K. Total Petroleum Hydrocarbons: Environmental Fate, Toxicity, and Remediation; Springer: Newcastle, Australia, 2020. [Google Scholar] [CrossRef]
- Liu, Q.; Luo, L.; Zheng, L. Lignins: Biosynthesis and biological functions in plants. Int. J. Mol. Sci. 2018, 19, 335. [Google Scholar] [CrossRef]
- Shuangyin, Z.; Ying, Z.; Mi, W.; Teng, F. Selection of the optimal spectral resolution for the cadmium-led cross contamination diagnosing based on the hyperspectral refelctance of rice canopy. Sensors 2019, 19, 3889. [Google Scholar] [CrossRef]
- Wang, F.; Gao, J.; Zha, Y. Hyperspectral sensing of heavy metals in soil and vegetation: Feasibility and challenges. ISPRS J. Photogramm. Remote Sens. 2018, 136, 73–84. [Google Scholar] [CrossRef]
- Song, Y.; Jin, L.; Wang, X. Cadmium absorption and transportation pathways in plants. Int. J. Phytoremediation 2017, 19, 133–141. [Google Scholar] [CrossRef]
- Chalker-Scott, L. Environmental significance of anthocyanins in plant stress responses. Photochem. Photobiol. 1999, 70, 1–9. [Google Scholar] [CrossRef]
- Yang, H.; Zhang, J.; Van Der Meer, F.; Kroonenberg, S.B. Imaging spectrometry data correlated to hydrocarbon microseepage. Int. J. Remote Sens. 2000, 21, 197–202. [Google Scholar] [CrossRef]
- Das, N.; Chandran, P. Microbial degradation of petroleum hydrocarbon contaminants: An overview. Biotechnol. Res. Int. 2010, 2011, 1–13. [Google Scholar] [CrossRef]
- Agathokleous, E. Environmental hormesis, a fundamental non-monotonic biological phenomenon with implications in ecotoxicology and environmental safety. Ecotoxicol. Environ. Saf. 2018, 148, 1042–1053. [Google Scholar] [CrossRef]
- Agathokleous, E.; Feng, Z.; Peñuelas, J. Chlorophyll hormesis: Are chlorophylls major components of stress biology in higher plants? Sci. Total Environ. 2020, 726, 138637. [Google Scholar] [CrossRef]
- Małkowski, E.; Sitko, K.; Szopiński, M.; Gieroń, Ż.; Pogrzeba, M.; Kalaji, H.M.; Zieleźnik-Rusinowska, P. Hormesis in plants: The role of oxidative stress, auxins and photosynthesis in corn treated with CD or PB. Int. J. Mol. Sci. 2020, 21, 2099. [Google Scholar] [CrossRef]
- Beaubien, S.E.; Ciotoli, G.; Coombs, P.; Dictor, M.C.; Krüger, M.; Lombardi, S.; Pearce, J.M.; West, J.M. The Impact of a naturally occurring CO2 gas vent on the shallow ecosystem and soil chemistry of a mediterranean pasture (Latera, Italy). Int. J. Greenh. Gas Control 2008, 2, 373–387. [Google Scholar] [CrossRef]
- Baruah, P.; Saikia, R.R.; Baruah, P.P.; Deka, S. Effect of crude oil contamination on the chlorophyll content and morpho-anatomy of cyperus brevifolius (Rottb.) hassk. Environ. Sci. Pollut. Res. 2014, 21, 12530–12538. [Google Scholar] [CrossRef] [PubMed]
- Rusin, M.; Gospodarek, J.; Nadgórska-Socha, A. The effect of petroleum-derived substances on the growth and chemical composition of Vicia faba L. Polish J. Environ. Stud. 2015, 24, 2157–2166. [Google Scholar] [CrossRef]
- Athar, H.-U.-R.; Ambreen, S.; Javed, M.; Hina, M.; Rasul, S.; Zafar, Z.U.; Manzoor, H.; Ogbaga, C.C.; Afzal, M.; Al-Qurainy, F.; et al. Influence of sub-lethal crude oil concentration on growth, water relations and photosynthetic capacity of maize (Zea mays L.) plants. Environ. Sci. Pollut. Res. 2016, 23, 18320–18331. [Google Scholar] [CrossRef] [PubMed]
- Hawrot-Paw, M.; Wijatkowski, A.; Mikiciuk, M. Influence of diesel and biodiesel fuel-contaminated soil on microorganisms, growth and development of plants. Plant Soil Environ. 2015, 61, 189–194. [Google Scholar] [CrossRef]
- Ribeiro, H.; Gomes, J.; Jesus, J.; Magalhães, C.; Dias, J.M.; Danko, A.S. Biodegradation of biodiesel and toluene under nitrate-reducing conditions and the impact on bacterial community structure. J. Soils Sediments 2019, 19, 439–450. [Google Scholar] [CrossRef]
- Deni, J.; Penninckx, M.J. Nitrification and autotrophic nitrifying bacteria in a hydrocarbon—Polluted soil. Appl. Environ. Microbiol. 1999, 65, 4008–4013. [Google Scholar] [CrossRef] [PubMed]
Publisher’s Note: MDPI stays neutral with regard to jurisdictional claims in published maps and institutional affiliations. |
© 2021 by the authors. Licensee MDPI, Basel, Switzerland. This article is an open access article distributed under the terms and conditions of the Creative Commons Attribution (CC BY) license (https://creativecommons.org/licenses/by/4.0/).

