Abstract
In this work, column-averaged dry-air mole fractions of carbon dioxide (XCO2), methane (XCH4) and carbon monoxide (XCO) are presented for the first time at a mid-latitude urban station, Thessaloniki, Greece, using the Bruker EM27/SUN ground-based low-resolution Fourier Transform spectrometer operated according to the requirements of the Collaborative Carbon Column Observing Network (COCCON). Two years of measurements are presented and examined for seasonal variability. The observed XCO2 levels show the expected seasonal cycle (spring maximum, late summer minimum) with a peak-to-peak amplitude of 12 ppm, with maximum values reported for winter 2021 exceeding 416 ppm. The XCH4 values are shown to increase in the second half of the year, with autumn showing the highest mean value of 1.878 ± 0.01 ppm. The XCO levels, following anthropogenic sources, show high winter and low summer values, exhibiting a rise again in August and September with a maximum value of 114 ± 3 ppb and a minimum in summer 2020 of 76 ± 3 ppb. Additionally, methane and carbon monoxide products obtained from the TROPOspheric Monitoring Instrument (TROPOMI), Sentinel-5P space borne sensor, are compared with the ground-based measurements. We report a good agreement between products. The relative mean bias for methane and carbon monoxide are −0.073 ± 0.647% and 3.064 ± 5.566%, respectively. Furthermore, a 15-day running average is subtracted from the original daily mean values to provide ΔXCO2, ΔXCO and ΔXCH4 residuals, so as to identify local sources at a synoptic scale. ΔXCO and ΔXCO2 show the best correlation in the winter (R2 = 0.898, slope = 0.007) season due to anthropogenic emissions in this period of the year (combustion of fossil fuels or industrial activities), while in summer no correlation is found. ΔXCO and ΔXCH4 variations are similar through both years of measurements and have a very good correlation in all seasons including winter (R2 = 0.804, slope = 1.209). The investigation of the X-gases comparison is of primary importance in order to identify local sources and quantify the impact of these trace gases to the deregulation of earth-climate system balance.
Keywords:
FTIR; EM27SUN; column average concentration; residuals; ΔXCO2; ΔXCO; ΔXCH4; Thessaloniki; KIT; TROPOMI 1. Introduction
Industrialisation, urbanisation, transport and domestic heating not only sustain but continuously increase the need for fossil fuel combustion, the main source of the anthropogenic component of the carbon cycle. Agriculture, coal mining, waste management, natural gas networks and other human activities also greatly contribute to the increase of greenhouse gas (GHG) concentrations in the atmosphere. This continuing increase of atmospheric greenhouse gas abundances is the major driver of anthropogenic global warming and subsequently climate change. Carbon dioxide, the most important long-lived greenhouse gas in the atmosphere, is responsible for about 65% of the radiative forcing (RF) and continues to increase at a rate approximately 2.0 ± 0.1 ppm per year for 2002–2011 despite emission reduction efforts worldwide [1]. Methane (CH4), the second most important anthropogenic greenhouse gas after CO2, has increased by about 259% since pre-industrial times [1]. Methane, with an estimated Global Warming Potential (GWP) of 28–36 in 100 years and a lifespan of about 11–13 years, is responsible for about 16% of the RF [1]. Globally averaged CH4 shows a stronger relative growth than CO2 increased by a factor of 2.5 from an annual average of 720 ppb (parts per billion) to approximately 1800 ppb within the same period [2]. Carbon monoxide is produced by the oxidation of methane, biomass burning and the combustion of fossil fuels while the dominant sink of CO is oxidation with hydroxyl radicals (OH). It is evident that accurate and precise measurements of atmospheric abundances of greenhouse gases and the study of their spatial and temporal variations are important for the estimation of their emission levels on a global scale and the quantification and better understanding of their sinks and sources, thus contributing to the design of proper policies for global warming mitigation.
In situ measurements of GHG abundances are performed in stations around the world via gas chromatography or Cavity ring-down spectroscopy (CRDS) analysers [3]. These point observations are considered to be representative of surface fluxes of a larger surrounding area [4]. However, the proximity of local sources and sinks to surface measurement sites makes it more difficult to distinguish between vertical exchange between the surface and atmosphere and transport on diurnal and seasonal time scales. To that end, the use of column-averaged dry-air mole fractions (DMFs) appears more useful, also due to their insensitivity to variations in surface pressure and atmospheric water vapor [5]. Vertical column integration of the GHG concentrations above surface ensures that these measurements are not significantly affected by vertical transport (as are surface in situ measurements), thus permitting the identification of possible horizontal gradients in measured DMFs to regional-scale fluxes [6]. Since these quantities are also measured by sensors on satellite missions, it is possible to use ground-based data to validate space borne GHG measurements, allowing us to properly use their valuable global coverage.
FTIR spectrometers measure the total column of trace gases using the direct solar radiation as a light source. The Total Carbon Column Observing Network (TCCON) [7] is a global-based network operating Fourier transform infrared (FTIR) spectrometers, in particular, Bruker IFS 125HR high-resolution spectrometers [8], designed to retrieve precise and accurate column abundances of CO2, CH4, and CO, among others, from near-infrared (NIR) solar absorption spectra. The COllaborative Carbon Column Observing Network (COCCON), established in 2014, aims to increase the global coverage of greenhouses gas columnar observations [8]. It produces greenhouse gas observations based on common instrumental standards, data analysis and quality assurance procedures [8], working as an important supplement of TCCON in order to increase the global density of column-averaged greenhouse gas observations, with low infrastructure [5]. COCCON uses the Bruker EM27/SUN portable low resolution FTIR spectrometer [9,10,11] developed by KIT, in collaboration with Bruker Optics™, as a mobile, reliable, easy-to-deploy and low-cost supplement to TCCON high-resolution spectrometers.
In addition to ground-based network measurements, space-borne greenhouse gas column-averaged dry air mole fractions are observed on a global scale. The Scanning Imaging Absorption Spectrometer for Atmospheric Chartography (SCIAMACHY) on board ENVISAT [12], operational between 2002 and 2012 and the Greenhouse Gases Observing Satellite (GOSAT) [13], launched in 2009, have the capability to provide a more extensive and homogenous network of methane observations compared to in situ networks. Similarly, since 2000, long-term global data sets of CO are provided by the MOPITT (Measurements of Pollution in the Troposphere) instrument (e.g., [14]), while the IASI (Infrared Atmospheric Sounding Interferometer) on board a series of three METOP (Meteorological Operational) satellites continues this long term dataset [15]. Satellite observations are frequently validated against ground-based FTIR measurements (e.g., [16,17]).
In this work, the first COCCON observations performed in Greece are presented, and the column-averaged dry air mole fractions over Thessaloniki of carbon dioxide (XCO2), methane (XCH4) and carbon monoxide (XCO) derived from these observations are discussed. A first comparison to the columnar abundances provided by the TROPOspheric Monitoring Instrument, TROPOMI, on board the Sentinel 5P platform, is also presented. Finally, the co-variability of the three greenhouse gases is investigated and their seasonal patterns, as well as local sources and sinks, are discussed.
2. Instrumentation and Data
2.1. The Thessaloniki EM27/SUN Spectrometer
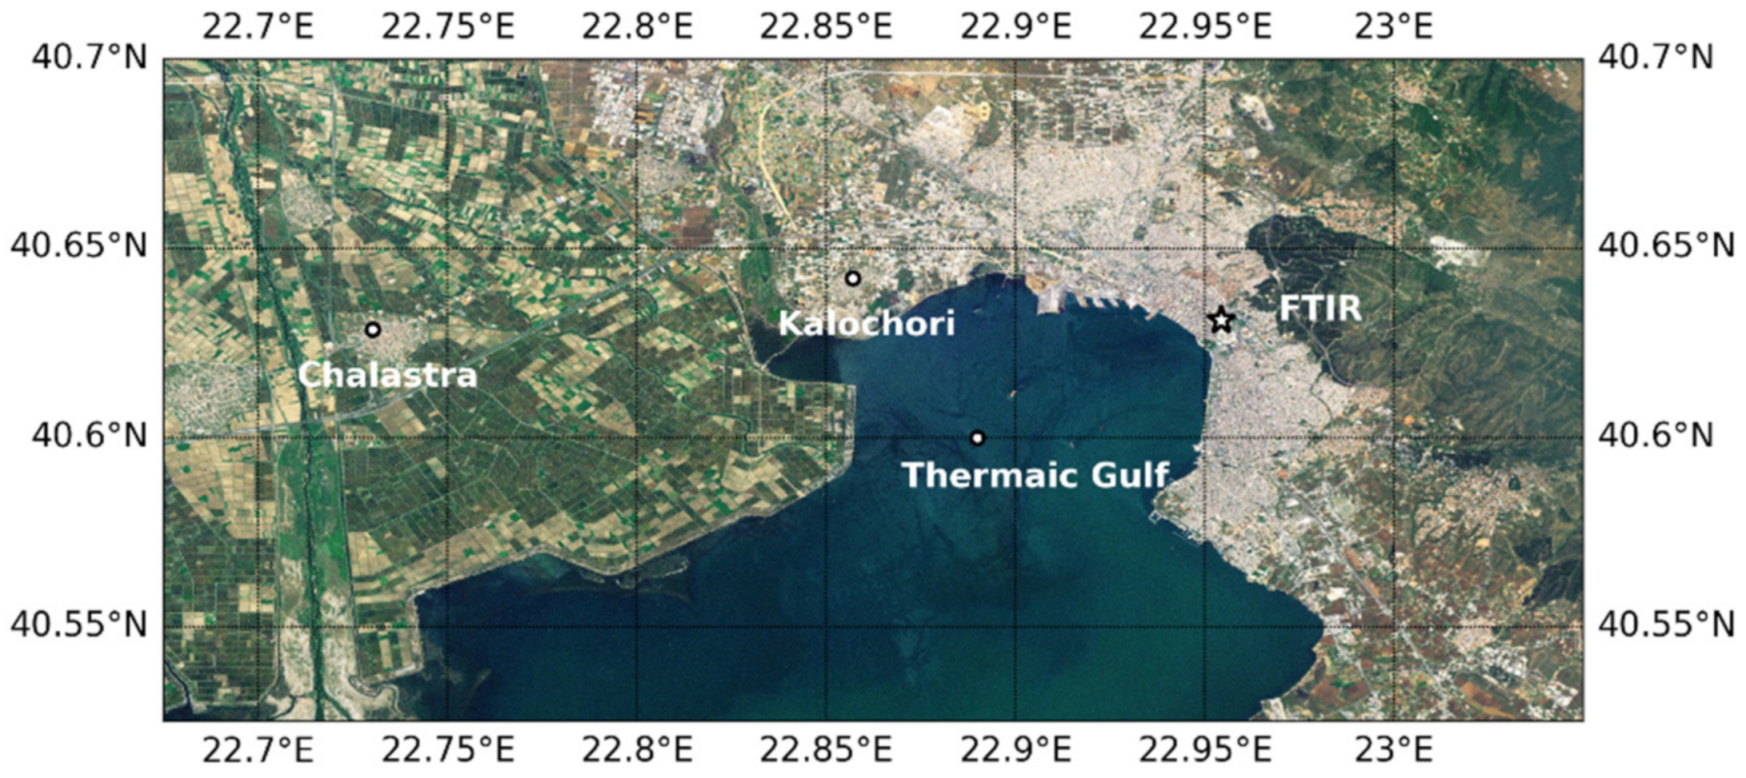
A new COCCON measurement site for greenhouse gas abundances has been established in Thessaloniki since January 2019, in cooperation with Karlsruhe Institute of Technology (KIT), Germany. With a population of around 1 million inhabitants in its metropolitan area, Thessaloniki is the second biggest city in Greece. It is situated in the northern part of Greece, built around Thermaic Gulf. Lowest temperatures are observed in January–February (mean: ~5 °C) and highest in July (mean: ~27 °C) (https://en.climate-data.org/europe/greece/thessaloniki/thessaloniki-1001/ accessed on 2 August 2021) and prevailing winds have north/northwestern directions. The main industrial area of Thessaloniki is situated 20 to 25 km northwest of the city. In around the same distance (20 km), west of Thessaloniki, near the delta of Axios River, lies Chalastra, the largest and most important rice production area in Greece and one of the biggest in Europe, with a total area of ~50,000 acres of rice paddies. In Figure 1, Thessaloniki urban sprawl and industrial area, as well as its surroundings that include the most important greenhouse gas emission sources are illustrated. Close by Thessaloniki, at the west perimeter of Thessaloniki rice paddies–a biogenic source of GHG- are located, between Kalochori and Chalastra. The position of the FTIR in downtown Thessaloniki is also shown.
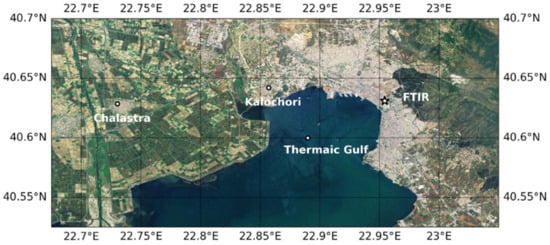
Figure 1.
A map showing the location of the FTIR instrument (star) within the Thessaloniki urban area, as well as the location of possible CH4 sources (rice paddies in the area between Kalochori and Chalastra), and Thermaic Gulf.
Measurements of column averaged dry air mole fractions of CO2, CH4 and CO used in this work were performed using the portable ground-based EM27/SUN, during 2019 and 2020. The EM27/SUN is a portable, ground-based, direct solar-viewing low resolution (0.5 cm−1) Fourier Transform spectrometer which is intended to measure direct solar radiation in the NIR spectral range. The recorded spectra contain signatures of atmospheric constituents (H2O, CO2, CH4, O2), which can be evaluated to retrieve the total columns. The design and function of the instrument is described in [9,10,18]. Details on the spectral analysis can be found in [8,19]. The FTIR is placed upon the roof of the Laboratory of Atmospheric Physics of Aristotle University of Thessaloniki (AUTH) (22.947°E, 40.629°N), around 60 m above sea level. Measurements are mostly performed on clear-sky days; however, it is possible for the FTIR–EM27/SUN spectrometer to perform with thin clouds around the solar disk, provided that the necessary criteria of spectra pre-processing (quality check in the pre-processing step) are met. The spectrometer entrance window was orientated towards the south and then, if necessary, the spectrometer was realigned in order to centre the solar disk in the field of view. The instrument function is not automated, it requires constant supervision in case of sudden rainfall and has to be moved outside and back inside each day. Observations are limited to during sunlight hours of the day. The measurements recorded with the FTIR last 58 seconds each, so there are several hundred measurements available in the course of the day.
The processing, quality control and spectra analysis procedure is described in [8,19]. A solar brightness fluctuation correction is performed [20] as a pre-processing step: the recorded interferograms are Fourier transformed using the Norton–Beer medium apodisation function [11] to reduce side-lobes around the spectral lines, and a quality control filter for interferograms with intensity fluctuations above/below 10% of the maximal signal range is applied.
Spectra were analysed using the PROFFAST retrieval algorithm, a line-by-line forward model, and retrieval code dedicated to COCCON data analysis that fits atmospheric spectra by scaling a priori trace gas profiles [9] with the measured instrumental line shape (ILS) as an input parameter. The instrumental line shape (ILS) of the EM27/SUN was optimised and characterised using open-path measurements as described in [9], using version 14.5 of the LINEFIT retrieval software [21].
TCCON data processing was performed using the GGG2014 Suite software package [7], which performs a scaling retrieval with respect to an a priori profile generated by the retrieval algorithm based on meteorological data (temperature, pressure and humidity) and then integrates the scaled profile over height to calculate the total column of the gas of interest. To be consistent with TCCON, these GGG2014-generated a priori files [6] were also used during processing for all three trace gases, as well as for temperature and pressure. Surface pressure and temperature values are provided by the Meteorological Station of the Aristotle University of Thessaloniki (https://meteo.geo.auth.gr, accessed on 22 June 2021). To achieve consistency between the spectroscopically derived mole fractions reported by TCCON with WMO units, airmass-independent calibration factors (AICFs) were included in the post processing of the trace gases retrievals. These factors are derived from a comparison of highly accurate in situ vertical gas profiles recorded from aircraft or by balloon experiments with TCCON data [22,23,24]. Furthermore, airmass-dependent correction factors (ADCFs) were also applied to correct for a systematic air-mass dependency originating from spectroscopic uncertainties and approximations by the radiative transfer model. This scaling method is required due to spectroscopic inaccuracies that may appear, especially in the O2 band. The COCCON AICFs are based on side-by-side comparisons with TCCON stations.
Dry-air mole fractions (DMF), denoted XG for each gas G, were computed using the retrieved O2 columns as a measure of the dry-air column, since the molecular oxygen mixing ratio in the atmosphere can be considered stable. The column abundances of gas G were converted to column-averaged DMFs by dividing them by the total column of dry air, which is calculated by dividing the molecular oxygen column with 0.2095. Errors that are common to the target gas (e.g., CO2) and O2 bands (such as miss-pointing or zero-level offsets) will largely cancel each other out in the column ratio [9]. In this work, the spectral regions used for column retrievals were 7765–8005 cm−1 for the O2 column, 6173 to 6390 cm−1 for CO2, 5897–6145 cm−1 for CH4 and the 8353–8463 cm−1 region for H2O.
2.2. S5P/TROPOMI Methane and Carbon Monoxide Observations
The Sentinel 5P satellite carries the TROPOspheric Monitoring Instrument, TROPOMI [25]. TROPOMI is a grating spectrometer that measures back-scattered solar radiation spectra in the nadir and off-nadir directions. With a swath of 2600 km and an increased spatial resolution of 7 × 5.5 km2 for the SWIR measurements since August 2019 (7 × 7 km2 previously), the spectrometer measures the SWIR range at 2305–2352 nm (4190–4340 cm−1) with a spectral resolution of 0.25 nm (0.45 cm−1), providing a daily global coverage of the Earth’s surface with ~7 × 10⁶ measured spectra [26].
TROPOMI provides CH4 column concentrations with high sensitivity to the Earth’s surface, sufficient accuracy and good spatiotemporal coverage, thus facilitating inverse modelling of sources and sinks. TROPOMI uses the Oxygen-A Band (760 nm) and the SWIR spectral range to monitor CH4 abundances in the Earth’s atmosphere [27,28]. To observe CO total column abundances, TROPOMI uses clear-sky and cloudy-sky Earth radiance measurements in the 2.3 μm range [29,30,31,32,33].
In this study, we used the daily TROPOMI CO & CH4 L2 data, OFFL, version 01.02.02 (from January 2019) to version 01.04.00 (in February 2021), publicly available via the Copernicus Open Data Access Hub (https://s5phub.copernicus.eu/ accessed on 22 June 2021). Both data products are filtered with a quality assurance value (qa) equal to 1.0, ensuring cloud-free observations. The data are constantly validated by the Mission Performance Center Validation Data Analysis Facility, VDAF, http://mpc-vdaf.tropomi.eu/ (accessed on 22 June 2021), who provide a quarterly validation report [34], as well as through recent TROPOMI-based validation papers (e.g., [28,35]). The S5P carbon monoxide and methane total column data are in overall good agreement with correlative measurements from the Network for the Detection of Atmospheric Composition Change (NDACC) and TCCON FTIR monitoring networks [36]. TROPOMI CO exhibits a positive bias of approximately 7 to 10%, against NDACC and TCCON stations, with a standard deviation of 5% on average, while for CH4, there is a negative bias between −0.3 and −0.7% ±0.6% respectively, meeting mission requirements of bias ± precision of less than 1.5% ± 1% for CH4 and 15% ± 10% for CO. The averaged correlation coefficient reaches 0.9 for both NDACC and TCCON.
Ref. [36] compared the TROPOMI CO and CH4 columns to mid-latitude TCCON and NDACC FTIR stations. For the station in Karlsruhe, Germany, the XCO comparisons have a relative mean bias of −0.55 ± 3.24%, while for Bremen, Germany, and Garmisch, Germany, this bias was found to be 5.12 ± 3.31% and 1.26 ± 4.25%, respectively, for the NDACC FTIR. The TCCON XCO datasets, for the same FTIR stations, report similar biases of −0.02 ± 2.95% for Karlsruhe, 3.33 ± 4.65% for Bremen and 3.83 ± 4.6% for Garmisch. A correlation coefficient higher than 0.9 was reported for most TCCON and NDACC stations studied by [36], indicating that the temporal variations in XCO column captured by the ground-based instruments are reproduced very similarly by the S5P XCO column. As to the XCH4 measurement, the NDACC Karlsruhe station has a relative mean bias of 0.32 ± 0.47%, while the TCCON station shows a negative relative mean bias of −0.36 ± 0.48%. A correlation of above 0.6 for most stations, which is mostly dominated by the seasonal cycle [36] was found.
2.3. Roadmap of the Methodology
In this work, we first present the FTIR timeseries (Section 3.1, Section 3.2 and Section 3.3), followed by a comparison to the TROPOMI satellite products, exhibiting good agreement within accepted bias and uncertainty (Section 4). Consequently, in Section 5, residuals are calculated by subtracting a 15-day moving average from daily mean values with the goal to detect short term variations and, if possible, common sources and sinks between species at a regional scale. CO2 and CO residuals are examined together to detect possible correlations, while carbon monoxide is also compared to methane on a seasonal basis. The main idea behind this comparison originates from the fact that common sources between X-gases could provide us with an overview of anthropogenic emissions impact. Our measurement schedule typically extends from morning to noon hours, covering a wide range of solar zenith angles (82.23° to 17.19°), and in most days to early afternoon hours as well. Late afternoon hours have been avoided because they show high uncertainty due to air mass effect. The daily mean values, calculated from 300–450 available scans per day, show good agreement with the noon values, due to a very small diurnal course of these gases, especially CO2 and CH4. The standard deviation shows almost no dependence on solar zenith angle, when examined for both summer and winter days. In Section 6, the conclusions of this work are provided.
3. Results
3.1. Column-Averaged Dry-Air Mole Fractions of Carbon Dioxide, XCO2
The seasonal variation of the dry-air mole fraction of carbon dioxide, XCO2, is that of a typical mid-northern-hemisphere site. Indicative sources of carbon dioxide (CO2) are fossil fuel combustion, transport, heating and industry and its sinks originate mainly from the terrestrial vegetation that binds CO2 during the process of photosynthesis. The amplitude of the seasonal cycle in CO2 is larger in the northern hemisphere than in the southern hemisphere, as northern hemispheric continents are the areas containing the majority of land plants covering the Earth’s surface and the seasonal changes in temperature result in large differences in plant photosynthesis from summer to winter. Photosynthesis results in decreased CO2 in the local growing season, whereas photosynthesis gradually ceases and CO2 builds up in autumn and winter [37]. Superimposed on the natural cycle of CO2 are the emissions from anthropogenic sources, with contributions from the domestic sector peaking during the heating period.
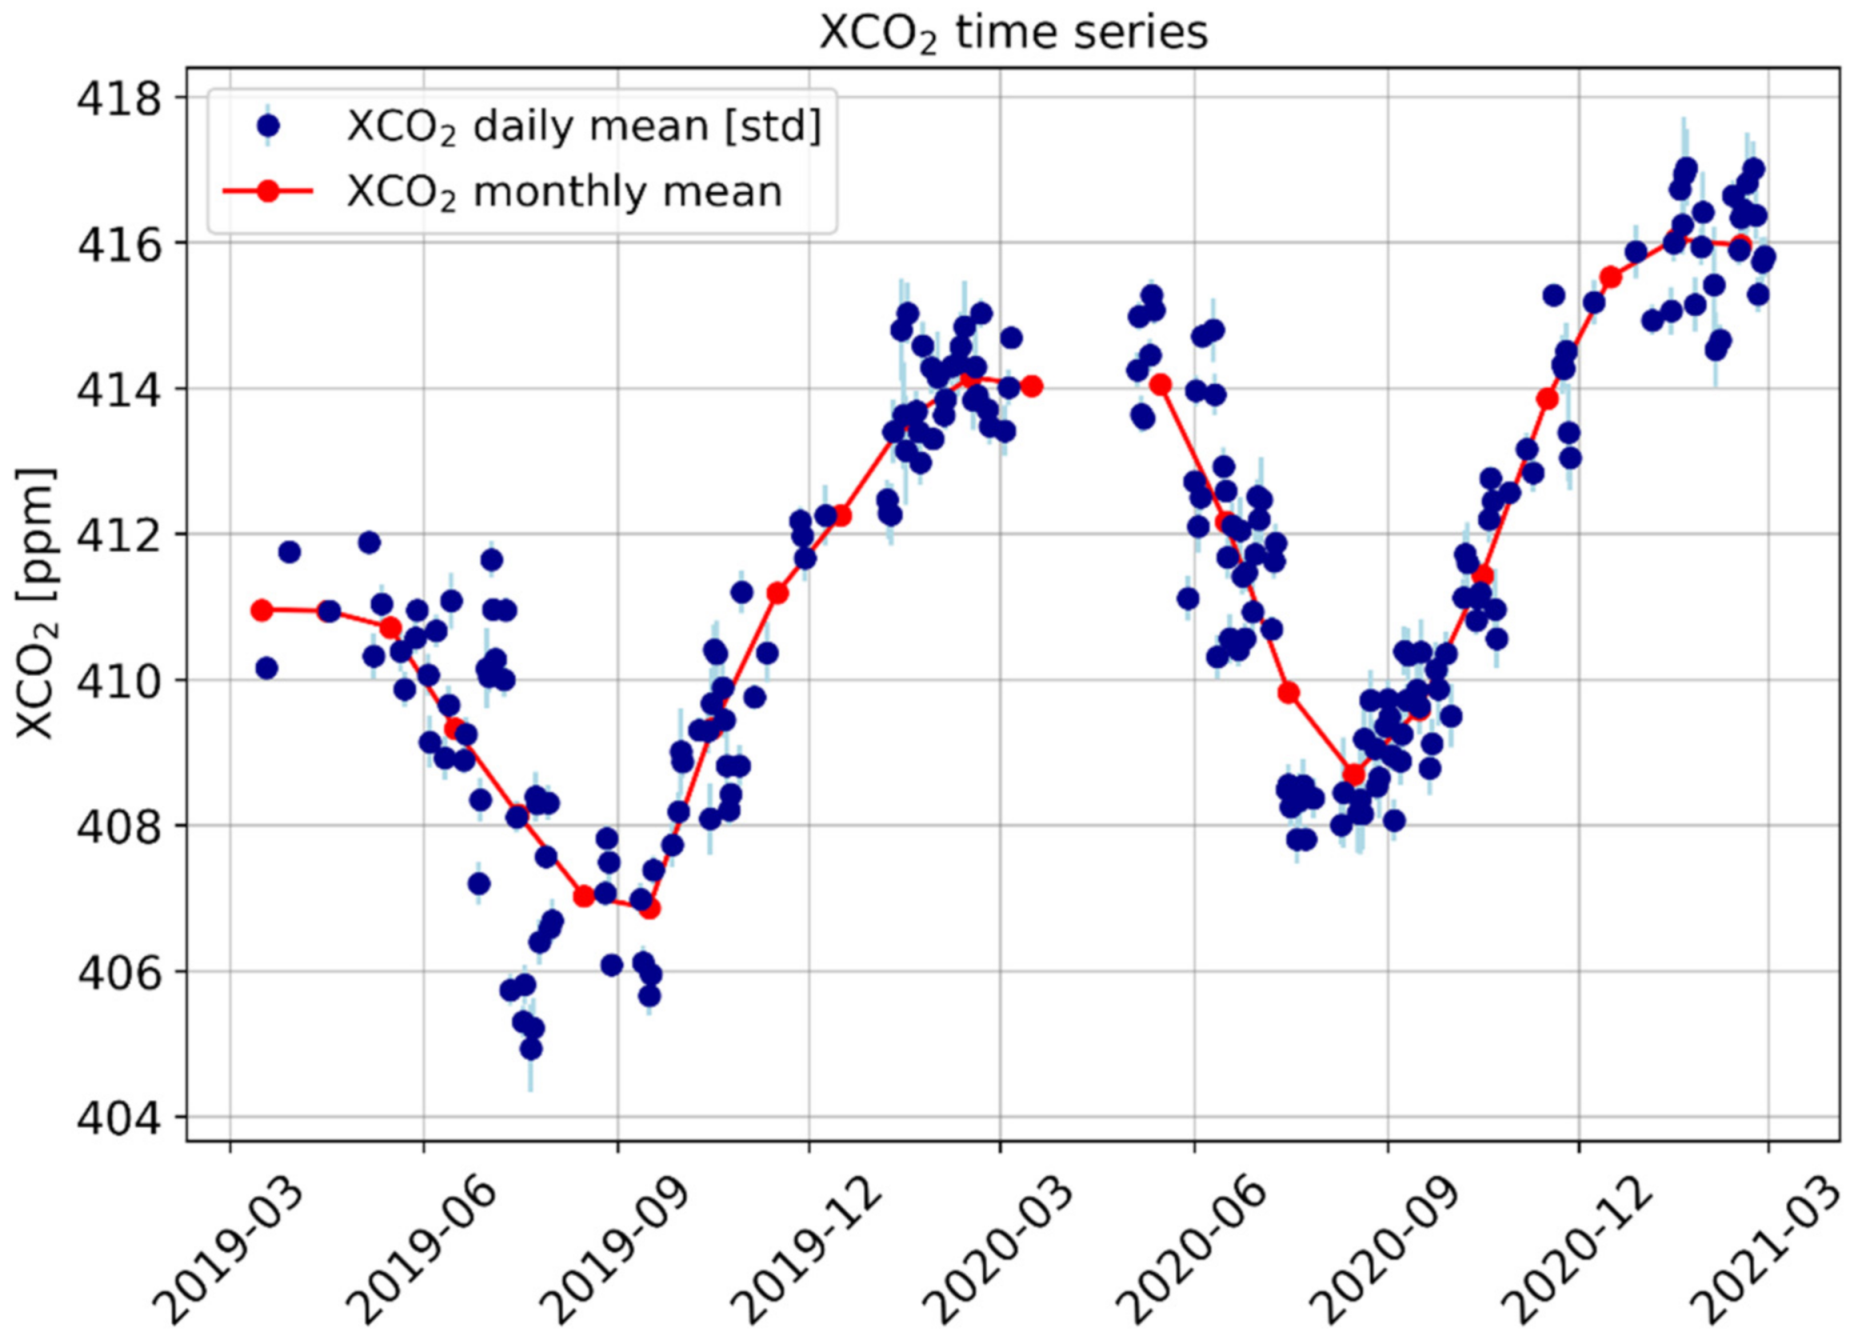
In Figure 2, the daily and monthly mean timeseries of XCO2 for the two-year period is presented. Largely associated with the biospheric cycle of photosynthesis and enhanced by anthropogenic emissions, XCO2 levels vary in the course of the year from a summer minimum of 404.94 ± 0.61 ppm in July 2019 and a maximum of 417.03 ± 0.72 ppm in January 2020, with an annual mean value of 408.76 ± 1.92 ppm, while these values rise to 408.14 ± 0.68 ppm in July 2020 and 417.32 ± 0.72 ppm in January 2021 and an annual mean of 411.99 ± 2.11 ppm, exceeding that of the previous year by 3 ppm. The daily mean peak-to-peak amplitude was found to be 12 ppm for the two-year period, corresponding to 2.9% of the annual mean value. Regarding XCO2 monthly mean values, there is an increase of approximately 3 ppm in the cold period and ~1.6 ppm in the summer period. The gap in observations between March 2020 and May 2020 is due to the Covid-19 pandemic restrictions when the instrument was not being operated. The trend and the annual cycle of XCO2 is in good agreement with earlier studies in Karlsruhe, Germany, where the yearly increase of XCO2 due to anthropogenic emissions of about 2 ppm can be seen from March 2014 to November 2017, as well as the seasonal cycle with a decrease of XCO2 of approximately 10 ppmv during summer due to photosynthesis, characteristic for mid latitude stations [8]. In Thessaloniki, the annual increase is found to be higher, ~2.8 ppm, for the two-year period of measurements. Another site of interest is the COCCON station at Xianghe, China an urban site 50 km to the east–southeast of Beijing and 70 km to the north–northwest of Tianjin [38]. XCO2 measurements in Xianghe follow the seasonal pattern of Thessaloniki measurements with a maximum monthly mean of 414.27 ± 0.94 ppm in April and a minimum monthly mean of 401.58 ± 1.32 ppm in August. The magnitude of the maximum monthly mean value in Thessaloniki is about the same as Xianghe (around 414 ppm in May 2020) while seasonal behaviour is similar to those at Pasadena, USA [39], Lamont, Canada [39] and Karlsruhe, Germany [40].
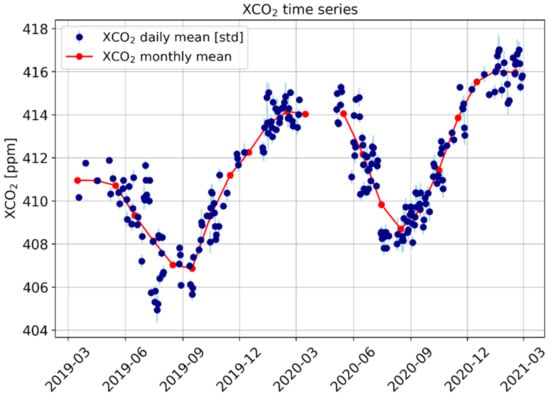
Figure 2.
Dry-air mole fraction of carbon dioxide (ppm) over Thessaloniki from March 2019 to February 2021. Daily mean and associated standard deviations are shown as blue dots and monthly means in red dots.
3.2. Column-Averaged Dry-Air Mole Fractions of Carbon Monoxide, XCO
Carbon monoxide (CO) has an indirect effect on global warming and plays a main role in atmospheric chemistry via its photochemical reaction sequence driven by hydroxyl radical (OH) that links methane (CH4), formaldehyde (HCHO), ozone (O3), and carbon dioxide (CO2). The reaction of CO with OH accounts for 40% of the removal of OH in the troposphere and governs the oxidising capacity of the Earth’s atmosphere [41]. Similar to CO2, combustion of fossil fuels, transport, domestic heating and the industrialisation of the area of Thessaloniki in recent years are the anthropogenic sources of carbon monoxide enhancing the increase in anthropogenic emission levels. The dominant sink of CO is oxidation with OH [42]. Since carbon monoxide’s chemical reaction with OH is generally the major sink for OH in mid-latitude locations, the concentration and distribution of OH in the atmosphere are often determined by CO [43]. Smaller OH indicates lower CO decrease so the inter-annual variability of OH perturbs the long-term trends of the CO levels [43].
The timeseries of the column-averaged dry-air mole fractions of carbon monoxide, XCO, is characterised by the large day to day variability due to local influences. The seasonal behaviour of carbon monoxide is similar that of XCO2, with higher values in winter indicating their common anthropogenic sources, while lower values in summer are governed by the strength of the OH sink. Isolated values can be associated with episodes such as forest fires and the investigation of such events is planned in the near future combined with an analysis of meteorological conditions and air mass transport.
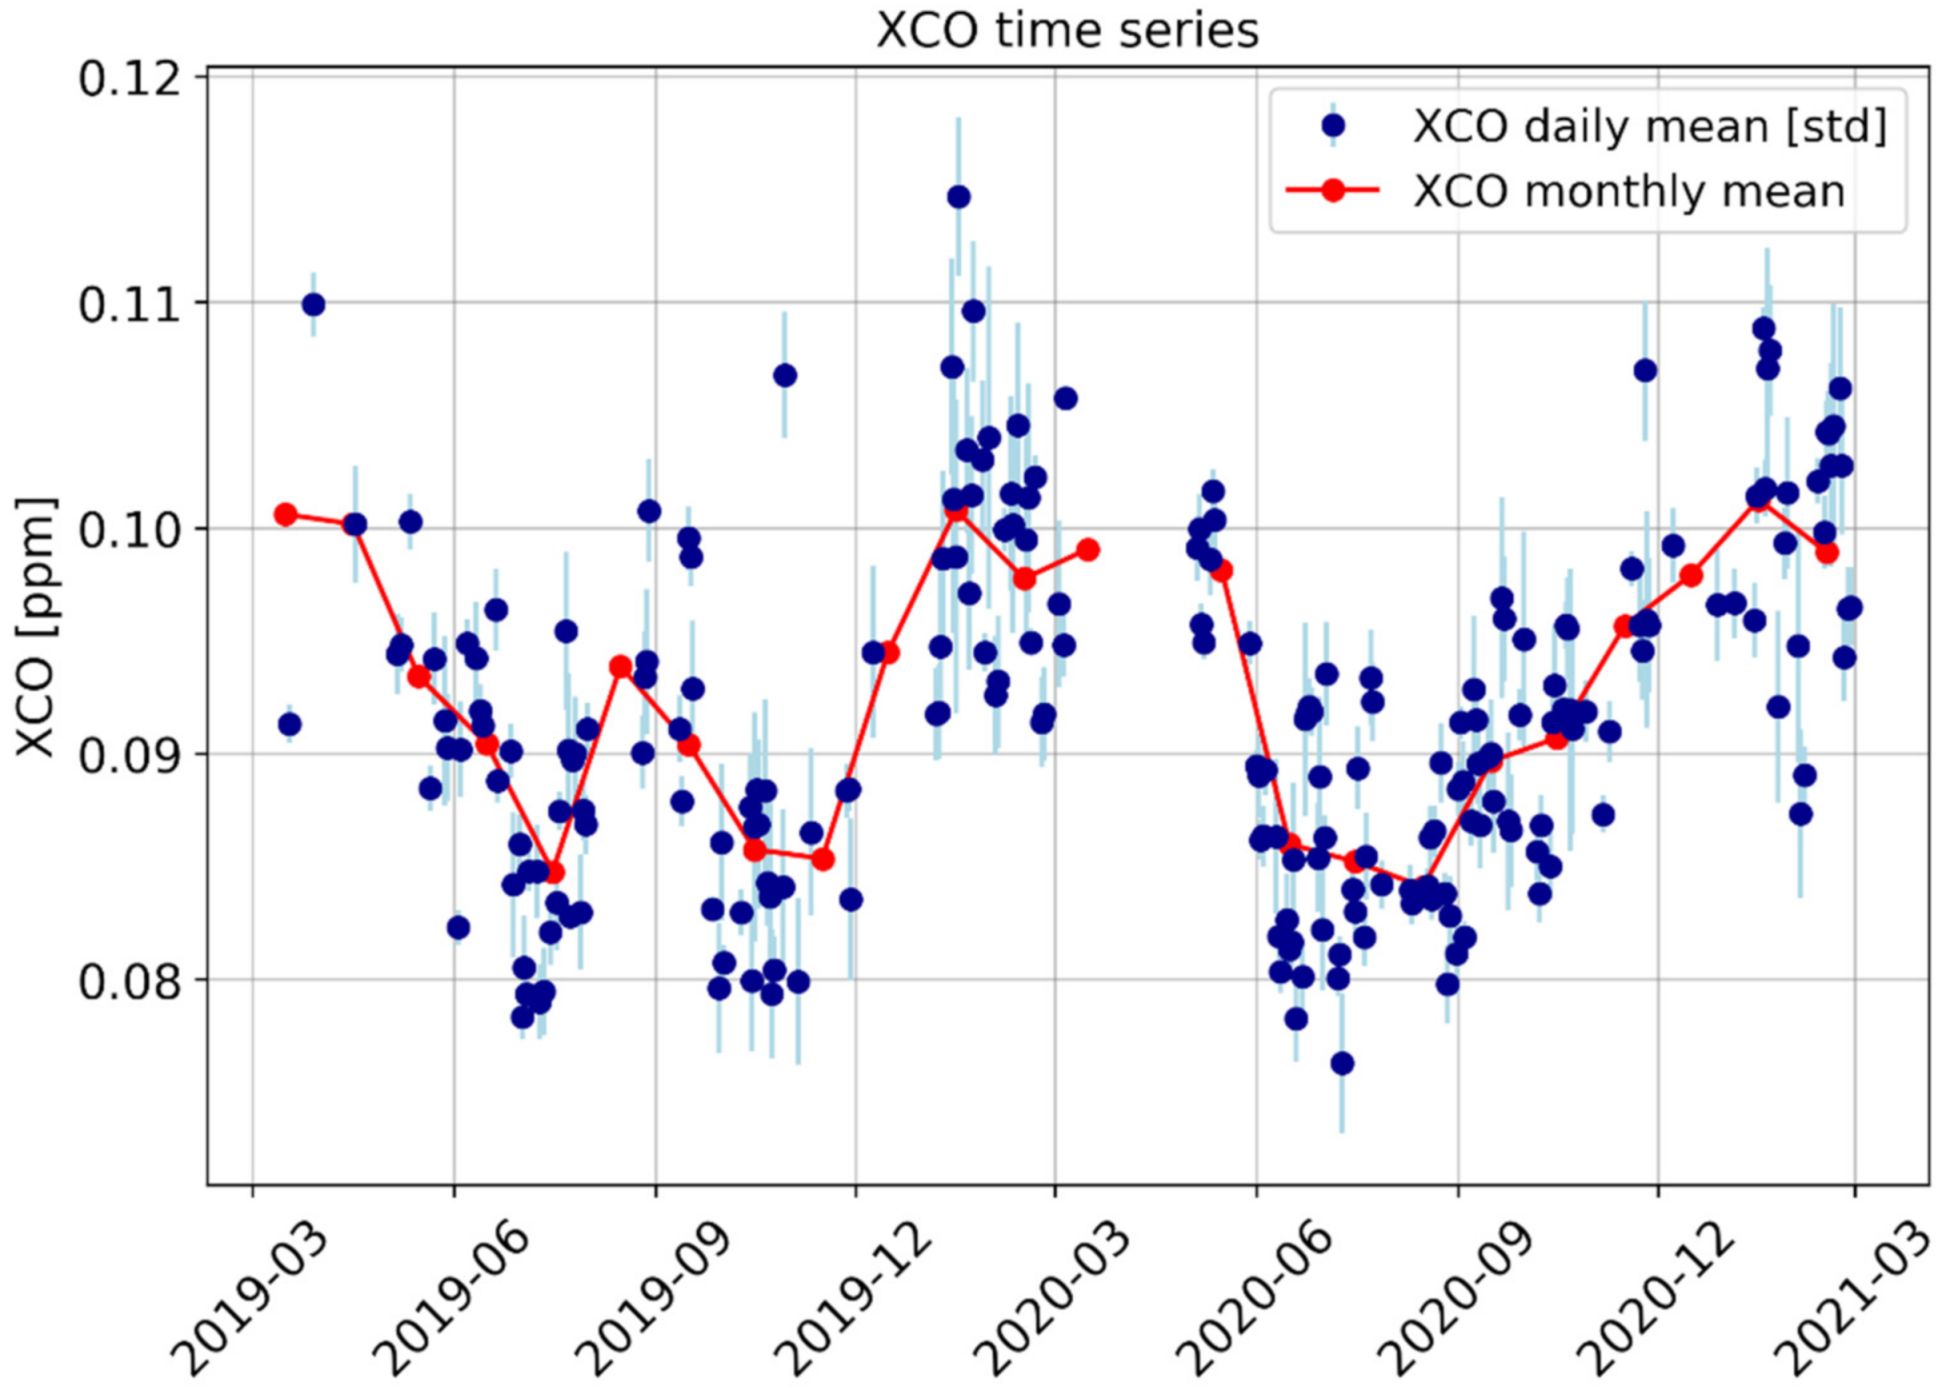
In Figure 3, the timeseries for the XCO load over Thessaloniki is shown. Monthly mean levels of 87.0 ± 5.0 ppb and 99.1 ± 5.0 ppb are calculated for the warm (spring, summer) and cold (autumn, winter) periods of 2019, respectively, similarly to the year 2020. A peak-to-peak variability of about ~40.0%, reflecting anthropogenic emissions, is revealed. The annual increase is limited to 2 ppb, which is not as profound as in CO2. The seasonal cycle of monthly average XCO is not clearly discernible, because it is concealed by the large daily variability due to local influences. Variations on a seasonal timescale show a late autumn minimum of 86.0 ± 3.0 ppb and a rise in winter (99.2 ± 4.1 ppb) that slightly increased in wintertime 2021 (99.7 ± 3.0 ppb) (Figure 3).
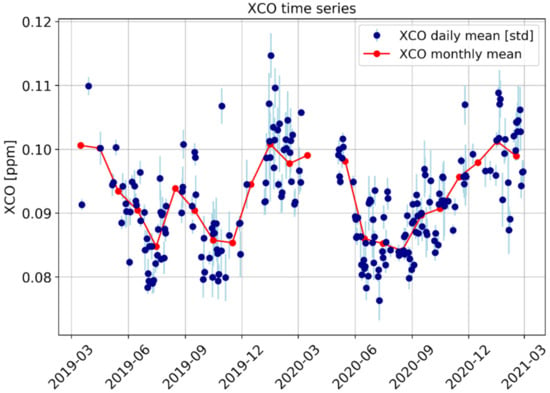
Figure 3.
Dry-air mole fraction of carbon monoxide over Thessaloniki from March 2019 to February 2021. Daily mean and associated standard deviations are as blue dots and monthly means in red dots.
Compared to other northern mid-latitude sites, the XCO at Xianghe is relatively high throughout the whole year, with background values of 90.0 ppb, and highs reaching up to 200.1 ppb, indicating that regional pollution sources are frequently observed at Xianghe [38]. Monthly mean values are quite stable over the year above 100.0 ppb and up to ~125.2 ppb, with higher values occurring in July 2018 and June 2019 that were much higher than those of Karlsruhe, Pasadena, Lamont and our station in Thessaloniki, where the maximum value of XCO was 114.0 ± 3 ppb.
3.3. Column-Averaged Dry-Air Mole Fractions of Methane, XCH4
Methane sources can be of natural origin such as the anaerobic decomposition of organic matter in natural wetlands, or of anthropogenic origin, like fossil fuel combustion, industry and energy, animal husbandry, and agriculture—especially rice cultivation or waste management [44]. The spatial distribution of these methane emissions sources is one of the factors influencing the release of this gas in the course of the year. On the other hand, one of the major removal mechanisms for OH is the reaction with CH4; therefore, as the levels of CH4 increase, the levels of OH could decrease. This could lead to increased lifetimes of CH4 and other important greenhouse gases [1]. During the summer time, CH4 chemical loss due to its reaction with OH is stronger and faster and constitutes the main sink of methane.
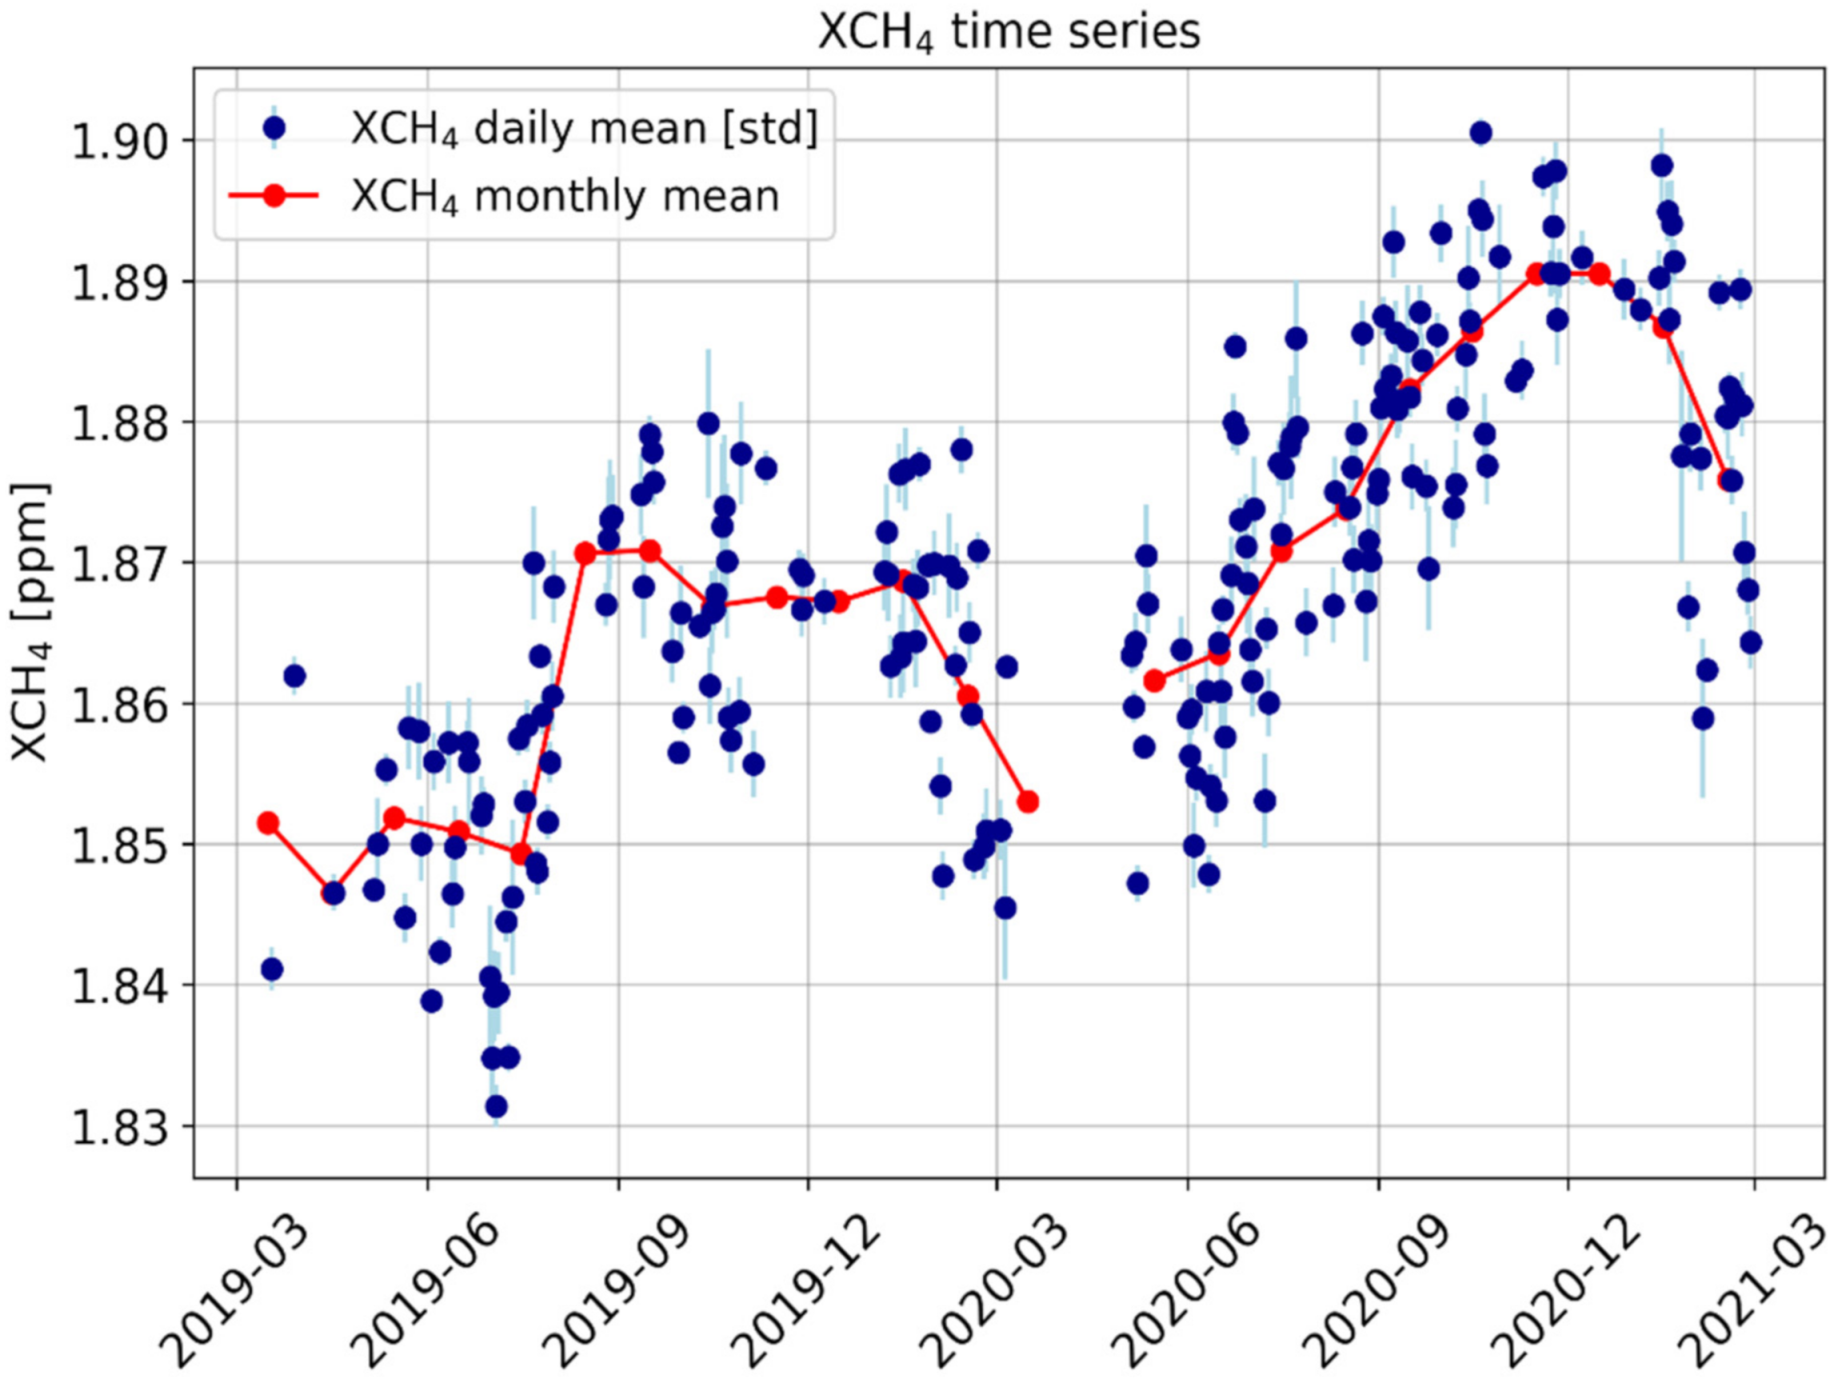
The XCH4 timeseries recorded in Thessaloniki (Figure 4), with an annual mean of 1.852 ± 0.001 ppm in 2019 and 1.871 ± 0.001 ppm in 2020, shows a plateau of lower values at the beginning of the year up until spring, rising during the summer, with the maximum appearing in autumn. The relative peak-to-peak change between the two years of observations is around 3%. This increase (during summer) can be attributed to both temperature rise and emissions from the rice cultivation period, which starts in May and is completed in late September–early October. The rice cultivation in the region of Chalastra represents approximately 70% of the rice production in Greece (http://www.evolution4.eu/images/PDF_files/Publications/Rice-Report.pdf, accessed on 1 August 2021). Given that the prevailing winds in the Thessaloniki area originate from this direction (west–northwest), extensive monitoring of meteorological conditions (wind speed—wind direction) is essential so that measured abundances can be associated with local emissions. Further research of possible methane sources is under investigation in the foreseeable future.
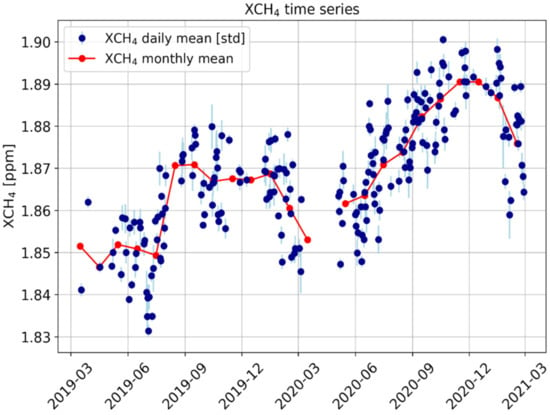
Figure 4.
Dry-air mole fraction of methane over Thessaloniki from March 2019 to February 2021. Daily mean and associated standard deviation in blue dots and monthly means in red dots.
Ref. [45], using satellite data, found maximum methane concentrations in September and October and minimum ones in March and April and suggested that the increase in methane concentration has a significant relationship with high humidity and high temperature, both the case for Greek summer months. As in the XCO2 case, XCH4 shows a similar pattern and a slight increase through these two years of measurements. XCH4 measurements in Karlsruhe, Germany also show a slight annual increase of about 0.01 ppm [16], while in Thessaloniki this increase is found to be 0.005 ppm, possibly attributed to methane sources around the city, such as rice paddies and cow breeding. With respect to similar mid-latitude FTIR stations (Xianghe, Pasadena, Karlsruhe and Lamont) we note that the XCH4 levels at Xianghe are low in spring and high in autumn and summer, with a maximum monthly mean of 1.89 ± 0.01 ppm in August and a minimum monthly mean 1.851 ± 0.01 ppm in March [38]. Thessaloniki seems to follow this pattern, as in spring we found low values (1.850 ± 0.008 ppm) of methane, which increase in the summer when the highest temperatures occur (1.898 ± 0.008 ppm). It is found that the seasonal cycle of the XCH4 at Xianghe is also very different from other sites at similar latitudes, as the observations at the other three stations (Pasadena, Karlsruhe, Lamont) show low values in summer and high values in autumn and winter [38]. This can mainly be attributed to local contributions to short-term variability, which can enhance or dampen the long-term mean average. The seasonal cycle of the XCH4 at Xianghe (a suburban area surrounded by croplands and irrigated croplands), for example, is probably affected by Beijing, an urban area that is located 50 km to the north-west of Xianghe.
In Table 1, a summary of the minimum and maximum values of the daily mean values with their standard deviation, peak-to-peak amplitude of their seasonal variation and the annual mean difference between 2019 and 2020 is provided for each trace gas, including the growth rate for each compound. XCO2 maximum and minimum values reflect the different behaviour of CO2 in the winter and summer period. The carbon dioxide annual growth is more pronounced than that of CO and CH4. However, they also exhibit a slight increase in the second year of measurements, but not to such an extent as carbon dioxide.

Table 1.
Minimum and maximum values of the two-year timeseries of the daily means with their standard deviation, range of variability, yearly difference and growth rate are presented for XCO2, XCO and XCH4.
In Table 2, the features of each site are presented.

Table 2.
Site features of Pasadena, Lamont, Karlsruhe, Thessaloniki and Xianghe are listed in the table below.
In summary, in this section, the timeseries of column-averaged dry-air mole fractions of XCO2, XCO and XCH4 were presented. Daily mean values together with monthly mean values were depicted in order to understand the sources and sinks of greenhouse gases using the FTIR spectrometer. A clear seasonal variation of XCO2 was observed during this two-year period of measurements, with lowest values of 404.94 ± 0.61 ppm in summer and highest values 417.03 ± 0.72 ppm in winter. Low XCH4 concentrations were observed in spring (1.830 ± 0.001 ppm), which rose in the middle of summer (1.850 ± 0.001 ppm) to reach their maximum in November–December. Methane showed a slight annual increase, as well as a similar pattern to that of XCO2 seasonal formation. For XCO there was no clear seasonal variation, although the day-to-day variability was strongly reflecting the local influences from anthropogenic sources. XCO peak-to-peak variability of the daily mean values, in the course of the year, was ~40.0%. Additionally, some isolated XCO values may indicate fire episodes, and will be investigated in a subsequent work. Regarding other COCCON sites, we found a good agreement in the seasonal variation with our station in Greece. These previous studies showed that the seasonal behaviour was similar to those in Pasadena, Lamont and Karlsruhe, which are located in the northern mid-latitude zone. Similar day-to-day variations were observed among XCO2, XCH4 and XCO [38].
4. Comparison with Sentinel-5P TROPOMI
In this comparison study, dry-air column mixing ratios of CO and CH4 measured by the EM27/SUN FTIR are collocated with TROPOMI total columns within an hour from the satellite overpass over Thessaloniki. The spatial collocation criterion is set to a radius of 100 km for methane and 50 km for carbon monoxide. Thessaloniki is an urban, polluted site, surrounded by a rural/semi-rural environment, and local influences, such as combustion of fossil fuels, especially for transportation, should be captured. Therefore, we chose a radius of 50 km around the city in order to capture local influences that caused primarily by anthropogenic emission sources such as combustion of fossil fuels. Satellite measurements are restricted to those with a quality assurance (qa) index of 100%, ensuring cloud-free days. For both CH4 and CO, the OFFL TROPOMI products were used, and in the case of methane, non-bias correction was carried out for both species. Bias-corrected CO TROPOMI retrievals were not available while the bias-corrected CH4 TROPOMI retrievals show a significantly higher bias over Thessaloniki. In view of the soon-to-be-released v02.02.02 of the datasets, we opted to also analyse the non-bias corrected CH4 data for reasons of consistency in this work. As mentioned previously, mission requirements involve a bias and precision of less than 1.5% ± 1% for CH4 and 15% ± 10% for CO.
4.1. Methane
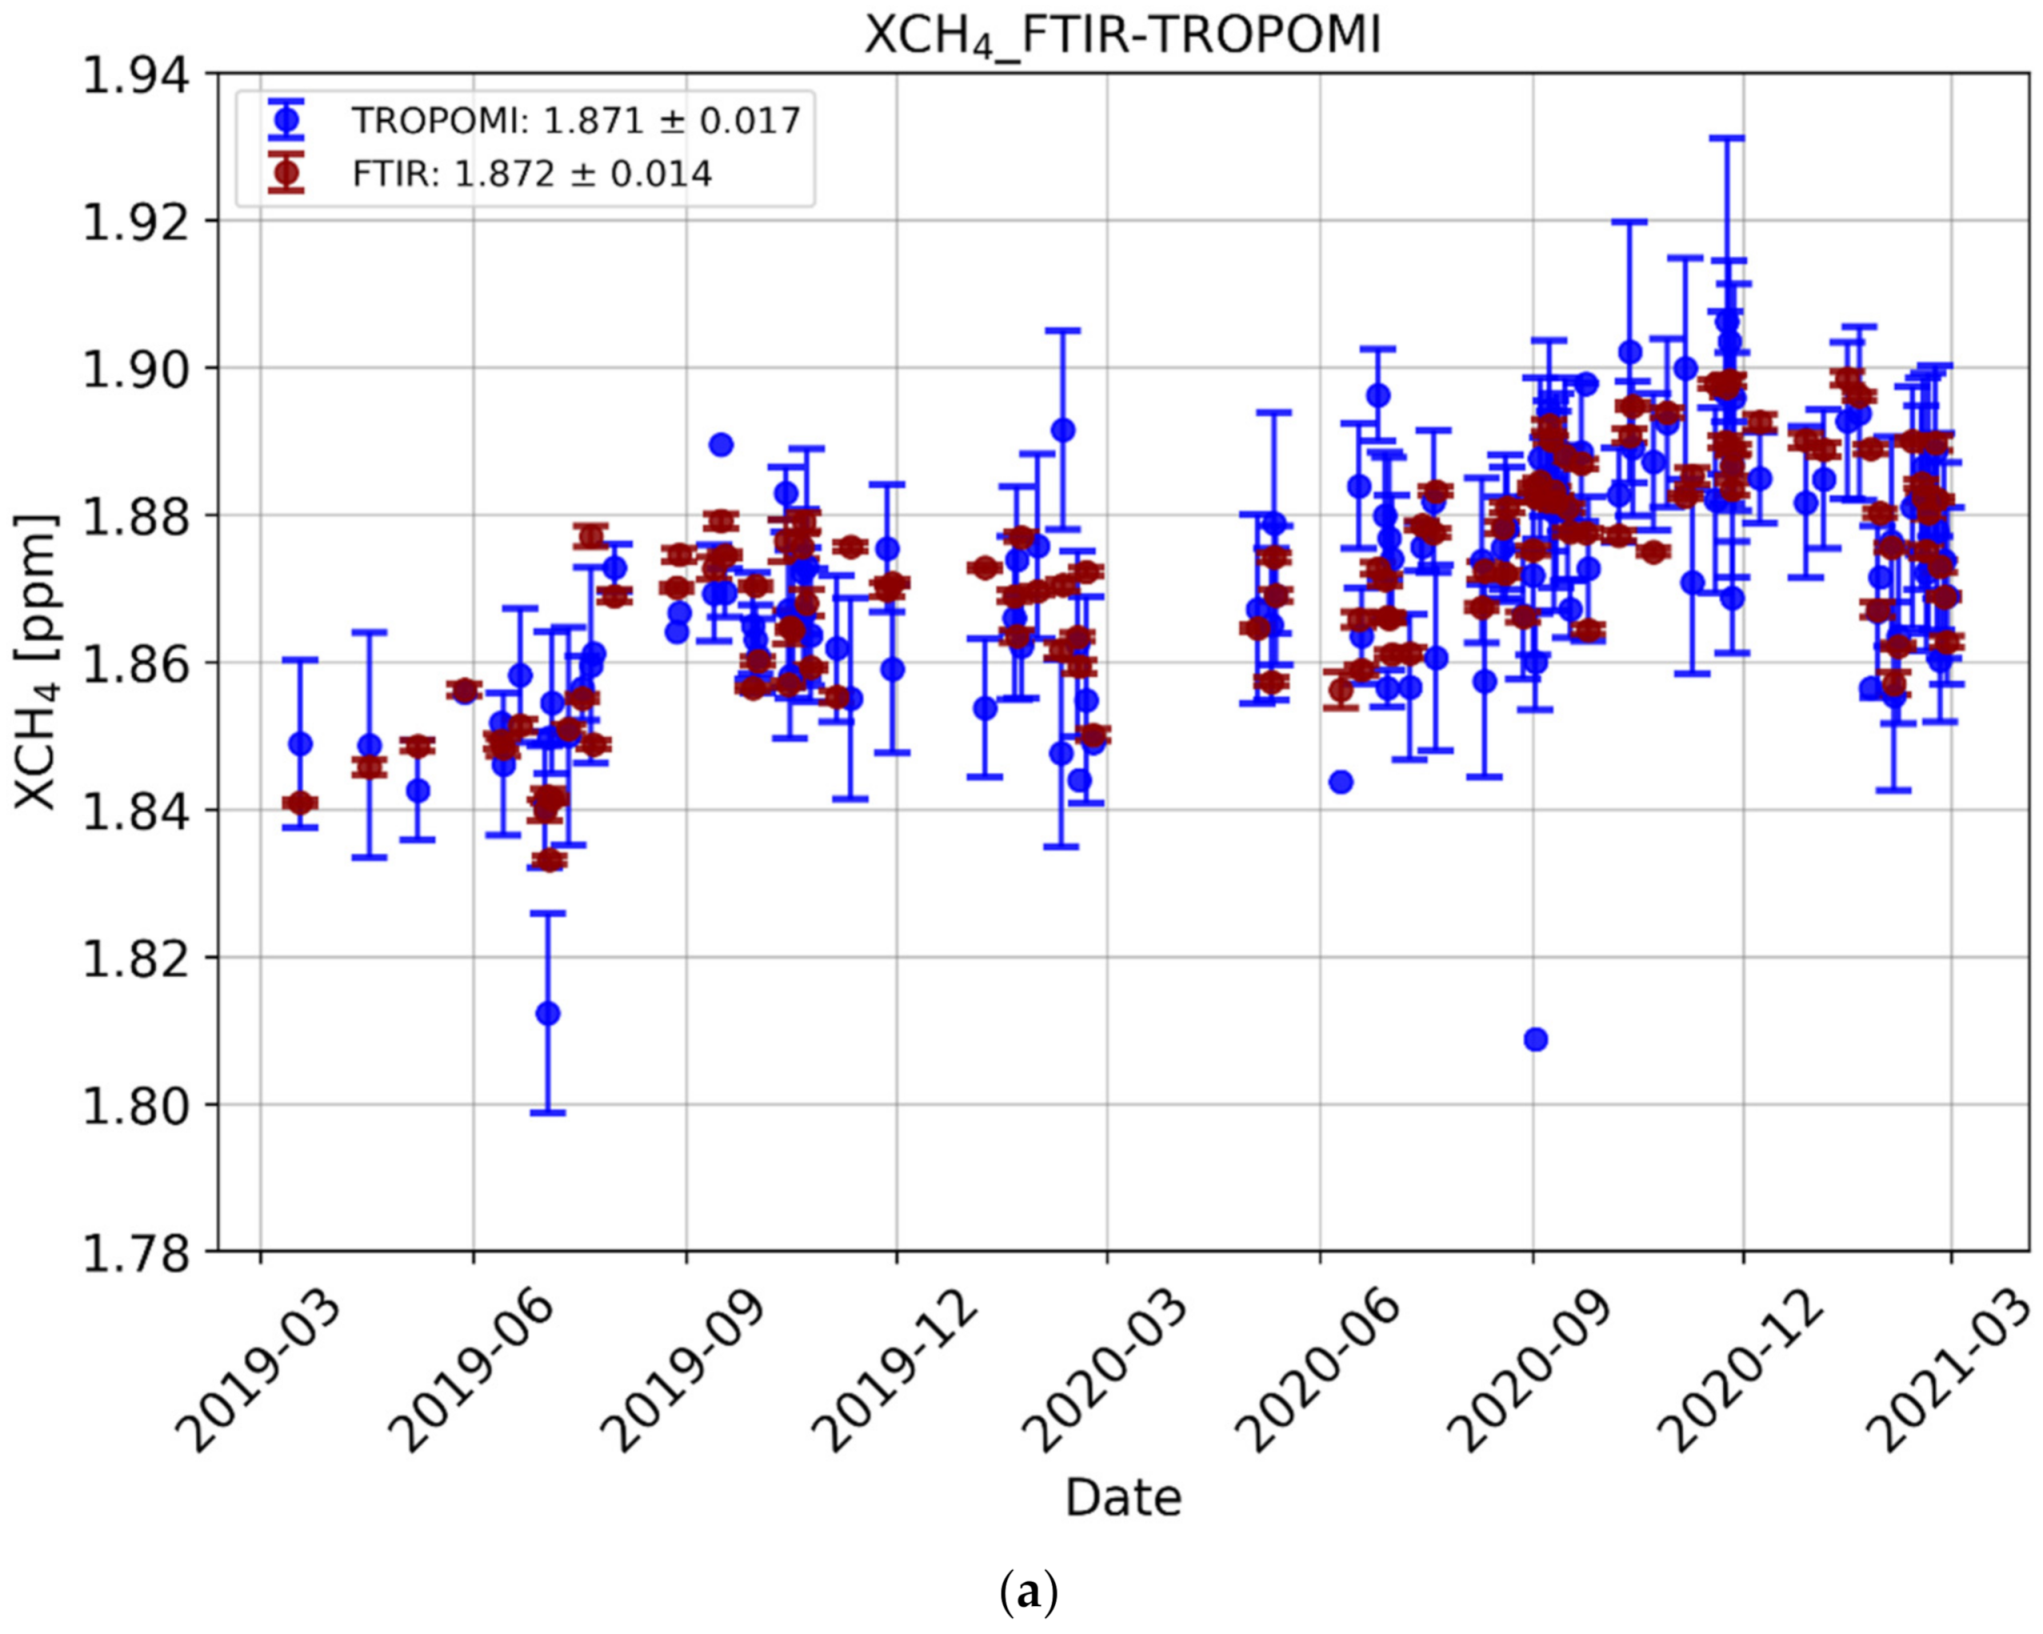
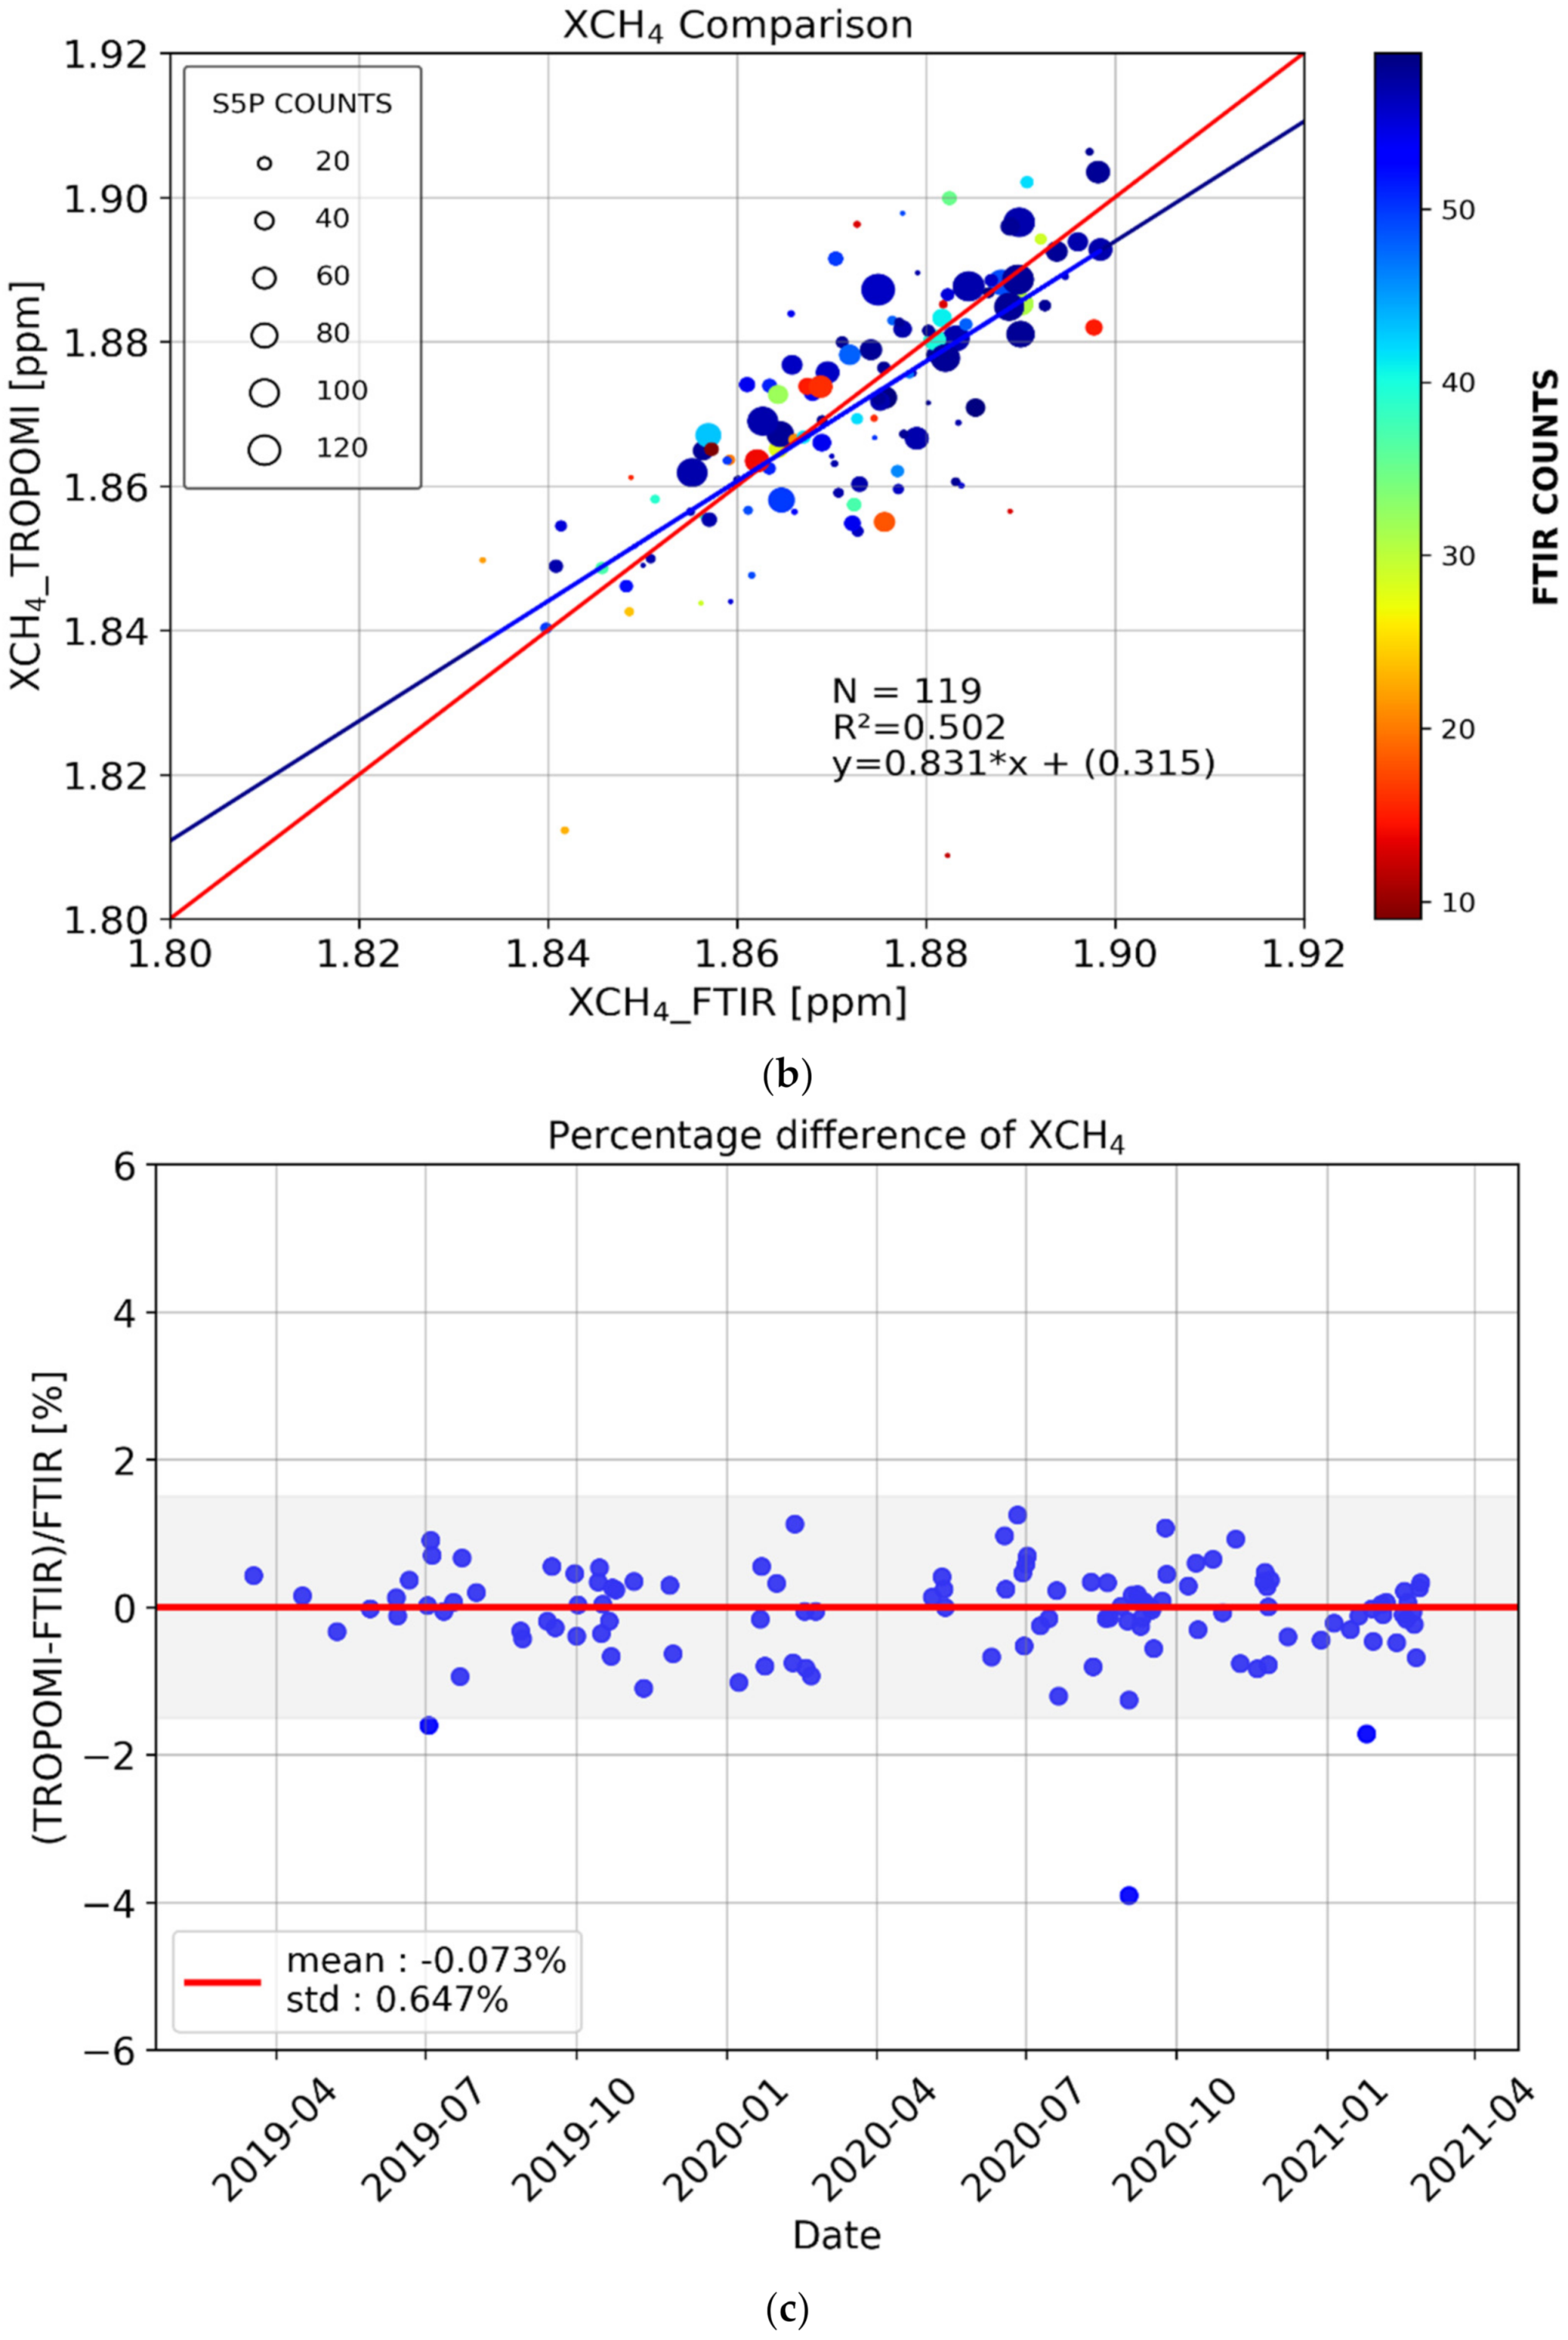
In Figure 5, we present the comparison between the methane columns measured by the FTIR and those reported by the TROPOMI instrument. Overall, we observe an excellent agreement between the two datasets for these first two years of measurements in Thessaloniki. In Figure 5a, S5P and FTIR timeseries of daily mean values are shown and have almost the same mean value of 1.871 ± 0.017 ppm and 1.872 ± 0.014 ppm, respectively. TROPOMI captures the temporal XCH4 variability, both the seasonal cycle with the profound summer increase as well as the overall higher values from 2019 to 2020. Both datasets report a slight annual increase of about 0.015 ± 0.085 ppm for TROPOMI and 0.016 ± 0.012 ppm for the FTIR for the second year of operations. In Figure 5b, the scatter plot of one-to-one comparison between S5P and FTIR is presented. The correlation coefficient is 0.502 for 119 coincident measurement points with a slope close to unity, 0.831. The colour bar indicates the number of FTIR measurements for each day of interest while different size indicates the number of S5P counts. Figure 5c provides the calculated percentage difference between the S5P and FTIR data. The biannual mean bias ± precision is calculated to be −0.07 ± 0.64%, well within mission requirements.
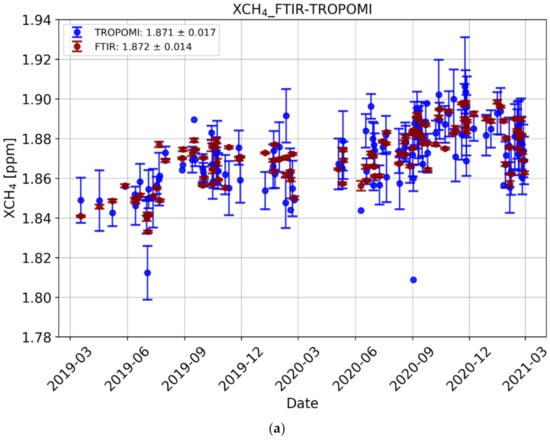
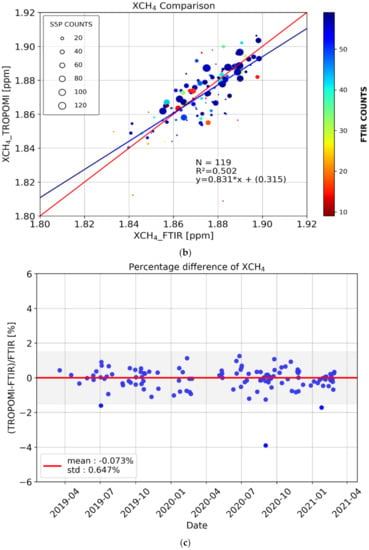
Figure 5.
(a) XCH4 daily mean of dry-air column mixing ratios measured by TROPOMI (dark red) and FTIR (blue) under clear-sky and cloudy atmospheric conditions, with associated temporal standard deviation. (b) Scatter plot of the two datasets, with the y = x line in red and the linear regression line in blue. Colours and the size of the open circles indicate the number of coincident measurements. (c) Percentage difference between satellite observations and FTIR measurements as (satellite–FTIR)/FTIR.
Compared to other mid-latitude NDACC FTIR stations, such as those in Bremen, Garmisch and Karlsruhe, Germany, we find a good agreement with our COCCON site in Thessaloniki. Karlsruhe shows a relative mean bias of −0.35 ± 0.52%, while Bremen and Garmisch biases were found to be 0.76 ± 1.45%, and −0.39 ± 0.54%, respectively [46]. All sites show a slight annual increase in methane concentrations from 2018 until 2021. We should mention that NDACC–S5P comparison takes into account total columns within three hours from the satellite overpass within a radius of 100 km.
4.2. Carbon Monoxide
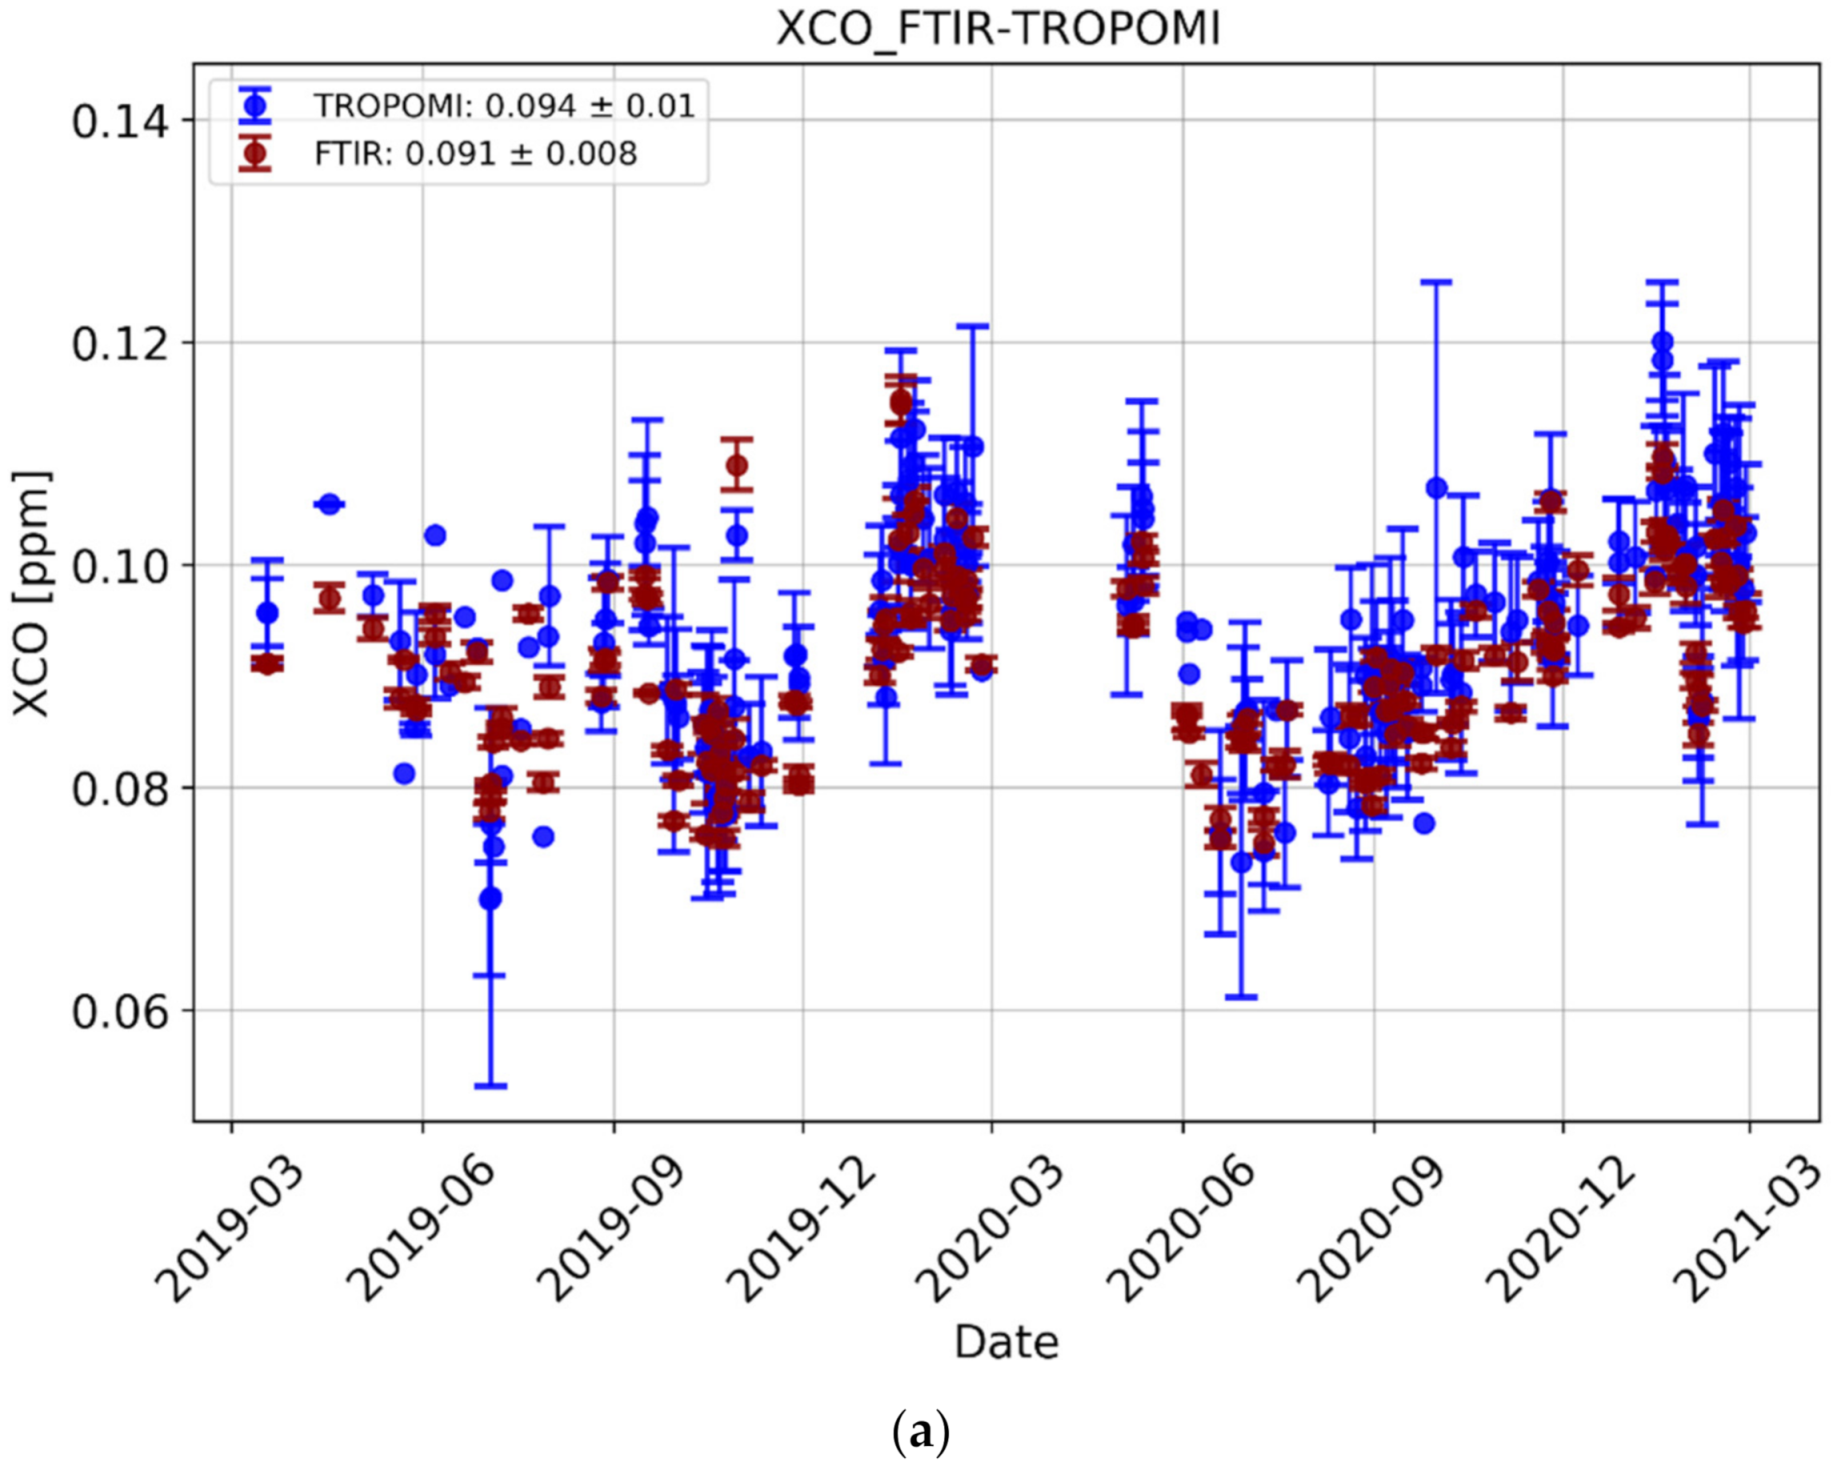
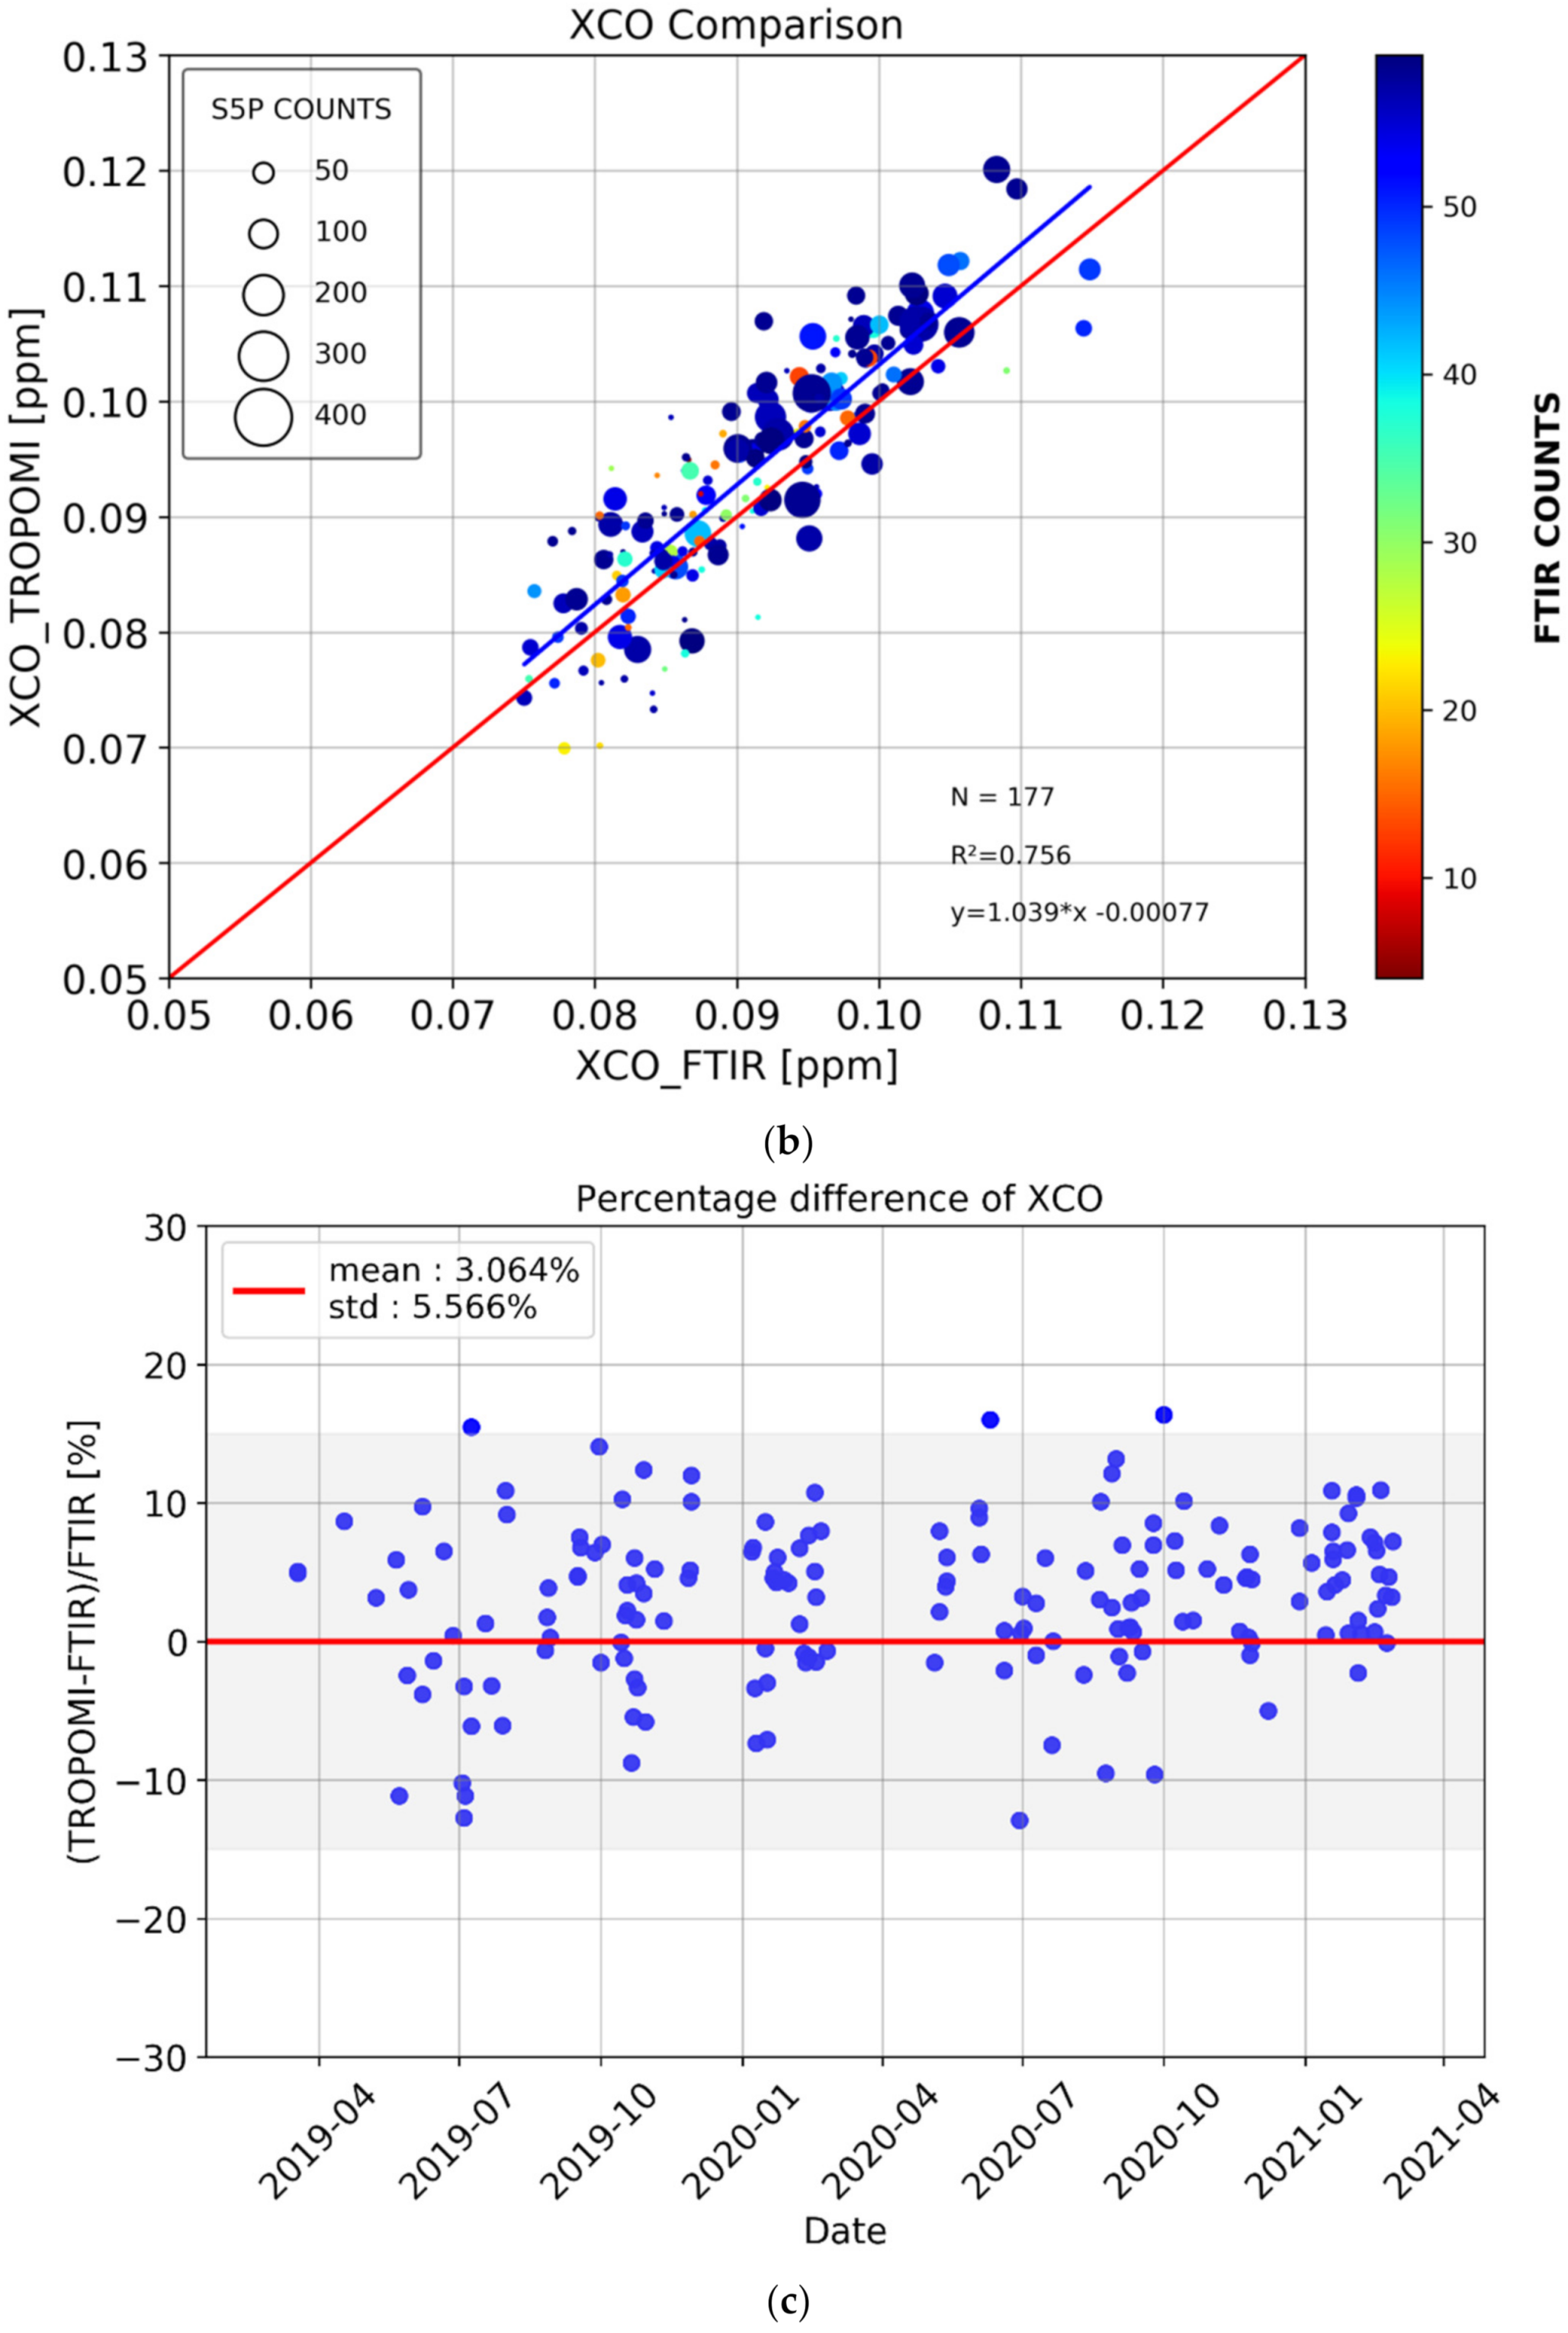
The comparison between EM27/SUN and TROPOMI timeseries for the carbon monoxide product shown in Figure 6a shows again that short-scale temporal variations in the CO column captured by ground-based instruments are well reproduced by the satellite observations. XCO values are higher in the spring and winter season due to anthropogenic emissions (incomplete combustion of fossil fuels as well as industrial activities). A mean value of 0.094 ± 0.010 ppm is calculated for S5P XCO measurements, while 0.091 ± 0.008 ppm is found for FTIR, showing their excellent agreement. High isolated XCO values may indicate fire episodes caused by air-mass transport captured by TROPOMI. The correlation plot for XCO data between collocated S-5P data and FTIR data for the 2019–2021 period is illustrated in Figure 6b. The correlation coefficient is close to 0.75 for the 177 common values, with a slope that is almost equal to unity. The colour bar denotes the number of FTIR measurements for XCO product per day of interest, while different size indicates the number of S5P quality-available scans. The total mean relative bias and precision for the two-year period is 3.06 ± 5.56%, falling well within the mission requirements (Figure 6c), while no seasonal dependency is apparent.
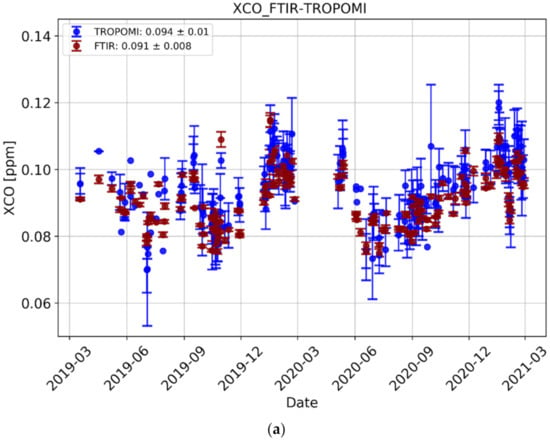
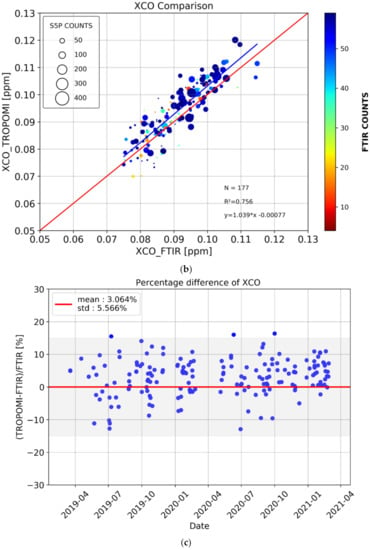
Figure 6.
(a) XCO daily mean of dry-air column mixing ratios measured by TROPOMI (dark red) and FTIR (blue) under clear-sky and cloudy atmospheric conditions, with associated temporal standard deviation. (b) Scatter plot of the two datasets, with the y = x line in red and the linear regression line in blue. Colours and the size of the open circles indicate the number of coincident measurements. (c) Percentage difference between satellite observations and FTIR measurements as (satellite–FTIR)/FTIR.
The Bremen NDACC station shows a similar pattern for XCO to the Thessaloniki timeseries. TROPOMI XCO values are slightly overestimated against the FTIR values in most cases with a great correlation (slope = 1.11, R2 = 0.85), while Garmisch shows a slightly worse correlation than our site in Thessaloniki (slope = 0.7, R2 = 0.54).
In summary, in this section, we compared XCH4 and XCO products between S5P TROPOMI observations and ground-based FTIR measurements in Thessaloniki. Both gases show a good agreement with slopes close to unity in both cases. The mean value of XCO was found to be the same (0.09 ppm) for both FTIR and S5P measurements. Methane also shows very similar mean values, around 1.870 ppm, with a standard deviation of 0.014 and 0.017 for the FTIR and S5P, respectively. The S5P satellite generally measures slightly higher atmospheric XCO than the FTIR, with a relative mean bias of 3%, standard deviation of 5.5% and R2 of 0.756 over Thessaloniki, while for both methane and carbon monoxide there is no seasonal bias dependency. Finally, when we compare the findings of the Thessaloniki FTIR station and other mid-latitude FTIR sites, a good agreement for both gases is found.
5. Study of the Co-Variability of XCO2, XCO and XCH4
In this section, we apply a method for identifying common sources and sinks of XCO2, XCO, XCH4 using the FTIR spectrometer observations. The observed timeseries of XCO2, XCO and XCH4 capture long-term trends with regular or irregular seasonal variations. We used the daily averages in order to obtain a 15-day moving average for the two years of measurements. Removing this 15-day moving average curve from the original data (daily mean values of X-gases) may filter out these seasonal variations and extract short term variations due to local influences for each corresponding gas. We refer to these differences as ΔX, or residuals. We then compared the residuals of ΔXCO to those of ΔXCO2, but also those of ΔXCO to ΔXCH4, on a seasonal basis. These comparisons have been performed with the goal to estimate the common emission sources of the Thessaloniki urban region, revealed by FTIR observations.
In the following Sections, the XCO residuals are compared with both ΔXCO2 and ΔXCH4 in order to investigate the relation with each one on a seasonal and daily timescale.
5.1. Carbon Monoxide and Carbon Dioxide Co-Variability
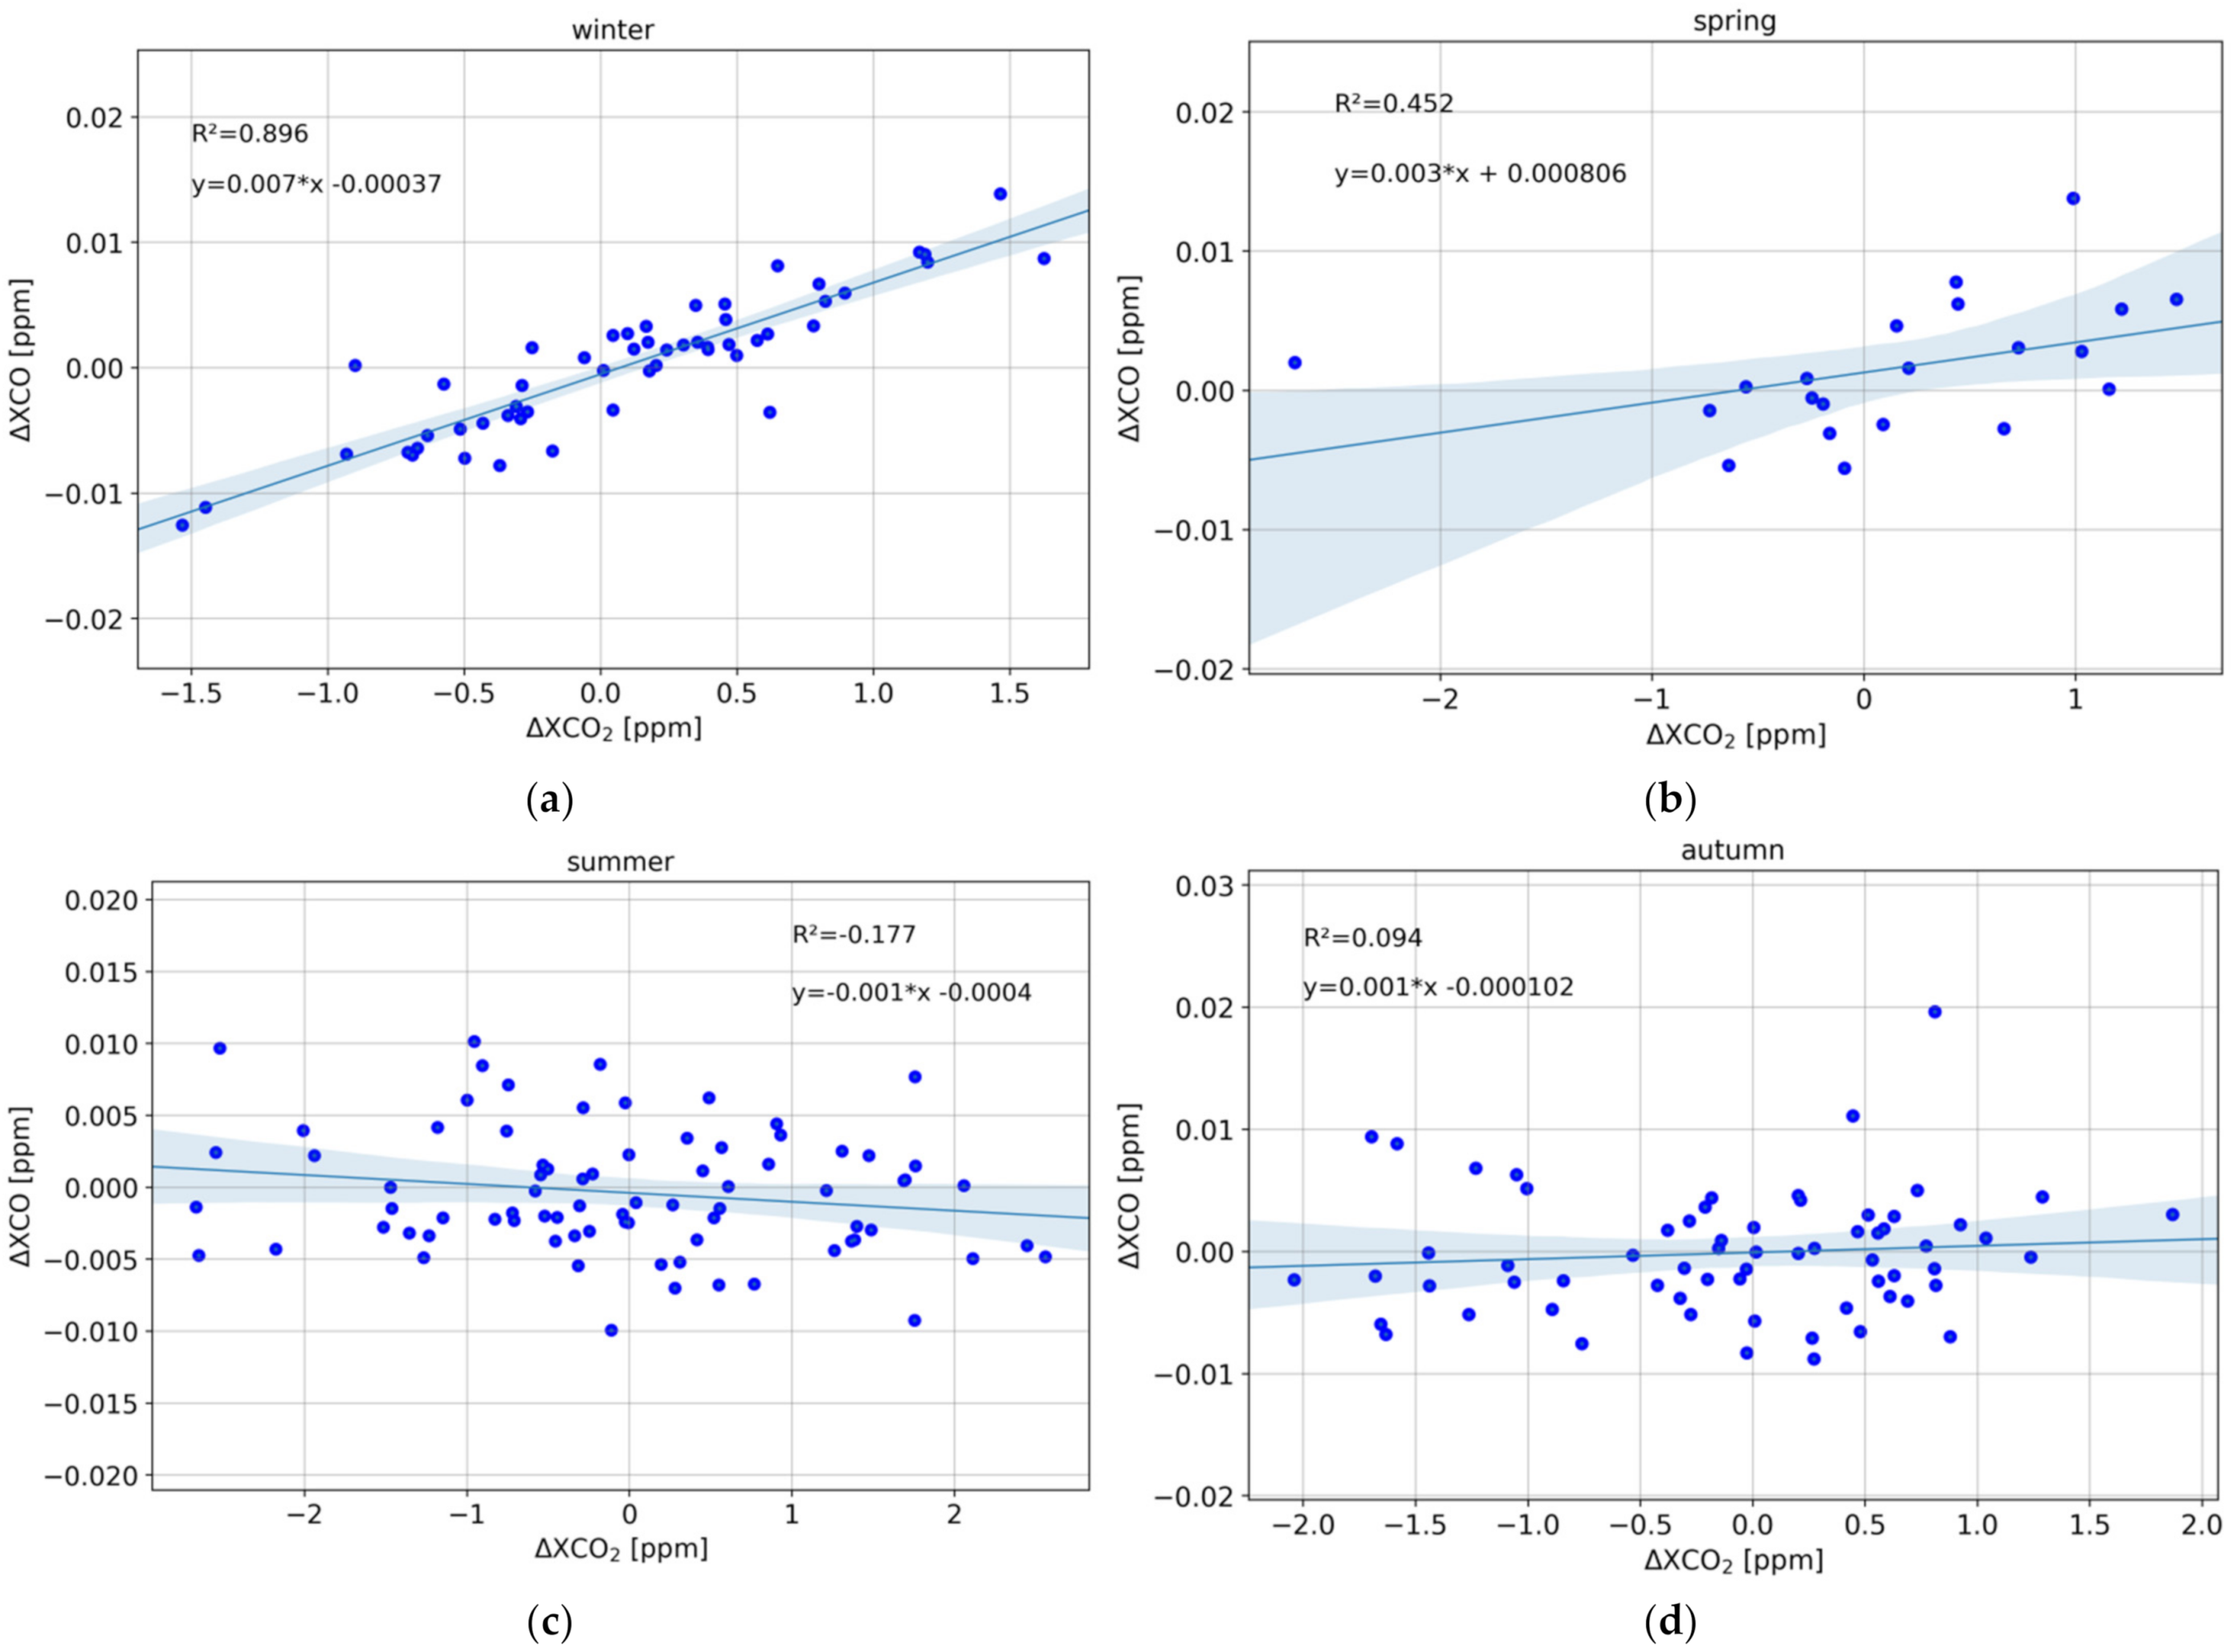
In Figure 7, the ΔXCO2 and ΔXCO are compared per season, in the form of scatter plots. An excellent agreement is found for the winter months, with a correlation coefficient of 0.898 and narrow confidence intervals, indicating the strong influences of fossil fuel combustion as common emission sources for the two gases. The correlation is not as strong, although it is present, during springtime (R2 = 0.418), while no correlation is found for the summer and autumn months. The ΔXCO2 variability is stronger than the ΔXCO one, as summer carbon dioxide emissions are dominated by the biosphere from June to September, with the highest decrease found in the summer.
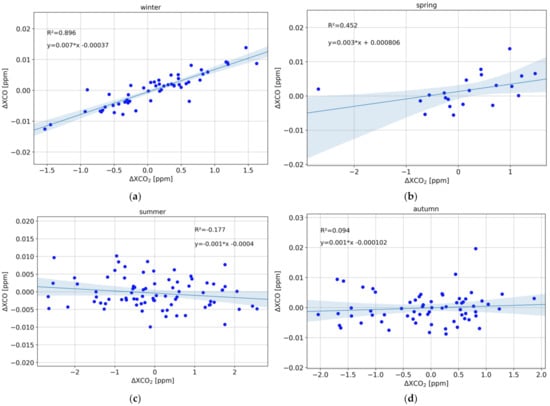
Figure 7.
Correlation between collocated ΔXCO and ΔXCO2 for winter (a), spring (b), summer (c) and autumn (d), and the resulting linear correlation line. The confidence interval is shown in the faded light-blue colour.
As anthropogenic activities increase, use of cars and heating during wintertime play an important role in dominating XCO2 and XCO emissions via the incomplete combustion of fossil fuels. Many recent publications have highlighted the relationship between CO and CO2 emission sources [47]. Thessaloniki shows a mean value of ΔXCO [ppm] per ΔXCO2 [ppm] ratio of 0.001 ± 0.05 in general (0.008 ± 0.02 in spring and 0.07 ± 0.02 in winter), reflecting the role that CO plays as an air pollutant tracer in the atmosphere in urban-industrial areas. The ΔXCO [ppm]/ΔXCO2 [ppm] ratio from July 2019 to November 2020 ranged between 0.0008 and 0.001 in south-western Germany—Rhine valley [48]. Higher values of ΔXCO/ΔXCO2 during the winter season might be in line with elevated residential heating. Comparing megacities in Europe, America and Asia, those in Europe and North America have a lower ΔXCO per ΔXCO2 ratio than those in Asia, which can be attributed to the lower dependency on coal and the gradual shift to using energy from natural gas and renewables [49,50]. Regardless of the advancement in emission technology, the large number of on-road motor vehicles and traffic congestion that is ubiquitous in many cities result in high emissions of air pollutants [51].
5.2. Carbon Monoxide and Methane Co-Variability
The seasonality in the observation-based ratios is likely dominated by the seasonality in CO emissions, which are expected to peak during winter time. Anthropogenic sources of CH4, conversely, are expected to be relatively constant over the two-year period [52]. CH4 emission sources, such as landfills or natural gas leakage, are relatively constant during the day, whereas CO emissions from traffic are dominant and have stronger daytime sources. In contrast to CO2, the primary sink of methane is the destruction by OH radicals, which would reveal a diurnal cycle related to the production mechanism of the radicals [53]. Carbon monoxide (CO) is primarily produced from biomass burning and oxidation of methane [54]. OH is considered well buffered in the atmosphere, with a small inter-annual variation, and the average lifetime of an OH molecule in the atmosphere is approximately 1 s [55,56,57]. However, considering the very slow reaction of CH4 with OH (lifetime 9–10 years; [58]), no significant diurnal cycle resulting from chemical loss can be observed. Higher mixing ratios indicate strong local sources of methane. Although the lifetime of CO is on the order of weeks in summer [59], the effect of the OH sink in diurnal scale may will not be seen, since transport and mixing processes occur on much shorter timescales.
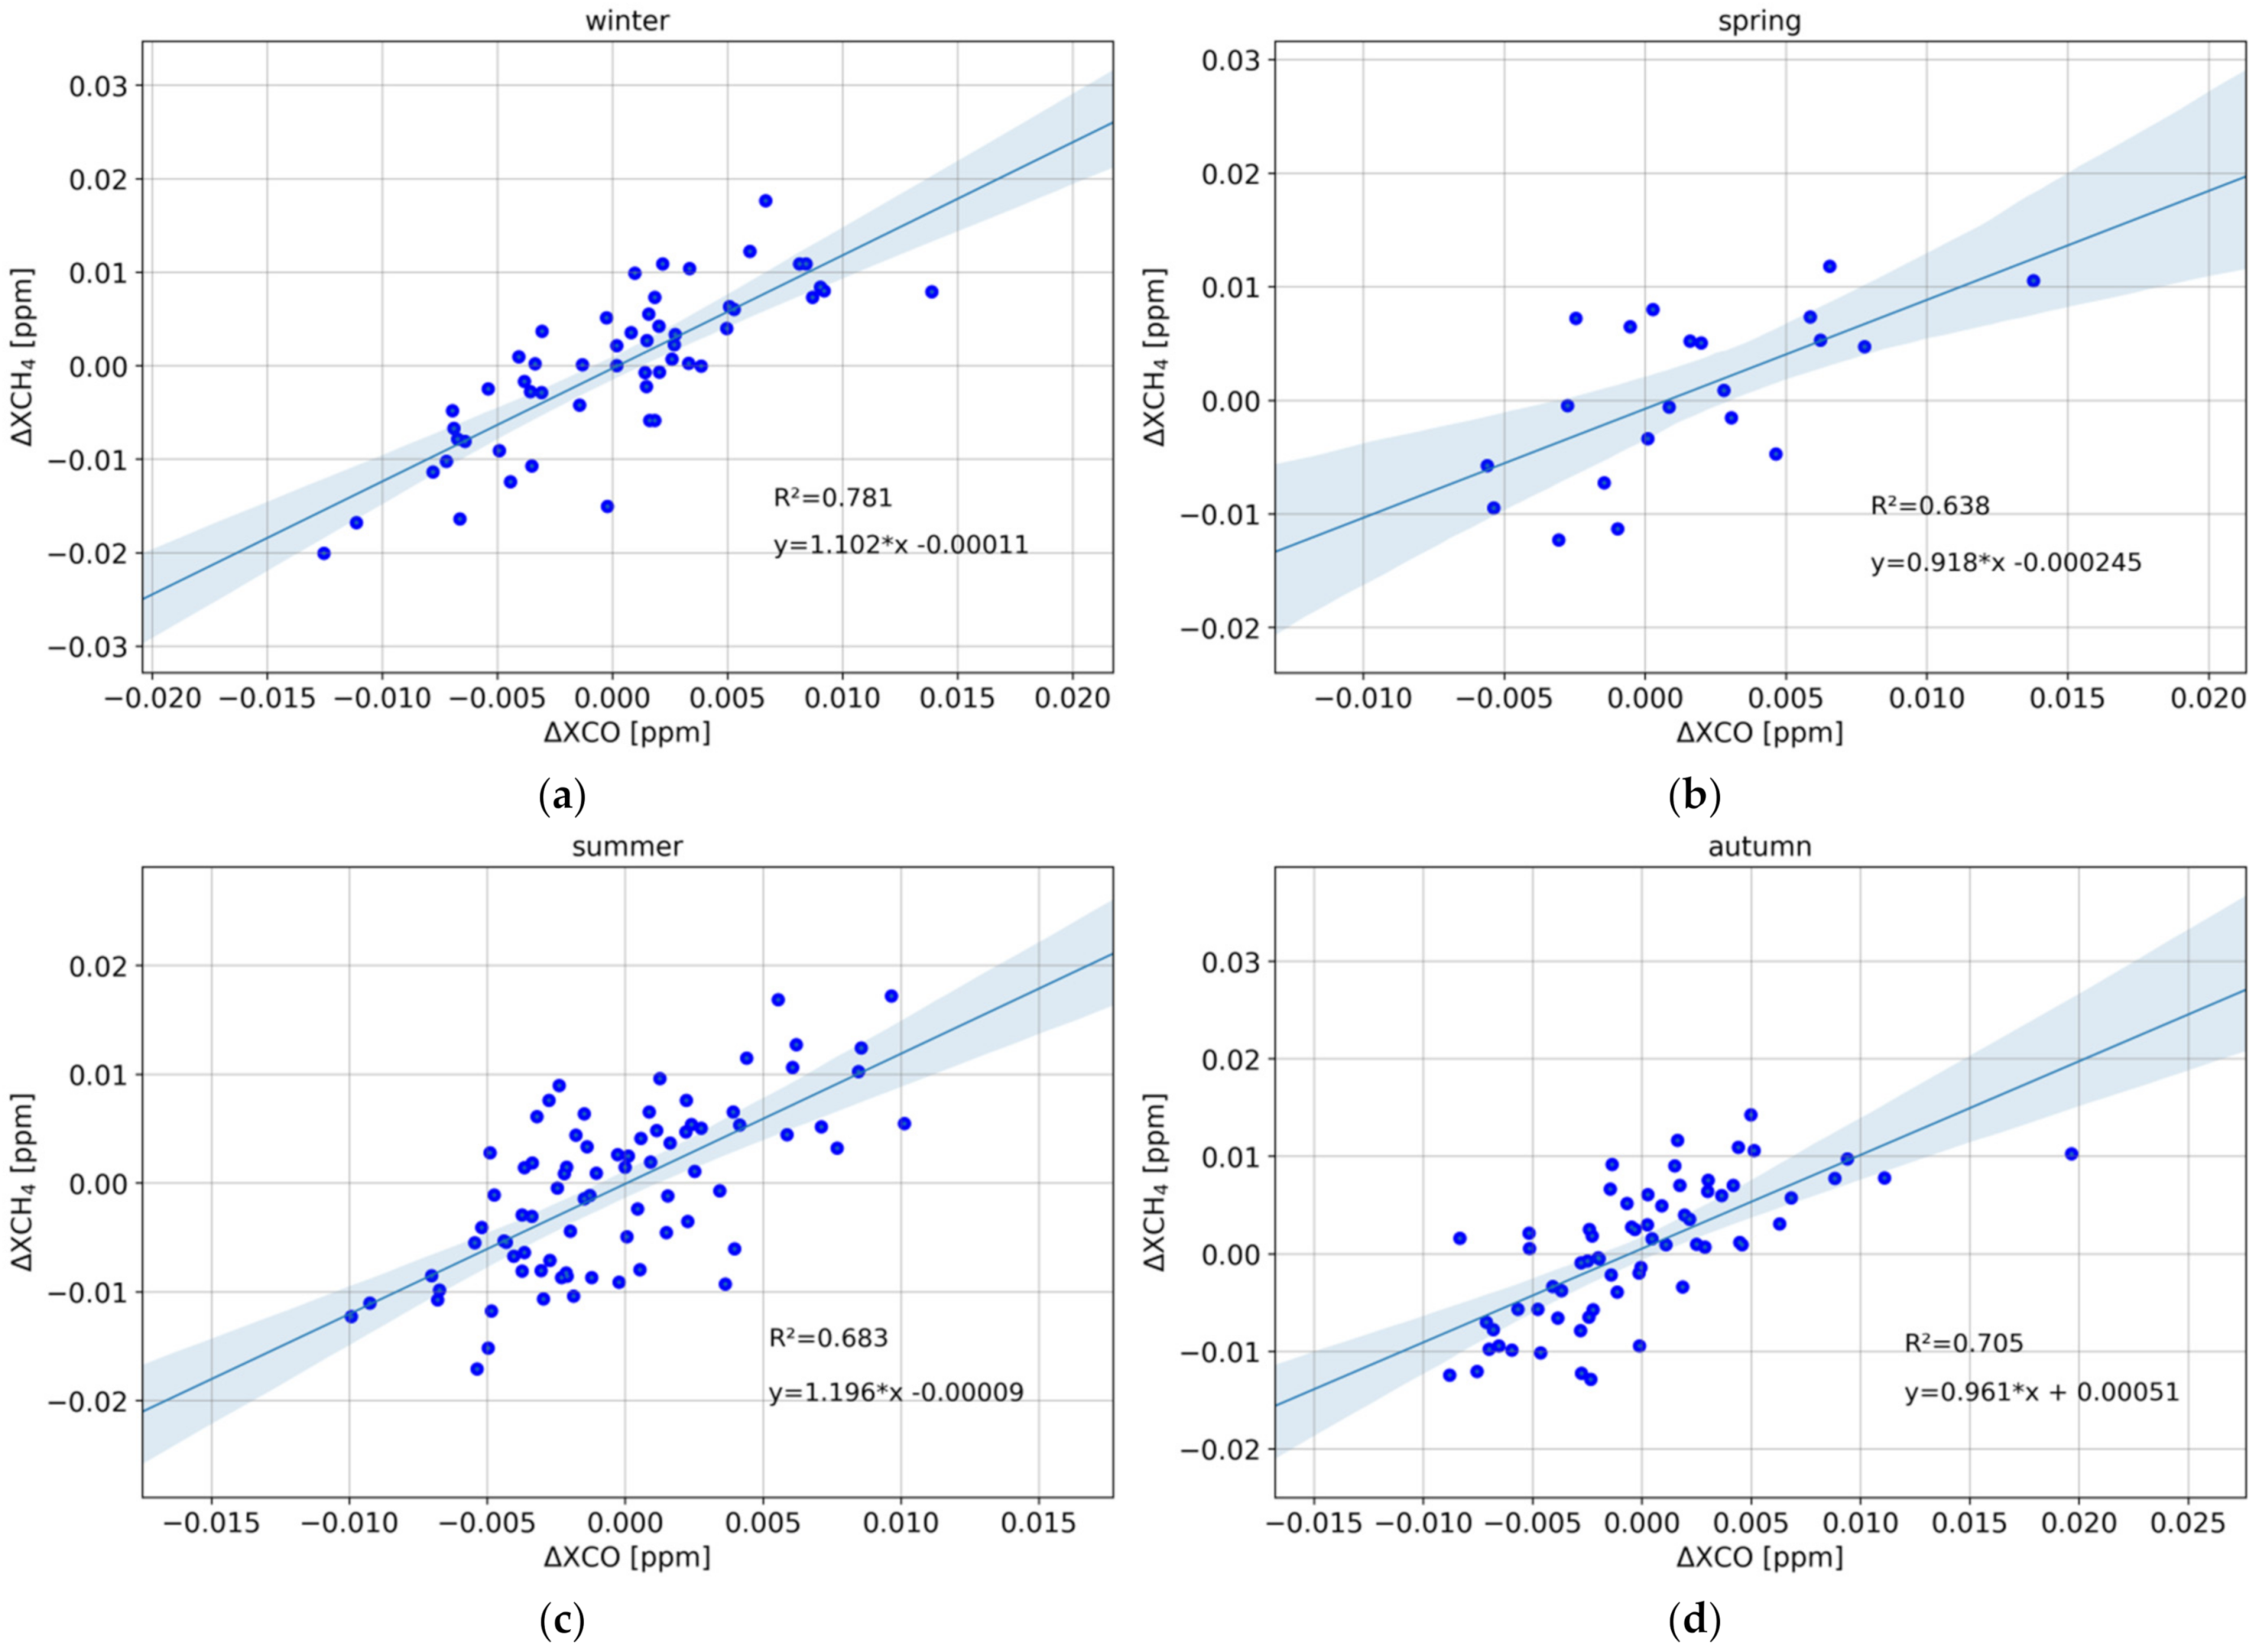
Figure 8 displays the seasonal co-dependency of methane and carbon monoxide residuals. As expected from their photochemical mechanisms of production and loss, all seasons show a good agreement, with narrow confidence intervals, and high correlation coefficients between 0.63 (spring) and 0.80 (winter). The close correlation observed for CH4 and CO residuals could possibly be attributed to both common local sources as well as the chemistry between the two species. According to Wofsy [60], CH4 photoxidation results to the formation of formaldehyde which in turn is photoxidated to produce CO. In result, CH4 oxidation is estimated to provide two thirds of the global source of CO, with evidence that this conversion of CH4 to CO exhibits almost unity efficiency. Since several chemical species and different conditions affect their concentration in the atmosphere, their correlation needs to be further studied. Local emissions and chemistry seem to lead to a site-specific variability of the two compounds, which is reflected in the near-unity slope observed in Thessaloniki.
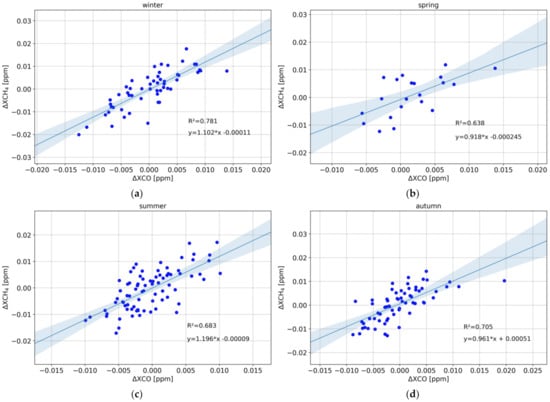
Figure 8.
Correlation between collocated ΔXCO and ΔXCH4 for winter (a), spring (b), summer (c) and autumn (d), and the resulting linear correlation line. The confidence interval is shown in the faded light-blue colour.
In summary, in this section the timeseries of XCO, XCO2 and XCH4 residuals for the two years of measurements in Thessaloniki were presented, followed by their co-variability analysis on a seasonal basis. Different seasons exhibit different correlation between X-gas residuals reflecting variant anthropogenic emission sources or sinks. In the case of ΔXCO, ΔXCO2, the comparison during winter shows a near perfect correlation since it is the season when most anthropogenic sources appear, such as the combustion of fossil fuels, which is the main driver of XCO, XCO2 high concentrations in the atmosphere. This strong correlation between ΔXCO and ΔXCO2 supports the premise that the emitted CO2 in Thessaloniki has the same origin as CO, i.e., heating and traffic. Previous studies in megacities have also shown that XCO and XCO2 are strongly inter-related [47]. Overall, very close correlations between ΔXCO and ΔXCH4 appear for all seasons with a correlation slope around unity, between 0.9 and 1.2. Winter accounts for the best correlation (R2 = 0.8), while autumn also emerges a similar picture with a correlation coefficient equal to 0.705. It is quite remarkable how significantly the XCO and XCH4 residuals are related to each other. Further investigation could reveal a new source of methane around Thessaloniki urban region or possible air mass transport far from the city centre.
6. Conclusions
In this paper, total columns of carbon dioxide, carbon monoxide and methane were measured for the first time in Thessaloniki, Greece using a portable direct-solar viewing FTIR spectrometer for two full years, 2019 and 2020. This first observation period shows the stable performance of the FTIR instrument, ensuring that these temporally dense measurements in Thessaloniki, Greece will continue to contribute to the Collaborative Carbon Column Observing Network with the goal of contributing to the validation of space-borne sensors and of detecting local sources of greenhouse gases in the future. The methane and carbon monoxide FTIR measurements were compared with the high-spatial-resolution TROPOspheric Monitoring Instrument (TROPOMI). A time coincidence of ±1 h between satellite overpasses and FTIR measurements was selected, and a spatial radius of 50 and 100 km for carbon monoxide and methane products, respectively. Furthermore, the seasonal behaviour of the greenhouse gas residuals (ΔX) was examined in order to capture short-term variations of X-gases and identify local sources, as well as common sources between them. We conclude that:
- The XCO2 timeseries shows a discernible seasonal cycle with a winter and spring maximum driven by anthropogenic emissions and a summer minimum due to biospheric activity for a typical mid-latitude Northern Hemisphere location. The XCO timeseries also reveals high winter and lower summer levels reflecting the common sources with CO2, albeit with a large daily variability due to local influences. Concerning XCH4 an increase begins in the summer, when maximum temperatures occur, to reach its maximum levels in the wintertime, when most anthropogenic emissions occur.
- The percentage variability of daily mean values in the course of the year is found to be ~2.9% in the case of XCO2, while for XCH4 it is found to be similar, at 3.7%, while for XCO it is much higher around 40.0%. These results are comparable to those obtained from previous studies of greenhouse gases [8], revealing the biospheric cycle for CO2, relatively stable sources for CH4 and intense variability due to anthropogenic emissions for XCO.
- The comparisons to the S5P/TROPOMI observations showed an excellent correlation between ground-based and space-borne measurements. The collocated XCH4 TROPOMI observations over Thessaloniki have a mean value of 1.871 ± 0.017 ppm while FTIR mean values are also 1.872 ± 0.014 ppm. Similarly, for XCO, TROPOMI results in a mean value of 0.094 ± 0.010 ppm, very close to that of the FTIR (0.091 ± 0.008 ppm).
- The study of the seasonal co-variability of the ΔXCO and ΔXCO2 residuals showed that they have a strong correlation in winter (R2 = 0.898), with a significant correlation found also in spring. They are not correlated in summer and autumn, reflecting the higher CO2 seasonal cycle variability than that of XCO. As for the ΔXCO and ΔXCH4 co-variability, this was found to be excellent for all seasons. Winter shows the best correlation (R2 = 0.804, slope = 1.209), while in summer we also found a good agreement (R2 = 0.683, slope = 1.196) with this strong interconnectivity underlies the CH4-OH-CO chemistry as well as possible common sources.
Operation of the Thessaloniki FTIR EM27/SUN spectrometer and analysis of greenhouse gas measurements will be continued with the aim of understanding the impact of greenhouse gases in climate change on a regional time-scale, and by extension, its contribution to global changes. Extended measurements together with the use of meteorological data (especially wind speed and direction information) and back trajectories will help us detect pollution episodes and study the gas columns variability in regard to their emission sources.
Author Contributions
Conceptualization, D.B.; Investigation, M.M. and C.T.; Methodology, M.M., C.T., D.B. and M.E.K.; Resources, M.E.K., D.D., T.B. and A.L.; Software, M.M., C.T., F.H. and D.D.; formal analysis, M.M., C.T. and M.E.K.; data curation, M.M.; Supervision, D.B. and F.H.; Writing—original draft, M.M. and C.T.; Writing—review & editing, C.T., D.B., M.E.K., F.H., D.D., T.B. and A.L. All authors have read and agreed to the published version of the manuscript.
Funding
This research was co-financed by the Karlsruhe Institute of Technology (KIT—“The Research University in the Helmholtz Association”) and by the European Union (European Regional Development Fund) and Greek national funds through the Operational Program “Competitiveness, Entrepreneurship and Innovation” (NSRF 2014-2020) by the “PANhellenic Infrastructure for Atmospheric Composition and Climate Change” project (MIS 5021516), implemented under the Action “Reinforcement of the Research and Innovation” Infrastructure.
Data Availability Statement
The EM27/SUN FTIR spectrometer data over Thessaloniki, Greece, are available upon request. The S5P/TROPOMI observations are publicly available from the Copernicus Open Access Hub (https://scihub.copernicus.eu/, ESA, 2021, accessed on 21 May 2021).
Acknowledgments
We wholeheartedly acknowledge the support provided by the IT Center of the Aristotle University of Thessaloniki (AUTh) throughout the progress of this research work. We acknowledge the usage of modified Copernicus Sentinel data (2019–2020).
Conflicts of Interest
The authors declare no conflict of interest.
References
- IPCC. Climate Change 2014: Mitigation of Climate Change. Contribution of Working Group III to the Fifth Assessment Report of the Intergovernmental Panel on Climate Change; Edenhofer, O., Pichs-Madruga, R., Sokona, Y., Farahani, E., Kadner, S., Seyboth, K., Adler, A., Baum, I., Brunner, S., Eickemeier, P., et al., Eds.; Cambridge University Press: Cambridge, UK; New York, NY, USA, 2014. [Google Scholar]
- Dlugokencky, E.J.; Nisbet, E.G.; Fisher, R.; Lowry, D. Global atmospheric methane: Budget, changes and dangers. Philos. Trans. A Math. Phys. Eng. Sci. 2011, 369, 2058–2072. [Google Scholar] [CrossRef] [Green Version]
- Zimnoch, M.; Necki, J.; Chmura, L.; Jasek, A.; Jelen, D.; Galkowski, M.; Kuc, T.; Gorczyca, Z.; Bartyzel, J.; Rozanski, K. Quantification of carbon dioxide and methane emissions in urban areas: Source apportionment based on atmospheric observations. Mitig. Adapt. Strat. Glob. Chang. 2018, 24, 1051–1071. [Google Scholar] [CrossRef] [Green Version]
- Vogel, F.R.; Frey, M.; Staufer, J.; Hase, F.; Broquet, G.; Xueref-Remy, I.; Chevallier, F.; Ciais, P.; Sha, M.K.; Chelin, P.; et al. XCO2 in an emission hot-spot region: The COCCON Paris campaign 2015. Atmos. Chem. Phys. 2019, 19, 3271–3285. [Google Scholar] [CrossRef] [Green Version]
- Hase, F.; Frey, M.; Blumenstock, T.; Gros, J.M.; Kiel, M.; Kohlhepp, R.; Tsidu, G.M.; Schafer, K.V.R.; Sha, M.K.; Orphal, J. Application of portable FTIR spectrometers for detecting greenhouse gas emissions of the major city Berlin. Atmos. Meas. Tech. 2015, 8, 3059–3068. [Google Scholar] [CrossRef] [Green Version]
- Wunch, D.; Toon, G.C.; Sherlock, V.; Deutscher, N.M.; Liu, C.; Feist, D.G.; Wennberg, P.O. The Total Carbon Column Observing Network’s GGG2014 Data Version. 2015. Available online: https://doi.org/10.14291/tccon.ggg2014.documentation.R0/1221662 (accessed on 10 April 2021).
- Wunch, D.; Toon, G.C.; Blavier, J.-F.L.; Washenfelder, R.A.; Notholt, J.; Connor, B.J.; Griffith, D.W.T.; Sherlock, V.; Wennberg, P.O. The total carbon column observing network. Philos. Trans. R. Soc. A Math. Phys. Eng. Sci. 2011, 369, 2087–2112. [Google Scholar] [CrossRef] [Green Version]
- Frey, M.; Sha, M.K.; Hase, F.; Kiel, M.; Blumenstock, T.; Harig, R.; Surawicz, G.; Deutscher, N.M.; Shiomi, K.; Franklin, J.E.; et al. Building the COllaborative carbon column observing network (COCCON): Long-term stability and ensemble performance of the EM27/SUN Fourier transform spectrometer. Atmos. Meas. Tech. 2019, 12, 1513–1530. [Google Scholar] [CrossRef] [Green Version]
- Frey, M.; Hase, F.; Blumenstock, T.; Gros, J.M.; Kiel, M.; Tsidu, G.M.; Schäfer, K.; Sha, M.K.; Orphal, J. Calibration and instrumental line shape characterization of a set of portable FTIR spectrometers for detecting greenhouse gas emissions. Atmos. Meas. Tech. 2015, 8, 3047–3057. [Google Scholar] [CrossRef] [Green Version]
- Gisi, M.; Hase, F.; Dohe, S.; Blumenstock, T.; Simon, A.M.; Keens, A. XCO2-measurements with a tabletop FTS using solar absorption spectroscopy. Atmos. Meas. Tech. 2012, 5, 2969–2980. [Google Scholar] [CrossRef] [Green Version]
- Hedelius, J.K.; Viatte, C.; Wunch, D.; Roehl, C.M.; Toon, G.C.; Chen, J.; Jones, T.; Wofsy, S.C.; Franklin, J.E.; Parker, H.; et al. Assessment of errors and biases in retrievals of XCO2, XCH4, XCO, and XN2O from a 0.5 cm–1 resolution solar-viewing spectrometer. Atmos. Meas. Tech. 2016, 9, 3527–3546. [Google Scholar] [CrossRef] [Green Version]
- Bovensmann, H.; Burrows, J.P.; Buchwitz, M.; Frerick, J.; Noël, S.; Rozanov, V.V.; Chance, K.; Goede, A.P.H. SCIAMACHY: Mission Objectives and Measurement Modes. J. Atmos. Sci. 1999, 56, 127–150. [Google Scholar] [CrossRef] [Green Version]
- Kuze, A.; Suto, H.; Nakajima, M.; Hamazaki, T. Thermal and near infrared sensor for carbon observation Fourier-transform spectrometer on the greenhouse gases observing satellite for greenhouse gases monitoring. Appl. Opt. 2009, 48, 6716–6733. [Google Scholar] [CrossRef] [PubMed]
- Deeter, M.; Emmons, L.K.; Francis, G.L.; Edwards, D.P.; Gille, J.C.; Warner, J.; Khattatov, B.V.; Ziskin, D.; Lamarque, J.; Ho, S.; et al. Operational carbon monoxide retrieval algorithm and selected results for the MOPITT instrument. J. Geophys. Res. Space Phys. 2003, 108, 4399. [Google Scholar] [CrossRef]
- Turquety, S.; Hadji-Lazaro, J.; Clerbaux, C.; Hauglustaine, D.; Clough, S.A.; Cassé, V.; Schlüssel, P.; Mégie, G. Operational trace gas retrieval algorithm for the Infrared Atmos. Sounding Interferometer. J. Geophys. Res. Space Phys. 2004, 109, 21301. [Google Scholar] [CrossRef]
- De Wachter, E.; Kumps, N.; Vandaele, A.C.; Langerock, B.; De Mazière, M. Retrieval and validation of MetOp/IASI methane. Atmos. Meas. Tech. 2017, 10, 4623–4638. [Google Scholar] [CrossRef] [Green Version]
- Hochstaffl, P.; Schreier, F.; Lichtenberg, G.; García, S.G. Validation of carbon monoxide total column retrievals from SCIAMACHY observations with NDACC/TCCON ground-based measurements. Remote Sens. 2018, 10, 223. [Google Scholar] [CrossRef] [Green Version]
- Hase, F.; Frey, M.; Kiel, M.; Blumenstock, T.; Harig, R.; Keens, A.; Orphal, J. Addition of a channel for XCO observations to a portable FTIR spectrometer for greenhouse gas measurements. Atmos. Meas. Tech. 2016, 9, 2303–2313. Available online: https://www.atmos-meas-tech.net/9/2303/2016/ (accessed on 21 May 2021). [CrossRef] [Green Version]
- Sha, M.K.; De Mazière, M.; Notholt, J.; Blumenstock, T.; Chen, H.; Dehn, A.; Griffith, D.W.T.; Hase, F.; Heikkinen, P.; Hermans, C.; et al. Intercomparison of low- and high-resolution infrared spectrometers for ground-based solar remote sensing measurements of total column concentrations of CO2, CH4, and CO. Atmos. Meas. Tech. 2020, 13, 4791–4839. [Google Scholar] [CrossRef]
- Keppel-Aleks, G.; Toon, G.C.; Wennberg, P.O.; Deutscher, N.M. Reducing the impact of source brightness fluctuations on spectra obtained by Fourier-transform spectrometry. Appl. Opt. 2007, 46, 4774–4779. [Google Scholar] [CrossRef] [Green Version]
- Hase, F.; Blumenstock, T.; Paton-Walsh, C. Analysis of the instrumental line shape of high-resolution Fourier transform IR spectrometers with gas cell measurements and new retrieval software. Appl. Opt. 1999, 38, 3417–3422. [Google Scholar] [CrossRef]
- Geibel, M.C.; Messerschmidt, J.; Gerbig, C.; Blumenstock, T.; Chen, H.; Hase, F.; Kolle, O.; Lavric, J.V.; Notholt, J.; Palm, M.; et al. Calibration of column-averaged CH4 over European TCCON FTS sites with airborne in-situ measurements. Atmos. Chem. Phys. Discuss. 2012, 12, 8763–8775. [Google Scholar] [CrossRef]
- Messerschmidt, J.; Macatangay, R.; Notholt, J.; Petri, C.; Warneke, T.; Weinzierl, C. Side by side measurements of CO2 by ground-based Fourier transform spectrometry (FTS). Tellus B Chem. Phys. Meteorol. 2010, 62, 749–758. [Google Scholar] [CrossRef] [Green Version]
- Wunch, D.; Toon, G.C.; Wennberg, P.; Wofsy, S.C.; Stephens, B.; Fischer, M.L.; Uchino, O.; Abshire, J.B.; Bernath, P.; Biraud, S.; et al. Calibration of the total carbon column observing network using aircraft profile data. Atmos. Meas. Tech. 2010, 3, 1351–1362. [Google Scholar] [CrossRef] [Green Version]
- Veefkind, J.; Aben, I.; McMullan, K.; Förster, H.; de Vries, J.; Otter, G.; Claas, J.; Eskes, H.; de Haan, J.; Kleipool, Q.; et al. TROPOMI on the ESA Sentinel-5 Precursor: A GMES mission for global observations of the atmospheric composition for climate, air quality and ozone layer applications. Remote Sens. Environ. 2012, 120, 70–83. [Google Scholar] [CrossRef]
- Zehner, C. Sentinel-5 precursor mission status and first results. In Proceedings of the IGARSS 2018—2018 IEEE International Geoscience and Remote Sensing Symposium, Valencia, Spain, 22–27 July 2018; pp. 1589–1590. [Google Scholar] [CrossRef]
- Hu, H.; Hasekamp, O.; Butz, A.; Galli, A.; Landgraf, J.; De Brugh, J.A.; Borsdorff, T.; Scheepmaker, R.; Aben, I. The operational methane retrieval algorithm for TROPOMI. Atmos. Meas. Tech. 2016, 9, 5423–5440. [Google Scholar] [CrossRef] [Green Version]
- Lorente, A.; Borsdorff, T.; Butz, A.; Hasekamp, O.; De Brugh, J.A.; Schneider, A.; Wu, L.; Hase, F.; Kivi, R.; Wunch, D.; et al. Methane retrieved from TROPOMI: Improvement of the data product and validation of the first 2 years of measurements. Atmos. Meas. Tech. 2021, 14, 665–684. [Google Scholar] [CrossRef]
- Landgraf, J.; De Brugh, J.A.; Scheepmaker, R.; Borsdorff, T.; Hu, H.; Houweling, S.; Butz, A.; Aben, I.; Hasekamp, O. Carbon monoxide total column retrievals from TROPOMI shortwave infrared measurements. Atmos. Meas. Tech. 2016, 9, 4955–4975. [Google Scholar] [CrossRef] [Green Version]
- Borsdorff, T.; Hasekamp, O.P.; Wassmann, A.; Landgraf, J. Insights into Tikhonov regularization: Application to trace gas column retrieval and the efficient calculation of total column averaging kernels. Atmos. Meas. Tech. 2014, 7, 523–535. [Google Scholar] [CrossRef] [Green Version]
- Borsdorff, T.; De Brugh, J.A.; Hu, H.; Hasekamp, O.; Sussmann, R.; Rettinger, M.; Hase, F.; Gross, J.; Schneider, M.; Garcia, O.; et al. Mapping carbon monoxide pollution from space down to city scales with daily global coverage. Atmos. Meas. Tech. 2018, 11, 5507–5518. [Google Scholar] [CrossRef] [Green Version]
- Borsdorff, T.; De Brugh, J.A.; Hu, H.; Aben, I.; Hasekamp, O.; Landgraf, J. Measuring carbon monoxide with TROPOMI: First results and a comparison with ECMWF-IFS analysis data. Geophys. Res. Lett. 2018, 45, 2826–2832. [Google Scholar] [CrossRef]
- Borsdorff, T.; De Brugh, J.A.; Pandey, S.; Hasekamp, O.; Aben, I.; Houweling, S.; Landgraf, J. Carbon monoxide air pollution on sub-city scales and along arterial roads detected by the Tropospheric Monitoring Instrument. Atmos. Chem. Phys. Discuss. 2019, 19, 3579–3588. [Google Scholar] [CrossRef] [Green Version]
- Quarterly Validation Report of the Copernicus Sentinel-5 Precursor Operational Data Products #06: April 2018–February 2020. In ESA MPC S5P MPC. Routine Operations Consolidated Validation Report; S5P MPC Routine Operations Consolidated Validation Report Series; Issue #06, Version 06.0.1; Lambert, J.-C.; Compernolle, S.; Eichmann, K.-U.; de Graaf, M.; Hubert, D.; Keppens, A.; Kleipool, Q.; Langerock, B.; Sha, M.K.; Verhoelst, T.; et al. (Eds.) Tropomi: Utrecht, The Netherlands, 2020; p. 154. [Google Scholar]
- Knapp, M.; Kleinschek, R.; Hase, F.; Agustí-Panareda, A.; Inness, A.; Barré, J.; Landgraf, J.; Borsdorff, T.; Kinne, S.; Butz, A. Shipborne measurements of XCO2, XCH4, and XCO above the Pacific Ocean and comparison to CAMS atmospheric analyses and S5P/TROPOMI. Earth Syst. Sci. Data 2021, 13, 199–211. [Google Scholar] [CrossRef]
- Sha, M.K.; Langerock, B.; Blavier, J.-F.L.; Blumenstock, T.; Borsdorff, T.; Buschmann, M.; Dehn, A.; De Mazière, M.; Deutscher, N.M.; Feist, D.G.; et al. Validation of methane and carbon monoxide from sentinel-5 precursor using TCCON and NDACC-IRWG stations. Atmos. Meas. Tech. Discuss. 2021. [Google Scholar] [CrossRef]
- Suni, T.; Berninger, F.; Markkanen, T.; Keronen, P.; Rannik, Ü.; Vesala, T. Interannual variability and timing of growing-season CO2 exchange in a boreal forest. J. Geophys. Res. Space Phys. 2003, 108, 4265. [Google Scholar] [CrossRef]
- Yang, Y.; Zhou, M.; Langerock, B.; Sha, M.K.; Hermans, C.; Wang, T.; Ji, D.; Vigouroux, C.; Kumps, N.; Wang, G.; et al. New ground-based Fourier-transform nearinfrared solar absorption measurements of XCO2, XCH4 and XCO at Xianghe, China. Earth Syst. Sci. Data 2020, 12, 1679–1696. [Google Scholar] [CrossRef]
- Wennberg, P.O.; Wunch, D.; Roehl, C.; Blavier, J.-F.; Toon, G.C.; Allen, N. TCCON data from Caltech (US), Release GGG2014. R1. 2014. Available online: https://data.caltech.edu/records/277 (accessed on 10 April 2021).
- Hase, F.; Blumenstock, T.; Dohe, S.; Gross, J.; Kiel, M. TCCON data from Karlsruhe (DE), Release GGG2014. R0. 2014. Available online: https://data.caltech.edu/records/278 (accessed on 10 April 2021).
- Lelieveld, J.; Gromov, S.; Pozzer, A.; Taraborrelli, D. Global tropospheric hydroxyl distribution, budget and reactivity. Atmos. Chem. Phys. 2016, 16, 12477–12493. [Google Scholar] [CrossRef] [Green Version]
- Spivakovsky, C.M.; Logan, J.A.; Montzka, S.; Balkanski, Y.; Foreman-Fowler, M.; Jones, D.B.A.; Horowitz, L.; Fusco, A.C.; Brenninkmeijer, C.A.M.; Prather, M.J.; et al. Three-dimensional climatological distribution of tropospheric OH: Update and evaluation. J. Geophys. Res. Space Phys. 2000, 105, 8931–8980. [Google Scholar] [CrossRef]
- Müller, J.; Stavrakou, T.; Bauwens, M.; George, M.; Hurtmans, D.; Coheur, P.; Clerbaux, C.; Sweeney, C. Top-down CO emissions based on IASI observations and hemispheric constraints on OH levels. Geophys. Res. Lett. 2018, 45, 1621–1629. [Google Scholar] [CrossRef] [Green Version]
- Saunois, M.; Bousquet, P.; Poulter, B.; Peregon, A.; Ciais, P.; Canadell, J.G.; Dlugokencky, E.J.; Etiope, G.; Bastviken, D.; Houweling, S.; et al. The global methane budget 2000–2012. Earth Syst. Sci. Data 2016, 8, 697–751. [Google Scholar] [CrossRef] [Green Version]
- Javadinejad, S.; Eslamian, S.; Ostad-Ali-Askari, K. Investigation of monthly and seasonal changes of methane gas with respect to climate change using satellite data. Appl. Water Sci. 2019, 9, 180. [Google Scholar] [CrossRef] [Green Version]
- S5P MPC. Routine Operations Consolidated Validation Report, (ROCVR) Quarterly Validation Report of the Sentinel-5 Precursor Operational Data Products. Available online: https://mpc-vdaf.tropomi.eu/ProjectDir/reports//pdf/S5P-MPC-IASB-ROCVR-10.01.00-20210326-signed.pdf (accessed on 6 May 2021).
- Ammoura, L.; Xueref-Remy, I.; Gros, V.; Baudic, A.; Bonsang, B.; Petit, J.-E.; Perrussel, O.; Bonnaire, N.; Sciare, J.; Chevallier, F. Atmospheric measurements of ratios between CO2 and co-emitted species from traffic: A tunnel study in the Paris megacity. Atmos. Chem. Phys. 2014, 14, 12871–12882. [Google Scholar] [CrossRef] [Green Version]
- Hase, F. Verify, Observation-Based System for Monitoring and Verification of Greenhouse Gases; GA number 776810; RIA, Contributors: C. Jäschke (UHEI), C. Alberti (KIT), S. Hammer (UHEI), F. Hase (KIT), C. Rosendahl (UHEI); European Commission: Brussels, Belgium, 2021. [Google Scholar]
- Bölük, G.; Mert, M. Fossil & renewable energy consumption, GHGs (greenhouse gases) and economic growth: Evidence from a panel of EU (European Union) countries. Energy 2014, 74, 439–446. [Google Scholar]
- Koplitz, S.N.; Jacob, D.J.; Sulprizio, M.P.; Myllyvirta, L.; Reid, C. Burden of disease from rising coal-fired power plant emissions in Southeast Asia. Environ. Sci. Technol. 2017, 51, 1467–1476. [Google Scholar] [CrossRef] [PubMed] [Green Version]
- Hassler, B.; McDonald, B.C.; Frost, G.J.; Borbon, A.; Carslaw, D.C.; Civerolo, K.; Granier, C.; Monks, P.S.; Monks, S.; Parrish, D.D.; et al. Analysis of long-term observations of NOx and CO in megacities and application to constraining emissions inventories. Geophys. Res. Lett. 2016, 43, 9920–9930. [Google Scholar] [CrossRef] [Green Version]
- Karydas, C.; Toukiloglou, P.; Minakou, C.; Gitas, I.Z. Development of a rule-based algorithm for rice cultivation mapping using Landsat 8 time series. In Proceedings of the Third International Conference on Remote Sensing and Geoinformation of the Environment (RSCy2015), Paphos, Cyprus, 19 June 2015; Volume 9535, p. 95350K. [Google Scholar] [CrossRef]
- Ehhalt, D.H. Photooxidation of trace gases in the troposphere Plenary Lecture. Phys. Chem. Chem. Phys. 1999, 1, 5401–5408. [Google Scholar] [CrossRef]
- Petersen, A.K.; Warneke, T.; Lawrence, M.G.; Notholt, J.; Schrems, O. First ground-based FTIR Observations of the seasonal variation of carbon monoxide in the tropics. Geophys. Res. Lett. 2008, 35, L03813. [Google Scholar] [CrossRef] [Green Version]
- Montzka, S.A.; Dlugokencky, E.J.; Butler, J.H. Non-CO2 greenhouse gases and climate change. Nature 2011, 476, 43–50. [Google Scholar] [CrossRef] [PubMed]
- Naik, V.; Voulgarakis, A.; Fiore, A.M.; Horowitz, L.W.; Lamarque, J.-F.; Lin, M.; Prather, M.J.; Young, P.J.; Bergmann, D.; Cameron-Smith, P.J.; et al. Preindustrial to present-day changes in tropospheric hydroxyl radical and methane lifetime from the Atmos. Chemistry and Climate Model Intercomparison Project (ACCMIP). Atmos. Chem. Phys. 2013, 13, 5277–5298. [Google Scholar] [CrossRef] [Green Version]
- Voulgarakis, A.; Naik, V.; Lamarque, J.-F.; Shindell, D.T.; Young, P.J.; Prather, M.J.; Wild, O.; Field, R.D.; Bergmann, D.; Cameron-Smith, P.; et al. Analysis of present day and future OH and methane lifetime in the ACCMIP simulations. Atmos. Chem. Phys. Discuss. 2013, 13, 2563–2587. [Google Scholar] [CrossRef] [Green Version]
- Kirschke, S.; Bousquet, P.; Ciais, P.; Saunois, M.; Canadell, J.G.; Dlugokencky, E.J.; Bergamaschi, P.; Bergmann, D.; Blake, D.R.; Bruhwiler, L.; et al. Three decades of global methane sources and sinks. Nat. Geosci. 2013, 6, 813–823. [Google Scholar] [CrossRef]
- Seinfeld, J.H. Atmospheric Chemistry and Physics: From Air Pollution to Climate Change, 2nd ed.; Pandis, S.N., Hoboken, N.J., Eds.; John & Wiley & Sons: Hoboken, NJ, USA, 2006. [Google Scholar]
- Wofsy, S. Interactions of CH4 and CO in the Earth’s atmosphere. Annu. Rev. Earth Planet. Sci. 1976, 4, 441–469. [Google Scholar] [CrossRef]
Publisher’s Note: MDPI stays neutral with regard to jurisdictional claims in published maps and institutional affiliations. |
© 2021 by the authors. Licensee MDPI, Basel, Switzerland. This article is an open access article distributed under the terms and conditions of the Creative Commons Attribution (CC BY) license (https://creativecommons.org/licenses/by/4.0/).

