Article

Using Historical Archives and Landsat Imagery to Explore Changes in the Mangrove Cover of Peninsular Malaysia between 1853 and 2018

by
Lavaniadevi Gopalakrishnan
1,2,*,
Behara Satyanarayana
1,3,
Danyang Chen
1,2,
Giovanna Wolswijk
1,
A. Aldrie Amir
4,
Michiel B. Vandegehuchte
5,
Aidy B. Muslim
3,
Nico Koedam
2 and
Farid Dahdouh-Guebas
1,2
1
Systems Ecology and Resource Management Research Unit (SERM), Université Libre de Bruxelles-ULB, 1050 Brussels, Belgium
2
Ecology & Biodiversity, Laboratory of Plant Biology and Nature Management, Biology Department, Vrije Universiteit Brussel-VUB, 1050 Brussels, Belgium
3
Mangrove Research Unit (MARU), Institute of Oceanography and Environment (INOS), Universiti Malaysia Terengganu (UMT), Kuala Nerus 21300, Malaysia
4
Institute for Environment and Development (LESTARI), Universiti Kebangsaan Malaysia, Bangi 43600, Malaysia
5
Vlaams Instituut voor de Zee (VLIZ), InnovOcean site, 8400 Oostend, Belgium
*
Author to whom correspondence should be addressed.
Remote Sens. 2021, 13(17), 3403; https://doi.org/10.3390/rs13173403
Submission received: 29 June 2021 / Revised: 9 August 2021 / Accepted: 24 August 2021 / Published: 27 August 2021
(This article belongs to the Special Issue Monitoring and Modelling of Dynamics in Tropical Coastal Systems)

Abstract

:
Archive records such as maps, journals, books, sketches, cadastre and notarial documents have been underutilised in describing past and present changes in ecological systems, such as mangrove forests. Historical records can be invaluable information sources for baseline establishment, to undertake long-term study on mangrove dynamics and enhance the historical land cover and land-use dynamics of a country. In this study, we explore these untapped information reservoirs, used complementarily with remote sensing techniques, to explain the dynamics of the mangrove systems in Peninsular Malaysia. The archives in the United Kingdom, the Netherlands, Malaysia and Singapore were explored and mined for related information on the mangrove systems in Peninsular Malaysia from past centuries. Most historical records found in this study were used to validate the mangrove presence in Peninsular Malaysia since 1853 while two records from 1944 and 1954 were used to quantify the mangrove cover extent. A significant finding of this study was the oldest record found in 1853 that attested to the presence of a mangrove system on the mainland Penang of Peninsular Malaysia which was not identified again as such in records post-1853. Remote sensing data, specifically Landsat images, were used to determine the mangrove extent in Peninsular Malaysia for the years 1988, 1992, 2002, 2012 and 2018. By complementing the historical records with remote sensing information, we were able to validate the mangrove presence in Peninsular Malaysia since 1853 and determine the gain/loss of mangrove systems over the last 74 years. Peninsular Malaysia has lost over 400 km2 of mangrove forests, equivalent to 31% of its original extent between 1944 and 2018. This is a significant loss for Peninsular Malaysia which has less than 1% mangrove cover of its total land area presently.

1. Introduction

Mangroves, representing one of the most productive ecosystems on Earth [1,2], offer ecosystem services to humankind [3] (pp. 19–22). Mangroves provide (a) resources such as food, timber and fuel [4,5,6,7]; (b) shoreline protection [8,9,10]; (c) refuge and habitat for marine and coastal species in several life stages [11,12,13]; and (d) recreation and tourism opportunities [14,15,16]. Notwithstanding the importance of mangroves, they continue to be threatened by natural and anthropogenic pressures. Most noticeable is the decrease in areal extent [17,18,19], though this is not the only impact. Moreover, Dahdouh-Guebas et al. in 2020 [20] illustrated that even with a better understanding of the importance of this ecosystem now, negative perceptions on mangroves or indifference persist, which could be detrimental to the willingness and support for management or conservation of these wetlands.
Over years, studies on mangroves have been undertaken in Malaysia to study and ascertain the existing mangrove extent [21,22,23,24,25,26]. However, these studies analyse the mangrove cover over a specific period of typically less than 50 years and/or on a local scale. This pioneering study on the scale of Peninsular Malaysia complements these case studies by investigating the long-term presence/absence of the mangrove system using historical data over a time scale of more than 100 years and subsequently is expected to provide insight into long-term mangrove cover dynamics.
The notion of using historical records to recreate the past mangrove systems is not a new one. Several studies have attempted to map and understand the historical systems and their changes [27,28,29,30,31,32,33]. In this context, historical records do not only include archived physical records but can also include a biological approach in the assessment of historical land-use changes. There have been studies where ecological records from fieldwork observations such as tree rings, pollen records, geomorphological features and lichen growth are used to describe the historical systems [34,35,36]. On the other hand, a study by Cavanaugh et al. in 2019 [33] used a mixed-methods approach in that they combined historical data, climate data and remote sensing to describe the shift in mangrove abundance over 250 years.
Historical information for Peninsular Malaysia can be retrieved from archival information from countries such as the United Kingdom and the Netherlands, the maritime colonial powers that ruled parts of Peninsular Malaysia (formerly known as the Malay Peninsula or Malaya) as colonies or trade settlements [37]. Archive records, which include historical maps, journals, logbooks, sketches, cadastre, notarial documents and texts by explorers, such as the Dutch East-India Company (Vereenigde Oostindische Compagnie or VOC) and the British East-India Company, could be valuable sources of information [30,34,38]. These types of information can be used to establish a baseline, investigate long-term changes in mangrove extent, and enhance the spatial structure of Peninsular Malaysia [39].
In order to look at the long-term changes in mangrove extent, there is also a need to obtain reliable recent information on the mangrove coverage. Remote sensing has been recognised as a credible method of mapping mangrove ecosystems as an alternative to direct observations via ground surveys [40,41]. By using satellite sensors and, more recently, Unoccupied Aerial Vehicles (UAVs) [42], remote sensing techniques allow for the structural characterisation and mapping of even inaccessible areas of mangroves, as well as an easier and more effective way of monitoring changes, both on the temporal and spatial scale [43,44,45].
With over 40 years of remote sensing data, the Landsat image archive is one of the most comprehensive collections of Earth imagery [46] which allows for the observation of land-use changes and ecological monitoring [47,48,49]. Landsat data are maintained by the United States Geological Survey (USGS), a freely accessible resource that allows users to request, search, and download necessary data [50]. The Landsat images available have a medium spatial resolution (15 to 30 m), which can be useful for ecological studies such as change detection, areal extent or species shift of a specific mangrove habitat [51].
In this study, we aimed to reconstruct and understand the past and present dynamics of the mangrove forests in Peninsular Malaysia and explore the tools to do so using historical sources. We explored the scientific gap on the spatio-temporal dynamics of the mangrove forests in Peninsular Malaysia from the 19th century with the use of historical records and recent remote sensing data. We believe that this study may prompt a regional/global interest in mapping the long-term dynamics of mangrove systems in order to understand the impacts of enacted (historically and/or currently) local-scale land-use policies and management. The specific objectives of this study were to (a) explore and extract historical information (including maps, texts, journals, etc.) related to the presence of mangrove forests and quantify the historical extent of mangroves in Peninsular Malaysia; (b) identify mangrove areas and their spatial extent from the recent remote sensing imagery, and; (c) to compare and contrast the historical records and the remote sensing information to describe the mangrove spatio-temporal dynamics.

2. Materials and Methods
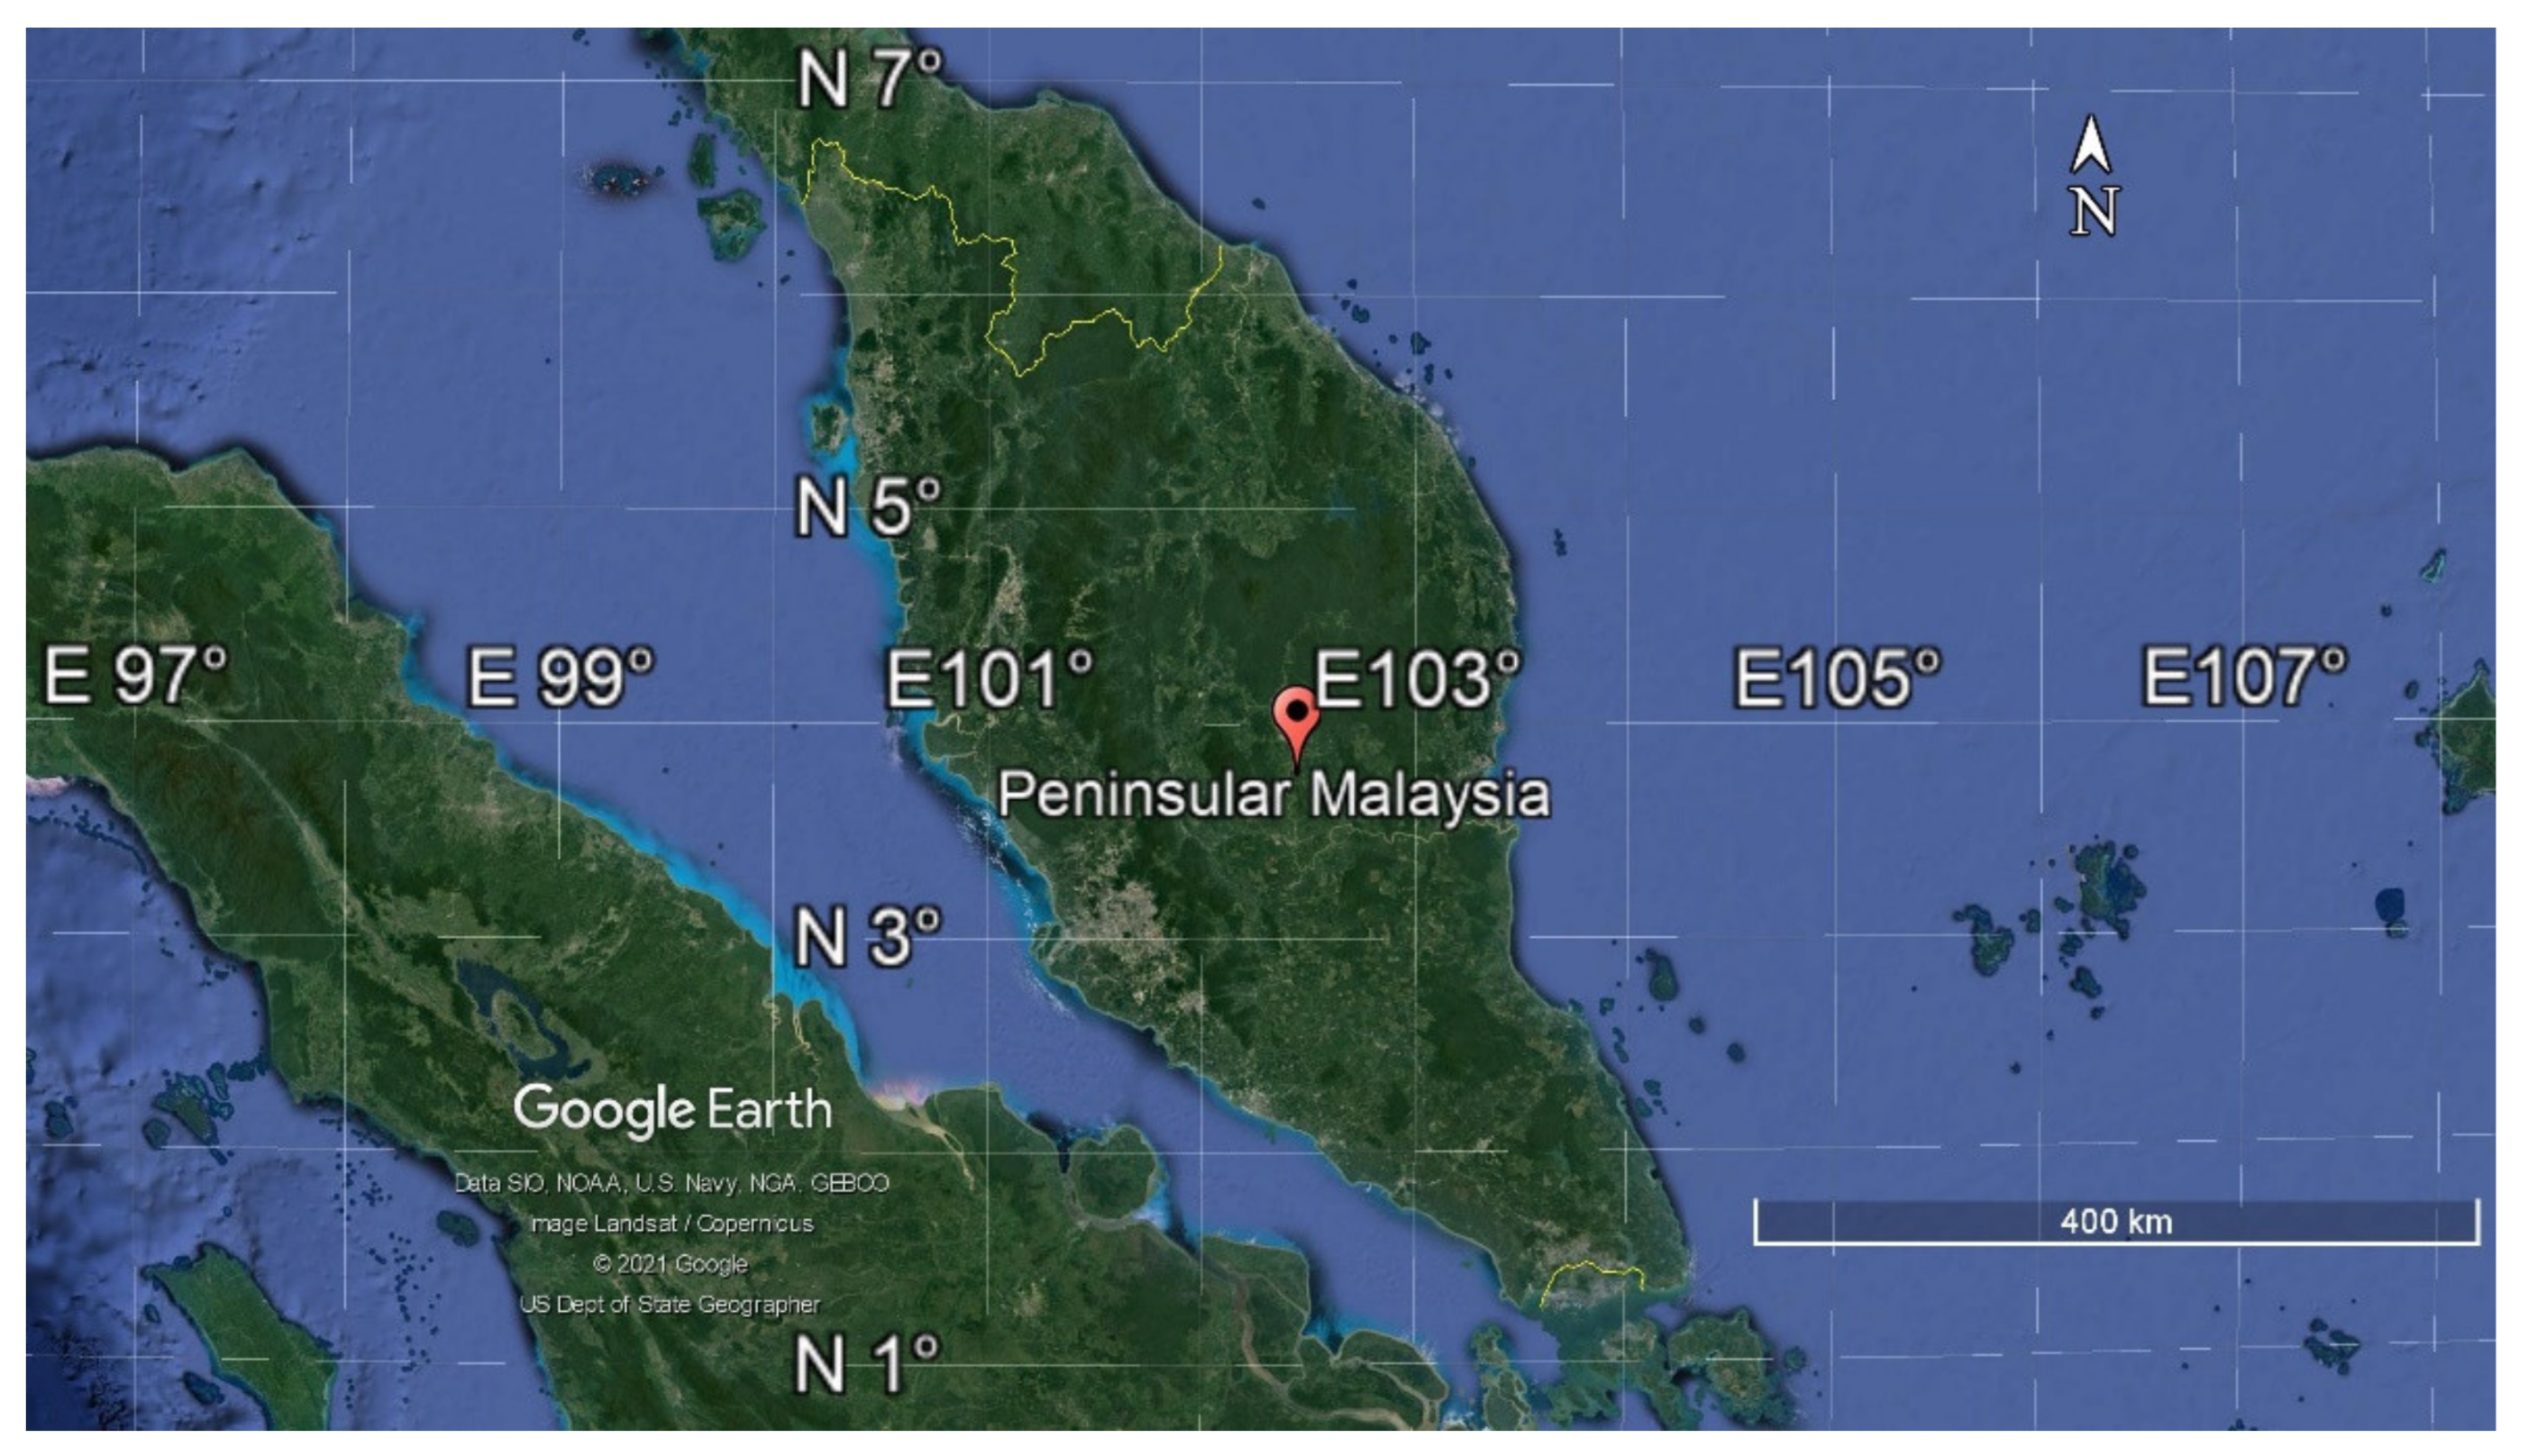
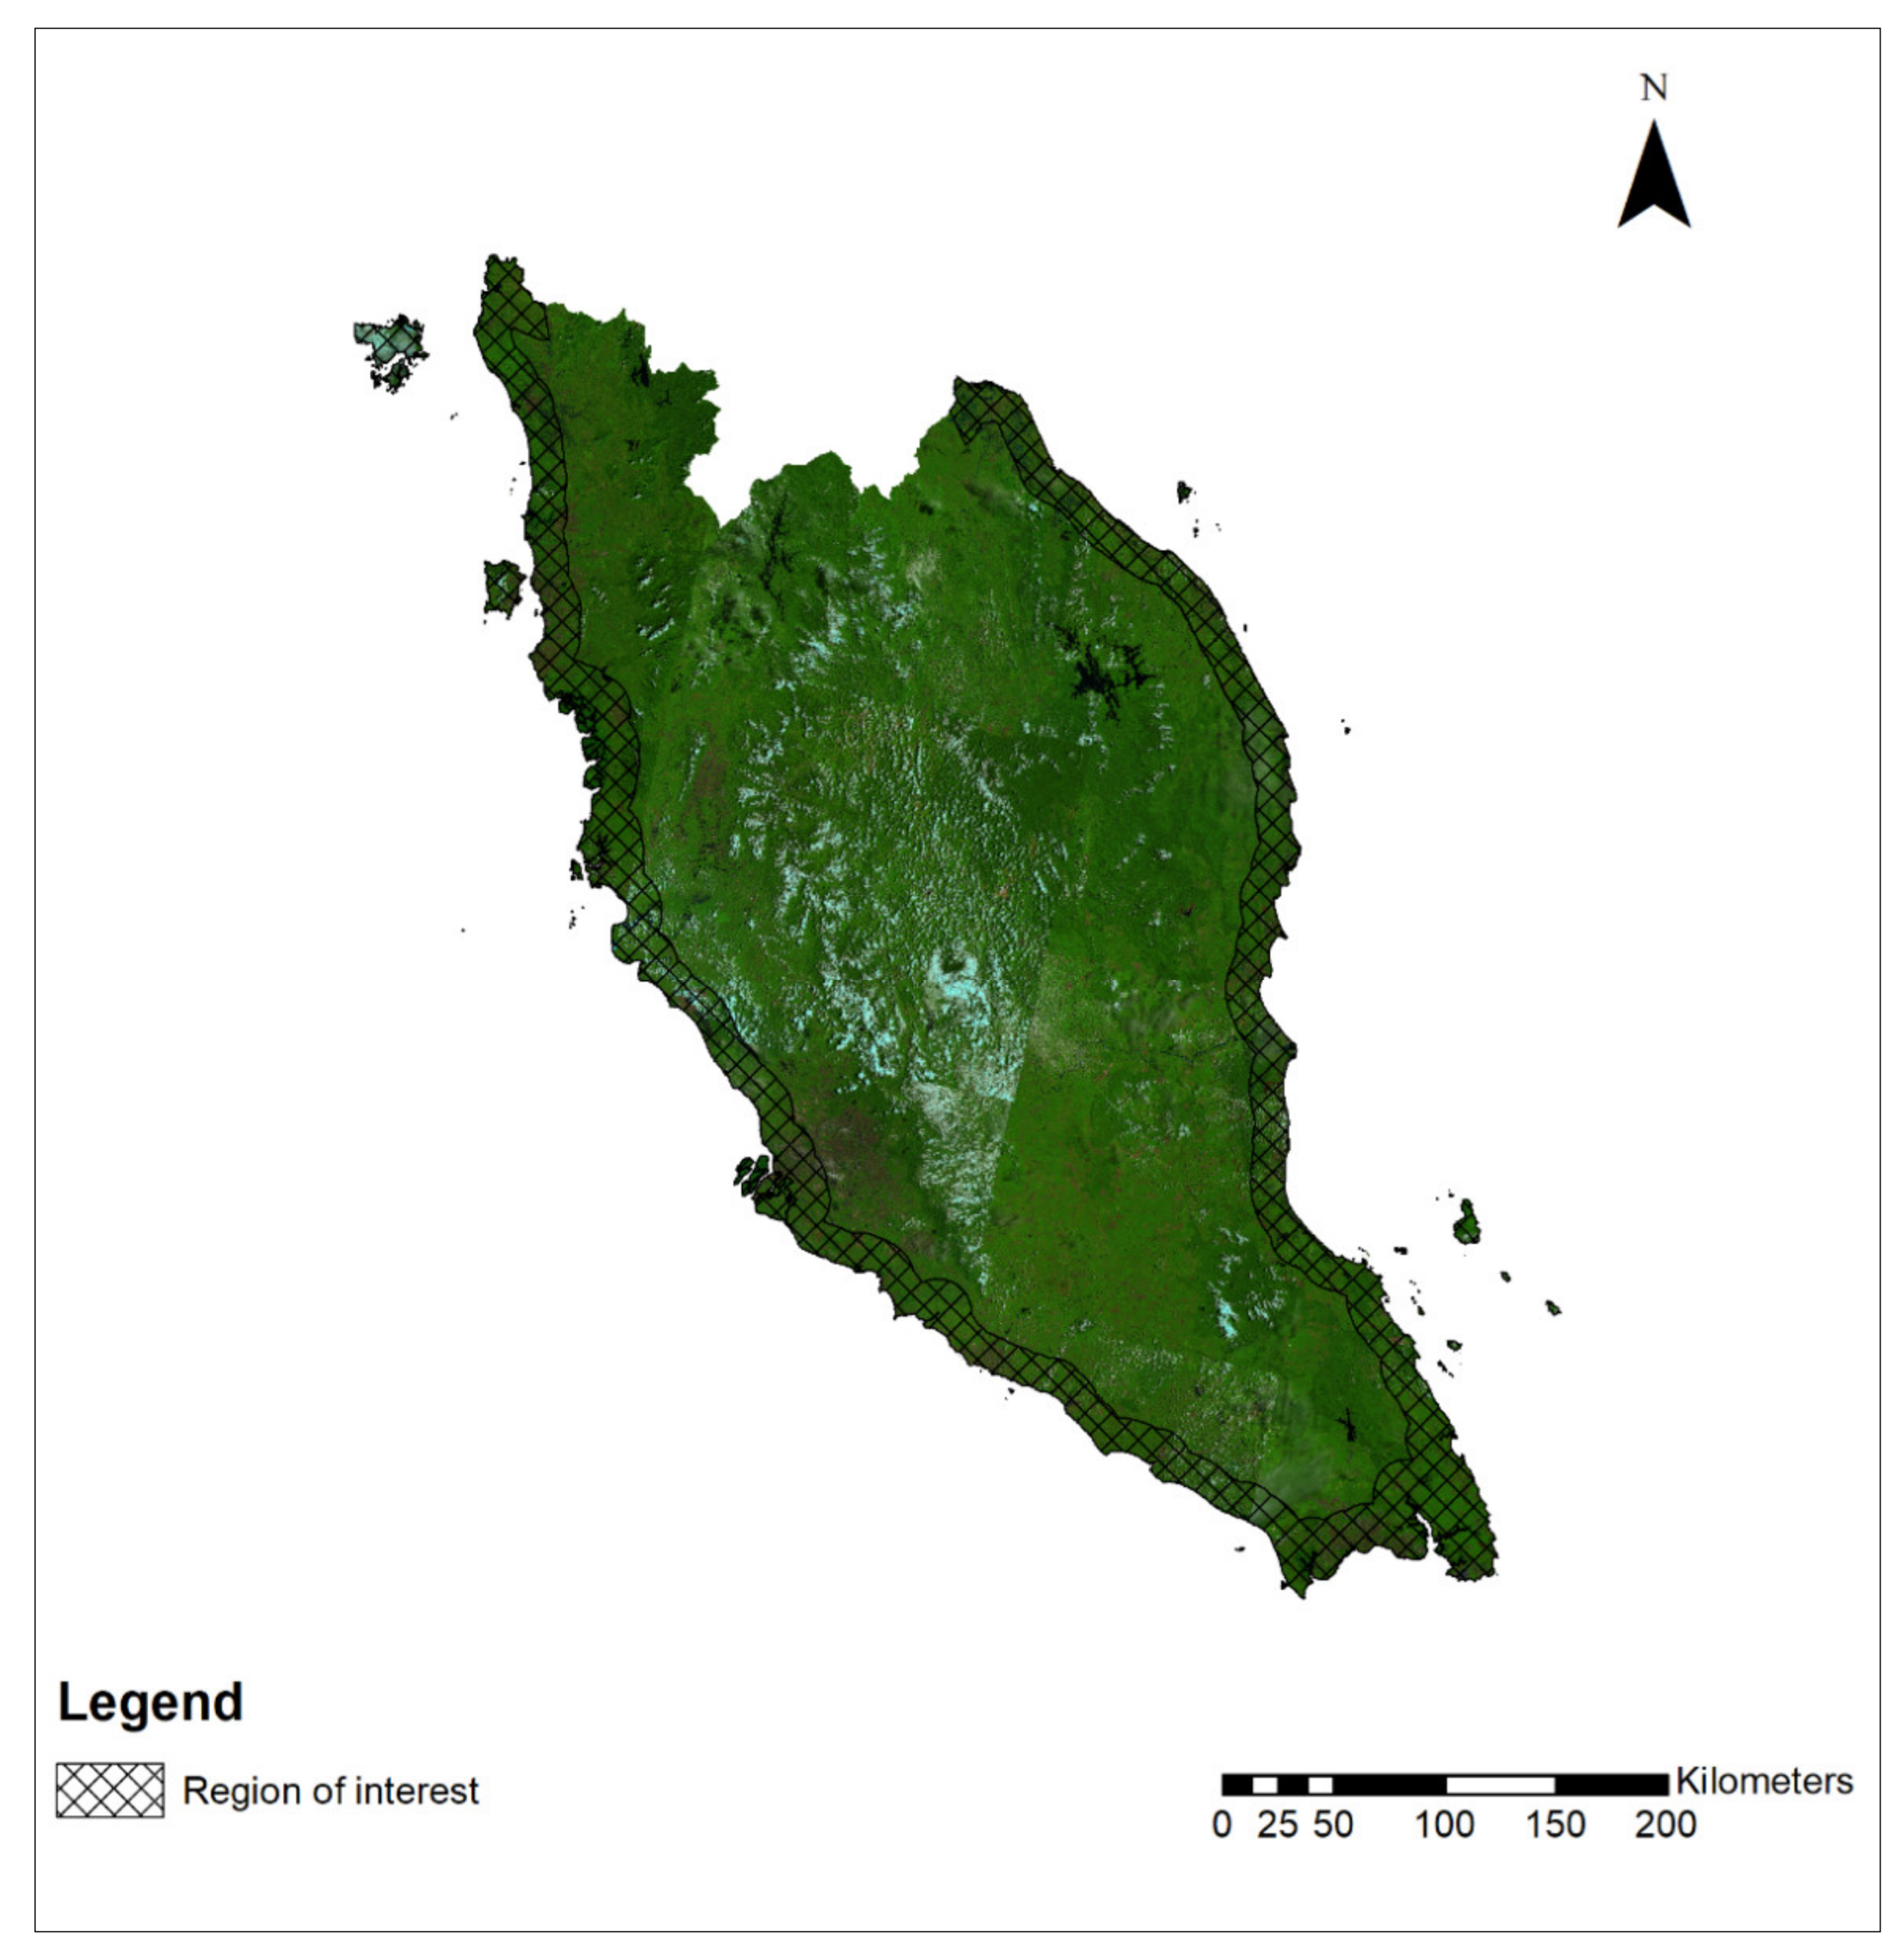
2.1. Study Area

Peninsular Malaysia, also known as West Malaysia, is the landmass connected to Thailand between the latitudes and longitudes of 01–06°N and 100–104°E (Figure 1). This landmass is separated from East Malaysia (the Malaysian states—Sabah and Sarawak) by the South China Sea. It is identified to have a tropical rainforest climate [52] with an average of 2400 mm rainfall annually and average temperatures between 26 and 28.7 °C [53]. Peninsular Malaysia also experiences monsoons, the Southwest Monsoon (April to September) and the Northeast Monsoon (October to March). Within Peninsular Malaysia, the study focuses on the coastal areas where mangroves grow.
Though Singapore was part of the Straits Settlements of British Malaya [54] and later Malaysia for a short period (September 1963–August 1965), the present study is limited to only Peninsular Malaysia due to the differences in biodiversity management policies/practices resulting from the different scale and general setting in their respective socio-political boundaries. Post-Independence, both Peninsular Malaysia and Singapore developed divergent policies for biodiversity conservation—Malaysia developed the National Policy on Biological Diversity, 1998 (revised in 2016) [55], while Singapore initiated the “Garden City” campaign in the 1960s [56], which is now known as “City in a Garden”.
This exemplifies the vast differences in natural resource management between Malaysia and Singapore with Malaysia’s focus being the preservation of the natural environment while Singapore committed to achieving environmental and water sustainability by way of a “green city”. While ecological boundaries typically do not coincide with socio-political boundaries, the latter coupled with the countries’ priority goals can impact biodiversity management negatively with the fragmentation of site ownership, administration and management of natural resources [57], in this case, the mangrove system in Malaysia and Singapore.
Additionally, as this study examines the nature of mangrove cover changes as a whole over the years, the dynamics of Singapore’s much smaller mangrove forests (Gaw et al. [58] estimated this to be 8.1 km2 in 2018) may be subsumed within the dynamism of Peninsular Malaysia’s larger mangrove system. Therefore, the overall dynamics we find may not accurately reflect Singapore’s efforts to rehabilitate its mangrove forests [59,60] and may present an inaccurate representation of the situation on the ground in terms of mangrove loss/gain and hinder conservation efforts to address the issue.

2.2. Data Collection and Analysis

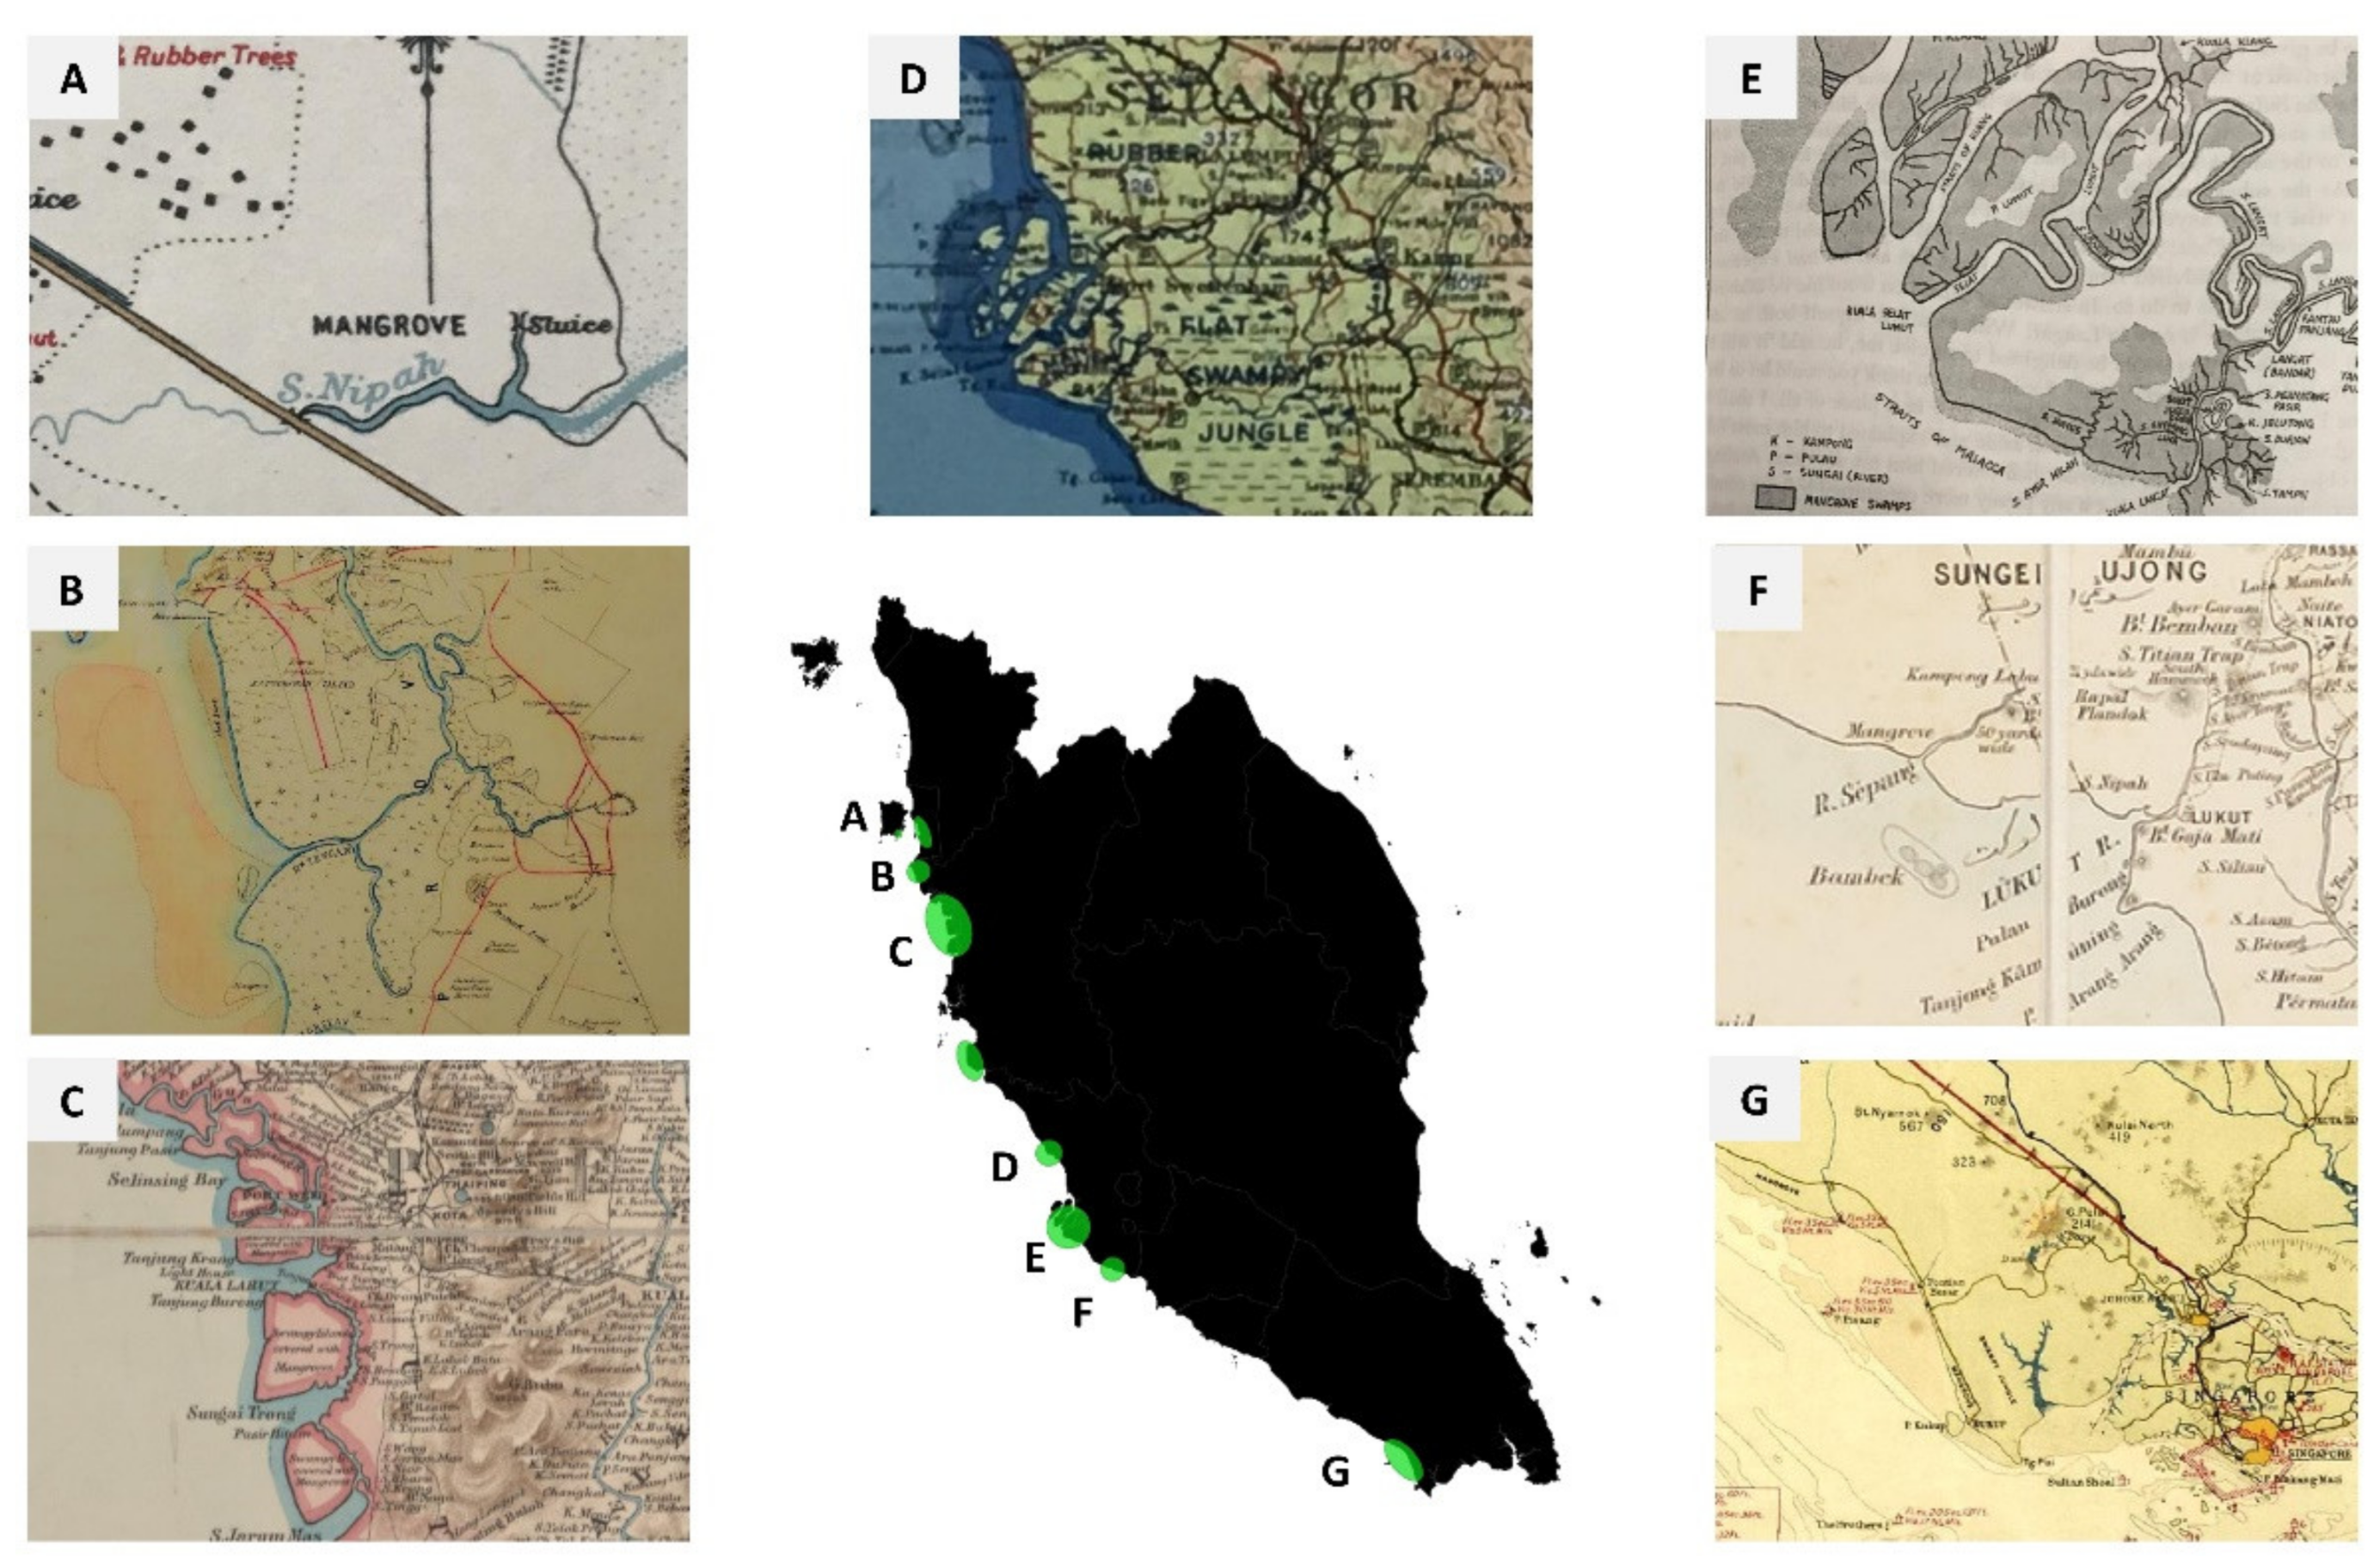
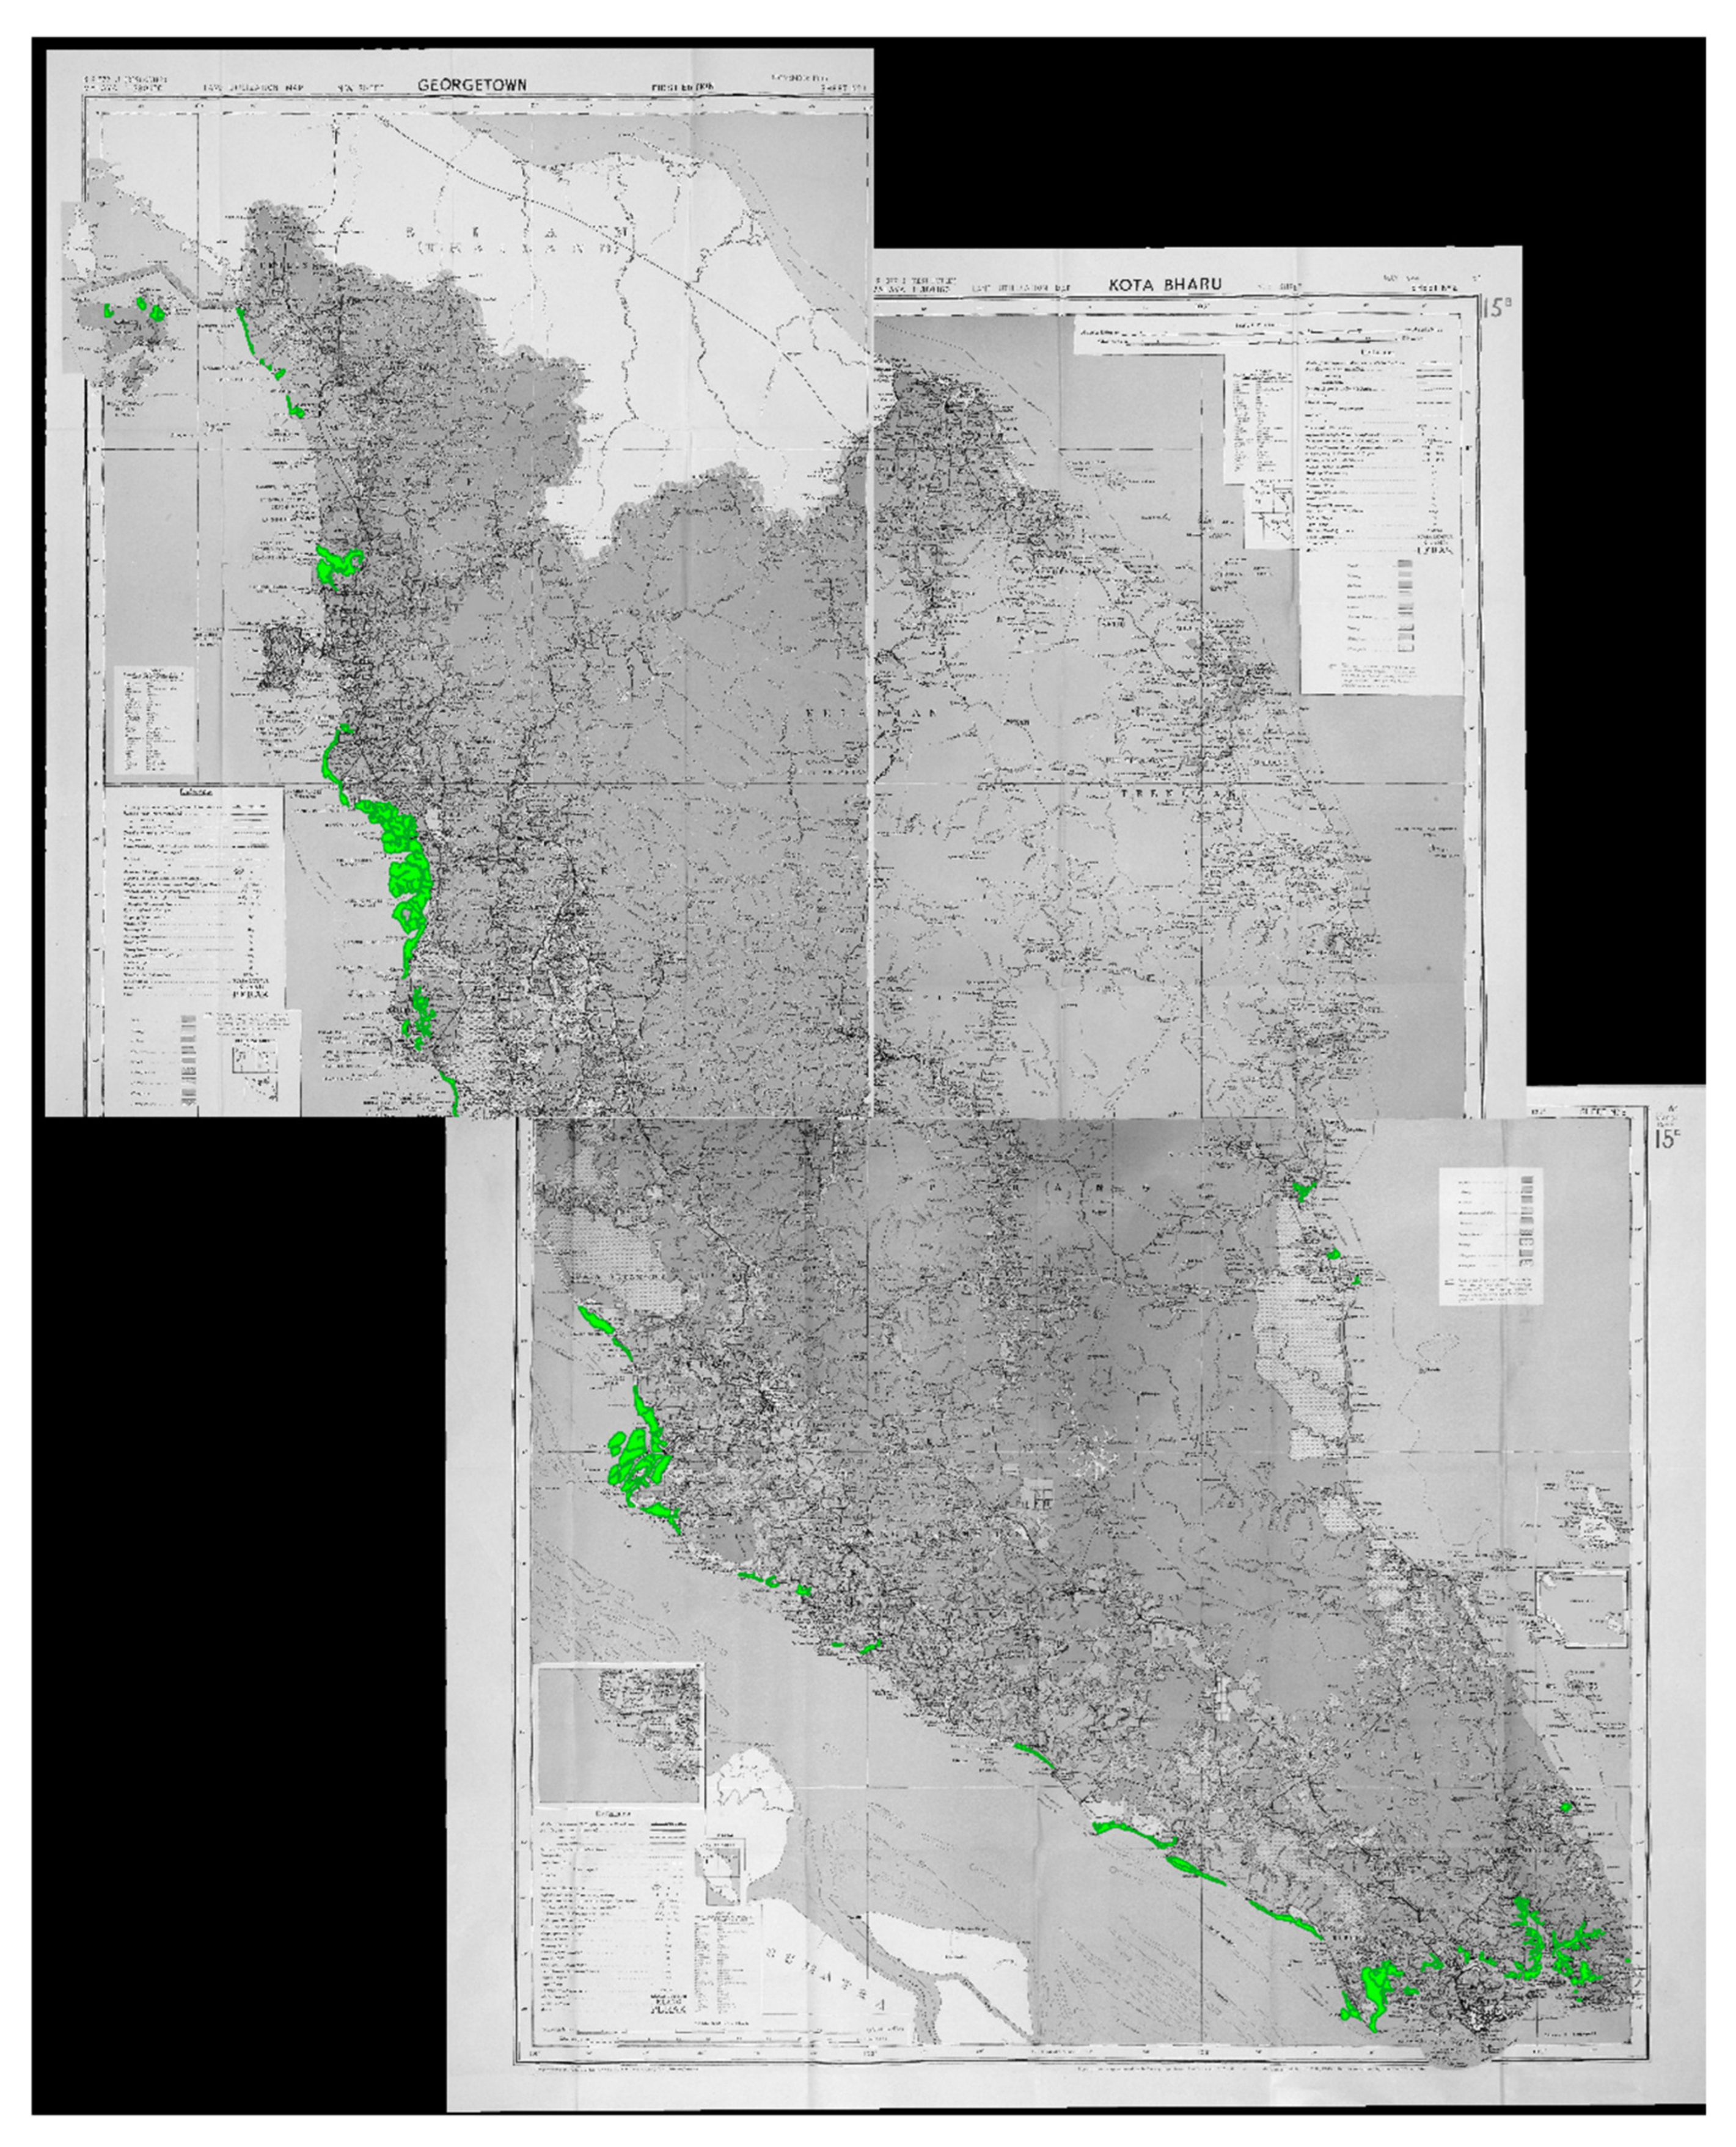
2.2.1. Historical Data

A preliminary online search was conducted with the use of meaningful keywords (see List S1 of Supplementary Materials for keywords used) in several languages including English, Malay and Dutch via online catalogues of selected archives in the United Kingdom, the Netherlands, Malaysia and Singapore (Table 1) between December 2018 and January 2019. The online catalogues provide key information, e.g., the date and author of the record as well as a concise description of the archive records that facilitate the search. Between February and April 2019, the selected archives in the United Kingdom, the Netherlands, and Malaysia were explored using the specified keywords in order to view the pre-selected records (from the preliminary online search). The National Archive of Singapore, on the other hand, had all archival records relating to Peninsular Malaysia digitised and available for online viewing. All records with notations on mangrove areas were then photographed with the permission of the respective archives.
Following the collection of the archive records, these were further categorised into two different sources: (a) primary sources, the main references that had delineated areas of mangrove on cartographic material which can be used to obtain historical mangrove presence, coverage and/or extent; or (b) secondary sources, anecdotal records which can be used as supplementary information to support the findings of the historical record analysis.
The primary sources were then pre-processed by georeferencing cartographic materials to retrieve the information (such as the mangrove area) contained within the maps using the Geospatial Data Abstraction Library (GDAL) Tools plugin on QGIS Desktop version 3.6.2 application [61]. The historical maps were georeferenced using two different methods, depending on the record type: (a) analogous georeferencing, using ground control points (GCPs) for certain features that did not change significantly over time and correspond to the old map/chart and a reference map with known geospatial information—at least 50 GCPs were used per map for this method; or (b) georeferencing using coordinate information of the map by making use of the intersection of grid lines (latitudes and longitudes) on maps/charts coupled with the corresponding geospatial information provided as the GCPs—the number of GCPs used with this method is dependent on the gridlines available on the map (at least 20 GCPs). Subsequently, a local transformation was used, the thin-plate spline method which is a non-rigid transformation [62] to warp the historical maps to match the reference map. This was used to ensure that the GCPs were perfectly aligned after transformation [63].
Next, maps with extent information of mangrove coverage were manually digitised on-screen into shapefiles to determine the exact area of mangrove during the historical period extracted from the attribute tables for the digitised area. While there are automatic digitisation methods that use computer algorithms to recognise and subsequently digitise features on maps that can eliminate initial human error, manual on-screen digitisation method was selected in this study. This is due to two considerations: (a) the accuracy of automatic digitisation is highly dependent on the quality of the historical records, i.e., archival maps with some degradation in colour or quality of the print may result in inaccurate feature recognition [64] and; (b) automatic digitisation requires manual corrections post-digitisation and therefore, can also be subject to human error, in addition to scanner errors of the software. Though manual on-screen digitisation can be a laborious task, it is presently the most accurate method of digitisation with variable quality of historical records as obtained in this study. Meanwhile, maps without extent information were processed further by pinpointing the identified mangrove systems (notations/mentions). The Root Mean Square Error RMSE, i.e., the measure of the average of the georeferencing errors, was used to determine the accuracy of the georeferenced historical maps with the following equation:
RMSE = R 2 r
where R is the difference between transformed and actual GCP locations, in pixels, and r is the total number of GCPs. The difference between the specified coordinate location of the GCPs and the actual coordinate location of the GCPs after transformation, i.e., the difference of the (x, y) coordinate positions between selected location and actual location on the georeferenced map, is known as residuals in the georeferencing process [65]. The maps were also overlaid and visually inspected to conform to a reference map, Openstreet Map [66].
Secondary sources of information obtained were used to complement the primary sources as these records did not provide comprehensive details of the geospatial information and were not expected to provide precise quantitative information needed to accurately identify and represent mangrove dynamics. These sources were used to complement the main source of historical records as an added verifier of the natural environment in the past, as well as providing insights into the lives and livelihoods of people who lived within or adjacent to mangrove systems. Secondary sources were, however, used to extract new information and search for contradictions between primary and secondary sources, where either (a) mangroves are recorded in secondary information but not found in primary sources; or (b) a site is mentioned to have no mangroves in secondary sources, but was detected in primary sources.

2.2.2. Remote Sensing Data

Landsat images from the USGS were obtained from its repository in EarthExplorer website (https://earthexplorer.usgs.gov (Accessed on 11 March 2019)) by defining the search area with the following coordinates: (1) 06°17′39.5″N, 098°38′15.4″E; (2) 07°24′24.8″N, 102°27′19.1″E; (3) 01°35′33.7″N, 105°37′23.5″E; (4) 01°1′4.4″N, 102°46′40.1″E; and (5) 02°51′3.2″N, 100°55′1.6″E.
The orbit altitudes and repeat cycle of Landsat satellites differ from one another. Landsat 1–3 had an orbit altitude of 917 km with an 18-day repeat cycle while the orbit altitude for Landsat 4–8 was reduced to 705 km with a 16-day repeat cycle [67,68]. The specifications of the various Landsat satellites are summarised in Table 2.
Terrain-corrected products (L1T) Tier 1 data from Landsat 5 (Thematic Mapper—TM), Landsat 7 (Enhanced Thematic Mapper Plus—ETM+) and Landsat 8 (Operational Land Imager—OLI) for the defined search areas were obtained for the years 1988 (Landsat 5 TM), 1992 (Landsat 5 TM), 2002 (Landsat 7 ETM+), 2012 (Landsat 7 ETM+) and 2018 (Landsat 8 OLI). The years were selected based on the availability of the full set of 14 Landsat scenes which encompassed the entire Peninsular Malaysia for each year. The 14 Landsat scenes were identified and downloaded for each year. Though there is a valid consideration of seasonality pattern (due to changes in temperature, rainfall, salinity, monsoon, etc.) observed in mangrove forests in studies in other countries [69,70], we were unable to account for seasonality in this study through the use of a particular range of months (Songsom et al. [70] found mangrove growth season in Southern Thailand to be between April and February). This is due to the lack of a complete set of Landsat scenes (14 scenes per year) needed for Peninsular Malaysia within a range of months for the years selected for this study. Furthermore, as this study focuses on the long-term dynamics of the mangrove forests, it is not possible to account for the seasonality of the mangrove forests from the historical records obtained and this is, therefore, of less relevance in a study of this scale.
However, the land cloud cover criterion was set to less than 20%, whenever possible, i.e., there are available Landsat scenes of interest for this study, in order to minimise classification errors. A higher percentage of land cloud cover was accepted (not more than 30%) if Landsat scenes with less land cloud cover were not available. These scenes were inspected visually prior to download to ensure the cloud does not cover the coastal areas of Peninsular Malaysia.
Considering that Landsat data can be subject to errors such as sensor error, solar and atmospheric effects [71], the data were pre-processed by using the Semi-Automatic Classification Plugin (SCP) on QGIS Desktop version 3.6.2. [72] to correct for these errors, i.e., atmospheric correction and radiometric correction. SCP can be used for the conversion of Landsat images to Top-of-Atmosphere (TOA) reflectance, which minimises the solar effects including solar angle and elevation. For this study, this plugin was used for atmospheric corrections of the Landsat images with the use of the Dark Object Subtraction 1 (DOS1) method which produces the surface reflectance. DOS1 method is widely used in studies detecting land-use changes [73].
For each year, 14 false-colour composites were produced using the three spectral bands from the Landsat data for each scene. For Landsat 5 and Landsat 7, the Bands 4, 3, 2 (in red, blue, green, respectively) were used to create a false-colour composite while Bands 5, 4, 3 (red, blue, green, respectively) were used for Landsat 8 dataset. A false-colour composite will display vegetation prominently in red while water bodies and urban areas are displayed in black and blue/green, respectively [74]. It also shows the highest contrast among the land-use types. A mosaic image of Peninsular Malaysia was created by overlapping these composites together and removing the regions out of interest. As mangroves grow in coastal areas, this was chosen as the region of interest for this study (Figure 2). A negative buffer set at 15 km inland from Peninsular Malaysia’s boundary was used to mask out the landmass of Peninsular Malaysia away from the coastal zone and therefore, out of the region of interest for this study.
The supervised classification (with Maximum Likelihood) method was used to classify different land uses within the negative buffer including the mangrove area using the ArcMap application of the ArcGIS 10.4 for Desktop software [75]. Though there are other newer supervised classification approaches for mangrove studies such as support vector machine, artificial neural networks, decision tree and random forest, Maximum Likelihood is one of the most used classification methods [76] and has been researched extensively in mangrove studies [77]. In addition, it is easy to implement due to its availability in commercial image processing software [76]. Moreover, Maximum Likelihood has been determined as an efficient pixel-based classification approach for mangrove studies [43] and produced higher accuracy and reduced “salt and pepper effect” when compared to support vector machine in a study in Malaysia [23].
As this study involves the whole coastline of Peninsular Malaysia, collection of GCPs on-site was not feasible within the study period. Therefore, the GCPs were collected using the Google Earth Pro for Desktop software, which enables users to view the surface of the Earth in high resolution from any location. This software provides images of Peninsular Malaysia taken from 1984 to the present. Using this software, we were able to identify land-use types at specific coordinates for each year within the region of interest (in the 15 km negative buffer) in Peninsular Malaysia, which were collected as GCPs. Approximately 350 GCPs were used to create training site polygons for each year to classify different land-use types within the region of interest including mangrove, urban development, agriculture, aquaculture, other forest types and water bodies, with at least 50 GCPs used for each class. There were two considerations used for the selection of the GCPs, which are (a) the selected GCPs were ensured to have clearly identifiable features; (b) the GCPs were visually inspected and ensured to be spread out throughout the region of interest while precisely marking a specific feature. The Maximum Likelihood algorithm assigns each pixel in the image to a particular land-use type based on its likelihood of membership [78].
Post-processing steps were carried out for the classified image to reduce noise from misclassified pixels and image enhancement to increase the overall accuracy [79]. The accuracy of the classified image was assessed in order to determine the output image quality and detect any error. A confusion or error matrix for the classified output for this study was calculated by comparing the ground truth data for each class type with a number of sample regions from the classified image [80]. A total of 1396 GCPs were used for the accuracy assessment of all the classified images. Kappa analysis was then carried out to determine the accuracy of the output image using the formula below:
κ = p o p e 1 p e
where, the Kappa coefficient, i.e., a measure that reflects the difference between the actual accuracy of the classes (κ approaches 1) and the agreement of classes that occurred by chance (κ approaches 0) [81,82], po is the observed agreement, and pe is the probability of chance agreement.
Mangrove extent was then calculated for each year using the attribute table of the classified image. As the resolution of Landsat images used in this study is 30 m (Spectral bands 4, 3, 2 for Landsat 5 TM and Landsat 7 ETM+; Bands 5, 4, 3 of Landsat 8 OLI), the area of each pixel within the Landsat scene is 900 m2 (30 m × 30 m). The equation used to calculate the mangrove area using the known number of pixels found for a specific land-use type was:
A = p x × 900   m 2 10 6
where A is the area in square kilometres and px is the number of pixels detected in the classified map as a specific type of land use.

3. Results

3.1. Retrospective Information to Study Historical Mangrove Extent in Peninsular Malaysia

The search for historical data from various repositories yielded 25 records with relevant information on mangrove cover in Peninsular Malaysia (see Table S2 of Supplementary Materials). Twelve of these records were primary sources of information (with identified or delineated mangrove areas) while the rest were secondary sources (anecdotal records). Mangrove areas in Peninsular Malaysia were either pinpointed (“mangrove” annotated on the maps/charts) or delineated in the 12 historical records (maps) dating from the late 19th century to the mid-20th century (the extent was shown on the record with the use of legends).
Ten of the primary sources were maps from 1853 up to 1958 that identified the mangrove area but did not provide quantitative information for areal extent analysis. However, these maps were still considered necessary in this study as they provided helpful information on the locations of mangrove coverage that may have been converted to other land-use types and can be used to compare and validate the gain/loss of mangroves (Figure 3). Two of the primary records identified, i.e., maps produced between 1944 and 1954, were able to provide quantitative information in terms of the mangrove extent.
From these records, it is apparent that mangrove areas were mainly observed and pinpointed on the west coast of Peninsular Malaysia (see Base map of Peninsular Malaysia in Figure 3). Mangrove areas of both Matang Mangrove Forest Reserve (in the state of Perak) and Klang Islands (in the state of Selangor) were detected on the majority of the maps (labelled as C and E, respectively, in the Base map of Peninsular Malaysia in Figure 3).
Two maps from the primary sources (Figure 4 and Figure 5) had demarcated types of land use in Peninsular Malaysia, including mangrove areas. As these maps were from the mid-1900s (1943–1944 and 1954), they were very useful in the efforts to detect and interpret mangrove system changes in terms of areal extent in Peninsular Malaysia prior to the development of remote sensing techniques. These maps were georeferenced and accuracy analysis was carried out (RMSE of 1.82 × 10⁻¹⁰ for the 1943-1944 map and 9.33 × 10⁻¹⁰ for the 1954 map). Subsequently, the digitisation process determined the area of mangroves on the 1943–44 map to be 1,389.19 km2 (Figure 4) and 1,129.76 km2 on the Forest Resources Map of Malaya, 1954 (Figure 5).
The secondary sources of information found proved to be very valuable for the validation of the primary sources. In many of the secondary sources, mangrove areas were noted to be more prevalent on the west coast than the east coast of the Malay Peninsula, verifying the information from primary sources. The book “Mangrove forests of the Malay Peninsula” by Watson [83] estimated the mangrove area to be 430 square miles (1114 km2) in the late 1920s, which was one of the secondary sources that gave information on the approximate coverage of the mangrove swamps. As none of the secondary sources found during this research contradicted any of the primary sources, the information in primary sources was easily verified. One of the written records by German [84] was an important source of new information, in that it identified a mangrove system that had not been described previously on the east coast of Peninsular Malaysia. Figure 6 below illustrates secondary sources that can be used to validate the presence of mangrove forests in an area over a long period.

3.2. Remote Sensing to Determine the Mangrove Area in Peninsular Malaysia

Five land-use classification maps were produced using remote sensing data from 1988, 1992, 2002, 2012, and 2018. The general findings of this study also revealed the prevalence of mangroves along the west coast of Peninsular Malaysia, with the greatest extent in Matang, followed by the Klang Islands and the southern part of the state of Johor.
The mangrove area in 1988 was estimated to be approximately 1221.79 km2 (overall accuracy: 89.30% and Kappa coefficient: 0.74) (Figure 7a, Table 3). There was a slight decrease in mangrove cover in 1992 as compared to 1988, with 1217.10 km2 of mangrove detected (accuracy: 89.26% and Kappa: 0.74) (Figure 7b, Table 3). The classified images for 2002, 2012 and 2018 showed a decreasing trend of mangrove coverage in Peninsular Malaysia (Figure 7c–e). The area covered by mangroves shrank in 2002 to 1087.61 km2, a reduction of 129.5 km2 from 1992 (accuracy: 96.25% and Kappa: 0.91) (Figure 7c, Table 3) and further declined to 1006.98 km2 in 2012 (accuracy: 91.29% and Kappa: 0.79) (Figure 7d, Table 3), and 962.97 km2 in 2018 (accuracy: 94.19% and Kappa: 0.81) (Figure 7e, Table 3).

4. Discussion

4.1. Use of Historical Information to Understand Mangrove System in Peninsular Malaysia

The initial search revealed that some historical records, such as sea charts and logbooks, often have detailed drawings and/or descriptions of landmarks and features [85] of the ships’ routes. Usually, the dangers along the routes that could affect the voyage (e.g., sandbars or reefs) have been described as well [30]. As a result, there was an assumption that the mangrove areas along Peninsular Malaysia’s coast would have been identified and/or described in multiple records as well as the availability of resources such as freshwater along shipping routes [30] to ensure voyagers’ safe navigation through these parts. However, historical information on Peninsular Malaysia’s mangrove systems has been difficult to come by, with only 25 records with useful information for this study being found from the 774,105 search results from the online catalogues. The findings show that when it came to mapping Peninsular Malaysia during that period, mentions of the mangrove system were the exception rather than the rule.
The lack of historical references to mangrove presence and/or cover is surprising since demarcating the mangrove areas along the coast of an important trade route of the pre-colonial era, such as the Straits of Malacca [86,87], was thought to be important to voyagers. As mangrove areas are often shallow and inaccessible, not featuring these areas in maps/charts could pose a significant risk to voyagers’ safe navigation along narrow straits. This lack of representation, however, reflects the findings of Koedam et al. [38] who suggested that the absence of mangrove depiction in historical painting (the oldest recorded as yet from 17th-century Dutch Brazil) is due to its general lack of relevance to the colonial power(s) despite its importance to local communities. This low relevance to early colonial economies is also shown by limited records in texts. Maps and most historical records are rarely completely “objective” and may include mistakes and human biases based on the mapmaker or record-keeper’s primary interests [34,88,89], such as trade or geopolitics. Moreover, “mangrove” did not have the well-defined meaning that it has in modern scientific literature as some species identified as mangrove presently were not recognised as such historically. Maps were also created for a specific purpose in order to achieve a specific goal, either economic or military, such as the “Escape and Evasion Map, 1944” (WO 418/70/3) created by the Military Intelligence Section 9 (MI9) of the War Office during the Second World War (see Table S3 of Supplementary Materials). Another possibility for the lack of mangrove representation in historical records could be due to the extent of mangroves was too small to be considered as an important feature to include on bigger scale maps, and thus it was “simplified” [88]. One could also argue that the low number of records found could be due to the choice of terms used (e.g., mangroves) during the online search which may not be the terms used by record-makers. The etymology of the term “mangrove” has been the subject of contention as it could have several origins—mangi-mangi from the now-extinct Malay term; mangle/mangue from Portuguese/Spanish; or even a composite word made of different languages [90,91]. Regardless of its etymology, ignorance of mangroves as a land cover type or terms used to identify mangroves can be ruled out as mangrove plants have been well-described since at least the 18th-century using terms such as Mangium and Mangi-Mangi (cf. Rumphius, [92] also for South-East Asia), though the terms are not restricted to what are now considered mangrove species. The latter term was also included as one of the search strings used for this study.
Secondary sources found in this study confirm that mangroves have been exploited in Peninsular Malaysia since 1900 or possibly earlier, primarily for firewood and charcoal production. In the year 1900, the firewood produced in the Perak state of Peninsular Malaysia was a lucrative “280,000 Straits dollars” (refer to the excerpt from “Report on the Present System of Forest Conservancy in the Straits Settlements, 1900” in Table S3 of Supplementary Materials), a fluctuating currency used in British Malaya since 1897 [93] until it was set at 2 shillings and 4 pence sterling for a Straits dollar in 1906 [94]. This value is equivalent in purchasing power to MYR 23,894,851.74 (EUR 4,760,053.19) in 2020 after adjusting for an average inflation rate of 4.1% per year since 1900 [95,96]. This, in turn, converts to G-K$ 19,115,881.39 in 1980 Geary–Khamis dollars (also known as international dollars), a unit used to denote adjusted value which reflects the purchasing power parity (PPP) of the chosen year for the country [97,98]. Between 1950 and 1959, the total value of mangrove firewood and charcoal from Matang was MYR 29,490.48 (EUR 5941.58) and MYR 469,869.66 (EUR 94,666.71), respectively [99]. By the end of the 1990s, however, the values of these mangrove resources had increased up to ~MYR 4899,419 (EUR 987107.50) for mangrove firewood and ~MYR 140,714,469 (EUR 28,350,363.21) for charcoal for the 10-year management period in Matang [100].
The firewood was used for various industries including as fuel for the first railway developed in British Malaya between Port Weld and Taiping in the state of Perak in 1885 [101,102]. However, despite it being a profitable natural resource in terms of commercial value, the mangrove area did not merit much importance when it came to the major mapping/delineating exercises, as evidenced by the absence of records discovered prior to the mid-1900s.
Additionally, secondary sources were also useful in identifying regions of the mangrove system that were not mapped or described before. For example, German [84] described mangrove swamps on the Kuantan River (on the east coast of Peninsular Malaysia—03°48′34.3″N, 103°20′14.8″E) which was not mapped previously. It was only in the mid-1900s that this region was demarcated as mangroves on maps (Figure 4 and Figure 5). This could be caused by one of two factors: (1) the absence of mangroves in the earlier era, followed by an expansion of mangrove cover in this region (natural or human-induced); or (2) the lack of importance of mangroves to the record-keeper, resulting in the exclusion of this information in historical records.

4.2. Dynamics of the Mangrove System in Peninsular Malaysia

Though historical areal extents of mangroves were only obtained from the mid-1990s in this study, the older records with annotations on mangroves cannot be wholly disregarded when studying the dynamics of the mangrove system in Peninsular Malaysia. Interestingly, the oldest historical map found (“Map of Pulo Penang” from 1853, Figure 3B) in this study also provided significant information on the mangrove cover dynamics in Peninsular Malaysia. Here, we found annotations on mangrove presence on the Penang mainland which was not delineated as such in any maps found post-1853. We found that when compared to the 1943-1944 map (with demarcated land-use types), the majority of this region was converted into agricultural land, predominantly rubber plantation, with a small patch of mangrove retained at the mouth of the Krian River (05°10′7.74″N, 100°25′31.32″E). This is consistent with the fact that Peninsular Malaysia experienced a “rubber boom” in the early 1900s which led to the country becoming one of the largest producers of plantation rubber in 1910 [103], with a total export value of $500 million in 1926, five-sixths of the total agricultural export value for the year [104]. This could have easily spurred the conversion of the mangrove swamps to rubber plantations within that timeframe.
In terms of areal extent, only one secondary source, i.e., Watson [83] estimated the mangrove extent in Peninsular Malaysia prior to the areal extent obtained by digitising the 1943–1944 map. Comparison of this extent information shows that there has been a significant increase in mangrove area (275.5 km2) within approximately 20 years. This is possibly due to an actual mangrove gain on the ground or the Nipa palm Nypa fruticans (Thunb.) Wurmb. (known as Nipah in Malaysia) not classified as a mangrove by the record-keeper. The latter is a possibility because the Nipa palm was listed under “beach forests” rather than “mangrove swamp forests” in the “General reports: topography, roads, towns and ports, 1944–1945” (WO 252/606, National Archives of UK, see Table S3 of Supplementary Materials) and was also considered as a crop plant at the time. It was grown for thatch and alcohol production in Peninsular Malaysia (approximately 28.66 km2 in 1926) [104] and thus may have been considered distinct from mangrove forests. Therefore, we do not consider this inconclusive extent information by Watson when considering the loss/gain of mangrove area in Peninsular Malaysia.
A summary of the types of the historical records found with notations/extent information for mangroves with possible explanations is presented in Figure 8.
There are some significant differences in the areal extent of the mangrove between 1943–44 and 1954 (see Figure 4 and Figure 5). Within this 10-year period, there was a marked decrease of 18.7% (259.43 km2) of mangrove cover. Examination of the 1954 map shows that areas designated as mangroves in the 1943–1944 map had been transformed into agricultural lands. The slump in the rubber and tin industries in the 1930s [105] may have accelerated the conversion of mangrove lands to agricultural lands, as there were efforts at agricultural diversification at the time, with oil palm plantation expansions being endorsed [106].
Remote sensing methods have now advanced to the point where images of an area can be captured remotely and then mapped. In this study, remote sensing greatly increased the quality of mangrove mapping and the precision with which mangrove coverage was calculated over time in Peninsular Malaysia. However, this too demonstrated a downward trend in mangrove cover from 1988 to 2018. This decline is also corroborated by other remote sensing studies on the mangrove cover in Peninsular Malaysia that estimated the mangrove extent in 2010 to be 1151.1 km2 [107] declined to 1109.5 km2 in 2017 [26].
We estimated the mangrove cover in Peninsular Malaysia to be 1221.79 km2 in 1988, which is 8.15% more than the mangrove cover estimated from the 1954 map (Figure 7a). While mangroves could have undergone natural rejuvenation and increased their extent, the possibility of intrinsic errors in the 1954 map should not be overlooked. The 1954 map had certain regions within Peninsular Malaysia that were not categorised and presumed to be data-deficient. These data-deficient areas included some areas on the west coast and in the southern state of Johor which were identified as mangrove areas in both the 1943–1944 map and the Landsat classification in 1988. The data deficiency is most likely due to the guerrilla war in Peninsular Malaysia, the Malayan Emergency (1948–1960), which hindered forestry studies and surveys leading to significant data losses and discontinuation of research projects [108].
In the period between 1988 and 2018, we found a trend of decline of this valuable ecosystem and natural resource (Figure 7a–e). There was a minor decrease of 0.38% (4.69 km2) between 1988 and 1992, followed by loss of 10.64% (129.49 km2) in 2002, 7.41% (80.63 km2) in 2012 and 4.37% (44.01 km2) in 2018. A number of factors may have contributed to the loss of mangroves between 1988 and 2018. The conversion of mangrove forests to other land uses, such as agriculture, aquaculture and urban development, is the most likely cause of this decline. This is because the expansion of oil palm and aquaculture have been recognised as major threats to mangroves in Malaysia [17]. Malaysia has implemented several agricultural economic policies post-independence [109,110], aimed at promoting rapid agricultural growth, particularly in the oil palm industry which is considered as a cash crop till today [111]. The rapid expansion of oil palm, combined with enabling policies, has brought about fragmentation and loss of forest and transformed Peninsular Malaysia’s landscape into one that is agriculture-dominated [112].
From this study, we learned that mangrove forests in Peninsular Malaysia have undergone dramatic changes over the years. Peninsular Malaysia has lost 426.22 km2 in total since 1944, accounting for 30.7% of the original estimated area, which is a loss of 5.76 km2 per year on average. With less than 1% mangrove cover of the total land extent in Peninsular Malaysia presently, this is a significant loss of this indispensable ecosystem. In Peninsular Malaysia, agricultural commodification has resulted in an unsustainable expansion of agriculture which is steadily displacing the natural mangrove systems.
The complementary use of historical archive records and remote sensing techniques in this study has produced important information on spatio-temporal dynamics of mangrove forests in Peninsular Malaysia which has not been explored before. This study has enabled us to understand and make use of old archival records to identify the presence/absence of mangrove systems, even using records without mangrove extent information. Extraction of information from old records followed by information obtained with the advent of remote sensing techniques, allowed us to identify mangrove forests in Peninsular Malaysia since 1853 and enabled us to evaluate dynamics over a period of 74 years.
One of the potential limitations of this study is that the seasonality of mangrove forests has not been taken into account. Due to the unavailability of range-filtered data, it is possible that the results may show minor seasonality-related errors due to different points in the mangrove growing season captured over the years for this study. Nonetheless, the study results show a steady decline of the mangrove forests in Peninsular Malaysia over the years which cannot be attributed to only seasonal errors. This, considered in conjunction with the scale of this study (in terms of years and area size), shows that seasonal errors are of minimal significance. Seasonality can potentially be addressed in future studies in which the effect of seasonality data on the long-term mangrove dynamics in Peninsular Malaysia can be investigated to add to the understanding of spatio-temporal dynamics. Secondly, no ground truth data points were collected in this study with consideration of sampling technique (random/stratified) due to the extensiveness of the area covered in this study. However, as we were able to (a) use passive ground-truthing from extensive experience in other fieldworks in mangrove forests in Peninsular Malaysia; and (b) recognise mangroves from past and present on imagery [113,114], we did not require additional ground-truthing for this study. In future studies on mangrove dynamics, there is a need to collect ground-truthing data using robust sampling techniques in order to describe the qualitative changes in mangrove systems with limited biases. It is important to note that since ground truthing can only be carried out in the present, it is not possible to have ground-truthing data for a retrospective study on mangrove dynamics.

5. Conclusions

In order to explore the mangrove dynamics in Peninsular Malaysia, we made use of historical records in conjunction with recent remote sensing data in this study. Our findings show that despite Peninsular Malaysia being a well-known and surveyed area as compared to other mangrove regions worldwide, there was a limited interest of colonial economies for mangroves besides direct exploitation for local industrial or other uses. This, in turn, has generated few historical quantitative estimates of mangroves which could be due to the effort required to map such areas that were deemed not worthwhile. Nevertheless, the limited primary and secondary records found do allow for validation of mangrove presence and were still able to provide useful information to better understand the changes in mangrove systems over the years. The findings show that mangrove cover in Peninsular Malaysia is dwindling, with a loss of 30.7% of the original extent since the 1940s.
This study, the first of its kind in Peninsular Malaysia, offers a good understanding of the changes that have occurred in the mangrove systems and will serve as a good baseline for future research on mangrove dynamics in Malaysia. There is a need to strengthen historical information on the mangrove systems in Peninsular Malaysia by studying and mining information from other archives and other information sources (e.g., land survey documents) to complement the information currently available and potentially define mangrove dynamics over a longer period. Other types of archive records, such as notarial acts, site management plans and cadastre, offer possibilities for such studies at the local level but not at the scale of the entire Peninsular Malaysia.
As this study provides us with the information on the locations of historical mangrove systems, we should focus our conservation and management actions on the possibility of restoring and rehabilitating these historical mangrove systems in order to arrest and reverse the decline in mangrove cover. Restoration and rehabilitation of mangrove forests should, however, be undertaken with caution after underlying issues that may affect the process are addressed such as changes in salinity or the hydrological system which is recognised by Bosire et al. [115] as one of the main factors to implement a successful restoration project.

Supplementary Materials

The following are available online at https://www.mdpi.com/article/10.3390/rs13173403/s1, List S1: Keywords used for Preliminary Research–in English, Dutch and Malay, Table S1: List of Landsat Images Used Each Year for 1988, 1992, 2022, 2012 and 2018, Table S2: Complete List of Primary Sources Obtained with Annotation or Delineated Mangrove Areas in Peninsular Malaysia, Table S3: List of Secondary Sources (Personal journal, books, reports, etc.) with Mentions of Mangroves in Peninsular Malaysia.

Author Contributions

Conceptualization, F.D.-G.; methodology, L.G.; M.B.V.; N.K. and F.D.-G.; validation, L.G.; N.K. and F.D.-G.; formal analysis, L.G. and M.B.V.; investigation, L.G.; N.K. and F.D.-G.; resources, L.G.; D.C.; G.W.; N.K. and F.D.-G.; data curation, L.G.; N.K. and F.D–G; writing—original draft preparation, L.G.; writing—review and editing, L.G.; B.S.; D.C.; G.W.; A.A.A.; M.B.V.; A.B.M.; N.K. and F.D.-G.; supervision, B.S.; M.B.V.; A.B.M.; N.K. and F.D.-G.; project administration, B.S. and F.D.-G.; funding acquisition, F.D.-G. All authors have read and agreed to the published version of the manuscript.

Funding

This research received no external funding.

Data Availability Statement

The data presented in this study are available within the article or Supplementary Material provided above.

Acknowledgments

L.G. was financed by the European Commission-funded Erasmus Mundus Masters Course in Tropical Biodiversity and Ecosystem (TROPIMUNDO). L.G. acknowledges the Australian National University for permitting the use of the Forest Resources Map of Malaya, 1954 of the ANU Asia-Pacific map Collection and National Archives of the Netherland for the use of Map of the Malay Peninsula, 1879 and Vegetation Map of Malaysia, 1958 in this study. L.G. would also like to extend her gratitude to Mr Jelle Rondelez of VLIZ for technical assistance during this study. This paper was published with the support of the Belgian University Foundation (Universitaire Stichting van België—Fondation Universitaire de la Belgique).

Conflicts of Interest

The authors declare no conflict of interest.

References

  1. Donato, D.C.; Kauffman, J.B.; Murdiyarso, D.; Kurnianto, S.; Stidham, M.; Kanninen, M. Mangroves among the most carbon-rich forests in the tropics. Nat. Geosci. 2011, 4, 293–297. [Google Scholar] [CrossRef]
  2. Alongi, D.M. Carbon cycling and storage in mangrove forests. Ann. Rev. Mar. Sci. 2014, 6, 195–219. [Google Scholar] [CrossRef] [PubMed]
  3. Dahdouh-Guebas, F.; Hugé, J.; Abuchahla, G.M.O.; Cannicci, S.; Jayatissa, L.P.; Kairo, J.G.; Kodikara Arachchilage, S.; Koedam, N.; Mafaziya Nijamdeen, T.W.G.F.; Mukherjee, N.; et al. Reconciling nature, people and policy in the mangrove social-ecological system through the adaptive cycle heuristic. Estuar. Coast. Shelf Sci. 2021, 248, 106942. [Google Scholar] [CrossRef]
  4. Dahdouh-Guebas, F.; Mathenge, C.; Kairo, J.G.; Koedam, N. Utilization of mangrove wood products around Mida Creek “Kenya” amongst subsistence and commercial users. Econ. Bot. 2000, 54, 513–527. [Google Scholar] [CrossRef]
  5. Walters, B.B. Patterns of local wood use and cutting of Philippine mangrove forests. Econ. Bot. 2005, 59, 66–76. [Google Scholar] [CrossRef]
  6. Jayatissa, L.P.; Hettiarachi, S.; Dahdouh-Guebas, F. An attempt to recover economic losses from decadal changes in two lagoon systems of Sri Lanka through a newly patented mangrove product. Environ. Dev. Sustain. 2006, 8, 585–595. [Google Scholar] [CrossRef] [Green Version]
  7. Aye, W.N.; Wen, Y.; Marin, K.; Thapa, S.; Tun, A.W. Contribution of mangrove forest to the livelihood of local communities in Ayeyarwaddy Region, Myanmar. Forests 2019, 10, 414. [Google Scholar] [CrossRef] [Green Version]
  8. Lee, S.Y.; Primavera, J.H.; Dahdouh-Guebas, F.; Mckee, K.; Bosire, J.O.; Cannicci, S.; Diele, K.; Fromard, F.; Koedam, N.; Marchand, C.; et al. Ecological role and services of tropical mangrove ecosystems: A reassessment. Glob. Ecol. Biogeogr. 2014, 23, 726–743. [Google Scholar] [CrossRef]
  9. Dasgupta, S.; Islam, M.S.; Huq, M.; Khan, Z.H.; Hasib, M.R. Quantifying the protective capacity of mangroves from storm surges in coastal Bangladesh. PLoS ONE 2019, 14, e0214079. [Google Scholar] [CrossRef]
  10. Hochard, J.P.; Hamilton, S.; Barbier, E.B. Mangroves shelter coastal economic activity from cyclones. Proc. Natl. Acad. Sci. USA 2019, 116, 12232–12237. [Google Scholar] [CrossRef] [Green Version]
  11. Nagelkerken, I.; Faunce, C.H. What makes mangroves attractive to fish? Use of artificial units to test the influence of water depth, cross-shelf location, and presence of root structure. Estuar. Coast. Shelf Sci. 2008, 79, 559–565. [Google Scholar] [CrossRef]
  12. Serafy, J.E.; Shideler, G.S.; Araújo, R.J.; Nagelkerken, I. Mangroves enhance reef fish abundance at the Caribbean regional scale. PLoS ONE 2015, 10, e0142022. [Google Scholar] [CrossRef] [Green Version]
  13. Glazner, R.; Blennau, J.; Armitage, A.R. Mangroves alter predator-prey interactions by enhancing prey refuge value in a mangrove-marsh ecotone. J. Exp. Mar. Biol. Ecol. 2020, 526, 151336. [Google Scholar] [CrossRef]
  14. Avau, J.; Cunha-Lignon, M.; De Myttenaere, B.; Godart, M.-F.; Dahdouh-Guebas, F. The commercial images promoting Caribbean mangroves to tourists: Case studies in Jamaica, Guadeloupe and Martinique. J. Coast. Res. 2011, 64, 1277–1281. [Google Scholar]
  15. Satyanarayana, B.; Bhanderi, P.; Debry, M.; Maniatis, D.; Foré, F.; Badgie, D.; Jammeh, K.; Vanwing, T.; Farcy, C.; Koedam, N.; et al. A socio-ecological assessment aiming at improved forest resource management and sustainable ecotourism development in the mangroves of Tanbi Wetland National Park, the Gambia, West Africa. Ambio 2012, 41, 513–526. [Google Scholar] [CrossRef]
  16. Spalding, M.; Parrett, C.L. Global patterns in mangrove recreation and tourism. Mar. Policy 2019, 110, 103540. [Google Scholar] [CrossRef]
  17. Richards, D.R.; Friess, D.A. Rates and drivers of mangrove deforestation in Southeast Asia, 2000–2012. Proc. Natl. Acad. Sci. USA 2016, 113, 344–349. [Google Scholar] [CrossRef] [Green Version]
  18. Thomas, N.; Lucas, R.; Bunting, P.; Hardy, A.; Rosenqvist, A.; Simard, M. Distribution and drivers of global mangrove forest change, 1996–2010. PLoS ONE 2017, 12, e0179302. [Google Scholar] [CrossRef] [PubMed] [Green Version]
  19. Goldberg, L.; Lagomasino, D.; Thomas, N.; Fatoyinbo, T. Global declines in human-driven mangrove loss. Glob. Change Biol. 2020, 26, 5844–5855. [Google Scholar] [CrossRef] [PubMed]
  20. Dahdouh-Guebas, F.; Ajonina, G.N.; Amir, A.A.; Andradi-Brown, D.A.; Aziz, I.; Balke, T.; Barbier, E.B.; Cannicci, S.; Cragg, S.M.; Cunha-Lignon, M.; et al. Public Perceptions of Mangrove Forests Matter for Their Conservation. Front. Mar. Sci. 2020, 7, 901. [Google Scholar] [CrossRef]
  21. Sulong, I.; Mohd-Lokman, H.; Mohd-Tarmizi, K.; Ismail, A. Mangrove Mapping Using Landsat Imagery and Aerial Photographs: Kemaman District, Terengganu, Malaysia. Environ. Dev. Sustain. 2002, 4, 135–152. [Google Scholar] [CrossRef]
  22. Azian, M.; Ismail Adnan, A.M.; Mohd Hasmadi, I. The use of remote sensing for monitoring spatial and temporal changes in mangrove management. Malaysian For. 2009, 72, 15–22. [Google Scholar]
  23. Kanniah, K.D.; Sheikhi, A.; Cracknell, A.P.; Goh, H.C.; Tan, K.P.; Ho, C.S.; Rasli, F.N. Satellite images for monitoring mangrove cover changes in a fast growing economic region in southern Peninsular Malaysia. Remote Sens. 2015, 7, 14360–14385. [Google Scholar] [CrossRef] [Green Version]
  24. Ibharim, N.A.; Mustapha, M.A.; Lihan, T.; Mazlan, A.G. Mapping mangrove changes in the Matang Mangrove Forest using multi temporal satellite imageries. Ocean Coast. Manag. 2015, 114, 64–76. [Google Scholar] [CrossRef]
  25. Satyanarayana, B.; Muslim, A.M.; Izzaty Horsali, N.A.; Mat Zauki, N.A.; Otero, V.; Nadzri, M.I.; Ibrahim, S.; Husain, M.-L.; Dahdouh-Guebas, F. Status of the undisturbed mangroves at Brunei Bay, East Malaysia: A preliminary assessment based on remote sensing and ground-truth observations. PeerJ 2018, 6, e4397. [Google Scholar] [CrossRef] [Green Version]
  26. Omar, H.; Misman, M.A. Extents and distribution of mangroves in Malaysia. In Status of Mangroves in Malaysia; Omar, H., Husin, T.M., Parlan, I., Eds.; Forest Research Institute Malaysia: Kepong, Malaysia, 2020; pp. 2–41. ISBN 8190108905. [Google Scholar]
  27. Kint, A. De luchtfoto en de topografische terreingesteldheid in de mangrove. Trop. Nat. 1934, 23, 173–189. [Google Scholar]
  28. Alleng, G.P. Historical development of the Port Royal mangrove wetland Jamaica. J. Coast. Res. 1998, 14, 951–959. [Google Scholar]
  29. Dahdouh-Guebas, F.; Verheyden, A.; De Genst, W.; Hettiarachchi, S.; Koedam, N. Four decade vegetation dynamics in Sri Lankan mangroves as detected from sequential aerial photography: A case study in Galle. Bull. Mar. Sci. 2000, 67, 741–759. [Google Scholar]
  30. Dahdouh-Guebas, F.; Hettiarachchi, S.; Lo Seen, D.; Batelaan, O.; Sooriyarachchi, S.; Jayatissa, L.P.; Koedam, N. Transitions in ancient inland freshwater resource management in Sri Lanka affect biota and human populations in and around coastal lagoons. Curr. Biol. 2005, 15, 579–586. [Google Scholar] [CrossRef] [Green Version]
  31. López-Angarita, J.; Roberts, C.M.; Tilley, A.; Hawkins, J.P.; Cooke, R.G. Mangroves and people: Lessons from a history of use and abuse in four Latin American countries. For. Ecol. Manag. 2016, 368, 151–162. [Google Scholar] [CrossRef] [Green Version]
  32. Hsu, L.-C.; Lee, C.-T. The current extent and historical expansion of mangroves in the Kuantu Nature Reserve, North Taiwan. J. Coast. Res. 2018, 34, 360–372. [Google Scholar] [CrossRef]
  33. Cavanaugh, K.C.; Dangremond, E.M.; Doughty, C.L.; Park Williams, A.; Parker, J.D.; Hayes, M.A.; Rodriguez, W.; Feller, I.C. Climate-driven regime shifts in a mangrove–salt marsh ecotone over the past 250 years. Proc. Natl. Acad. Sci. USA 2019, 116, 21602–21608. [Google Scholar] [CrossRef] [PubMed] [Green Version]
  34. Dahdouh-Guebas, F.; Koedam, N. Long-term retrospection on mangrove development using transdisciplinary approaches: A review. Aquat. Bot. 2008, 89, 80–92. [Google Scholar] [CrossRef] [Green Version]
  35. Beans, C. Science and Culture: Journal entries, maps, and photos help ecologists reconstruct ecosystems of the past. Proc. Natl. Acad. Sci. USA 2018, 115, 13138–13141. [Google Scholar] [CrossRef] [PubMed] [Green Version]
  36. Winchester, V.; Chaujar, R.K. Lichenometric dating of slope movements, Nant Ffrancon, North Wales. Geomorphology 2002, 47, 61–74. [Google Scholar] [CrossRef]
  37. Winstedt, R.O. A History of Malaya. J. Malayan Branch R. Asiat. Soc. 1935, 13, iii-270. [Google Scholar]
  38. Koedam, N.; Dahdouh-Guebas, F.; Lima Barcellos, R.; Van der Stocken, T. Mangroves–captured by the keen eye of a 17th century landscape painter. Dutch Crossing 2016, 41, 247–263. [Google Scholar] [CrossRef]
  39. Fuchs, R.A. A Data-Driven Reconstruction of Historic Land Cover/Use Change of Europe for the Period 1900 to 2010; Wageningen University: Wageningen, The Netherlands, 2015. [Google Scholar]
  40. Dahdouh-Guebas, F. The use of remote sensing and GIS in the sustainable management of tropical coastal ecosystems. Environ. Dev. Sustain. 2002, 4, 93–112. [Google Scholar] [CrossRef] [Green Version]
  41. Kirui, K.B.; Kairo, J.G.; Bosire, J.; Viergever, K.M.; Rudra, S.; Huxham, M.; Briers, R.A. Mapping of mangrove forest land cover change along the Kenya coastline using Landsat imagery. Ocean Coast. Manag. 2013, 83, 19–24. [Google Scholar] [CrossRef]
  42. Joyce, K.E.; Anderson, K.; Bartolo, R.E. Of course we fly unmanned—We’re women! Drones 2021, 5, 21. [Google Scholar] [CrossRef]
  43. Ruwaimana, M.; Satyanarayana, B.; Otero, V.; Muslim, A.M.; Muhammad Syafiq, A.; Ibrahim, S.; Raymaekers, D.; Koedam, N.; Dahdouh-Guebas, F. The advantages of using drones over space-borne imagery in the mapping of mangrove forests. PLoS ONE 2018, 13, e0200288. [Google Scholar] [CrossRef] [PubMed] [Green Version]
  44. Lucas, R.; Van De Kerchove, R.; Otero, V.; Lagomasino, D.; Fatoyinbo, L.; Omar, H.; Satyanarayana, B.; Dahdouh-Guebas, F. Structural characterisation of mangrove forests achieved through combining multiple sources of remote sensing data. Remote Sens. Environ. 2020, 237, 111543. [Google Scholar] [CrossRef]
  45. Lucas, R.; Otero, V.; Van De Kerchove, R.; Lagomasino, D.; Satyanarayana, B.; Fatoyinbo, T.; Dahdouh-Guebas, F. Monitoring Matang’s Mangroves in Peninsular Malaysia through Earth observations: A globally relevant approach. Land Degrad. Dev. 2021, 32, 354–373. [Google Scholar] [CrossRef]
  46. Wulder, M.A.; White, J.C.; Loveland, T.R.; Woodcock, C.E.; Belward, A.S.; Cohen, W.B.; Fosnight, E.A.; Shaw, J.; Masek, J.G.; Roy, D.P. The global Landsat archive: Status, consolidation, and direction. Remote Sens. Environ. 2016, 185, 271–283. [Google Scholar] [CrossRef] [Green Version]
  47. Cohen, W.B.; Goward, S.N. Landsat’s Role in Ecological Applications of Remote Sensing. Bioscience 2004, 54, 535–545. [Google Scholar] [CrossRef]
  48. Wulder, M.A.; Masek, J.G.; Cohen, W.B.; Loveland, T.R.; Woodcock, C.E. Opening the archive: How free data has enabled the science and monitoring promise of Landsat. Remote Sens. Environ. 2012, 122, 2–10. [Google Scholar] [CrossRef]
  49. Abdul Aziz, A.; Phinn, S.; Dargusch, P.; Omar, H.; Arjasakusuma, S. Assessing the potential applications of Landsat image archive in the ecological monitoring and management of a production mangrove forest in Malaysia. Wetl. Ecol. Manag. 2015, 23, 1049–1066. [Google Scholar] [CrossRef]
  50. Woodcock, C.E.; Allen, R.; Anderson, M.; Belward, A.; Bindschadler, R.; Cohen, W.; Gao, F.; Goward, S.N.; Helder, D.; Helmer, E.; et al. Free Access to Landsat Imagery. Science 2008, 320, 1011–1012. [Google Scholar] [CrossRef]
  51. Kuenzer, C.; Bluemel, A.; Gebhardt, S.; Quoc, T.V.; Dech, S. Remote sensing of mangrove ecosystems: A review. Remote Sens. 2011, 3, 878–928. [Google Scholar] [CrossRef] [Green Version]
  52. Peel, M.C.; Finlayson, B.L.; Mcmahon, T.A. Updated world map of the Köppen-Geiger climate classification. Hydrol. Earth Syst. Sci. Discuss. Eur. Geosci. Union 2007, 11, 1633–1644. [Google Scholar] [CrossRef] [Green Version]
  53. Tang, K.H.D. Climate change in Malaysia: Trends, contributors, impacts, mitigation and adaptations. Sci. Total Environ. 2019, 650, 1858–1871. [Google Scholar] [CrossRef] [PubMed]
  54. Turnbull, C.M. The Straits Settlements 1826–1867: Indian Presidency to Crown Colony; The Athlone Press, University of London: London, UK, 1972. [Google Scholar]
  55. MOSTE. The National Policy on Biological Diversity; Ministry of Science, Technology and the Environment of Malaysia—MOSTE: Kuala Lumpur, Malaysia, 1998; ISBN 983-99248-1-8. [Google Scholar]
  56. National Parks Board of Singapore. First National Report under the Convention on Biological Diversity; National Parks Board of Singapore: Singapore, 1997.
  57. Dallimer, M.; Strange, N. Why socio-political borders and boundaries matter in conservation. Trends Ecol. Evol. 2015, 30, 132–139. [Google Scholar] [CrossRef]
  58. Gaw, L.Y.F.; Yee, A.T.K.; Richards, D.R.A. High-resolution map of Singapore’s terrestrial ecosystems. Data 2019, 4, 116. [Google Scholar] [CrossRef] [Green Version]
  59. Friess, D.A. Mangrove rehabilitation along urban coastlines: A Singapore case study. Reg. Stud. Mar. Sci. 2017, 16, 279–289. [Google Scholar] [CrossRef]
  60. Ellison, A.M.; Felson, A.J.; Friess, D.A. Mangrove rehabilitation and restoration as experimental adaptive management. Front. Mar. Sci. 2020, 7, 327. [Google Scholar] [CrossRef]
  61. QGIS Development Team. QGIS Geographic Information System. Open Source Geospatial Foundation Project. 2021. Available online: http://qgis.osgeo.org (accessed on 17 May 2021).
  62. Bookstein, F.L. Principle Warps: Thin-Plate Spline and the Decomposition of Deformations. IEEE Trans. Pattern Anal. Mach. Intell. 1989, 11, 567–585. [Google Scholar] [CrossRef] [Green Version]
  63. Goshtabsy, A. Registration of images with geometric distortions. IEEE Trans. Geosci. Remote Sens. 1988, 26, 60–64. [Google Scholar] [CrossRef]
  64. Ostafin, K.; Iwanowski, M.; Kozak, J.; Cacko, A.; Gimmi, U.; Kaim, D.; Psomas, A.; Ginzler, C.; Ostapowicz, K. Forest cover mask from historical topographic maps based on image processing. Geosci. Data J. 2017, 4, 29–39. [Google Scholar] [CrossRef] [Green Version]
  65. Conolly, J.; Lake, M. Geographical Information Systems in Archaeology. Barker, G., Ed.; Cambridge University Press: Cambridge, UK, 2006; ISBN 9780521797443. [Google Scholar]
  66. OpenStreetMap. Contributors OpenStreetMap Standard. Available online: https://planet.openstreetmap.org (accessed on 15 May 2019).
  67. Markham, B.L.; Arvidson, T.; Barsi, J.A.; Choate, M.; Kaita, E.; Levy, R.; Lubke, M.; Masek, J.G. Landsat Program. Compr. Remote Sens. 2017, 1, 27–90. [Google Scholar] [CrossRef]
  68. Loveland, T.R.; Dwyer, J.L. Landsat: Building a strong future. Remote Sens. Environ. 2012, 122, 22–29. [Google Scholar] [CrossRef]
  69. Pastor-Guzman, J.; Dash, J.; Atkinson, P.M. Remote sensing of mangrove forest phenology and its environmental drivers. Remote Sens. Environ. 2018, 205, 71–84. [Google Scholar] [CrossRef] [Green Version]
  70. Songsom, V.; Koedsin, W.; Ritchie, R.J.; Huete, A. Mangrove phenology and environmental drivers derived from remote sensing in Southern Thailand. Remote Sens. 2019, 11, 955. [Google Scholar] [CrossRef] [Green Version]
  71. Young, N.E.; Anderson, R.S.; Chignell, S.M.; Vorster, A.G.; Lawrence, R.; Evangelista, P.H. A survival guide to Landsat preprocessing. Ecology 2017, 98, 920–932. [Google Scholar] [CrossRef] [Green Version]
  72. Congedo, L. Semi-automatic classification plugin documentation. Release 2016, 4, 29. [Google Scholar]
  73. Prieto-Amparan, J.A.; Villarreal-Guerrero, F.; Martinez-Salvador, M.; Manjarrez-Domínguez, C.; Santellano-Estrada, E.; Pinedo-Alvarez, A. Atmospheric and radiometric correction algorithms for the multitemporal assessment of grasslands productivity. Remote Sens. 2018, 10, 219. [Google Scholar] [CrossRef] [Green Version]
  74. CRCSI. Earth Observation: Data, Processing and Applications; Harrison, B.A., Jupp, D.L.B., Lewis, M.M., Forster, B., Mueller, N., Smith, C., Phinn, S., Hudson, D., Grant, I., Coppa, I., Eds.; CRCSI: Melbourne, Australia, 2016; Volume 1A, ISBN 978-953-307-973-8. [Google Scholar]
  75. ESRI. ArcGIS Desktop: Release 10.4.1; Environmental Systems Research Institute: Redlands, CA, USA, 2016. [Google Scholar]
  76. Yu, L.; Liang, L.; Wang, J.; Zhao, Y.; Cheng, Q.; Hu, L.; Liu, S.; Yu, L.; Wang, X.; Zhu, P.; et al. Meta-discoveries from a synthesis of satellite- based land-cover mapping research. Int. J. Remote Sens. 2014, 35, 4573–4588. [Google Scholar] [CrossRef]
  77. Maurya, K.; Mahajan, S.; Chaube, N. Remote sensing techniques: Mapping and monitoring of mangrove ecosystem—A review. Complex Intell. Syst. 2021. [Google Scholar] [CrossRef]
  78. Jensen, J.R. Introductory Digital Image Processing: A Remote Sensing Perspective; Pearson Education, Inc.: London, UK, 2015; ISBN 9783540773405. [Google Scholar]
  79. Manandhar, R.; Odeh, I.O.A.; Ancev, T. Improving the accuracy of land use and land cover classification of Landsat data using post-classification enhancement. Remote Sens. 2009, 1, 330–344. [Google Scholar] [CrossRef] [Green Version]
  80. Congalton, R.G.; Green, K. Assessing the Accuracy of Remotely Sensed Data; CRC Press, Taylor & Francis Group: Boca Raton, FL, USA, 2008; ISBN 9781420055122. [Google Scholar]
  81. Congalton, R.G. A review of assessing the accuracy of classifications of remotely sensed data. Remote Sens. Environ. 1991, 37, 35–46. [Google Scholar] [CrossRef]
  82. Lillesand, T.M.; Kiefer, R.W.; Chipman, J.W. Remote Sensing and Image Interpretation, 5th ed.; Wiley International: Hoboken, NJ, USA, 2004; ISBN 0471152277. [Google Scholar]
  83. Watson, J.G. Mangrove Forests of the Malay Peninsula; Fraser & Neave: Singapore, 1928. [Google Scholar]
  84. German, R.L. Handbook to British Malaya; Malay States Information Agency: London, UK, 1927. [Google Scholar]
  85. Thrower, N.J.W. Maps and Civilization: Cartography in Culture and Society, 3rd ed.; The University of Chicago Press: Chicago, IL, USA, 2008; ISBN 9780226799742. [Google Scholar]
  86. Sien, C. The importance of the straits of Malacca and Singapore. Singapore J. Int. Comp. Law 1998, 2, 301–322. [Google Scholar]
  87. Borschberg, P. The Singapore and Melaka Straits; NUS Press: Singapore, 2010; ISBN 9789971694647. [Google Scholar]
  88. Wright, J.K. Map makers are human: Comments on the subjective in maps. Geogr. Rev. 1942, 32, 527–544. [Google Scholar] [CrossRef]
  89. Swetnam, T.W.; Allen, C.D.; Betancourt, J.L. Applied historical ecology: Using the past to manage for the future. Ecol. Appl. 1999, 9, 1189–1206. [Google Scholar] [CrossRef]
  90. Saenger, P. Mangrove Ecology, Silviculture and Conservation; Kluwer Academic Publishers: Dordrecht, The Netherlands, 2002; ISBN 9789401599627. [Google Scholar]
  91. Mandal, R.N.; Saenger, P.; Das, C.S.; Aziz, A. Current Status of Mangrove Forests in the Trans-boundary Sundarbans; Springer: Cham, Switzerland, 2019; Volume 30, ISBN 9783030006808. [Google Scholar]
  92. Rumphius, G.E. Het Amboinsch Kruid-Boek. Dat is, Beschryvinge van de Meest Bekende Boomen, Heesters, Kruiden, Land- en Water-planten die Men in Amboina en de Omleggende Eylanden Vind. (Herbarium Amboinense); Franciscus Changuion: Amsterdam, The Netherlands, 1743; Volume 3. [Google Scholar]
  93. Kemmerer, E.W. A gold standard for the Straits Settlements. Polit. Sci. Q. 1904, 19, 636–649. [Google Scholar] [CrossRef]
  94. Drake, P.J. Singapore and Malaysia: The monetary consequences. Aust. Outlook 1966, 20, 28–35. [Google Scholar] [CrossRef]
  95. Ding, C.H. The origins of the Malaysian currency system (1867—1906). J. Malays. Branch R. Asiat. Soc. 1966, 39, 1–18. [Google Scholar]
  96. Bank of England Inflation Calculator. Available online: https://www.bankofengland.co.uk/monetary-policy/inflation/inflation-calculator (accessed on 17 May 2021).
  97. Schmidt, M. International Dollar, Geary-Khamis Dollar. Available online: https://www.business-case-analysis.com/international-dollar.html (accessed on 17 May 2021).
  98. IMF. DataMapper World Economic Outlook 1980—2026: Implied PPP Conversion Rate [Malaysia]. Available online: https://www.imf.org/external/datamapper/profile/MYS (accessed on 17 May 2021).
  99. Noakes, D.S.P. A Working Plan for the Matang Mangrove Forest Reserve Perak; Forest Department, Federation of Malaya: Kuala Lumpur, Malaysia, 1952. [Google Scholar]
  100. Keong, G.B. A Working Plan for the Matang Mangrove Forest Reserve Perak (fourth revision); State Forestry Department: Perak Darul Ridzuan, Malaysia, 1995; 214p.
  101. Andaya, B.W.; Andaya, L.Y. A History of Malaysia, 3rd ed.; Macmillan International Higher Education: Basingstoke, UK, 2016; ISBN 1137605154. [Google Scholar]
  102. Martínez-Espinosa, C.; Wolfs, P.; Vande Velde, K.; Satyanarayana, B.; Dahdouh-Guebas, F.; Hugé, J. Call for a collaborative management at Matang Mangrove Forest Reserve, Malaysia: An assessment from local stakeholders’ view point. For. Ecol. Manag. 2020, 458, 117741. [Google Scholar] [CrossRef]
  103. Drabble, J.H. The plantation rubber industry in Malaya up to 1922. J. Malays. Branch R. Asiat. Soc. 1967, 40, 52–77. [Google Scholar]
  104. Griest, D.H. Report of the agricultural economist for 1926. Malayan Agric. J. 1927, 15, 190–201. [Google Scholar]
  105. Drabble, J.H. An Economic History of Malaysia, c. 1800–1990: The Transition to Modern Economic Growth; Reid, A., Booth, A., Falkus, M., Snooks, G., Eds.; MacMillan Press Ltd.: London, UK, 2000; ISBN 9780333714294. [Google Scholar]
  106. Courtenay, P.P. The diversification of Malaysian agriculture, 1950–1980: Objectives and achievements. J. Southeast Asian Stud. 1984, 15, 166–181. [Google Scholar] [CrossRef]
  107. Hamdan, O.; Mohd Azahari, F.; Audi Hani, A.; Khairul Azwan, M. Distribution and extents of mangroves. In Status of Mangroves in Peninsular Malaysia; Hamdan, O., Khali Aziz, H., Shamsudin, I., Raja Barizan, R.S., Eds.; Forest Research Institute Malaysia: Kepong, Malaysia, 2012; pp. 60–87. ISBN 9789675221422. [Google Scholar]
  108. Menon, K.D. A Brief History of Forest Research in Malaya. Commonw. For. Rev. 1969, 48, 309–316. [Google Scholar]
  109. Wan, L.F. Policies for agricultural development in Peninsular Malaysia. Land Use Policy 1985, 2, 30–40. [Google Scholar] [CrossRef]
  110. Lee, C.; Chew-Ging, L. The evolution of development planning in Malaysia. J. Southeast Asian Econ. 2017, 34, 436–461. [Google Scholar] [CrossRef]
  111. Koh, L.P.; Wilcove, D.S. Cashing in palm oil for conservation. Nature 2007, 448, 993–994. [Google Scholar] [CrossRef]
  112. Abdullah, S.A.; Hezri, A.A. From forest landscape to agricultural landscape in the developing tropical country of Malaysia: Pattern, process, and their significance on policy. Environ. Manag. 2008, 42, 907–917. [Google Scholar] [CrossRef] [PubMed]
  113. Verheyden, A.; Hettiarachchi, S.; Koedam, N.; Dahdouh-Guebas, F.; Thomaes, K.; De Genst, W. High-resolution vegetation data for mangrove research as obtained from aerial photography. Environ. Dev. Sustain. 2002, 4, 113–133. [Google Scholar] [CrossRef]
  114. Dahdouh-Guebas, F.; Verheyden, A.; Kairo, J.G.; Jayatissa, L.P.; Koedam, N. Capacity building in tropical coastal resource monitoring in developing countries: A re-appreciation of the oldest remote sensing method. Int. J. Sustain. Dev. World Ecol. 2006, 13, 62–76. [Google Scholar] [CrossRef] [Green Version]
  115. Bosire, J.O.; Dahdouh-Guebas, F.; Walton, M.; Crona, B.I.; Lewis, R.R.; Field, C.; Kairo, J.G.; Koedam, N. Functionality of restored mangroves: A review. Aquat. Bot. 2008, 89, 251–259. [Google Scholar] [CrossRef] [Green Version]
Figure 1. Map of Peninsular Malaysia. (Source: Map Data © 2021 Google Imagery © 2021 Landsat/Copernicus).
Remotesensing 13 03403 g001
Figure 2. Region of interest for this study—coastal areas of Peninsular Malaysia where mangroves grow. © Landsat-8 images courtesy of the U.S. Geological Survey.
Remotesensing 13 03403 g002
Figure 3. Base map of Peninsular Malaysia showing the locations of historical mentions of mangrove cover (areas in green labelled (AG) denoted on the black map) with excerpts from corresponding historical maps surrounding the base map. Excerpt A: Map of Penang Aerodome—1932, (Accession N° CO 1047/957, National Archives of UK); Excerpt B: Map of Prince of Wales’ Island or Pulo Penang, and Province Wellesley—1853 (Accession N° CO 700/StraitsSettlements6, National Archives of UK); Excerpt C: A Map of the Malay Peninsula—1898 (Accession N° CO 700/StraitsSettlements31, National Archives of UK); Excerpt D: Escape and Evasion map: Sheet 44F—1944 (Accession N° WO 418/70/3, National Archives of UK); Excerpt E: Hand-drawn map of Langat District in Sir Frank Swettenham’s Malayan journals—1874–1876 (Accession N° 959.5030924, UK Archive Library); Excerpt F: Map of the Malay Peninsula—1879 (Accession N° 4.MIKO, inventarisnummer 1131A, The National Archives of the Netherlands); and Excerpt G: Aviation Map of Malaya—1935 (Accession N° CO 1047/957, National Archives of UK).
Remotesensing 13 03403 g003
Figure 4. Mangrove cover classification on Land Utilization Maps—Georgetown, Kota Bharu and Singapore, 1943–1944 (WO 252/608, National Archives of UK). The areas in green indicate the detection of mangrove forests. Separate sheets of the map were stitched together, georeferenced and displayed in grayscale to make the digitised mangrove area more prominent.
Remotesensing 13 03403 g004
Figure 5. Mangrove cover classification on Forest Resources Map of Malaya, 1954 (hdl:1885/140842, Australian National University). The areas in green indicate the detection of mangrove forests. The map is displayed in grayscale to make the digitised mangrove area more prominent.
Remotesensing 13 03403 g005
Figure 6. (a) Excerpt from “A Working Plan for Matang Mangrove Forest Reserve Perak, 1995 (fourth revision) by G.B. Keong”—Mangrove forest photographed at Pulau Pasir Hitam, Matang, Perak in 1989; (b) Photograph of mangrove forest at Matang, Perak in 2018 (Source: © Giovanna Wolswijk).
Remotesensing 13 03403 g006
Figure 7. (a) Mangrove cover classification for the year 1988 from Landsat images. © Landsat-5 images courtesy of the U.S. Geological Survey; (b) Mangrove cover classification for the year 1992 from Landsat images. © Landsat-5 images courtesy of the U.S. Geological Survey; (c) Mangrove cover classification for the year 2002 from Landsat images. © Landsat-7 images courtesy of the U.S. Geological Survey; (d) Mangrove cover classification for the year 2012 from Landsat images. © Landsat-7 images courtesy of the U.S. Geological Survey; (e) Mangrove cover classification for the year 2018 from Landsat images. © Landsat-8 images courtesy of the U.S. Geological Survey. The areas in green indicate the detection of mangrove forests.
Remotesensing 13 03403 g007
Figure 8. Summary of the different types of historical records obtained and the possible explanations for the inclusion/exclusion of information on mangrove system in Peninsular Malaysia.
Remotesensing 13 03403 g008
Table 1. Archives explored and their respective online catalogues. N.B. All archives used in our paper make reference to the accession numbers by which the archives can be found back in the catalogues in this table.
ArchiveOnline Catalogue
The National Archives, United Kingdomhttps://discovery.nationalarchives.gov.uk
(Accessed on 4–31 December 2018)
Nationaal Archief, Netherlandshttps://www.nationaalarchief.nl/en/research (Accessed on 15–31 December 2018)
National Archives of Malaysia (Arkib Negara), Malaysiahttp://compassweb.arkib.gov.my/english, (Accessed on 1–31 January 2019)
National Archives of Singapore, Singaporehttp://www.nas.gov.sg/archivesonline, (Accessed on 13–31 January 2019)
Table 2. Specification of Landsat satellite sensor, bands, wavelength and resolution.
SensorLandsat Satellite BandsWavelength
(μm)
Resolution
(m)
Multispectral Scanner (MSS)Landsat 1, 2, 3Band 4—Green0.5–0.660
Band 5—Red0.6–0.760
Band 6—Near Infrared0.7–0.860
Band 7—Near Infrared0.8–1.160
Landsat 4, 5Band 1—Green0.5–0.660
Band 2—Red0.6–0.760
Band 3—Near Infrared0.7–0.860
Band 4—Near Infrared0.8–1.160
Thematic Mapper (TM)Landsat 4, 5Band 1—Blue0.45–0.5230
Band 2—Green0.52–0.6030
Band 3—Red0.63–0.6930
Band 4—Near Infrared0.76–0.9030
Band 5—Short-wave Infrared1.55–1.7530
Band 6—Thermal Infrared10.40–12.5030
Band 7—Short-wave Infrared2.08–2.3530
Enhanced Thematic Mapper Plus
(ETM+)
Landsat 7Band 1—Blue0.45–0.5230
Band 2—Green0.52–0.6030
Band 3—Red0.63–0.6930
Band 4—Near Infrared0.77–0.9030
Band 5—Short-wave Infrared1.55–1.7530
Band 6—Thermal Infrared10.40–12.5060
Band 7—Short-wave Infrared2.09–2.3530
Band 8—Panchromatic0.52–0.9030
Operational
Land Imager (OLI)/ Thermal Infrared Sensor (TIRS)
Landsat 8Band 1—Coastal aerosol0.43–0.4530
Band 2—Blue0.45–0.5130
Band 3—Green0.53–0.5930
Band 4—Red0.64–0.6730
Band 5—Near Infrared0.85–0.8830
Band 6—Short-wave Infrared 11.57–1.6530
Band 7—Short-wave Infrared 22.11–2.2930
Band 8—Panchromatic0.50–0.6815
Band 9—Cirrus1.36–1.3830
Band 10—TIRS 110.60–11.19100
Band 11—TIRS 211.50–12.51100
Table 3. Confusion Matrix and Kappa Coefficient for 1988, 1992, 2002, 2012 and 2018 Landsat Classifications.
YearClassified MapReference Data (GCPs)TotalProducer’s AccuracyUser’s Accuracy
MangroveNon-Mangrove
1988Mangrove5786576.00087.692
Non-mangrove1816017895.23889.888
Total75168243
Total accuracy 89.30
Kappa coefficient 0.740
1992Mangrove59117079.73084.286
Non-mangrove1515717293.45291.279
Total74168242
Total accuracy 89.256
Kappa coefficient 0.743
2002Mangrove7047493.33394.595
Non-mangrove516116697.57696.988
Total75165240
Total accuracy 96.250
Kappa coefficient 0.912
2012Mangrove5736076.00095.000
Non-mangrove1816318198.19390.055
Total75166241
Total accuracy 91.286
Kappa coefficient 0.785
2018Mangrove68188690.66779.070
Non-mangrove733734494.93097.965
Total75355430
Total accuracy 94.186
Kappa coefficient 0.809
Publisher’s Note: MDPI stays neutral with regard to jurisdictional claims in published maps and institutional affiliations.

