Technical Note

Extreme Solar Events’ Impact on GPS Positioning Results

Institute of Geodesy and Geoinformatics, University of Latvia, Jelgavas 3, LV-1004 Riga, Latvia
*
Author to whom correspondence should be addressed.
Remote Sens. 2021, 13(18), 3624; https://doi.org/10.3390/rs13183624
Submission received: 18 August 2021 / Revised: 6 September 2021 / Accepted: 8 September 2021 / Published: 10 September 2021

Abstract

:
The main objective of the present study is to perform an analysis of the space weather impact on the Latvian CORS (Continuously Operating GNSS (Global Navigation Satellite System) Stations) GPS (Global Positioning System) observations, in situations of geomagnetic storms, sun flares and extreme TEC (Total Electron Content) and ROTI (Rate of change of TEC index) levels, by analyzing the results, i.e., 90-s kinematic post-processing solutions, obtained using Bernese GNSS Software v5.2. To complete this study, the 90-s kinematic time series of all the Latvian CORS for the period from 2007 to 2017 were analyzed, and a correlation between time series outliers (hereinafter referred to as faults) and extreme space weather events was sought. Over 36 million position determination solutions were examined, 0.6% of the solutions appear to be erroneous, 0.13% of the solutions have errors greater than 1 m, 0.05% have errors greater than 10 m, and 0.01% of the solutions show errors greater than 50 m. The correlation between faulty results, TEC and ROTI levels and Bernese GNSS Software v5.2 detected cycle slips was computed. This also includes an analysis of fault distribution depending on the geomagnetic latitude as well as faults distribution simultaneously occurring in some stations, etc. This work is the statistical analysis of the Latvian CORS security, mainly focusing on geomagnetic extreme events and ionospheric scintillations in the region of Latvia, with a latitude around 57°N.

Graphical Abstract

1. Introduction

This study uses observation data from the Latvian CORS network, after post processing with the Bernese GNSS Software v5.2 in kinematic mode with a sampling interval of 90 s. These results are used for the study of the Latvian CORS vulnerability control and for the statistical analysis of discrepancies in relation to the TEC and the ROTI levels. The objective of this study is to assess the risks of the CORS reliability for RTK measurements, and the publicly available TEC and ROTI reliability in connection with ionospheric irregularities in the midlatitude region of Latvia.
The term space weather refers to conditions on the sun, solar wind, and Earth’s magnetosphere, ionosphere, and thermosphere that can affect the performance and reliability of space- and ground-based technological systems and can endanger human life or health [1]. Improving the understanding and characterization of the effects of space weather phenomena on the Earth and in the space can increase situational awareness, inform decision making, and enable missions to be carried out that depend on technologies and services susceptible to disruption from space weather [2].
Ionospheric disturbances on a small scale can lead to fluctuations in the received satellite signal, so-called signal scintillations. Within GNSS, this reduces the positioning accuracy. Particularly strong events can even lead to a Loss-of-Lock between satellite and receiver, which can delay or completely invalidate a positioning solution. Every GNSS user is affected, especially users with high demands on accuracy, integrity, availability, and continuity [3].
Multiple studies of ionospheric scintillations have been performed. However, the global climate is evolving, and atmosphere irregularities are changing. The use of GNSS positioning is increasing in various applications and the awareness of space weather impact on GNSS observations is increasing.
Spogli et al. [4] discussed the possibility of investigating the dynamics of ionospheric irregularities causing scintillation by combining the information coming from a wide range of latitudes. The authors analyzed the data of ionospheric scintillation from latitudes 44–88° N during October, November and December 2003.
Similar work was carried out in Belgium by Stankov et al. [5] by studying GPS signal delay during geomagnetic storms of 29 October and 20 November 2003. The anomalous movement of ionosphere walls was studied [5]. Similar ionospheric gradients were found. Instead of the traditional Instrument Landing System (ILS), several prototype airports have used systems for GNSS landings and takeoffs. These prototype airports are in areas in which the occurrence of scintillation is negligible [6,7,8]. Stankov et al. [5] suggest that one important objective is to assess the integrity risk to GBAS/ SBAS services.
Liu et al. [9] studied the variation characteristics of the GPS-based TEC fluctuations over 21 regions of China. They studied the fluctuation intensity at various latitudes, in daytime and nighttime, during winter and summer. The ROTI indices were used to investigate the characteristics of the ionospheric TEC fluctuations during 11-year solar cycle 2002–2012 [9].
To classify the relevant orders of the magnitude and the occurrence rates Hlubek et al. [3] employed a statistical approach and large amounts of measured data were aggregated. The research by Hlubek et al. [3] concluded that a double-peak structure with the greatest scintillation intensity was observed during the spring and autumn equinoxes.
Research on the correlation between GNSS-derived ionospheric spatial de-correlation and space weather intensity for safety-critical differential GNSS systems was carried out by Lee and Lee [8]. Space weather events that occurred in 2015 have been extensively analyzed by the research society around the world. Cherniak et al. [10] investigated the dynamics of the high-latitude ionospheric irregularities during 17 March 2015 (St. Patrick’s Day Storm), using ground-based GPS measurements. The St. Patrick’s Day geomagnetic storm has been widely considered [10,11,12,13,14,15].
The results reveal interhemispheric differences in the occurrence of ionospheric irregularities. Research on variations of the TEC over the Iberian Peninsula in 2015 was performed by Morozova et al. [11], highlighting the effects of geomagnetic storms, solar flares, and solar eclipses. These authors showed that no definitive conclusions about the dependence of the TEC variation during geomagnetic storms on the season or start time can be made.
At high latitudes, the dynamic behavior of the ionosphere is dominated by the solar wind and electron precipitation (aurora borealis and aurora australis). In mid latitudes, ionospheric dynamics are dominated by the inner magnetosphere and neutral winds, the knowledge of which is incomplete [16].
Advanced studies are carried out by using space-borne exploration techniques like ionosondes, LiDAR, radio waves [17]. The geomagnetic field of the upper atmosphere, the ionospheric plasma and the GPS signal propagation in line of sight from explorer satellite to the GPS vehicle were studied in, for example, the ESA Swarm mission [18].
In high latitudes, Park et al. [19] presented the morphology of GPS TEC “perturbations” with emphasis on the orientation of plasma structures with respect to the line-of-sight direction (CHAMP mission).
Jin et al. and Park et al. [18,19] present the first comprehensive statistical results of high latitude ionospheric plasma irregularities and their dependence on the interplanetary magnetic field (IMF) configurations.
The impact of space weather on the GNSS positioning, navigation, and timing has been recognized as a serious threat [20] to the operational quality of GBAS and SBAS, and for many other positioning and navigation applications as well, such as for remote sensing vehicles, satellites, aviation, cars, trucks, farming, construction, snow removal, etc. Distortion of GNSS signals is of concern for many applications, especially those related to Safety-of-Life. However, despite the fact that the studies of the space weather are developed, not so many research activities are devoted to study the infallibility of the CORS depending on the size of the network and the covered territory.
In our study, performed at the Institute of Geodesy and Geoinformatics, University of Latvia (GGI), the Latvian CORS ground-based GPS observations were collected during the 24th solar cycle. Latvian CORS data is regularly post-processed by the GGI for the Permanent GNSS Network densification of the Regional Reference Frame Sub-Commission for Europe (EUREF), as well as for the EPOS (European Plate Observing System) program [21].
The statistical data of the results of the space weather impact on GPS observations are presented in this study. Conclusions on the security level of the Latvian CORS will be drawn on the basis of these statistics. At the end of this study, Pearson’s correlation analysis is performed on the relation characteristics of both the TEC and the ROTI to the impacted GPS positioning discrepancies. The assessment of the TEC and ROTI irregularities will be discussed.

2. Data and Methods

2.1. Bernese GNSS Software v5.2 Solutions

The analysis of the kinematic solution results of the 90-s GPS observations was used to approximate the GPS navigation situation. To identify disturbed results caused by extreme solar events of geomagnetic activity and ionospheric scintillations, the Latvian CORS 11-year, selective daily GPS observation data were post-processed in a double-difference (DD) mode using Bernese GNSS Software v5.2 [22]. Information on the ionospheric TEC levels and extreme solar events was obtained from publicly available data sets. The maximum TEC values wereextracted from CODE’S European Ionosphere information INX data files [23]. Data of solar flares and geomagnetic storms were obtained from the auroral and solar activity web page [24]. Bernese GNSS Software v5.2 program RNXSMT (detects cycle slips and outliers on RINEX level using simultaneous code and phase observations from both frequencies to each satellite; code observations are smoothed using the phase measurements) and MAUPRP (automatic phase pre-processing, cycle slip detection and correction, outlier detection, and updating of the Ambiguity List) were used for cycle slip detection [22]. The MAUPRP program was also used to repair cycle slips, with 10 cycles being the minimum size of accepted cycle slip corrections. The outputs from both programs were used to find detected cycle slips for each station and baseline. Daily RINEX observation data (30-s sampling rate) were selected, which included 4-month observation data (with high monthly TEC values) for the full set of Latvian CORS stations for each year from 2007 to 2017. The 90-s sampling interval of kinematic post-processing was chosen. There are 960 kinematic post-processing solutions per 24 h, and 28,800 sessions for each station in 30 days. For the Bernese Software v.5.2 solutions, 4 IGS/EPN (EUREF Permanent GNSS Network) stations were used as reference stations, and the Latvian CORS stations were used as rover stations. The IGS final orbit and clock data, TEC, ocean and atmosphere loading were taken into account. Stochastic ionospheric parameters and CODE’s global ionospheric maps are used. The dry Global Mapping Function (GMF) was used to model the tropospheric delay. The solutions were carried out in sets of 4–5 Latvian stations and constantly using the same IGS/ EPN reference stations. The computation of each set of 4–5 Latvian CORS stations, for an observation period of 1 month takes approximately 12–14 h. This type of computation was carried out for all the Latvian CORS stations for 4 to 5 months per year, for 11 years (2007–2017). The main post-processing strategy parameters are listed in Table 1.

2.2. Road of Performed Analysis

The post-processed observation data were analyzed by applying software programs developed at the GGI. A total of 30 software programs in Fortran g95 and Python programming language were developed. The faulty solutions were found, and the statistical analysis was performed; the data were prepared for the correlation analysis, and the correlation analysis was performed. The flowchart of the operational functions and data sets are depicted in Figure S1 in Supplementary Materials. The main functions performed were:
  • CORS observation data were post-processed and 90-s kinematic coordinate solutions were obtained. The Cartesian XYZ coordinates were converted to the national grid coordinates: Northing, Easting, Up (abbreviation denoted in Figure S1—NEh);
  • The faulty solutions where one of the coordinate components exceeded the 10 cm threshold (SW2, ALL_ERR) were searched;
  • The cycle slips identified by the Bernese GNSS Software v5.2 were listed (CSLP);
  • The monthly mean coordinate values were calculated (SW2, MONTH TREND) for each station in each month (ALL_ERR, X4);
  • The geomagnetic storms over the territory of Latvia, the TEC max values, and solar flares were extracted from the publicly available data sources [23,24] (For_CORR);
  • The occurrence of the faulty solutions was analyzed, namely: sequences of faulty solutions, simultaneous faulty solutions in numerous stations, count of cycle slips, and faulty solutions for each month and each station were determined (1_z4, Waves, 1_z6, DISCR_4, statistics in Tables S1–S8);
  • The Pearson’s correlation coefficient was computed to find the relation between TEC (set x) and count of cycle slips (set y) and, similarly, between TEC and the count of faulty solutions, as well as TEC and count of cycle slips in faulty solutions, and also between the count of cycle slips and count of faulty solutions (Correlation, R_line).

2.3. Latvian CORS Networks

There are two CORS networks included in this study: LatPos, maintained by the Latvian Geospatial Information Agency (LGIA), and EUPOS-RIGA, maintained by the Riga Municipality; and one IGS/ EPN station RIGA, which is operated by the Institute of Astronomy of the University of Latvia. Figure 1 shows the input rate (months in operation) of the Latvian CORS stations with their DOMES names. The maximum rate of input data for a stations/months included in the analysis is 46 months. The map of the Latvian CORS station sites is shown in Figure 2. The EUPOS-RIGA network consists of 5 stations, with their respective DOMES names, initially: ANNI, KREI, LUNI, MASK and VANG. Stations MASK and ANNI were operational from 2007–2011, then they were moved to other locations—SALP and VAIV respectively—and have been operational from mid-2011 up until now. DOMES names and stations are used with the same meaning in this article. At the beginning of 2007, only 23 CORS stations were operational, new stations were gradually created, and in year 2017, the number of operational stations reached 32. Many stations during the 11-year period were moved to other locations. Therefore, it is more truthful to refer to 46 sites instead of 46 stations. For example, in the city of Kuldiga, the station with a DOMES name KULD was moved to another location two times, correspondingly changing the DOMES names to KUL1 after the first move and to KUL2 after the second move (Figure 2). Among all the stations included in the analysis, only 8 stations were not moved for 46 months (Figure 2).
Over 11 years, the total number of months included in the analysis reached 46. For 2015 and 2017, 5-month observation data were analyzed, compared to 4-month observation data in each of all the other 9 years.

2.4. Monthly Mean Station Coordinates

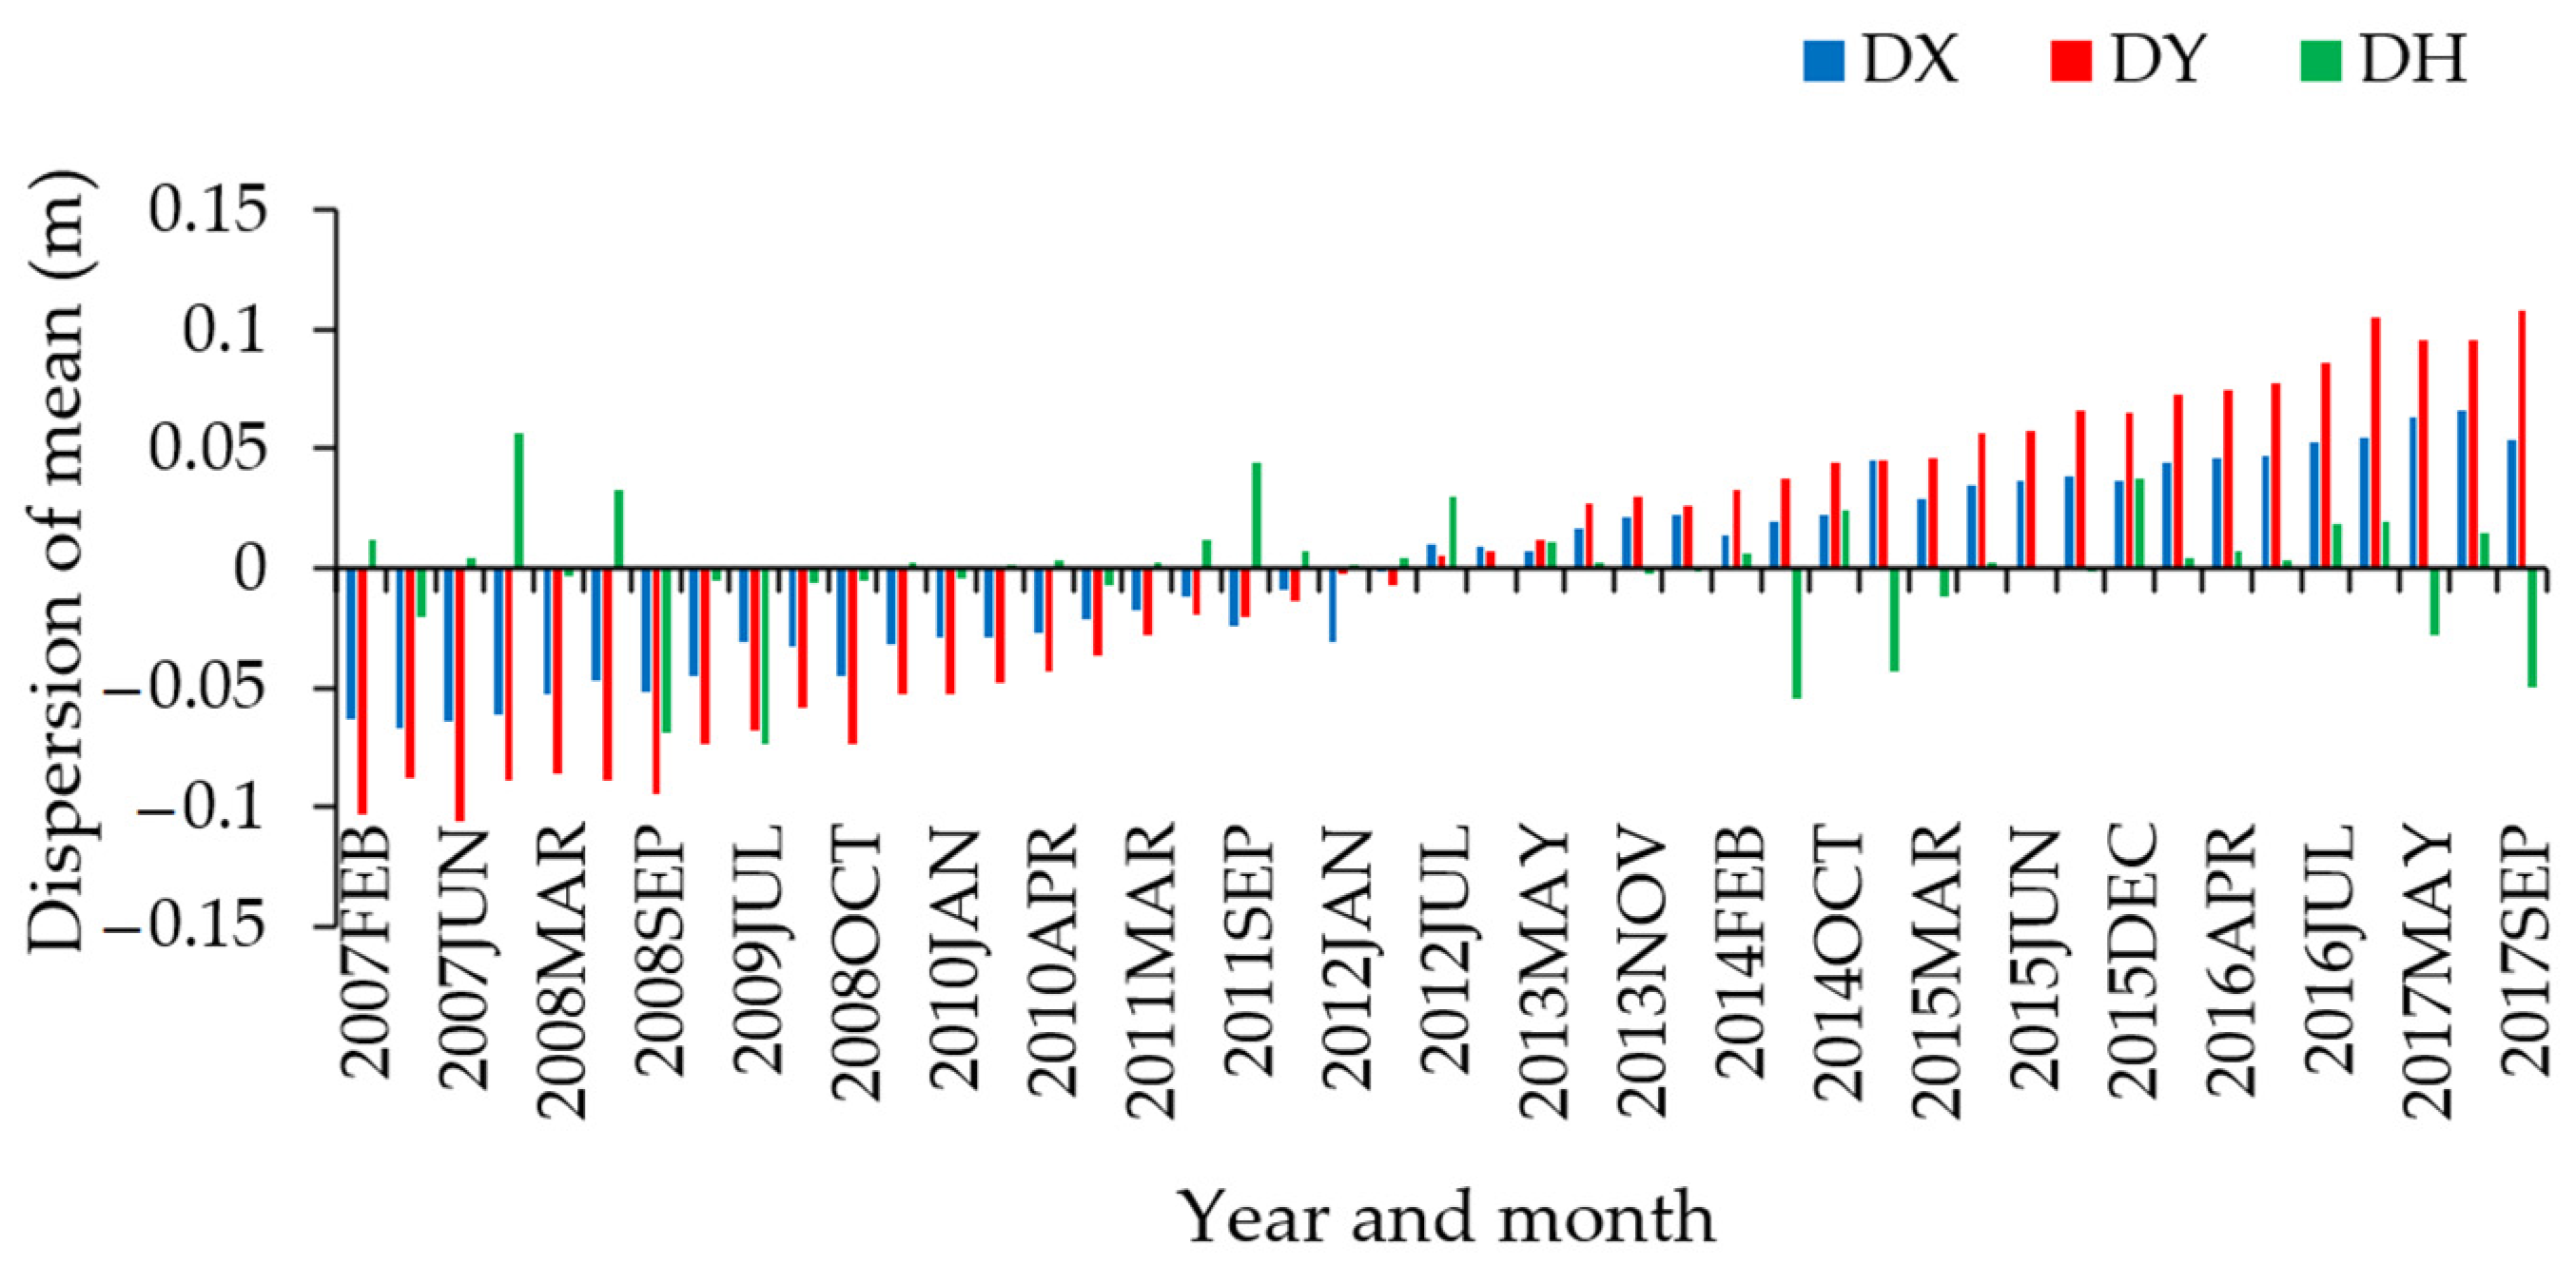
The knowledge of the correct monthly mean station non-disturbed coordinate values is the prerequisite for identifying disturbances. Further analysis discovered that 0.6% of the whole set of solutions shows disturbed results of great errors. The CORS station coordinates were computed for each month and the corresponding mean monthly coordinates were obtained. The values of the monthly mean coordinates were changing during the period of 11 years. To calculate the reliable monthly mean coordinates, in the first attempt, the outliers exceeding 3σ criteria were excluded. The trend of mean coordinate values after the data filtration from the first attempt was nearly linear; the time series were evaluated in the second attempt (example in Figure 3). Therefore, it made it easier to approximate the trend of each stations’ coordinates’ component changes. The quality control of the monthly mean coordinates for the set of filtered solution results becomes possible.
The monthly mean coordinates obtained were then used to identify disturbed solutions among the whole set of Bernese GNSS Software v5.2 solutions. The accuracy of each solution was controlled by checking the discrepancies of each of the component (Northing, Easting, Up) of the national grid in comparison with monthly mean coordinate values. The precision of filtered solution results of monthly mean station coordinates is of about 3 cm.

2.5. Distribution of the Size of Discrepancies

During the research, the total count of Bernese GNSS Software v5.2 solutions reached 36,728,129, of which 203,981 (i.e., 0.6%) solutions appeared with discrepancies in position greater than 10 cm (3σ). Including the 10 cm threshold, the count reached 204,022. There were 744,689 cycle slips (CSLP) identified by Bernese GNSS Software v5.2. This covers 2% of all Bernese GNSS Software v5.2 solutions. A total of 4849 (i.e., 0.6% of all cycle slips) of these were identified in the subset of disturbed solutions.
The size of the disturbances in coordinates is classified. During the geomagnetic storm, which occurred on 17 March 2015 (St. Patrick’s day) max disturbances in 2 stations (RIGA and VAIV) reached 500 m. The error caused by ionospheric scintillation in 50,430 solutions was greater than 1 m (Table 2). This is dangerous in Safety-of-Life critical situations.
Classification shows that 75% of disturbances were in the bounds of [0.1; 1.0) meters; 10% of disturbances were in the bounds of [1.0; 5.0) and 4% of disturbances were in the bounds of [5.0; 10); 10% of disturbances were greater than 10 m. From 204,022 disturbed solutions there were 2.4% cycle slips identified by Bernese GNSS Software v5.2. Unfortunately, in these cases, the results were not excluded by Bernese GNSS Software v5.2.

3. Results

3.1. Evil Waves of Disturbances

The term “evil waveform” is used to denote the disturbed information for navigation in some area caused by the GPS clock error [25]. The term “evil waves” in this paper is used to describe the changing distribution of positioning discrepancies over the territory of Latvia in some time period. The movement of “evil wave” is shown in slides of Figure 4a–c and Supplementary Materials Tables S2–S7. The red circles in Figure 4 denote the simultaneously occurring faulty solutions. In each of the (a), (b) and (c) titles in the top row, the period of the “evil wave” is written, in the second row, the beginning of the current 90-s faulty solution is shown.
When sorting the disturbances, the occurrence of faulty solutions was found in numerous stations simultaneously. The movement of these disturbances over the territory of Latvia can be described as a “waveform”. This could be interpreted as ionospheric scintillations, exposed in a form of table (Table 3, Supplementary Materials Tables S4 and S7) and/or graphs (Figure 4 and Figure 5).
Table 3 (and Supplementary Materials Tables S4 and S7) lists the DOMES names of the stations, where the faulty solutions occurred simultaneously, the date and time are fixed. Similar information is obtained for all the selected months in a period of 11 years.
The waves are counted in cases where the groups of at least three simultaneous 90-s sequences occurred within at least two simultaneous solutions with equal time events. Table 3 shows example of two “waves”: the first on 29 October 2012, 00:00:00 UT and the second, starting at 0:55:30 UT 29 October 2012 and ending at 01:01:30 UT, 29 October 2012. According to Figure 6, there are 28 “waves” in October 2009.
The movement of one “evil wave” (Figure 4) is described as an example: there are only 8 stations with faulty solutions (red dots) in Figure 4a. In Figure 4b there are already 20 stations with faulty solutions, RIGA, SALP now has good solution, 14 new stations with faulty solutions (compared to Figure 4a). In Figure 4c there are 21 stations. DOB1, VANG, IRBE, ALUK now has good solution, new stations with faulty solutions: VAIN, KUL2, BAUS, LVRD, PLSM (compared to Figure 4b). The “wave” continues (not shown on Figure 4), and the end time of the disturbed position’s “evil wave” is 11:46:30.
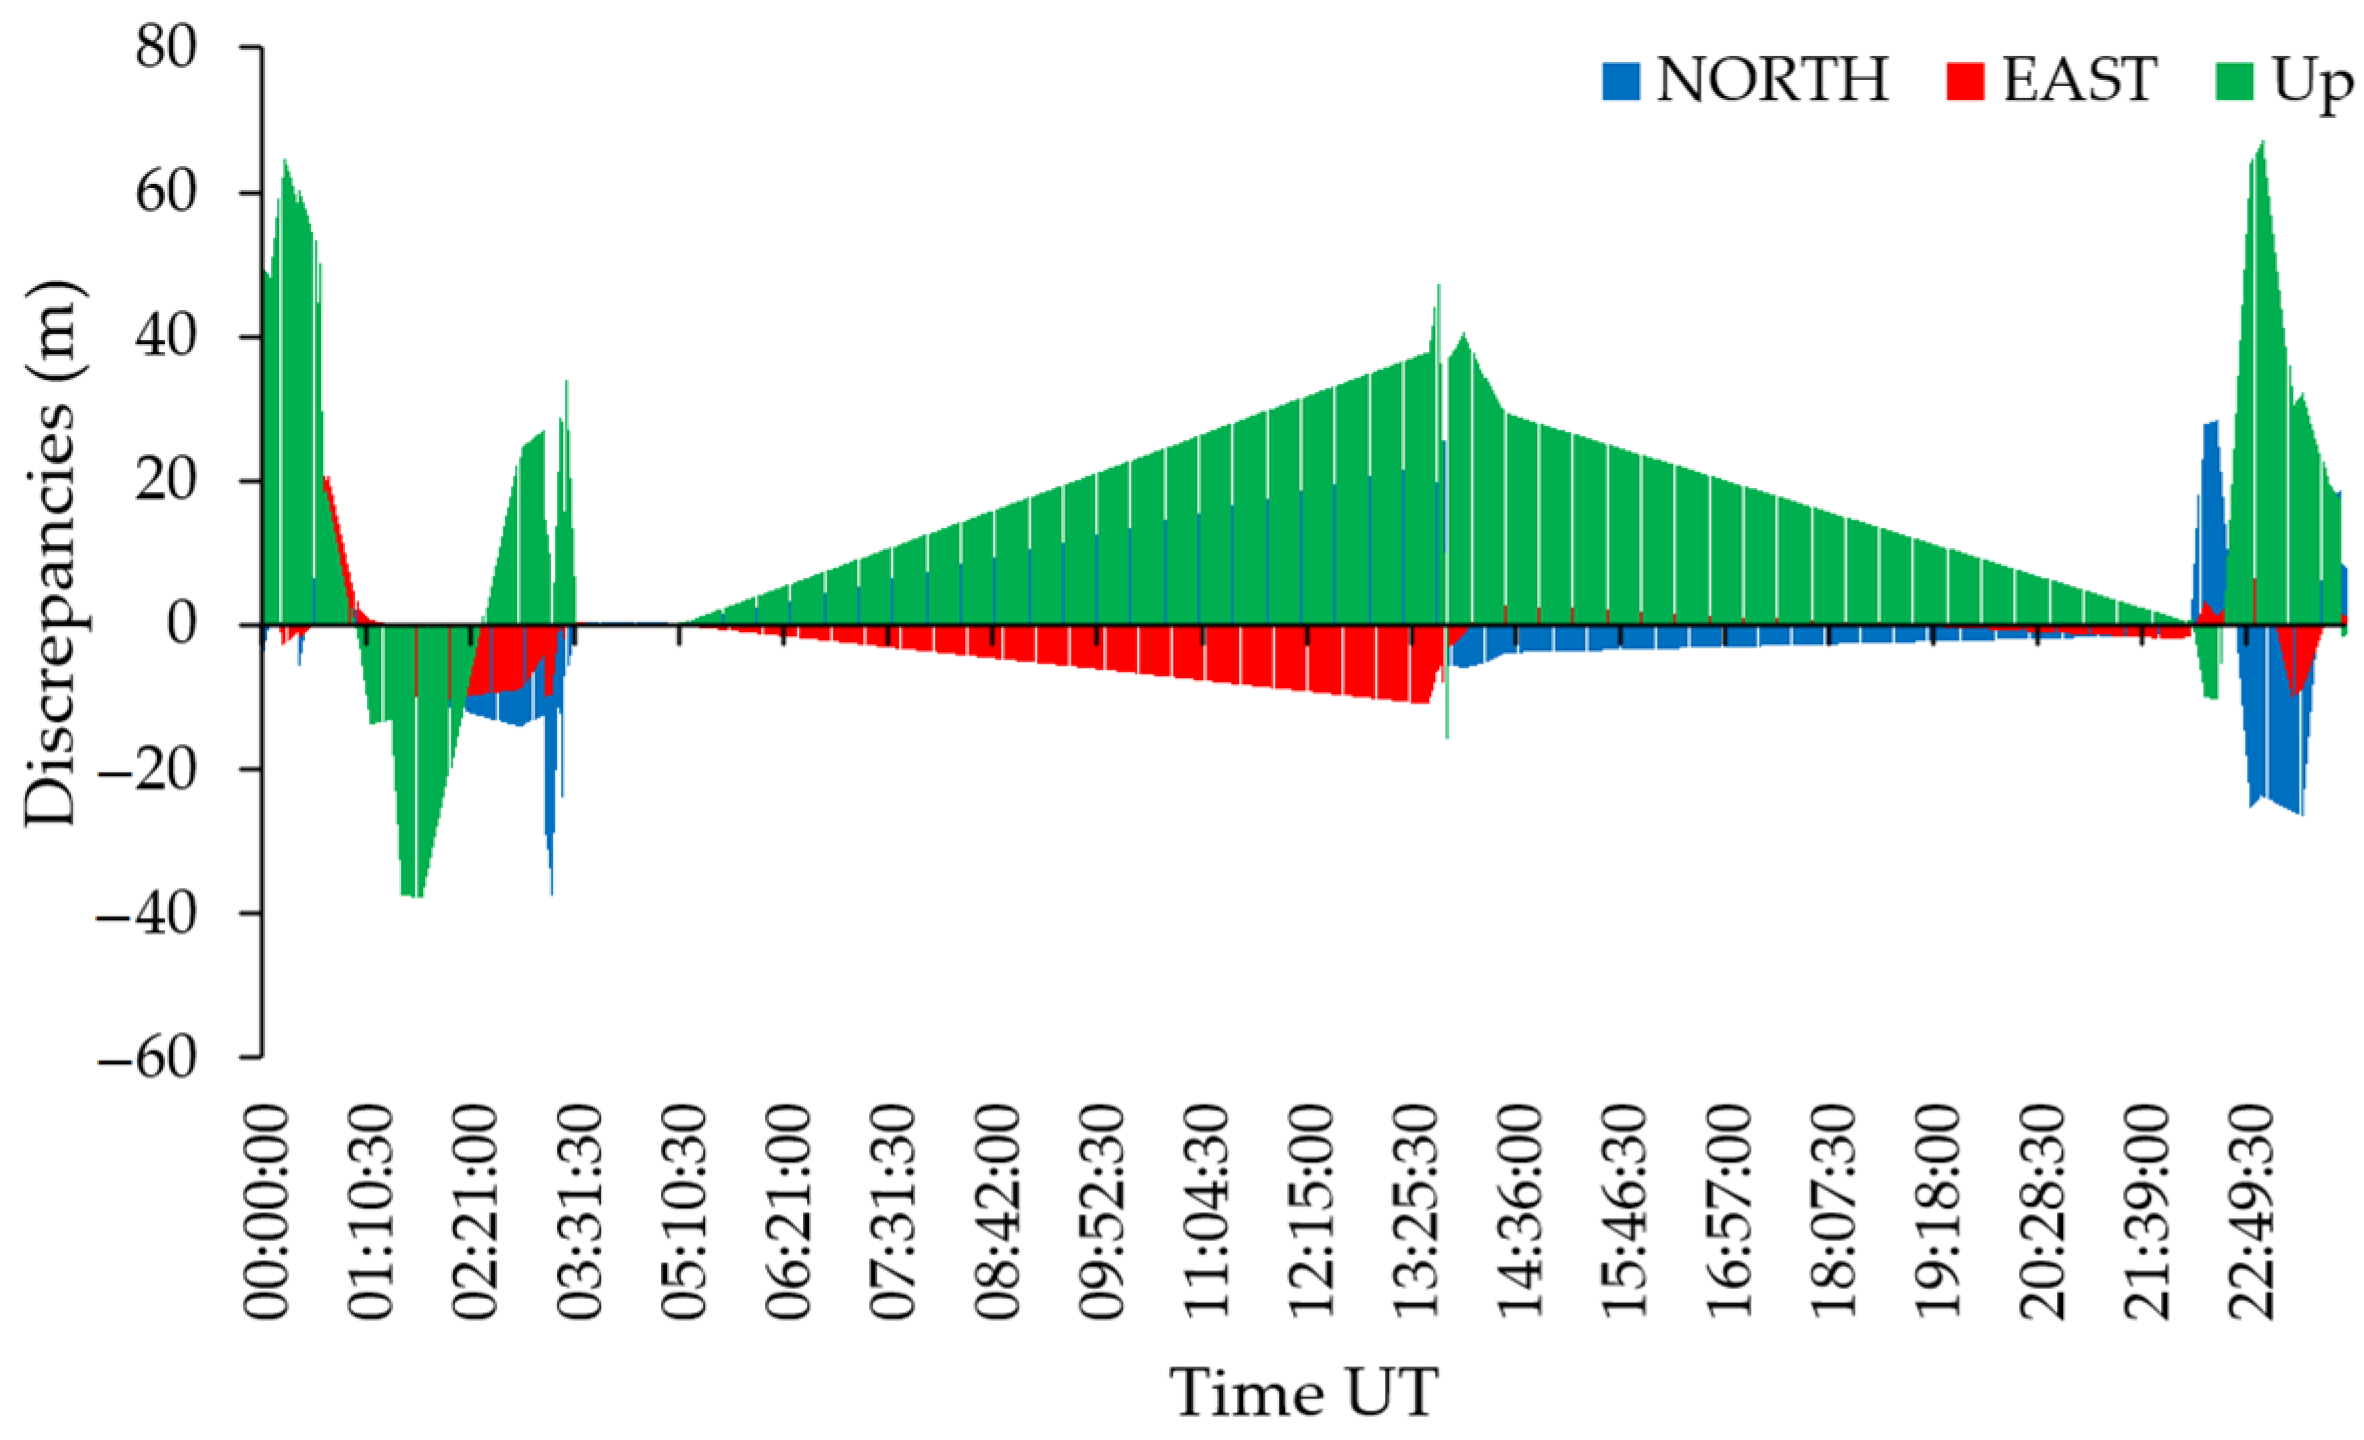
Figure 5 depicts similar information for the entire month of December 2009, and represents, eventually, the space weather impact on GNSS observations on the whole set of CORS stations. Figure 5 does not represent the names of the stations where the simultaneous disturbances occurred. The sample of the size of disturbances in 27, 28 and 29 December are shown in Supplementary Materials Table S8. The month of December 2009 is at the beginning part of the Solar cycle 24 when the sun activity awakes after a long, calm period.
More information on “waves” can be found in Supplementary Materials Tables S3 and S6 and in Tables S4 and S7 for December 2014 and March 2015, respectively.
Figure 6 depicts the count of “waves” in each analyzed month.
In March 2015, strong geomagnetic storms occurred, with following indices: 17 March, Kp 8-, Ap 108, 2 C-class flares, 1 M-class flare; 18 March, Kp 6, Ap 47, 18 C-class flares; 19 March, Kp 5, 2 C-class flares; 20 March, Kp 5, C-class flare. The impact of the strongest geomagnetic storm on 17th of March (St Patrick’s Day) has been widely considered in many papers [10,11,12,13,14,15]. Figure 7 and Supplementary Materials Tables S5–S7 shows the plot of simultaneously occurring discrepancies in March 2015.
The plot of solution discrepancies in Figure 8 shows that the discrepancies in the Up component of RIGA station reached −531.42 m at 17:09:00 UT.

3.2. Loss-of-Lock Situations

Figure 9 shows the plot of the distribution of simultaneously occurring discrepancies in July 2017, where date shows the day of the month. The figure of a rectangular shape covering 14 July 2017 shows that there is a sequence of a repeated equal count of stations (DOMES) with simultaneously occurring discrepancies.
Table 4 is a sample of the lists of simultaneous sequentially repeated disturbances. Inspecting the Tables of 14 July 2017, similar to Supplementary Materials Table S4, it appears that four stations LUNI, VAIV, KREI and SALP are repeatedly listed in each row, meaning that out of five EUPOS-RIGA network stations, four of them on 14 July 2017 were out of normal operation. Consequently, erroneous corrections for GNSS related measurements were disseminated. Such a search method was adopted for searching Loss-of-Lock of GNSS receivers [26]. Other stations in the city of Riga (OJAR, RIGA, VANG) and in other sites in Latvia (IRBE, TKMS, LIMB and others) are faulty occasionally, but not as often (Table 4). Therefore, there is reason to believe that this is not an effect of jamming.
The information on sequences of repeatedly occurred 90-s faulty solutions is summarized in Table 5, where DOY denotes the day of the year.
The detailed analysis of the discrepancies for the two stations LUNI and SALP is shown in Figure 10 and Figure 11.
On other dates, there are similar sequences of repeated discrepancies in other stations of the LatPos network and the IGS/EPN station RIGA. Table 5 gives an example of where the sequences of repeated disturbances occur.
The situation described in Table 3, Table 4 and Table 5 and shown in Figure 9 can be assumed as a corresponding stations’ Loss-of-Lock of receiver. At first, the idea was to remove these sequences of repeated disturbances. However, according to the Figure 10 and Figure 11, the impact of space weather during successive scintillations of the receiver are disturbances of various magnitude, which reflect the strength of the impact. Figure 12 shows the count of frequencies and how often an assumed Loss-of-Lock has occurred (blue). On some days, Loss-of-Lock sequences occurred several times (2–3) per day, e.g., LUNI on 14 July 2017, and 21 July 2017 (Table 5). The second column (red) in Figure 12 shows the frequency of the days of receivers’ Loss-of-Lock occurrence. The maximum number of the count of frequencies of receivers’ Loss-of-Lock appears for the IGS/ EPN station RIGA. The receiver of the RIGA station is mounted on a stable basement. Also, the EUPOS-RIGA network stations ANNI, MASK (relocated to VAIV and SALP in 2011, correspondingly), KREI, LUNI, and VANG are covering a small region of the city of Riga. The antennas are mounted on the roofs of buildings with no obstructions. The OJAR station of LatPos network is also located in the city of Riga very close to the station RIGA with the same type of receiver and antenna. However, the occurrence of the positioning disturbances is many times less.
The LatPos network (now 32 stations) covers the entire territory of Latvia. The analysis discovers that this network is most stable with less Loss-of-Lock situations, except DAU1 and LIMB stations.
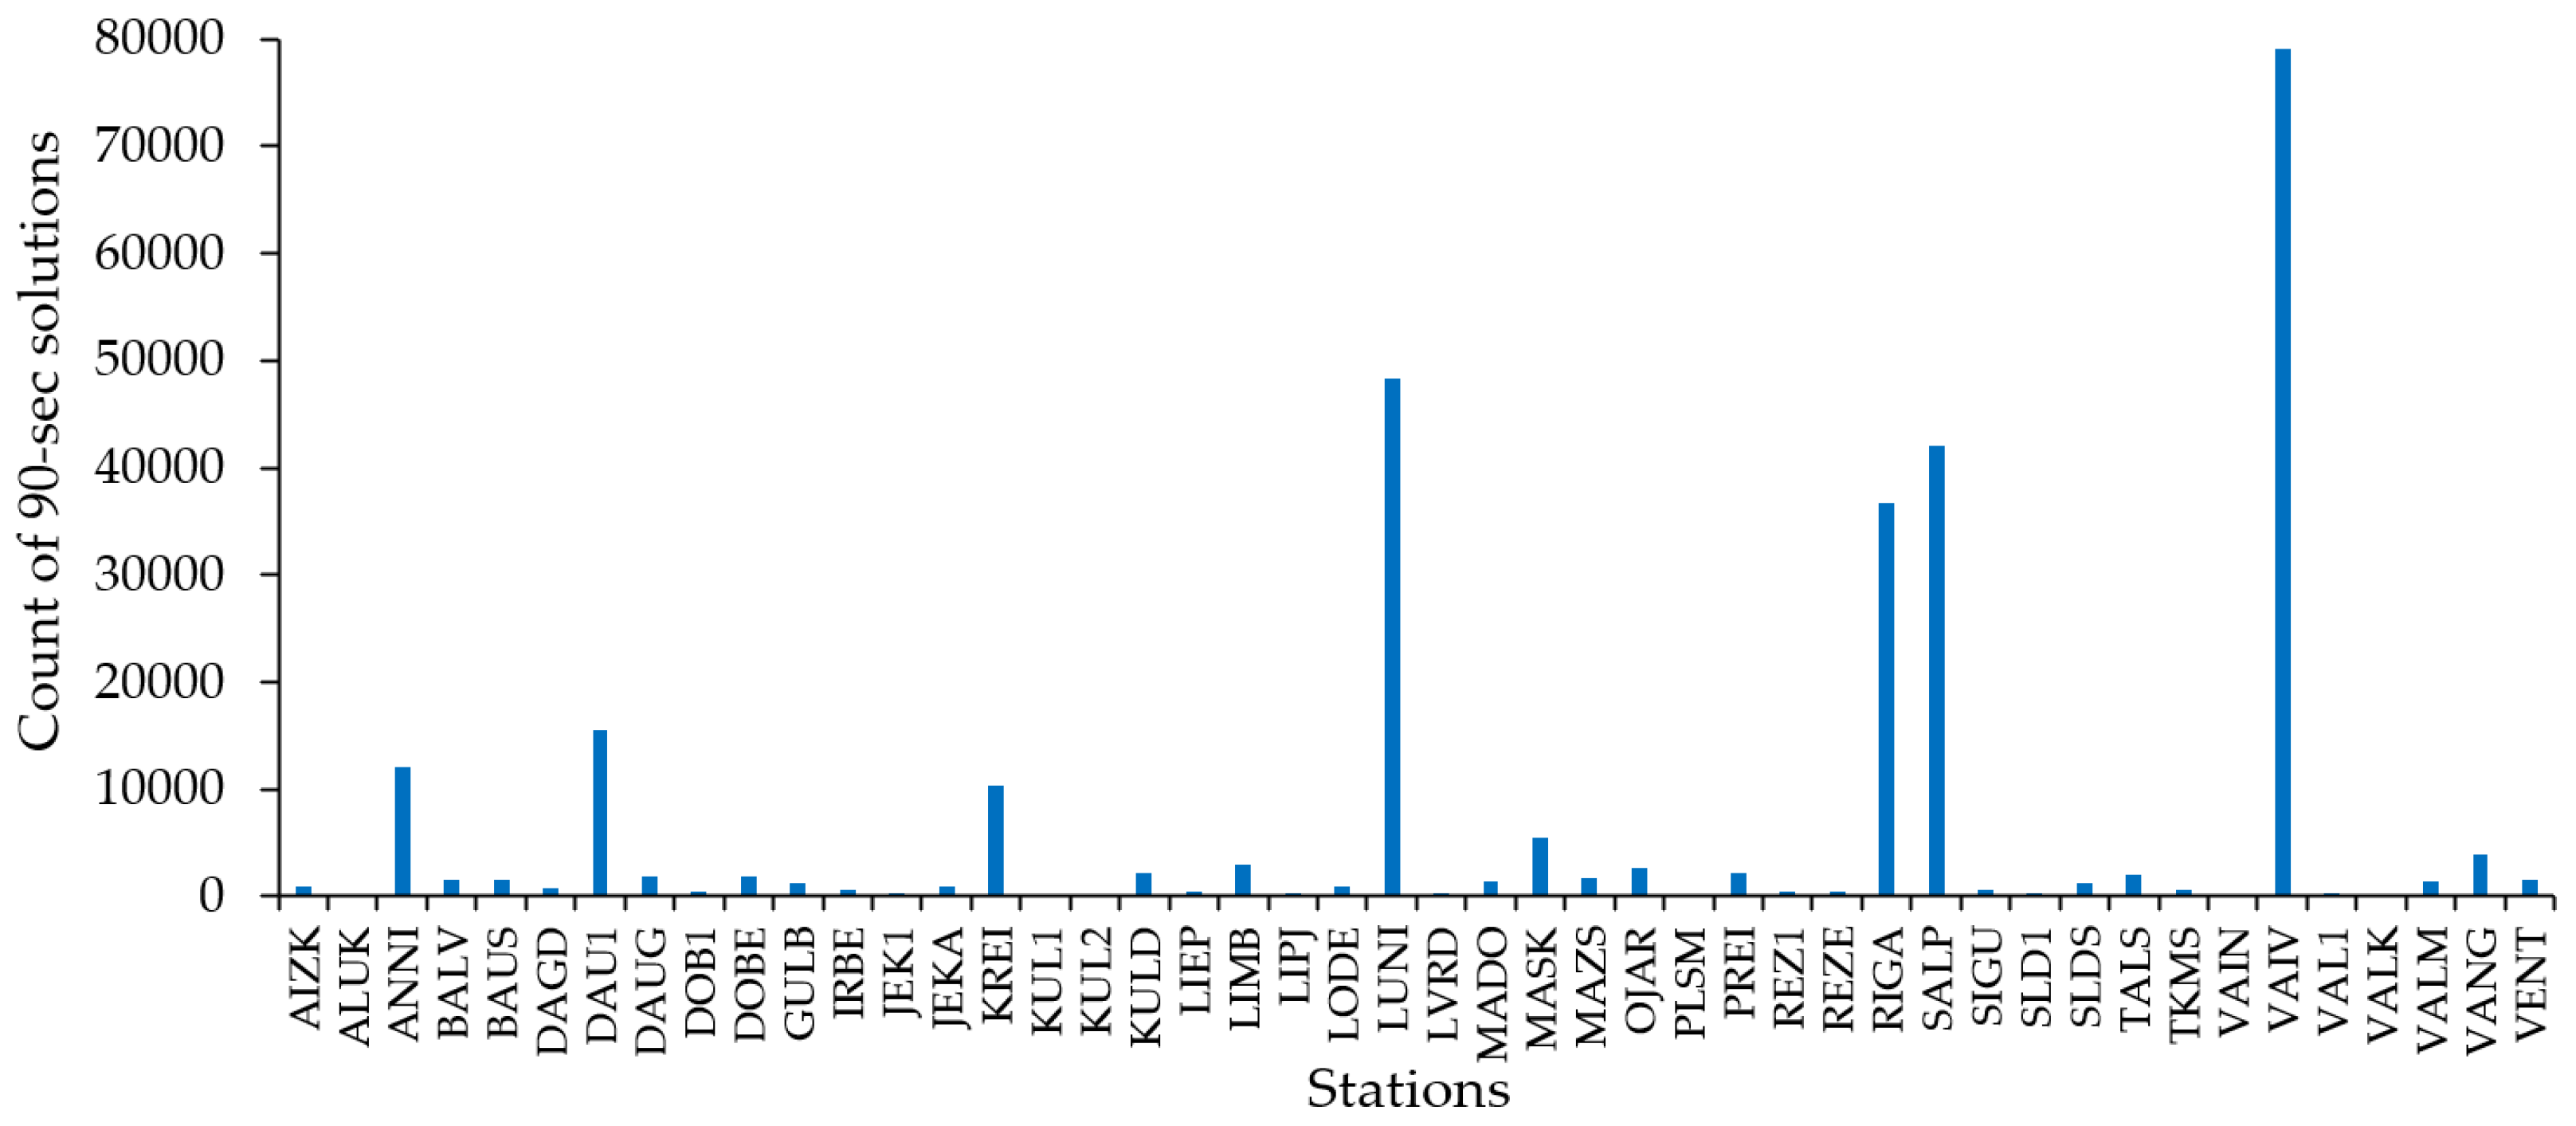
A summary of 90-s solutions associated with Loss-of-Lock sequences is shown in the histogram (Figure 13), where for each station the count of faulty solutions is displayed.
Figure 13 shows that station VAIV has the largest total count of Loss-of-Lock 90-s faulty solutions. The station VAIV is very close to the seashore. The station LUNI is located in the center of the city of Riga surrounded with a busy traffic environment. Most impacted of the receivers’ Loss-of-Lock are the stations of the EUPOS-RIGA network and the single station RIGA.
The stations’ DAU1 Loss-of-Lock occasions are very uniform. They are irregular by date, the sequences are not long, and the discrepancies are about 15–20 cm. However, since 2011 there have been 70 sequences in 58 days. The shape of the discrepancy distribution plots is uniform and differs from other stations’ discrepancy plots.

3.3. Correlation Analysis

The monthly data subsets included the collected daily information of max TEC values over the territory of Latvia, count of cycle slips (CSLP) in all solutions and faulty solutions (CSLP (F)), and count of faulty solutions (>10 cm). A sample of this monthly data subset is presented in Table 6. In Supplementary Materials Table S1 the same data is exposed for the whole 24th solar cycle period 2007–2017.
Using the data as in Table 6 the Pearson’s correlation coefficient, the covariance coefficient, regression line coefficient, solution’s mean square error, both numerator and denominator from Formula (6), R2, and value of t-test, were computed and the output was made for each month.
The Pearson’s correlation coefficient was computed:
r x y = i = 1 n ( x i x ¯ ) ( y i y ¯ ) i = 1 n ( x i x ¯ ) 2 i = 1 n ( y i y ¯ ) 2
The covariance was computed by using the formula
C o v ( X , Y ) =   ( x x ¯ ) ( y y ¯ ) n
Regression line was computed
Y i = a ^ + b ^ X i
where
b ^ =   ( x i x ¯ ) ( y i y ¯ )   ( x i x ¯ ) 2
and
a ^ = Y i b ^ X i
R2 was computed by formula
R 2 =   ( y ^ i y ¯ ) 2   ( y i y ¯ ) 2
The Student’s distribution t-test was computed by applying the formula
t = r x y 1 r x y 2 n 2
A sample of this output is given in Table 7 for the four pairs of data types listed in the explanations after Table 7. This type of computation was carried out in two different versions: the first one with all the data discussed so far, the second version with modified data sets in which the 90-s sequences were removed, which seems to be the GNSS receiver’s Loss-of-Lock product. The resulting correlation coefficients are shown in Table 8 and Figure 14.
where:
T—type (1–4):
  • TEC and cycle slips;
  • TEC and faulty solutions;
  • TEC and cycle slips in faulty solutions;
  • Cycle slips and faulty solutions.
Corr.c—Pearson’s correlation coefficient (Formula (1)); Cov—covariance (Formula (2)); Linear regression line, coefficient a ^ and coefficient b ^ (Formulas (3)–(5)); S—mean square error; R2—coefficient of determination (Formula (6)) and its numerator and denominator values; Student’s distribution t-test (Formula (7)).
Table 8 summarizes the analysis of the Pearson’s coefficients’ results in both versions—the complete set of input data (row 1) and the input data without Loss-of-Lock situations (row 2). The results for each of four data types were summarized in four columns: Pearson’s correlation coefficient in bounds of [0; 0.4), which means very weak correlation; in bounds of [0.4; 0.7)—moderate correlation; in bounds of [0.7; 1]—strong correlation and in bounds of [0; −1]—negative correlation. In both versions 1 and 2, the results are very similar—weak correlation and negative correlation between TEC and count of cycle slips, TEC and count of faulty solutions, TEC and cycle slips in faulty solutions, and between cycle slips and faulty solutions. In only two cases there was a very strong correlation between cycle slips and the count of faulty solutions. One of them was in March 2015.
In Figure 14, the variations of Pearson’s correlation coefficient in three cases are depicted: between TEC and count of cycle slips, TEC and count of faulty solutions (f.s.), TEC and faulty solutions with removed Loss-of-Lock sequences (No LoL). The conclusion is that in most situations TEC max, which is defined as a smooth value over the territory of Latvia, is not comparable to the sporadic nature of real time instantaneous spatial distribution of TEC [27].

3.4. ROTI Correlation Analysis

The ROTI index is determined from the IGS data of GNSS stations located around the Earth [28].
Correlation summary of the ROTI is given in Table 9. Unfortunately, the ROTI values are only available starting from year 2010 [28].
In Table S9 (see Supplementary Material), the count of faulty solutions, count of cycle slips and the ROTI max values per day and per each hour (ROTI*1.e04 for RIGA station) for the month of December 2014 are given and in Table S10 (see Supplementary Materials) for the month of March 2015. In Tables S11 and S12 (see Supplementary Materials) similar information is given, but instead of the ROTI, the occurred positioning discrepancies are presented. For example, in 16 March, the ROTI values (0.5830) are extremely high for 2 h. Maximum positioning discrepancy is 31.32 m. On 17 March, the maximum ROTI is lower (0.1174) for 8 h, but maximum discrepancy reaches 533.04 m. The irregularities of ionosphere and a correlation between the count of disturbances or the count of cycle slips are difficult to define. In Tables S13–S16 (see Supplementary Materials) a similar situation for the KREI station is depicted. In Tables S2 and S5 (see Supplementary Materials) the count of discrepancies in other Latvian CORS stations in December 2014 and March 2015 is shown.

3.5. Estimation of the Relation between the Count of Faulty Solutions and TEC-Max

Geomagnetic storms and solar flares are extreme events. Figure 15 shows the monthly average of the daily maximum TECs and the average numbers of the Latvian CORS networks’ faulty 90-s solutions per station/ per month. There is no close correlation between the indices of the mean TEC-max values and disturbance events. The average over a time span of 11 years is compared with sporadic events, and there is no close correlation expected.
Figure 15 indicates the monthly average of the irregularities of daily maximum TECs and the average number of faults per month. Figure 16 shows the monthly mean values of:
  • the TEC-max over the territory of Latvia;
  • the mean value of the count of cycle slips counts found by the Bernese GNSS Software v5.2 in all volume of reduced solutions, including faulty solutions (CSLP);
  • the mean count of faulty solutions (F.sol.);
  • the mean count of cycle slips found by Bernese GNSS Software v5.2 in faulty solutions (CSLP in f.sol.).
The count of cycle slips is greater than faulty solutions, the Bernese GNSS Software v5.2 identified most of the affected positions. However, there are still many faulty solutions that Bernese GNSS Software v5.2 does not identify.
A database was created for all collected data and processed data results. The database is stored in the Microsoft Office 365 OneDrive account, provided by the University of Latvia. This database includes also g95 Fortran and Python software programs that were developed as tools for large volume data processing.

4. Discussion

The impact of space weather on GNSS positioning, navigation and timing has been recognized by many authors as a threat [5,20] to the operational quality of SBAS and GBAS, as well as to many other positioning and navigation applications. The Latvian CORS serves as a basis for the RTK measurements which are used for the land surveying, cadaster and many other branches of engineering, including remote sensing and mapping. So far, no studies have been conducted on the impact of space weather on CORS in Latvia. The researchers of the GGI are working on national geoid improvement and on the application of the digital zenith camera, where short-term GNSS positioning and timing is used [29]. After this study, attention will be paid to the information on space weather and solar activities in the validation of GNSS high quality applications. Faulty solutions in the current study are caused by ionospheric irregularities which are discovered in a specific manner by the application of Bernese GNSS Software v5.2. Other methods, used in the studies of the ionospheric irregularities are reported in most of the references mentioned above.
This study shows that there exists a weak correlation between faulty positioning results and the applied TEC and even ROTI information on ionospheric irregularities caused by solar activity. However, the highest sun activity of the 24th solar cycle occurred in years 2013–2015. The largest positioning disturbances and the frequency of faults appeared in March 2015.
Many research papers are devoted to the studies of the ionospheric irregularities, the TEC fluctuation [19,30,31,32] and the impact on GNSS and their correlation with GNSS positioning errors [4]. The current research results are, in principle, in agreement with them (Belgium 2002–2012 [30], Northern Europe 2009 [31], China [32]), but the approach of this study is different. However, Norwegian researchers have carried out the positioning tests with 5-minute resolution in a much shorter time span than 11 years, and they concluded that there is a good correlation of the ROTI and the GNSS positioning errors in the high geographical latitudes of Norway [4]. The results in China show significant regional differences at different latitudes [9]. Liu et al. concluded that “relevant discussions of this phenomenon are still relatively rare, so our results contribute to the development of a more in-depth understanding of irregular ionospheric activities, specifically the characteristics and features that occur over China” [9].

5. Conclusions

The results show that 0.6% of the solutions appeared with discrepancies in position greater than 10 cm. The largest positioning disturbances and their frequency appeared in March 2015 during the highest sun activity of the 24th solar cycle in years 2013–2015. A very strong geomagnetic storm with Kp index 8 occurred on 6–8 September 2017over the territory of Canada and USA, but this geomagnetic storm did not cover the territory of Latvia. Geomagnetic storm of 17 March 2015 was the only solar activity event that created significant (~500 m) positioning disturbances in the Latvian CORS stations.
The Pearson’s correlation coefficients were computed in order to validate the relation between the TEC maximum values over the territory of Latvia. Positioning discrepancies of the Bernese GNSS Software v5.2 solutions discovers that correlation is weak. The ROTI analysis also demonstrated a weak correlation. Even the sum of CSLP and faulty solutions showed a weak correlation between the TEC and the ROTI as well. The performed correlation analysis revealed that the global TEC approximation models are not suitable for the study of the local TEC anomalies. The GPS receiver onboard the ESA Swarm satellite provided the TEC between Swarm and GPS satellite. These electron high-density plasma patches are highly structured with significantly enhanced density fluctuation [18]. This could probably confirm the eventually significant small fluctuation of the TEC that are not included in the global TEC and ROTI models.
The monthly discrepancy diagrams revealed simultaneous discrepancies at numerous individual stations. The output was analyzed, and it was identified that for several stations, the disturbed solutions usually appeared more than 150–200 times. This is assumed to be the Loss-of-Lock of GNSS receivers. The conclusion arises on the dependency between the Loss-of-Lock of GNSS receivers and the GNSS receivers’ network geometry and the size of the territorial coverage.
The Loss-of-Lock affected a single operating GNSS receiver the most, which is not included in any network.

Supplementary Materials

The following are available online at https://www.mdpi.com/article/10.3390/rs13183624/s1, Figure S1: Flowchart of the problem solution functions and related data sets, Table S1: List of geomagnetic storms and sun flares, count of tec-max, identified cycle slips, position discrepancies > 10 cm (faulty solutions) and faulty solution with cycle slips in Latvian CORS 90 s solutions, Table S2: List of faulty solutions per station in December 2014, Table S3: List of “evil waves” in December 2014, Table S4: List of stations where faulty solutions occurred synchronously in December 2014, Table S5: List of faulty solutions per station in March 2015, Table S6: List of “evil waves” in March 2015, Table S7: List of stations where faulty solutions occurred synchronously in March 2015, Table S8: Sample data of discrepancies, Table S9: RIGA station’s ROTI max values per day and per each hour, December 2014, Table S10: RIGA station’s ROTI max values per day and per each hour, March 2015, Table S11: Max values (m) of discrepancies per day and per each hour, December 2014, Table S12: Max values (m) of discrepancies per day and per each hour, March 2015, Table S13: KREI station’s ROTI max values per day and per each hour, December 2014, Table S14: KREI station’s ROTI max values per day and per each hour, March 2015, Table S15: Max values (m) of discrepancies per day and per each hour, December 2014, Table S16: Max values (m) of discrepancies per day and per each hour, March 2015.

Author Contributions

Conceptualization, J.B.; methodology, J.B.; software, J.B. and I.V.; validation, J.B. and M.N.; for-mal analysis, M.N.; investigation, J.B., I.V. and M.N.; resources, I.V. and M.N.; data curation, I.V.; writing—original draft preparation, J.B. and M.N; writing—review and editing, M.N.; visualization, J.B. and I.V.; supervision, J.B.; project administration, J.B.; funding acquisition, J.B., I.V. and M.N. All authors have read and agreed to the published version of the manuscript.

Funding

This research was funded by Programme for European Cooperating States (PECS), European Space Agency Contract No: 4000128661/19/NL/SC, project “Ionospheric characterization by statistics analysis of Latvian GBAS 11-year selective daily observations”. The views expressed in this publication can in no way be taken to reflect the official opinion of the European Space Agency. The APC was funded by University of Latvia.

Data Availability Statement

The data presented in this study are available in a Microsoft Office 365 OneDrive account provided by the University of Latvia.

Acknowledgments

The authors would like to express gratitude to Diana Haritonova and to Izolde Jumare for their support and assistance in the GNSS data management and processing.

Conflicts of Interest

The authors declare no conflict of interest.

References

  1. Dunbar, B. Space Weather. National Aeronautics and Space Administration. Available online: https://www.nasa.gov/mission_pages/rbsp/science/rbsp-spaceweather.html (accessed on 3 November 2020).
  2. National Science & Technology Council; United States Government. National Space Weather Strategy and Action Plan. White House Archives. Available online: https://trumpwhitehouse.archives.gov/wp-content/uploads/2019/03/National-Space-Weather-Strategy-and-Action-Plan-2019.pdf (accessed on 3 November 2020).
  3. Hlubek, N.; Berdermann, J.; Wilken, V.; Gewies, S.; Jakowski, N.; Wassaie, M.; Damtie, B. Scintillations of the GPS, GLONASS, and Galileo signals at equatorial latitude. J. Space Weather Space Clim. 2014, 4, A22. [Google Scholar] [CrossRef] [Green Version]
  4. Spogli, L.; Alfonsi, L.; De Franceschi, G.; Romano, V.; Aquino, M.H.O.; Dodson, A. Climatology of GPS ionospheric scintillations over high and mid-latitude European regions. Ann. Geophys. 2009, 27, 3429–3437. [Google Scholar] [CrossRef]
  5. Stankov, S.M.; Warnant, R.; Stegen, K. Transionospheric GPS signal delay gradients ob-served over mid-latitude Europe during the geomagnetic storms of October–November 2003. Adv. Space Res. 2009, 43, 1314–1324. [Google Scholar] [CrossRef]
  6. Mayer, C.; Belabbas, B.; Dunkel, W. Ionospheric Threat Model Assessment. ICAO NSP Meeting, EUROCONTROL Experimental Centre. Available online: https://elib.dlr.de/58489/ (accessed on 2 November 2020).
  7. Circiu, M.-S.; Felux, M.; Remi, P.; Yi, L.; Belabbas, B.; Pullen, S. Evaluation of Dual Frequency GBAS Performance Using Flight Data. In Proceedings of the 2014 International Technical Meeting of The Institute of Navigation, San Diego, CA, USA, 27–29 January 2014; pp. 645–656. [Google Scholar]
  8. Lee, J.; Lee, J. Correlation between ionospheric spatial decorrelation and space weather in-tensity for safety-critical differential GNSS systems. Sensors 2019, 19, 2127. [Google Scholar] [CrossRef] [Green Version]
  9. Liu, X.; Yuan, Y.; Tan, B.; Li, M. Observational Analysis of Variation Characteristics of GPS-Based TEC Fluctuation over China. ISPRS Int. J. Geo-Inf. 2016, 5, 237. [Google Scholar] [CrossRef] [Green Version]
  10. Cherniak, I.; Zakharenkova, I.; Redmon, R.J. Dynamics of the high-latitude ionospheric ir-regularities during the 17 March 2015 St. Patrick’s Day storm: Ground-based GPS measurements. Space Weather 2015, 13, 585–597. [Google Scholar] [CrossRef]
  11. Morozova, A.L.; Barlyaeva, T.V.; Barata, T. Variations of TEC Over Iberian Peninsula in 2015 Due to Geomagnetic Storms and Solar Flares. Space Weather 2020, 18, 2516. [Google Scholar] [CrossRef]
  12. Astafyeva, E.; Zakharenkova, I.; Förster, M. Ionospheric response to the 2015 St. Patrick’s Day storm: A global multi-instrumental overview. J. Geophys. Res. Space Phys. 2015, 120, 9023–9037. [Google Scholar] [CrossRef] [Green Version]
  13. Jacobsen, K.S.; Andalsvik, Y.L. Overview of the 2015 St. Patrick’s day storm and its consequences for RTK and PPP positioning in Norway. J. Space Weather Space Clim. 2016, 6, A9. [Google Scholar] [CrossRef]
  14. Liu, J.; Wang, W.; Burns, A.; Yue, X.; Zhang, S.; Zhang, Y.; Huang, C. Profiles of ionospheric storm-enhanced density during the 17 March 2015 great storm. J. Geophys. Res. Space Phys. 2016, 121, 727–744. [Google Scholar] [CrossRef]
  15. Balasis, G.; Papadimitriou, C.; Boutsi, A.Z. Ionospheric response to solar and interplane-tary disturbances: A Swarm perspective. Philos. Trans. R. Soc. A Math. Phys. Eng. Sci. 2019, 377, 20180098. [Google Scholar] [CrossRef]
  16. Kintner, P.M.; Ledvina, B.M.; De Paula, E.R. GPS and ionospheric scintillations. Space Weather 2007, 5, 260. [Google Scholar] [CrossRef]
  17. Nina, A.; Nico, G.; Odalovic, O.; Cadez, V.M.; Todorovic Drakul, M.; Radovanovic, M.; Popovic, L.C. GNSS and SAR Signal Delay in Perturbed Ionospheric D-Region during So-lar X-Ray Flares. IEEE Geosci. Remote Sens. Lett. 2020, 17, 1198–1202. [Google Scholar] [CrossRef]
  18. Jin, Y.; Spicher, A.; Xiong, C.; Clausen, L.B.N.; Kervalishvili, G.; Stolle, C.; Miloch, W.J. Ionospheric Plasma Irregularities Characterized by the Swarm Satellites: Statistics at High Latitudes. J. Geophys. Res. Space Phys. 2019, 124, 1262–1282. [Google Scholar] [CrossRef]
  19. Park, J.; Lühr, H.; Kervalishvili, G.; Rauberg, J.; Stolle, C.; Kwak, Y.S.; Lee, W.K. Morphology of high-latitude plasma density perturbations as deduced from the total electron content measurements onboard the Swarm constellation. J. Geophys. Res. Space Phys. 2017, 122, 1338–1359. [Google Scholar] [CrossRef] [Green Version]
  20. Sreeja, V.; Veettil, S.V. Impact and mitigation of space weather effects on GNSS receiver performance. Geosci. Lett. 2016, 3, 170. [Google Scholar] [CrossRef] [Green Version]
  21. Kenyeres, A.; Bellet, J.G.; Bruyninx, C.; Caporali, A.; De Doncker, F.; Droscak, B.; Duret, A.; Franke, P.; Georgiev, I.; Bingley, R.; et al. Regional integration of long-term national dense GNSS network solutions. GPS Solut. 2019, 23, 122. [Google Scholar] [CrossRef] [Green Version]
  22. Dach, R.; Lutz, S.; Walser, P.; Fridez, P. Bernese GNSS Software Version 5.2; University of Bern, Bern Open Publishing: Bern, Switzerland, 2015; ISBN 978-3-906813-05-9. [Google Scholar]
  23. CODE Data Archive. Available online: ftp://ftp.unibe.ch/aiub/BSWUSER50/ATM/ (accessed on 9 August 2021).
  24. Real-Time Auroral and Solar Activity. Available online: https://www.spaceweatherlive.com/ (accessed on 9 August 2021).
  25. Julien, O.; Selmi, I.; Pagot, J.-B.; Samson, J.; Fernandez, F.A. Extension of EWF Threat Model and Associated SQM. In Proceedings of the 2017 International Technical Meeting of The Institute of Navigation, Monterey, CA, USA, 30 January–2 February 2017; pp. 492–507. [Google Scholar]
  26. Leick, A.; Rapoport, L.; Tatarnikov, D. GPS Satellite Surveying, 4th ed.; Wiley: Hoboken, NJ, USA, 2015; ISBN 978-1-118-67557-1. [Google Scholar]
  27. Pi, X.; Mannucci, A.J.; Lindqwister, U.J.; Ho, C.M. Monitoring of global ionospheric irreg-ularities using the worldwide GPS network. Geophys. Res. Lett. 1997, 24, 2283–2286. [Google Scholar] [CrossRef]
  28. CDDIS Data Archive. Available online: https://cddis.nasa.gov/archive/gnss/products/ionex/ (accessed on 14 June 2021).
  29. Morozova, K.; Jäger, R.; Zarins, A.; Balodis, J.; Varna, I.; Silabriedis, G. Evaluation of quasigeoid model based on astrogeodetic measurements: Case of Latvia. J. Appl. Geod. 2021. [Google Scholar] [CrossRef]
  30. Wautelet, G. Characterization of Ionospheric Irregularities and Their Influence on High-Accuracy Positioning with GPS over Mid-Latitudes. Ph.D. Thesis, Université de Liège, Liège, Belgique, 2013. [Google Scholar]
  31. Otsuka, Y.; Suzuki, K.; Nakagawa, S.; Nishioka, M.; Shiokawa, K.; Tsugawa, T. GPS observations of medium-scale traveling ionospheric disturbances over Europe. Ann. Geophys. 2013, 31, 163–172. [Google Scholar] [CrossRef]
  32. Ding, F.; Wan, W.; Xu, G.; Yu, T.; Yang, G.; Wang, J.S. Climatology of medium-scale traveling ionospheric disturbances observed by a GPS network in central China. J. Geophys. Res. Space Phys. 2011, 116, A9. [Google Scholar] [CrossRef]
Figure 1. Data input rate of Latvian CORS stations.
Remotesensing 13 03624 g001
Figure 2. A schematic map of LatPos and EUPOS-RIGA networks and IGS/ EPN station RIGA.
Remotesensing 13 03624 g002
Figure 3. Differences of station RIGA monthly mean coordinate components.
Remotesensing 13 03624 g003
Figure 4. A schematic map of movement of “evil wave” over the territory of Latvia: (ac).
Remotesensing 13 03624 g004
Figure 5. Plot of the distribution of simultaneously occurred discrepancies in December 2009.
Remotesensing 13 03624 g005
Figure 6. Count of “evil waves” in the selected month in period 2007–2017.
Remotesensing 13 03624 g006
Figure 7. Plot of the distribution of simultaneously occurred discrepancies in March 2015.
Remotesensing 13 03624 g007
Figure 8. Plot of discrepancies of station RIGA on 17 March 2015.
Remotesensing 13 03624 g008
Figure 9. Plot of the distribution of simultaneously occurred discrepancies in July 2017.
Remotesensing 13 03624 g009
Figure 10. Plot of discrepancies of station LUNI on 14 July 2017.
Remotesensing 13 03624 g010
Figure 11. Plot of discrepancies of station SALP on 14 July 2017.
Remotesensing 13 03624 g011
Figure 12. Frequency of Loss-of-Lock in CORS stations.
Remotesensing 13 03624 g012
Figure 13. Distribution of total count of sequential 90-s faulty solutions.
Remotesensing 13 03624 g013
Figure 14. Graph of Pearson’s coefficient values in 3 cases.
Remotesensing 13 03624 g014
Figure 15. Monthly average of daily maximum TECs and the average number of faults per month.
Remotesensing 13 03624 g015
Figure 16. Mean TEC-max values, mean count of cycle slips, faulty solutions, and cycle slips at faulty solutions.
Remotesensing 13 03624 g016
Table 1. List of main processing strategy parameters.
ParameterValue
Processing strategyDouble-difference, ionosphere-free
Ground and satellite antenna phase center calibrationsAbsolute, IGS
CODE products usedPrecise orbits, Earth orientation, clock, final ionosphere
Reference stationsLAMA (Olsztyn, Poland), METS (Metsahovi, Finland), VIS0 (Visby, Sweden), VLNS (Vilnius, Lithuania)
Satellite systemGPS
Elevation cut off angle15°
Sampling interval90 s
Ocean tidal loading correctionsFES2004
Corrections of solid Earth tide effectYes
Tropospheric delay modellingDry Global Mapping Function
Minimum size of accepted cycle slip corrections10
Table 2. Distribution of the size of discrepancies.
#Interval (m)Count of f.sol.CSLP% f.sol.% CSLP
1[0.11.0)153.592378.175.28%77.97%
2[1.05.0)21.53347310.55%9.75%
3[5.010.0)8.6911924.26%3.96%
4[10.020.0)7.1631413.51%2.91%
5[20.030.0)4.196572.06%1.18%
6[30.040.0)2.694421.32%0.87%
7[40.050.0)1.478330.72%0.68%
8[50.0100.0)3.401871.67%1.79%
9[100.0150.0)806260.40%0.54%
10[150.0200.0)259100.13%0.21%
11[200.0500.0)20470.10%0.14%
12[500.0900.0]500.00%0.00%
Total[0.1900.0]204.0224.849100.00%100.00%
Table 3. Sample list of stations (DOMES), date and time of simultaneous scintillations.
#DateTimeDomes
78528 October 20128:16:30 UTBAUS DOB1
78628 October 20129:45:0 UTDAU1
78728 October 20129:58:29 UTLUNI
78829 October 20120:0:0 UTSIGU REZ1 TALS SLD1 VANG IRBE VAL1 RIGA OJAR MADO PREI LIMB ALUK DOB1 DAU1 DAGD BAUS BALV MAZS LIPJ KUL1 PLSM JEK1
78929 October 20120:55:30 UTJEK1 MAZS BALV PLSM DAGD
79029 October 20120:57:0 UTVAL1 DAGD RIGA VANG IRBE DOB1 DAU1 BAUS ALUK PREI OJAR LIMB MADO SLD1 SIGU TALS REZ1 LVRD
79129 October 20120:58:30 UTSLD1 PREI LIMB MADO DAGD MAZS BALV DOB1 DAU1 BAUS LVRD ALUK
79229 October 20121:0:0 UTLIPJ SIGU SLD1 IRBE RIGA TALS VANG REZ1 PREI OJAR LIMB MADO
79329 October 20121:1:30 UTALUK OJAR
79429 October 20121:3:0 UTREZ1
79529 October 20121:6:0 UTLIPJ OJAR RIGA
79629 October 20127:33:0 UTLIPJ
Table 4. Part of the output diagnostics for July 2017.
DateDomeRepetition Information
13 July 2017KREI2010 after 194.516667 day repeatedly 5 times
14 July 2017KREI2970 after 195.000000 day repeatedly 960 times
15 July 2017KREI2972 after 196.033333 day repeatedly 2 times
14 July 2017LUNI5403 after 195.000000 day repeatedly 184 times
14 July 2017LUNI5563 after 195.215625 day repeatedly 160 times
14 July 2017LUNI5567 after 195.389583 day repeatedly 4 times
14 July 2017LUNI6135 after 195.408333 day repeatedly 568 times
14 July 2017SALP11,513 after 195.000000 day repeatedly 184 times
14 July 2017SALP11,516 after 195.208333 day repeatedly 2 times
14 July 2017SALP12,270 after 195.214583 day repeatedly 754 times
15 July 2017SALP12,276 after 196.030208 day repeatedly 5 times
14 July 2017VAIV16,460 after 195.000000 day repeatedly 960 times
15 July 2017VAIV16,469 after 196.033333 day repeatedly 9 times
15 July 2017VAIV16,471 after 196.511458 day repeatedly 2 times
13 July 2017VANG17,076 after 194.517708 day repeatedly 2 times
15 July 2017VANG17,080 after 196.030208 day repeatedly 3 times
Table 5. Sample List of stations (DOMES), date and time of the sequence of faulty solutions.
DomeDOY IntervalTime IntervalDate
BALV188.254167 188.2802086:6:0 6:43:307 July 2017
DAU1182.532292 182.55312512:46:30 13:16:301 July 2017
DAU1200.004167 200.0312500:6:0 0:45:019 July 2017
IRBE205.447917 205.47395810:45:0 11:22:3024 July 2017
KREI195.004167 195.9989580:6:0 23:58:3014 July 2017
KREI205.447917 205.47395810:45:0 11:22:3024 July 2017
LODE188.254167 188.2906256:6:0 6:58:307 July 2017
LUNI183.023959 183.9958340:34:30 23:54:02 July 2017
LUNI195.004167 195.1906250:6:0 4:34:3014 July 2017
LUNI195.219792 195.3812505:16:30 9:9:014 July 2017
LUNI195.412500 195.9989589:54:0 23:58:3014 July 2017
LUNI200.004167 200.0312500:6:0 0:45:019 July 2017
LUNI202.022917 202.1343750:33:0 3:13:3021 July 2017
LUNI202.276042 202.4947926:37:30 11:52:3021 July 2017
LUNI202.518750 202.55312512:27:0 13:16:3021 July 2017
LUNI202.585417 202.98437514:3:0 23:37:3021 July 2017
LUNI204.017709 204.4989590:25:30 11:58:3023 July 2017
LUNI204.518750 204.99479112:27:0 23:52:3023 July 2017
LUNI205.447917 205.47395810:45:0 11:22:3024 July 2017
LUNI206.004167 206.0281250:6:0 0:40:3025 July 2017
LUNI206.261459 206.4125006:16:30 9:54:025 July 2017
LUNI206.959375 206.99895823:1:30 23:58:3025 July 2017
MAZS188.254167 188.2802086:6:0 6:43:307 July 2017
RIGA193.477084 193.50937511:27:0 12:13:3012 July 2017
RIGA200.004167 200.0239580:6:0 0:34:3019 July 2017
Table 6. Data subset for correlation analysis, March 2015.
DateGeomagnetic Storms and Sun FlaresTECCSLP>10 cmCSLP(F)
1 March 2015Kp 5+. 3 C-class flares23.44662526
2 March 2015Kp 5+. 14 C-class flares. 4 M-class flares314972803
3 March 20155 C-class flares. M-class flare29.44973174
4 March 20153 C-class flares31.94763072
5 March 20154 C-class flares. M-class flare33.84552733
6 March 20155 C-class flares. 2 M-class flares35.14792533
7 March 20154 C-class flares. M-class flare31.24612371
8 March 20152 C-class flares34.74692242
9 March 201513 C-class flares. 2 M-class flares284842142
10 March 201513 C-class flares. 2 M -class flares30.24792453
11 March 201514 C-class flares. 3 M-class flares. X-class flare31.35201982
12 March 201510 C-class flares. 5 M-class flares304451841
13 March 20156 C-class flares. 2 M-class flares33.45202841
14 March 201512 C-class flares. M-class flare30.34601801
15 March 20157 C-class flares. 2 M-class flares304932294
16 March 20156 C-class flares. M-class flare29.34642504
17 March 2015Kp 8-. Ap 108. 2 C-class flares. M-class flare4011342949228
18 March 2015Kp 6. Ap 47. 18 C-class flares18.45112173
19 March 2015Kp 5. 2 C-class flares25.24972525
20 March 2015Kp 5-. C-class flare19.94891973
21 March 20152 C-class flares254841793
22 March 2015Kp 6+. 2 C-class flares33.54881901
23 March 20153 C-class flares31.74881741
24 March 20152 C-class flares32.34882012
25 March 20158 C-class flares32.95212004
26 March 20154 C-class flares33.34971731
27 March 20155 C-class flares30.95021644
28 March 201510 C-class flares36.44871983
29 March 20158 C-class flares35.64611861
30 March 20155 C-class flares294731882
31 March 2015-36.34821872
Table 7. Sample of output data from the correlation analysis program.
TMonthCorr. c.Cov. a ^ b ^ SNumeratorDenominatorR2t-Test
1October 20140.3366.0387.201.9732.64021.335,973.40.111.9104
1December 20140.2351.6380.123.1553.75032.391,479.10.061.2993
1March 20150.35184.1235.658.77110.950,068.8419,357.40.121.9829
1May 20150.098.7482.910.4221.8111.914,431.90.010.4761
2October 20140.0566.0107.430.2934.090.434,726.20.000.2752
2December 2014−0.2051.6326.23−1.7334.91517.438,077.90.04−1.0971
2March 20150.32184.112.597.27100.934,376.9339,500.70.101.8076
2May 2015−0.178.7130.47−1.6142.31681.655,275.90.03−0.953
3October 20140.060.71.930.022.10.4137.10.000.2990
3December 2014−0.20−3.110.36−0.193.717.7424.40.04−1.1236
3March 20150.298.8−9.150.426.6114.91407.40.081.6057
3May 2015−0.01−0.12.17−0.001.80.096.70.00−0.0367
4October 20140.11125.168.600.1133.8418.334,726.20.010.5946
4December 20140.29556.4184.310.1934.13252.338,077.90.091.6457
4March 20150.9211154.8−180.640.8242.6285,143.1339,500.70.8412.3339
4May 2015−0.10−94.0187.07−0.2042.7589.055,275.90.01−0.5589
Table 8. Count of Pearson’s correlation coefficients before the removal of the Loss-of-Lock (1st row) and after the removal of the Loss-of-Lock (2nd row).
TEC and Cycle SlipsTEC and Faulty SolutionsTEC and Cycle Slips from f.sol.Cycle Slips and f. Solutions
[0; 0.4)[0.4; 0.7)[0.7; 1][0; −1][0; 0.4)[0.4; 0.7)[0.7; 1][0; −1][0; 0.4)[0.4; 0.7)[0.7; 1][0; −1][0; 0.4)[0.4; 0.7)[0.7; 1][0; −1]
185023184024254017251218
195022166024263017210223
Table 9. Count of Pearson’s correlation coefficients between ROTI and faulty solutions.
ROTI and Cycle SlipsROTI and Faulty SolutionsROTI and Cycle Slips from Faulty SolutionsROTI and TEC
[0; 0.4)[0.4; 0.7)[0.7; 1][0; −1][0; 0.4)[0.4; 0.7)[0.7; 1][0; −1][0; 0.4)[0.4; 0.7)[0.7; 1][0; −1][0; 0.4)[0.4; 0.7)[0.7; 1][0; −1]
1853813611415411418709
Publisher’s Note: MDPI stays neutral with regard to jurisdictional claims in published maps and institutional affiliations.