Article

Evaluation of Three Gridded Precipitation Products to Quantify Water Inputs over Complex Mountainous Terrain of Western China

1
State Key Laboratory of Hydraulics and Mountain River Engineering, College of Water Resource and Hydropower, Sichuan University, Chengdu 610065, China
2
Water Resources Department, Federal University of Lavras, Lavras 37200-900, Minas Gerais, Brazil
3
Department of Ecosystem Science and Management, Penn State University, University Park, PA 16802, USA
4
School of Water and Environment, Chang’an University, Xi’an 710054, China
*
Author to whom correspondence should be addressed.
These authors contributed equally to this work.
Remote Sens. 2021, 13(19), 3795; https://doi.org/10.3390/rs13193795
Submission received: 15 August 2021 / Revised: 13 September 2021 / Accepted: 15 September 2021 / Published: 22 September 2021

Abstract

:
This study evaluates the capacity of three gridded precipitation products (MSWEP V2.2, TRMM-3B42 V7, and GPM-IMERG V6) to detect precipitation in the Min Jiang watershed, a data-scarce and mountainous region in western China. A set of statistical and contingency indices is calculated for the precipitation products and compared with rain gauge observations at 23 ground stations from July 2000 to May 2016. Consistency between gridded and ground precipitation datasets is examined at different temporal (i.e., daily, monthly, seasonally, and annually) and spatial (i.e., site level, sub-regional level, and watershed level) resolutions. We identify possible reasons for discrepancies among precipitation datasets. Our results indicate that: (1) the MSWEP product is best suited for the study of long-term mesoscale rainfall, rather than short-term light or extreme rainfall; (2) the IMERG product represents stable performance for the simulation of rainfall spatial variability and detection capability; and (3) Composition of the datasets, climatic systems, and regional topography are key factors influencing the consistency between gridded and ground precipitation datasets. Therefore, we suggest using MSWEP V2.2 and GPM-IMERG V6 as potential precipitation data sources for hydrometeorological studies over the Min Jiang watershed. The findings of this study inform future hydrometeorological and climate applications in data-scarce regions with complex terrain.

1. Introduction

Precipitation is a primary component of the global water cycle and energy balance. Reliable long-term records of precipitation at high spatiotemporal resolutions can support a wide range of applications, such as hydrological model optimization [1,2], water resources management [3,4], drought and flood forecast and warning [5,6,7,8], agricultural irrigation planning [9,10], hydrometeorology analysis [11,12], and climate studies [13,14,15,16]. Information on precipitation from imagery and measurements provides an understanding of a region’s climate and is needed to facilitate rainfall prediction (e.g., about potential flooding and droughts) [17]. Accurate precipitation datasets with the high spatiotemporal resolution and long-term records are difficult to achieve [18], particularly in mountainous areas, mainly due to the inadequate and uneven distribution of ground observation stations [19,20,21]. Complex topography and variable rainfall characteristics add particular challenge in regions where ground-based precipitation monitoring is limited [22].
The development of infrared (IR) and microwave (MW) satellite sensors promotes the contemporary application of gridded precipitation products globally or at the quasi-global scales [9,23,24]. These include satellite, reanalysis, and merged datasets, such as Precipitation Estimation from Remotely Sensed Information using Artificial Neural Networks (PERSIANN) [25], Global Satellite Mapping of Precipitation (GSMaP) [26,27], Climate Hazards Group Infrared Precipitation with Station Data (CHIRPS) [28], Tropical Rainfall Measuring Mission (TRMM) Multi-satellite Precipitation Analysis (TMPA) [29], Global Precipitation Measurement Integrated Multi-satellite Retrievals (GPM-IMERG), and Multi-Source Weighted-Ensemble Precipitation (MSWEP) [30]. As a result of the relative advantages of high spatiotemporal resolution and wide coverage, long-term gridded precipitation products have received extensive interest from a range of fields that benefit from forecasting of extreme rainfall [15,31] and hydrological variability [32], especially with the ability for precipitation remote sensing [33,34] in data-scarce areas.
However, measurement errors inherent in satellite-based datasets [35] and uncertainties originating from mechanical error and algorithm tolerances [36,37] have caused high regional variability, restricting direct applications of gridded datasets. Therefore, evaluating multiple gridded precipitation products’ performance, suitability, and reliability at distinct spatiotemporal scales is essential for further research and practical applications [38,39,40,41]. To date, long-term gridded datasets are rare not only in mountainous areas but also different landscapes, and the use of satellite-related products in meteorological studies has been limited by their systematic errors and relatively short records (e.g., <25 years for TRMM and IMERG) [42,43]. To compensate, reanalysis datasets with more accurate combined precipitation estimates have been widely used by the climatology community [44]. Reanalysis precipitation datasets also have their own uncertainties in different areas [45]. This leaves open an opportunity to evaluate and distinguish between these datasets to provide more refined inputs for hydrological, meteorological, and ecological studies, especially in data-scarce regions with complex terrain and convective systems [2,46,47].
In recent years, numerous studies have been devoted to investigating the factors that affect the performance of gridded datasets in data-scarce regions by comparing them with ground observations. Detection accuracy of datasets is subjected to satellite-based data resources, various retrieval algorithms, gauge adjustment procedures [48], and sensors’ ability to capture climatic systems [17,19,49,50,51]. For example, the drought monitoring performance of MSWEP V2.1 over eastern China was significantly superior to its performance in western China [52]. MSWEP V1.1 was identified as superior performance for hydrological applications in the Yellow River Basin, China [53]. Furthermore, its hydrological performance was consistently better than Climate Prediction Center Morphing Technique (CMORPH), TRMM, ERA-Interim (ERAI), and Global Precipitation Climatology Centre (GPCC) at multi-spatial scales in Ethiopia [13,37,54]. However, few studies have been conducted to evaluate the accuracy and applicability of the newly released MSWEP V2.2. TRMM and IMERG products have been directly compared in extensive studies, which quantified their performance and their errors and biases [55,56], such as the GPM sensors could detect light and solid precipitation more accurately than TRMM sensors [55]. Further, several studies compared the performance of different IMERG products (such as Early, Late, and Final Runs), which indicated that the IMERG Final Run captured well the seasonality of precipitation, while the Early and Late Runs showed larger deviations [18,57,58]. These results can be used as a basis for selecting proper gridded precipitation products.
One factor for biases is probably the treatment of temporal heterogeneity when comparing products, i.e., that temporal differences may be smoothed and offset by the quantile-matching approach [59,60]. Extensive studies using these intervals revealed that gridded precipitation data is highly correlated with observations on monthly and annual scales [61,62]. Common intervals of comparison are daily, monthly, and annual [17,63], while the study of intermediate time scales is limited. In addition, topographical factors influence the evaluation of gridded precipitation datasets through gauge numbers and elevation over complex terrain [23,64,65,66]. Evaluation of three long-term (spanning more than half a century) gridded precipitation products over the Tibetan Plateau recommended Asian Precipitation-Highly Resolved Observational Data Integration Towards Evaluation of Water Resources (APHRODITE) for climate change study because of its long-time coverage and high quality [67]. Previous research demonstrated that topography has a profound impact on reliable measurement of precipitation over mountainous regions [67], which could be partly overcome with stochastic weather generators [68]. The impact analysis of the corresponding topographic features is not mentioned [67]. Overall, in-depth verification and comparison of multiple datasets are required to explore further the reasons for the relative performance of different datasets and topographical characteristics [65].
The objective of this study is to systematically quantify the performance of the latest versions of MSWEP, TRMM, and IMERG gridded precipitation products in a geographically diverse watershed by comparing them to ground observations and to analyze the reasons for their strengths and weaknesses. To accomplish this, we compared the products at a basin average scale using data from 2000 through 2016. We use indices including continuous and categorical statistical metrics to appraise the agreement and differences of mean spatial patterns and variability between the precipitation datasets and observations. Results inform the improvement of future versions of precipitation retrieval algorithms for each product. We also discuss factors influencing the consistency between ground and gridded precipitation data. Precipitation data improvements could increase the forecast accuracy of hydrological and meteorological models, in return reducing the disaster risk in vulnerable areas, especially regions that currently have insufficient in situ precipitation data.

2. Materials and Methods

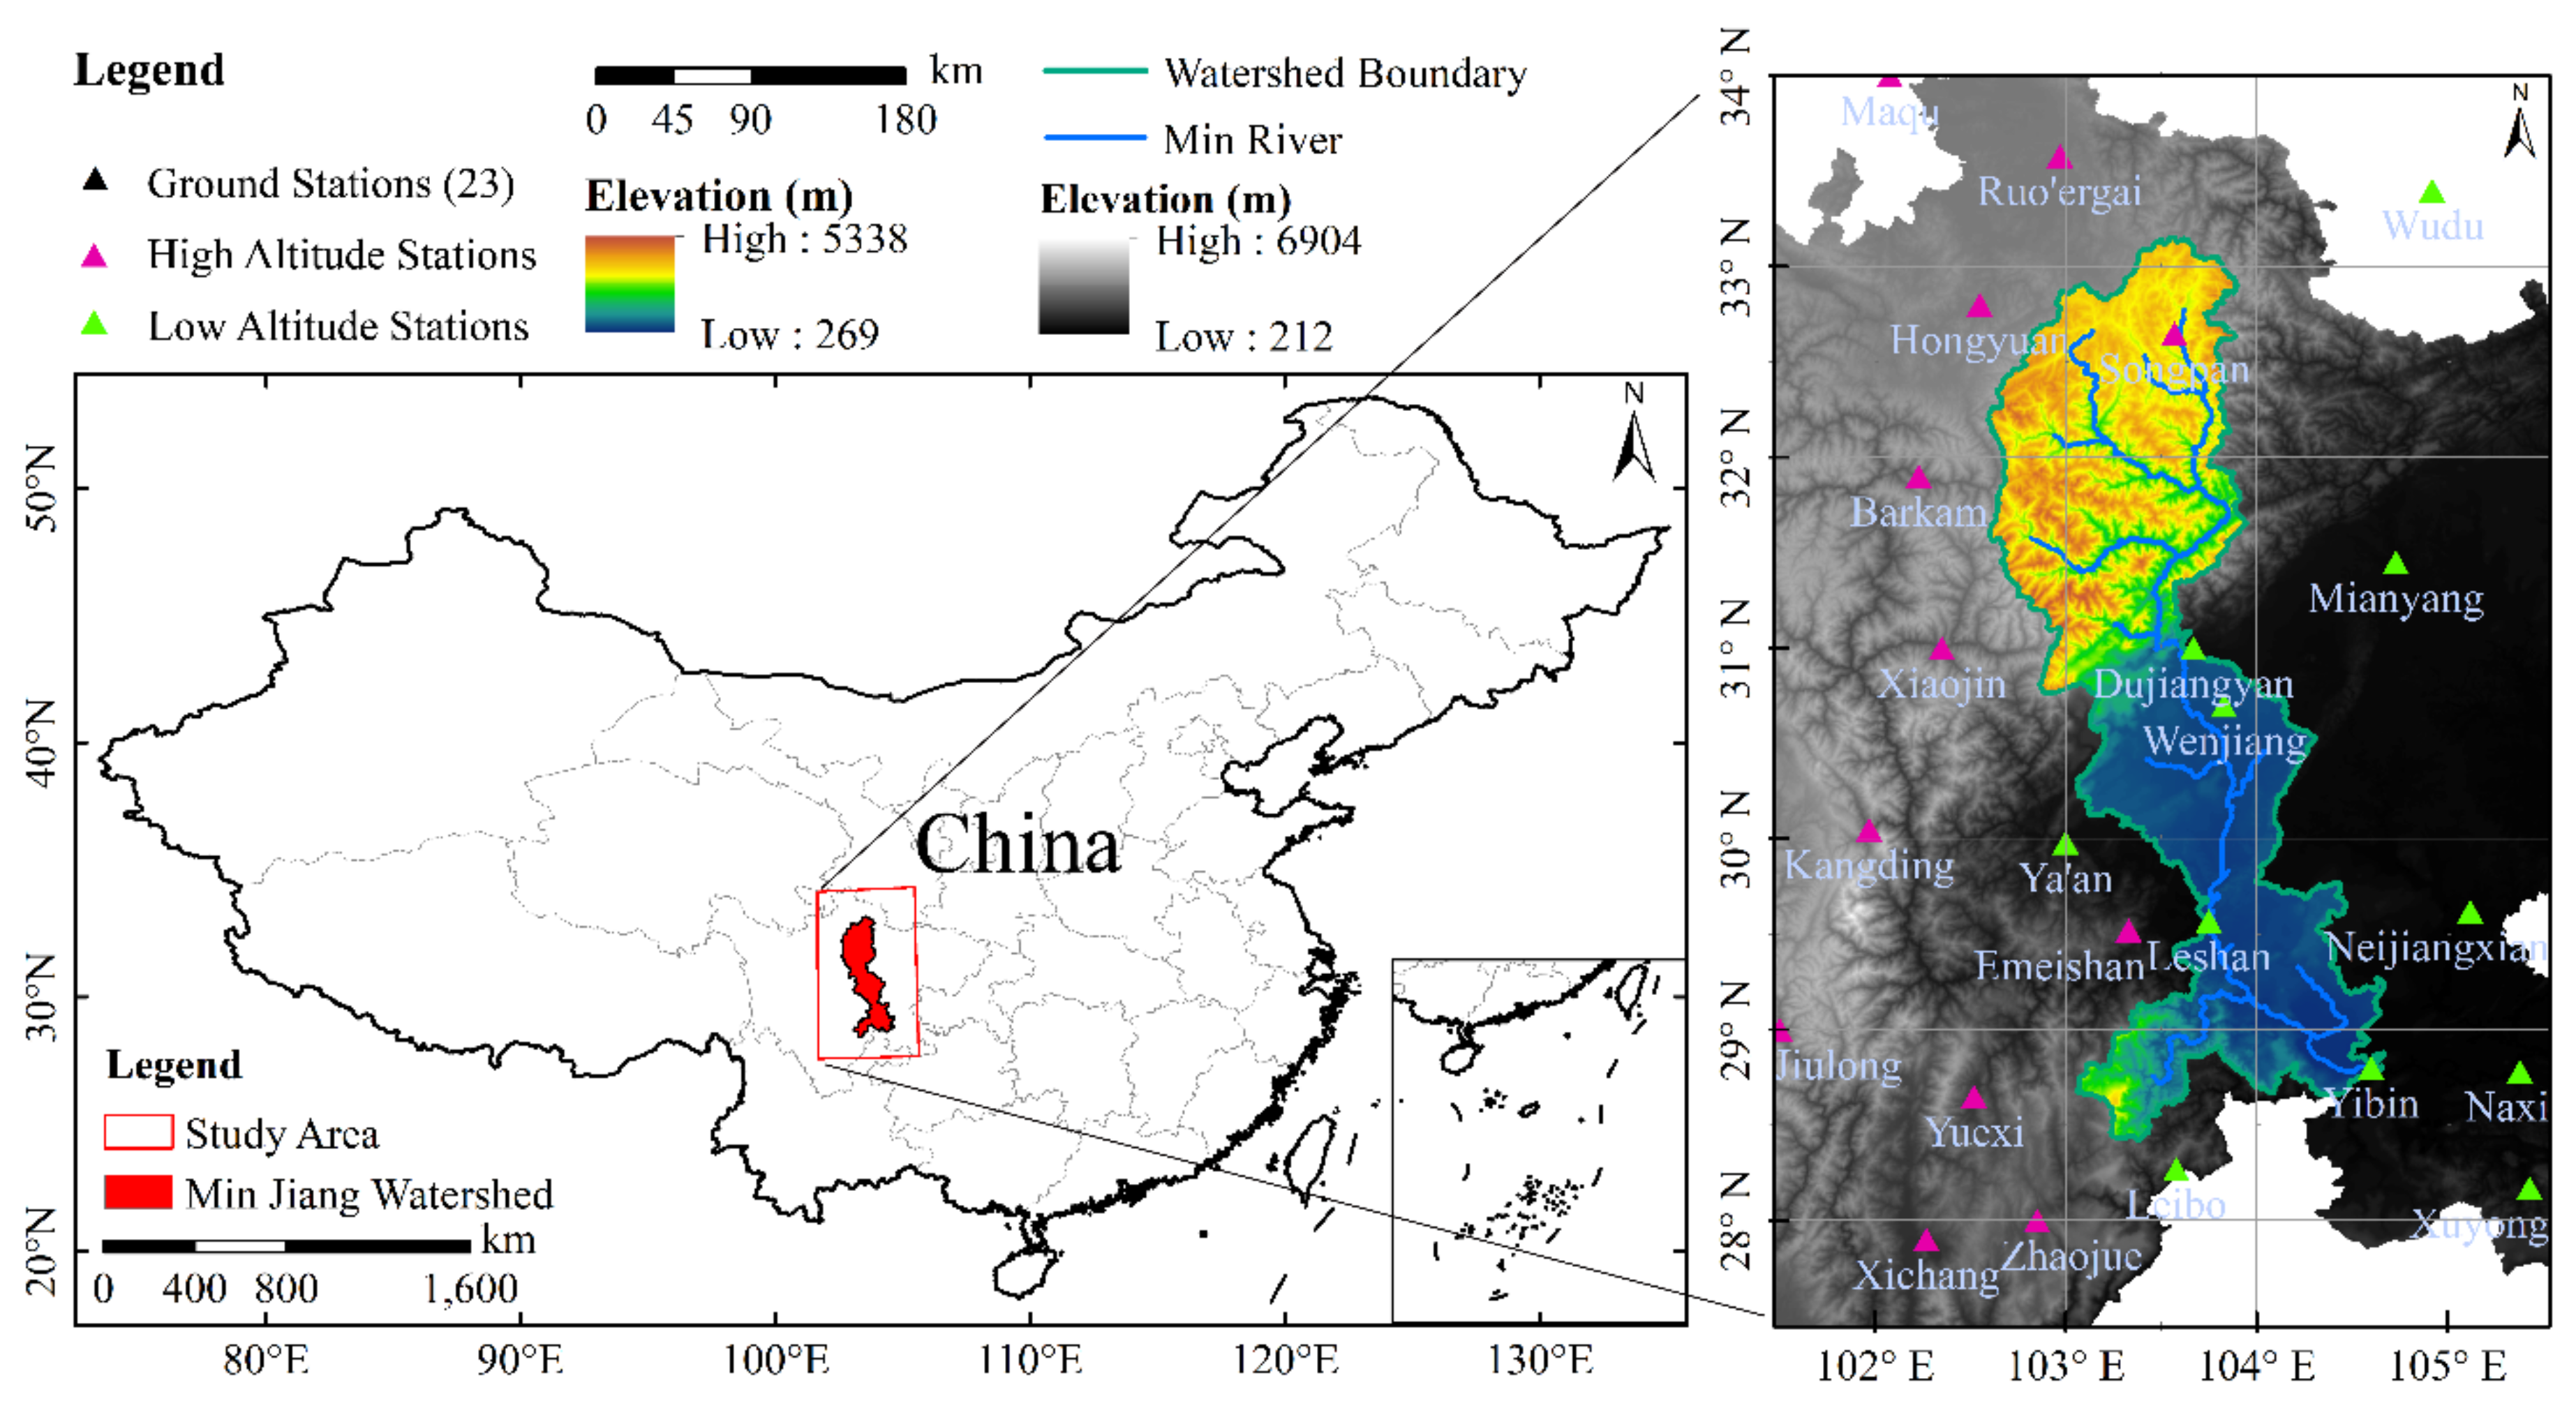
2.1. Study Watershed

The Min Jiang or Min River is located in southwest China, between 102°59′E and 104°31′E longitude and 29°53′N and 33°15′N latitude. Min Jiang drains a watershed of 13.6 × 10⁴ km2 and is an important tributary to the Yangtze River [69]. It originates in the slopes of the Min Mountains at the junction of Sichuan and Gansu provinces, then flows south through Songpan, Dujiangyan, and Leshan, before joining the Yangtze River at Yibin (Figure 1). The total length of the Min Jiang is about 730 km, over which it drops 3650 m in elevation [70]. The average annual precipitation across the Min Jiang Watershed ranges from 500 to 850 mm, and the steep terrain of the transition zone between the Sichuan Basin and Tibetan Plateau frequently experiences heavy precipitation [71]. The wettest portion of the watershed is the Wolong Nature Reserve and Dujiangyan area in the lower part of the watershed, where average annual precipitation reaches 1000–1500 mm. The annual average air temperature is 5–15 °C [72], which shows a decreasing trend from southeast to northwest.
The Min Jiang watershed is characterized by the monsoon climate of the Western Sichuan Plateau and the subtropical climate of the Eastern Sichuan Basin [73,74]. The multi-terraced complex terrain and interactions between various circulation systems result in heterogeneous climatic and rainfall systems in this region [75]. Further, due to its unique geographic location and altitude constraints, the vertical spatial difference in its climate behavior is evident [76]. To explore the influence of elevation on precipitation detection, two major sub-regions within the study area were separated, including a high altitude (1500–3500 m) sub-region and a low altitude (300–1500 m) sub-region (Figure 1). The overall climate characteristics present dual zoning characteristics in both the horizontal and vertical directions. As a result, the watershed presents a challenging environment for characterizing precipitation through meteorological observatory networks, and there remains a strong need for understanding the characteristics and mechanisms of precipitation in the area. The Upper Min Jiang is the major water supply source for the Chengdu Plain with a population of 25 million and functions as a key ecological barrier in southwest China [77]. It is, therefore, a suitable area to develop studies regarding the validation and calibration of gridded precipitation products in data-scarce mountainous watersheds [72].

2.2. Ground Observations of Precipitation

Due to the multi-terraced terrain and interactions between different climate circulation systems [75], rain gauge stations are sparse within the Min Jiang Watershed, and the access to ground-based observations of precipitation data is rather limited. In addition, the quality of regional-scale synoptic precipitation data is uncertain. Daily ground observation precipitation datasets from 2000 to 2016 were obtained from the China Meteorological Administration (CMA) Data Center. The quality of the data from each available site was confirmed and reinforced by checking the percentage of days with missing data and migrating adjacent gauge data as required [78]. Stations with no missing data and long-term coverage of daily records (during the period of July 2000 to May 2016) were selected.
A total of 23 rain gauge stations were identified as the reference for the intercomparison of gridded precipitation datasets. Figure 1 shows the spatial distribution of the ground observation rain gauges that were located between 101°30′E and 105°30′E longitude and between 27°30′N and 34°00′N latitude, which contains a number of representative sites within ~1° of the Min Jiang watershed. The stations were located at elevations from 341 to 3492 m (Table S1), which afford a wide range of altitudes to provide vertical distinctions.

2.3. Gridded Precipitation Datasets

We evaluated three gridded precipitation products, including MSWEP (Multi-Source Weighted-Ensemble Precipitation), TRMM (Tropical Rainfall Measuring Mission), and IMERG (Integrated Multi-satellite Retrievals for GPM). The latest version of MSWEP (version 2.2) covers the period from 1979 to 2017 with full global coverage at 0.1° spatial resolution and temporal resolution of 3 h, daily, and monthly. It seeks to optimally merge data from various gauges, satellites, and reanalysis estimates over the entire globe [79]. MSWEP has several specific advantages, such as global coverage and correction for distributional biases to eliminate spurious drizzle and restore attenuated peaks. The latest Version-7 post-real-time 3B42 (hereafter referred to as TRMM-3B42 V7), a product of TMPA, is one of the best TRMM-era multi-satellite precipitation datasets [57]. The TRMM-3B42 V7 is a quasi-global (50°S–50°N) precipitation dataset with 0.25° spatial resolution and temporal resolutions of 3 h, daily, and monthly. The TRMM microwave imager, IR and MW sensors, and a visible and infrared scanner radiometer support its rainfall estimating. This precipitation product has been proven to be one of the best TRMM-era multi-satellite precipitation estimates [80,81]. To extend TRMM, the GPM Core Observatory was launched on 28 February 2014. As a successor of TRMM, the IMERG Final Run (IMERG-F) is a Level 3 GPM product that combines all the passive microwave and infrared estimates from TRMM and GPM eras and is calibrated based on monthly gauge analysis from the Global Precipitation Climatology Centre (GPCC) [35,55,82]. IMERG provides rainfall and snowfall information at 0.1° spatial and half-hour temporal resolutions. The recent version of IMERG V6 uses retrospective processing back through the TRMM era and integrates the advantages of many previous algorithms [83], such as the PERSIANN Cloud Classification System [84], TMPA satellite-gauge combination procedure [43], and CMORPH Kalman filter Lagrangian time interpolation algorithm [35] and covers the period beginning in June 2000 [85,86]. IMERG precipitation estimates from 2000 to 2018 indicated that IMERG is robust in the transition period around 2014 [35].
In terms of the independence of comparison between gauge and three gridded precipitation products, GPCC uses data from 194 International Exchange Stations over China, accounting for <9% of the total rain gauge stations across China to tune the IMERG product [87]. In addition, both TRMM and GPM research-level products are calibrated by monthly gauge data from GPCC, and MSWEP V2.2 is calibrated by daily gauge-based information [52]. These global precipitation products are widely used, providing synoptic estimates of precipitation over our large focal watershed and having a complete data record for our study period of 2000–2016. Before evaluating and comparing the detection capabilities of these three products, we converted relevant data from the Coordinated Universal Time (UTC) to the Local Standard Time (LST) [88]. The gridded precipitation products with their spatial and temporal resolution are described briefly in Table 1.

2.4. Comparisons between Gridded Precipitation Data and Ground Observations

Sparse coverage of meteorological stations introduces additional errors from spatial interpolation while extrapolating data from meteorological stations to grids [51,89]. Therefore, for the comparison between observations and different gridded precipitation products, all three datasets were resampled at the point scale [90] by converting grid cells that contained at least one rain gauge station to station degree with the bilinear interpolation method [91,92,93]. The bilinear interpolation method [93,94] can be used to resample gridded data for a specific location [95], which in this study was each rain gauge. The logic is based on taking weighted averages of four adjacent pixels for the target location [95]. Once we derived these weighted averages, we captured general comparisons among the precipitation datasets by taking watershed averages. Performance of detecting spatial distribution required quantitative analysis at the daily and monthly scales. To tackle this, we evaluated the products on their ability to produce accurate rainfall intensities at the station scale.
Both the MSWEP and TRMM precipitation products are available at 3-h resolution, yet IMERG contains data every 30 min. Moreover, CMA accumulates daily precipitation ending at UTC+0800 [96], which is different from the precipitation accumulation conventions used by the three gridded datasets. Therefore, we adjusted this accumulation cut-off to the same standard daily scale in CST (China Standard Time).
To measure the accuracy of the gridded products, we calculated a number of continuous statistical metrics, including the correlation coefficient (CC), root mean square error (RMSE), mean absolute error (MAE), and relative bias (RB) [97,98]:
C C = i = 1 N P i P ¯ O i O ¯ i = 1 N P i P ¯ 2 i = 1 N O i O ¯ 2
R M S E = i = 1 N P i O i 2 N
M A E = i = 1 N P i O i N
R B = i = 1 N P i O i i = 1 N O i
where P i denotes the gridded product precipitation,   O i denotes the ground observation precipitation, P ¯ and O ¯ are their respective mean values, and N is the number of collocated observations.
The value of CC represents the degree of agreement in the linear relationship between the two variables [99]. RMSE and MAE measure the average error and average difference, respectively. MAE is a linear measure of error, whereas RMSE is a quadratic loss function that emphasizes extremes [50]. The RB metric quantifies the tendency of the gridded products to over- or underestimate the observed values, which can be negative (underestimation) or positive (overestimation). Values of 0 for RMSE, MAE, and RB indicate relatively ideal product performance. RRMSE and RMAE, respectively, indicate the normalized value of RMSE and MAE, defined as the RMSE and MAE divided by the mean value of the gridded precipitation datasets. Using RRMSE and RMAE allows the errors to be reflected in the form of percentages, facilitating comparison.
Further, the modified Kling-Gupta efficiency (KGE) score was used to assess the comprehensive performance of each gridded precipitation dataset [13]. The KGE score combines the Pearson’s correlation coefficient with ratios of bias (β) and variability (γ):
K G E = 1 C C 1 2 + β 1 2 + γ 1 2
w i t h   β = P ¯ O ¯   a n d   γ = C V p C V O
where CV is the coefficient of variation (i.e., the ratio of standard deviation to the mean value). The optimal values of KGE, β, and γ are 1.
Systematic and random error components of all datasets were assessed through a suitable error decomposition technique [49]:
R a n d o m . E r r . = i = 1 N P i P i * N
S y s t e m . E r r . = i = 1 N P i * O i N
P i * = a × O i + b
where P i * was calculated using a linear regression function in which a is the slope and b is the intercept [61]. We then used the percentage of systematic and random error components to describe the performance of the products. The scores ranged from 0 to 100 for errors representing the good and poor ends, respectively. A strong performance should yield lower systematic error components than random error components.
Monthly precipitation time series were examined at the watershed scale among different precipitation datasets. Then, all metrics described above were computed for the entire watershed and for each sub-region. Further, we used Taylor diagrams to demonstrate the statistical relationships between ground and gridded precipitation products and analyze factors influencing the consistency. Taylor diagrams have been applied widely to evaluate complex aspects of models and to discern the relative skill of several models [78]. For this purpose, two major sub-regions within the study area were isolated for detailed analysis of topographical influence factors (Figure 1). Taylor diagrams were then created at sub-regional scales.

2.5. Performance of Gridded Data in the Detection of Precipitation Events

Evaluation of precipitation detection ability among the three gridded precipitation products and ground observation data were performed for each station. Several widely used categorical statistical indices were adopted, including, respectively, the probability of detection (POD), false alarm ratio (FAR), BIAS, and critical success index (CSI):
P O D = H H + M
F A R = F H + F
B I A S = H + F H + M
C S I = H H + F + M
where H is the number of gridded precipitation data that are consistent with the gauge monitoring data; M is the number of data points in which gridded precipitation data showed no precipitation event (daily precipitation less than 0.5 mm represents no precipitation event) but the gauge station did; and F is the number of datapoints in which the gridded precipitation data showed a precipitation event but the gauge station did not.
These contingency metrics were assessed using various thresholds (0.5, 10, 25, 50, 100 mm/day) of daily ground observed precipitation over the Min Jiang watershed. The rainfall intensity was divided according to the division standards of rainfall intensity in the China Meteorological department and [20]. The POD metric represents a “hit rate” and describes the fraction of the observed events correctly estimated by the precipitation product based on the given threshold values [100]. The FAR metric is the percentage of precipitation events identified by the gridded products when there was no rainfall [101]. The BIAS metric indicates the degree of deviation from real rainfall events. The CSI shows the overall detection ability of the gridded precipitation compared to the observed precipitation [102]. The ideal values for POD, BIAS, and CSI are 1, and the ideal value of FAR is 0.

3. Results

3.1. Evaluation of Gridded Precipitation Products

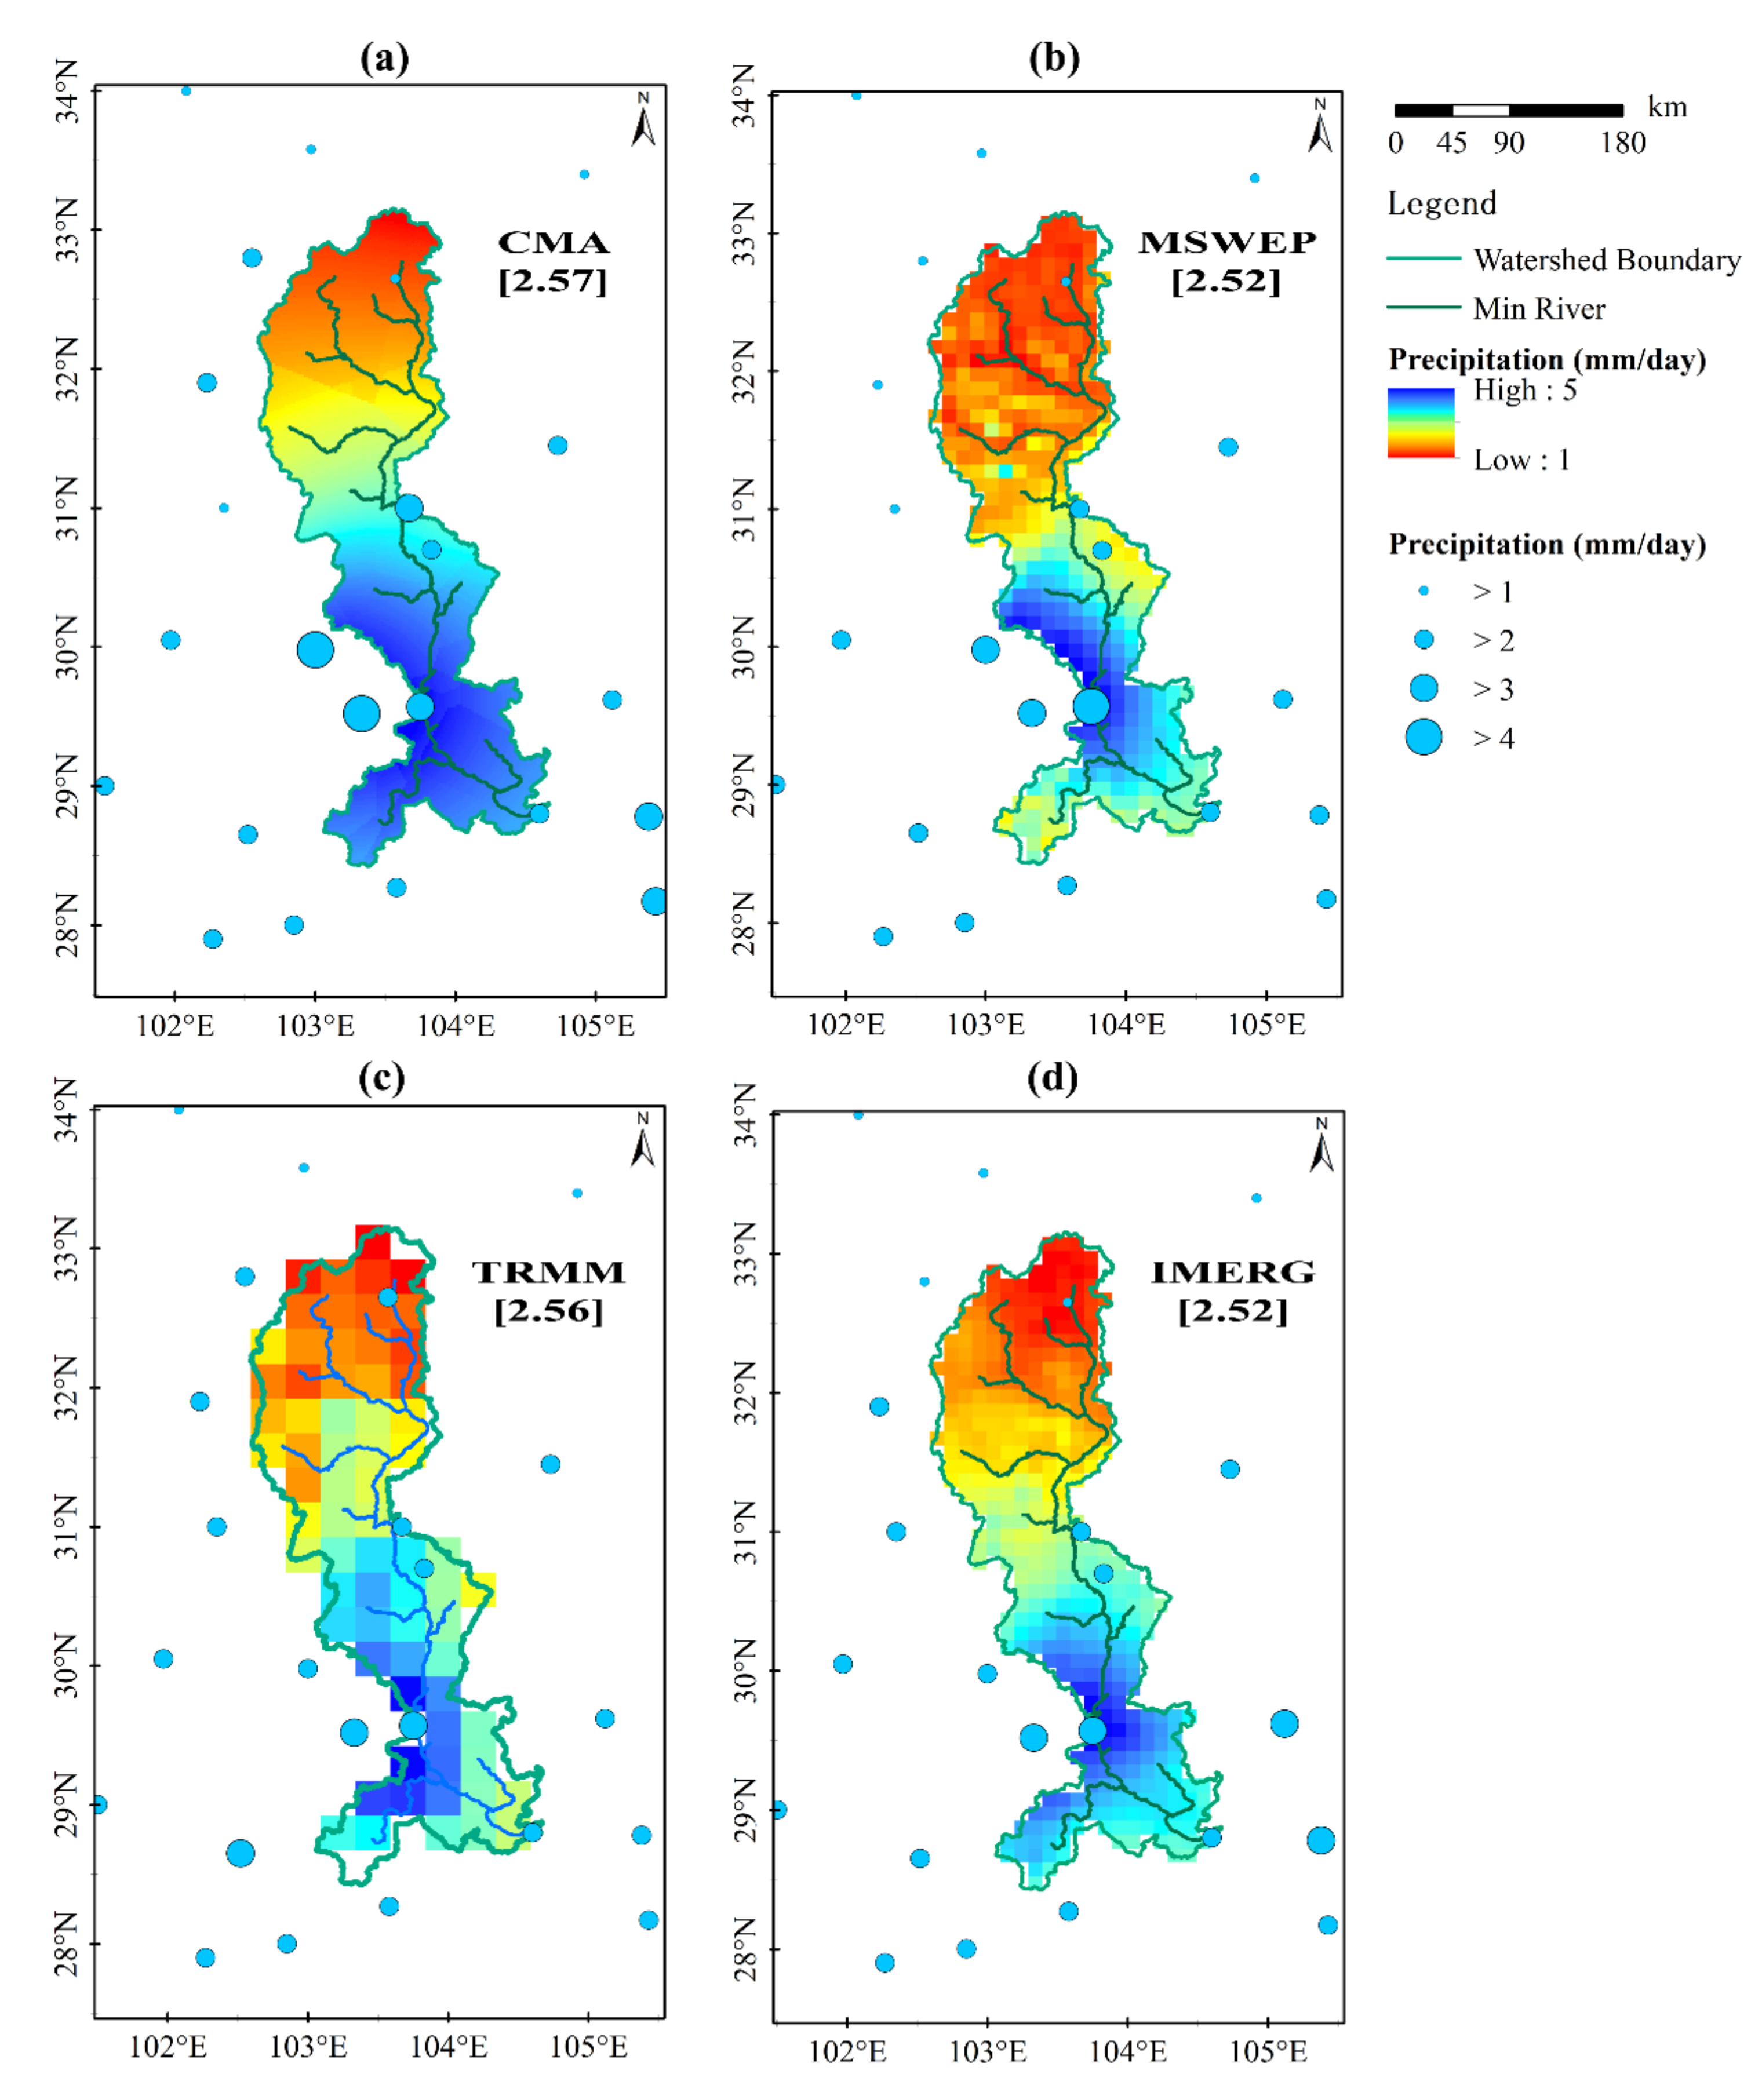
3.1.1. A General Comparison of the Precipitation Datasets

Figure 2 depicts scatterplots of the watershed-scale precipitation from the three gridded precipitation products versus the ground observations. All three products achieved their highest R2 values at the monthly scale, with IMERG and TRMM (R2 = 0.99) outperforming MSWEP (R2 = 0.98; Figure 2g). All three products performed worst with daily values, but MSWEP showed an especially large spread of points with a radial pattern (R2 = 0.14).
The continuous statistical metrics (CC, RRMSE, RMAE, RB, and modified KGE) of the comparisons between gridded precipitation products and ground observation data for different timescales (daily, 3 days, 5 days, 7 days, 10 days, 14 days, monthly, and annual) are plotted in Figure 3.
MSWEP performed better than the other products at the temporal scales from five days to monthly (CC > 0.85, RRMSE < 50%, RMAE < 30%, RB < −0.02, KGE > 0.85). Its performance peaked at the 14-day resolution (KGE = 0.95). However, MSWEP experienced severe declines in performance at time scales shorter than that, with much lower values of CC and KGE, and higher deviation and error values, reinforcing and quantifying the results from Figure 2. For the temporal scales at which the MSWEP product scored the least, IMERG performed better than TRMM. However, TRMM always had the best values of RB, indicating less deviation from the observed precipitation values.
As a supplement to Figure 3, Figure S1 presents the temporal distributions of the systematic and random error components of the comparisons. Due to the higher systematic error component for MSWEP at the daily, 3 days, and annual scales, MSWEP shows worse overall performance in short-term detection (Figure 3). It is the same reason that leads to a turning point in IMERG’s performance on the monthly-to-year scales.

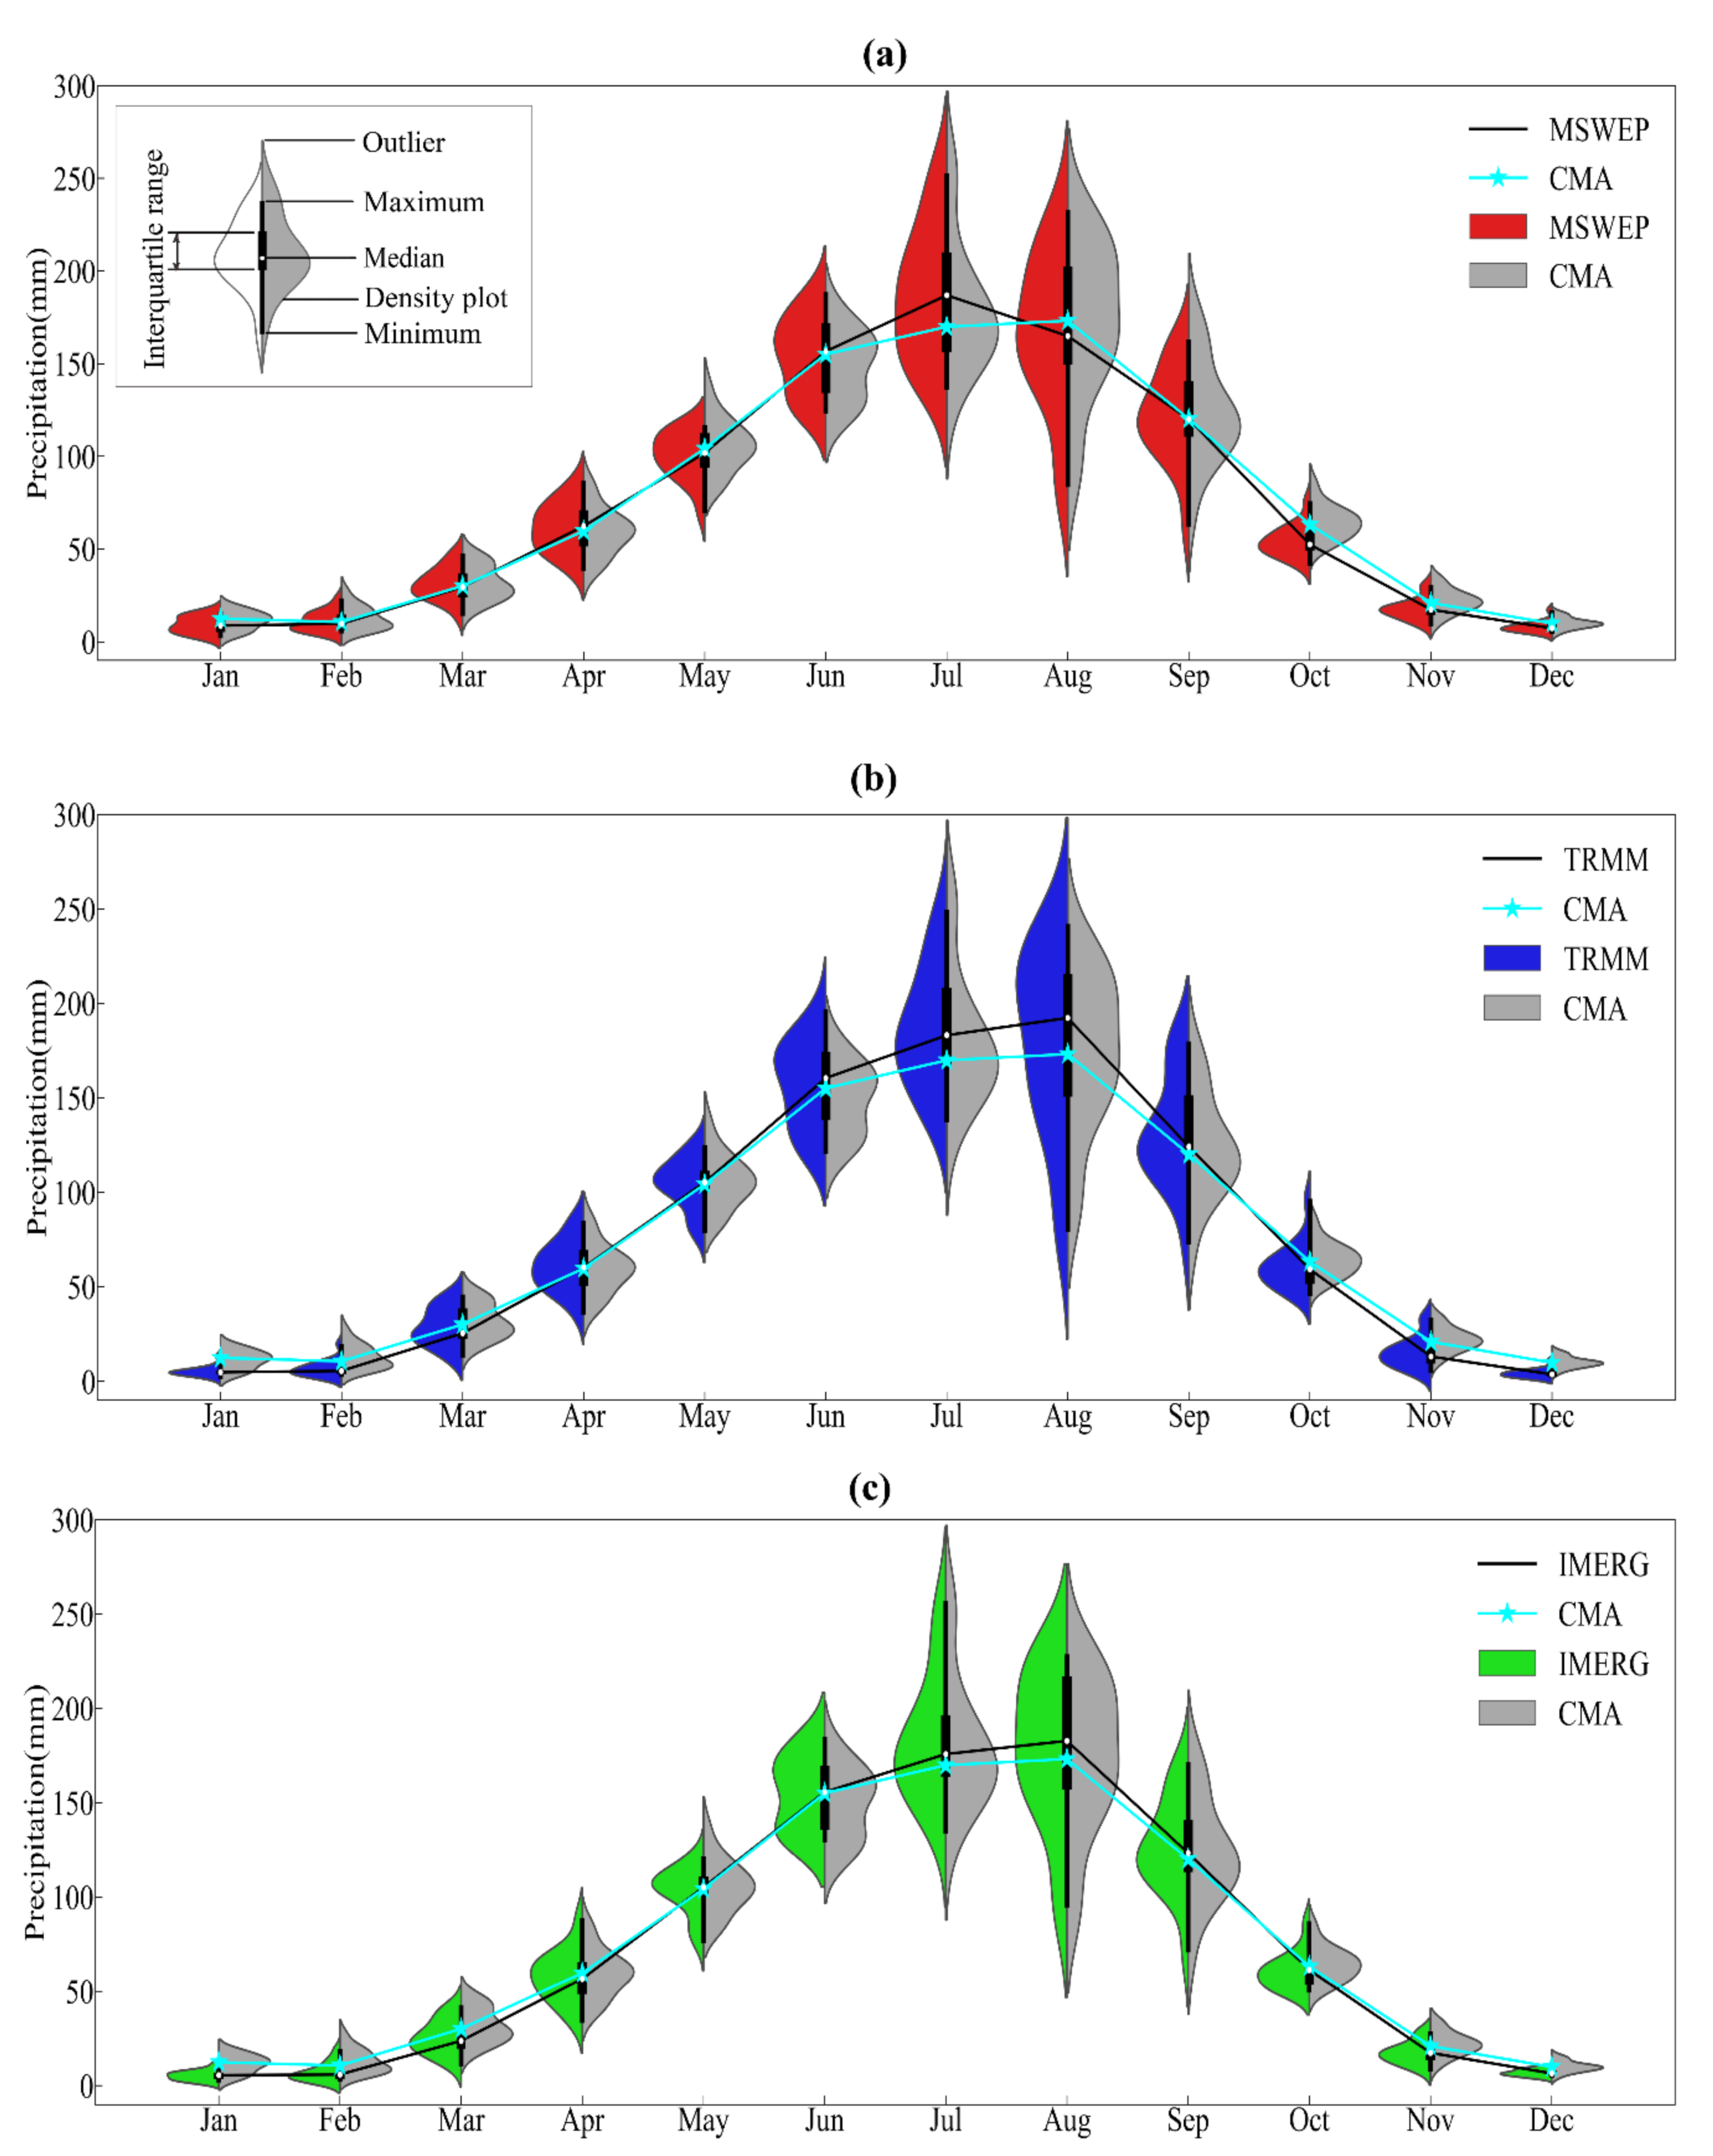
3.1.2. Detailed Comparison at the Monthly Scale

The spatial distribution of the relative error in monthly average precipitation is illustrated in Figure 4. All gridded products produced precipitation rates with negative relative error values and higher variability in lower elevation areas, confirming that topography influences the gradients of rainfall relative error in this region. MSWEP was observed to have the lowest relative error when averaged across all stations (Figure 4d and Table S1), with a mean relative error value of 0.03%. It was followed by IMERG at 1.38%. TRMM showed a higher average relative error (4.00%), indicating a higher positive deviation from the ground observation data.
Figure 5 is a time series of the absolute error derived from the monthly station-average precipitation between the ground observation data and the three gridded products. This figure reveals the obvious impact of seasonal fluctuations in precipitation. During the wet season (May through September), during which rainfall intensity was higher, TRMM notably overestimated precipitation while MSWEP predominantly underestimated it. IMERG fluctuated between overestimation and underestimation of precipitation. All three gridded precipitation products underestimated the precipitation rate at lower rainfall intensities, and MSWEP had the smallest values of absolute error.
Histograms of monthly relative errors in the study area (2000–2016) are presented in Figure S2, which confirm that all the gridded products slightly overestimated precipitation values for wet season months and underestimated the dry season values from October through April. The relative error achieved by IMERG was better than TRMM but not as good as MSWEP. MSWEP had the best performance during all months except April, May, July, September, and October. We can conclude that MSWEP has better correlations as compared to the other products at the monthly scale.
To account for the impact of seasonal fluctuations for each product showing in Figure 5 on the inter-products comparison, we adopt the violin plots to illustrate the probability distributions of monthly average precipitation for the gridded precipitation products (Figure 6). The temporal variation of monthly precipitation (shown by the probability distribution in the violin plots) was similar among site groups, and MSWEP had the best performance among median values. The violin plot distribution shows substantial differences in monthly rainfall amounts and patterns. The TRMM and IMERG products underestimated the precipitation of the dry season, while MSWEP correctly represented the timing of dry season. The TRMM and IMERG products tended to overestimate precipitation during the wet season [103].
Plots of the CC and KGE comprehensive indices of MSWEP, TRMM, and IMERG in different months are shown in Figure 7. All gridded products had good agreement with ground precipitation. However, their patterns were distributed differently between dry and wet seasons. IMERG showed better skill at detecting the precipitation of the wet season (all CC values exceeded 0.9; all KGE values exceeded 0.8), while MSWEP exhibited the best skill in detecting the precipitation of the dry season. TRMM fell in the middle for CC and KGE, reflecting its stable detecting ability. All of the gridded products were more accurate when detecting higher rainfall.

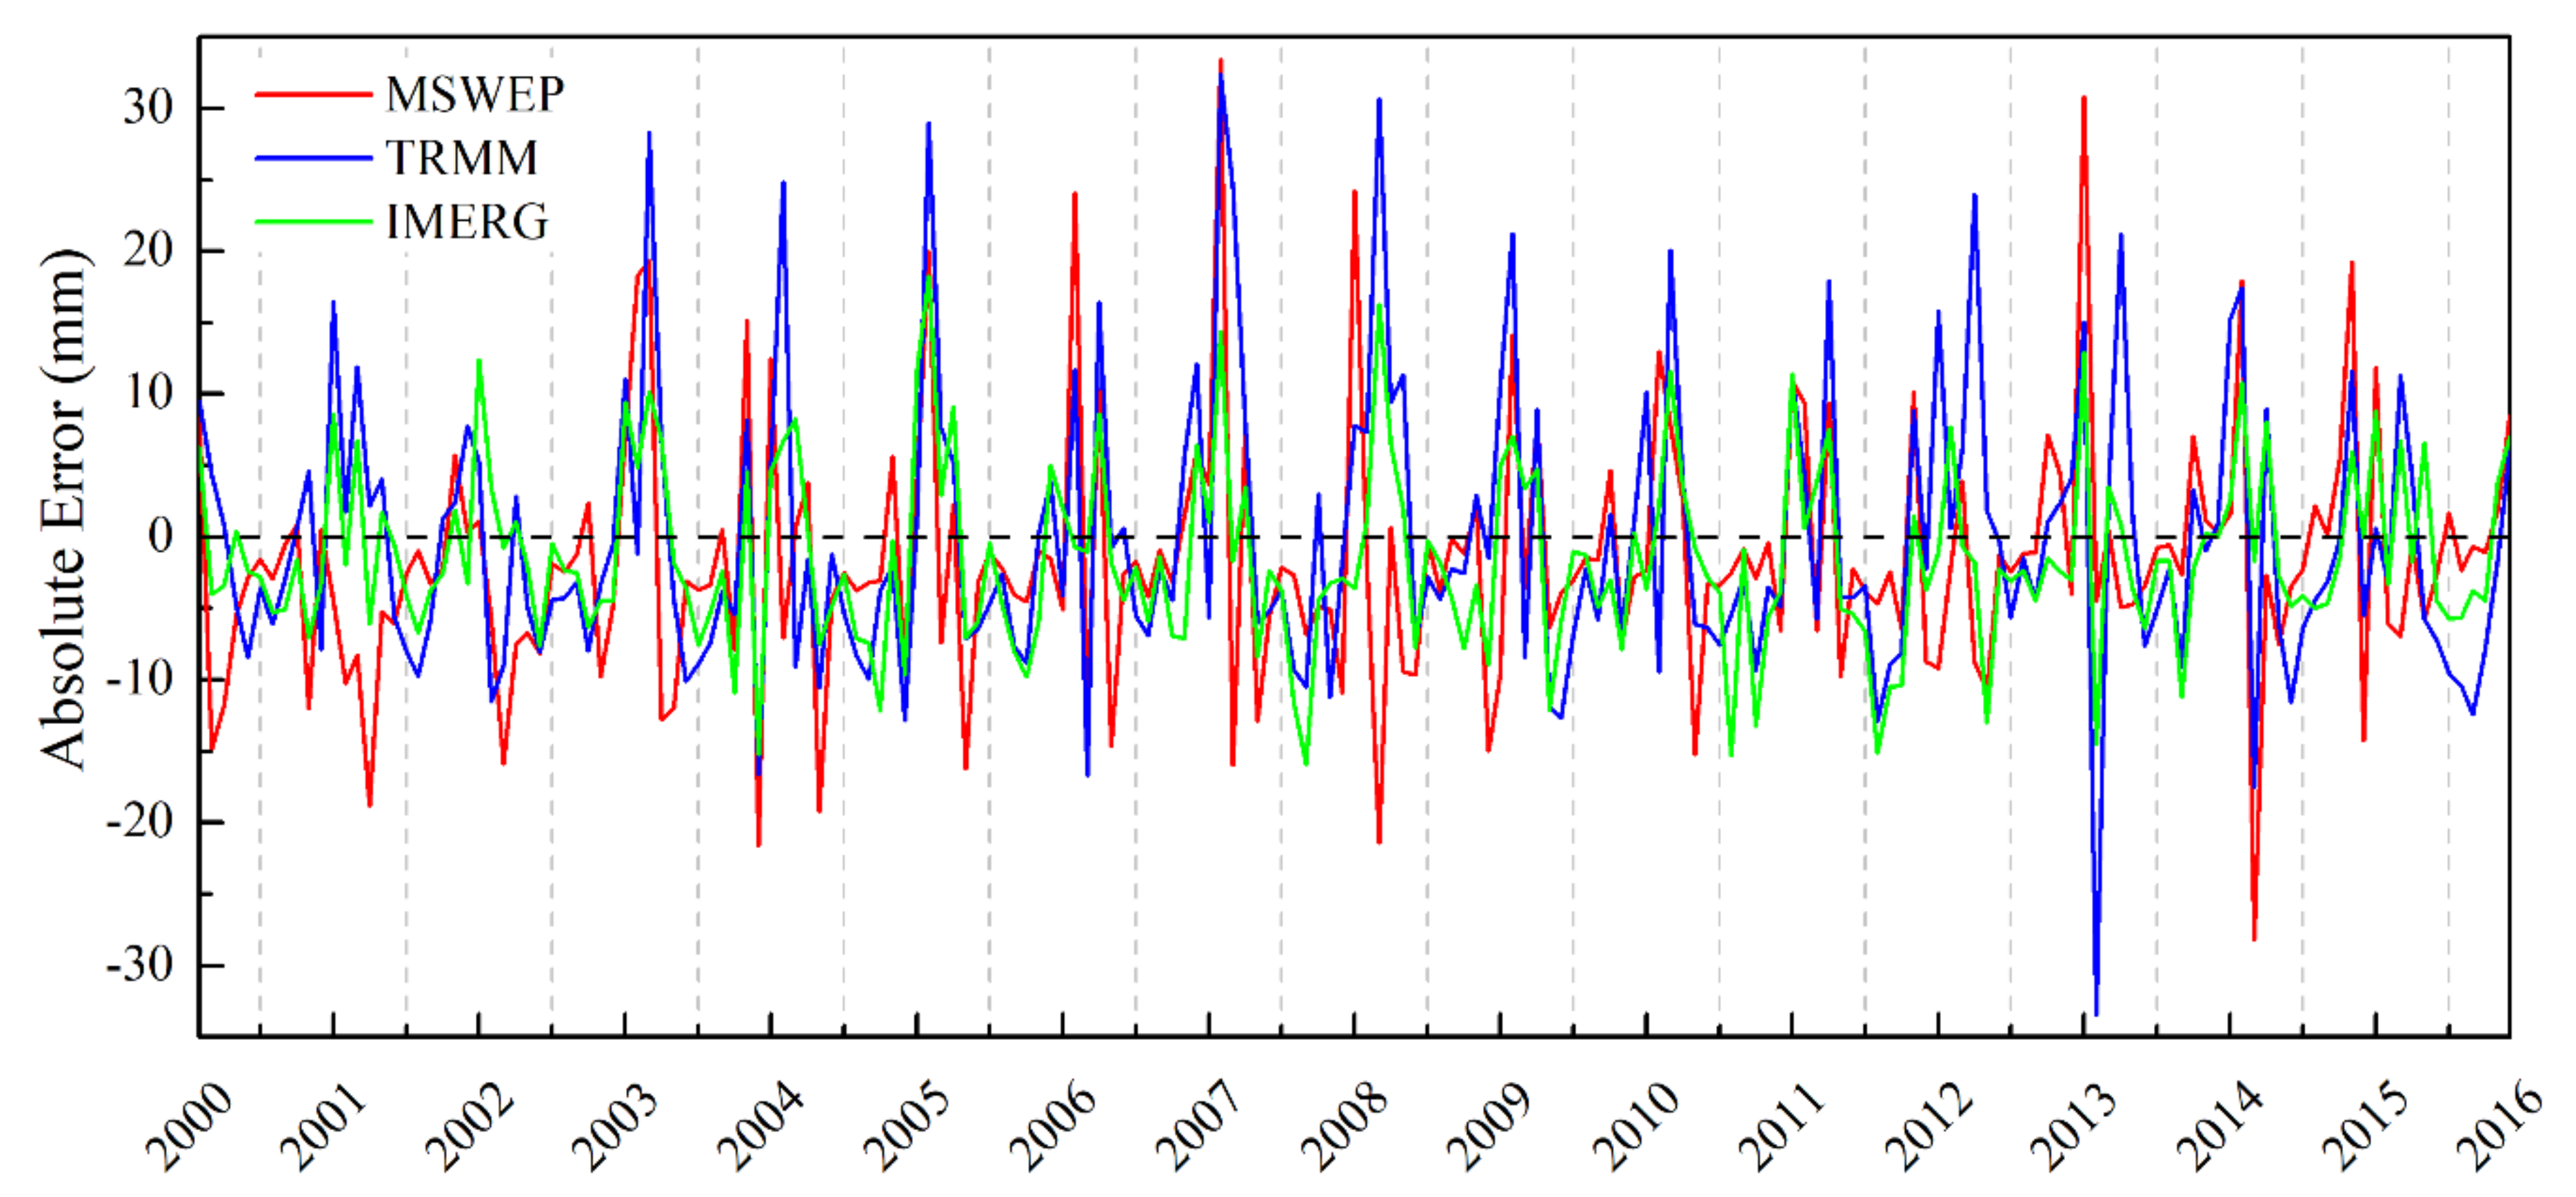
3.1.3. Detailed Comparison at the Daily Scale

The spatial distribution of the mean daily rainfall intensity across the Min Jiang watershed during the study period is shown in Figure 8. Because of the low density of observation stations, Figure 8a was obtained by Kriging Interpolation of the ground observation precipitation data. The notable spatial patterns of precipitation, such as the high precipitation areas situated in the southwest, were captured realistically by all gridded products. The precipitation gradients in the northern parts of the watershed were well-captured by the TRMM and IMERG products, whereas MSWEP indicated a wider belt of low precipitation in the north. The mean precipitation of TRMM was 2.57 mm/day, which agreed well with the ground observations. It also produced the most accurate daily average precipitation values and spatial distribution, which may be due in part to lower native spatial resolutions of TRMM, which are more similar to the resolution of the ground stations [13,104].
As calculated at the watershed average scale, the various daily statistical indices of gridded precipitation are presented in Table 2. Most of the statistical indices were well-captured by MSWEP, which showed similar skewness, kurtosis, SD, and CV. TRMM was worse at representing the precipitation pattern, with a higher standard deviation (4.17) and coefficient of variation (162.44%).

3.2. Precipitation Thresholds Detection Comparison

Evaluation of Contingency. The statistical values showing the performance of the three gridded products at different thresholds are tabulated in Table 3. When the daily precipitation threshold value was 0.5 mm/day, the IMERG product had the highest POD (0.65) and CSI (0.48) values, while the MSWEP had the lowest POD (0.63) and CSI (0.40) values. The same characteristics have been found with different thresholds [90]. At the same time, when the daily precipitation threshold value changed, the IMERG also registered the best FAR and BIAS values, which indicates that the IMERG product has minimal volatility with different thresholds [18,104]. Overall, the performance of all contingency metrics illustrated that the POD and CSI values of all three products decreased as the precipitation threshold increased, and FAR and BIAS were worse [105]. These three gridded products were not able to adequately and accurately capture precipitation events of different magnitudes.
Evaluation of Rainfall Intensity Distribution. For the probability density function (PDF) difference of daily precipitation, both TRMM and IMERG showed similar PDF structures with the ground observation data (within ±1%; Figure 9). Although MSWEP incorrectly estimated the frequency of small precipitation events (<0.5, 0.5–10 mm/day), it provided an approximate match for the frequency of large precipitation events. In general, all products had a similar ability to capture occurrence frequency distributions for a range of rainfall intensities [2,106].

4. Discussion

4.1. Factors Influencing the Consistency between Ground and Gridded Precipitation Data

  • Different Precipitation Data Products
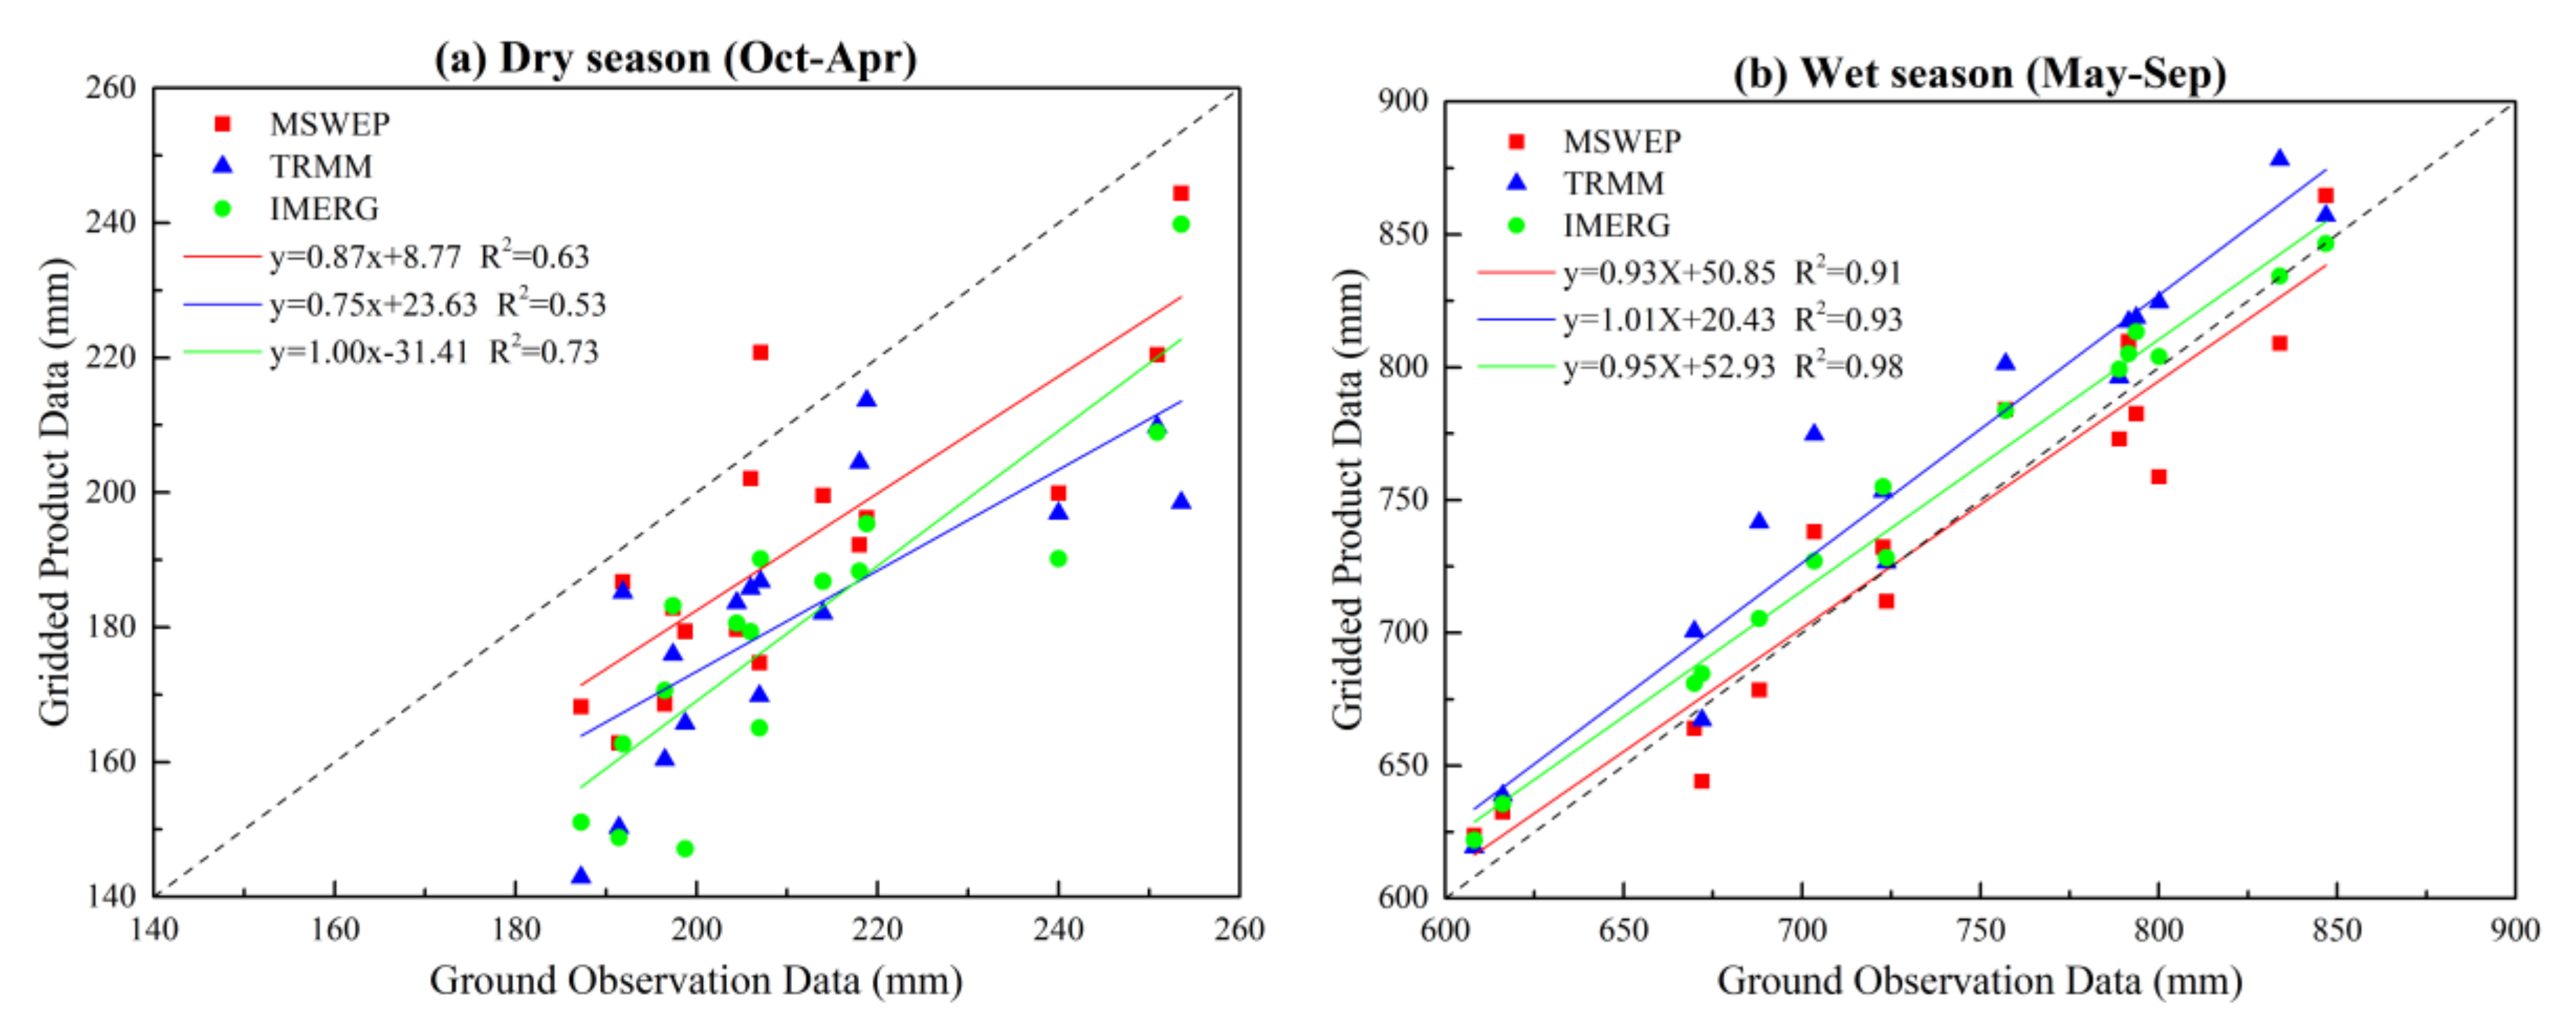
The results of our performance evaluations of the MSWEP, TRMM, and IMERG precipitation products showed that they all performed well in the data-scarce, topographically diverse Min Jiang watershed. It also confirmed that the degree of consistency between directly measured ground data and gridded precipitation data is influenced by the type of precipitation product, topographical features, and climate patterns.
As shown in Figure 2 and Figure 3, the CC, RRMSE, RMAE, and KGE metrics confirmed that IMERG was more accurate than the other products for daily and annual scales [101]. TRMM showed the smallest deviations and differences, and was slightly inferior to IMERG. These statistical deviations could be associated with the differences in detection hardware, retrieval algorithms, and correction mechanisms. The TMI (TRMM Microwave Imager) uses nine radiometric channels from 10 GHz to 85.5 GHz, whereas the GMI (GPM Microwave Imager; used by IMERG) added four channels for a total range of 10 GHz to 183 GHz [107]. The enhanced capability of IMERG to detect light rain and solid precipitation can be attributed mainly to these improvements in its sensors [104]. In addition, the TRMM satellite carries a single-frequency precipitation radar, whereas the GPM Core Observatory carries a dual-frequency precipitation radar (DPR), which provides details about particle drop size distributions and improves the performance of precipitation estimates [48,103]. Additionally, compared with the TRMM PR, the GPM DPR distinguishes rain types more clearly and classifies more precipitation events as “stratiform” and “convective” with no precipitation events classified as “missing”. DPR reduces the misclassification of clouds and noise signals as precipitation type “other” (from 10.14%) to 0.51% for all swath data [48].
With 5-day to monthly temporal resolutions, MSWEP outperformed the other two precipitation products. Figure 2 and Figure 3 revealed that MSWEP products are more suitable for the study of long-term mesoscale rainfall than for short-term light or extreme rainfall, which matches performance results from India [13]. Figure S1 revealed that a larger systematic error component may lead to worse performance for all products. The sources of systematic error can generally be attributed to their design objectives [105], which are retrieval algorithms and merging weights design of various data resources. MSWEP can be used as high spatiotemporal input data of hydrological and meteorological applications for medium temporal scales, notably in the monthly scale, even in data-scarce regions [54]. MSWEP V2.2 has made progress by merging a wide range of the gauge, satellite, and reanalysis data [52], and it was calibrated by daily gauge-based information, thus low-density distributions of ground observations will introduce a certain amount of error. Compared with TRMM and MSWEP, IMERG products have higher spatial and temporal resolutions (0.1° and 30 min, respectively), which enhanced its ability to detect extreme rainfall and reduced its downscaling errors [104].
  • Seasonality
Due to the seasonal volatility of precipitation showed in Figure 6 and Figure 7, evaluation of seasonal precipitation (wet and dry accumulated precipitation) distributions is presented by the scatter plots showed in Figure 10. The values of R2 indicated that the wet season detection had better agreement with the ground observation data than did the dry season detection. The TRMM and IMERG products overestimated precipitation, whereas MSWEP underestimated rainfall during the wet season. Overall, the IMERG dataset had the highest correlation values (0.73 and 0.98, respectively) for both dry and wet seasons.
Table 4 presents different statistical indices of the tested precipitation products, as compared to ground observation data at the watershed scale for the dry and wet seasons. The error characteristics and continuous indices clearly show that MSWEP was the best gridded precipitation product for both seasons, with the smallest error values and the highest scores on comprehensive indicators. Further, the wet season detection notably outperformed dry season detection across the board, which also shows that gridded precipitation had better detection ability for higher rainfall. Yilmaz and Derin [108] explained the differences in the wet and dry seasons produced by the IR and MW datasets, which are used in the algorithms of TRMM and IMERG products. Their results showed that the MW datasets were responsible for significant precipitation underestimation (underreported by about 75%) in the cold season. Given the much better detection during the wet season, gridded precipitation products are more suitable for regions with greater rainfall.
Gridded products exhibited strengths and weaknesses for detection capabilities at different temporal scales. For example, the daily results showed much lower CC values relative to observations than the monthly evaluation results for all three products. This phenomenon generally occurs because errors that are discernible on a daily scale are canceled out when averaged out across an entire month [97]. With 5-day to monthly temporal resolutions, MSWEP outperformed the other two precipitation products. IMERG was more accurate than the other products for daily and annual scales. The 5-day resolution served as a turning point for all three datasets, which was caused by the higher systematic error component.
  • Topography
To explore the influence of different elevation bands on precipitation detection, two major sub-regions within this area were differentiated for spatial comparison: (a) high altitude (1500–3500 m) and (b) low altitude (300–1500 m). The two sub-regions had similar numbers of observation stations. Figure 1 and Table 5 show the distribution of altitudes and daily mean precipitation values, which reveals that low altitude areas had higher rainfall values in a flat setting. Table 5 displays the values of relative error for the three precipitation products for low- and high-altitude regions. As shown in Table 5, the IMERG product had the lowest negative relative error. The results in Table 5 were quite different from those in Figure 4. Taken together, we conclude that the relative error values of MSWEP across the whole study region were produced by pronounced errors in both the high and low altitude areas that canceled each other out.
Taylor diagrams comparing monthly precipitation from the three products at different elevation levels are presented in Figure 11. IMERG had the best comprehensive metrics. Figure S3 presents box plots of the daily statistical metrics distributions for different products across different elevation ranges. It reveals that gridded datasets in high-altitude areas performed better than in lower areas, which contradicted our assumption.
One of the reasons behind this discrepancy is that high altitude observations are closer to the spaceborne radar equipment, which shows a marked height dependence. It is possible that precipitation data in high-altitude areas were taken at heights where the attenuation effects of radar could be reduced. Ground observation precipitation in high-altitude areas is less influenced by temperature, interception, surface vegetation, etc., so the true ground observation values are better observed by the satellite sensors [109]. According to [55,110], the sparse gauge network in western China, with its mountainous areas, may affect the performance of gridded precipitation products. However, our hypothesis excluded this factor since it was based on comparing two subdivisions with similar numbers of observations.
Secondly, rainfall processes are complex in the watershed of western China. Ground observation stations located on the windward side of the mountains are subject to rainfall patterns dominated by orographic uplift. Moreover, most of the low-altitude observations are located in the transition zone between the Sichuan Basin and the Tibetan Plateau, right where orographic uplift and the latent heat release trigger the initiation and development of convective systems [111,112]. The satellite sensors have worse performance in convective systems [38,113], which does not trouble high altitude areas with relatively simpler weather systems [55,110]. Many studies have also confirmed that precipitation radar generally works better for stratiform rainfall with horizontally homogenous radar echoes than for convective rainfall, which tends to present with vertical cores of intense radar echoes [113,114]. The examination over the upper Yellow River and Gansu–Ningxia water system also demonstrate better POD than other areas in the Yellow River Basin [53]. The greater proximity to the satellites and the interactions between convective systems and regional topography could be the main reasons for superior performance at high altitudes.
Previous studies on the combined effects of topography and rainfall types in high and low elevation ranges have produced opposing conclusions [57,63,67,104]. It may be due to the differences in gauge density, rainfall types, and regional topography compared to Min Jiang watershed. To summarize, the stronger performance of all precipitation estimates at higher altitudes (Table 5 and Figure 11) likely results from a combination of three factors: the characteristics of the retrieval algorithms, cloud microphysics, and specific interactions with regional topography [104].

4.2. Benefits and Limitations of Using Gridded Precipitation Data in this Data Scare Region

  • Potential Benefits
In the extensive and complex topography and climate conditions of western China, comprehensive in situ observations of precipitation are greatly limited by high spatial and temporal variation. Many previous studies have confirmed that small regions with complex terrain can produce large variations in precipitation, which cannot be accurately reflected by the sparse monitoring stations [46]. Gridded precipitation products have the potential to eliminate these deviations stemming from in situ stations, assess climatic trends, simulate the process of pollutant migration, evaluate the ecological impacts of climate change, and bolster hydrologic simulations with high spatiotemporal resolutions [115,116,117]. This study noted that MSWEP, TRMM, and IMERG have different strengths and limitations in data-scarce regions, depending on the specific precipitation detection conditions. Taken as a group, that may be viewed as a strength in terms of practical applications to address different spatiotemporal scales. For temporal comparison, MSWEP is the ideal choice for datasets that resolve at 5-day to monthly scales, whereas IMERG is better at the extremes (e.g., daily or annual scales). MSWEP is best suited for the precipitation detection and hydrological modeling of long-term mesoscale rainfall in western China, whereas the IMERG product has stable performance for applications with short-term light and extreme rainfall [104]. Low rain gauge availability, the noise introduced by complex topography, and bias introduced by climatic conditions may affect the adjustment and reanalysis of gridded precipitation products with ground station datasets [118]. Similarly, the infrared and microwave retrieval algorithms also have limitations [64,108,119]. These results should help guide algorithm development and encourage the development of a better understanding of the performance of the physical mechanism for each product. These accurate precipitation datasets with the high spatiotemporal resolution and long-term records can be utilized in the distributed time-variant gain-based framework to quantified the effects of climate and human activities on hydrological alterations [77], thereby reducing the disaster risk in vulnerable areas, especially regions that currently have insufficient in situ data.
For detection capacities of rainfall across a range of intensities, IMERG has the best performance among all three precipitation products. It also has the highest spatial and temporal resolutions, which may help to represent the spatial patterns, volumes, and extreme precipitation events in western China.
  • Potential Limitations
With the exception of a few well-equipped research locations within the overall watersheds [120], the distribution of precipitation characteristics in complex terrain cannot currently be confirmed with direct measurements beyond sparse gauges, making it challenging to get a true estimate of the performance of these gridded products [46] within the Min Jiang watershed. The performance of all contingency metrics revealed that the POD and CSI values of all three products decreased as the precipitation threshold increased, and FAR and BIAS were worse. This indicates a limitation in the ability of these satellite sensors to detect precipitation intensity, a conclusion also drawn in [56,103]. Meanwhile, these products are unable to reflect local heavy rainfall characteristics accurately because their grids were downscaled by homogenization data. The performance of gridded products during extreme precipitation in data-scarce regions remains to be validated, especially at higher temporal resolutions, such as 30-min resolution.
Furthermore, gridded precipitation estimates are also subject to uncertainties resulting from cloud top reflectance, thermal radiance, retrieval algorithms, and correction mechanisms [18]. For example, both TRMM and GPM products compared here are calibrated by monthly gauge data from GPCC, and MSWEP V2.2 is calibrated by daily gauge-based information as well [18]. Even for different levels of IMERG products, the retrieval algorithms and rain gauge correction methods are various [108,119]. The complete IMERG products (for all Runs) include calibration to gauge data, such as climatologically for Early and Late products and by month for the Final product [108,119]. Additionally, The Early and Late Runs are executed in the Precipitation Processing System (PPS) Real Time (RT) processing system, while the Final run is executed in the PPS processing system. All the input data, algorithms, and PPS introduce differences and errors for all the Runs [108,119].
To extend TRMM, the GPM Core Observatory was launched on 28 February 2014. Therefore, there can be discrepancies of the precipitation data between the TRMM and GPM eras. However, we do not observe an evident breakpoint in precipitation time series around 2014, indicating that the consistency of the IMERG dataset is robust during the transition period, which is in line with previous findings in China [35,85]. Thus, identifying sources of errors should be achieved to further improve satellite sensors and algorithms development [58]. Follow-up studies are required to clarify the reasons that lead to the varied performance of gridded precipitation datasets when compared with ground observations in the study region, which is beyond the scope of this study. The core task of this work is to make the recommendation of potential precipitation datasets for hydrometeorological studies in data-scarce mountainous areas in western China.
This study did not consider the error effects of the interpolation method that we used, although we selected one that is relatively well-equipped to change the spatial scale from gridded products to the station scale [40]. The impact of different interpolation methods on accuracy differences presents an opportunity for future study. When extrapolating our findings to other regions, attention should be paid to the density and spatial distribution of gauge stations, monsoon influences, rainfall systems (convective or topography rainfall), seasonal wind patterns, and the location of in situ stations on the leeward sides of mountains and valleys [108,119]. To support the practical application of high-quality data products, they need to be comprehensively evaluated and carefully selected before integrating one into any specific application.

5. Conclusions

We evaluated three global-scale gridded precipitation products for their ability to estimate precipitation over a range of spatial and temporal scales within the Min Jiang watershed of western China, a data-scarce region having complex topography and large spatiotemporal variability in precipitation. We compared the remotely-sensed precipitation data products against ground-based measurement data during the period of 2000–2016 and explored the primary factors influencing differences in performance. Ground-based observational measurements representing “true” rates of observed precipitation are needed to provide an independent check on the degree of errors in gridded precipitation datasets. Future studies are required to completely identify factors influencing the consistency between ground and gridded precipitation data. The main conclusions are summarized as follows:
  • The three precipitation products that were evaluated each exhibited strengths and weaknesses for detection capabilities at different temporal scales. The wet season detection notably outperformed dry season detection across the board, indicating that gridded precipitation had better detection ability for higher rainfall.
  • Gridded precipitation from MSWEP outperformed TRMM and IMERG on moderate (5-day through monthly) time scales. The 5-day resolution served as a turning point for all three datasets: at shorter time scales, the quality of MSWEP detection deteriorated severely. The MSWEP product was deemed to be the most suitable for the study of long-term mesoscale rainfall, rather than short-term light or extreme rainfall, in this watershed.
  • The IMERG data product was superior to the other two in its performance stability and had the best performance of rainfall detection. Overall, IMERG represents a good choice when stable performance is required for precipitation pattern simulation, uniform distribution of spatial scale indices, and detection capability.
  • All products provided more accurate estimates of precipitation in high-altitude elevation bands compared to low-altitude areas.
  • The composition of the datasets, climatic systems, and regional topography are the three primary factors affecting consistency between ground and gridded precipitation data.

Supplementary Materials

The following are available online at https://www.mdpi.com/article/10.3390/rs13193795/s1, Table S1, Figures S1—S3.

Author Contributions

Collaboration and discussion: all authors; Conceptualization, L.Z., P.L. (Ping Lan) and L.G.; methodology, L.Z. and L.G.; software, L.Z. and P.L. (Ping Lan); validation, L.Z.; formal analysis, L.Z., L.G., and G.Q.; investigation, L.Z. and P.L. (Ping Lan); resources, L.Z., L.G., and P.L. (Ping Lan); data curation, L.Z., L.G., and P.L. (Ping Lan); writing—original draft preparation, L.Z.; writing—review and editing, all authors; visualization, L.Z. and L.G.; supervision, L.G., C.R.M., and G.Q.; project administration, L.G. and G.Q.; funding acquisition, L.G., E.W.B., and G.Q. All authors have read and agreed to the published version of the manuscript.

Funding

This research was funded by the National Key R & D Program of China, (Grant 2019YFC1510701 and 2018YFE0103800); The National Natural Science Foundation of China (Grant 51879172); The Fundamental Research Funds for the Central Universities, CHD (300102299302, 300102299102, 300102299104) and International Collaborative Research of Disaster Prevention Research Institute of Kyoto University (2019W-02). E.B. conducted this research while serving at the U.S. National Science Foundation (NSF) and was supported in part by the National Institute of Food and Agriculture under Hatch project #PEN04730. Any opinions, findings, and conclusions or recommendations expressed in this material are those of the authors and do not necessarily reflect the views of the funding agencies.

Institutional Review Board Statement

Not applicable.

Informed Consent Statement

Not applicable.

Data Availability Statement

The data and codes used for this study are available from the corresponding author upon request.

Acknowledgments

This study used MSWEP V2.2, TRMM-3B42 V7, and GPM-IMERG V6 precipitation products, along with in situ ground observation data available from the China Meteorological Administration (CMA) Data Center (http://data.cma.cn/ (accessed on 20 June 2020)). The TRMM and IMERG products were downloaded from Precipitation Measurement Missions at National Aeronautics and Space Administration (NASA) at https://pmm.nasa.gov/data-access/downloads/gpm (accessed on 20 May 2020). The authors cordially acknowledge and appreciate the efforts of the institutions and scientists who made possible the availability of these datasets, without which the current study would not have been possible.

Conflicts of Interest

The authors declare no conflict of interest.

References

  1. Xue, X.; Hong, Y.; Limaye, A.S.; Gourley, J.J.; Huffman, G.J.; Khan, S.I.; Dorji, C.; Chen, S. Statistical and hydrological evaluation of TRMM-based Multi-satellite Precipitation Analysis over the Wangchu Basin of Bhutan: Are the latest satellite precipitation products 3B42V7 ready for use in ungauged basins? J. Hydrol. 2013, 499, 91–99. [Google Scholar] [CrossRef]
  2. Li, D.; Christakos, G.; Ding, X.; Wu, J. Adequacy of TRMM satellite rainfall data in driving the SWAT modeling of Tiaoxi catchment (Taihu lake basin, China). J. Hydrol. 2018, 556, 1139–1152. [Google Scholar] [CrossRef]
  3. Li, X.-H.; Zhang, Q.; Xu, C.-Y. Suitability of the TRMM satellite rainfalls in driving a distributed hydrological model for water balance computations in Xinjiang catchment, Poyang lake basin. J. Hydrol. 2012, 426–427, 28–38. [Google Scholar] [CrossRef]
  4. Zhang, A.; Jia, G. Satellite observed reversal in trends of tropical and subtropical water availability. Int. J. Appl. Earth Obs. Geoinf. 2020, 86, 102015. [Google Scholar] [CrossRef]
  5. Shen, R.; Huang, A.; Li, B.; Guo, J. Construction of a drought monitoring model using deep learning based on multi-source remote sensing data. Int. J. Appl. Earth Obs. Geoinf. 2019, 79, 48–57. [Google Scholar] [CrossRef]
  6. Iqbal, U.; Perez, P.; Li, W.; Barthelemy, J. How computer vision can facilitate flood management: A systematic review. Int. J. Disaster Risk Reduct. 2021, 53, 102030. [Google Scholar] [CrossRef]
  7. Zhang, Y.; Chang Huang, C.; Tan, Z.; Chen, Y.; Qiu, H.; Huang, C.; Li, Y.; Zhang, Y.; Li, X.; Shulmeister, J.; et al. Prehistoric and historic overbank floods in the Luoyang Basin along the Luohe River, middle Yellow River basin, China. Quat. Int. 2019, 521, 118–128. [Google Scholar] [CrossRef]
  8. Luo, P.; Mu, D.; Xue, H.; Ngo-Duc, T.; Dang-Dinh, K.; Takara, K.; Nover, D.; Schladow, G. Flood inundation assessment for the Hanoi Central Area, Vietnam under historical and extreme rainfall conditions. Sci. Rep. 2018, 8, 12623. [Google Scholar] [CrossRef]
  9. Costa, L.C.; Cunha, A.P.; Anderson, L.O.; Cunningham, C. New approach for drought assessment: A case study in the northern region of Minas Gerais. Int. J. Disaster Risk Reduct. 2020, 53, 102019. [Google Scholar] [CrossRef]
  10. Wei, X.; Wang, N.; Luo, P.; Yang, J.; Zhang, J.; Lin, K. Spatiotemporal Assessment of Land Marketization and Its Driving Forces for Sustainable Urban–Rural Development in Shaanxi Province in China. Sustainability 2021, 13, 7755. [Google Scholar] [CrossRef]
  11. Worqlul, A.W.; Yen, H.; Collick, A.S.; Tilahun, S.A.; Langan, S.; Steenhuis, T.S. Evaluation of CFSR, TMPA 3B42 and ground-based rainfall data as input for hydrological models, in data-scarce regions: The upper Blue Nile Basin, Ethiopia. Catena 2017, 152, 242–251. [Google Scholar] [CrossRef]
  12. Zha, X.; Luo, P.; Zhu, W.; Wang, S.; Lyu, J.; Zhou, M.; Huo, A.; Wang, Z. A Bibliometric Analysis of the Research on Sponge City: Current Situation and Future Development Direction. Ecohydrology 2021, e2328. [Google Scholar] [CrossRef]
  13. Prakash, S. Performance assessment of CHIRPS, MSWEP, SM2RAIN-CCI, and TMPA precipitation products across India. J. Hydrol. 2019, 571, 50–59. [Google Scholar] [CrossRef]
  14. Wu, L.; Zhang, X.; Hao, F.; Wu, Y.; Li, C.; Xu, Y. Evaluating the contributions of climate change and human activities to runoff in typical semi-arid area, China. J. Hydrol. 2020, 590, 125555. [Google Scholar] [CrossRef]
  15. Kalubowila, P.; Lokupitiya, E.; Halwatura, D.; Jayathissa, G. Threshold rainfall ranges for landslide occurrence in Matara district of Sri Lanka and findings on community emergency preparedness. Int. J. Disaster Risk Reduct. 2021, 52, 101944. [Google Scholar] [CrossRef]
  16. Ehmele, F.; Kautz, L.-A.; Feldmann, H.; Pinto, J.G. Long-term variance of heavy precipitation across central Europe using a large ensemble of regional climate model simulations. Earth Syst. Dyn. 2020, 11, 469–490. [Google Scholar] [CrossRef]
  17. Gebere, S.; Alamirew, T.; Merkel, B.; Melesse, A. Performance of High Resolution Satellite Rainfall Products over Data Scarce Parts of Eastern Ethiopia. Remote Sens. 2015, 7, 11639–11663. [Google Scholar] [CrossRef] [Green Version]
  18. Maghsood, F.F.; Hashemi, H.; Hosseini, S.H.; Berndtsson, R. Ground Validation of GPM IMERG Precipitation Products over Iran. Remote Sens. 2020, 12, 48. [Google Scholar] [CrossRef] [Green Version]
  19. Krakauer, N.Y.; Pradhanang, S.M.; Lakhankar, T.; Jha, A.K. Evaluating Satellite Products for Precipitation Estimation in Mountain Regions: A Case Study for Nepal. Remote Sens. 2013, 5, 4107–4123. [Google Scholar] [CrossRef] [Green Version]
  20. Xu, H.; Xu, C.-Y.; Sælthun, N.R.; Zhou, B.; Xu, Y. Evaluation of reanalysis and satellite-based precipitation datasets in driving hydrological models in a humid region of Southern China. Stoch. Environ. Res. Risk Assess. 2014, 29, 2003–2020. [Google Scholar] [CrossRef]
  21. Yao, J.; Chen, Y.; Yu, X.; Zhao, Y.; Guan, X.; Yang, L. Evaluation of multiple gridded precipitation datasets for the arid region of northwestern China. Atmos. Res. 2020, 236, 104818. [Google Scholar] [CrossRef]
  22. Kunz, M. Characteristics of Large-Scale Orographic Precipitation in a Linear Perspective. J. Hydrometeorol. 2011, 12, 27–44. [Google Scholar] [CrossRef]
  23. Wang, W.; Lin, H.; Chen, N.; Chen, Z. Evaluation of multi-source precipitation products over the Yangtze River Basin. Atmos. Res. 2021, 249, 105287. [Google Scholar] [CrossRef]
  24. Zhu, Y.; Luo, P.; Zhang, S.; Sun, B. Spatiotemporal Analysis of Hydrological Variations and Their Impacts on Vegetation in Semiarid Areas from Multiple Satellite Data. Remote Sens. 2020, 12, 4177. [Google Scholar] [CrossRef]
  25. Ashouri, H.; Hsu, K.L.; Sorooshian, S.; Braithwaite, D.K.; Knapp, K.R.; Cecil, L.D.; Nelson, B.R.; Prat, O.P. PERSIANN-CDR: Daily Precipitation Climate Data Record from Multisatellite Observations for Hydrological and Climate Studies. Bull. Am. Meteorol. Soc. 2015, 96, 69–83. [Google Scholar] [CrossRef] [Green Version]
  26. Ushio, T.; Sasashige, K.; Kubota, T.; Shige, S.; Okamoto, K.I.; Aonashi, K.; Inoue, T.; Takahashi, N.; Iguchi, T.; Kachi, M.; et al. A Kalman Filter Approach to the Global Satellite Mapping of Precipitation (GSMaP) from Combined Passive Microwave and Infrared Radiometric Data. J. Meteorol. Soc. Jpn. 2009, 87, 137–151. [Google Scholar] [CrossRef] [Green Version]
  27. Mega, T.; Ushio, T.; Takahiro, M.; Kubota, T.; Kachi, M.; Oki, R. Gauge-Adjusted Global Satellite Mapping of Precipitation. IEEE Trans. Geosci. Remote Sens. 2018, 57, 1928–1935. [Google Scholar] [CrossRef]
  28. Funk, C.; Peterson, P.; Landsfeld, M.; Pedreros, D.; Verdin, J.; Shukla, S.; Husak, G.; Rowland, J.; Harrison, L.; Hoell, A.; et al. The climate hazards infrared precipitation with stations—a new environmental record for monitoring extremes. Sci. Data 2015, 2, 1–21. [Google Scholar] [CrossRef] [PubMed] [Green Version]
  29. Huffman, G.J.; Adler, R.F.; Bolvin, D.T.; Nelkin, E.J. The TRMM Multi-Satellite Precipitation Analysis (TMPA). In Satellite Rainfall Applications for Surface Hydrology; Springer: Dordrecht, The Netherlands, 2010; pp. 3–22. [Google Scholar] [CrossRef] [Green Version]
  30. Beck, H.E.; Wood, E.F.; Pan, M.; Fisher, C.K.; Miralles, D.G.; Van Dijk, A.I.J.M.; McVicar, T.R.; Adler, R.F. MSWEP V2 Global 3-Hourly 0.1° Precipitation: Methodology and Quantitative Assessment. Bull. Am. Meteorol. Soc. 2019, 100, 473–500. [Google Scholar] [CrossRef] [Green Version]
  31. Keikhosravi Kiany, M.S.; Masoodian, S.A.; Balling, R.C., Jr.; Montazeri, M. Evaluation of the TRMM 3B42 product for extreme precipitation analysis over southwestern Iran. Adv. Space Res. 2020, 66, 2094–2112. [Google Scholar] [CrossRef]
  32. Vecere, A.; Martina, M.; Monteiro, R.; Galasso, C. Satellite precipitation–based extreme event detection for flood index insurance. Int. J. Disaster Risk Reduct. 2021, 55, 102108. [Google Scholar] [CrossRef]
  33. Yang, Y.; Wang, R.; Chen, F.; Liu, C.; Bi, X.; Huang, M. Synoptic weather patterns modulate the frequency, type and vertical structure of summer precipitation over Eastern China: A perspective from GPM observations. Atmos. Res. 2021, 249, 105342. [Google Scholar] [CrossRef]
  34. Guo, N.; Zhou, Y.; Yang, L. Statistical analysis of Central Asian vortices and their influence on precipitation in Xinjiang. Atmos. Res. 2021, 249, 105327. [Google Scholar] [CrossRef]
  35. Tang, G.; Clark, M.P.; Papalexiou, S.M.; Ma, Z.; Hong, Y. Have satellite precipitation products improved over last two decades? A comprehensive comparison of GPM IMERG with nine satellite and reanalysis datasets. Remote Sens. Environ. 2020, 240, 111697. [Google Scholar] [CrossRef]
  36. Satgé, F.; Defrance, D.; Sultan, B.; Bonnet, M.-P.; Seyler, F.; Rouché, N.; Pierron, F.; Paturel, J.-E. Evaluation of 23 gridded precipitation datasets across West Africa. J. Hydrol. 2020, 581, 124412. [Google Scholar] [CrossRef] [Green Version]
  37. Lakew, H.B. Investigating the effectiveness of bias correction and merging MSWEP with gauged rainfall for the hydrological simulation of the upper Blue Nile basin. J. Hydrol. Reg. Stud. 2020, 32, 100741. [Google Scholar] [CrossRef]
  38. Ebert, E.E.; Janowiak, J.E.; Kidd, C. Comparison of Near-Real-Time Precipitation Estimates from Satellite Observations and Numerical Models. Bull. Am. Meteorol. Soc. 2007, 88, 47–64. [Google Scholar] [CrossRef] [Green Version]
  39. Müller, M.F.; Thompson, S.E. Bias adjustment of satellite rainfall data through stochastic modeling: Methods development and application to Nepal. Adv. Water Resour. 2013, 60, 121–134. [Google Scholar] [CrossRef] [Green Version]
  40. Manz, B.; Páez-Bimos, S.; Horna, N.; Buytaert, W.; Ochoa-Tocachi, B.; Lavado-Casimiro, W.; Willems, B. Comparative Ground Validation of IMERG and TMPA at Variable Spatiotemporal Scales in the Tropical Andes. J. Hydrometeorol. 2017, 18, 2469–2489. [Google Scholar] [CrossRef]
  41. Mu, D.; Luo, P.; Lyu, J.; Zhou, M.; Huo, A.; Duan, W.; Nover, D.; He, B.; Zhao, X. Impact of temporal rainfall patterns on flash floods in Hue City, Vietnam. J. Flood Risk Manag. 2021, 14, e12668. [Google Scholar] [CrossRef]
  42. Xie, P.; Janowiak, J.E.; Arkin, P.A.; Adler, R.; Gruber, A.; Ferraro, R.; Huffman, G.J.; Curtis, S. GPCP Pentad Precipitation Analyses: An Experimental Dataset Based on Gauge Observations and Satellite Estimates. J. Clim. 2003, 16, 2197–2214. [Google Scholar] [CrossRef] [Green Version]
  43. Huffman, G.J.; Nelkin, E.J.; Bolvin, D.T.; Wolff, D.B.; Adler, R.F.; Gu, G.; Hong, Y.; Bowman, K.P.; Stocker, E.F. The TRMM Multisatellite Precipitation Analysis (TMPA): Quasi-Global, Multiyear, Combined-Sensor Precipitation Estimates at Fine Scales. J. Hydrometeorol. 2007, 8, 38–55. [Google Scholar] [CrossRef]
  44. Bosilovich, M.G.; Chen, J.; Robertson, F.R.; Adler, R.F. Evaluation of Global Precipitation in Reanalyses. J. Appl. Meteorol. Climatol. 2008, 47, 2279–2299. [Google Scholar] [CrossRef]
  45. Adler, R.F.; Huffman, G.J.; Chang, A.; Ferraro, R.; Xie, P.; Janowiak, J.; Nelkin, E. The Version-2 Global Precipitation Climatology Project (GPCP) Monthly Precipitation Analysis (1979–Present). J. Hydrometeorol. 2003, 4, 1147–1167. [Google Scholar] [CrossRef]
  46. Henn, B.; Newman, A.J.; Livneh, B.; Daly, C.; Lundquist, J.D. An assessment of differences in gridded precipitation datasets in complex terrain. J. Hydrol. 2018, 556, 1205–1219. [Google Scholar] [CrossRef]
  47. Chiaravalloti, F.; Brocca, L.; Procopio, A.; Massari, C.; Gabriele, S. Assessment of GPM and SM2RAIN-ASCAT rainfall products over complex terrain in southern Italy. Atmos. Res. 2018, 206, 64–74. [Google Scholar] [CrossRef]
  48. Gao, J.; Tang, G.; Hong, Y. Similarities and Improvements of GPM Dual-Frequency Precipitation Radar (DPR) upon TRMM Precipitation Radar (PR) in Global Precipitation Rate Estimation, Type Classification and Vertical Profiling. Remote Sens. 2017, 9, 1142. [Google Scholar] [CrossRef] [Green Version]
  49. AghaKouchak, A.; Mehran, A.; Norouzi, H.; Behrangi, A. Systematic and random error components in satellite precipitation data sets. Geophys. Res. Lett. 2012, 39, n. [Google Scholar] [CrossRef] [Green Version]
  50. Bharti, V.; Singh, C. Evaluation of error in TRMM 3B42V7 precipitation estimates over the Himalayan region. J. Geophys. Res. Atmos. 2015, 120, 12458–12473. [Google Scholar] [CrossRef]
  51. Tan, M.; Ibrahim, A.; Duan, Z.; Cracknell, A.; Chaplot, V. Evaluation of Six High-Resolution Satellite and Ground-Based Precipitation Products over Malaysia. Remote Sens. 2015, 7, 1504–1528. [Google Scholar] [CrossRef] [Green Version]
  52. Xu, Z.; Wu, Z.; He, H.; Wu, X.; Zhou, J.; Zhang, Y.; Guo, X. Evaluating the accuracy of MSWEP V2.1 and its performance for drought monitoring over mainland China. Atmos. Res. 2019, 226, 17–31. [Google Scholar] [CrossRef]
  53. Yang, Y.; Wu, J.; Bai, L.; Wang, B. Reliability of Gridded Precipitation Products in the Yellow River Basin, China. Remote Sens. 2020, 12, 374. [Google Scholar] [CrossRef] [Green Version]
  54. Lakew, H.B.; Moges, S.A.; Asfaw, D.H. Hydrological performance evaluation of multiple satellite precipitation products in the upper Blue Nile basin, Ethiopia. J. Hydrol. Reg. Stud. 2020, 27, 100664. [Google Scholar] [CrossRef]
  55. Tang, G.; Ma, Y.; Long, D.; Zhong, L.; Hong, Y. Evaluation of GPM Day-1 IMERG and TMPA Version-7 legacy products over Mainland China at multiple spatiotemporal scales. J. Hydrol. 2016, 533, 152–167. [Google Scholar] [CrossRef]
  56. Sun, R.; Yuan, H.; Liu, X.; Jiang, X. Evaluation of the latest satellite–gauge precipitation products and their hydrologic applications over the Huaihe River basin. J. Hydrol. 2016, 536, 302–319. [Google Scholar] [CrossRef]
  57. Arshad, M.; Ma, X.; Yin, J.; Ullah, W.; Ali, G.; Ullah, S.; Liu, M.; Shahzaman, M.; Ullah, I. Evaluation of GPM-IMERG and TRMM-3B42 precipitation products over Pakistan. Atmos. Res. 2021, 249, 105341. [Google Scholar] [CrossRef]
  58. Moazami, S.; Najafi, M.R. A comprehensive evaluation of GPM-IMERG V06 and MRMS with hourly ground-based precipitation observations across Canada. J. Hydrol. 2021, 594, 125929. [Google Scholar] [CrossRef]
  59. Guentchev, G.; Barsugli, J.J.; Eischeid, J. Homogeneity of Gridded Precipitation Datasets for the Colorado River Basin. J. Appl. Meteorol. Climatol. 2010, 49, 2404–2415. [Google Scholar] [CrossRef]
  60. Mizukami, N.; Smith, M.B. Analysis of inconsistencies in multi-year gridded quantitative precipitation estimate over complex terrain and its impact on hydrologic modeling. J. Hydrol. 2012, 428–429, 129–141. [Google Scholar] [CrossRef] [Green Version]
  61. Prakash, S.; Mitra, A.K.; AghaKouchak, A.; Pai, D.S. Error characterization of TRMM Multisatellite Precipitation Analysis (TMPA-3B42) products over India for different seasons. J. Hydrol. 2015, 529, 1302–1312. [Google Scholar] [CrossRef]
  62. Katiraie-Boroujerdy, P.-S.; Akbari Asanjan, A.; Hsu, K.-l.; Sorooshian, S. Intercomparison of PERSIANN-CDR and TRMM-3B42V7 precipitation estimates at monthly and daily time scales. Atmos. Res. 2017, 193, 36–49. [Google Scholar] [CrossRef] [Green Version]
  63. Liu, J.; Shangguan, D.; Liu, S.; Ding, Y.; Wang, S.; Wang, X. Evaluation and comparison of CHIRPS and MSWEP daily-precipitation products in the Qinghai-Tibet Plateau during the period of 1981–2015. Atmos. Res. 2019, 230, 104634. [Google Scholar] [CrossRef]
  64. Derin, Y.; Anagnostou, E.; Berne, A.; Borga, M.; Boudevillain, B.; Buytaert, W.; Chang, C.H.; Delrieu, G.; Hong, Y.; Hsu, Y.C.; et al. Multiregional Satellite Precipitation Products Evaluation over Complex Terrain. J. Hydrometeorol. 2016, 17, 1817–1836. [Google Scholar] [CrossRef]
  65. Yu, C.; Hu, D.; Liu, M.; Wang, S.; Di, Y. Spatio-temporal accuracy evaluation of three high-resolution satellite precipitation products in China area. Atmos. Res. 2020, 241, 104952. [Google Scholar] [CrossRef]
  66. Ma, Y.; Tang, G.; Long, D.; Yong, B.; Zhong, L.; Wan, W.; Hong, Y. Similarity and Error Intercomparison of the GPM and Its Predecessor-TRMM Multisatellite Precipitation Analysis Using the Best Available Hourly Gauge Network over the Tibetan Plateau. Remote Sens. 2016, 8, 569. [Google Scholar] [CrossRef] [Green Version]
  67. Tan, X.; Ma, Z.; He, K.; Han, X.; Ji, Q.; He, Y. Evaluations on gridded precipitation products spanning more than half a century over the Tibetan Plateau and its surroundings. J. Hydrol. 2020, 582, 124455. [Google Scholar] [CrossRef]
  68. Ehmele, F.; Kunz, M. Flood-related extreme precipitation in southwestern Germany: Development of a two-dimensional stochastic precipitation model. Hydrol. Earth Syst. Sci. 2019, 23, 1083–1102. [Google Scholar] [CrossRef] [Green Version]
  69. Song, S.; Xu, Y.P.; Wu, Z.F.; Deng, X.J.; Wang, Q. The relative impact of urbanization and precipitation on long-term water level variations in the Yangtze River Delta. Sci. Total. Environ. 2019, 648, 460–471. [Google Scholar] [CrossRef] [PubMed]
  70. Wang, Y.; Liao, W.; Ding, Y.; Wang, X.; Jiang, Y.; Song, X.; Lei, X. Water resource spatiotemporal pattern evaluation of the upstream Yangtze River corresponding to climate changes. Quat. Int. 2015, 380–381, 187–196. [Google Scholar] [CrossRef]
  71. Li, Q.; Yang, S.; Cui, X.-P.; Gao, S.-T. Investigating the initiation and propagation processes of convection in heavy precipitation over the western Sichuan Basin. Atmos. Ocean. Sci. Lett. 2017, 10, 235–242. [Google Scholar] [CrossRef] [Green Version]
  72. Zong-Jie, L.; Zong-Xing, L.; Ling-Ling, S.; Jin-Zhu, M. Characteristic and factors of stable isotope in precipitation in the source region of the Yangtze River. Agric. For. Meteorol. 2020, 281, 107825. [Google Scholar] [CrossRef]
  73. Gao, B.; Yang, D.; Zhao, T.; Yang, H. Changes in the eco-flow metrics of the Upper Yangtze River from 1961 to 2008. J. Hydrol. 2012, 448–449, 30–38. [Google Scholar] [CrossRef]
  74. Yang, X.; Yu, X.; Wang, Y.; Liu, Y.; Zhang, M.; Ren, L.; Yuan, F.; Jiang, S. Estimating the response of hydrological regimes to future projections of precipitation and temperature over the upper Yangtze River. Atmos. Res. 2019, 230, 104627. [Google Scholar] [CrossRef]
  75. Li, Y.; Yan, D.; Peng, H.; Xiao, S. Evaluation of precipitation in CMIP6 over the Yangtze River Basin. Atmos. Res. 2021, 253, 105406. [Google Scholar] [CrossRef]
  76. Chen, L.; Yu, B.; Chen, Z.; Li, B.; Wu, J. Investigating the Temporal and Spatial Variability of Total Ozone Column in the Yangtze River Delta Using Satellite Data: 1978–2013. Remote Sens. 2014, 6, 12527–12543. [Google Scholar] [CrossRef] [Green Version]
  77. Zhang, Y.; Ye, A.; You, J.; Jing, X. Quantification of human and climate contributions to multi-dimensional hydrological alterations: A case study in the Upper Minjiang River, China. J. Geogr. Sci. 2021, 31, 1102–1122. [Google Scholar] [CrossRef]
  78. Al-Falahi, A.H.; Saddique, N.; Spank, U.; Gebrechorkos, S.H.; Bernhofer, C. Evaluation the Performance of Several Gridded Precipitation Products over the Highland Region of Yemen for Water Resources Management. Remote Sens. 2020, 12, 2984. [Google Scholar] [CrossRef]
  79. Beck, H.E.; Vergopolan, N.; Pan, M.; Levizzani, V.; Van Dijk, A.I.J.M.; Weedon, G.P.; Brocca, L.; Pappenberger, F.; Huffman, G.J.; Wood, E.F. Global-scale evaluation of 22 precipitation datasets using gauge observations and hydrological modeling. Hydrol. Earth Syst. Sci. 2017, 21, 6201–6217. [Google Scholar] [CrossRef] [Green Version]
  80. Brasil Neto, R.M.; Santos, C.A.G.; Nascimento, T.V.M.d.; Silva, R.M.d.; Dos Santos, C.A.C. Evaluation of the TRMM Product for Monitoring Drought over Paraíba State, Northeastern Brazil: A Statistical Analysis. Remote Sens. 2020, 12, 2184. [Google Scholar] [CrossRef]
  81. Habib, E.; Henschke, A.; Adler, R.F. Evaluation of TMPA satellite-based research and real-time rainfall estimates during six tropical-related heavy rainfall events over Louisiana, USA. Atmos. Res. 2009, 94, 373–388. [Google Scholar] [CrossRef]
  82. Freitas, E.d.S.; Coelho, V.H.R.; Xuan, Y.; Melo, D.d.C.D.; Gadelha, A.N.; Santos, E.A.; Galvão, C.d.O.; Ramos Filho, G.M.; Barbosa, L.R.; Huffman, G.J.; et al. The performance of the IMERG satellite-based product in identifying sub-daily rainfall events and their properties. J. Hydrol. 2020, 589, 125128. [Google Scholar] [CrossRef]
  83. Huffman, G.J.; Bolvin, D.T.; Braithwaite, D.; Hsu, K.-L.; Joyce, R.J.; Kidd, C.; Nelkin, E.J.; Sorooshian, S.; Stocker, E.F.; Tan, J.; et al. Integrated Multi-satellite Retrievals for the Global Precipitation Measurement (GPM) Mission (IMERG). In Satellite Precipitation Measurement; Springer: Cham, Switzerland, 2020; pp. 343–353. [Google Scholar] [CrossRef]
  84. Yang, H.; Hsu, K.-L.; Sorooshian, S.; Gao, X. Precipitation Estimation from Remotely Sensed Imagery Using an Artificial Neural Network Cloud Classification System. J. Appl. Meteorol. 2004, 43, 1834–1853. [Google Scholar] [CrossRef] [Green Version]
  85. Ma, Q.; Li, Y.; Feng, H.; Yu, Q.; Zou, Y.; Liu, F.; Pulatov, B. Performance evaluation and correction of precipitation data using the 20-year IMERG and TMPA precipitation products in diverse subregions of China. Atmos. Res. 2020, 249, 105304. [Google Scholar] [CrossRef]
  86. Li, R.; Wang, K.; Qi, D. Event-Based Evaluation of the GPM Multisatellite Merged Precipitation Product From 2014 to 2018 Over China: Methods and Results. J. Geophys. Res. Atmos. 2020, 126, e2020JD033692. [Google Scholar] [CrossRef]
  87. Shen, Y.; Xiong, A.; Hong, Y.; Yu, J.; Pan, Y.; Chen, Z.; Saharia, M. Uncertainty analysis of five satellite-based precipitation products and evaluation of three optimally merged multi-algorithm products over the Tibetan Plateau. Int. J. Remote Sens. 2014, 35, 6843–6858. [Google Scholar] [CrossRef]
  88. Ren, P.; Li, J.; Feng, P.; Guo, Y.; Ma, Q. Evaluation of Multiple Satellite Precipitation Products and Their Use in Hydrological Modelling over the Luanhe River Basin, China. Water 2018, 10, 677. [Google Scholar] [CrossRef] [Green Version]
  89. Li, Z.; Yang, D.; Hong, Y. Multi-scale evaluation of high-resolution multi-sensor blended global precipitation products over the Yangtze River. J. Hydrol. 2013, 500, 157–169. [Google Scholar] [CrossRef]
  90. Wagner, P.D.; Fiener, P.; Wilken, F.; Kumar, S.; Schneider, K. Comparison and evaluation of spatial interpolation schemes for daily rainfall in data scarce regions. J. Hydrol. 2012, 464–465, 388–400. [Google Scholar] [CrossRef]
  91. Kuehl, H.; Sacchi, M.D. Least-squares wave-equation migration for AVP/AVA inversion. Geophysics 2003, 68, 262–273. [Google Scholar] [CrossRef] [Green Version]
  92. Arnold, D.N.; Boffi, D.; Falk, R.S. Approximation by quadrilateral finite elements. Math. Comput. 2002, 71, 909–922. [Google Scholar] [CrossRef] [Green Version]
  93. Al-Dousari, A.; Ramdan, A.; Al Ghadban, A. Site-specific precipitation estimate from TRMM data using bilinear weighted interpolation technique: An example from Kuwait. J. Arid Environ. 2008, 72, 1320–1328. [Google Scholar] [CrossRef]
  94. Fernandez, D.L.; Da Silva, E.B. Interpolation of bilinear operators and compactness. Nonlinear Anal. Theory Methods Appl. 2010, 73, 526–537. [Google Scholar] [CrossRef] [Green Version]
  95. Brito, A.E.; Chan, S.H.; Cabrera, S.D. SAR Image Superresolution via 2-D AdaptiveExtrapolation. In Radar Signal Processing and Its Applications; Springer: Boston, MA, USA, 2003; Volume 14, pp. 83–104. [Google Scholar] [CrossRef]
  96. Li, Y.; Guo, B.; Wang, K.; Wu, G.; Shi, C. Performance of TRMM Product in Quantifying Frequency and Intensity of Precipitation during Daytime and Nighttime across China. Remote Sens. 2020, 12, 740. [Google Scholar] [CrossRef] [Green Version]
  97. Zhang, Y.; Li, Y.; Ji, X.; Luo, X.; Li, X. Evaluation and Hydrologic Validation of Three Satellite-Based Precipitation Products in the Upper Catchment of the Red River Basin, China. Remote Sens. 2018, 10, 1881. [Google Scholar] [CrossRef] [Green Version]
  98. Knoben, W.J.M.; Freer, J.E.; Woods, R.A. Technical note: Inherent benchmark or not? Comparing NashSutcliffe and Kling-Gupta efficiency scores. Hydrol. Earth Syst. Sci. 2019, 23, 4323–4331. [Google Scholar] [CrossRef] [Green Version]
  99. Schober, P.; Boer, C.; Schwarte, L.A. Correlation Coefficients: Appropriate Use and Interpretation. Anesth. Analg. 2018, 126, 1763–1768. [Google Scholar] [CrossRef] [PubMed]
  100. Xu, R.; Tian, F.; Yang, L.; Hu, H.; Lu, H.; Hou, A. Ground validation of GPM IMERG and TRMM 3B42V7 rainfall products over southern Tibetan Plateau based on a high-density rain gauge network. J. Geophys. Res. Atmos. 2017, 122, 910–924. [Google Scholar] [CrossRef]
  101. Kim, K.; Park, J.; Baik, J.; Choi, M. Evaluation of topographical and seasonal feature using GPM IMERG and TRMM 3B42 over Far-East Asia. Atmos. Res. 2017, 187, 95–105. [Google Scholar] [CrossRef]
  102. Nastos, P.T.; Kapsomenakis, J.; Philandras, K.M. Evaluation of the TRMM 3B43 gridded precipitation estimates over Greece. Atmos. Res. 2016, 169, 497–514. [Google Scholar] [CrossRef]
  103. Chen, C.; Chen, Q.; Duan, Z.; Zhang, J.; Mo, K.; Li, Z.; Tang, G. Multiscale Comparative Evaluation of the GPM IMERG v5 and TRMM 3B42 v7 Precipitation Products from 2015 to 2017 over a Climate Transition Area of China. Remote Sens. 2018, 10, 944. [Google Scholar] [CrossRef] [Green Version]
  104. Fang, J.; Yang, W.; Luan, Y.; Du, J.; Lin, A.; Zhao, L. Evaluation of the TRMM 3B42 and GPM IMERG products for extreme precipitation analysis over China. Atmos. Res. 2019, 223, 24–38. [Google Scholar] [CrossRef]
  105. Musie, M.; Sen, S.; Srivastava, P. Comparison and evaluation of gridded precipitation datasets for streamflow simulation in data scarce watersheds of Ethiopia. J. Hydrol. 2019, 579, 124168. [Google Scholar] [CrossRef]
  106. Zhu, H.; Li, Y.; Huang, Y.; Li, Y.; Hou, C.; Shi, X. Evaluation and hydrological application of satellite-based precipitation datasets in driving hydrological models over the Huifa river basin in Northeast China. Atmos. Res. 2018, 207, 28–41. [Google Scholar] [CrossRef]
  107. Draper, D.W.; Newell, D.A.; McKague, D.S.; Piepmeier, J.R. Assessing Calibration Stability Using the Global Precipitation Measurement (GPM) Microwave Imager (GMI) Noise Diodes. IEEE J. Sel. Top. Appl. Earth Obs. Remote Sens. 2015, 8, 4239–4247. [Google Scholar] [CrossRef]
  108. Yilmaz, K.K.; Derin, Y. Evaluation of Multiple Satellite-Based Precipitation Products over Complex Topography. J. Hydrometeorol. 2014, 15, 1498–1516. [Google Scholar] [CrossRef] [Green Version]
  109. An, N.; Wang, K. A Comparison of MODIS-Derived Cloud Fraction with Surface Observations at Five SURFRAD Sites. J. Appl. Meteorol. Climatol. 2015, 54, 1009–1020. [Google Scholar] [CrossRef]
  110. Chen, F.; Li, X. Evaluation of IMERG and TRMM 3B43 Monthly Precipitation Products over Mainland China. Remote Sens. 2016, 8, 472. [Google Scholar] [CrossRef] [Green Version]
  111. Zhao, Y. A study on the heavy-rain-producing mesoscale convective system associated with diurnal variation of radiation and topography in the eastern slope of the western Sichuan plateau. Meteorol. Atmos. Phys. 2014, 127, 123–146. [Google Scholar] [CrossRef]
  112. Hu, L.; Deng, D.; Gao, S.; Xu, X. The seasonal variation of Tibetan Convective Systems: Satellite observation. J. Geophys. Res. Atmos. 2016, 121, 5512–5525. [Google Scholar] [CrossRef]
  113. Houze, R.A., Jr. Stratiform Precipitation in Regions of Convection: A Meteorological Paradox? Bull. Am. Meteorol. Soc. 1997, 78, 2179–2196. [Google Scholar] [CrossRef]
  114. Liao, L.; Meneghini, R.; Lguchi, T. Comparisons of Rain Rate and Reflectivity Factor Derived from the TRMM Precipitation Radar and the WSR-88D over the Melbourne, Florida, Site. J. Atmos. Ocean. Technol. 2001, 18, 1959–1974. [Google Scholar] [CrossRef]
  115. Zhang, Y.; Luo, P.; Zhao, S.; Kang, S.; Wang, P.; Zhou, M.; Lyu, J. Control and remediation methods for eutrophic lakes in the past 30 years. Water Sci. Technol. 2020, 81, 1099–1113. [Google Scholar] [CrossRef] [PubMed]
  116. Guo, B.; Wang, X.; Pei, L.; Su, Y.; Zhang, D.; Wang, Y. Identifying the spatiotemporal dynamic of PM2.5 concentrations at multiple scales using geographically and temporally weighted regression model across China during 2015–2018. Sci. Total. Environ. 2021, 751, 141765. [Google Scholar] [CrossRef]
  117. Xie, D.; Duan, L.; Si, G.; Liu, W.; Zhang, T.; Mulder, J. Long-Term 15N Balance After Single-Dose Input of 15N-Labeled NH4+ and NO3− in a Subtropical Forest Under Reducing N Deposition. Glob. Biogeochem. Cycles. 2021, 35, e2021GB006959. [Google Scholar] [CrossRef]
  118. Tan, M.L.; Santo, H. Comparison of GPM IMERG, TMPA 3B42 and PERSIANN-CDR satellite precipitation products over Malaysia. Atmos. Res. 2018, 202, 63–76. [Google Scholar] [CrossRef]
  119. Ullah, W.; Wang, G.; Ali, G.; Tawia Hagan, D.; Bhatti, A.; Lou, D. Comparing Multiple Precipitation Products against In-Situ Observations over Different Climate Regions of Pakistan. Remote Sens. 2019, 11, 628. [Google Scholar] [CrossRef] [Green Version]
  120. Daly, C.; Slater, M.E.; Roberti, J.A.; Laseter, S.H.; Swift, L.W. High-resolution precipitation mapping in a mountainous watershed: Ground truth for evaluating uncertainty in a national precipitation dataset. Int. J. Climatol. 2017, 37, 124–137. [Google Scholar] [CrossRef] [Green Version]
Figure 1. Spatial distribution of ground observation stations within and around the Min Jiang watershed. These rain gauges provided consistent observations during the study period (2000–2016). High altitude stations have the elevation ranging from 1500 to 3500 m, and low altitude stations have the elevation ranging from 300 to 1500 m.
Remotesensing 13 03795 g001
Figure 2. Scatterplots of ground observations versus precipitation derived from MSWEP, TRMM, and IMERG products with different temporal resolutions at the watershed scale. (ah) show the comparison at the daily, 3 days, 5 days, 7 days, 10 days, 14 days, monthly, and annual temporal scales, respectively. The black dashed line indicates the 1:1 correspondence, and the red, blue, and green solid lines represent the best linear regression fits for MSWEP, TRMM, and IMERG, respectively.
Remotesensing 13 03795 g002
Figure 3. Distribution of continuous statistical metrics ((a) CC, (b) RRMSE, (c) RMAE, (d) RB, and (e) modified KGE) of the comparisons between the three precipitation products and ground observations at different temporal resolutions. The histogram in (a) represents the average precipitation at different temporal resolutions for each precipitation product at the basin average scale.
Remotesensing 13 03795 g003
Figure 4. Spatial distributions of relative error ((PO)/O) in monthly average precipitation (mm/day) derived from (a) MSWEP, (b) TRMM, and (c) IMERG products with respect to ground observation data for the period of 2000–2016. (d) shows the relative error values for all three products for each ground observation station.
Remotesensing 13 03795 g004
Figure 5. Time series of absolute errors derived from the monthly station-average precipitation between the CMA and three gridded products.
Remotesensing 13 03795 g005
Figure 6. Violin plots illustrating the probability distributions of monthly average precipitation for the three precipitation products, (a) MSWEP, (b) TRMM, and (c) IMERG. The left half of each plot shows a precipitation product, while the right half presents the ground observations (indicated by CMA). Overlapping each violin plot is a box plot summarizing the range from maximum to minimum, the interquartile range (IQR), the median, and outliers.
Remotesensing 13 03795 g006
Figure 7. Distribution of (a) CC and (b) KGE values of monthly average precipitation over 16 years, along with mean monthly rainfall for each precipitation product.
Remotesensing 13 03795 g007
Figure 8. Spatial distributions of 16-year (2000–2016) mean precipitation (mm/day) across the Min Jiang watershed from the (a) CMA, (b) MSWEP, (c) TRMM, and (d) IMERG products. The watershed average value of each precipitation product is included in the brackets in each figure.
Remotesensing 13 03795 g008
Figure 9. The percent difference between the occurrence frequency distribution of each precipitation product and that of the ground observations for a range of rainfall intensities.
Remotesensing 13 03795 g009
Figure 10. Seasonal distributions of precipitation ((a) Dry season: October to April; (b) Wet season: May to September) across the study area from MSWEP, TRMM, and IMERG products as compared to CMA gauge data.
Remotesensing 13 03795 g010
Figure 11. Taylor diagrams comparing monthly precipitation from MSWEP, TRMM, and IMERG precipitation products with respect to ground observation data for two elevation levels: (a) High altitude; (b) Low altitude.
Remotesensing 13 03795 g011
Table 1. General characteristics of the precipitation products.
Precipitation
Dataset
Temporal
Coverage
Spatial
Coverage
Spatial
Resolution
Temporal
Resolution
Ground Stations (CMA)1951–presentChinaStationDaily
MSWEP V2.21979–2017Global0.1°3 h
TRMM-3B42 V71998–present50°N–50°S0.25°3 h
GPM-IMERG V62000–present60°N–60°S0.1°30 min
Table 2. Summary of daily statistical results of the precipitation products in the study area.
Statistical IndicesCMAMSWEPTRMMIMERG
Mean (mm)2.572.522.562.52
Median (mm)0.960.940.890.86
Lower Quartile (mm)0.170.180.140.15
Upper Quartile (mm)3.263.093.203.06
Range (mm)[0, 42.61][0, 42.51][0, 45.00][0, 55.21]
Skewness3.003.203.233.39
Kurtosis12.4413.9914.9117.19
Standard Deviation (mm)4.024.01 4.17 4.15
Coefficient of Variation (%)156.08159.38 162.44 164.30
Table 3. The detection capacities of rainfall at different magnitudes. The POD, FAR, BIAS, and CSI contingency statistics obtained using various precipitation thresholds (0.5, 10, 25, 50, 100 mm/day) of daily observed precipitation over the Min Jiang watershed. M, T, and I represent the MSWEP, TRMM, and IMERG products, respectively.
Precipitation
Intensity
(mm/day)
PODFARBIASCSI
MTIMTIMTIMTI
0.50.630.640.650.480.350.351.220.991.000.400.470.48
100.180.540.540.800.470.450.931.040.980.100.370.38
250.080.460.470.900.560.550.801.051.050.050.290.30
500.030.330.390.950.630.600.670.890.980.020.210.24
1000.020.250.290.960.590.660.490.610.850.010.180.19
Table 4. Statistical indices between each gridded precipitation product and ground observation data at the watershed scale divided between the dry and wet seasons.
Statistical
Indices
Dry Season Wet Season
MSWEP TRMM IMERG MSWEP TRMM IMERG
CC0.810.750.870.960.970.99
RMSE22.9232.5632.9721.4933.1316.75
MAE20.6929.4130.8819.1727.2714.05
RB−0.09−0.14−0.150.000.040.02
KGE0.720.670.590.950.950.93
RE30.2516.4113.0998.8935.5732.16
SE69.7583.5986.911.1164.4367.84
Table 5. Daily relative errors from three precipitation products against ground observation data and daily average precipitation at different elevation levels.
Statistical
Indices
High/Low
Altitude
CMAMSWEPTRMMIMERG
Mean (mm)H2.422.252.582.35
L2.742.812.552.72
Relative Error (%)H-−7.006.51−2.83
L-2.52−0.92−0.93
Publisher’s Note: MDPI stays neutral with regard to jurisdictional claims in published maps and institutional affiliations.

