Abstract
Assessing the relentless expansion of built-up areas is one of the most important tasks for achieving sustainable planning and supporting decision-making on the regional and local level. In this context, techniques based on remote sensing can play a crucial role in monitoring the fast rhythm of urban growth, allowing the regular appraisal of territorial dynamics. The main aim of the study is to evaluate, in a multi-scalar perspective, the built-up area expansion and the spatio–temporal changes in Ilfov County, which overlaps the surroundings of Bucharest, capital of Romania. Our research focuses on processing multi-date Landsat satellite imagery from three selected time references (2000, 2008, 2018) through the supervised classification process. Further on, the types of built-up area dynamics are explored using LDTtool, a landscape metrics instrument. The results reveal massive territorial restructuring in the 18 years, as the new built-up developments occupy a larger area than the settlements’ surface in 2000. The rhythm of the transformations also changed over time, denoting a significant acceleration after 2008, when 75% of the new development occurred. At the regional level, the spatial pattern has become more and more complex, in a patchwork of spatial arrangements characterized by the proliferation of low density areas interspersed with clusters of high density developments and undeveloped land. At the local level, a comparative assessment of the administrative territorial units’ pathway was conducted based on the annual growth of built-up areas, highlighting the most attractive places and the main territorial directions of development. In terms of the specific dynamics of built-up areas, the main change patterns are “F—NP increment by gain”, followed by “G—Aggregation by gain”, both comprising around 80% of the total number of cells. The first type was prevalent in the first period (2000–2008), while the second is identified only after 2008, when it became the most represented, followed in the hierarchy by the previously dominant category. The spatial pattern differentiations were further explored in three complementary case studies investigated in correlation with socioeconomic data, revealing a heterogeneous landscape.
1. Introduction
The increasing demand for land reclaimed for the incessant process of built-up area expansion represents a major concern around the world [1,2], as it leads to irreversible changes to, and negative impacts on, the environment. In this regard, urban expansion is considered a threat to sustainable development goals [3,4], as previous research reported detrimental consequences related to soil sealing [5], air and water pollution [6,7], biodiversity loss [8,9], land use conflicts [10,11,12,13].
However, land is a finite natural resource [14,15,16], which is why better planning that will control the spread of built-up areas is critical [4,17]. For this reason, studies addressing the territorial impact of urban expansion, its patterns and its driving forces have become essential for researchers, planners and policy makers.
Lately, the topic of urban growth has been the focus of a huge amount of literature [18] in the context of various fields and geographical regions. While its pace differs from one continent to another or even from region to region, the process of urban growth is one of the most visible in the landscape today [19,20]. Although this phenomenon is global, the biggest territorial transformations due to the augmentation of built-up areas are found in Asia [21]. In this respect, there are numerous studies that deal with single metropolitan regions [22,23,24,25,26,27,28,29], cross-sectional comparisons between two or more cities [30,31,32,33], as well as studies that focus on much larger areas [34,35,36]. In the African continent, overall, the tempo of urban development is considered low [21], but is anticipated to increase significantly [8]. The number of studies is more limited [30], and tackle some of the largest urban regions, such as Kinshasa [37], Cairo [38], Nairobi [39], Lagos [40], Lusaka [41] and Pretoria [42]. Meanwhile, other research make comparisons between different places across the continent [43,44,45,46,47]. All these studies emphasize the fast pace of built-up area expansion that occurs in an unplanned and unregulated manner.
On the other hand, Europe has registered a generally moderate rhythm of urban growth over the last few decades [21], but, nevertheless, many regions exhibit a significant increase in built-up areas, which is expected to continue [4]. The phenomenon has been consistently observed even in areas that have experienced population decline [48]. Previous studies have concluded that the different spatial structure and patterns of urban growth are related with historical and political backgrounds, but also with socioeconomic and cultural features [49,50]. In this regard, Central and Eastern European (CEE) countries had a distinct urban development pathway compared with the rest of the continent [49,51,52,53,54]. This macro-region is considered one of the most impacted in the world, in the last 30 years, by complex transformations (political, socioeconomic, cultural and institutional) as a result of the communist regime dismantling and the subsequent transition from centralized planning to free market capitalism [55,56,57,58,59]. A relentless process of spatial reconfiguration was registered and the compact shape of the socialist city and the once well-defined boundaries [60,61,62] faded gradually, along with the dispersion of built-up areas in fragmented, less regular development in the surrounding regions [63,64]. In fact, recent studies revealed that the CEE city regions are generally characterized by a more dispersed pattern of development than Western Europe [52,56] in view of higher rates of urban growth [65]. The main challenges are the inefficient policies and loose regulatory framework [66,67] that foster an uncontrolled development of built-up areas in the vicinity of large cities [56,68].
Still, beyond this general trajectory, regional variations related to the management of territorial transformations within CEE countries have been observed, variations that were deeply connected to national place-specific factors [52,68]. This situation is also rooted in the European Union’s approach, which assigns the land use management and spatial planning responsibilities to each member state [16,17]. In this respect, robust analysis at regional level, which will provide in-depth knowledge regarding the spatial patterns of growth and their determinants, is essential [69]. Such investigations will be extremely useful, if not downright necessary, for further comparative analysis.
Previous studies have outlined the pressing need for the quantitative assessment of the urban expansion territorial impact in CEE countries [70], as the majority of research uses qualitative approaches to describe the political and socioeconomic context, as well as the factors that influence built-up area growth and its overall characteristics [56,62,63,71,72,73]. Even though qualitative research brings valuable findings, quantitative appraisal is essential in the support of better governance, which will ultimately lead to sustainable planning. In this regard, it has been emphasized that the spatial impact of urban expansion around large cities, as well as its socioeconomic and environmental effects, have been insufficiently investigated [54].
Bucharest, the capital of Romania, is considered the largest post-socialist city [74,75] in the European Union and its neighboring Ilfov County the most dynamic, predominantly urban, region in terms of the growth rate of inhabitants for the period 2004–2014 [76]. The first decade after the fall of communism was marked by modest territorial transformations [57] followed, after 2000, by an ongoing process of unplanned built-up area expansion into the predominantly agricultural landscape of Ilfov County. Given the rapid pace of territorial change, more information about the resultant complex spatial patterns is needed to substantiate further decision-making on the local and regional levels.
Lately, various studies have pointed out Landsat satellite images as valuable resources for investigating the territorial impact of built-up area expansion, as they allow a comprehensive, integrated regional overview [77,78,79,80,81,82,83]. One of the strengths of using geospatial information is that it enables longitudinal analysis, in view of the long temporal coverage based on consistent archives with data [80]. They can play a critical role in depicting various spatio–temporal patterns [84]; evaluating the impact of enforced policies, urban plans and strategies [85]; and sustaining effective measures to improve territorial management and land use [4,49,79,86,87].
Of the few studies that applied quantitative measurements in CEE countries, several have utilized the Landsat dataset to explore urban growth from different perspectives in different contexts: the structural changes in Berlin and its surroundings [88], urban change detection in the Ljubljana region [89], the built-up area development in the surroundings of Prague [90]. Another paper addressed the dynamics of urban expansion and its spatial patterns in a cross-national comparison of several post-socialist cities [70]. The aforementioned studies revealed the general pattern of development, while the current research goes beyond this perspective, using a more complex approach and seeking deeper insights into the expansion of the built-up area through a multi-scalar territorial vision.
Regarding Bucharest and its surroundings, previous studies used Landsat to outline the overall trends of built-up area expansion until 2010, focused on the capital and the first ring of administrative territorial units (ATUs) located nearby [75], or on its fringes—20–25 km distance from the city center [91]. A more recent study treated Bucharest and Ilfov County as a laboratory region for comparing Corine Land Cover and Landsat datasets with each other and the ground truth, thus revealing their strengths and limitations in assessing the built-up area’s changes [64]. The current study is distinguished by a more comprehensive framework: a gradual evaluation of the expansion of built-up areas on a regional level followed by comparative assessment of the local ATU’s trajectory. The potential for using the results as a basis for qualitative analysis is explored in correlation with ancillary, socioeconomic data. Moreover, the research provides up-to-date information by investigating the most dynamic period (after 2000) in terms of land cover changes.
In any case, in-depth knowledge about the built-up area expansion process around Bucharest is limited compared with other post-socialist capitals [57,61]. One of the reasons for this may be that the impact of Bucharest’s urban expansion became visible in the landscape much later—after the turn of the millennium—whereas the deconcentration of urban functions took place more rapidly in some of its CEE counterparts (such us Prague and Budapest).
Considering all of the above, the goal of this study is to contribute to filling this knowledge gap by analyzing the territorial transformations induced by the built-up area expansion that reconfigured the Bucharest surroundings after 2000, through a multi-scalar approach.
The paper follows several stages: (a) mapping built-up area coverage for three years: 2000, 2008, 2018; (b) investigating the intensity of built-up area expansion and associated spatio–temporal changes for two distinct periods: 2000–2008 and 2008–2018 on the macroterritorial (regional perspective) and medium level; (c) exploring the distribution patterns of the built-up area.
The results of the study reveal an overview of the territorial impact of built-up area expansion, providing a valuable scientific approach and data support which can be used for better planning, sustainable land use management and the design of efficient development plans.
2. Materials and Methods
2.1. Study Area
The study focuses on Ilfov County, located in the southern part of Romania, overlapping the surrounding area of Bucharest (Figure 1). From an administrative point of view, Ilfov County is divided into eight urban settlements and 32 communes, covering a total area of 1583.3km2 [92]. The registered population is around 430,000 inhabitants (Romanian National Institute of Statistics—NIS) but there are estimates, even from local authorities, that the actual number of people is much higher, since there is no obligation to register changes of legal residence [57]. However, between 2000 and 2018, the number of people more than doubled and this trend is expected to continue, stimulated by the proximity to Bucharest [64].
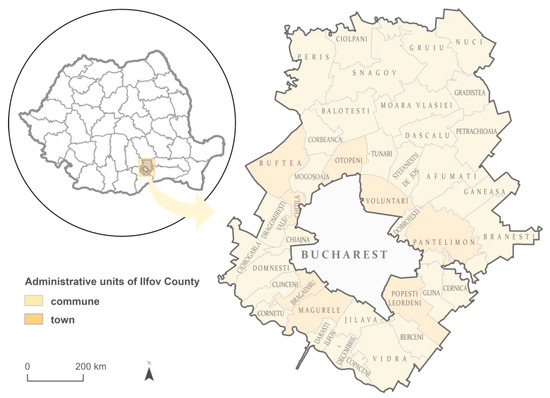
Figure 1.
Location map of the study area.
Traditionally, Ilfov County was known for its agricultural profile, as around 70% of the total surface was composed of agricultural land in the 1990s (NIS). The settlements featured a high degree of compactness—a result of highly regulated communist central planning [75]. The area registered numerous spatial transformations, mainly after 2000, under the auspices of a free market economy, as new built-up areas (residential and non-residential) emerged in the landscape. Furthermore, Ilfov, together with Bucharest, is considered the richest region of the country [50,93], attracting newcomers and investors which leads to a continuous process of territorial reorganisation. This process is not uniform, as there is spatial differentiation between the local entities in terms of attractiveness, natural resources, level of economic development, etc. One of the main challenges remains the uncontrolled growth of built-up areas in a fragmented spatial pattern, with no integrated vision or strategy for governing urban expansion at the regional level.
2.2. Methodology
The methodology includes several phases to capture the spatio–temporal changes of the built-up area through a multi-scalar perspective. Key time points (2000, 2008, 2018) were selected for mapping the extent of the built-up area to allow a stepwise evaluation of the recorded transformations.
The year 2000 was chosen as a reference point because the urban expansion spilled over significantly into the surrounding territory of Bucharest only after the turn of the 21st century, significantly transforming the area’s previous spatial pattern.
The year 2008 was selected as a benchmark in light of the global economic crisis, which hit Romania in the second half of the year. Previous evidence reported a subsequent sharp decline in construction in CEE countries [66,90,94]. Thus, the long term territorial impact of the crisis was investigated a decade after its occurrence, in 2018.
Our analysis is based on Landsat satellite imagery at 30 m spatial resolution, as it constitutes the longest record of observation data with free availability [95]. In this regard, up to three cloud free scenes from the summer–autumn seasons were selected from different Landsat sensors for each reference moment: Landsat 7 Enhanced Thematic Mapper (ETM+) for 2000, Landsat 5 Thematic Mapper (TM) for 2008 and Landsat 8 Operational Land Imager (OLI) for 2018. All the images, downloaded at Level-2 processing in terms of surface reflectance from the USGS archives, helped create multi-date stacks of Landsat imagery for each temporal moment. The multi-date approach was preferred because of the demonstrated higher performance of the classification algorithms, as opposed to single-date imagery [96], especially in areas with confusion between some built-up features and bare lands because of the spectral similarities, as is the case in our study area.
The approach follows several steps, as presented in Figure 2.
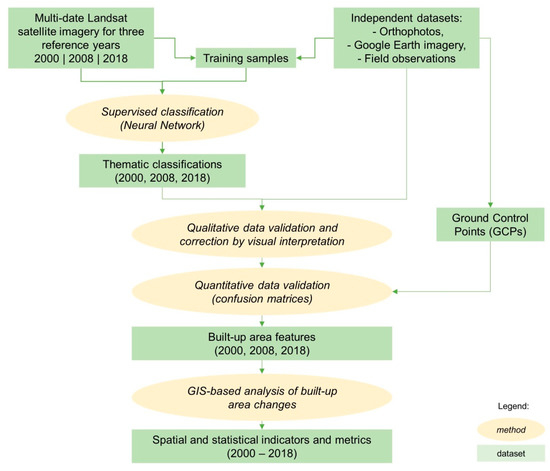
Figure 2.
Analysis workflow.
First, the training sample datasets for the land cover features were created for each reference moment. This was performed by visual interpretation of the input satellite images in different band combinations together with independent data sources, including orthophotos and field observations, with special focus on built-up features.
Second, a thematic supervised classification method was applied on each multi-date stacked dataset, resulting in a thematic classification of land cover features, grouped later in two main classes: built-up area and non-built-up area. Different methods of supervised classification were used and tested on multispectral data in the last 30 years, in order to find the most efficient classifier for data extraction from remote sensing images. However, the effectiveness of the classification algorithms strongly depends on various factors, including the image properties and resolutions, the complexity of land cover/use classes, and the training datasets. Our purpose is to accurately isolate the built-up features from other land cover/use classes for a large area with heterogeneous landscape. The most challenging task was to reduce the confusions caused by the spectral similarities between built-up features and barren lands, less arable vegetation plots, and landfills. In this context, several supervised classification learning methods were tested and compared, including the parametric algorithm Maximum Likelihood and the non-parameter algorithms Support Vector Machine and Neural Network. The Neural Network classifier returned better results for built-up area discrimination in our study area, with fewer confusions and a higher precision of the features. As several other studies previously mentioned, the Neural Network algorithm has the ability to solve large scale complex problems, such as pattern recognition, nonlinear modelling, association and control [97,98,99]. Contrary to parametric classifiers, which are highly dependent upon statistical distribution [100], non-parametric classifiers, including Neural Network, can handle large amounts of noisy data from dynamic and nonlinear systems [101], and identify the relationship from given patterns [100]. This is why the Neural Network classifier was preferred for built-up feature extractions in different study areas [102,103].
Third, a double validation of the binary classifications was performed, by comparison with the input images and independent datasets (such as Google Earth imagery, orthophotos and field observation). The objective of the qualitative approach of visual comparison between resulted classification and independent data was to identify and correct the misclassifications generated by the spectral similarities between built-up features and other land cover classes, especially bare lands or landfills.
The quantitative method of confusion matrices [104,105] was based on a number of 300 ground control points (GCPs) randomly distributed over the study area, with binary attributes (built-up and non-built-up), created for each reference moment through visual interpretation of input imagery and independent datasets. The number of the GCPs was determined through a statistically solid sampling scheme [104], accounting for various parameters, such as the level of probability assigned to the estimation, the estimated percentage of successes, the percentage of errors and the level of error allowed. In the case of classified images, where the variable is categorical, the preferred approach is a bimodal distribution of probability [104]. The results consisted in statistical indicators of accuracies, such as overall accuracy (%) and a kappa coefficient.
Finally, geographical information systems (GIS) techniques were used for built-up area change detection analysis and interpretation, in a spatial and statistical manner, at the regional and local administrative levels, as well as for data mapping.
In order to quantify the magnitude of urban expansion and the main territorial directions of development at the ATU level, the annual growth (AG) of built-up areas was calculated for two periods: 2000–2008 and 2008–2018. This indicator can be defined as the measurement of the newly developed built-up areas as the annual average over a given period and is expressed as follows:
where At2 and At1 represent the size of the built-up area at the final and initial years, and n refers to the time span between the two dates. The values were ranked in four categories to reveal the spatial differentiation (under 10 ha/year; 10–20 ha/year; 20–30 ha/year; over 30 ha/year) and to allow further comparisons.
AG = (At2 − At1)/n (ha/year),
The type of built-up area dynamics between 2000 and 2018 was evaluated with the help of LDTtool, a landscape metrics instrument that focuses on accounting for both composition and configuration changes of the binary land cover classes [106]. This tool is based on the combination of the characteristics of two spatial metrics (area and number of patches—NP) that can increase, decrease or remain the same between both reference times, resulting in a set of landscape dynamics types. The analysis was run using the built-up area polygons from all three moments of reference (2000, 2008 and 2018) on an artificial sampling grid. The chosen grid cell size was 250 m, a value we consider large enough (comparing to building dimensions) to ensure a proper spatial resolution and, at the same time, to minimize patch intersection with the spatial grid which could lead to an increased number of patches.
From the group of ATUs recording the highest annual growth of built-up area (over 30 ha/year) in the period 2008–2018, three complementary case studies denoting various spatial patterns of development were chosen, in connection with socioeconomic data. The development patterns erected in the post-socialist context were examined using high resolution Google Earth Images.
3. Results
3.1. Spatial and Temporal Features of Built-Up Area Expansion
The spatial configuration of the built-up area in the three key temporal moments (2000, 2008, 2018) is represented in Figure 3.

Figure 3.
Built-up area coverage in Ilfov County at different temporal moments.
The accuracy assessment of the satellite based spatial data was performed by both qualitative and quantitative approaches. First, the resulted datasets were visually compared to independent geospatial layers as orthophotos and Google Earth imagery. Second, confusion matrices were used to explain the evaluation in a quantitative formula, based on a set of 300 GCPs generated with a random distribution over the study area.
Table 1 provides a synthetic view over the statistical validation of the built-up datasets extracted from Landsat satellite images with the GCPs.

Table 1.
Main accuracies of the built-up datasets extracted from Landsat imagery.
The values of the global accuracies and of the calculated Kappa coefficients (over 95% and over 0.9, respectively) are encouraging; they illustrate the results’ performance.
The result map highlights the process of territorial restructuring with a significant increase in built-up areas on previously undeveloped land, mainly through the conversion of greenfield sites.
To better understand the changes, the analysis was further centered on two phases: 2000–2008; 2008–2018. In 2000 the built-up area covered around 9822.3 ha, after which it increased by 31%, reaching 12,891.4 ha in 2008 (Table 2). Analysis of the spatial configuration revealed that the spread of newly built-up areas followed certain directions of development, more obviously along major communication routes and on the edges of previously existent settlements. Additionally, some significant nuclei of development in terms of land consumption emerged far away, highlighting a fragmented spatial pattern. Usually, these clusters were comprised of residential complexes, but non-residential expansion has also been observed.
Table 2.
The built-up area expansion and the annual growth increase (2000–2018).
Overall, a higher concentration of newly built-up areas is noted in several places located near Bucharest. Still, generally, some settlements in the southern, south-western and even western side proved to be less appealing.
Between 2008 and 2018, the amplitude of built-up area expansion heightened, as the newly developed constructions increased by 70%, meaning 9057 ha. In 2018, the built-up area encompassed 21,948.3 ha. The map highlights large area construction increases and a general tendency for more spread development into the territory. The most noticeable changes occurred nearby the compact edges of settlements or next to previously post-socialist nuclei of development. Additionally, an infilling process can be observed in several places, as well as an attractiveness of the open spaces close to the boundaries of Bucharest. Still, the emergence of new fragmented clusters can be observed almost all over the county.
As far as the general spatial pattern is concerned, the preferred territorial directions seem to have preserved the pre-existing radial layout. Nevertheless, compared to the previous period, it is obvious that the overall configuration is moving towards a more circular development in the immediate vicinity of Bucharest.
The territorial extent of the newly built-up area between 2000 and 2018 encompasses 12,126 ha, revealing a massive spatial reconfiguration as the new developments are occupying a larger area than the settlements’ surface in 2000. Further analysis of the map shows that this process is more than visible in many places, such as Chiajna, Bragadiru, Corbeanca, etc. In fact, for 65% of ATUs, the surface of the new constructions exceeded the initial size of settlements at the turn of the millennium. Overall, the territorial reconversion did not follow the same pace, considering that between 2000–2008 only 3069.1 ha were built, while in the next decade the impact was much higher—9057 ha were converted into new buildings. In fact, an enormous 75% of the entire development took place in the last decade. Analysis of the annual growth of built-up area confirmed the substantial acceleration of urban decentralisation in the second interval, 136% higher than the values recorded between 2000 and 2008.
The initially prevalent compact form of the settlements with clearly established boundaries, a legacy of the communist policy, has faded in the areas experiencing the most dynamic development, as the open spaces between them have been swallowed up by new constructions. As a result, in several places, a relative continuum of built-up areas, including clusters of isolated buildings, has become visible in the landscape. In addition, low density developments proliferated in a scattered way all over the territory. This situation is also supported by the conversion of a large part of the agricultural surface to land available for construction, boosting the building sector.
From a morphological point of view, the settlements’ structures became increasingly complex: in addition to the main core, more and more new secondary built-up areas have been identified. It is important to investigate these features to evaluate the financial resources needed to ensure adequate infrastructure and basic services. Meanwhile, other settlements maintain their previously linear structure, along the roads, even though new built-up areas emerged. This pattern is distributed mostly in the northern part of the county, but also in the south and south-west.
3.2. Comparison of Built-Up Area Expansion in a Medium-Scale Perspective
Extending the analysis to the local level is relevant for exploring the spatial differentiations and for identifying the places with the most significant development of new constructions. This type of analysis can be useful for planners and policy makers as the basis for further assessment of the local land use management, urban plans and strategies. For an accurate evaluation of the territorial dynamics, the annual growth of built-up areas was calculated for two periods (2000–2008; 2008–2018).
In the first interval, between 2000 and 2008, the majority of ATUs (65%) presented a limited spread of built-up areas, under 10 ha each (Table 3). Higher values were registered in several places in the first and second ring of ATUs near Bucharest, mainly in the northern, north-eastern, and north-western side. Only two attractive places are located in the south-eastern (Popești-Leordeni) and south-western part (Bragadiru), both granted with an urban status (Figure 4). This denotes a prevalence of development in certain areas. New developments, comprising over 20 ha, were registered in places with a good accessibility to Bucharest, in settlements located in the first ring of ATUs. The town of Voluntari, located in the north-eastern part of Romania’s capital, recorded the highest increase for this period (about 50 ha/year).
Table 3.
Annual growth of built-up areas (%).
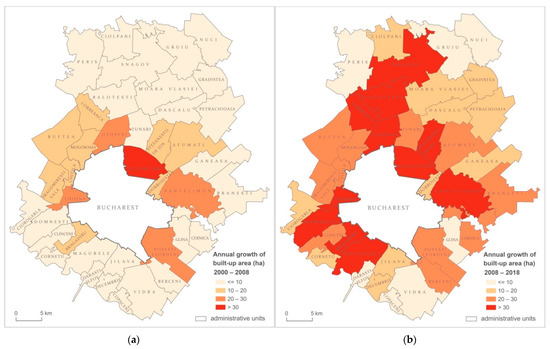
Figure 4.
Annual growth of built-up area at the administrative unit level, 2000–2008 (a) and 2008–2018 (b).
In the second interval (2008–2018) the majority of ATUs in Ilfov County saw an accelerated expansion of built-up areas. In this regard, just 17.5% of the ATUs were less appealing, located in the north or south extremities, and in the south-east—Glina, known for its environmental issues. In the first place in terms of attractiveness is a town located in the southwestern side (Bragadiru) with about 59 ha/year land consumption, followed by Voluntari (about 55 ha/year) and Chiajna (about 52 ha/year). Analysis of the map reveals that the most attractive places are located near Bucharest or along an axis of territorial development which extends to the northern part of the county, following one of the main communication routes to the capital.
Thus, comparing the maps enables the conclusion that, in the second period, significant real estate investments expanded to other parts of the county as well. For example, some settlements in the south and south-west side which did not use to be appealing now attract investors and Bucharest residents.
Confronting the annual growth of built-up areas for the two intervals, only a few ATUs have maintained a limited extent of transformations over the whole period—below 10 ha—although, even in these cases, a slight increase has been recorded. Meanwhile, the others maintain the same, relatively high, pace of transformations (Popești-Leordeni) or one substantially amplified (e.g., Bragadiru went from about 14 ha/year to about 59 ha/year). This process gradually leads to a trend of densification in certain areas, even though divergent spatial patterns can be noticed in many places, through a mixture of low density developments with high-rise complexes, sometimes inside the same settlement.
3.3. Identifying the Types of Built-Up Area Dynamics
The types of built-up area dynamics, for the period 2000–2018, as revealed by LDTtool, is presented in Figure 5. The map denotes the intensive spatio–temporal transformation patterns of built-up area expansion, which is further interpreted according to the characterizations of dynamics types established by Machado et al. in 2020 [106].
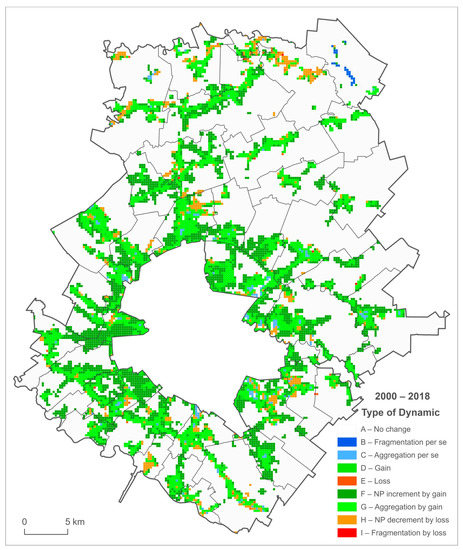
Figure 5.
Built-up area types of dynamics (2000–2018).
Overall, the main change patterns are represented by “F—NP increment by gain”, including 3435 cells, followed by “G—Aggregation by gain” with 2835 cells (Figure 6), both visible almost all over the county. These two forms of dynamics comprise around 80% of the total number of cells. The first type expresses the development of multiple new patches of built-up areas not contiguous to the existing ones, more frequent in some of the ATUs located in the first or second ring near Bucharest, such as: Chiajna, Bragadiru, Ștefăneștii de Jos, Corbeanca. The second most identified type of dynamics—“G—Aggregation by gain”—denotes situations in which new nuclei of built-up areas or the augmentation of previous clusters generate the fusion of patches.
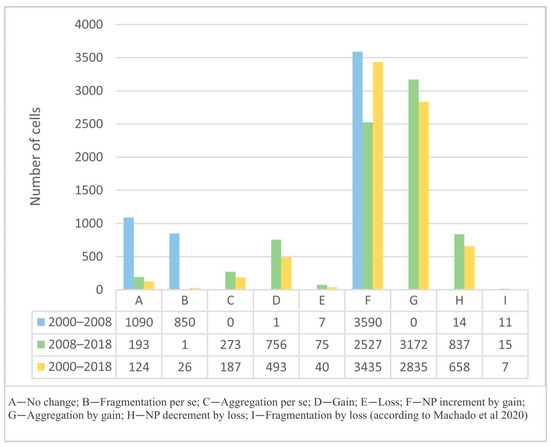
Figure 6.
Number of cells assigned to each built-up area dynamic type.
At the same time, Ilfov County registered some losses, framed especially in the “H—NP decrement by loss” class, identified in 658 cells, more obvious in the south-eastern and northern parts. This category can reflect a variety of situations, presumably disused former construction sites or disassembled ruins of economic units from the communist period which have yet not been reused. Another example is temporary agricultural constructions that have been dismantled.
In the general hierarchy, the following type of built-up area dynamics is “D—gain”, which occurred in 493 cells, dispersed among several ATUs, expressing an increase in the built-up area with no influence on the NP.
A comparison of the number of cells between 2000–2008 and 2008–2018 denotes some significant differences concerning the dynamics of built-up area types. One of the most notable changes is related to the “G—Aggregation by gain” type, identified only in the second interval, when the largest number of cells—3172—was registered. In the first period, the “F—NP increment by gain” category was predominant, presumably boosting the fusion of patches after 2008. Indeed, this type reached the second highest number of cells in the last period. Meanwhile, in the first interval, the category “A—No change” was identified in 1090 cells, leading to the assumption that no modifications were registered. Subsequently, after 2008, only 193 cells were found, expressing a significant increase in the construction sector. The categories “B—Fragmentation per se” and “C—Aggregation per se” reflect pure geometric variations, without amount changes [106,107].
3.4. Various Development Patterns of Built-Up Area at the Local Level
Our study is enriched with complementary case studies, in order to explore the spatial pattern differentiations and to better understand the utility of Landsat datasets for sustainable planning and for substantiating further qualitative analysis. The case studies illustrate different administrative statuses and geographical locations: an urban settlement—Bragadiru, and a commune—Chiajna, nearby Bucharest; a commune in the second ring of ATUs—Corbeanca, further away from the capital. In all three ATUs (Bragadiru, Chiajna and Corbeanca) the human pressure has been unprecedented and the spatial pattern was completely redesigned as the new construction exceeds the built-up area outlined in 2000.
Bragadiru, a town granted with urban status in 2005, is located in the south-west part of Ilfov County. Traditionally, this settlement was well known for industrial and agricultural functions (around 91% agricultural land in 2000) (Figure 7).

Figure 7.
Changes in the built-up area configuration in Bragadiru, on the south-western edge of Bucharest (Source: Landsat imagery archives, earthexplorer.usgs.gov, accessed 24 March 2021).
As a legacy of the communist policy of the territorial reorganization of rural areas, Bragadiru’s central part includes several blocks of flats. Single-family houses and nonresidential constructions were also diffused into the territory. Subsequently, during the 1990s, limited transformations were reported. Meanwhile, a large share of agricultural plots was rezoned for urban use, with residential developments and other types of constructions for secondary and tertiary activities. In the first interval (2000–2008), the annual growth of built-up area was reduced (about 14 ha/year), mainly along the main roads towards Bucharest or at the edge of the existent settlement. Isolated nuclei of new constructions emerged in a fragmented pattern in a few places.
In the second period (2008–2018), Bragadiru saw a fast rhythm of development, presenting the highest annual growth of built-up land in Ilfov County (about 59 ha/year). The highest development was registered on greenfield sites located between Bucharest’s limits and the beltway. In this regard, this communication route fragments the spatial pattern, as it is widely known for frequent traffic jams. In addition, a more limited surface occupied by new constructions is noticed in the expansion of Bragadiru’s old core, on the western side, possibly related with its proximity to a leisure area. Overall, a surface of 699 ha of land was consumed for urban growth between 2000 and 2018. The spatial pattern is complex, comprised of an overall mixture of residential and non-residential areas (commercial, industrial, logistics, etc.). The latter are usually concentrated in several places, sometimes at the edge of built-up areas, but interspersed among residential neighborhoods.
In terms of residential expansion, clusters of single-family houses or multi-family residential complexes stand out in several places, but a more common feature is the disordered intermingling of the two. Some of the newly emerged residential clusters are the result of large scale projects developed almost entirely after 2008, including several blocks of flats.
Another case study explores the spatial dynamics of three villages—Chiajna, Dudu and Roșu—in the Chiajna commune, on the western edge of Bucharest (Figure 8).
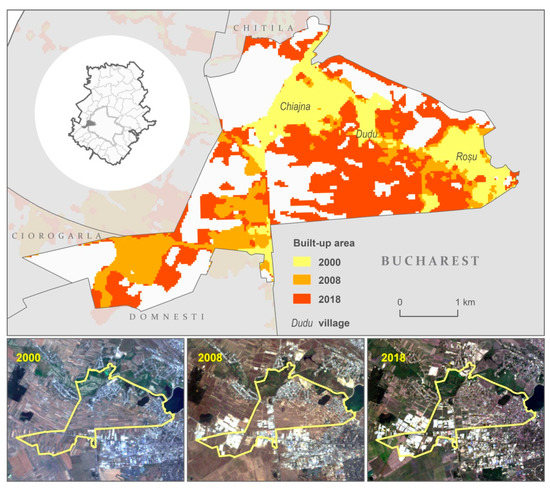
Figure 8.
Changes in the built-up area configuration in Chiajna commune, on the western edge of Bucharest (Source: Landsat imagery archives, earthexplorer.usgs.gov, accessed 24 March 2021).
In 2000 the largest part of the territory was composed of agricultural land (67%), typical villages and some small scale post-socialist developments. The latter included a few commercial and logistics spaces at the junction of the Bucharest beltway and the A1 highway. Subsequently, this commune has become one of the most attractive places for the Bucharest population and investors, transforming it into an area of intense economic activity and residential development. Thus, between 2000–2008, the annual growth of built-up area was the second highest registered in Ilfov County (about 30 ha/year).
Over the next period, this trend intensified, reaching around 52 ha/year between 2008–2018, placing it third in the region. The total surface converted into built-up area between 2000 and 2018 was around 750 ha. From a functional point of view, two major areas of development can be delineated: the largest one, in the eastern part, predominantly recorded a spread of residential buildings; meanwhile, in the western side non-residential activities were concentrated.
A previous analysis even noted that some of the largest logistic spaces and clusters of logistics parks in Ilfov County are located in the western side of Chiajna [108]. These developments were established along the Bucharest beltway and the A1 highway. In terms of the types of land consumption, between 2000 and 2008, it was mostly non-residential areas that expanded. New houses were developed mainly in an unplanned, fragmented way at the edges of the pre-existent villages, but also expanding largely into the nearby open space. After 2008, even though the deconcentration of non-residential activities continued, residential buildings made up the lion’s share of built-up area expansion, spilling over into greenfield sites. Large scale projects and multi-family residential complexes are definitive characteristics of this area in recent years.
The last case study addresses the territorial reconfiguration of the Corbeanca commune, in the second ring of ATUs, north of Bucharest, and composed of four villages: Corbeanca, Ostratu, Petrești and Tamași. In terms of accessibility, these villages are located around 20 km from the capital center. In 2000, rural settlements were characterized by a linear structure surrounded by agricultural plots (84% of the entire land surface), forests and bodies of water. Distinguished by attractive natural settings, this area was among the earliest to be developed for residential expansion, with some new single-family houses built in the first post-socialist decade. However, in terms of land consumption, in the period 2000–2008, Corbeanca presented a modest spread of built-up areas (about 11 ha/year), compared with 40 ha/year between 2008–2018, making it the sixth fastest expanding place in the region. The total surface transformed into built-up area between 2000 and 2018 encompasses 492 ha. Regarding the growth patterns, in the first interval the spread of constructions generally went beyond the edges of the old villages, in a more scattered way into greenfield sites (Figure 9). Some of these new developments were placed on isolated patches far away from the old built-up areas. After 2008 there was a new wave of construction, creating a significant nucleus of new built-up area in the open space between the four villages—a greater diffusion of new buildings into the territory. This led to the creation of a more articulated spatial pattern, comprised of almost a continuum of built space, fragmented by patches of forest, bodies of water and agricultural land. Gradually, the pressure on land near forest intensified, much like it did for waterfront plots. A rarer trend is the development of new houses interspersed between previously built dwellings. The predominant functional use of the land is residential constructions, followed by developments in the service sector. Generally, the landscape is dominated by single-family homes mixed with residential complexes with detached houses built as part of several large scale projects. Still, a few blocks of flats may be observed in some areas.
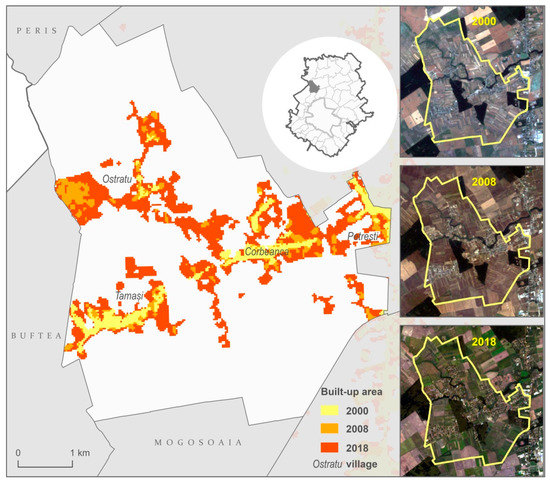
Figure 9.
Changes in the built-up area configuration in Corbeanca commune, north-west of Bucharest (Source: Landsat imagery archives, earthexplorer.usgs.gov, accessed 24 March 2021).
4. Discussion
The result maps illustrate the gradual expansion of the built-up area in the surroundings of Bucharest, which allows an overview of the structural changes that have occurred after the turn of the millennium. Previous research noted that, generally in CEE countries, the uncontrolled expansion of built-up areas was embraced as a positive measure, regardless of the long lasting detrimental effects [5,109]. Thus, such quantitative approaches based on Landsat datasets enable the understanding of the urban development pathway, the resulting spatial outcome and related challenges, which can then be used to improve policy making that might sustain better planning.
Our results reinforce previous findings that indicated substantial territorial transformations in the Bucharest city region in the post-communist period, under the increasing pressure of real estate developers, investors and the growing population [64,75,91,110]. The large amount of greenfield land and its lower costs, as compared with the capital, are considered the main attractive factors for establishing new developments [111]. Moreover, the preferences for the open space adjacent to large cities is common in CEE countries [5,53,63], fostered by the interest of local authorities to increase their budget revenues [68].
Deepening our analysis, we have revealed spatial and temporal variations of processes related to urban growth, both at regional and local level, shedding light on the trajectory of the largest post-socialist city in the European Union. The employed up-to-date information brings a new, integrated perspective to the last decade’s territorial changes. Considering all this, the resulted knowledge can serve as a starting point for further qualitative approaches.
The noteworthy differentiations recorded between the two analyzed periods are anchored in the socioeconomic context. The fall of communism was followed by economic restructuring, a profound downturn and the late implementation of the reforms necessary for the transition from a centralized economy to a free market. As a result, the economic recovery was late [50], stimulated also by the mandatory reforms required for joining the European Union (2007). In this context, between 2000 and 2008, the development of newly built-up areas has augmented progressively—a total increase of 31%, according to our findings.
Initially the urban expansion process and the development of large scale projects were thought to be delayed in this region compared to its CEE counterparts [91], but now it seems that those times are long gone. In fact, after 2008, the annual growth of built-up development significantly accelerated, to a concerning degree, and it shows no signs of slowing down; on the contrary, there are hints of an upward trend. The human pressure has become greater and greater as the number of players in the real estate market multiplied. The 2008 economic crisis was expected to trigger a significant decrease in built-up area expansion, as reported in other CEE countries [63]. Moreover, the deep economic recession detrimentally impacted the Romanian construction sector, as noted in previous research [112,113]. Still, a decade later, an assessment of the territorial impact of built-up area expansion reveals that the share of land overtaken for urban growth is significantly higher than in the previous period, encompassing 75% of the entire development. One of the main reasons for this unexpected trajectory was the governmental decisions made in 2009 to encourage the construction sector, still in effect today, which boosted the residential sector.
This situation confirms previous findings that national policies play an essential role in guiding built-up area expansion [63,83]. In this context, the legislation in the field of spatial and urban planning is considered inefficient [114,115], even though a framework law was adopted in 2001. This normative act registered several structural changes, especially beginning with 2008. Still, these legal provisions failed in ensuring effective regulations for limiting urban expansion.
The analysis of the development trends and urban growth intensity at the local level outlines that, prior to 2008, the most dynamic territorial transformations (over 20 ha/year) took place in 12.5% of the ATUs located in the first ring near Bucharest. In the last decade, however, a similar intensity of development was registered in 55% of the ATUs dispersed across Ilfov County. The newly emerging clusters were more territorially concentrated in the first period, but, after 2008, amid the increasing magnitude of urban expansion, other parts of the county which initially experienced modest development also became very appealing. These results confirm several intraregional differences, broadly suggested by other studies [75], as well as the significant rise of land consumption.
In addition, LDTtool provides valuable findings. Through quantitative measurements, it identifies the specific dynamics of built-up area and the overall fragmented spatial way of development hinted in other studies [57,75]. Still, some interesting differentiations were revealed, as the prevailing change pattern was “F—NP increment by gain” before 2008, but afterwards the “G—Aggregation by gain” type of dynamics became the most represented, followed by the previously dominant category. Thus, we notice an obvious shift in the last decade toward a spatial homogenization in several places, as the fusion of patches fosters this process [106]. Still, overall, the results demonstrate the maintenance of the general development pathway, with new built-up areas springing up further away from the existing ones, but which can, afterward, support a process of densification. These findings demonstrate the area’s unsustainable urban expansion, given that one of the countermeasures indicated on the European level is to clearly designate building zones to sustain compact growth [4].
Exploring the three complementary case studies, we have captured several similarities and differences between the patterns of development at the local level. In Bragadiru and Chiajna the overall pattern is much more complex than in Corbeanca, with residential development and substantial areas occupied by non-residential activities (commercial, industrial, logistics, etc.). In Bragadiru, concentrations of non-residential activities are interspersed among residential neighbourhoods in several places, while in Chiajna they are mostly clustered on the western side, at the junction between the Bucharest beltway and the A1 highway. In Chiajna, the communication routes seem to have stimulated new activities; meanwhile, in Bragadiru, the beltway has fragmented the spatial pattern, as the largest development took place between the beltway and Bucharest’s city limits. In Corbeanca, the majority of newly emerged areas are residential, with the prevalence of single-family detached houses. In addition, in Chiajna and Bragadiru, clusters of multi-family residential complexes emerged in several places, developed almost entirely after 2008. These three case studies illustrate various development patterns, even inside the same settlement boundaries—a result of an incoherent planning policy, as suggested by previous studies [110,116,117].
Concerning the planning process, while the elaboration of a master plan for Ilfov County has been publicly discussed since 2016, it has yet to be completed. However, such a master plan will only provide a guiding character to the territorial impact of socioeconomic development. Clearly enforceable regulations for land use management and built-up area development are established only at the local level entities through specific plans. Thus, the local authorities at the ATU level decide land development independently, being in permanent competition with each other to attract more investments. The lack of coordination between these entities, coupled with the absence of a joint development plan at the regional level, has led to uncontrolled development, labelled even as chaotic [118]. This situation is likely to persist, as there are no plans for cooperation in the foreseeable future. In this sense, it seems that the space is structured more according to the private interests of developers and newcomers, than for the public’s benefit. Previous research reported these practices as common in other CEE countries as well [109], even though in several places progress has been made toward more sustainable planning [5,66].
Uncontrolled urban expansion is perceived as a negative way of development [4,94], in and of itself. It is stimulated by the fast pace of transformations, illustrating the lack of proper planning, characterized by ad-hoc decisions [5,67,68] without coordination between different projects [111], which all lead, more often than not, to a patchwork of spatial arrangements. One of the most visible results is the lack of clear functional zoning that fosters a heterogeneous mixture of residential (single-family houses or multi-family residential complexes) and non-residential areas (commercial, logistical, high-rise offices, industrial, etc.), sometimes tightly intertwined on the same parcels of land. Another serious negative dysfunctionality is the emergence of residential development nuclei near landfills. In this sense, previous studies have drawn attention to inappropriate solid waste management in the surroundings of Bucharest [119].
Other detrimental consequences are related to the increasing human pressure over attractive natural amenities, considering that new clusters have appeared near or even inside forests and along bodies of water [64], some of which are protected areas. This type of aggression is a continuous process, leading to the progressive degradation of natural resources, as well as limiting recreational areas for Bucharest residents. Another common dysfunctionality in many places is the lack of, or undersized, basic infrastructure and services, which further on may lead to water and soil pollution. Additionally, frequent traffic congestion was reported [118] which seems to lead to a higher attractiveness of the more accessible places located near Bucharest.
In terms of land consumption, the urban growth has led to the fragmentation of greenfield land and proliferation of low density areas interspersed with clusters of high-density developments and undeveloped land. The latter is not usually used for agricultural production [111], but is more often acquired for speculative purposes, and abandoned until profitable opportunities arise for investors.
Previous studies have argued that, in Europe, discontinuous spatial development represents an intermediary phase toward a more contiguous pattern [52,120]. It is true that, in several places in Ilfov County lately, as revealed by our analysis, one of the tendencies has been to build on the open spaces between previously dispersed buildings. Still, this potential evolution does not erase the long term detrimental impacts of uncontrolled development in terms of the degradation of natural resources, pollution, inefficient land use, etc., all of which have negative repercussions on the inhabitants’ quality of life.
These findings reinforce the conclusions of previous studies that call for urgent action [4,17,121] and for up-to-date information that will allow the design of appropriate policies and strategies for a more sustainable future. Local urban plans are updated once every few years, usually after more than a decade, and they focus on the territorial development trends at the time of their elaboration. Thus, complementary instruments, such as the Landsat dataset, have become essential for the constant monitoring of the fast paced dynamics of built-up areas, as revealed in previous researches [22,27,31,34,44,122,123,124,125,126]. In this regard, different studies highlighted the importance of analyzing temporal and spatial characteristics [22,126], the main directions of urban expansion [25,123] and the spatial pattern of land changes [31,34,44,124]. All these studies focused on different places and are in the same line of thought, illustrating the fast rhythm of urban growth, as we have identified in the case of Bucharest. In addition, our results confirm previous findings that point out that investigating built-up area dynamics based on remote sensing can serve as a basis for decision-making [26,29,35,122,127]. For getting deeper insights about territorial transformations, LDTtool has proven suitable for detecting the types of local dynamics, as suggested in previous research [106,107]. Still, there are some limitations related to the modifiable areal unit problem (MAUP) which refers “to the fact that the areal units can be set arbitrarily and are modifiable” [106].
5. Conclusions
The study explores the built-up area expansion process and the resulting spatio–temporal changes between 2000 and 2018 in Ilfov County, which overlaps the surroundings of Bucharest, capital of Romania. The research is approached from a multi-scalar perspective on a regional and local level, through the comparative assessment of the ATUs’ pathway, based on Landsat satellite data at a medium spatial resolution of 30 m. Additionally, the types of built-up area dynamics were identified by using the LDT tool.
The results illustrate a massive spatial reconfiguration that took place under the relatively recent conditions of free market capitalism, as the built-up area has more than doubled in the 18 years. The pace of territorial transformations has also changed, with a significant acceleration after 2008, when 75% of the entire development was registered. Regarding the overall growth pattern between 2000 and 2008, prevalent directions of development with a higher expansion concentrated in several places closer to Bucharest. After 2008, a more widespread development trend was noticed in the territory, even though some areas remain more appealing than others. The annual growth of built-up areas at the local level reflect that the greatest territorial impact (over 20 ha/year) was recorded in 12.5% of the ATUs in the first period, but in the last interval a similar increase was registered in 55% of the entities. In some cases, tremendous changes were recorded: from a limited transformation in the first period to substantial development after 2008.
Concerning the specific dynamics of built-up area for the entire period, the number of cells classified as dynamics related to gain is predominant (“F-NP increment by gain”, “G-Aggregation by gain”, “D—gain”), encompassing around 87% of the total.
The overall spatial configuration became more and more complex and heterogeneous, in a mosaic of spatial arrangements, with low density developments interspersed with high density clusters and undeveloped areas. The analysis of the three complementary case studies illustrates various development patterns, even inside the same settlement boundaries. The results reveal that the largest part of the newly built-up area emerged through fragmentation of greenfield land.
Our research enriches the knowledge on CEE countries by bringing the largest post-socialist city in the European Union into the spotlight, and thus contributing to filling the recognized gap for more quantitative assessment of the built-up area’s territorial impact. At the same time, the results draw attention to the fast pace of transformations in this macro-region, and to the crucial role of Landsat dataset and other related tools in capturing spatio–temporal changes, especially in the context of lacking relevant socioeconomic data. Compared with other studies that focused on Bucharest’s surroundings, or even beyond, the approach implies a more comprehensive framework, displaying the multilevel territorial dynamics for two distinct periods.
The present study highlights the importance of deeper insights into the trajectory of different CEE city regions to understand the fast rhythm of changes and monitor the spatial outcome. These findings provide a valuable scientific approach that can be exploited by decision-makers to evaluate the territorial impact of implemented plans and strategies, as well as to inform future development decisions for better planning.
In addition, the approach can be used to investigate the trajectories of other places with similar development patterns. Moreover, it provides a basis for further comparative analysis in the wider post-socialist framework.
Future research should link these findings with other types of data from a more comprehensive perspective, to understand the local impact and the causal mechanisms that triggered the territorial reconfiguration.
Author Contributions
All authors have equally contributed to the article. In more detail, the contributions for the different sections are: conceptualization, I.-V.S.; methodology, formal analysis and investigation, I.-V.S., M.V., D.Z; writing—original draft preparation, I.-V.S., M.V.; writing—review and editing, I.-V.S., M.V., D.Z. All authors have read and agreed to the published version of the manuscript.
Funding
The article was partially funded by the University of Bucharest.
Institutional Review Board Statement
Not applicable.
Informed Consent Statement
Not applicable.
Conflicts of Interest
The authors declare no conflict of interest. The funders had no role in the design of the study; in the collection, analyses, or interpretation of data; in the writing of the manuscript, or in the decision to publish the results.
References
- Angel, S.; Parent, J.; Civco, D.L.; Blei, A.; Potere, D. The Dimensions of Global Urban Expansion: Estimates and Projections for All Countries, 2000–2050. Prog. Plan. 2011, 75, 53–107. [Google Scholar] [CrossRef]
- Liu, X.; Pei, F.; Wen, Y.; Li, X.; Wang, S.; Wu, C.; Cai, Y.; Wu, J.; Chen, J.; Feng, K.; et al. Global Urban Expansion Offsets Climate-Driven Increases in Terrestrial Net Primary Productivity. Nat. Commun. 2019, 10, 5558. [Google Scholar] [CrossRef] [Green Version]
- European Environment Agency. Urban Sprawl in Europe: The Ignored Challenge; EEA Report; European Environment Agency; Office for Official Publications of the European Communities: Copenhagen, Denmark; Luxembourg, 2006. [Google Scholar]
- European Environment Agency; Swiss Federal Office for the Environment (FOEN). Urban Sprawl in Europe: Joint EEA-FOEN Report; Publications Office: Luxembourg, 2016. [Google Scholar]
- Pichler-Milanović, N. Confronting Suburbanization in Ljubljana: From “Urbanization of the Countryside” to Urban Sprawl. In Confronting Suburbanization; Stanilov, K., Sýkora, L., Eds.; John Wiley & Sons, Ltd.: Chichester, UK, 2014; pp. 65–96. [Google Scholar] [CrossRef]
- Larkin, A.; van Donkelaar, A.; Geddes, J.A.; Martin, R.V.; Hystad, P. Relationships between Changes in Urban Characteristics and Air Quality in East Asia from 2000 to 2010. Environ. Sci. Technol. 2016, 50, 9142–9149. [Google Scholar] [CrossRef] [Green Version]
- Zaharia, L.; Ioana-Toroimac, G.; Cocoş, O.; Ghiţă, F.A.; Mailat, E. Urbanization Effects on the River Systems in the Bucharest City Region (Romania). Ecosyst. Health Sustain. 2016, 2, e01247. [Google Scholar] [CrossRef] [Green Version]
- Seto, K.C.; Guneralp, B.; Hutyra, L.R. Global Forecasts of Urban Expansion to 2030 and Direct Impacts on Biodiversity and Carbon Pools. Proc. Natl. Acad. Sci. USA 2012, 109, 16083–16088. [Google Scholar] [CrossRef] [Green Version]
- McDonald, R.I.; Güneralp, B.; Huang, C.-W.; Seto, K.C.; You, M. Conservation Priorities to Protect Vertebrate Endemics from Global Urban Expansion. Biol. Conserv. 2018, 224, 290–299. [Google Scholar] [CrossRef]
- Matei, E.; Manea, G.; Cocoş, O.; Vijulie, I.; Tîrlă, L.; Bogan, E.; Tișcovschi, A. Sustainable Development as a Solution for Agriculture and Human Settlements Competition in Ilfov County. In Proceedings of the 14th International Multidisciplinary Scientific Geoconference SGEM 2014, Sofia, Bulgaria, 19–25 June 2014; Volume 3, pp. 415–422. [Google Scholar] [CrossRef]
- Nae, M.; Dumitrache, L.; Suditu, B.; Matei, E. Housing Activism Initiatives and Land-Use Conflicts: Pathways for Participatory Planning and Urban Sustainable Development in Bucharest City, Romania. Sustainability 2019, 11, 6211. [Google Scholar] [CrossRef] [Green Version]
- Ianoș, I.; Merciu, F.C.; Merciu, G.; Zamfir, D.; Stoica, I.-V.; Vlăsceanu, G. Unclear Perspectives for a Specific Intra-Urban Space: Văcărești Lake Area (Bucharest City). Carpathian J. Earth Environ. Sci. 2014, 9, 215–224. [Google Scholar]
- Merciu, F.C.; Sîrodoev, I.; Merciu, G.; Zamfir, D.; Schvab, A.; Stoica, I.V.; Paraschiv, M.; Saghin, I.; Cercleux, A.L.; Văidianu, N.; et al. The “Văcărești Lake” Protected Area, a Neverending Debatable Issue? Carpathian J. Earth Environ. Sci. 2017, 12, 463–472. [Google Scholar]
- Louwagie, G.; European Environment Agency. Land Recycling in Europe: Approaches to Measuring Extent and Impacts. EEA Rep. 2016, 31, 51. [Google Scholar]
- Dallhammer, E.; Schuh, B.; Caldeira, I. Urban Impact Assessment Report. Implementation of the 2030 Agenda. The Influence of SDG 11.3 on Urban Development through Spatial Planning; European Committee of the Region: Luxembourg, 2018. [Google Scholar]
- European Environment Agency. Land Take in Europe. Available online: https://www.eea.europa.eu/data-and-maps/indicators/land-take-3 (accessed on 6 April 2021).
- Meiner, A.; Pedroli, G.B.M.; European Environment Agency. Landscapes in Transition: An Account of 25 Years of Land Cover Change in Europe; EEA Publications Office: Luxembourg, 2017. [Google Scholar]
- Xie, H.; Zhang, Y.; Duan, K. Evolutionary Overview of Urban Expansion Based on Bibliometric Analysis in Web of Science from 1990 to 2019. Habitat Int. 2020, 95, 102100. [Google Scholar] [CrossRef]
- Wang, L.; Brenden, T.; Seelbach, P.; Cooper, A.; Allan, D.; Clarck, R.; Wiley, M. Landscape Based Identification of Human Disturbance Gradients and Reference Conditions for Michigan Streams. Environ. Monit. Assess. 2008, 144, 483–484. [Google Scholar] [CrossRef] [Green Version]
- Zhang, Z.; Liu, F.; Zhao, X.; Wang, X.; Shi, L.; Xu, J.; Yu, S.; Wen, Q.; Zuo, L.; Yi, L.; et al. Urban Expansion in China Based on Remote Sensing Technology: A Review. Chin. Geogr. Sci. 2018, 28, 727–743. [Google Scholar] [CrossRef] [Green Version]
- He, C.; Liu, Z.; Gou, S.; Zhang, Q.; Zhang, J.; Xu, L. Detecting Global Urban Expansion over the Last Three Decades Using a Fully Convolutional Network. Environ. Res. Lett. 2019, 14, 034008. [Google Scholar] [CrossRef]
- Xiao, J.; Shen, Y.; Ge, J.; Tateishi, R.; Tang, C.; Liang, Y.; Huang, Z. Evaluating Urban Expansion and Land Use Change in Shijiazhuang, China, by Using GIS and Remote Sensing. Landsc. Urban Plan. 2006, 75, 69–80. [Google Scholar] [CrossRef]
- Li, H.; Wei, Y.; Huang, Z. Urban Land Expansion and Spatial Dynamics in Globalizing Shanghai. Sustainability 2014, 6, 8856–8875. [Google Scholar] [CrossRef] [Green Version]
- Luo, T.; Tan, R.; Kong, X.; Zhou, J. Analysis of the Driving Forces of Urban Expansion Based on a Modified Logistic Regression Model: A Case Study of Wuhan City, Central China. Sustainability 2019, 11, 2207. [Google Scholar] [CrossRef] [Green Version]
- Zeng, C.; Zhang, M.; Cui, J.; He, S. Monitoring and Modeling Urban Expansion—A Spatially Explicit and Multi-Scale Perspective. Cities 2015, 43, 92–103. [Google Scholar] [CrossRef]
- Kumar, A.; Pandey, A.C.; Hoda, N.; Jeyaseelan, A.T. Evaluating the Long-Term Urban Expansion of Ranchi Urban Agglomeration, India Using Geospatial Technology. J. Indian Soc. Remote Sens. 2011, 39, 213–224. [Google Scholar] [CrossRef]
- Kantakumar, L.N.; Kumar, S.; Schneider, K. Spatiotemporal Urban Expansion in Pune Metropolis, India Using Remote Sensing. Habitat Int. 2016, 51, 11–22. [Google Scholar] [CrossRef]
- Rustiadi, E.; Pravitasari, A.E.; Setiawan, Y.; Mulya, S.P.; Pribadi, D.O.; Tsutsumida, N. Impact of Continuous Jakarta Megacity Urban Expansion on the Formation of the Jakarta-Bandung Conurbation over the Rice Farm Regions. Cities 2021, 111, 103000. [Google Scholar] [CrossRef]
- Dhanarak, K.; Angadi, D.P. Urban Expansion Quantification from Remote Sensing Data for Sustainable Land-Use Planning in Mangaluru, India. Remote Sens. Appl. Soc. Environ. 2021, 23, 100602. [Google Scholar] [CrossRef]
- Xu, G.; Jiao, L.; Liu, J.; Shi, Z.; Zeng, C.; Liu, Y. Understanding Urban Expansion Combining Macro Patterns and Micro Dynamics in Three Southeast Asian Megacities. Sci. Total Environ. 2019, 660, 375–383. [Google Scholar] [CrossRef]
- Wu, W.; Zhao, S.; Zhu, C.; Jiang, J. A Comparative Study of Urban Expansion in Beijing, Tianjin and Shijiazhuang over the Past Three Decades. Landsc. Urban Plan. 2015, 134, 93–106. [Google Scholar] [CrossRef]
- Zhang, Q.; Su, S. Determinants of Urban Expansion and Their Relative Importance: A Comparative Analysis of 30 Major Metropolitans in China. Habitat Int. 2016, 58, 89–107. [Google Scholar] [CrossRef]
- Zhang, S.; Fang, C.; Kuang, W.; Sun, F. Comparison of Changes in Urban Land Use/Cover and Efficiency of Megaregions in China from 1980 to 2015. Remote Sens. 2019, 11, 1834. [Google Scholar] [CrossRef] [Green Version]
- Yang, C.; Li, Q.; Zhao, T.; Liu, H.; Gao, W.; Shi, T.; Guan, M.; Wu, G. Detecting Spatiotemporal Features and Rationalities of Urban Expansions within the Guangdong–Hong Kong–Macau Greater Bay Area of China from 1987 to 2017 Using Time-Series Landsat Images and Socioeconomic Data. Remote Sens. 2019, 11, 2215. [Google Scholar] [CrossRef] [Green Version]
- Rimal, B.; Zhang, L.; Stork, N.; Sloan, S.; Rijal, S. Urban Expansion Occurred at the Expense of Agricultural Lands in the Tarai Region of Nepal from 1989 to 2016. Sustainability 2018, 10, 1341. [Google Scholar] [CrossRef] [Green Version]
- Shi, L.; Liu, F.; Zhang, Z.; Zhao, X.; Liu, B.; Xu, J.; Wen, Q.; Yi, L.; Hu, S. Spatial Differences of Coastal Urban Expansion in China from 1970s to 2013. Chin. Geogr. Sci. 2015, 25, 389–403. [Google Scholar] [CrossRef]
- De Boeck, F. Urban Expansion, the Politics of Land, and Occupation as Infrastructure in Kinshasa. Land Use Policy 2020, 93, 103880. [Google Scholar] [CrossRef]
- Hereher, M.E. Analysis of Urban Growth at Cairo, Egypt Using Remote Sensing and GIS. Nat. Sci. 2012, 4, 355–361. [Google Scholar] [CrossRef] [Green Version]
- Mundia, C.N.; Aniya, M. Analysis of Land Use/Cover Changes and Urban Expansion of Nairobi City Using Remote Sensing and GIS. Int. J. Remote Sens. 2005, 26, 2831–2849. [Google Scholar] [CrossRef]
- Braimoh, A.K.; Onishi, T. Spatial Determinants of Urban Land Use Change in Lagos, Nigeria. Land Use Policy 2007, 24, 502–515. [Google Scholar] [CrossRef]
- Simwanda, M.; Murayama, Y. Spatiotemporal Patterns of Urban Land Use Change in the Rapidly Growing City of Lusaka, Zambia: Implications for Sustainable Urban Development. Sustain. Cities Soc. 2018, 39, 262–274. [Google Scholar] [CrossRef]
- Magidi, J.; Ahmed, F. Assessing Urban Sprawl Using Remote Sensing and Landscape Metrics: A Case Study of City of Tshwane, South Africa (1984–2015). Egypt. J. Remote Sens. Space Sci. 2019, 22, 335–346. [Google Scholar] [CrossRef]
- Terfa, B.K.; Chen, N.; Liu, D.; Zhang, X.; Niyogi, D. Urban Expansion in Ethiopia from 1987 to 2017: Characteristics, Spatial Patterns, and Driving Forces. Sustainability 2019, 11, 2973. [Google Scholar] [CrossRef] [Green Version]
- Hou, H.; Estoque, R.C.; Murayama, Y. Spatiotemporal Analysis of Urban Growth in Three African Capital Cities: A Grid-Cell-Based Analysis Using Remote Sensing Data. J. Afr. Earth Sci. 2016, 123, 381–391. [Google Scholar] [CrossRef]
- Linard, C.; Tatem, A.J.; Gilbert, M. Modelling Spatial Patterns of Urban Growth in Africa. Appl. Geogr. 2013, 44, 23–32. [Google Scholar] [CrossRef]
- Xu, G.; Dong, T.; Cobbinah, P.B.; Jiao, L.; Sumari, N.S.; Chai, B.; Liu, Y. Urban Expansion and Form Changes across African Cities with a Global Outlook: Spatiotemporal Analysis of Urban Land Densities. J. Clean. Prod. 2019, 224, 802–810. [Google Scholar] [CrossRef]
- Forget, Y.; Shimoni, M.; Gilbert, M.; Linard, C. Mapping 20 Years of Urban Expansion in 45 Urban Areas of Sub-Saharan Africa. Remote Sens. 2021, 13, 525. [Google Scholar] [CrossRef]
- Haase, D.; Kabisch, N.; Haase, A. Endless Urban Growth? On the Mismatch of Population, Household and Urban Land Area Growth and Its Effects on the Urban Debate. PLoS ONE 2013, 8, e66531. [Google Scholar] [CrossRef] [Green Version]
- Salvati, L.; Zambon, I.; Chelli, F.M.; Serra, P. Do Spatial Patterns of Urbanization and Land Consumption Reflect Different Socioeconomic Contexts in Europe? Sci. Total Environ. 2018, 625, 722–730. [Google Scholar] [CrossRef] [PubMed]
- Ianoş, I.; Petrişor, A.-I.; Zamfir, D.; Cercleux, A.L.; Stoica, I.V.; Tălângă, C. In Search of a Relevant Index Measuring Territorial Disparities in a Transition Country. Romania as a Case Study. ERDE—J. Geogr. Soc. Berl. 2013, 144, 69–81. [Google Scholar] [CrossRef]
- Hirt, S. Suburbanizing Sofia: Characteristics of Post-Socialist Peri-Urban Change. Urban. Geogr. 2007, 28, 755–780. [Google Scholar] [CrossRef]
- Taubenböck, H.; Gerten, C.; Rusche, K.; Siedentop, S.; Wurm, M. Patterns of Eastern European Urbanisation in the Mirror of Western Trends—Convergent, Unique or Hybrid? Environ. Plan. B Urban. Anal. City Sci. 2019, 46, 1206–1225. [Google Scholar] [CrossRef] [Green Version]
- Stanilov, K.; Hirt, S. Sprawling Sofia: Postsocialist Suburban Growth in the Bulgarian Capital. In Confronting Suburbanization; Stanilov, K., Sýkora, L., Eds.; John Wiley & Sons, Ltd.: Chichester, UK, 2014; pp. 163–191. [Google Scholar] [CrossRef]
- Kovács, Z.; Farkas, Z.J.; Egedy, T.; Kondor, A.C.; Szabó, B.; Lennert, J.; Baka, D.; Kohán, B. Urban Sprawl and Land Conversion in Post-Socialist Cities: The Case of Metropolitan Budapest. Cities 2019, 92, 71–81. [Google Scholar] [CrossRef]
- Matei, E.; Dumitrache, L.; Nae, M.; Vijulie, I.; Onetiu, N. Evaluating Sustainability of Urban Development of the Small Towns in Romania. In Proceedings of the SGEM Conference, Albena, Bulgaria, 20–25 June 2011; Volume 3, pp. 1065–1072. [Google Scholar] [CrossRef]
- Hirt, S.; Stanilov, K. Revisiting Urban Planning in the Transitional Countries. Regional Study Prepared for Planning Sustainable Cities Global Report on Human Settlements 2009. Available online: http://www.unhabitat.org/grhs/2009 (accessed on 22 April 2021).
- Dumitrache, L.; Zamfir, D.; Nae, M.; Simion, G.; Stoica, V. The Urban Nexus: Contradictions and Dilemmas of (Post) Communist (Sub) Urbanization in Romania. Hum. Geogr.—J. Stud. Res. Hum. Geogr. 2016, 10, 38–50. [Google Scholar] [CrossRef] [Green Version]
- Ursu, A.; Burtila, R.; Minea, V.; Marius, A.; Ichim, P. Urban Public Transportation System Changes, in Post Communist Period in Iasi Municipality. In Proceedings of the SGEM 2015 Conference, Albena, Bulgaria, 16–24 June 2015; Volume 2, pp. 615–622. [Google Scholar] [CrossRef]
- Stoica, I.-V.; Tulla, A.F.; Zamfir, D.; Petrișor, A.-I. Exploring the Urban Strength of Small Towns in Romania. Soc. Indic. Res. 2020, 152, 843–875. [Google Scholar] [CrossRef]
- Stanilov, K. Urban Planning and the Challenges of Post-Socialist Transformation. In The Post-Socialist City: Urban Form and Space Transformations in Central and Eastern Europe After Socialism; GeoJournal Library; Springer: Dordrecht, The Netherlands, 2007. [Google Scholar]
- Sýkora, L.; Bouzarovski, S. Multiple Transformations: Conceptualising the Post-Communist Urban Transition. Urban. Stud. 2011, 49, 43–60. [Google Scholar] [CrossRef] [Green Version]
- Slaev, A.D.; Nedović-Budić, Z.; Krunić, N.; Petrić, J.; Daskalova, D. Suburbanization and Sprawl in Post-Socialist Belgrade and Sofia. Eur. Plan. Stud. 2018, 26, 1389–1412. [Google Scholar] [CrossRef]
- Stanilov, K.; Sýkora, L. Postsocialist Suburbanization Patterns and Dynamics: A Comparative Perspective. In Confronting Suburbanization; Stanilov, K., Sýkora, L., Eds.; John Wiley & Sons, Ltd.: Chichester, UK, 2014; pp. 256–295. [Google Scholar] [CrossRef]
- Stoica, I.-V.; Vîrghileanu, M.; Zamfir, D.; Mihai, B.-A.; Săvulescu, I. Comparative Assessment of the Built-Up Area Expansion Based on Corine Land Cover and Landsat Datasets: A Case Study of a Post-Socialist City. Remote Sens. 2020, 12, 2137. [Google Scholar] [CrossRef]
- Hirt, S. Whatever Happened to the (Post) Socialist City? Cities 2013, 32, S29–S38. [Google Scholar] [CrossRef]
- Kovács, Z.; Tosics, I. Urban Sprawl on the Danube: The Impacts of Suburbanization in Budapest. In Confronting Suburbanization; Stanilov, K., Sýkora, L., Eds.; John Wiley & Sons, Ltd.: Chichester, UK, 2014; pp. 33–64. [Google Scholar] [CrossRef]
- Hirt, S. Planning during Post-Socialism. In International Encyclopedia of Social and Behavioral Sciences, 2nd ed.; Elsevier: London, UK, 2015; Volume 18, pp. 187–192. [Google Scholar]
- Stanilov, K.; Sýkora, L. Managing Suburbanization in Postsocialist Europe. In Confronting Suburbanization; Stanilov, K., Sýkora, L., Eds.; John Wiley & Sons, Ltd.: Chichester, UK, 2014; pp. 296–320. [Google Scholar] [CrossRef]
- Ferenčuhová, S. Explicit Definitions and Implicit Assumptions about Post-Socialist Cities in Academic Writings: Explicit Definitions and Implicit Assumptions. Geogr. Compass 2016, 10, 514–524. [Google Scholar] [CrossRef]
- Poghosyan, A. Quantifying Urban Growth in 10 Post-Soviet Cities Using Landsat Data and Machine Learning. Int. J. Remote Sens. 2018, 39, 8688–8702. [Google Scholar] [CrossRef]
- Leetmaa, K.; Tammaru, T.; Anniste, K. From Priority-Led to Market-Led Suburbanisation In A Post-Communist Metropolis. Tijdschr. Voor Econ. En Soc. Geogr. 2009, 100, 436–453. [Google Scholar] [CrossRef]
- Krisjane, Z.; Berzins, M. Post-Socialist Urban Trends: New Patterns and Motivations for Migration in the Suburban Areas of Rīga, Latvia. Urban. Stud. 2012, 49, 289–306. [Google Scholar] [CrossRef]
- Spórna, T.; Krzysztofik, R. ‘Inner’ Suburbanisation—Background of the Phenomenon in a Polycentric, Post-Socialist and Post-Industrial Region. Example from the Katowice Conurbation, Poland. Cities 2020, 104, 102789. [Google Scholar] [CrossRef]
- Gentile, M.; Marcińczak, S. Housing Inequalities in Bucharest: Shallow Changes in Hesitant Transition. GeoJournal 2014, 79, 449–465. [Google Scholar] [CrossRef]
- Ianoş, I.; Sîrodoev, I.; Pascariu, G.; Henebry, G. Divergent Patterns of Built-up Urban Space Growth Following Post-Socialist Changes. Urban. Stud. 2016, 53, 3172–3188. [Google Scholar] [CrossRef]
- Urban Europe: Statistics on Cities, Towns and Suburbs, 2016 ed.; Koceva, M.M.; Brandmüller, T.; Lupu, I.; Önnerfors, Å.; Corselli-Nordblad, L.; Coyette, C.; Johansson, A.; Strandell, H.; Wolff, P.; Europäische Kommission (Eds.) Statistical books/Eurostat; Publications Office of the European Union: Luxembourg, 2016. [Google Scholar]
- Schneider, A.; Woodcock, C.E. Compact, Dispersed, Fragmented, Extensive? A Comparison of Urban Growth in Twenty-Five Global Cities Using Remotely Sensed Data, Pattern Metrics and Census Information. Urban. Stud. 2008, 45, 659–692. [Google Scholar] [CrossRef]
- Netzband, M.; Jürgens, C. Urban and Suburban Areas as a Research Topic for Remote Sensing. In Remote Sensing of Urban and Suburban Areas; Rashed, T., Jürgens, C., Eds.; Remote Sensing and Digital Image Processing; Springer: Dordrecht, The Netherlands, 2010; Volume 10, pp. 1–9. [Google Scholar] [CrossRef]
- Alqurashi, A.; Kumar, L.; Sinha, P. Urban Land Cover Change Modelling Using Time-Series Satellite Images: A Case Study of Urban Growth in Five Cities of Saudi Arabia. Remote Sens. 2016, 8, 838. [Google Scholar] [CrossRef] [Green Version]
- Firozjaei; Sedighi; Kiavarz; Qureshi; Haase; Alavipanah. Automated Built-Up Extraction Index: A New Technique for Mapping Surface Built-Up Areas Using LANDSAT 8 OLI Imagery. Remote Sens. 2019, 11, 1966. [Google Scholar] [CrossRef] [Green Version]
- Firozjaei, M.K.; Sedighi, A.; Kiavarz, M.; Qureshi, S.; Haase, D.; Alavipanah, S.K. Monitoring of Urban Sprawl and Densification Processes in Western Germany in the Light of SDG Indicator 11.3.1 Based on an Automated Retrospective Classification Approach. Remote Sens. 2021, 13, 1694. [Google Scholar] [CrossRef]
- Dolean, B.-E.; Bilașco, Ș.; Petrea, D.; Moldovan, C.; Vescan, I.; Roșca, S.; Fodorean, I. Evaluation of the Built-Up Area Dynamics in the First Ring of Cluj-Napoca Metropolitan Area, Romania by Semi-Automatic GIS Analysis of Landsat Satellite Images. Appl. Sci. 2020, 10, 7722. [Google Scholar] [CrossRef]
- Cheng, C.; Yang, X.; Cai, H. Analysis of Spatial and Temporal Changes and Expansion Patterns in Mainland Chinese Urban Land between 1995 and 2015. Remote Sens. 2021, 13, 2090. [Google Scholar] [CrossRef]
- Khanal, N.; Uddin, K.; Matin, M.; Tenneson, K. Automatic Detection of Spatiotemporal Urban Expansion Patterns by Fusing OSM and Landsat Data in Kathmandu. Remote Sens. 2019, 11, 2296. [Google Scholar] [CrossRef] [Green Version]
- Maktav, D.; Erbek, F.S.; Jürgens, C. Remote Sensing of Urban Areas. Int. J. Remote Sens. 2005, 26, 655–659. [Google Scholar] [CrossRef]
- Leinenkugel, P.; Deck, R.; Huth, J.; Ottinger, M.; Mack, B. The Potential of Open Geodata for Automated Large-Scale Land Use and Land Cover Classification. Remote Sens. 2019, 11, 2249. [Google Scholar] [CrossRef] [Green Version]
- Ranagalage, M.; Estoque, R.; Handayani, H.; Zhang, X.; Morimoto, T.; Tadono, T.; Murayama, Y. Relation between Urban Volume and Land Surface Temperature: A Comparative Study of Planned and Traditional Cities in Japan. Sustainability 2018, 10, 2366. [Google Scholar] [CrossRef] [Green Version]
- Ellen, D.; Patrick, H. Assessing Post-Socialist Urban Change with Landsat Data; Case Study Berlin, Germany. In 2007 Urban Remote Sensing Joint Event; IEEE: Paris, France, 2007; pp. 1–4. [Google Scholar] [CrossRef]
- Kanjir, U.; Veljanovski, T.; Ostir, K. Change Detection of Urban Areas—the Ljubljana, Slovenia Case Study. In 2011 Joint Urban Remote Sensing Event; IEEE: Munich, Germany, 2011; pp. 425–428. [Google Scholar] [CrossRef]
- Franke, D. Development of Suburbanization in the Hinterland of Prague Monitored by Remote Sensing. In Proceedings of the SGEM 2015 Conference, Albena, Bulgaria, 16–24 June 2015; Volume 1, pp. 1027–1034. [Google Scholar] [CrossRef]
- Mihai, B.; Nistor, C.; Simion, G. Post-Socialist Urban Growth of Bucharest, Romania—a Change Detection Analysis on Landsat Imagery (1984–2010). Acta Geogr. Slov. 2015, 55, 223–234. [Google Scholar] [CrossRef] [Green Version]
- Institutul Național de Statistică (National Institute of Statistics). Anuarul Statistic al României—Serii de Timp (CD-ROM); Bucharest, Romania, 2020. [Google Scholar]
- Pîrvu, R.; Bădîrcea, R.; Manta, A.; Lupăncescu, M. The Effects of the Cohesion Policy on the Sustainable Development of the Development Regions in Romania. Sustainability 2018, 10, 2577. [Google Scholar] [CrossRef] [Green Version]
- Sýkora, L.; Mulíček, O. Prague: Urban Growth and Regional Sprawl. In Confronting Suburbanization; Stanilov, K., Sýkora, L., Eds.; John Wiley & Sons, Ltd.: Chichester, UK, 2014; pp. 133–162. [Google Scholar] [CrossRef]
- Hansen, M.C.; Loveland, T.R. A Review of Large Area Monitoring of Land Cover Change Using Landsat Data. Remote Sens. Environ. 2012, 122, 66–74. [Google Scholar] [CrossRef]
- Rujoiu-Mare, M.-R.; Olariu, B.; Mihai, B.-A.; Nistor, C.; Săvulescu, I. Land Cover Classification in Romanian Carpathians and Subcarpathians Using Multi-Date Sentinel-2 Remote Sensing Imagery. Eur. J. Remote Sens. 2017, 50, 496–508. [Google Scholar] [CrossRef] [Green Version]
- Yoshida, T.; Omatu, S. Neural Network Approach to Land Cover Mapping. IEEE Trans. Geosci. Remote Sens. 1994, 32, 1103–1109. [Google Scholar] [CrossRef]
- Dreiseitl, S.; Ohno-Machado, L. Logistic Regression and Artificial Neural Network Classification Models: A Methodology Review. J. Biomed. Inform. 2002, 35, 352–359. [Google Scholar] [CrossRef] [Green Version]
- Ndehedehe, C.; Ekpa, A.; Simeon, O.; Nse, O. Understanding the Neural Network Technique for Classification of Remote Sensing Data Sets. NY Sci. J. 2013, 6, 26–33. [Google Scholar]
- Debojit, B.J.H.; Arora Manoj, K.; Balasubramanian, R. Study and Implementation of a Non-Linear Support Vector Machine Classifier. Int. J. Earth Sci. Eng. 2011, 4, 985–988. [Google Scholar]
- Ndehedehe, C.E.; Oludiji, S.M.; Asuquo, I. Supervised Learning Methods in the Mapping of Built up Areas from Landsat-Based Satellite Imagery in Part of Uyo Metropolis. NY Sci. J. 2013, 6, 45–52. [Google Scholar]
- Mukherjee, A.; Kumar, A.A.; Ramachandran, P. Development of New Index-Based Methodology for Extraction of Built-Up Area from Landsat7 Imagery: Comparison of Performance With SVM, ANN, and Existing Indices. IEEE Trans. Geosci. Remote Sens. 2021, 59, 1592–1603. [Google Scholar] [CrossRef]
- Zhang, T.; Tang, H. Evaluating the Generalization Ability of Convolutional Neural Networks for Built-up Area Extraction in Different Cities of China. Optoelectron. Lett. 2020, 16, 52–58. [Google Scholar] [CrossRef]
- Chuvieco, E. Fundamentals of Satellite Remote Sensing: An Environmental Approach, 2nd ed.; CRC Press: Boca Raton, FL, USA, 2016. [Google Scholar] [CrossRef]
- Lewis, H.G.; Brown, M. A Generalized Confusion Matrix for Assessing Area Estimates from Remotely Sensed Data. Int. J. Remote Sens. 2001, 22, 3223–3235. [Google Scholar] [CrossRef]
- Machado, R.; Bayot, R.; Godinho, S.; Pirnat, J.; Santos, P.; de Sousa-Neves, N. LDTtool: A Toolbox to Assess Landscape Dynamics. Environ. Model. Softw. 2020, 133, 104847. [Google Scholar] [CrossRef]
- Machado, R.; Godinho, S.; Pirnat, J.; Neves, N.; Santos, P. Assessment of Landscape Composition and Configuration via Spatial Metrics Combination: Conceptual Framework Proposal and Method Improvement. Landsc. Res. 2018, 43, 652–664. [Google Scholar] [CrossRef]
- Strategia de Dezvoltare a Județului Ilfov 2020–2030, Sinteza. Consiliul Județean Ilfov, The World Bank. March 2020.
- Sýkora, L.; Stanilov, K. The Challenge of Postsocialist Suburbanization. In Confronting Suburbanization; John Wiley & Sons, Ltd.: Chichester, UK, 2014; pp. 1–32. [Google Scholar] [CrossRef]
- Gheorghe, K.; Ines, G. Urban Growth in the Bucharest Metropolitan Area: Spatial and Temporal Assessment Using Logistic Regression. J. Urban. Plan. Dev. 2018, 144, 05017013. [Google Scholar] [CrossRef]
- Pătroescu, M.; Vânău, G.; Niţă, M.R.; Iojă, C.; Iojă, A. Land Use Change in the Bucharest Metropolitan Area and Its Impacts on the Quality of the Environment in Residential Developments. Forum Geogr. 2011, 10, 177–186. [Google Scholar] [CrossRef]
- Flanders Investment&Trade. Construction-Real Estate Sector in Romania; Flanders Investment&Trade: Bucharest, Romania, 2018. [Google Scholar]
- Negescu, O. Efectele Crizei Financiare Şi Ale Evoluţiei Pieţei Imobiliare Asupra Sectorului Construcţiilor Din România. In Analiză şi Evaluare Economico-Financiară. Provocări pe Piaţa Imobiliară; Academia de Studii Economice Bucureşti: Bucharest, Romania, 2013; pp. 28–42. [Google Scholar]
- Tosa, C.; Mitrea, A.; Sato, H.; Miwa, T.; Morikawa, T. Economic Growth and Urban Metamorphosis: A Quarter Century of Transformations within the Metropolitan Area of Bucharest. J. Transp. Land Use 2018, 11, 273–295. [Google Scholar] [CrossRef] [Green Version]
- Pascariu, G. Overview of Romanian Planning Evolution. In Proceedings of AESOP 26th Annual Congress; METU: Ankara, Turkey, 2012. [Google Scholar]
- Ianoş, I.; Sorensen, A.; Merciu, C. Incoherence of Urban Planning Policy in Bucharest: Its Potential for Land Use Conflict. Land Use Policy 2017, 60, 101–112. [Google Scholar] [CrossRef]
- Grigorescu, I.; Kucsicsa, G.; Popovici, E.-A.; Mitrică, B.; Mocanu, I.; Dumitraşcu, M. Modelling Land Use/Cover Change to Assess Future Urban Sprawl in Romania. Geocarto Int. 2021, 36, 721–739. [Google Scholar] [CrossRef]
- Stoica, I.V.; Tălângă, C.; Braghină, C.; Zamfir, D. Ways of Managing the Urban-Rural Interface. Case Study: Bucharest. Analele Univ. Din. Oradea—Ser. Geogr. 2011, 21, 313–322. [Google Scholar]
- Ianos, I.; Zamfir, D.; Stoica, V.; Cercleux, L.; Schvab, A.; Pascariu, G. Municipal Solid Waste Management For Sustainable Development Of Bucharest Metropolitan Area. Environ. Eng. Manag. J. 2012, 11, 359–369. [Google Scholar] [CrossRef]
- PeiSer, R. Decomposing Urban Sprawl. Town Plan. Rev. 2001, 72, 275–298. [Google Scholar] [CrossRef]
- Rusu, A.; Ursu, A.; Stoleriu, C.C.; Groza, O.; Niacșu, L.; Sfîcă, L.; Minea, I.; Stoleriu, O.M. Structural Changes in the Romanian Economy Reflected through Corine Land Cover Datasets. Remote Sens. 2020, 12, 1323. [Google Scholar] [CrossRef] [Green Version]
- Jat, M.K.; Garg, P.K.; Khare, D. Monitoring and Modelling of Urban Sprawl Using Remote Sensing and GIS Techniques. Int. J. Appl. Earth Obs. Geoinf. 2008, 10, 26–43. [Google Scholar] [CrossRef]
- Dewan, A.M.; Yamaguchi, Y. Land Use and Land Cover Change in Greater Dhaka, Bangladesh: Using Remote Sensing to Promote Sustainable Urbanization. Appl. Geogr. 2009, 29, 390–401. [Google Scholar] [CrossRef]
- Estoque, R.C.; Murayama, Y. Intensity and Spatial Pattern of Urban Land Changes in the Megacities of Southeast Asia. Land Use Policy 2015, 48, 213–222. [Google Scholar] [CrossRef]
- Zeng, C.; Liu, Y.; Liu, Y.; Qiu, L. Urban Sprawl and Related Problems: Bibliometric Analysis and Refined Analysis from 1991 to 2011. Chin. Geogr. Sci. 2014, 24, 245–257. [Google Scholar] [CrossRef]
- Luo, J.; Xing, X.; Wu, Y.; Zhang, W.; Chen, R.S. Spatio-Temporal Analysis on Built-up Land Expansion and Population Growth in the Yangtze River Delta Region, China: From a Coordination Perspective. Appl. Geogr. 2018, 96, 98–108. [Google Scholar] [CrossRef]
- Krishna, A.P.; Mitra, S.K. Geoinformatics Based Environmental Quality Assessment of Physical Parameters of Urbanization: Case Study of Ranchi City, India; Map Asia: Kuala Lumpur, Malaysia, 2007. [Google Scholar]
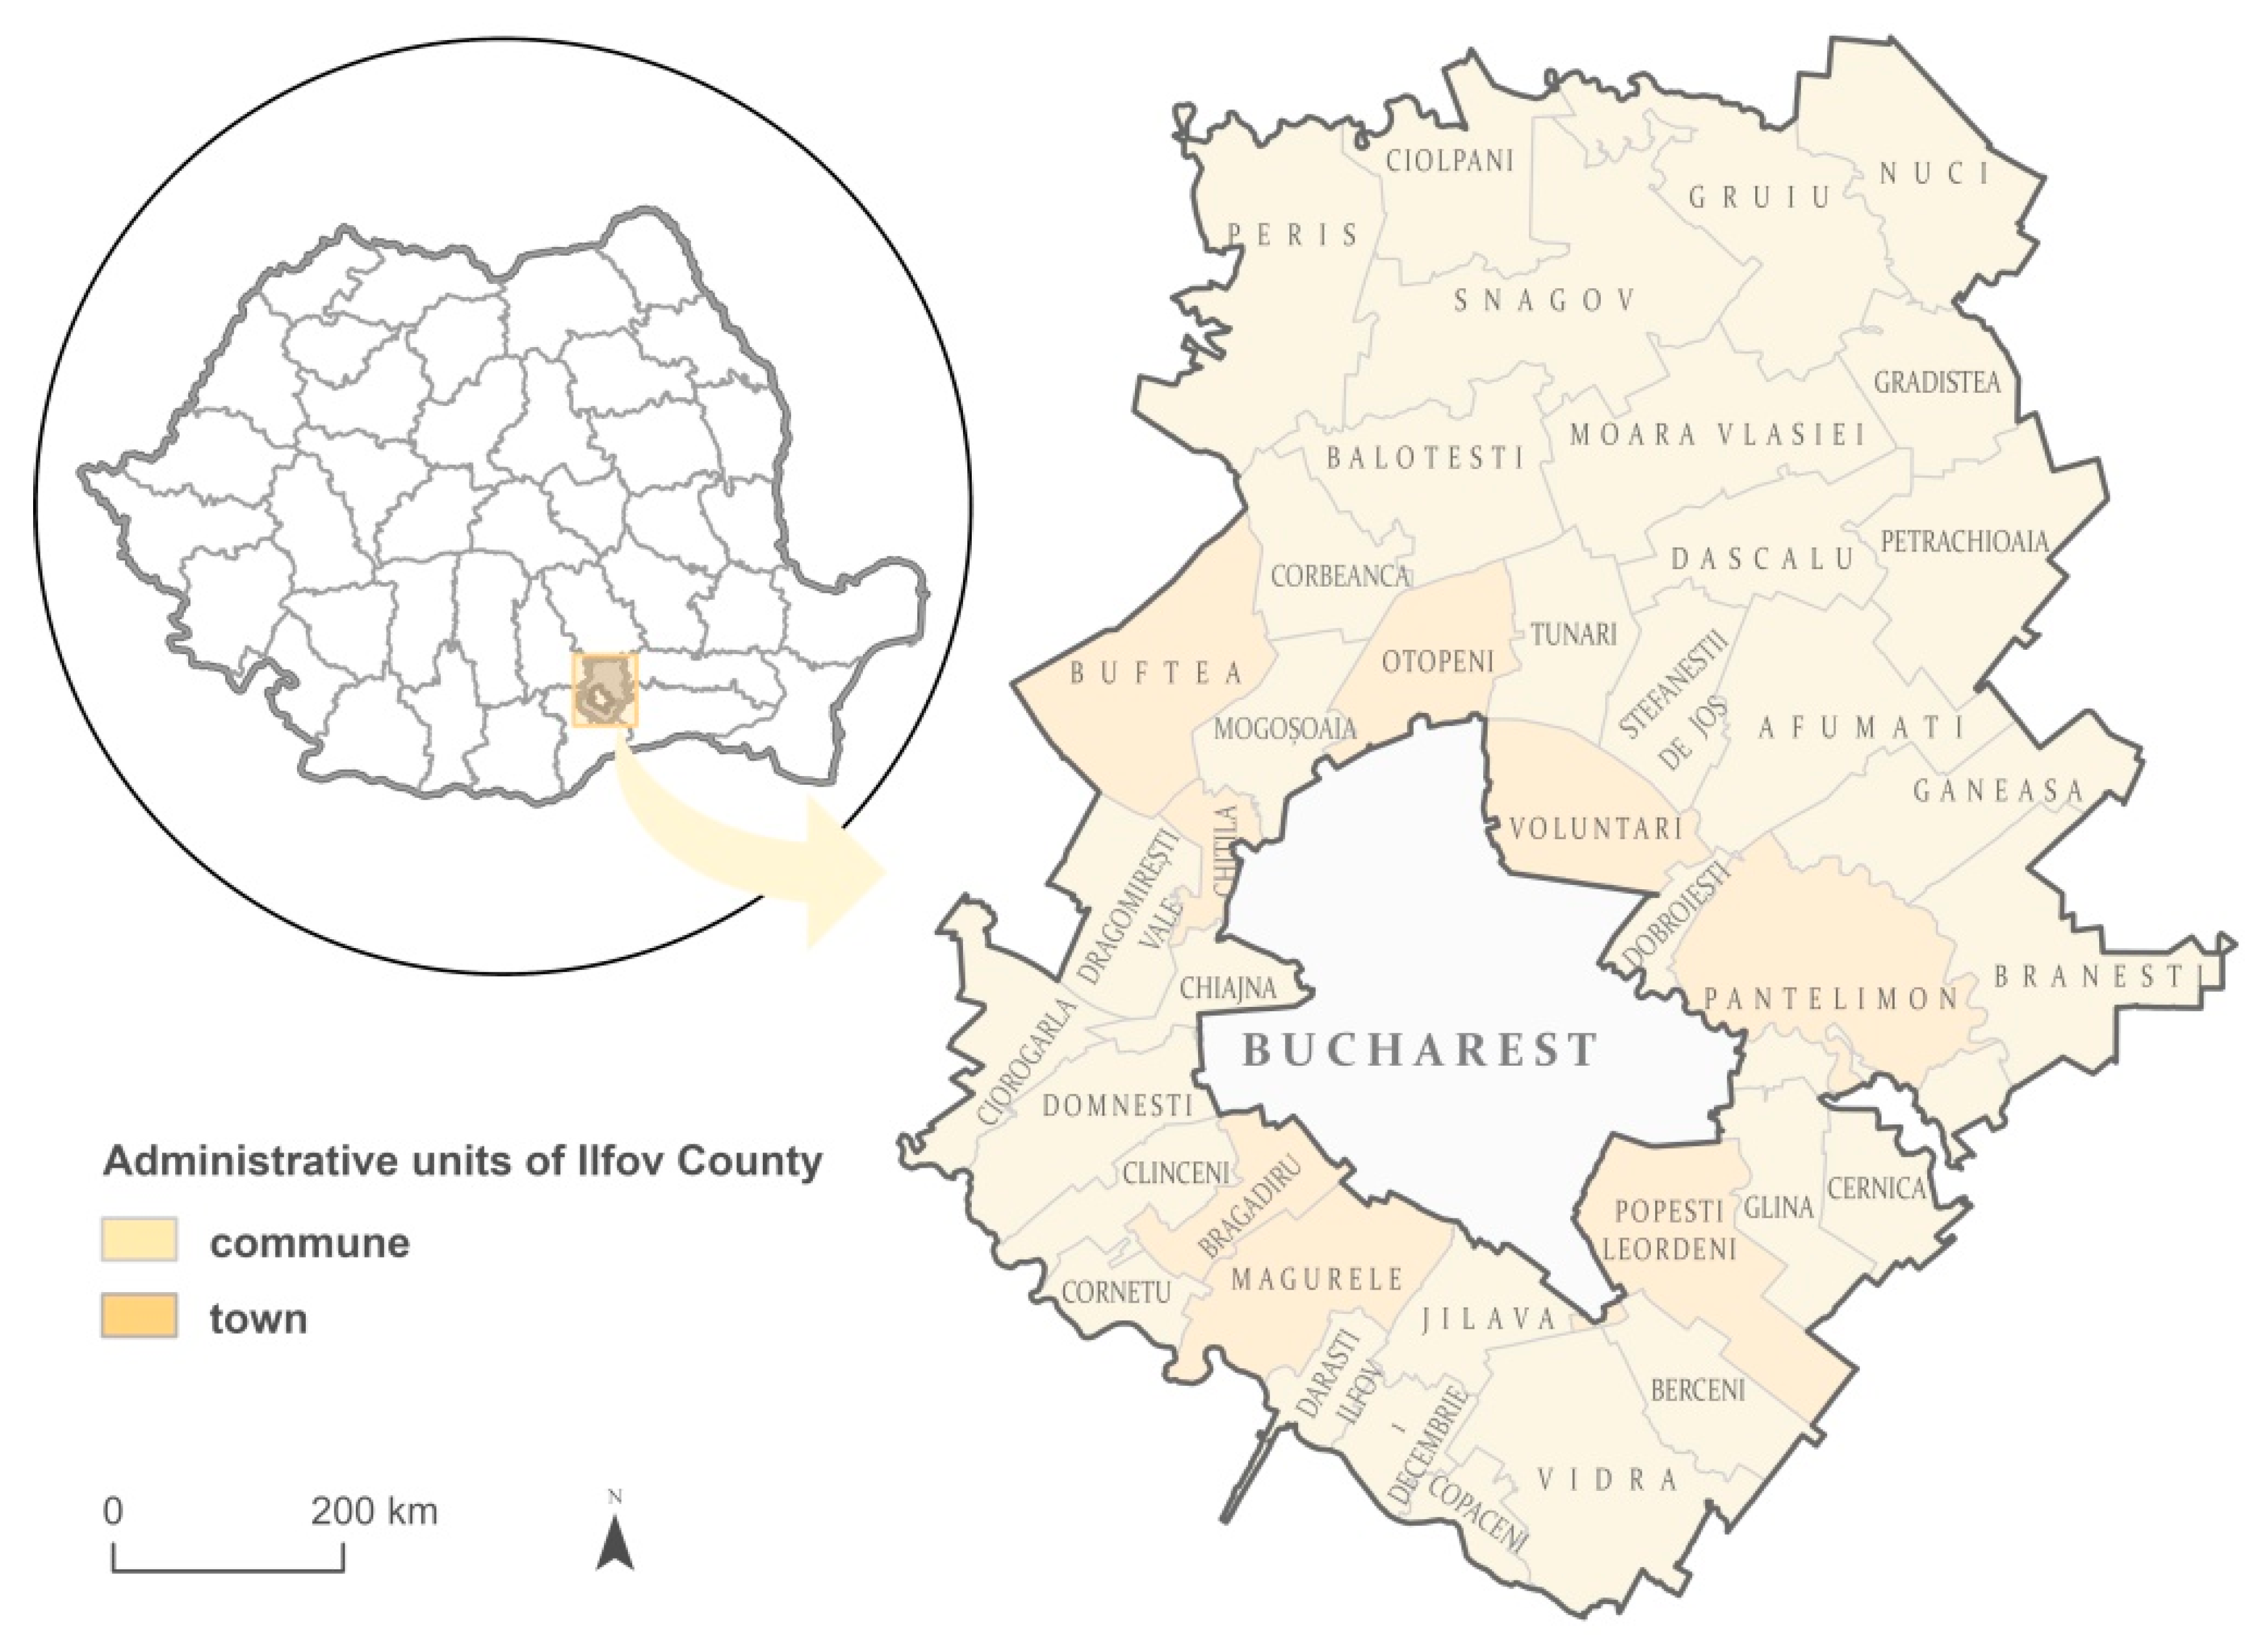
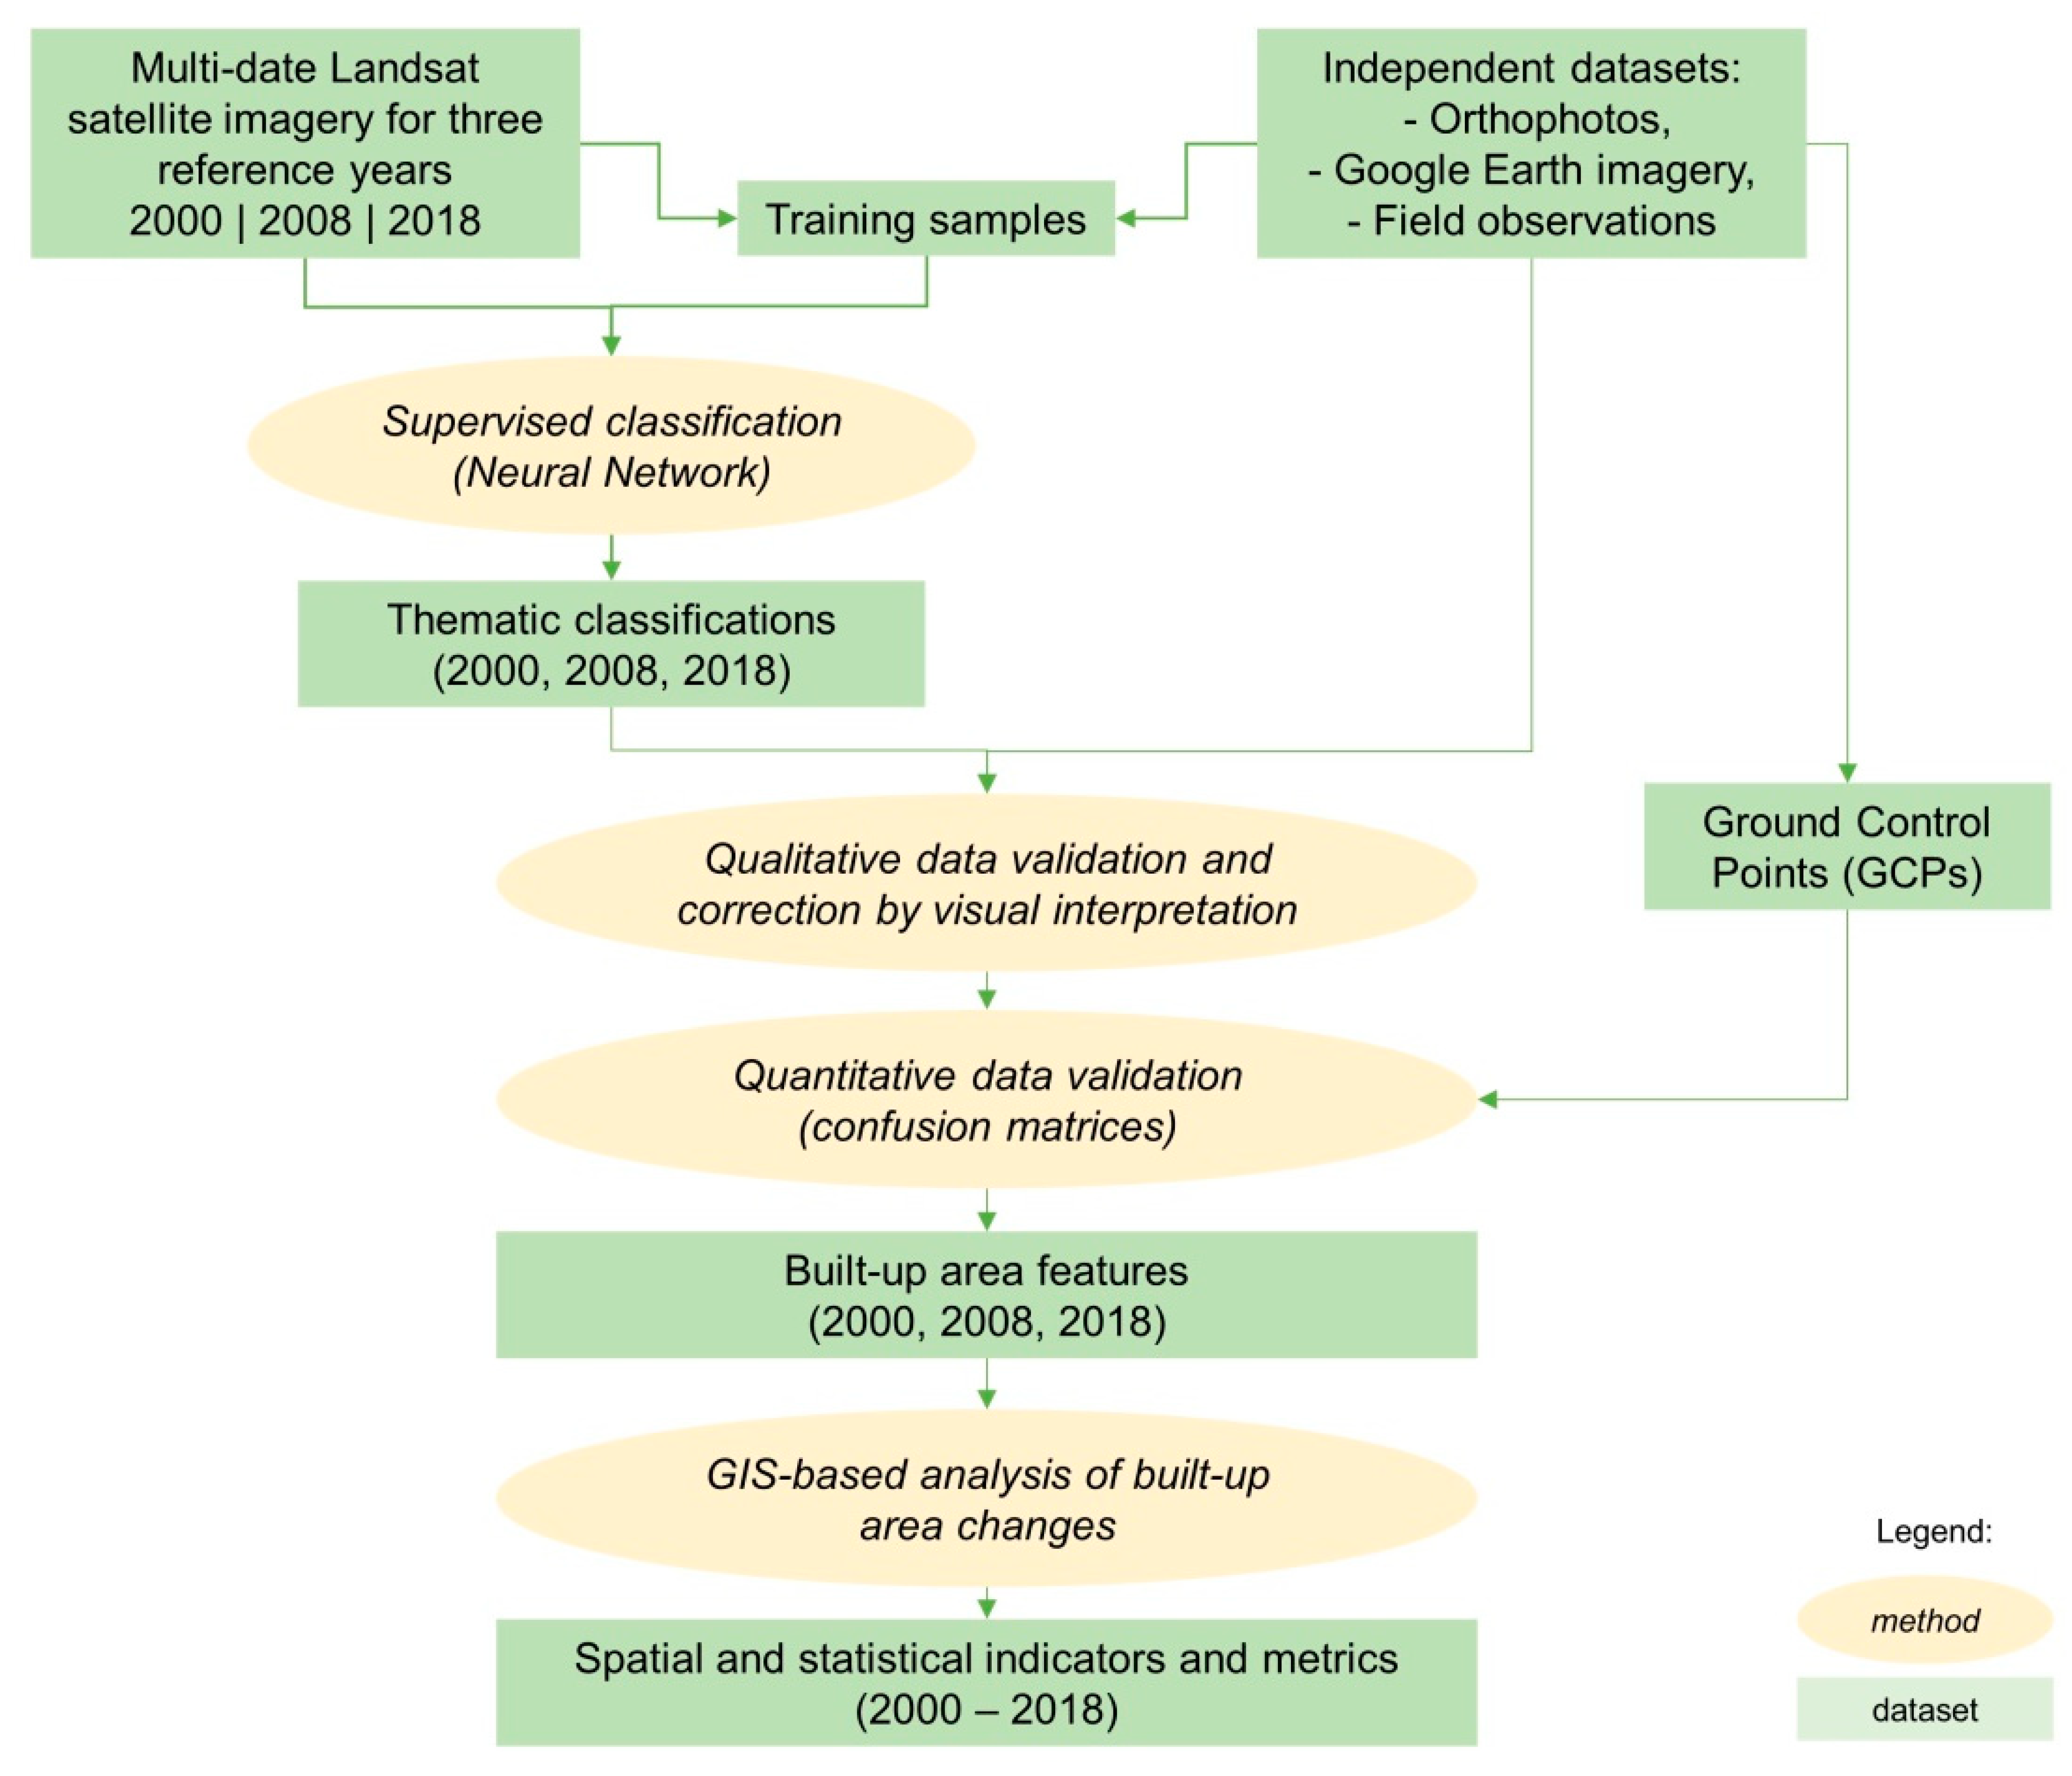
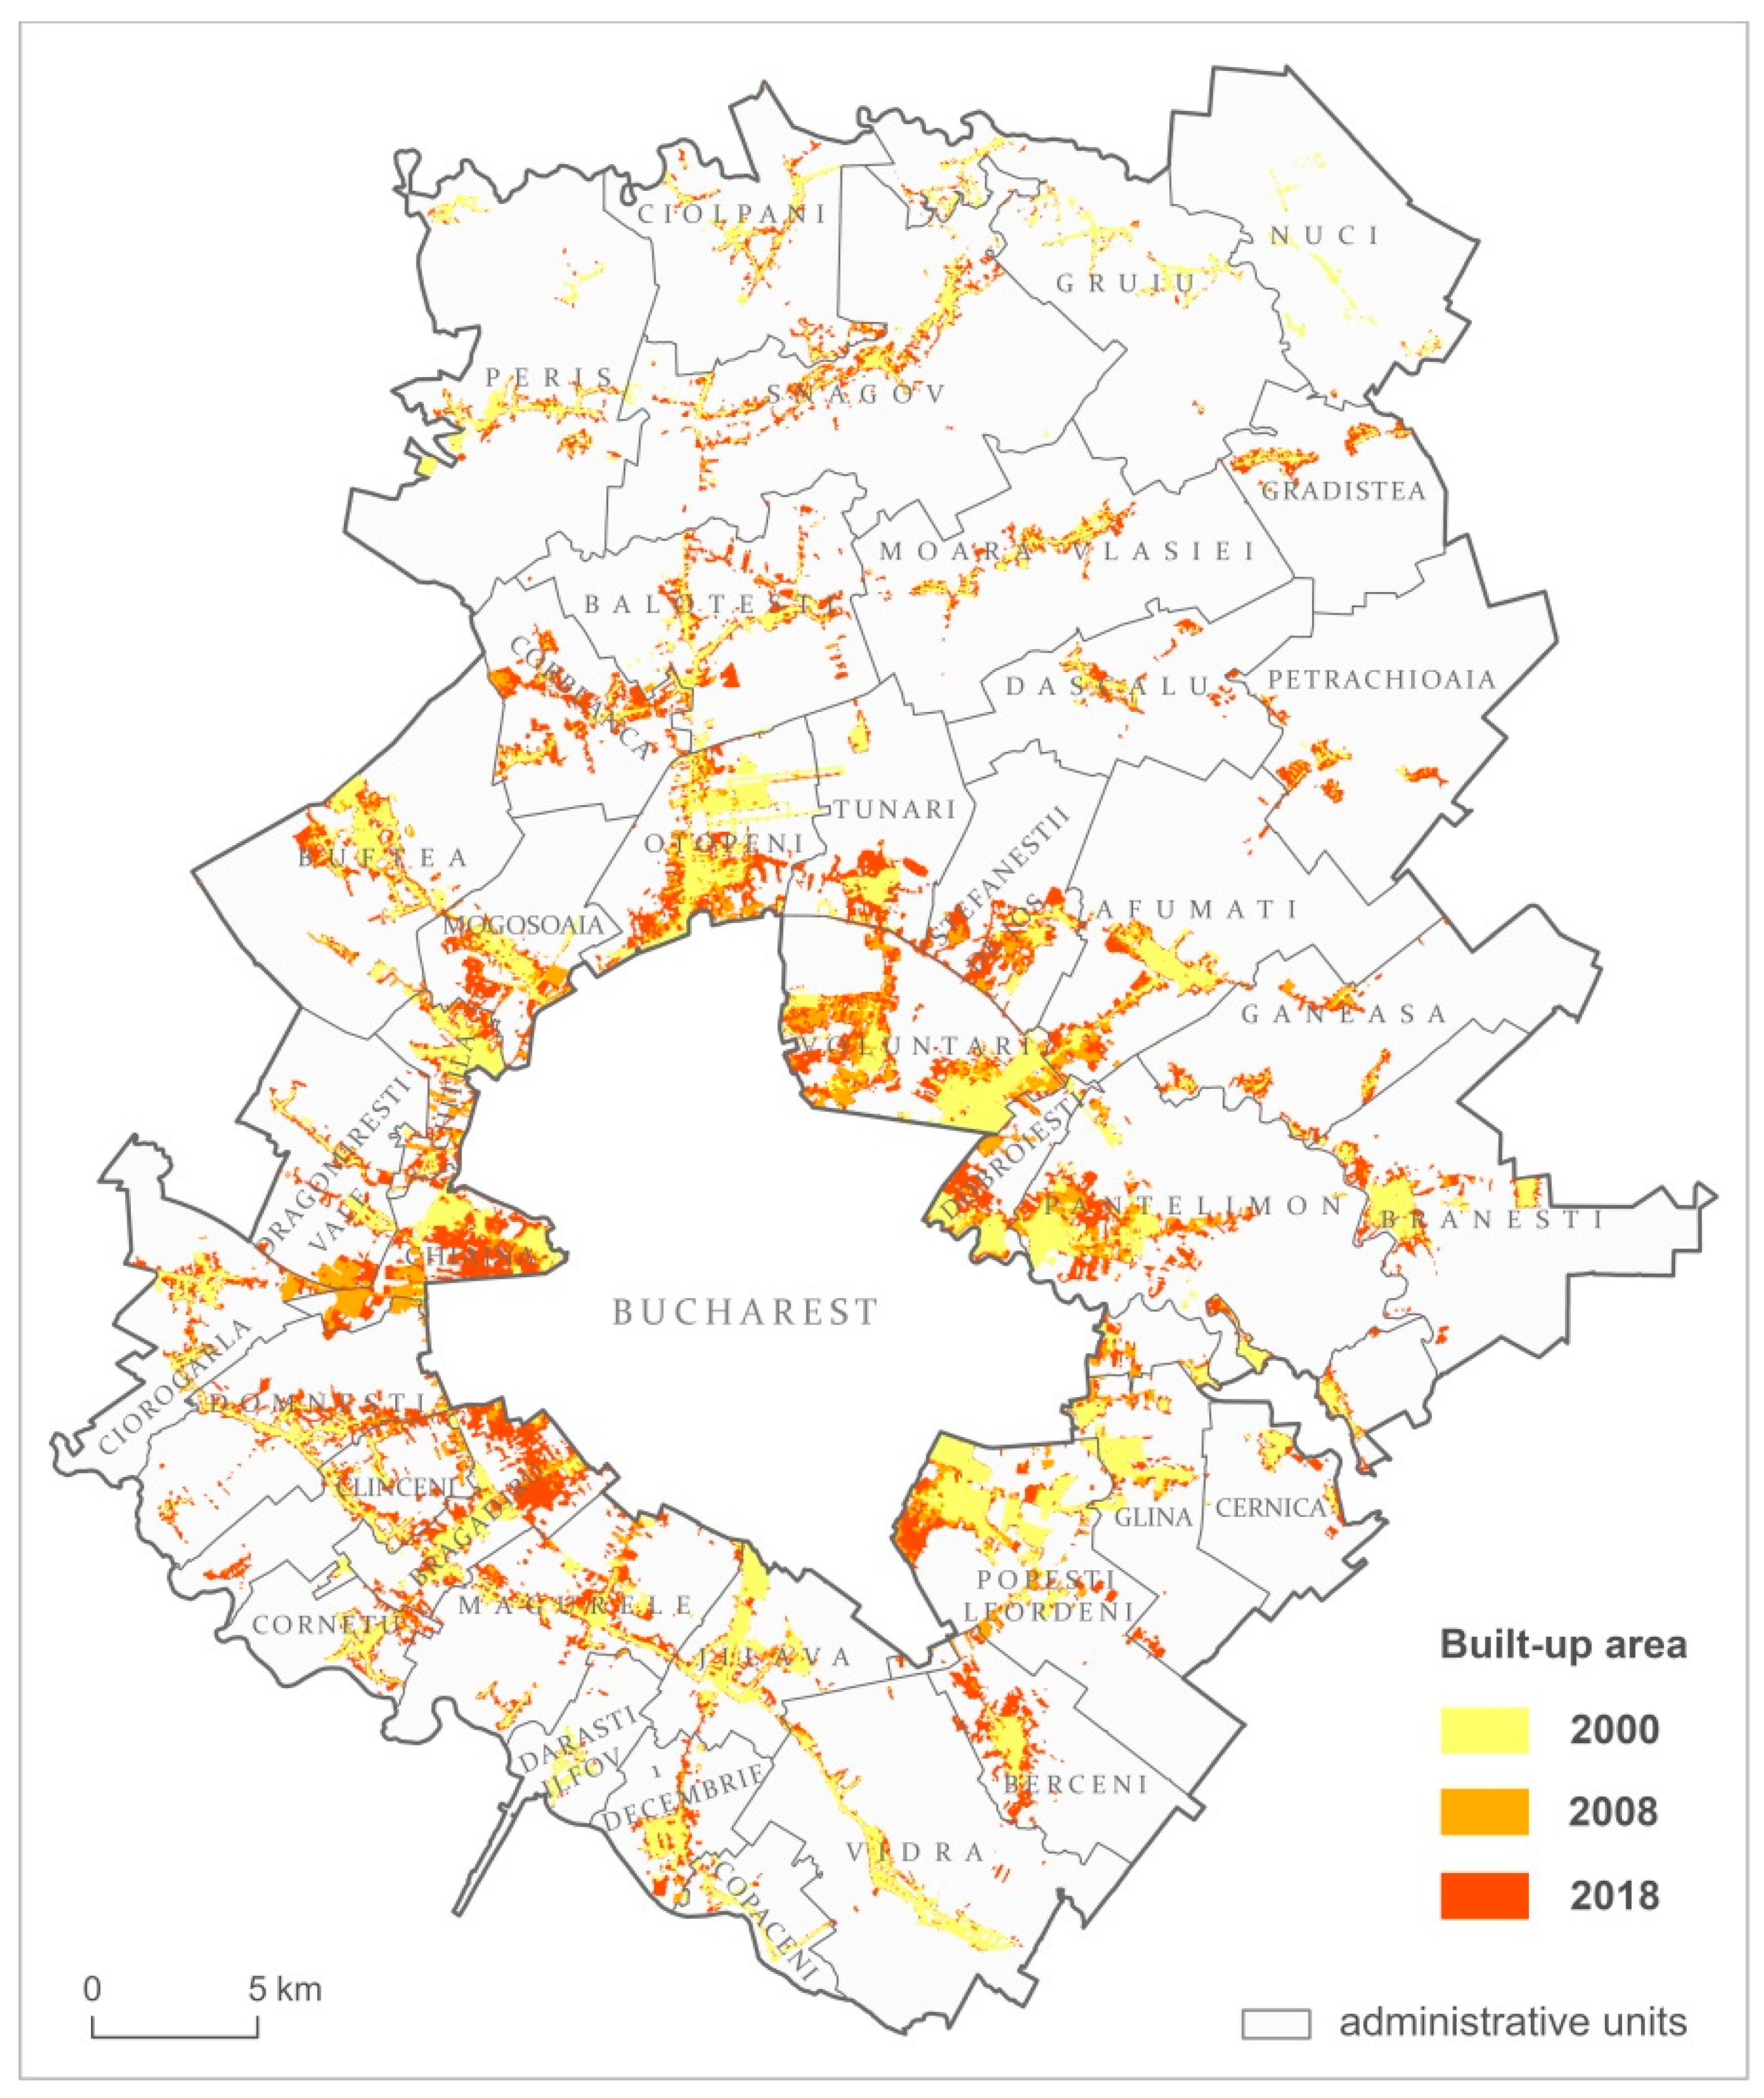

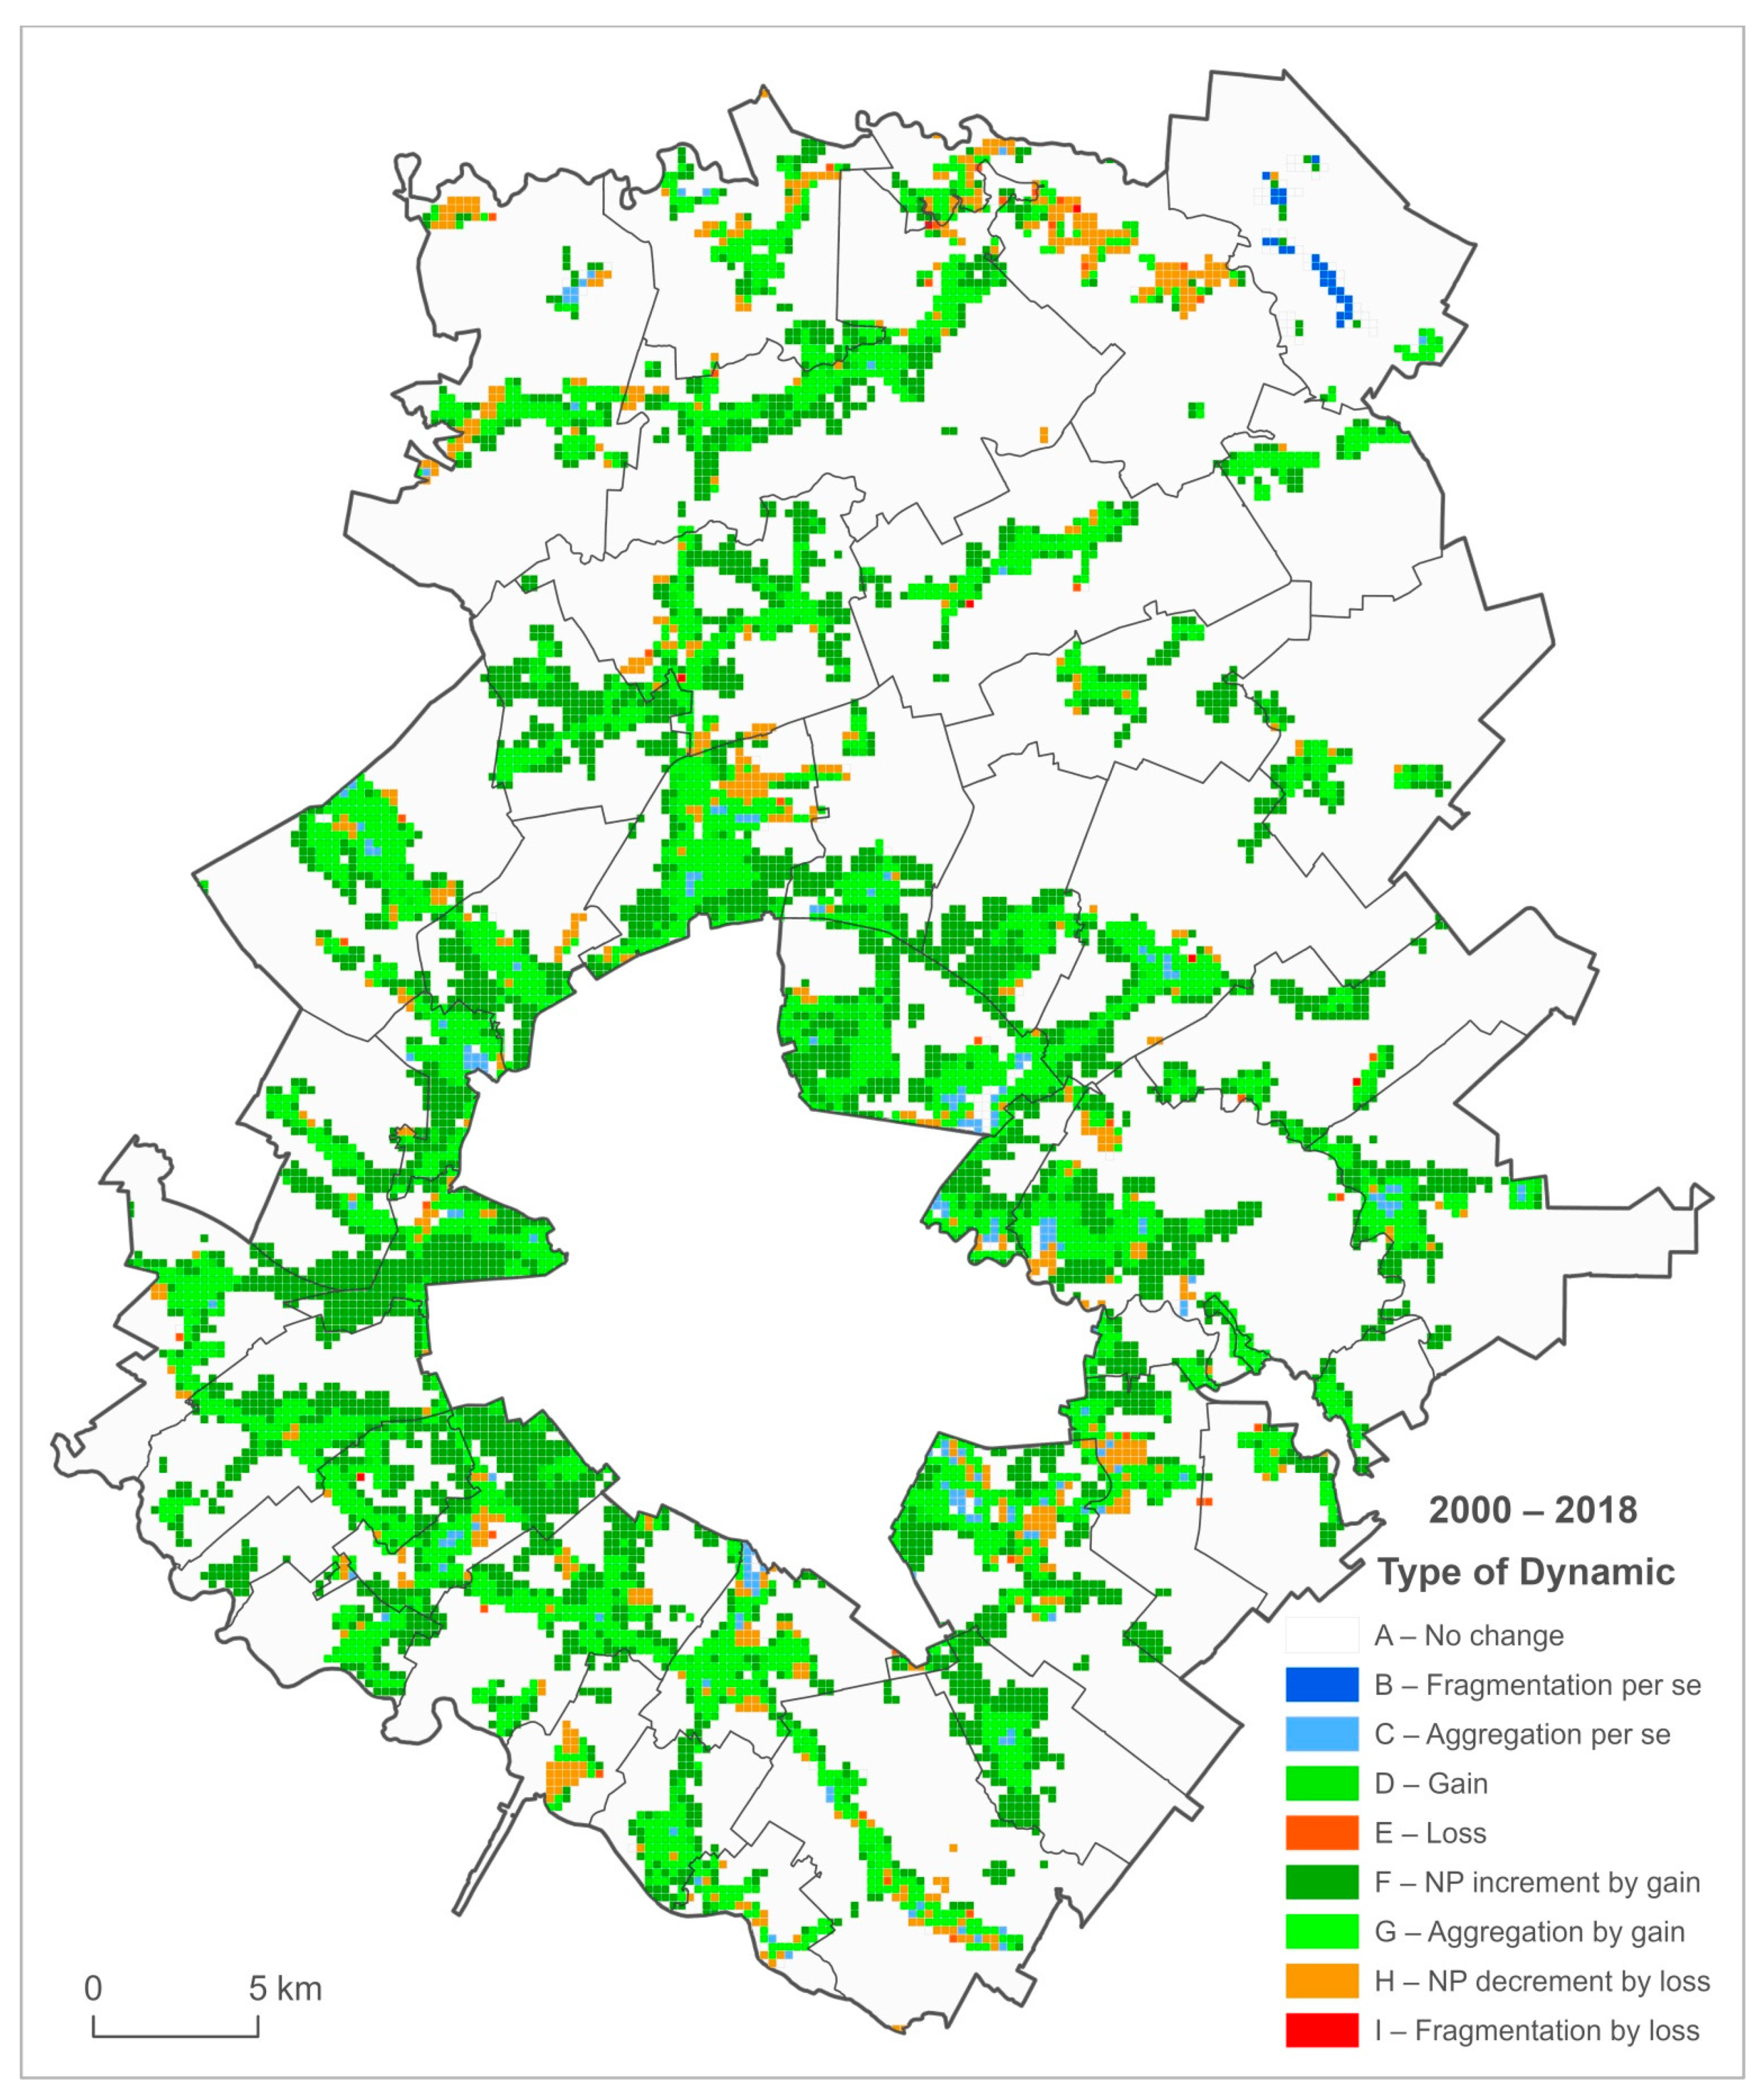
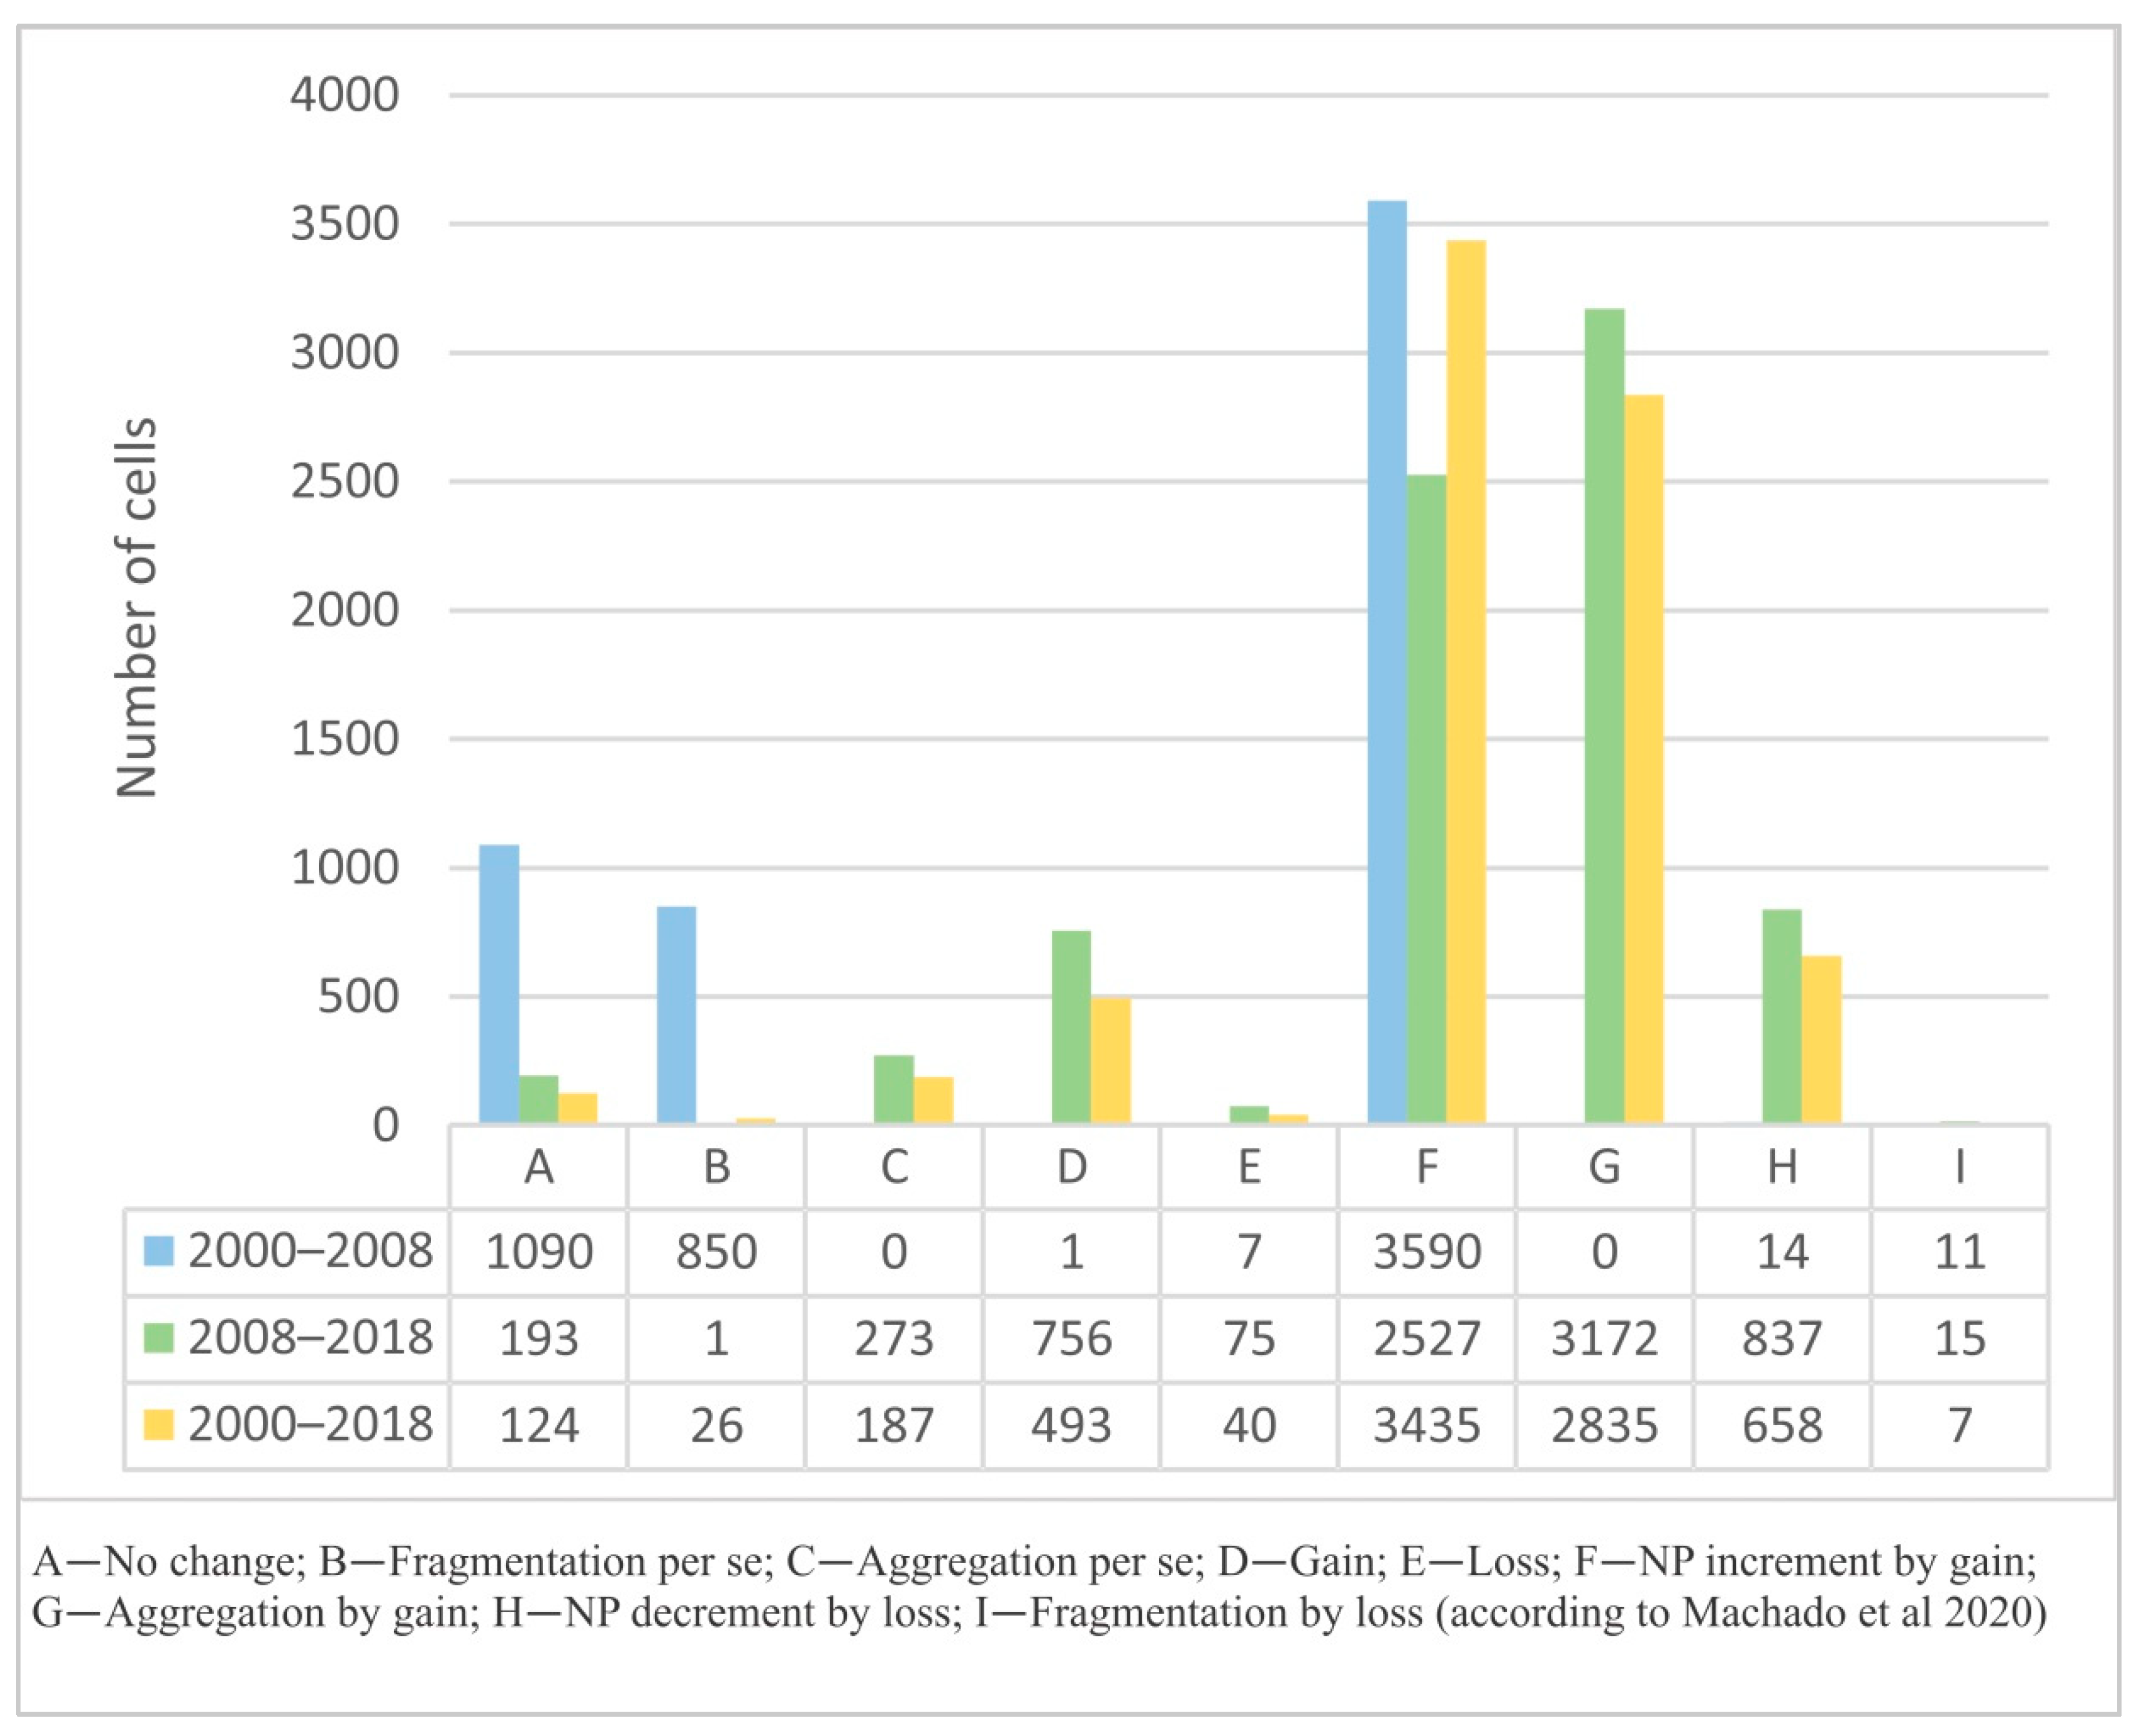
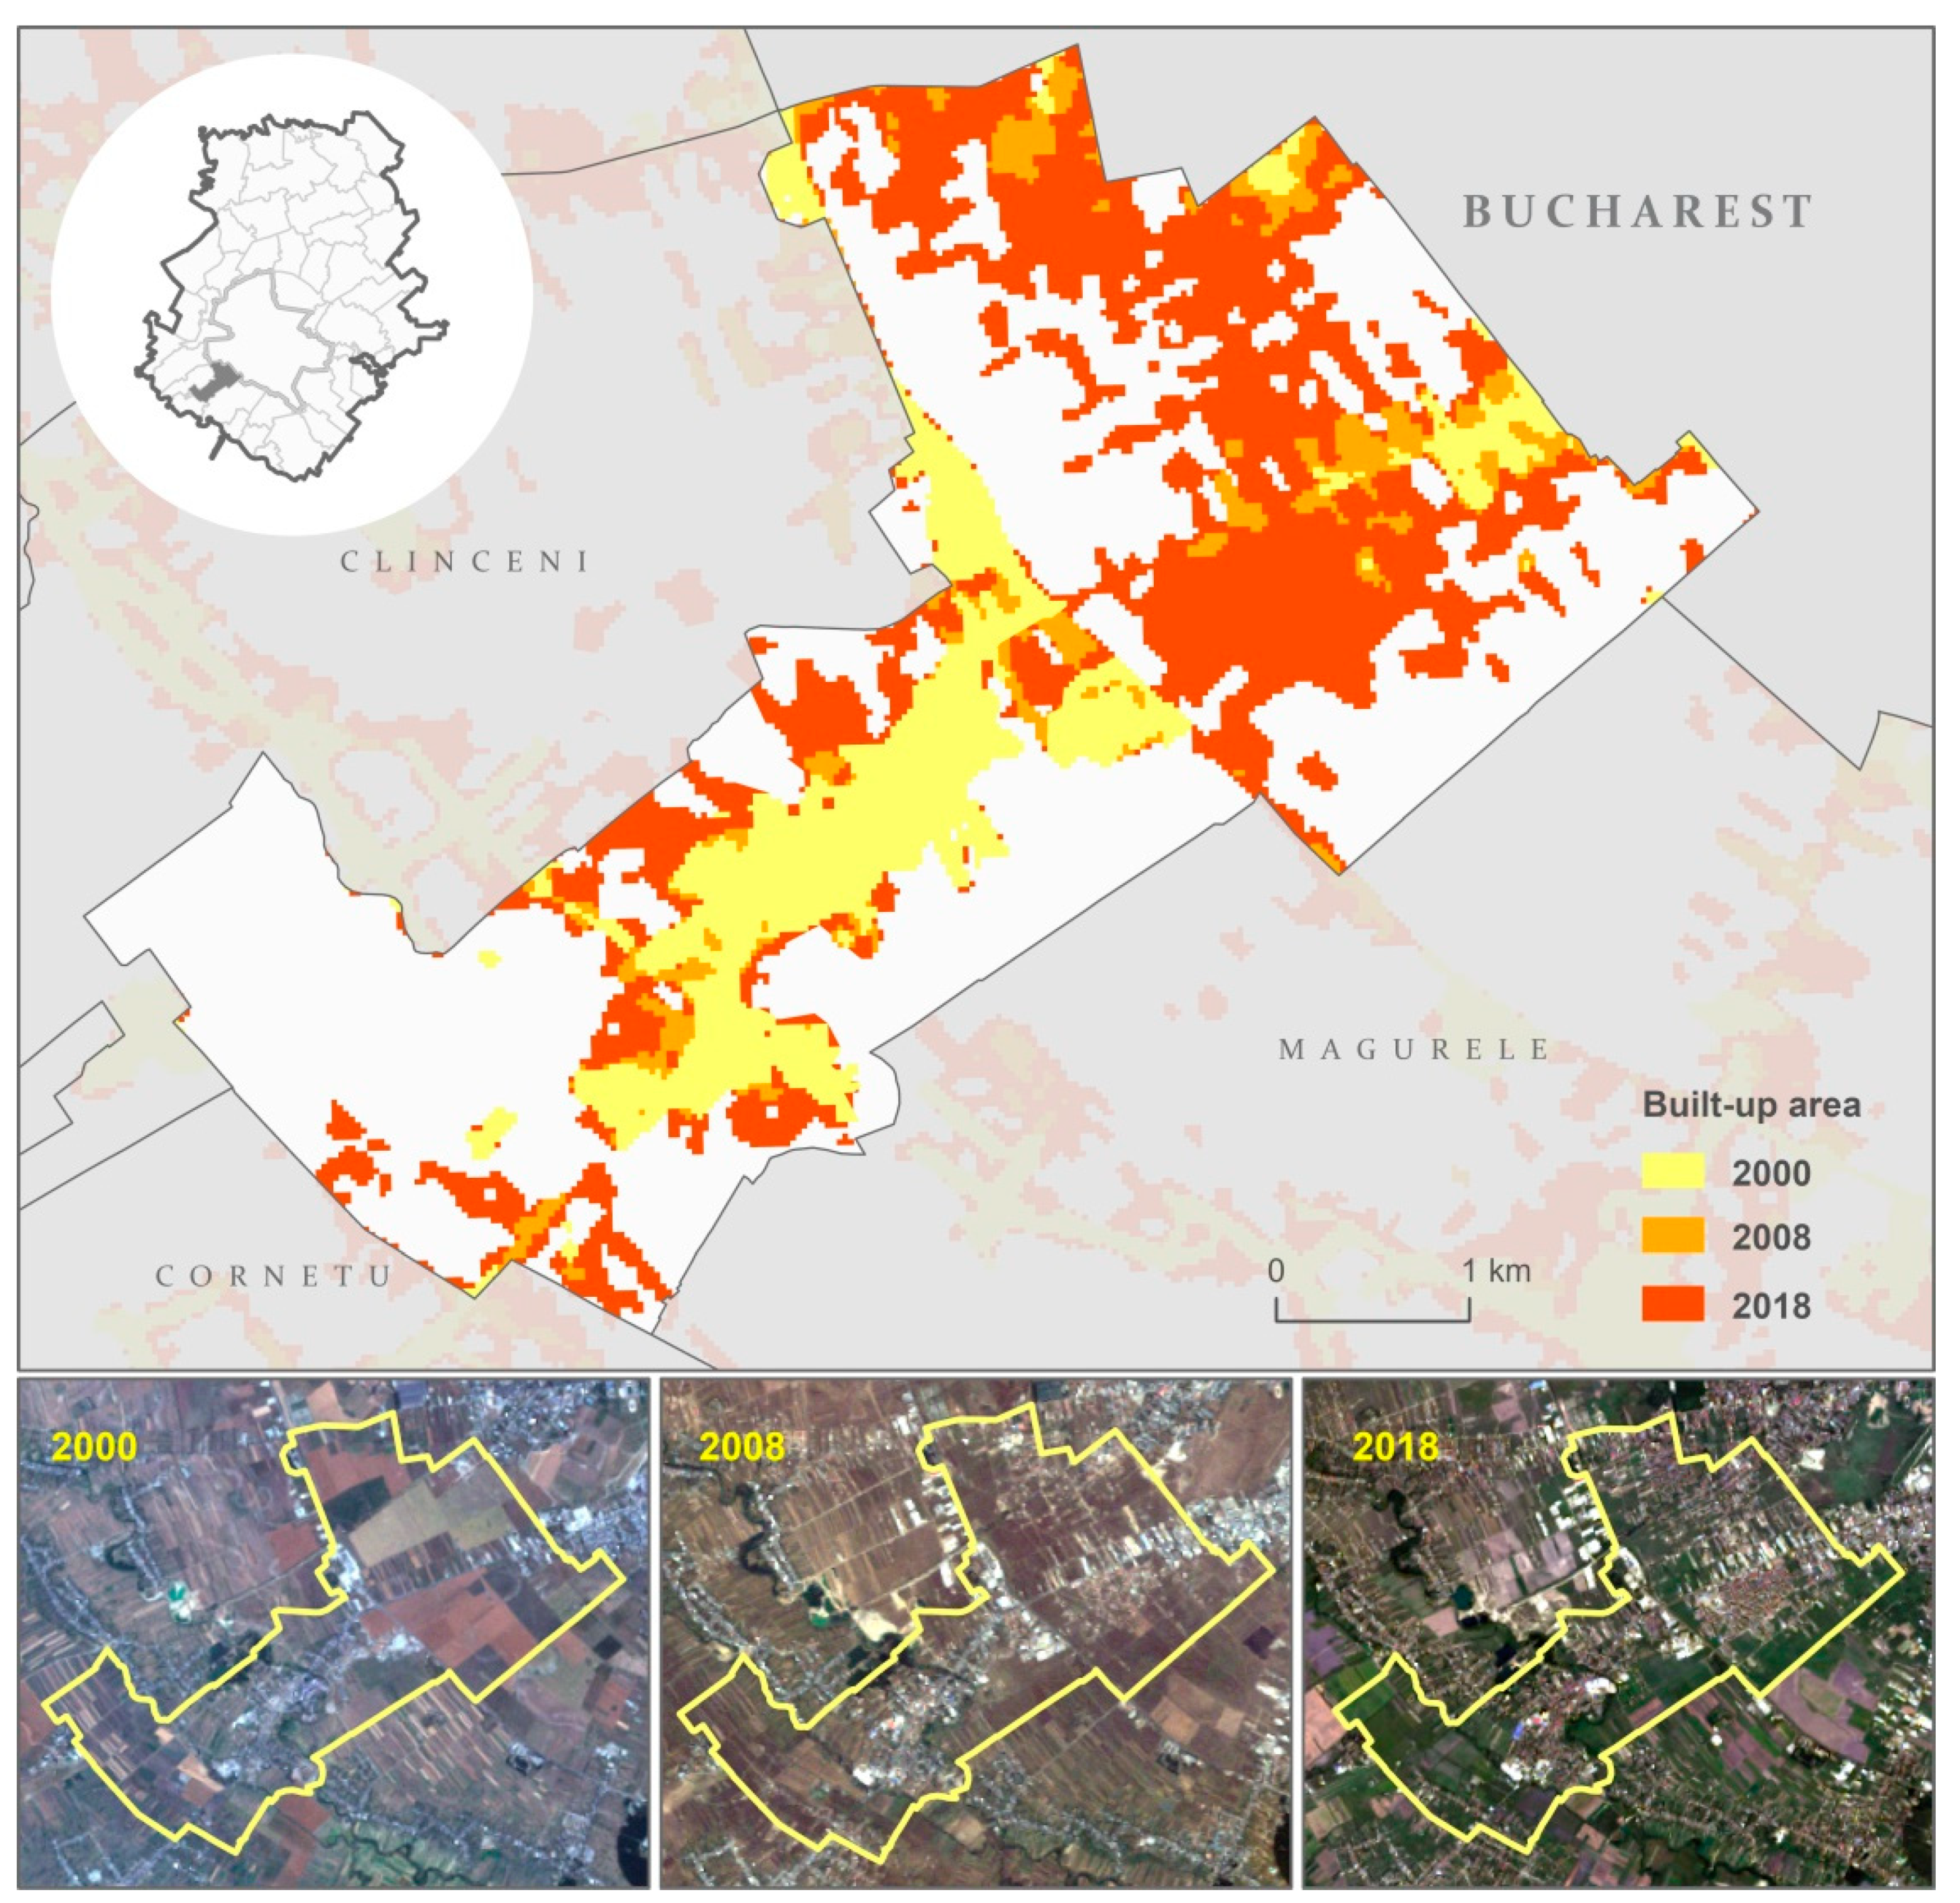
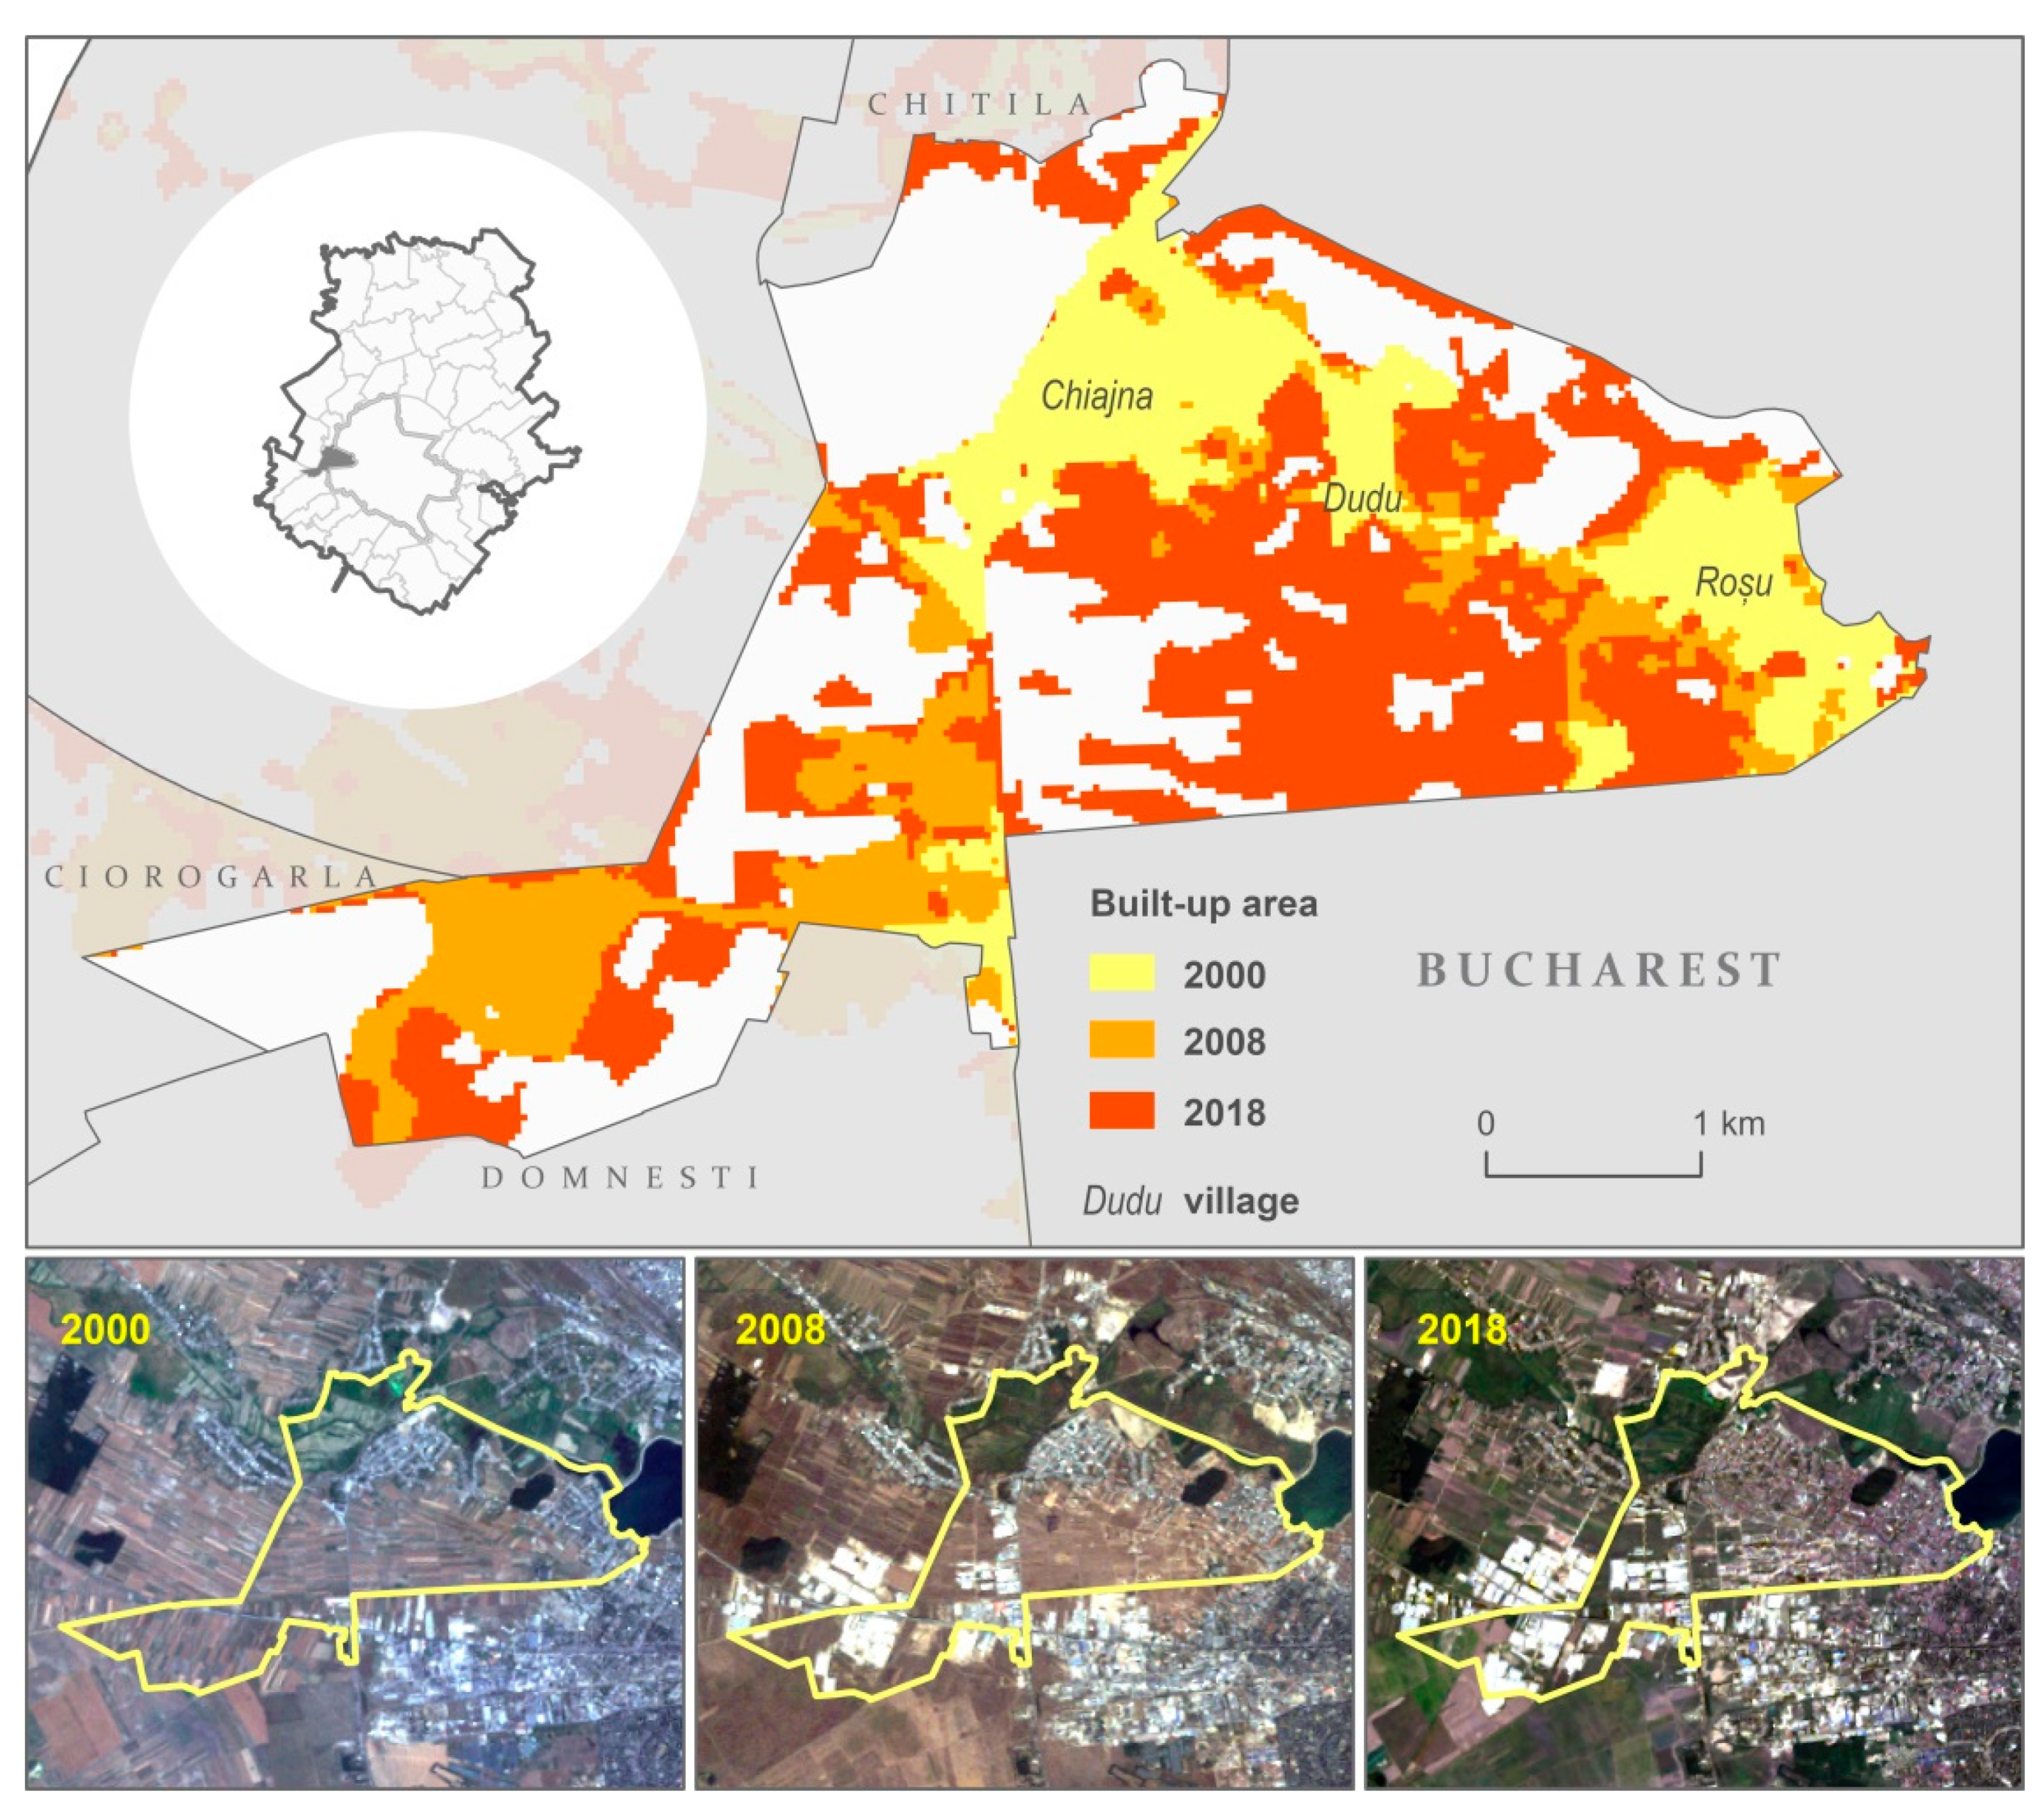
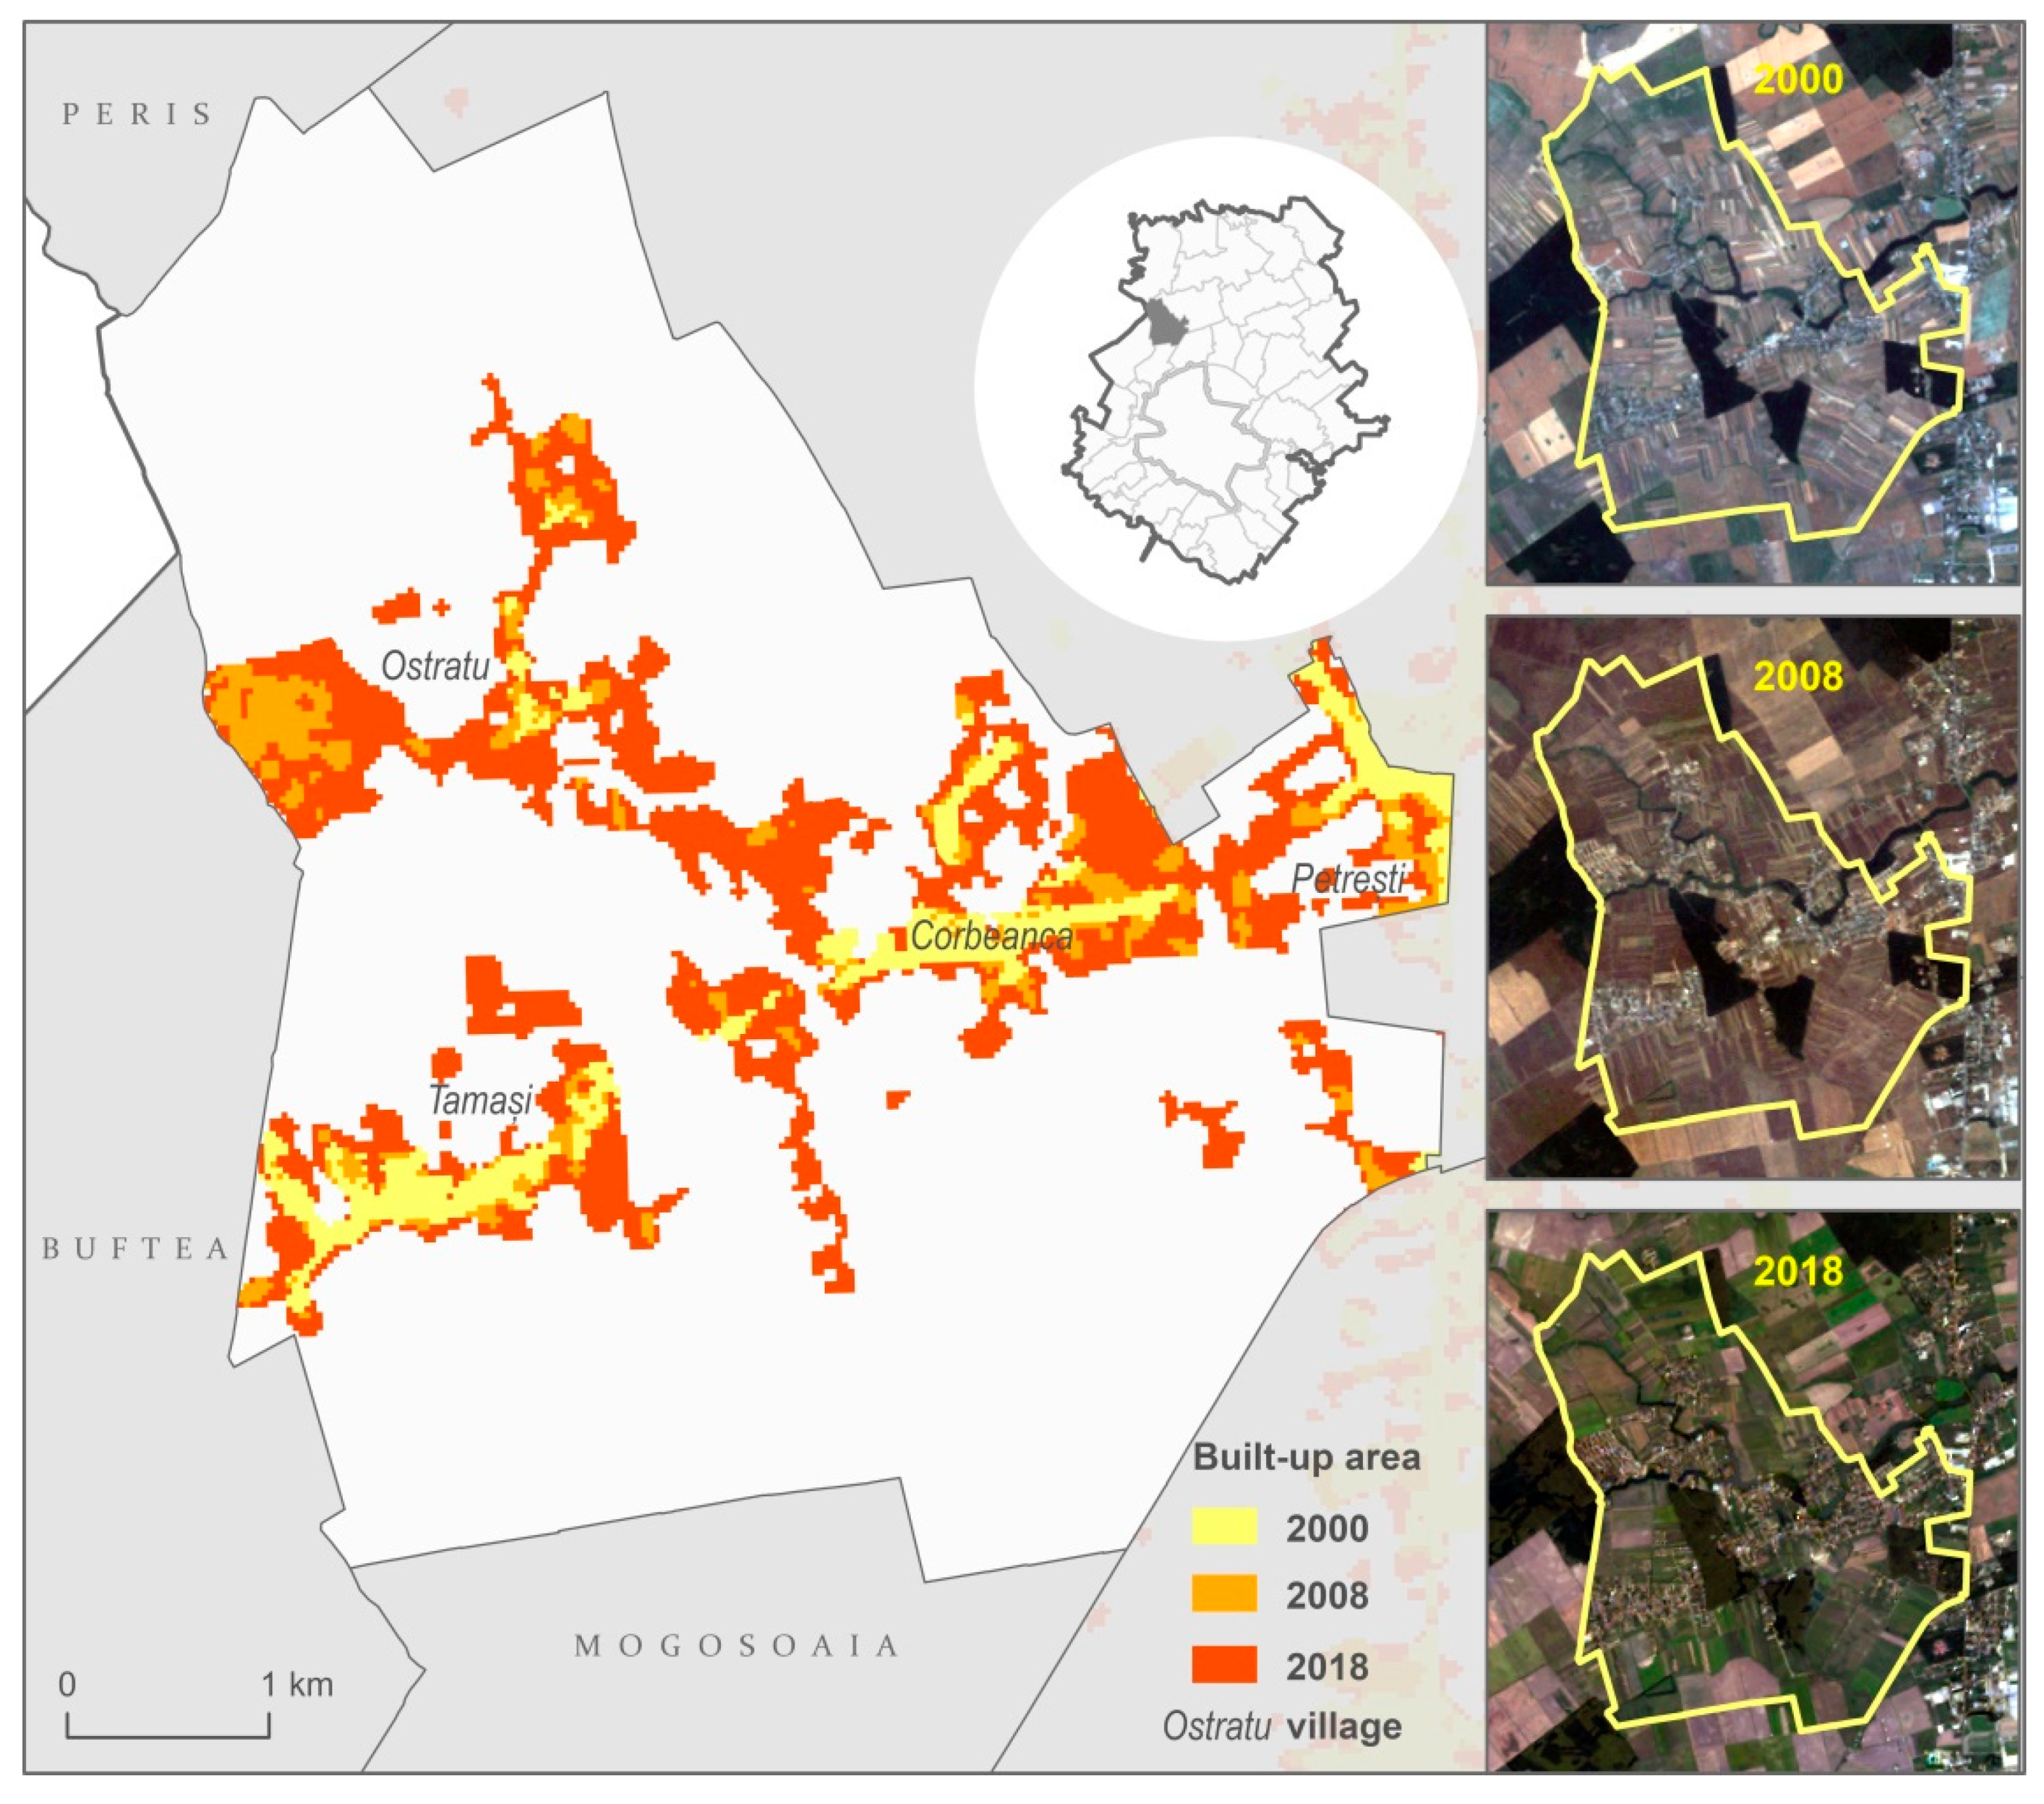
Publisher’s Note: MDPI stays neutral with regard to jurisdictional claims in published maps and institutional affiliations. |
© 2021 by the authors. Licensee MDPI, Basel, Switzerland. This article is an open access article distributed under the terms and conditions of the Creative Commons Attribution (CC BY) license (https://creativecommons.org/licenses/by/4.0/).